Clarita, OK Map & Demographics
Clarita Map
Clarita Overview
$14,707
PER CAPITA INCOME
$35,893
AVG HOUSEHOLD INCOME
0.26
INEQUALITY / GINI INDEX
179
TOTAL POPULATION
68
MALE POPULATION
111
FEMALE POPULATION
61.26
MALES / 100 FEMALES
163.24
FEMALES / 100 MALES
33.6
MEDIAN AGE
3.7
AVG FAMILY SIZE
3.5
AVG HOUSEHOLD SIZE
38
LABOR FORCE [ PEOPLE ]
31.1%
PERCENT IN LABOR FORCE
18.4%
UNEMPLOYMENT RATE
Clarita Zip Codes
Clarita Area Codes
Income in Clarita
Income Overview in Clarita
| Characteristic | Number | Measure |
| Per Capita Income | 179 | $14,707 |
| Median Family Income | 44 | $0 |
| Mean Family Income | 44 | $47,036 |
| Median Household Income | 51 | $35,893 |
| Mean Household Income | 51 | $45,469 |
| Income Deficit | 44 | $0 |
| Wage / Income Gap (%) | 179 | 0.00% |
| Wage / Income Gap ($) | 179 | 100.00¢ per $1 |
| Gini / Inequality Index | 179 | 0.26 |
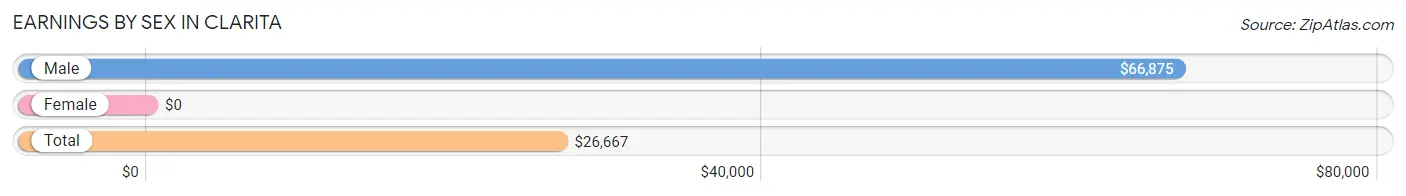
Earnings by Sex in Clarita
| Sex | Number | Average Earnings |
| Male | 20 (52.6%) | $66,875 |
| Female | 18 (47.4%) | $0 |
| Total | 38 (100.0%) | $26,667 |
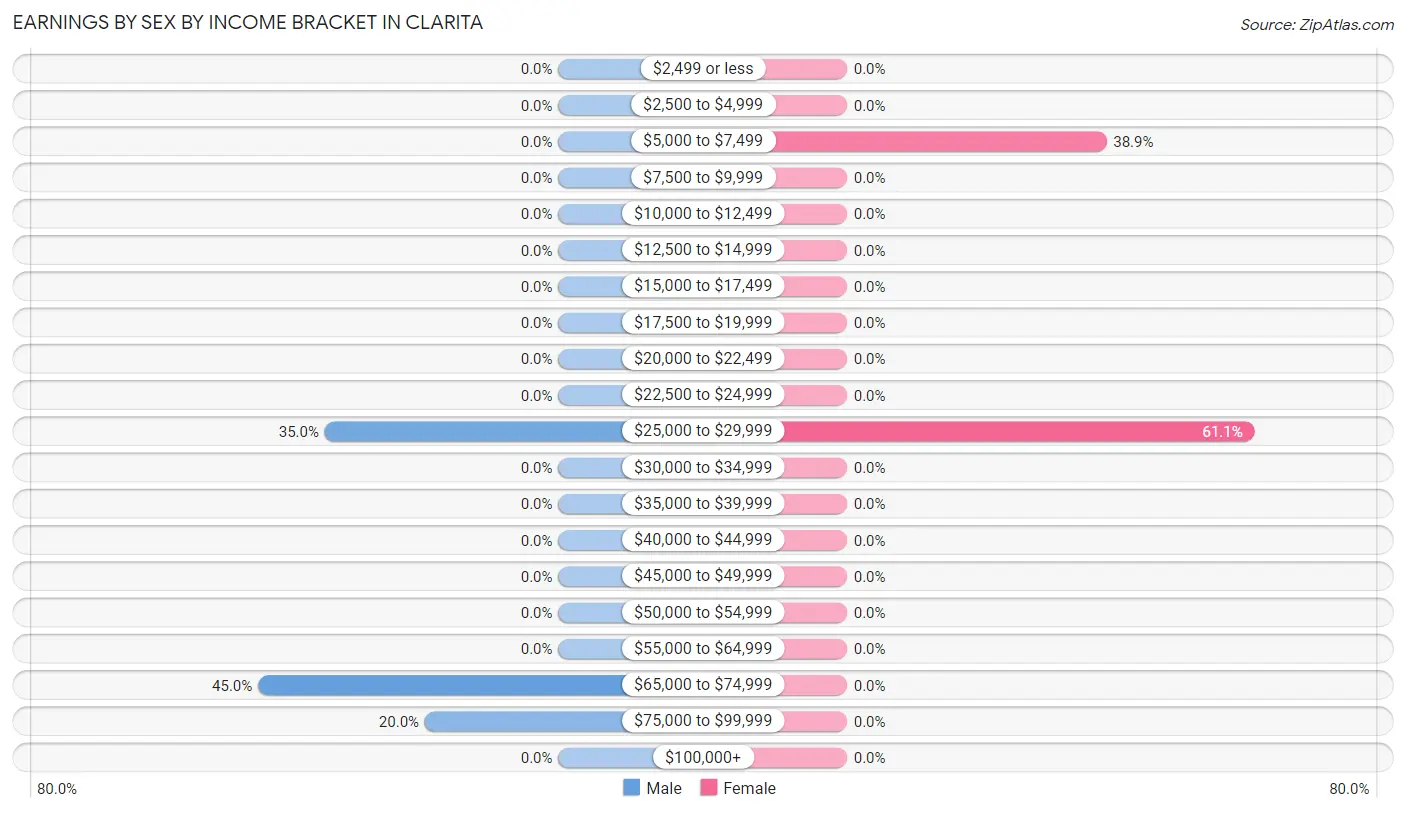
Earnings by Sex by Income Bracket in Clarita
The most common earnings brackets in Clarita are $65,000 to $74,999 for men (9 | 45.0%) and $25,000 to $29,999 for women (11 | 61.1%).
| Income | Male | Female |
| $2,499 or less | 0 (0.0%) | 0 (0.0%) |
| $2,500 to $4,999 | 0 (0.0%) | 0 (0.0%) |
| $5,000 to $7,499 | 0 (0.0%) | 7 (38.9%) |
| $7,500 to $9,999 | 0 (0.0%) | 0 (0.0%) |
| $10,000 to $12,499 | 0 (0.0%) | 0 (0.0%) |
| $12,500 to $14,999 | 0 (0.0%) | 0 (0.0%) |
| $15,000 to $17,499 | 0 (0.0%) | 0 (0.0%) |
| $17,500 to $19,999 | 0 (0.0%) | 0 (0.0%) |
| $20,000 to $22,499 | 0 (0.0%) | 0 (0.0%) |
| $22,500 to $24,999 | 0 (0.0%) | 0 (0.0%) |
| $25,000 to $29,999 | 7 (35.0%) | 11 (61.1%) |
| $30,000 to $34,999 | 0 (0.0%) | 0 (0.0%) |
| $35,000 to $39,999 | 0 (0.0%) | 0 (0.0%) |
| $40,000 to $44,999 | 0 (0.0%) | 0 (0.0%) |
| $45,000 to $49,999 | 0 (0.0%) | 0 (0.0%) |
| $50,000 to $54,999 | 0 (0.0%) | 0 (0.0%) |
| $55,000 to $64,999 | 0 (0.0%) | 0 (0.0%) |
| $65,000 to $74,999 | 9 (45.0%) | 0 (0.0%) |
| $75,000 to $99,999 | 4 (20.0%) | 0 (0.0%) |
| $100,000+ | 0 (0.0%) | 0 (0.0%) |
| Total | 20 (100.0%) | 18 (100.0%) |
Earnings by Sex by Educational Attainment in Clarita
| Educational Attainment | Male Income | Female Income |
| Less than High School | - | - |
| High School Diploma | - | - |
| College or Associate's Degree | - | - |
| Bachelor's Degree | - | - |
| Graduate Degree | - | - |
| Total | $66,875 | $0 |
Family Income in Clarita
Family Income Brackets in Clarita
According to the Clarita family income data, there are 22 families falling into the $25,000 to $34,999 income range, which is the most common income bracket and makes up 50.0% of all families.
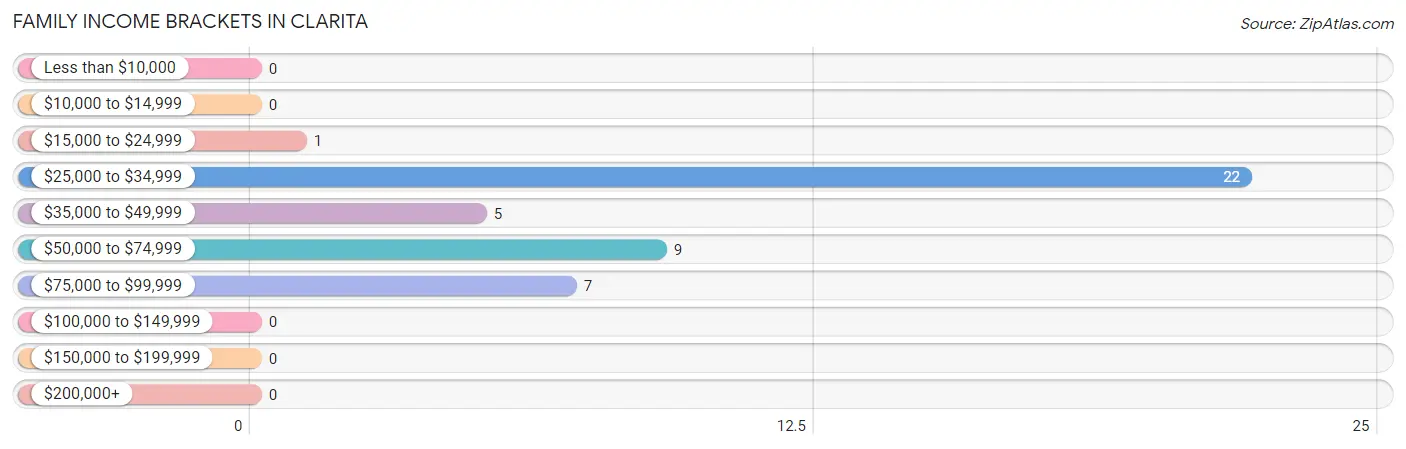
| Income Bracket | # Families | % Families |
| Less than $10,000 | 0 | 0.0% |
| $10,000 to $14,999 | 0 | 0.0% |
| $15,000 to $24,999 | 1 | 2.3% |
| $25,000 to $34,999 | 22 | 50.0% |
| $35,000 to $49,999 | 5 | 11.4% |
| $50,000 to $74,999 | 9 | 20.5% |
| $75,000 to $99,999 | 7 | 15.9% |
| $100,000 to $149,999 | 0 | 0.0% |
| $150,000 to $199,999 | 0 | 0.0% |
| $200,000+ | 0 | 0.0% |
Family Income by Famaliy Size in Clarita
2-person families (32 | 72.7%) account for the highest median family income in Clarita with $28,409 per family, while 2-person families (32 | 72.7%) have the highest median income of $14,204 per family member.
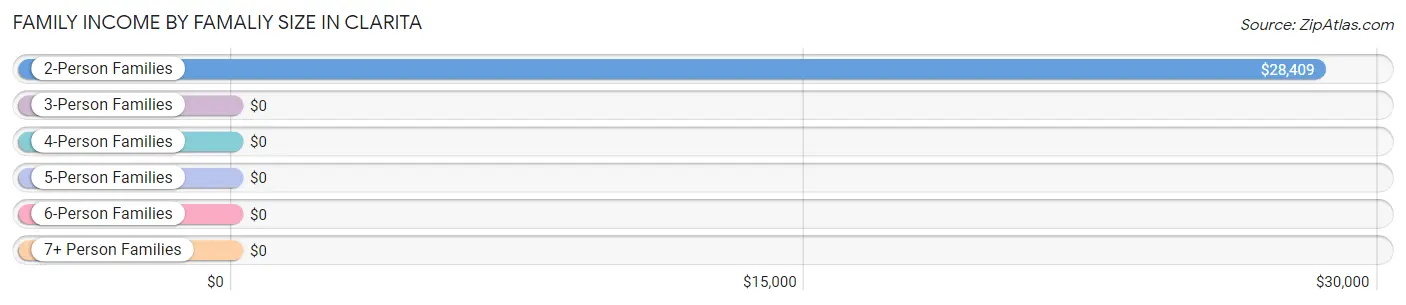
| Income Bracket | # Families | Median Income |
| 2-Person Families | 32 (72.7%) | $28,409 |
| 3-Person Families | 0 (0.0%) | $0 |
| 4-Person Families | 8 (18.2%) | $0 |
| 5-Person Families | 0 (0.0%) | $0 |
| 6-Person Families | 0 (0.0%) | $0 |
| 7+ Person Families | 4 (9.1%) | $0 |
| Total | 44 (100.0%) | $0 |
Family Income by Number of Earners in Clarita
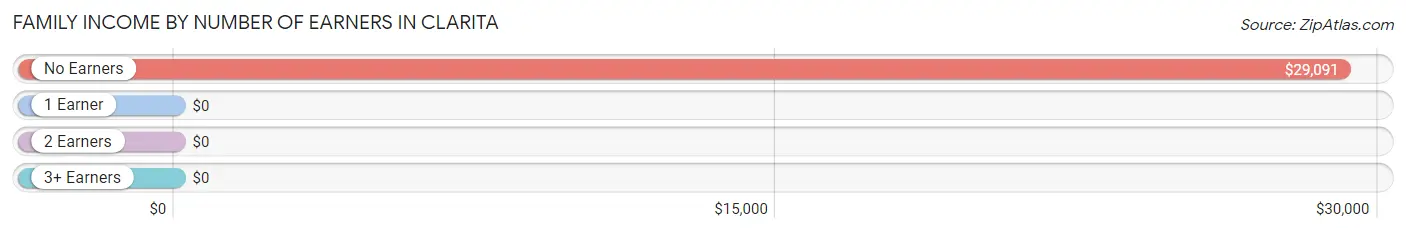
| Number of Earners | # Families | Median Income |
| No Earners | 16 (36.4%) | $29,091 |
| 1 Earner | 25 (56.8%) | $0 |
| 2 Earners | 3 (6.8%) | $0 |
| 3+ Earners | 0 (0.0%) | $0 |
| Total | 44 (100.0%) | $0 |
Household Income in Clarita
Household Income Brackets in Clarita
With 22 households falling in the category, the $25,000 to $34,999 income range is the most frequent in Clarita, accounting for 43.1% of all households.
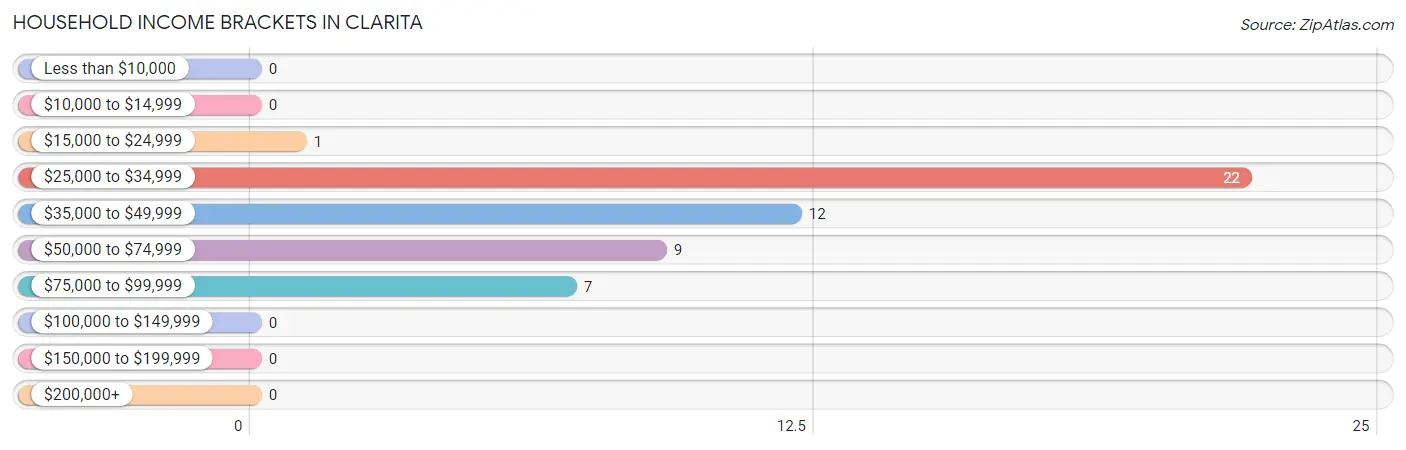
| Income Bracket | # Households | % Households |
| Less than $10,000 | 0 | 0.0% |
| $10,000 to $14,999 | 0 | 0.0% |
| $15,000 to $24,999 | 1 | 2.0% |
| $25,000 to $34,999 | 22 | 43.1% |
| $35,000 to $49,999 | 12 | 23.5% |
| $50,000 to $74,999 | 9 | 17.6% |
| $75,000 to $99,999 | 7 | 13.7% |
| $100,000 to $149,999 | 0 | 0.0% |
| $150,000 to $199,999 | 0 | 0.0% |
| $200,000+ | 0 | 0.0% |
Household Income by Householder Age in Clarita
The median household income in Clarita is $35,893, with the highest median household income of $28,977 found in the 45 to 64 years age bracket for the primary householder. A total of 35 households (68.6%) fall into this category.
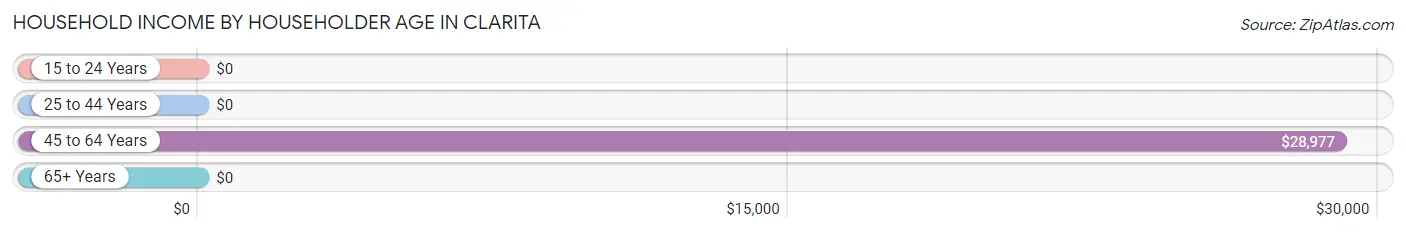
| Income Bracket | # Households | Median Income |
| 15 to 24 Years | 0 (0.0%) | $0 |
| 25 to 44 Years | 4 (7.8%) | $0 |
| 45 to 64 Years | 35 (68.6%) | $28,977 |
| 65+ Years | 12 (23.5%) | $0 |
| Total | 51 (100.0%) | $35,893 |
Poverty in Clarita
Income Below Poverty by Sex and Age in Clarita
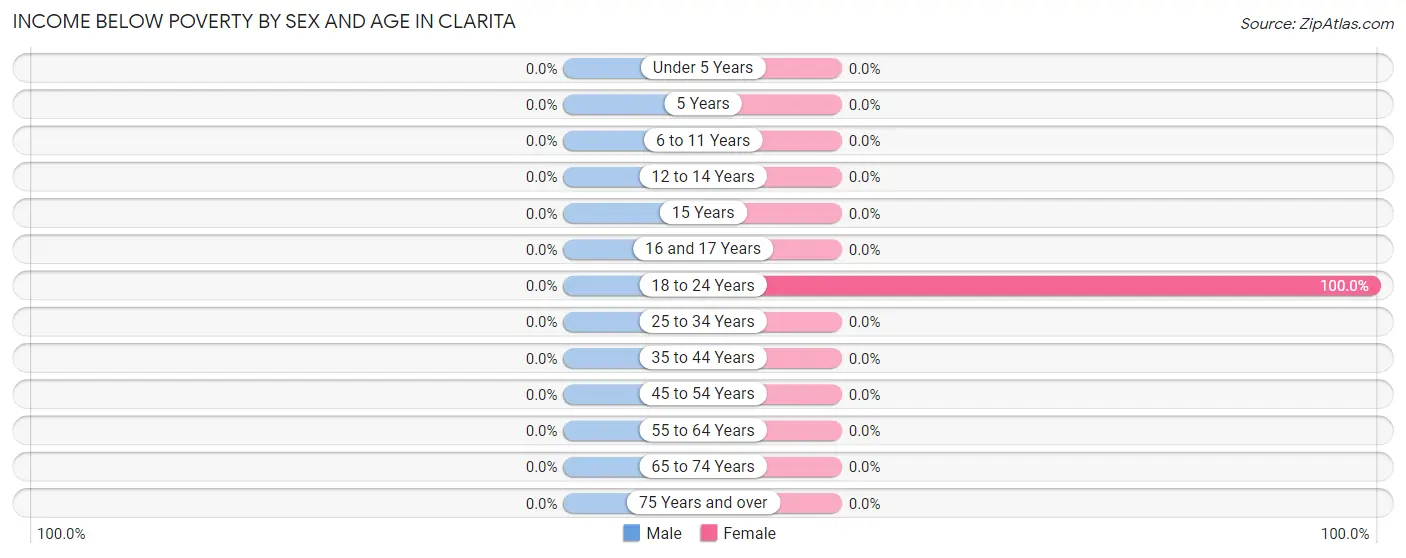
| Age Bracket | Male | Female |
| Under 5 Years | 0 (0.0%) | 0 (0.0%) |
| 5 Years | 0 (0.0%) | 0 (0.0%) |
| 6 to 11 Years | 0 (0.0%) | 0 (0.0%) |
| 12 to 14 Years | 0 (0.0%) | 0 (0.0%) |
| 15 Years | 0 (0.0%) | 0 (0.0%) |
| 16 and 17 Years | 0 (0.0%) | 0 (0.0%) |
| 18 to 24 Years | 0 (0.0%) | 10 (100.0%) |
| 25 to 34 Years | 0 (0.0%) | 0 (0.0%) |
| 35 to 44 Years | 0 (0.0%) | 0 (0.0%) |
| 45 to 54 Years | 0 (0.0%) | 0 (0.0%) |
| 55 to 64 Years | 0 (0.0%) | 0 (0.0%) |
| 65 to 74 Years | 0 (0.0%) | 0 (0.0%) |
| 75 Years and over | 0 (0.0%) | 0 (0.0%) |
| Total | 0 (0.0%) | 10 (9.0%) |
Income Above Poverty by Sex and Age in Clarita
According to the poverty statistics in Clarita, males aged under 5 years and females aged under 5 years are the age groups that are most secure financially, with 100.0% of males and 100.0% of females in these age groups living above the poverty line.
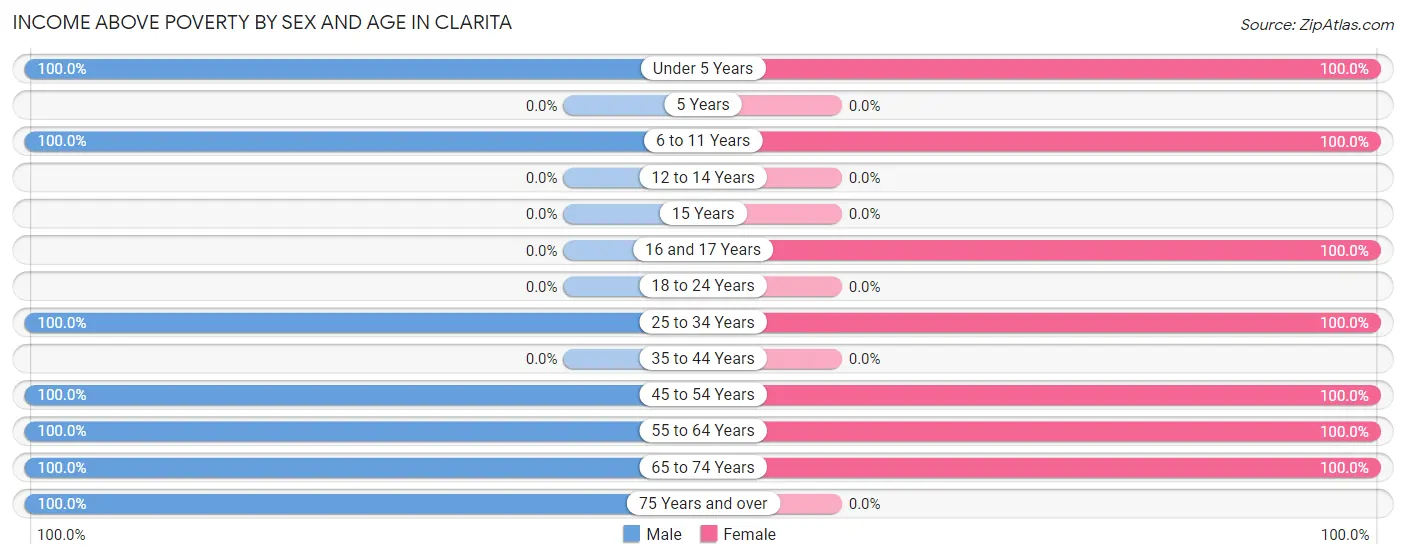
| Age Bracket | Male | Female |
| Under 5 Years | 6 (100.0%) | 6 (100.0%) |
| 5 Years | 0 (0.0%) | 0 (0.0%) |
| 6 to 11 Years | 7 (100.0%) | 38 (100.0%) |
| 12 to 14 Years | 0 (0.0%) | 0 (0.0%) |
| 15 Years | 0 (0.0%) | 0 (0.0%) |
| 16 and 17 Years | 0 (0.0%) | 7 (100.0%) |
| 18 to 24 Years | 0 (0.0%) | 0 (0.0%) |
| 25 to 34 Years | 17 (100.0%) | 6 (100.0%) |
| 35 to 44 Years | 0 (0.0%) | 0 (0.0%) |
| 45 to 54 Years | 4 (100.0%) | 6 (100.0%) |
| 55 to 64 Years | 21 (100.0%) | 33 (100.0%) |
| 65 to 74 Years | 1 (100.0%) | 5 (100.0%) |
| 75 Years and over | 12 (100.0%) | 0 (0.0%) |
| Total | 68 (100.0%) | 101 (91.0%) |
Income Below Poverty Among Married-Couple Families in Clarita
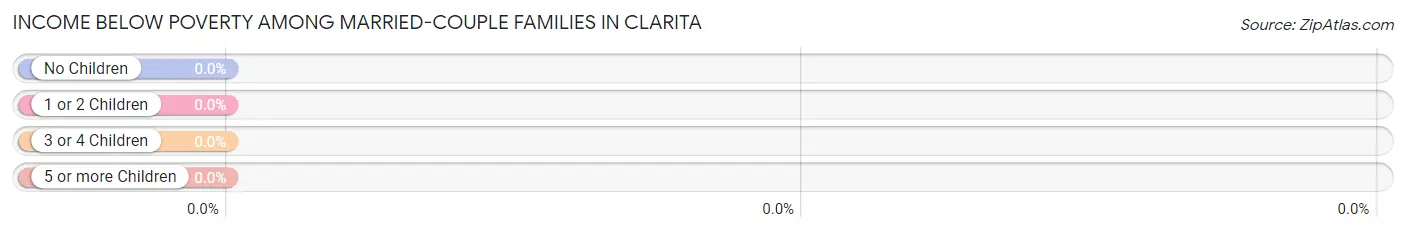
| Children | Above Poverty | Below Poverty |
| No Children | 21 (100.0%) | 0 (0.0%) |
| 1 or 2 Children | 3 (100.0%) | 0 (0.0%) |
| 3 or 4 Children | 0 (0.0%) | 0 (0.0%) |
| 5 or more Children | 4 (100.0%) | 0 (0.0%) |
| Total | 28 (100.0%) | 0 (0.0%) |
Income Below Poverty Among Single-Parent Households in Clarita
| Children | Single Father | Single Mother |
| No Children | 0 (0.0%) | 0 (0.0%) |
| 1 or 2 Children | 0 (0.0%) | 0 (0.0%) |
| 3 or 4 Children | 0 (0.0%) | 0 (0.0%) |
| 5 or more Children | 0 (0.0%) | 0 (0.0%) |
| Total | 0 (0.0%) | 0 (0.0%) |
Income Below Poverty Among Married-Couple vs Single-Parent Households in Clarita
| Children | Married-Couple Families | Single-Parent Households |
| No Children | 0 (0.0%) | 0 (0.0%) |
| 1 or 2 Children | 0 (0.0%) | 0 (0.0%) |
| 3 or 4 Children | 0 (0.0%) | 0 (0.0%) |
| 5 or more Children | 0 (0.0%) | 0 (0.0%) |
| Total | 0 (0.0%) | 0 (0.0%) |
Race in Clarita
The most populous races in Clarita are White / Caucasian (146 | 81.6%), Two or more Races (22 | 12.3%), and Native / Alaskan (11 | 6.1%).
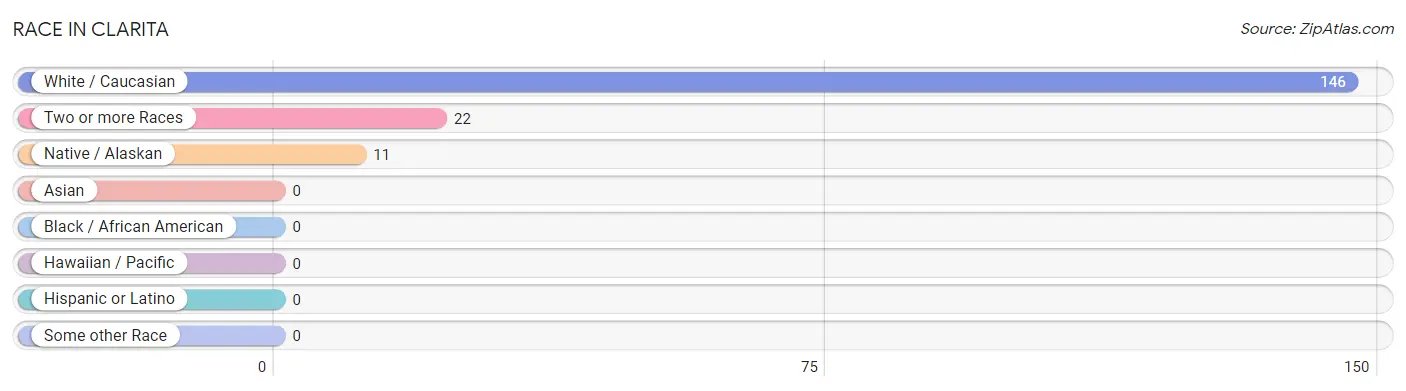
| Race | # Population | % Population |
| Asian | 0 | 0.0% |
| Black / African American | 0 | 0.0% |
| Hawaiian / Pacific | 0 | 0.0% |
| Hispanic or Latino | 0 | 0.0% |
| Native / Alaskan | 11 | 6.1% |
| White / Caucasian | 146 | 81.6% |
| Two or more Races | 22 | 12.3% |
| Some other Race | 0 | 0.0% |
| Total | 179 | 100.0% |
Ancestry in Clarita
The most populous ancestries reported in Clarita are American (44 | 24.6%), Swiss (36 | 20.1%), English (26 | 14.5%), Scotch-Irish (26 | 14.5%), and Choctaw (22 | 12.3%), together accounting for 86.0% of all Clarita residents.
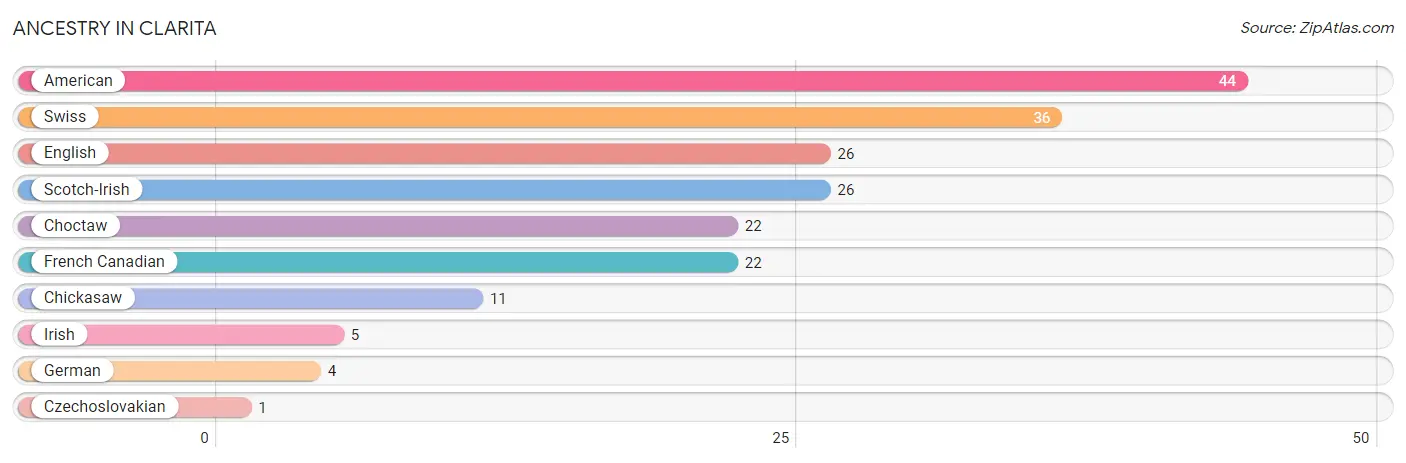
| Ancestry | # Population | % Population |
| American | 44 | 24.6% |
| Chickasaw | 11 | 6.1% |
| Choctaw | 22 | 12.3% |
| Czechoslovakian | 1 | 0.6% |
| English | 26 | 14.5% |
| French Canadian | 22 | 12.3% |
| German | 4 | 2.2% |
| Irish | 5 | 2.8% |
| Scotch-Irish | 26 | 14.5% |
| Swiss | 36 | 20.1% | View All 10 Rows |
Immigrants in Clarita

| Immigration Origin | # Population | % Population | View All 0 Rows |
Sex and Age in Clarita
Sex and Age in Clarita
The most populous age groups in Clarita are 60 to 64 Years (21 | 30.9%) for men and 60 to 64 Years (33 | 29.7%) for women.
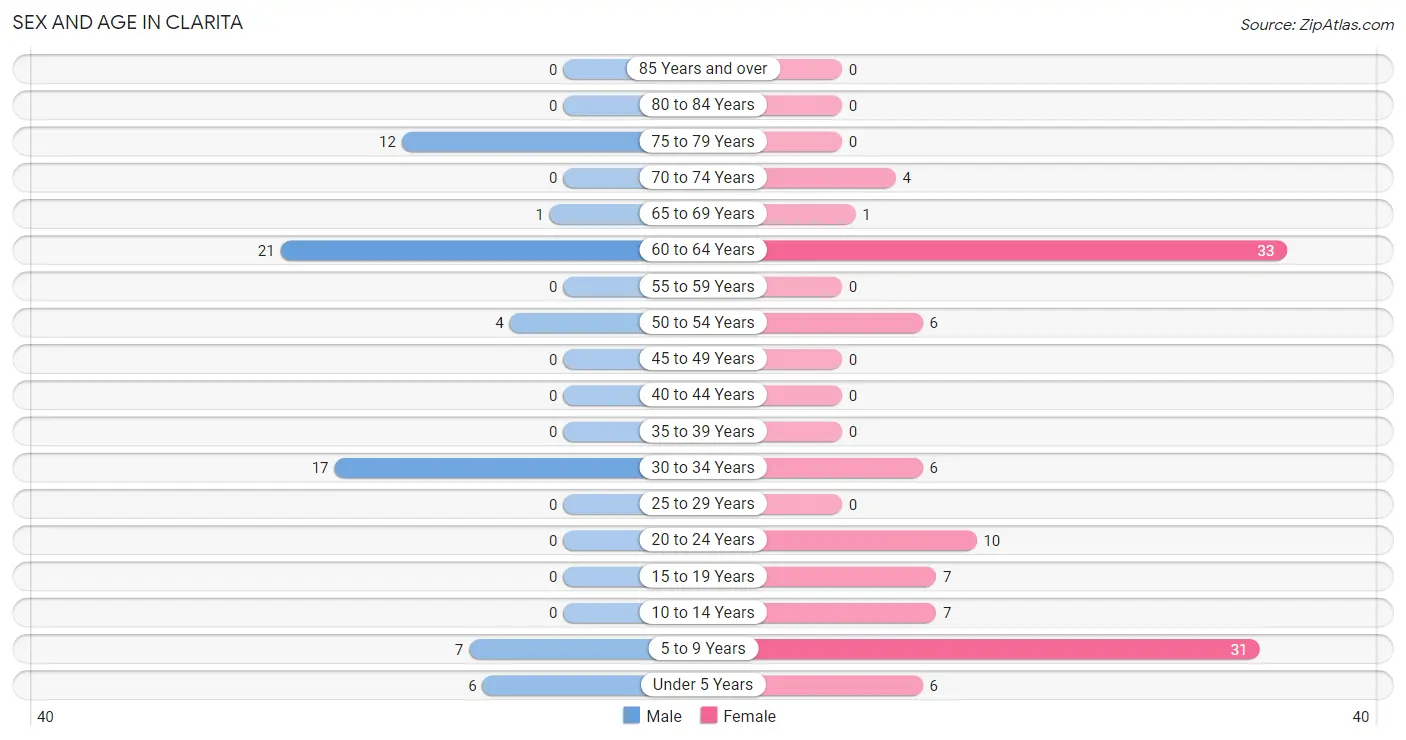
| Age Bracket | Male | Female |
| Under 5 Years | 6 (8.8%) | 6 (5.4%) |
| 5 to 9 Years | 7 (10.3%) | 31 (27.9%) |
| 10 to 14 Years | 0 (0.0%) | 7 (6.3%) |
| 15 to 19 Years | 0 (0.0%) | 7 (6.3%) |
| 20 to 24 Years | 0 (0.0%) | 10 (9.0%) |
| 25 to 29 Years | 0 (0.0%) | 0 (0.0%) |
| 30 to 34 Years | 17 (25.0%) | 6 (5.4%) |
| 35 to 39 Years | 0 (0.0%) | 0 (0.0%) |
| 40 to 44 Years | 0 (0.0%) | 0 (0.0%) |
| 45 to 49 Years | 0 (0.0%) | 0 (0.0%) |
| 50 to 54 Years | 4 (5.9%) | 6 (5.4%) |
| 55 to 59 Years | 0 (0.0%) | 0 (0.0%) |
| 60 to 64 Years | 21 (30.9%) | 33 (29.7%) |
| 65 to 69 Years | 1 (1.5%) | 1 (0.9%) |
| 70 to 74 Years | 0 (0.0%) | 4 (3.6%) |
| 75 to 79 Years | 12 (17.6%) | 0 (0.0%) |
| 80 to 84 Years | 0 (0.0%) | 0 (0.0%) |
| 85 Years and over | 0 (0.0%) | 0 (0.0%) |
| Total | 68 (100.0%) | 111 (100.0%) |
Families and Households in Clarita
Median Family Size in Clarita
The median family size in Clarita is 3.68 persons per family, with single male/father families (5 | 11.4%) accounting for the largest median family size of 5.4 persons per family. On the other hand, single female/mother families (11 | 25.0%) represent the smallest median family size with 2.36 persons per family.
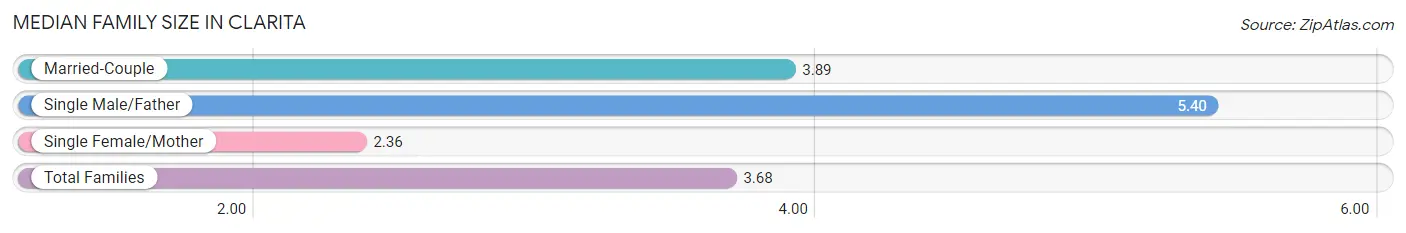
| Family Type | # Families | Family Size |
| Married-Couple | 28 (63.6%) | 3.89 |
| Single Male/Father | 5 (11.4%) | 5.40 |
| Single Female/Mother | 11 (25.0%) | 2.36 |
| Total Families | 44 (100.0%) | 3.68 |
Median Household Size in Clarita
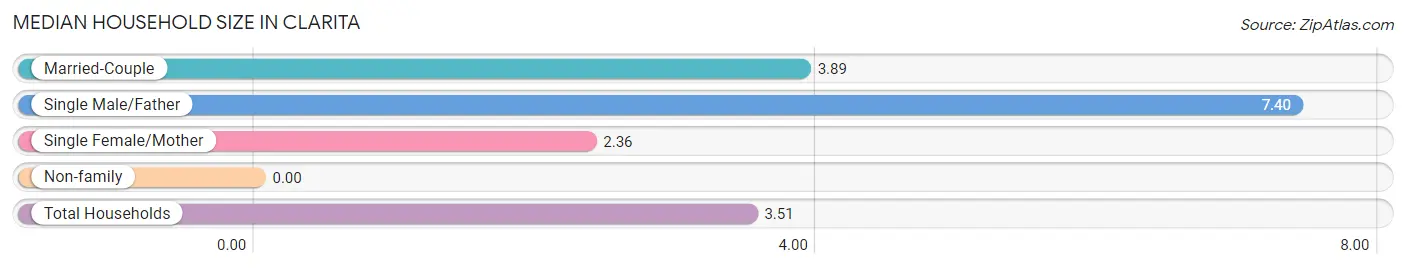
| Household Type | # Households | Household Size |
| Married-Couple | 28 (54.9%) | 3.89 |
| Single Male/Father | 5 (9.8%) | 7.40 |
| Single Female/Mother | 11 (21.6%) | 2.36 |
| Non-family | 7 (13.7%) | - |
| Total Households | 51 (100.0%) | 3.51 |
Household Size by Marriage Status in Clarita
Out of a total of 51 households in Clarita, 44 (86.3%) are family households, while 7 (13.7%) are nonfamily households. The most numerous type of family households are 2-person households, comprising 32, and the most common type of nonfamily households are 1-person households, comprising 7.
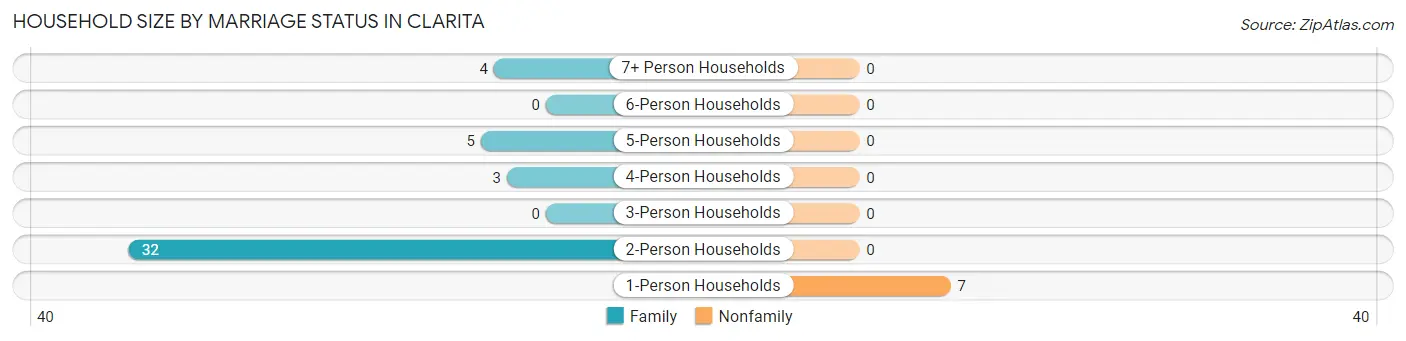
| Household Size | Family Households | Nonfamily Households |
| 1-Person Households | - | 7 (13.7%) |
| 2-Person Households | 32 (62.7%) | 0 (0.0%) |
| 3-Person Households | 0 (0.0%) | 0 (0.0%) |
| 4-Person Households | 3 (5.9%) | 0 (0.0%) |
| 5-Person Households | 5 (9.8%) | 0 (0.0%) |
| 6-Person Households | 0 (0.0%) | 0 (0.0%) |
| 7+ Person Households | 4 (7.8%) | 0 (0.0%) |
| Total | 44 (86.3%) | 7 (13.7%) |
Female Fertility in Clarita
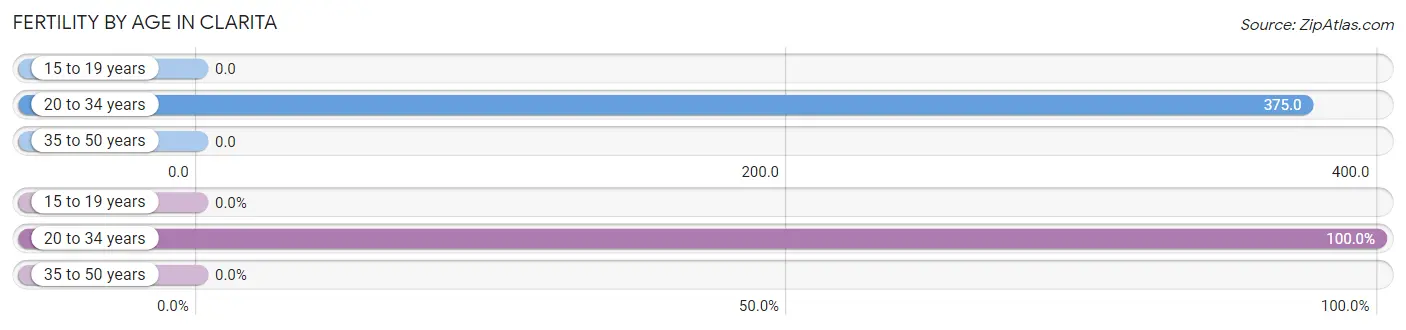
Fertility by Age in Clarita
Average fertility rate in Clarita is 261.0 births per 1,000 women. Women in the age bracket of 20 to 34 years have the highest fertility rate with 375.0 births per 1,000 women. Women in the age bracket of 20 to 34 years acount for 100.0% of all women with births.
| Age Bracket | Women with Births | Births / 1,000 Women |
| 15 to 19 years | 0 (0.0%) | 0.0 |
| 20 to 34 years | 6 (100.0%) | 375.0 |
| 35 to 50 years | 0 (0.0%) | 0.0 |
| Total | 6 (100.0%) | 261.0 |
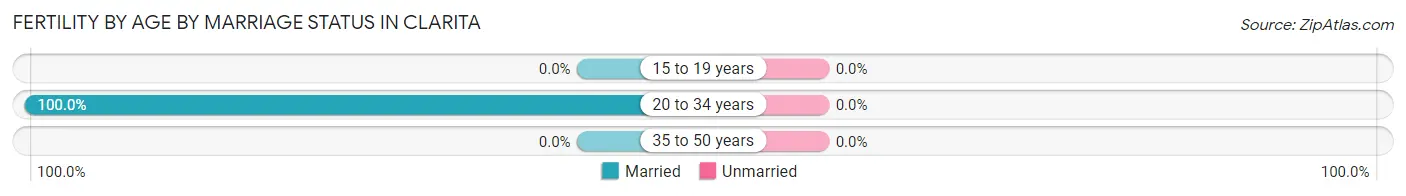
Fertility by Age by Marriage Status in Clarita
| Age Bracket | Married | Unmarried |
| 15 to 19 years | 0 (0.0%) | 0 (0.0%) |
| 20 to 34 years | 6 (100.0%) | 0 (0.0%) |
| 35 to 50 years | 0 (0.0%) | 0 (0.0%) |
| Total | 6 (100.0%) | 0 (0.0%) |
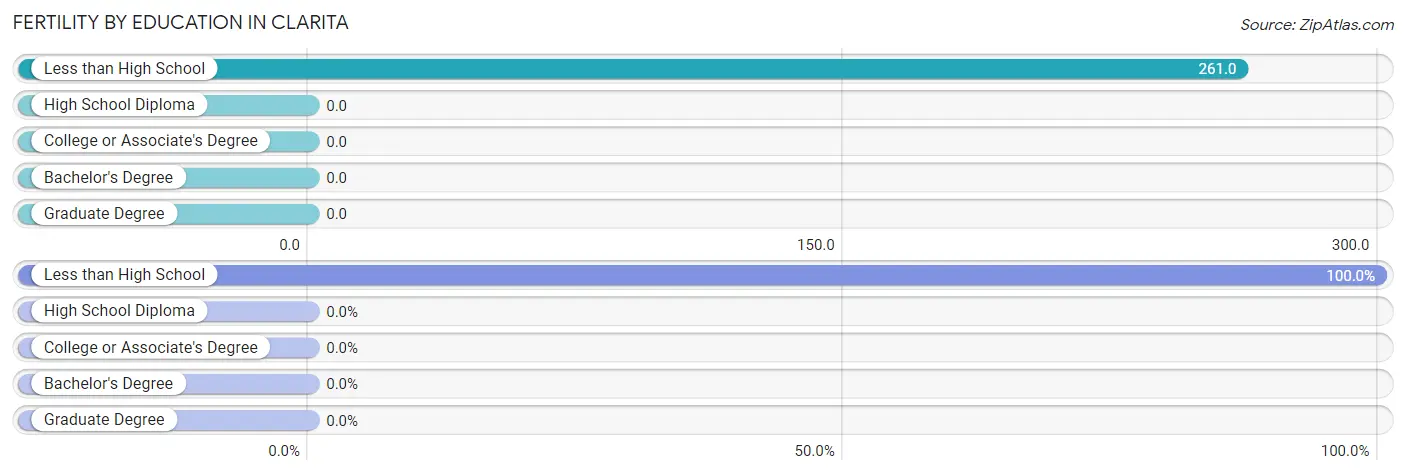
Fertility by Education in Clarita
| Educational Attainment | Women with Births | Births / 1,000 Women |
| Less than High School | 6 (100.0%) | 261.0 |
| High School Diploma | 0 (0.0%) | 0.0 |
| College or Associate's Degree | 0 (0.0%) | 0.0 |
| Bachelor's Degree | 0 (0.0%) | 0.0 |
| Graduate Degree | 0 (0.0%) | 0.0 |
| Total | 6 (100.0%) | 261.0 |
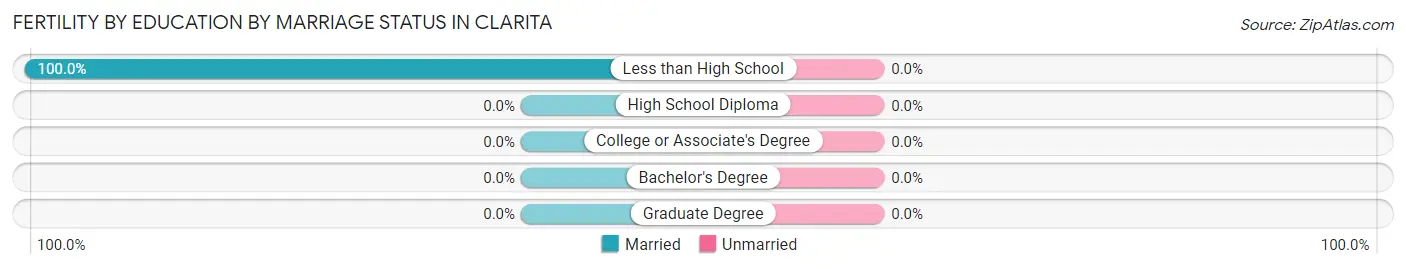
Fertility by Education by Marriage Status in Clarita
| Educational Attainment | Married | Unmarried |
| Less than High School | 6 (100.0%) | 0 (0.0%) |
| High School Diploma | 0 (0.0%) | 0 (0.0%) |
| College or Associate's Degree | 0 (0.0%) | 0 (0.0%) |
| Bachelor's Degree | 0 (0.0%) | 0 (0.0%) |
| Graduate Degree | 0 (0.0%) | 0 (0.0%) |
| Total | 6 (100.0%) | 0 (0.0%) |
Employment Characteristics in Clarita
Employment by Class of Employer in Clarita
Among the 31 employed individuals in Clarita, federal government employees (11 | 35.5%), local government employees (7 | 22.6%), and private company employees (5 | 16.1%) make up the most common classes of employment.
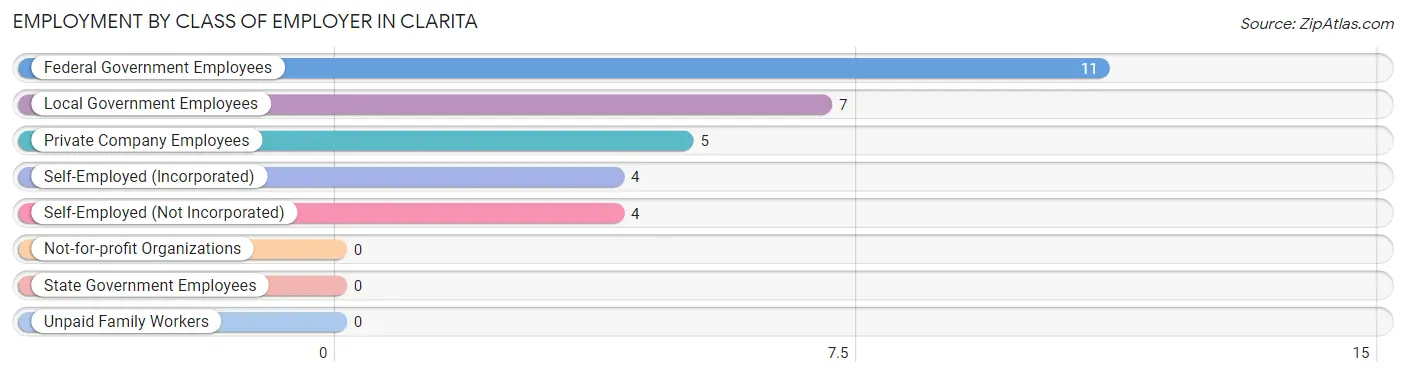
| Employer Class | # Employees | % Employees |
| Private Company Employees | 5 | 16.1% |
| Self-Employed (Incorporated) | 4 | 12.9% |
| Self-Employed (Not Incorporated) | 4 | 12.9% |
| Not-for-profit Organizations | 0 | 0.0% |
| Local Government Employees | 7 | 22.6% |
| State Government Employees | 0 | 0.0% |
| Federal Government Employees | 11 | 35.5% |
| Unpaid Family Workers | 0 | 0.0% |
| Total | 31 | 100.0% |
Employment Status by Age in Clarita
According to the labor force statistics for Clarita, out of the total population over 16 years of age (122), 31.1% or 38 individuals are in the labor force, with 18.4% or 7 of them unemployed. The age group with the highest labor force participation rate is 16 to 19 years, with 100.0% or 7 individuals in the labor force. Within the labor force, the 16 to 19 years age range has the highest percentage of unemployed individuals, with 100.0% or 7 of them being unemployed.
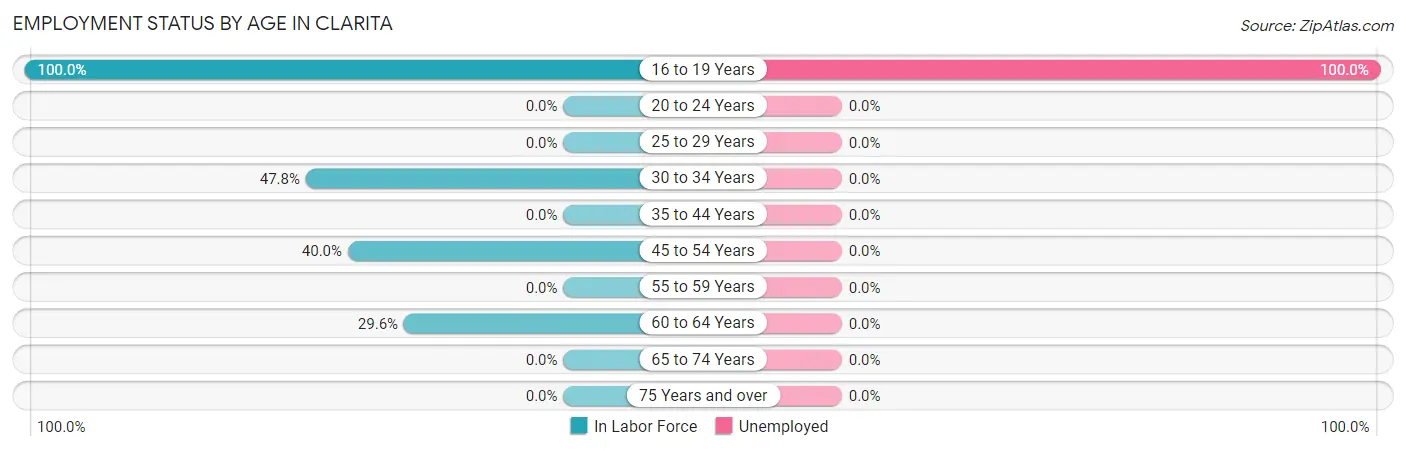
| Age Bracket | In Labor Force | Unemployed |
| 16 to 19 Years | 7 (100.0%) | 7 (100.0%) |
| 20 to 24 Years | 0 (0.0%) | 0 (0.0%) |
| 25 to 29 Years | 0 (0.0%) | 0 (0.0%) |
| 30 to 34 Years | 11 (47.8%) | 0 (0.0%) |
| 35 to 44 Years | 0 (0.0%) | 0 (0.0%) |
| 45 to 54 Years | 4 (40.0%) | 0 (0.0%) |
| 55 to 59 Years | 0 (0.0%) | 0 (0.0%) |
| 60 to 64 Years | 16 (29.6%) | 0 (0.0%) |
| 65 to 74 Years | 0 (0.0%) | 0 (0.0%) |
| 75 Years and over | 0 (0.0%) | 0 (0.0%) |
| Total | 38 (31.1%) | 7 (18.4%) |
Employment Status by Educational Attainment in Clarita
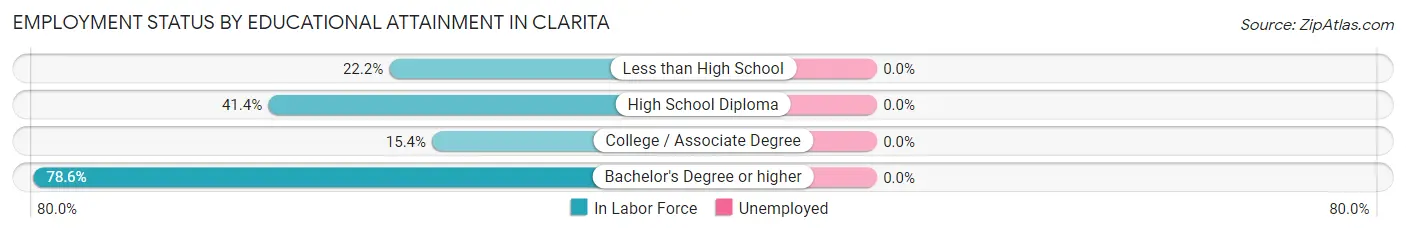
| Educational Attainment | In Labor Force | Unemployed |
| Less than High School | 4 (22.2%) | 0 (0.0%) |
| High School Diploma | 12 (41.4%) | 0 (0.0%) |
| College / Associate Degree | 4 (15.4%) | 0 (0.0%) |
| Bachelor's Degree or higher | 11 (78.6%) | 0 (0.0%) |
| Total | 31 (35.6%) | 0 (0.0%) |
Employment Occupations by Sex in Clarita
Management, Business, Science and Arts Occupations
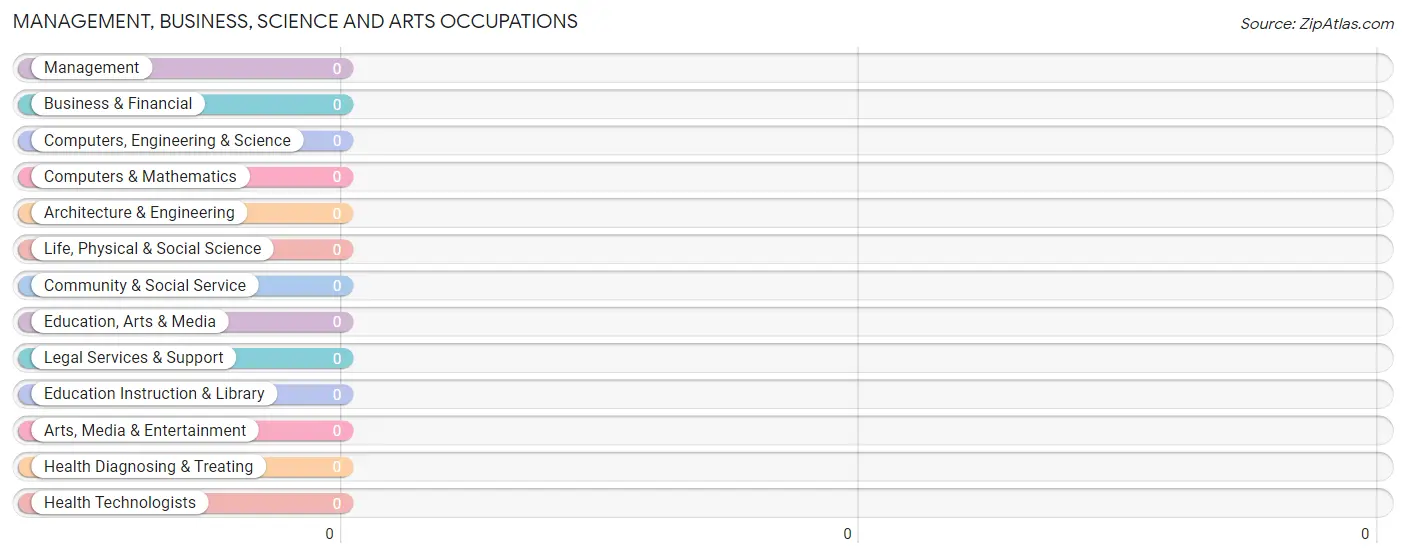
Management, Business, Science and Arts Occupations by Sex
| Occupation | Male | Female |
| Management | 0 (0.0%) | 0 (0.0%) |
| Business & Financial | 0 (0.0%) | 0 (0.0%) |
| Computers, Engineering & Science | 0 (0.0%) | 0 (0.0%) |
| Computers & Mathematics | 0 (0.0%) | 0 (0.0%) |
| Architecture & Engineering | 0 (0.0%) | 0 (0.0%) |
| Life, Physical & Social Science | 0 (0.0%) | 0 (0.0%) |
| Community & Social Service | 0 (0.0%) | 0 (0.0%) |
| Education, Arts & Media | 0 (0.0%) | 0 (0.0%) |
| Legal Services & Support | 0 (0.0%) | 0 (0.0%) |
| Education Instruction & Library | 0 (0.0%) | 0 (0.0%) |
| Arts, Media & Entertainment | 0 (0.0%) | 0 (0.0%) |
| Health Diagnosing & Treating | 0 (0.0%) | 0 (0.0%) |
| Health Technologists | 0 (0.0%) | 0 (0.0%) |
| Total (Category) | 0 (0.0%) | 0 (0.0%) |
| Total (Overall) | 20 (64.5%) | 11 (35.5%) |
Services Occupations
Services Occupations by Sex
| Occupation | Male | Female |
| Healthcare Support | 0 (0.0%) | 0 (0.0%) |
| Security & Protection | 0 (0.0%) | 0 (0.0%) |
| Firefighting & Prevention | 0 (0.0%) | 0 (0.0%) |
| Law Enforcement | 0 (0.0%) | 0 (0.0%) |
| Food Preparation & Serving | 0 (0.0%) | 0 (0.0%) |
| Cleaning & Maintenance | 0 (0.0%) | 0 (0.0%) |
| Personal Care & Service | 0 (0.0%) | 0 (0.0%) |
| Total (Category) | 0 (0.0%) | 0 (0.0%) |
| Total (Overall) | 20 (64.5%) | 11 (35.5%) |
Sales and Office Occupations
The most common Sales and Office occupations in Clarita are Office & Administration (18 | 58.1%), and Sales & Related (4 | 12.9%).
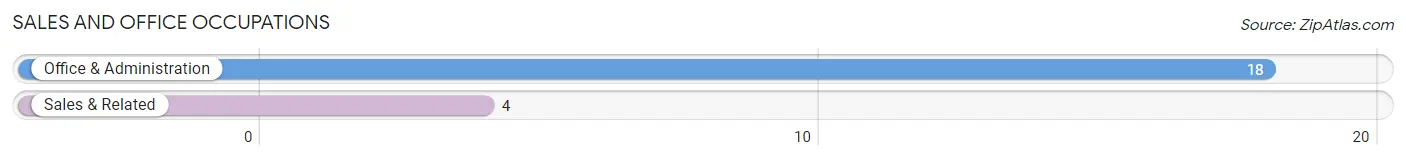
Sales and Office Occupations by Sex
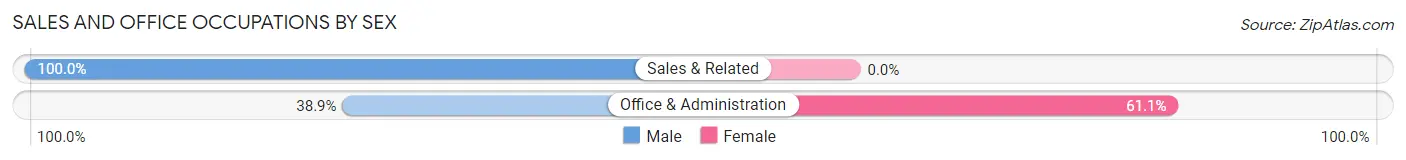
| Occupation | Male | Female |
| Sales & Related | 4 (100.0%) | 0 (0.0%) |
| Office & Administration | 7 (38.9%) | 11 (61.1%) |
| Total (Category) | 11 (50.0%) | 11 (50.0%) |
| Total (Overall) | 20 (64.5%) | 11 (35.5%) |
Natural Resources, Construction and Maintenance Occupations
The most common Natural Resources, Construction and Maintenance occupations in Clarita are , and Construction & Extraction (9 | 29.0%).
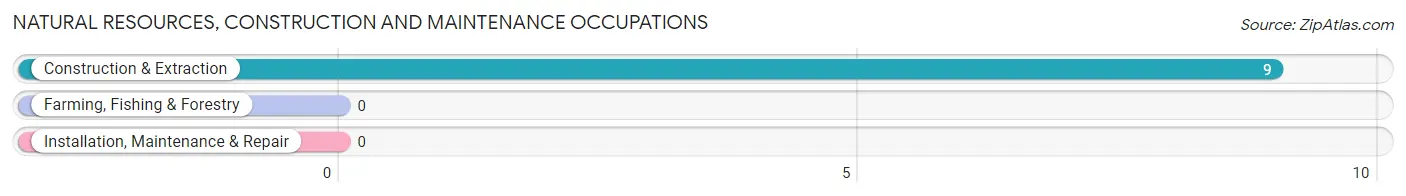
Natural Resources, Construction and Maintenance Occupations by Sex
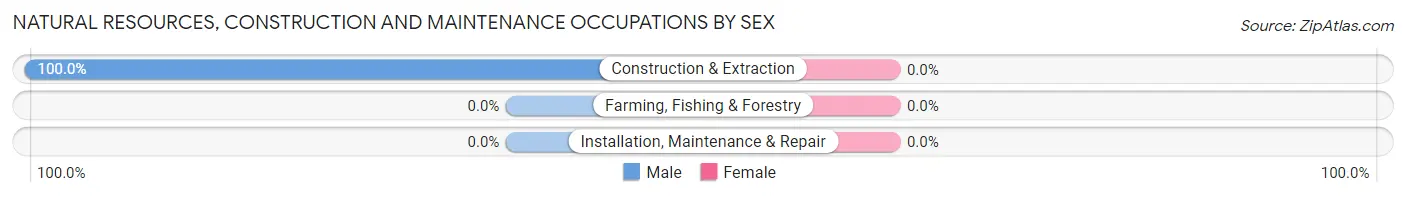
| Occupation | Male | Female |
| Farming, Fishing & Forestry | 0 (0.0%) | 0 (0.0%) |
| Construction & Extraction | 9 (100.0%) | 0 (0.0%) |
| Installation, Maintenance & Repair | 0 (0.0%) | 0 (0.0%) |
| Total (Category) | 9 (100.0%) | 0 (0.0%) |
| Total (Overall) | 20 (64.5%) | 11 (35.5%) |
Production, Transportation and Moving Occupations
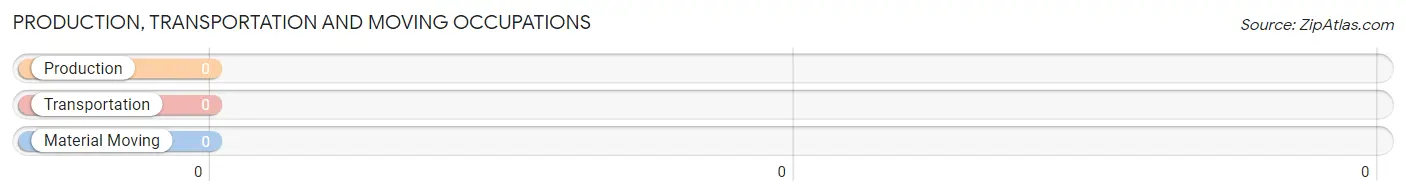
Production, Transportation and Moving Occupations by Sex
| Occupation | Male | Female |
| Production | 0 (0.0%) | 0 (0.0%) |
| Transportation | 0 (0.0%) | 0 (0.0%) |
| Material Moving | 0 (0.0%) | 0 (0.0%) |
| Total (Category) | 0 (0.0%) | 0 (0.0%) |
| Total (Overall) | 20 (64.5%) | 11 (35.5%) |
Employment Industries by Sex in Clarita
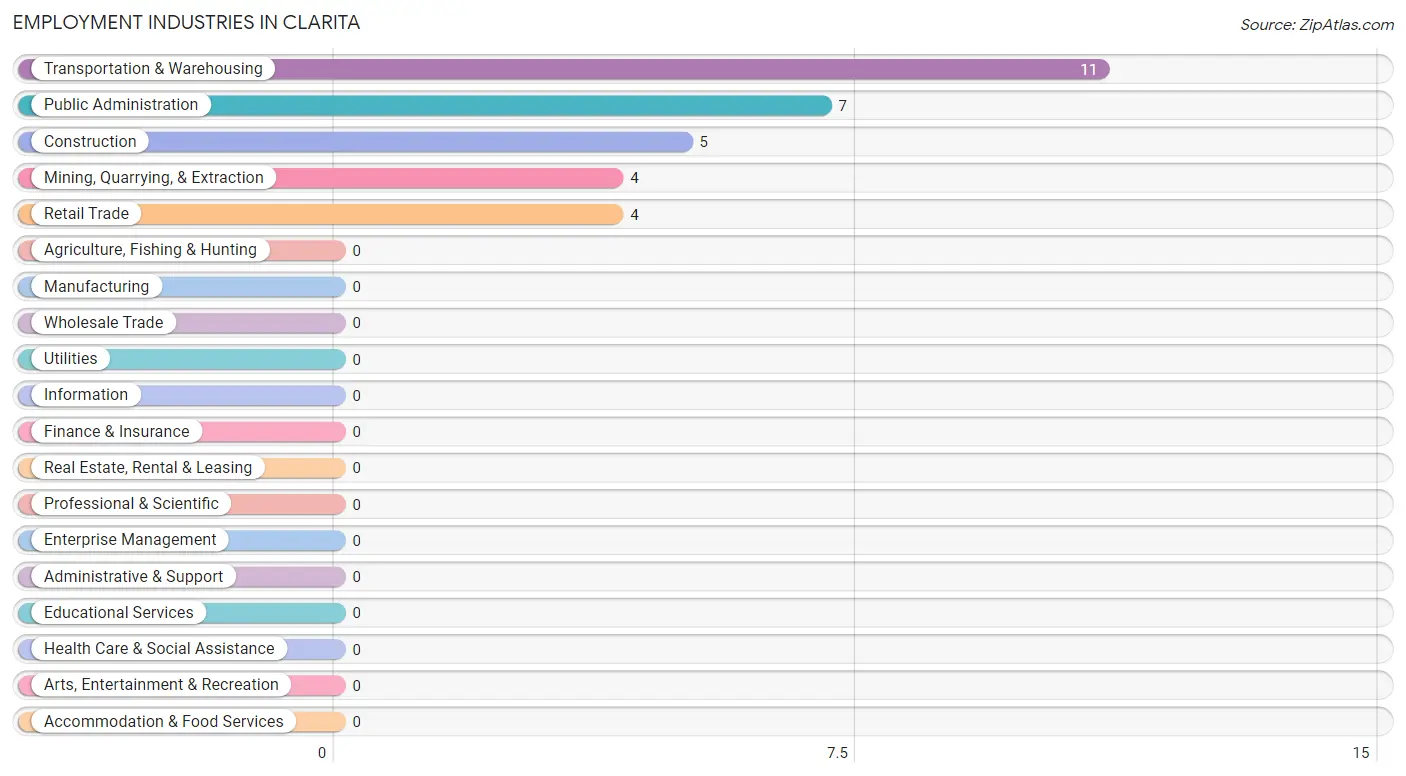
Employment Industries in Clarita
The major employment industries in Clarita include Transportation & Warehousing (11 | 35.5%), Public Administration (7 | 22.6%), Construction (5 | 16.1%), Mining, Quarrying, & Extraction (4 | 12.9%), and Retail Trade (4 | 12.9%).
Employment Industries by Sex in Clarita
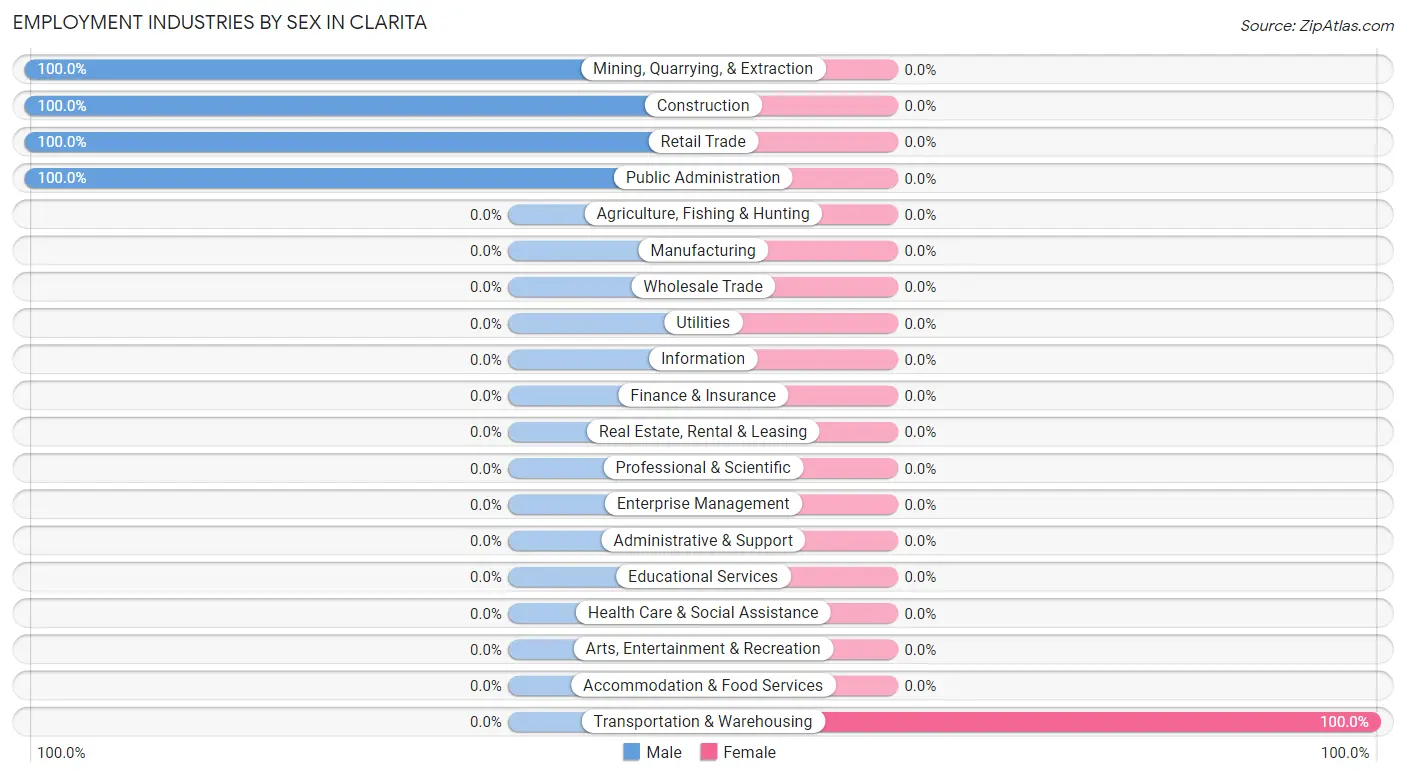
| Industry | Male | Female |
| Agriculture, Fishing & Hunting | 0 (0.0%) | 0 (0.0%) |
| Mining, Quarrying, & Extraction | 4 (100.0%) | 0 (0.0%) |
| Construction | 5 (100.0%) | 0 (0.0%) |
| Manufacturing | 0 (0.0%) | 0 (0.0%) |
| Wholesale Trade | 0 (0.0%) | 0 (0.0%) |
| Retail Trade | 4 (100.0%) | 0 (0.0%) |
| Transportation & Warehousing | 0 (0.0%) | 11 (100.0%) |
| Utilities | 0 (0.0%) | 0 (0.0%) |
| Information | 0 (0.0%) | 0 (0.0%) |
| Finance & Insurance | 0 (0.0%) | 0 (0.0%) |
| Real Estate, Rental & Leasing | 0 (0.0%) | 0 (0.0%) |
| Professional & Scientific | 0 (0.0%) | 0 (0.0%) |
| Enterprise Management | 0 (0.0%) | 0 (0.0%) |
| Administrative & Support | 0 (0.0%) | 0 (0.0%) |
| Educational Services | 0 (0.0%) | 0 (0.0%) |
| Health Care & Social Assistance | 0 (0.0%) | 0 (0.0%) |
| Arts, Entertainment & Recreation | 0 (0.0%) | 0 (0.0%) |
| Accommodation & Food Services | 0 (0.0%) | 0 (0.0%) |
| Public Administration | 7 (100.0%) | 0 (0.0%) |
| Total | 20 (64.5%) | 11 (35.5%) |
Education in Clarita
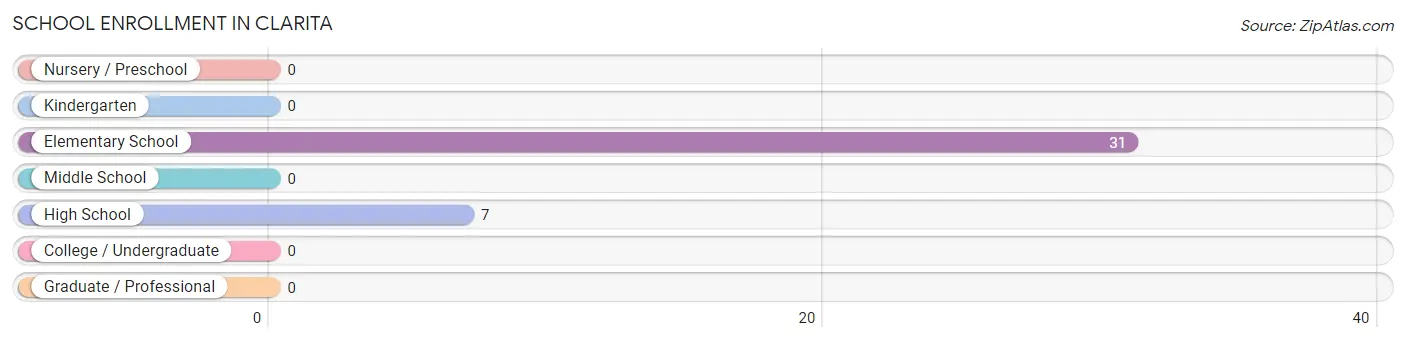
School Enrollment in Clarita
The most common levels of schooling among the 38 students in Clarita are elementary school (31 | 81.6%), and high school (7 | 18.4%).
| School Level | # Students | % Students |
| Nursery / Preschool | 0 | 0.0% |
| Kindergarten | 0 | 0.0% |
| Elementary School | 31 | 81.6% |
| Middle School | 0 | 0.0% |
| High School | 7 | 18.4% |
| College / Undergraduate | 0 | 0.0% |
| Graduate / Professional | 0 | 0.0% |
| Total | 38 | 100.0% |
School Enrollment by Age by Funding Source in Clarita
Out of a total of 38 students who are enrolled in schools in Clarita, 7 (18.4%) attend a private institution, while the remaining 31 (81.6%) are enrolled in public schools. The age group of 15 to 17 year olds has the highest likelihood of being enrolled in private schools, with 7 (100.0% in the age bracket) enrolled. Conversely, the age group of 5 to 9 year old has the lowest likelihood of being enrolled in a private school, with 31 (100.0% in the age bracket) attending a public institution.
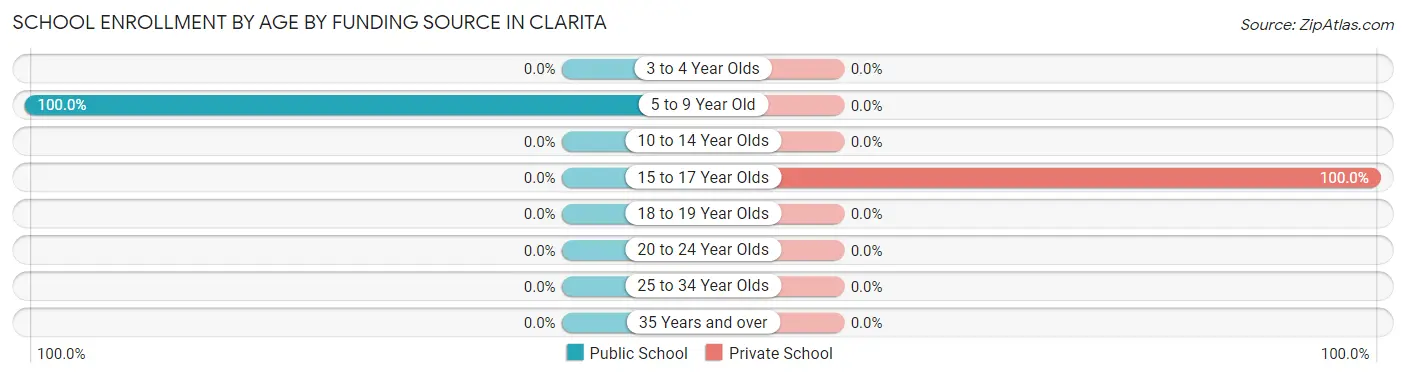
| Age Bracket | Public School | Private School |
| 3 to 4 Year Olds | 0 (0.0%) | 0 (0.0%) |
| 5 to 9 Year Old | 31 (100.0%) | 0 (0.0%) |
| 10 to 14 Year Olds | 0 (0.0%) | 0 (0.0%) |
| 15 to 17 Year Olds | 0 (0.0%) | 7 (100.0%) |
| 18 to 19 Year Olds | 0 (0.0%) | 0 (0.0%) |
| 20 to 24 Year Olds | 0 (0.0%) | 0 (0.0%) |
| 25 to 34 Year Olds | 0 (0.0%) | 0 (0.0%) |
| 35 Years and over | 0 (0.0%) | 0 (0.0%) |
| Total | 31 (81.6%) | 7 (18.4%) |
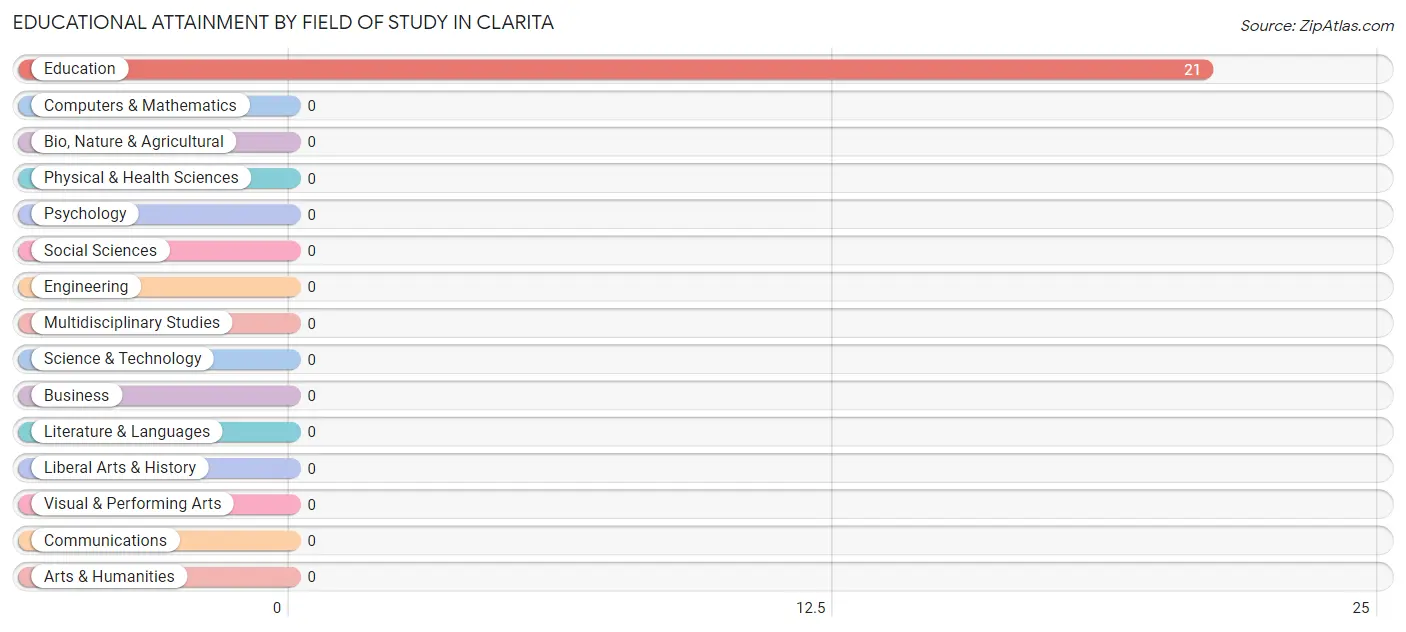
Educational Attainment by Field of Study in Clarita
, and education (21 | 100.0%) are the most common fields of study among 21 individuals in Clarita who have obtained a bachelor's degree or higher.
| Field of Study | # Graduates | % Graduates |
| Computers & Mathematics | 0 | 0.0% |
| Bio, Nature & Agricultural | 0 | 0.0% |
| Physical & Health Sciences | 0 | 0.0% |
| Psychology | 0 | 0.0% |
| Social Sciences | 0 | 0.0% |
| Engineering | 0 | 0.0% |
| Multidisciplinary Studies | 0 | 0.0% |
| Science & Technology | 0 | 0.0% |
| Business | 0 | 0.0% |
| Education | 21 | 100.0% |
| Literature & Languages | 0 | 0.0% |
| Liberal Arts & History | 0 | 0.0% |
| Visual & Performing Arts | 0 | 0.0% |
| Communications | 0 | 0.0% |
| Arts & Humanities | 0 | 0.0% |
| Total | 21 | 100.0% |
Transportation & Commute in Clarita
Vehicle Availability by Sex in Clarita
The most prevalent vehicle ownership categories in Clarita are males with 4 vehicles (9, accounting for 45.0%) and females with 4 vehicles (0, making up 81.8%).
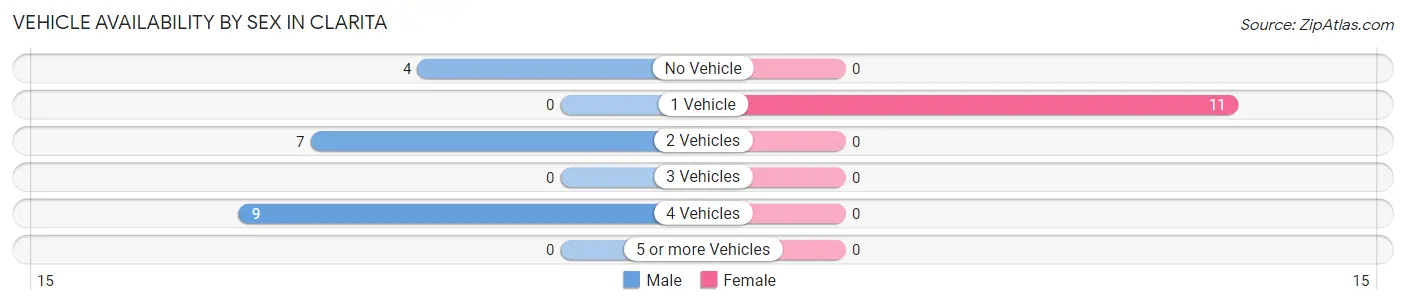
| Vehicles Available | Male | Female |
| No Vehicle | 4 (20.0%) | 0 (0.0%) |
| 1 Vehicle | 0 (0.0%) | 11 (100.0%) |
| 2 Vehicles | 7 (35.0%) | 0 (0.0%) |
| 3 Vehicles | 0 (0.0%) | 0 (0.0%) |
| 4 Vehicles | 9 (45.0%) | 0 (0.0%) |
| 5 or more Vehicles | 0 (0.0%) | 0 (0.0%) |
| Total | 20 (100.0%) | 11 (100.0%) |
Commute Time in Clarita
The most frequently occuring commute durations in Clarita are 30 to 34 minutes (11 commuters, 35.5%), 20 to 24 minutes (7 commuters, 22.6%), and 45 to 59 minutes (5 commuters, 16.1%).
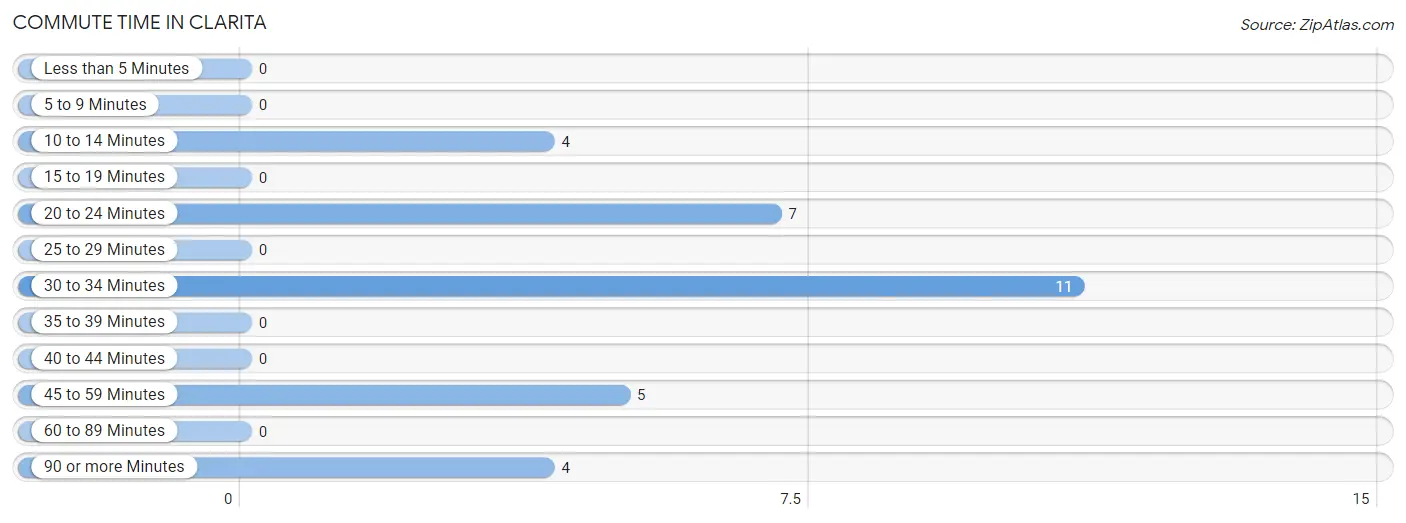
| Commute Time | # Commuters | % Commuters |
| Less than 5 Minutes | 0 | 0.0% |
| 5 to 9 Minutes | 0 | 0.0% |
| 10 to 14 Minutes | 4 | 12.9% |
| 15 to 19 Minutes | 0 | 0.0% |
| 20 to 24 Minutes | 7 | 22.6% |
| 25 to 29 Minutes | 0 | 0.0% |
| 30 to 34 Minutes | 11 | 35.5% |
| 35 to 39 Minutes | 0 | 0.0% |
| 40 to 44 Minutes | 0 | 0.0% |
| 45 to 59 Minutes | 5 | 16.1% |
| 60 to 89 Minutes | 0 | 0.0% |
| 90 or more Minutes | 4 | 12.9% |
Commute Time by Sex in Clarita
The most common commute times in Clarita are 20 to 24 minutes (7 commuters, 35.0%) for males and 30 to 34 minutes (11 commuters, 100.0%) for females.
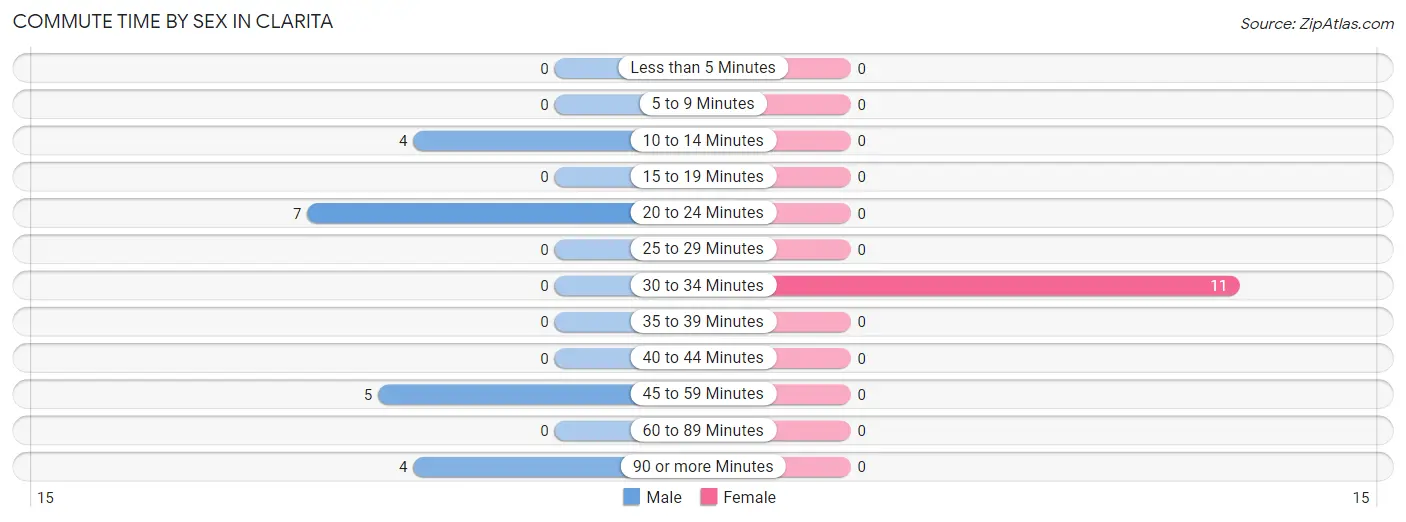
| Commute Time | Male | Female |
| Less than 5 Minutes | 0 (0.0%) | 0 (0.0%) |
| 5 to 9 Minutes | 0 (0.0%) | 0 (0.0%) |
| 10 to 14 Minutes | 4 (20.0%) | 0 (0.0%) |
| 15 to 19 Minutes | 0 (0.0%) | 0 (0.0%) |
| 20 to 24 Minutes | 7 (35.0%) | 0 (0.0%) |
| 25 to 29 Minutes | 0 (0.0%) | 0 (0.0%) |
| 30 to 34 Minutes | 0 (0.0%) | 11 (100.0%) |
| 35 to 39 Minutes | 0 (0.0%) | 0 (0.0%) |
| 40 to 44 Minutes | 0 (0.0%) | 0 (0.0%) |
| 45 to 59 Minutes | 5 (25.0%) | 0 (0.0%) |
| 60 to 89 Minutes | 0 (0.0%) | 0 (0.0%) |
| 90 or more Minutes | 4 (20.0%) | 0 (0.0%) |
Time of Departure to Work by Sex in Clarita
The most frequent times of departure to work in Clarita are 4:00 PM to 11:59 PM (7, 35.0%) for males and 7:00 AM to 7:29 AM (11, 100.0%) for females.
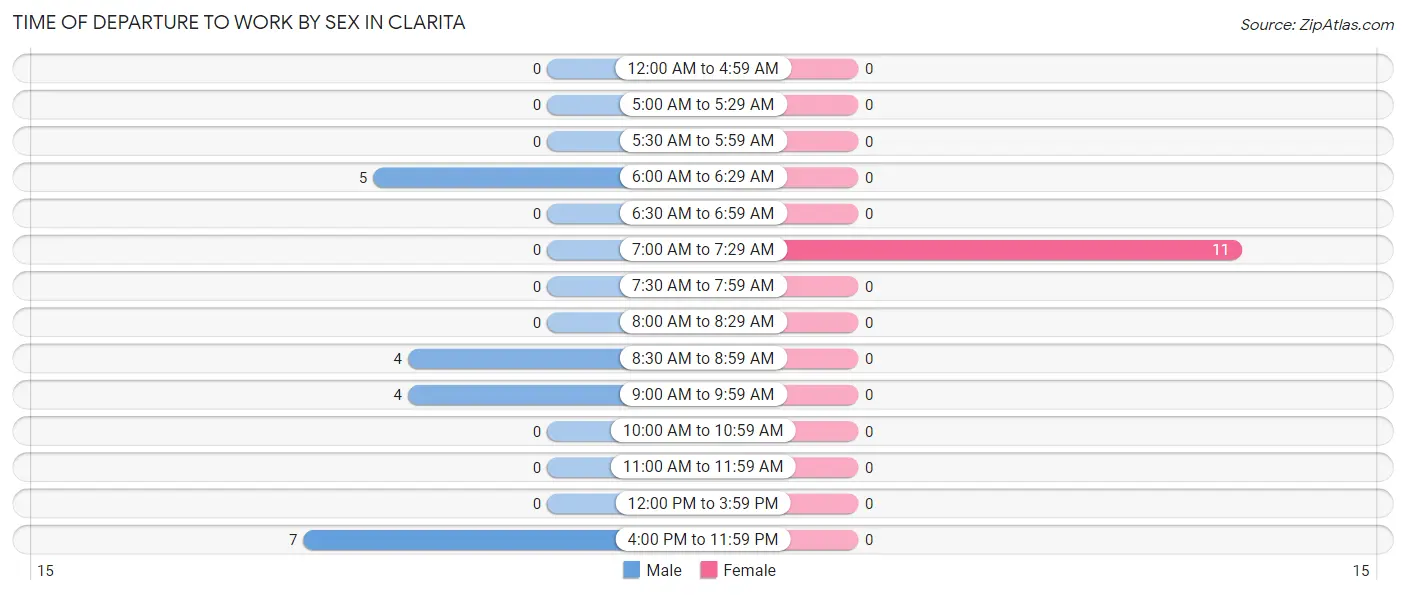
| Time of Departure | Male | Female |
| 12:00 AM to 4:59 AM | 0 (0.0%) | 0 (0.0%) |
| 5:00 AM to 5:29 AM | 0 (0.0%) | 0 (0.0%) |
| 5:30 AM to 5:59 AM | 0 (0.0%) | 0 (0.0%) |
| 6:00 AM to 6:29 AM | 5 (25.0%) | 0 (0.0%) |
| 6:30 AM to 6:59 AM | 0 (0.0%) | 0 (0.0%) |
| 7:00 AM to 7:29 AM | 0 (0.0%) | 11 (100.0%) |
| 7:30 AM to 7:59 AM | 0 (0.0%) | 0 (0.0%) |
| 8:00 AM to 8:29 AM | 0 (0.0%) | 0 (0.0%) |
| 8:30 AM to 8:59 AM | 4 (20.0%) | 0 (0.0%) |
| 9:00 AM to 9:59 AM | 4 (20.0%) | 0 (0.0%) |
| 10:00 AM to 10:59 AM | 0 (0.0%) | 0 (0.0%) |
| 11:00 AM to 11:59 AM | 0 (0.0%) | 0 (0.0%) |
| 12:00 PM to 3:59 PM | 0 (0.0%) | 0 (0.0%) |
| 4:00 PM to 11:59 PM | 7 (35.0%) | 0 (0.0%) |
| Total | 20 (100.0%) | 11 (100.0%) |
Housing Occupancy in Clarita
Occupancy by Ownership in Clarita
Of the total 51 dwellings in Clarita, owner-occupied units account for 44 (86.3%), while renter-occupied units make up 7 (13.7%).
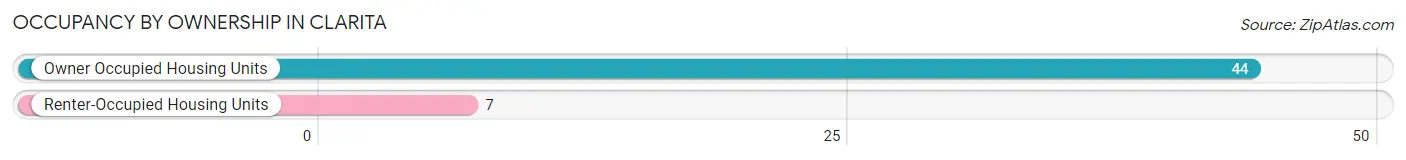
| Occupancy | # Housing Units | % Housing Units |
| Owner Occupied Housing Units | 44 | 86.3% |
| Renter-Occupied Housing Units | 7 | 13.7% |
| Total Occupied Housing Units | 51 | 100.0% |
Occupancy by Household Size in Clarita
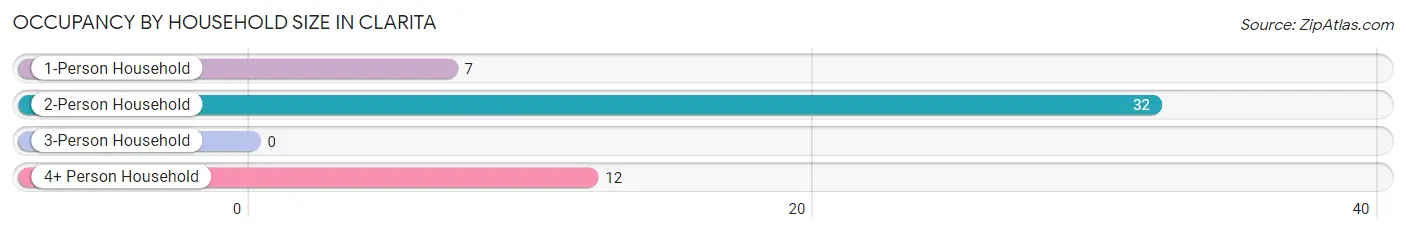
| Household Size | # Housing Units | % Housing Units |
| 1-Person Household | 7 | 13.7% |
| 2-Person Household | 32 | 62.7% |
| 3-Person Household | 0 | 0.0% |
| 4+ Person Household | 12 | 23.5% |
| Total Housing Units | 51 | 100.0% |
Occupancy by Ownership by Household Size in Clarita
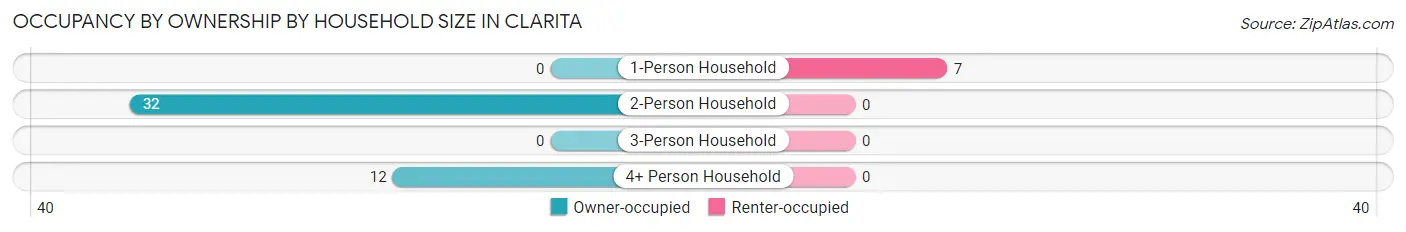
| Household Size | Owner-occupied | Renter-occupied |
| 1-Person Household | 0 (0.0%) | 7 (100.0%) |
| 2-Person Household | 32 (100.0%) | 0 (0.0%) |
| 3-Person Household | 0 (0.0%) | 0 (0.0%) |
| 4+ Person Household | 12 (100.0%) | 0 (0.0%) |
| Total Housing Units | 44 (86.3%) | 7 (13.7%) |
Occupancy by Educational Attainment in Clarita
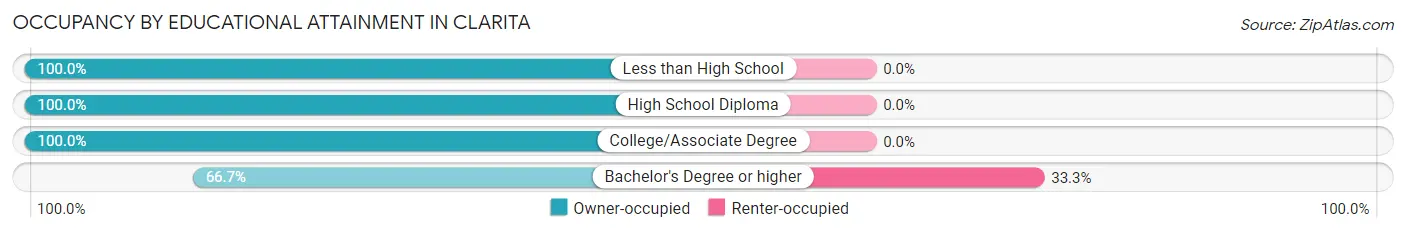
| Household Size | Owner-occupied | Renter-occupied |
| Less than High School | 9 (100.0%) | 0 (0.0%) |
| High School Diploma | 17 (100.0%) | 0 (0.0%) |
| College/Associate Degree | 4 (100.0%) | 0 (0.0%) |
| Bachelor's Degree or higher | 14 (66.7%) | 7 (33.3%) |
Occupancy by Age of Householder in Clarita
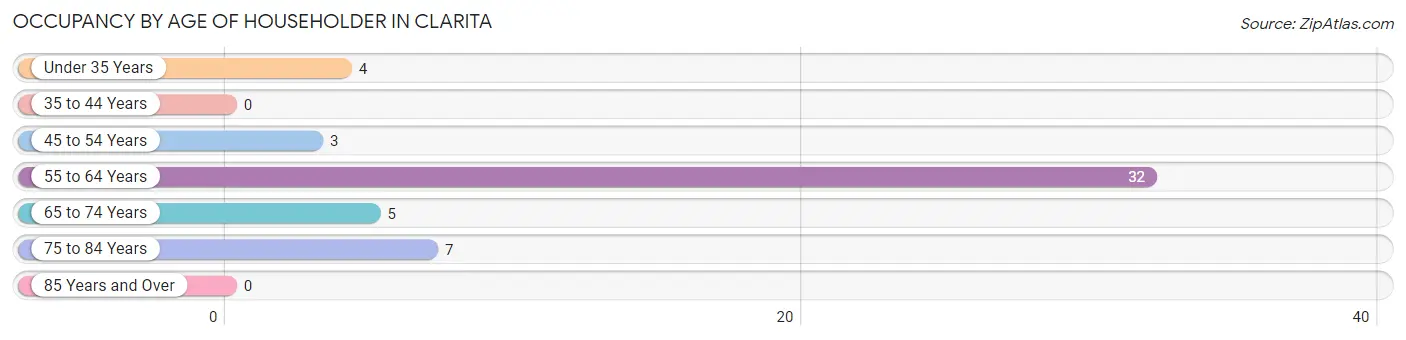
| Age Bracket | # Households | % Households |
| Under 35 Years | 4 | 7.8% |
| 35 to 44 Years | 0 | 0.0% |
| 45 to 54 Years | 3 | 5.9% |
| 55 to 64 Years | 32 | 62.7% |
| 65 to 74 Years | 5 | 9.8% |
| 75 to 84 Years | 7 | 13.7% |
| 85 Years and Over | 0 | 0.0% |
| Total | 51 | 100.0% |
Housing Finances in Clarita
Median Income by Occupancy in Clarita
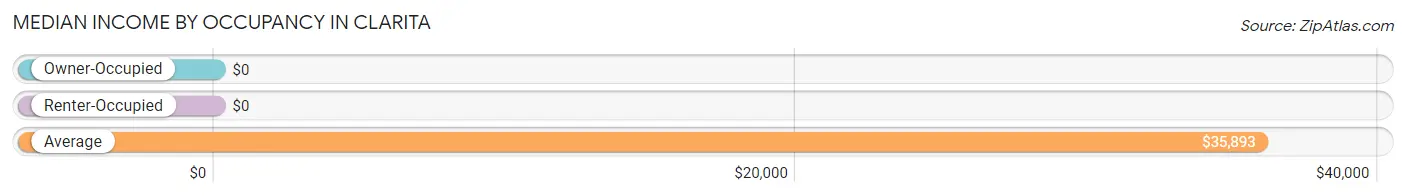
| Occupancy Type | # Households | Median Income |
| Owner-Occupied | 44 (86.3%) | $0 |
| Renter-Occupied | 7 (13.7%) | $0 |
| Average | 51 (100.0%) | $35,893 |
Occupancy by Householder Income Bracket in Clarita
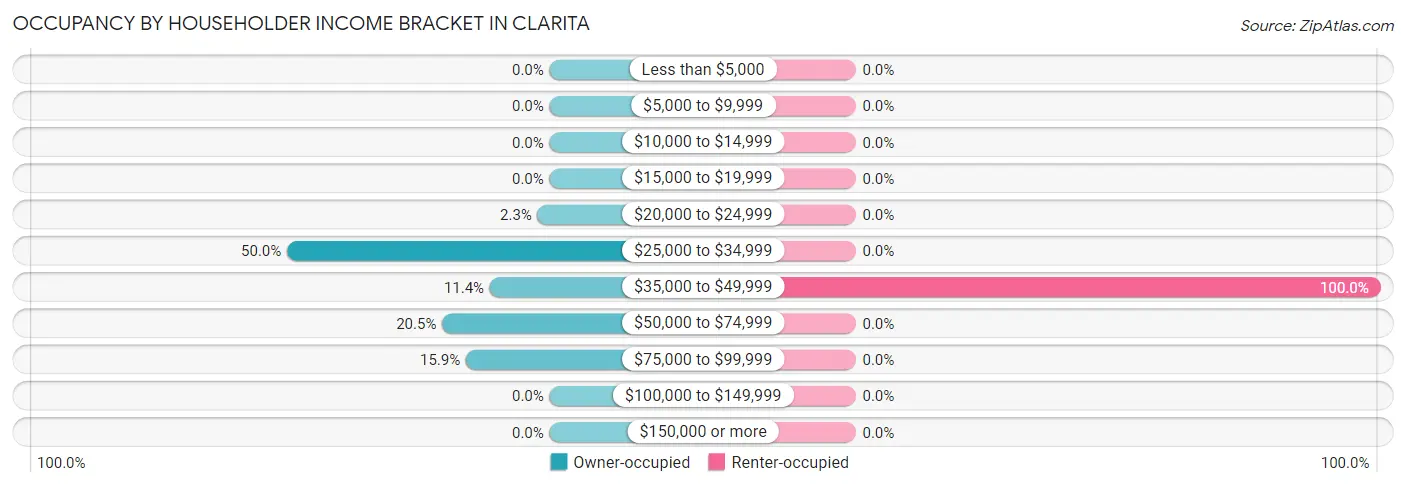
| Income Bracket | Owner-occupied | Renter-occupied |
| Less than $5,000 | 0 (0.0%) | 0 (0.0%) |
| $5,000 to $9,999 | 0 (0.0%) | 0 (0.0%) |
| $10,000 to $14,999 | 0 (0.0%) | 0 (0.0%) |
| $15,000 to $19,999 | 0 (0.0%) | 0 (0.0%) |
| $20,000 to $24,999 | 1 (2.3%) | 0 (0.0%) |
| $25,000 to $34,999 | 22 (50.0%) | 0 (0.0%) |
| $35,000 to $49,999 | 5 (11.4%) | 7 (100.0%) |
| $50,000 to $74,999 | 9 (20.4%) | 0 (0.0%) |
| $75,000 to $99,999 | 7 (15.9%) | 0 (0.0%) |
| $100,000 to $149,999 | 0 (0.0%) | 0 (0.0%) |
| $150,000 or more | 0 (0.0%) | 0 (0.0%) |
| Total | 44 (100.0%) | 7 (100.0%) |
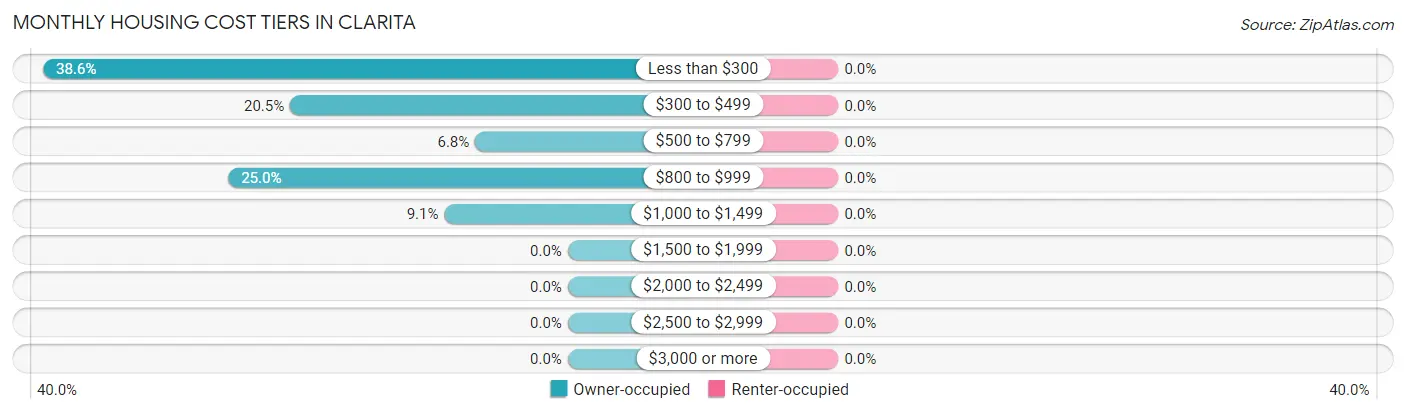
Monthly Housing Cost Tiers in Clarita
| Monthly Cost | Owner-occupied | Renter-occupied |
| Less than $300 | 17 (38.6%) | 0 (0.0%) |
| $300 to $499 | 9 (20.4%) | 0 (0.0%) |
| $500 to $799 | 3 (6.8%) | 0 (0.0%) |
| $800 to $999 | 11 (25.0%) | 0 (0.0%) |
| $1,000 to $1,499 | 4 (9.1%) | 0 (0.0%) |
| $1,500 to $1,999 | 0 (0.0%) | 0 (0.0%) |
| $2,000 to $2,499 | 0 (0.0%) | 0 (0.0%) |
| $2,500 to $2,999 | 0 (0.0%) | 0 (0.0%) |
| $3,000 or more | 0 (0.0%) | 0 (0.0%) |
| Total | 44 (100.0%) | 7 (100.0%) |
Physical Housing Characteristics in Clarita
Housing Structures in Clarita
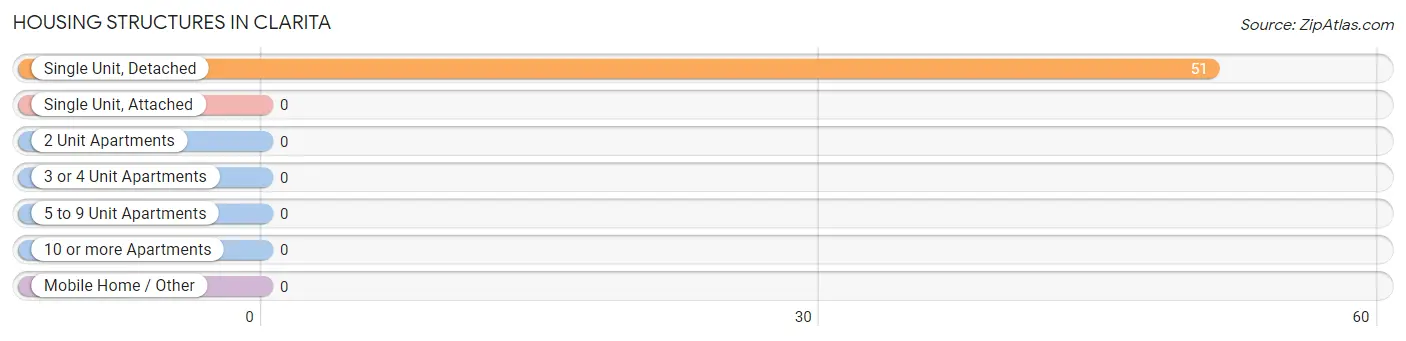
| Structure Type | # Housing Units | % Housing Units |
| Single Unit, Detached | 51 | 100.0% |
| Single Unit, Attached | 0 | 0.0% |
| 2 Unit Apartments | 0 | 0.0% |
| 3 or 4 Unit Apartments | 0 | 0.0% |
| 5 to 9 Unit Apartments | 0 | 0.0% |
| 10 or more Apartments | 0 | 0.0% |
| Mobile Home / Other | 0 | 0.0% |
| Total | 51 | 100.0% |
Housing Structures by Occupancy in Clarita
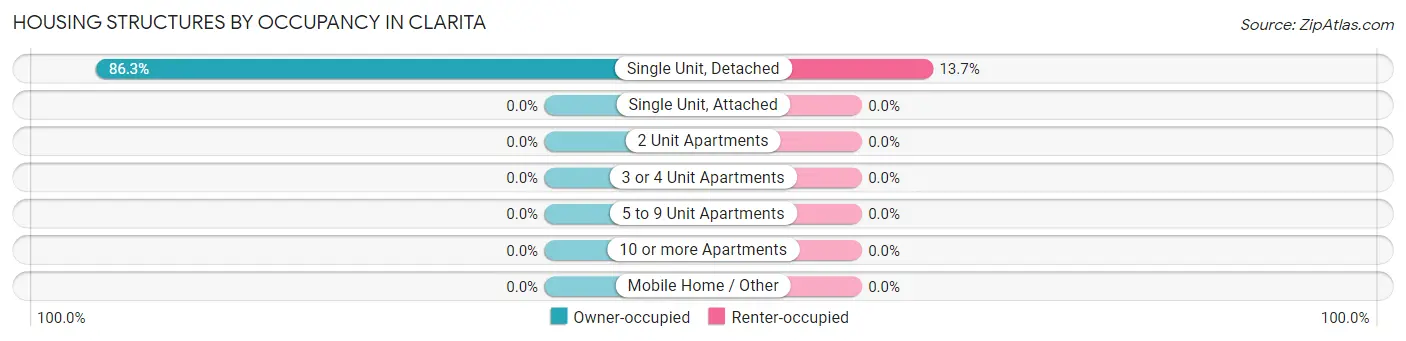
| Structure Type | Owner-occupied | Renter-occupied |
| Single Unit, Detached | 44 (86.3%) | 7 (13.7%) |
| Single Unit, Attached | 0 (0.0%) | 0 (0.0%) |
| 2 Unit Apartments | 0 (0.0%) | 0 (0.0%) |
| 3 or 4 Unit Apartments | 0 (0.0%) | 0 (0.0%) |
| 5 to 9 Unit Apartments | 0 (0.0%) | 0 (0.0%) |
| 10 or more Apartments | 0 (0.0%) | 0 (0.0%) |
| Mobile Home / Other | 0 (0.0%) | 0 (0.0%) |
| Total | 44 (86.3%) | 7 (13.7%) |
Housing Structures by Number of Rooms in Clarita
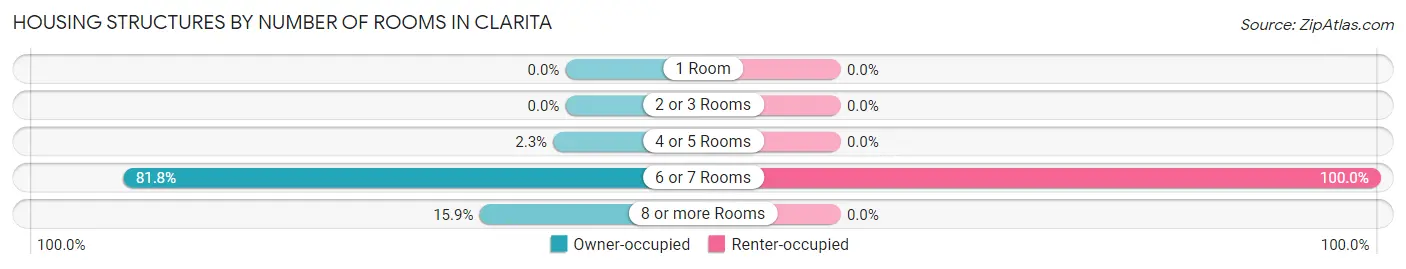
| Number of Rooms | Owner-occupied | Renter-occupied |
| 1 Room | 0 (0.0%) | 0 (0.0%) |
| 2 or 3 Rooms | 0 (0.0%) | 0 (0.0%) |
| 4 or 5 Rooms | 1 (2.3%) | 0 (0.0%) |
| 6 or 7 Rooms | 36 (81.8%) | 7 (100.0%) |
| 8 or more Rooms | 7 (15.9%) | 0 (0.0%) |
| Total | 44 (100.0%) | 7 (100.0%) |
Housing Structure by Heating Type in Clarita
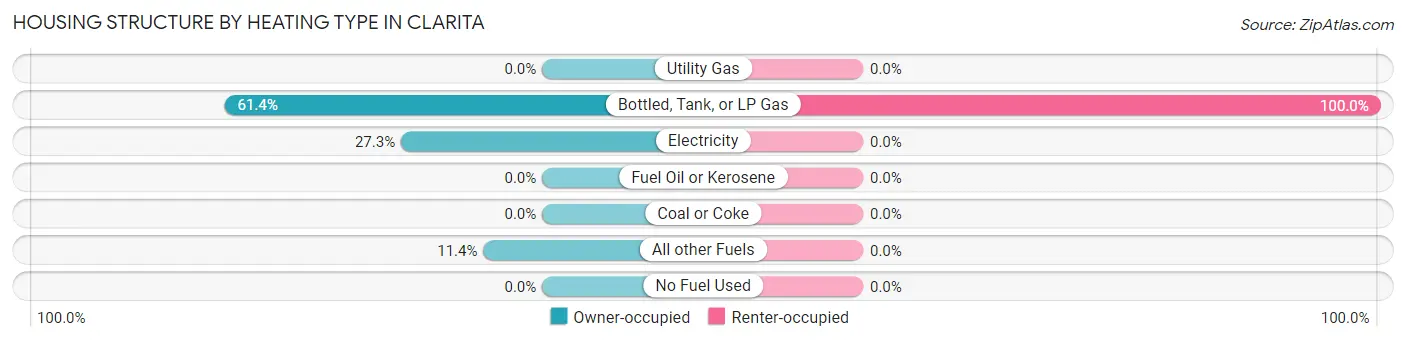
| Heating Type | Owner-occupied | Renter-occupied |
| Utility Gas | 0 (0.0%) | 0 (0.0%) |
| Bottled, Tank, or LP Gas | 27 (61.4%) | 7 (100.0%) |
| Electricity | 12 (27.3%) | 0 (0.0%) |
| Fuel Oil or Kerosene | 0 (0.0%) | 0 (0.0%) |
| Coal or Coke | 0 (0.0%) | 0 (0.0%) |
| All other Fuels | 5 (11.4%) | 0 (0.0%) |
| No Fuel Used | 0 (0.0%) | 0 (0.0%) |
| Total | 44 (100.0%) | 7 (100.0%) |
Household Vehicle Usage in Clarita
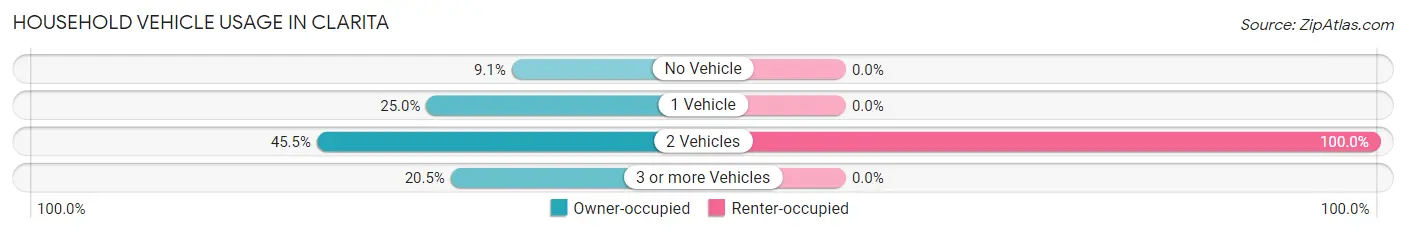
| Vehicles per Household | Owner-occupied | Renter-occupied |
| No Vehicle | 4 (9.1%) | 0 (0.0%) |
| 1 Vehicle | 11 (25.0%) | 0 (0.0%) |
| 2 Vehicles | 20 (45.5%) | 7 (100.0%) |
| 3 or more Vehicles | 9 (20.4%) | 0 (0.0%) |
| Total | 44 (100.0%) | 7 (100.0%) |
Real Estate & Mortgages in Clarita
Real Estate and Mortgage Overview in Clarita
| Characteristic | Without Mortgage | With Mortgage |
| Housing Units | 29 | 15 |
| Median Property Value | $55,000 | $0 |
| Median Household Income | $41,250 | $0 |
| Monthly Housing Costs | $279 | $0 |
| Real Estate Taxes | $338 | $0 |
Property Value by Mortgage Status in Clarita
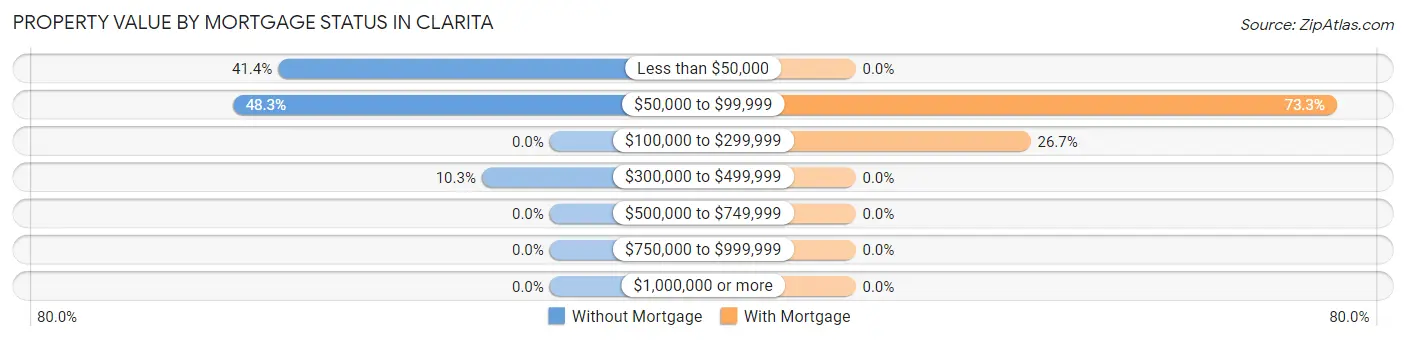
| Property Value | Without Mortgage | With Mortgage |
| Less than $50,000 | 12 (41.4%) | 0 (0.0%) |
| $50,000 to $99,999 | 14 (48.3%) | 11 (73.3%) |
| $100,000 to $299,999 | 0 (0.0%) | 4 (26.7%) |
| $300,000 to $499,999 | 3 (10.3%) | 0 (0.0%) |
| $500,000 to $749,999 | 0 (0.0%) | 0 (0.0%) |
| $750,000 to $999,999 | 0 (0.0%) | 0 (0.0%) |
| $1,000,000 or more | 0 (0.0%) | 0 (0.0%) |
| Total | 29 (100.0%) | 15 (100.0%) |
Household Income by Mortgage Status in Clarita
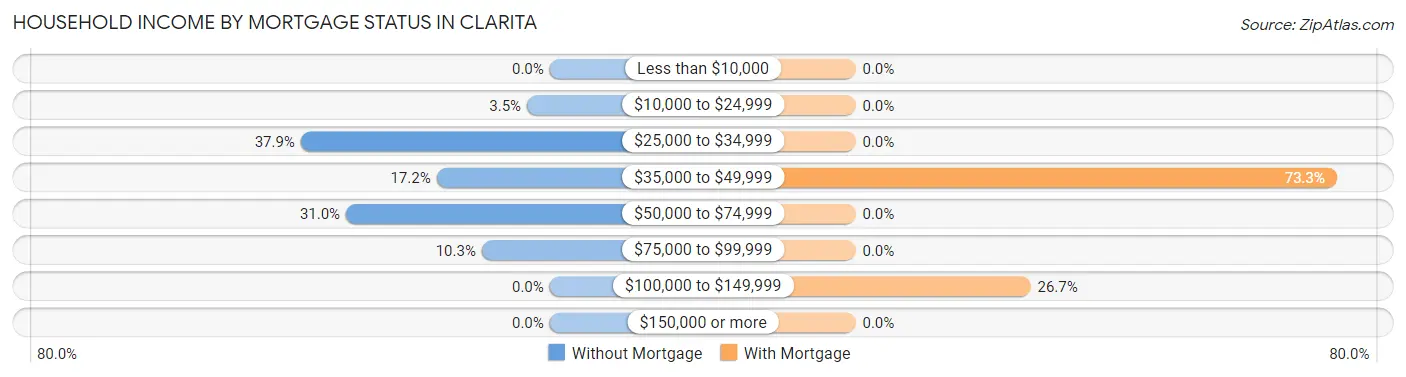
| Household Income | Without Mortgage | With Mortgage |
| Less than $10,000 | 0 (0.0%) | 0 (0.0%) |
| $10,000 to $24,999 | 1 (3.5%) | 0 (0.0%) |
| $25,000 to $34,999 | 11 (37.9%) | 0 (0.0%) |
| $35,000 to $49,999 | 5 (17.2%) | 11 (73.3%) |
| $50,000 to $74,999 | 9 (31.0%) | 0 (0.0%) |
| $75,000 to $99,999 | 3 (10.3%) | 0 (0.0%) |
| $100,000 to $149,999 | 0 (0.0%) | 4 (26.7%) |
| $150,000 or more | 0 (0.0%) | 0 (0.0%) |
| Total | 29 (100.0%) | 15 (100.0%) |
Property Value to Household Income Ratio in Clarita
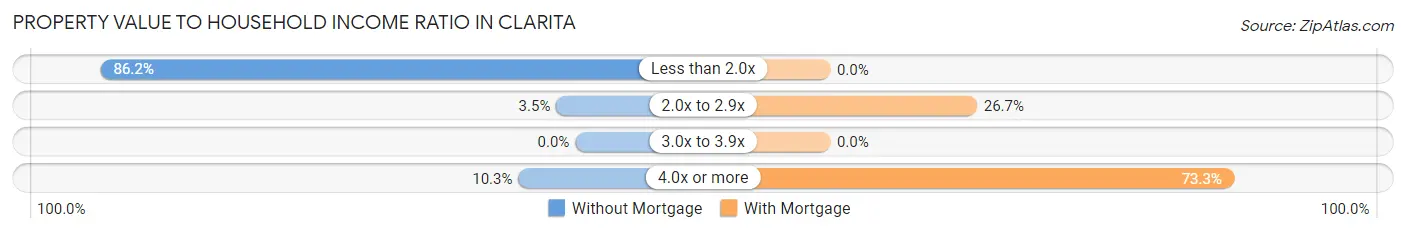
| Value-to-Income Ratio | Without Mortgage | With Mortgage |
| Less than 2.0x | 25 (86.2%) | 0 (0.0%) |
| 2.0x to 2.9x | 1 (3.5%) | 4 (26.7%) |
| 3.0x to 3.9x | 0 (0.0%) | 0 (0.0%) |
| 4.0x or more | 3 (10.3%) | 11 (73.3%) |
| Total | 29 (100.0%) | 15 (100.0%) |
Real Estate Taxes by Mortgage Status in Clarita
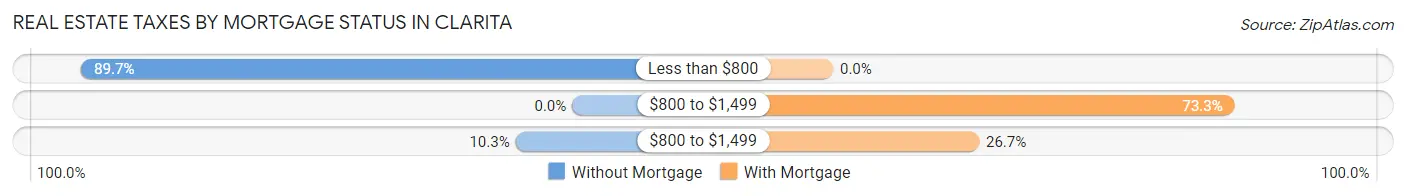
| Property Taxes | Without Mortgage | With Mortgage |
| Less than $800 | 26 (89.7%) | 0 (0.0%) |
| $800 to $1,499 | 0 (0.0%) | 11 (73.3%) |
| $800 to $1,499 | 3 (10.3%) | 4 (26.7%) |
| Total | 29 (100.0%) | 15 (100.0%) |
Health & Disability in Clarita
Health Insurance Coverage by Age in Clarita
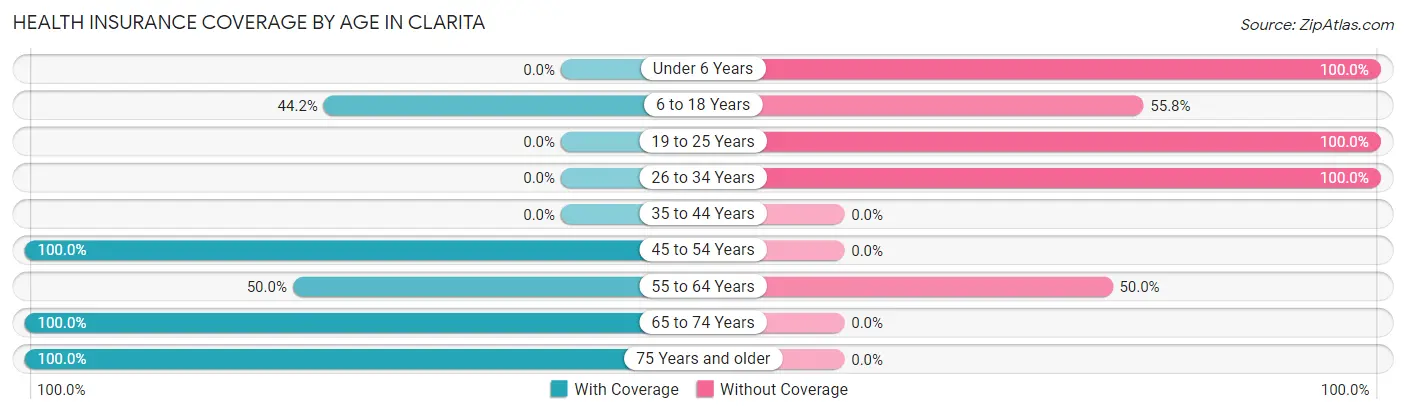
| Age Bracket | With Coverage | Without Coverage |
| Under 6 Years | 0 (0.0%) | 12 (100.0%) |
| 6 to 18 Years | 23 (44.2%) | 29 (55.8%) |
| 19 to 25 Years | 0 (0.0%) | 10 (100.0%) |
| 26 to 34 Years | 0 (0.0%) | 23 (100.0%) |
| 35 to 44 Years | 0 (0.0%) | 0 (0.0%) |
| 45 to 54 Years | 10 (100.0%) | 0 (0.0%) |
| 55 to 64 Years | 27 (50.0%) | 27 (50.0%) |
| 65 to 74 Years | 6 (100.0%) | 0 (0.0%) |
| 75 Years and older | 12 (100.0%) | 0 (0.0%) |
| Total | 78 (43.6%) | 101 (56.4%) |
Health Insurance Coverage by Citizenship Status in Clarita
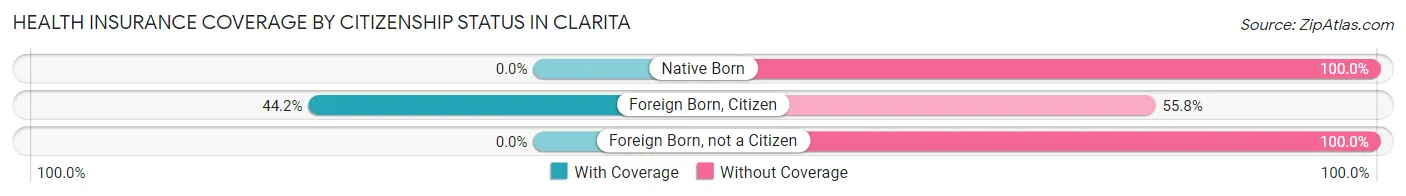
| Citizenship Status | With Coverage | Without Coverage |
| Native Born | 0 (0.0%) | 12 (100.0%) |
| Foreign Born, Citizen | 23 (44.2%) | 29 (55.8%) |
| Foreign Born, not a Citizen | 0 (0.0%) | 10 (100.0%) |
Health Insurance Coverage by Household Income in Clarita
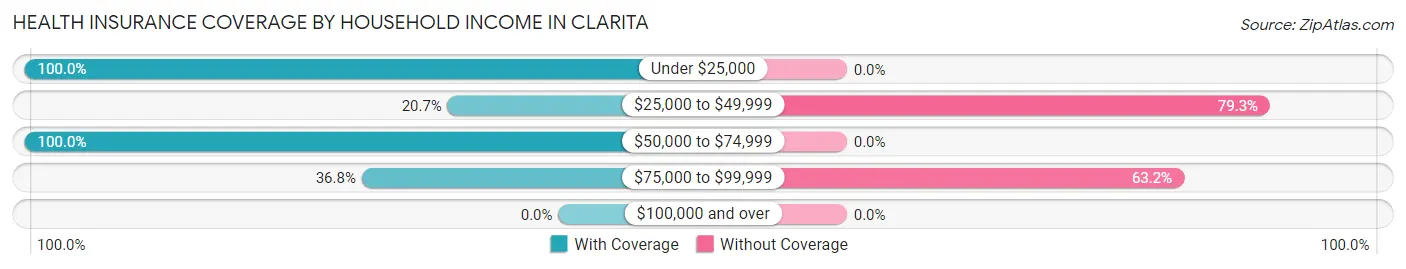
| Household Income | With Coverage | Without Coverage |
| Under $25,000 | 23 (100.0%) | 0 (0.0%) |
| $25,000 to $49,999 | 17 (20.7%) | 65 (79.3%) |
| $50,000 to $74,999 | 17 (100.0%) | 0 (0.0%) |
| $75,000 to $99,999 | 21 (36.8%) | 36 (63.2%) |
| $100,000 and over | 0 (0.0%) | 0 (0.0%) |
Public vs Private Health Insurance Coverage by Age in Clarita
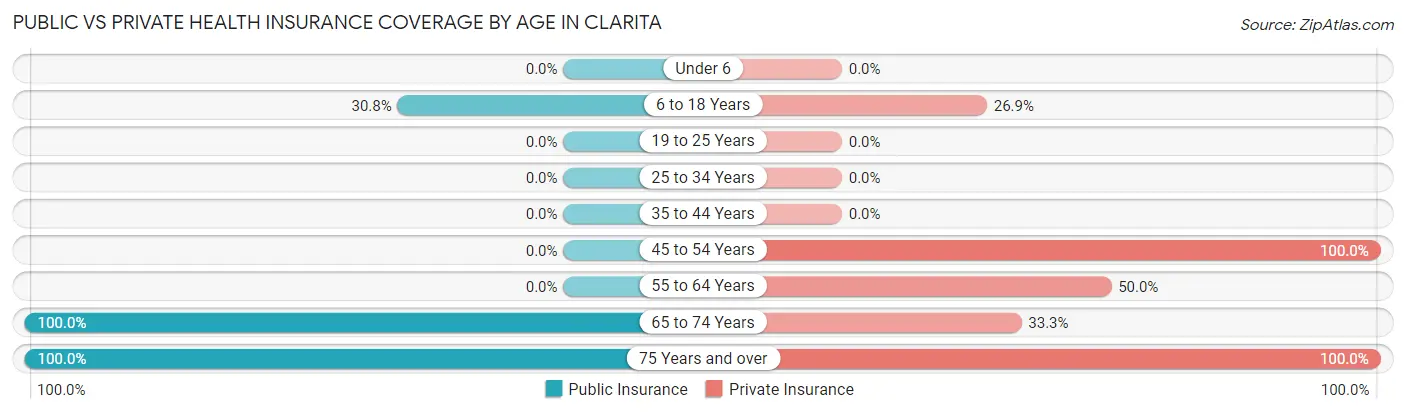
| Age Bracket | Public Insurance | Private Insurance |
| Under 6 | 0 (0.0%) | 0 (0.0%) |
| 6 to 18 Years | 16 (30.8%) | 14 (26.9%) |
| 19 to 25 Years | 0 (0.0%) | 0 (0.0%) |
| 25 to 34 Years | 0 (0.0%) | 0 (0.0%) |
| 35 to 44 Years | 0 (0.0%) | 0 (0.0%) |
| 45 to 54 Years | 0 (0.0%) | 10 (100.0%) |
| 55 to 64 Years | 0 (0.0%) | 27 (50.0%) |
| 65 to 74 Years | 6 (100.0%) | 2 (33.3%) |
| 75 Years and over | 12 (100.0%) | 12 (100.0%) |
| Total | 34 (19.0%) | 65 (36.3%) |
Disability Status by Sex by Age in Clarita
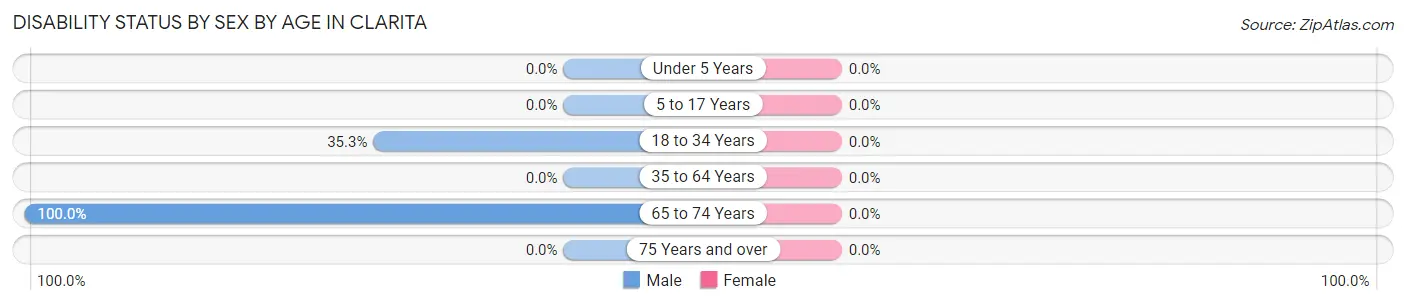
| Age Bracket | Male | Female |
| Under 5 Years | 0 (0.0%) | 0 (0.0%) |
| 5 to 17 Years | 0 (0.0%) | 0 (0.0%) |
| 18 to 34 Years | 6 (35.3%) | 0 (0.0%) |
| 35 to 64 Years | 0 (0.0%) | 0 (0.0%) |
| 65 to 74 Years | 1 (100.0%) | 0 (0.0%) |
| 75 Years and over | 0 (0.0%) | 0 (0.0%) |
Disability Class by Sex by Age in Clarita
Disability Class: Hearing Difficulty
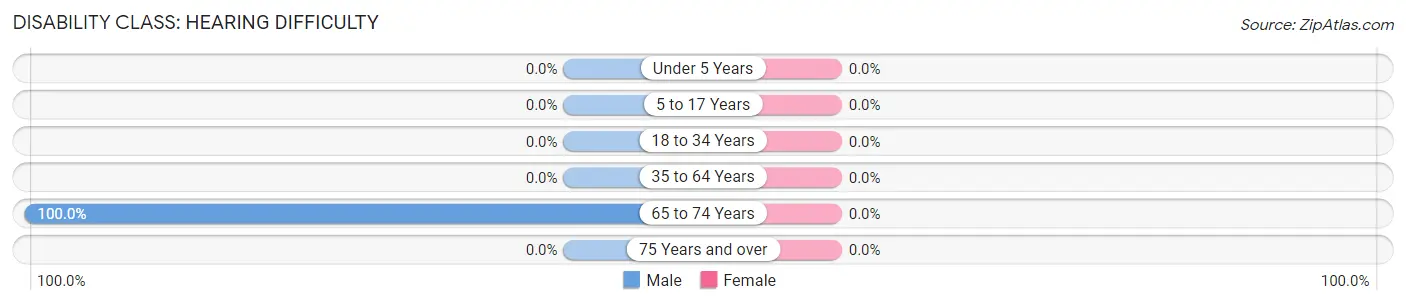
| Age Bracket | Male | Female |
| Under 5 Years | 0 (0.0%) | 0 (0.0%) |
| 5 to 17 Years | 0 (0.0%) | 0 (0.0%) |
| 18 to 34 Years | 0 (0.0%) | 0 (0.0%) |
| 35 to 64 Years | 0 (0.0%) | 0 (0.0%) |
| 65 to 74 Years | 1 (100.0%) | 0 (0.0%) |
| 75 Years and over | 0 (0.0%) | 0 (0.0%) |
Disability Class: Vision Difficulty
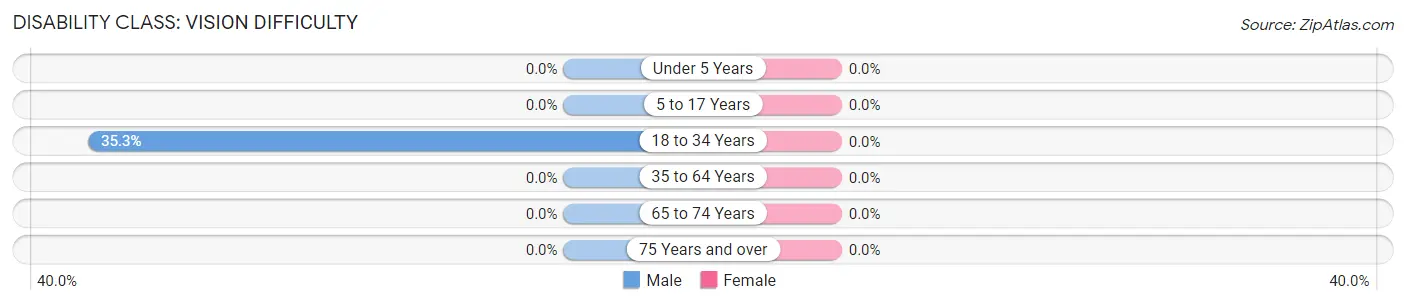
| Age Bracket | Male | Female |
| Under 5 Years | 0 (0.0%) | 0 (0.0%) |
| 5 to 17 Years | 0 (0.0%) | 0 (0.0%) |
| 18 to 34 Years | 6 (35.3%) | 0 (0.0%) |
| 35 to 64 Years | 0 (0.0%) | 0 (0.0%) |
| 65 to 74 Years | 0 (0.0%) | 0 (0.0%) |
| 75 Years and over | 0 (0.0%) | 0 (0.0%) |
Disability Class: Cognitive Difficulty
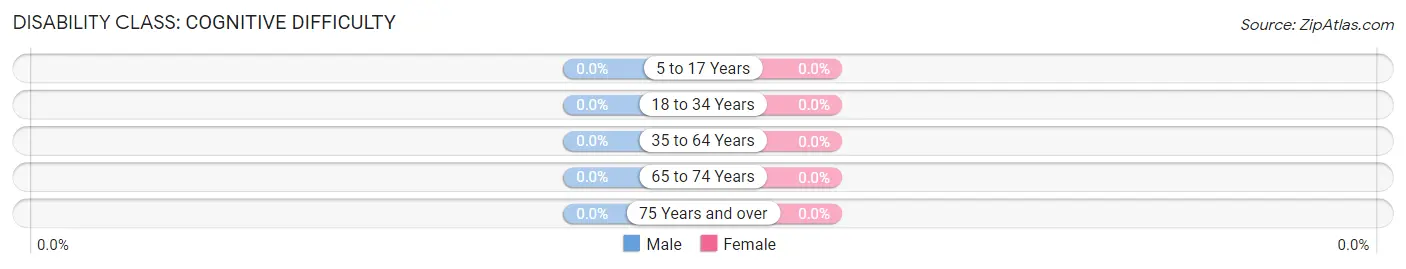
| Age Bracket | Male | Female |
| 5 to 17 Years | 0 (0.0%) | 0 (0.0%) |
| 18 to 34 Years | 0 (0.0%) | 0 (0.0%) |
| 35 to 64 Years | 0 (0.0%) | 0 (0.0%) |
| 65 to 74 Years | 0 (0.0%) | 0 (0.0%) |
| 75 Years and over | 0 (0.0%) | 0 (0.0%) |
Disability Class: Ambulatory Difficulty
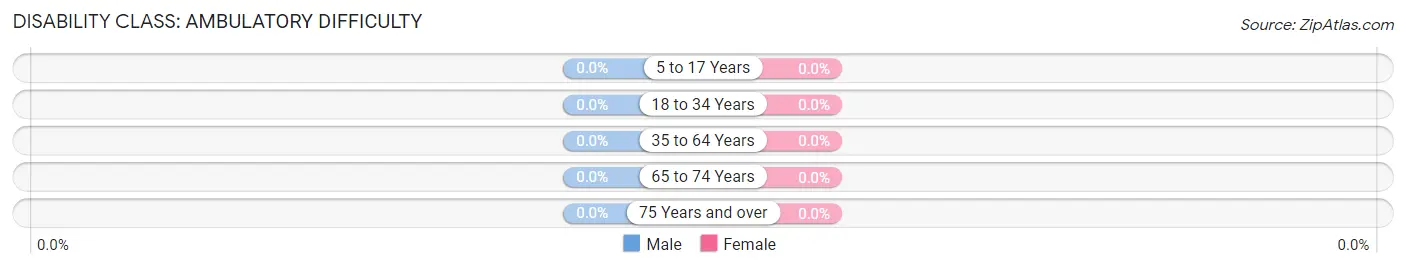
| Age Bracket | Male | Female |
| 5 to 17 Years | 0 (0.0%) | 0 (0.0%) |
| 18 to 34 Years | 0 (0.0%) | 0 (0.0%) |
| 35 to 64 Years | 0 (0.0%) | 0 (0.0%) |
| 65 to 74 Years | 0 (0.0%) | 0 (0.0%) |
| 75 Years and over | 0 (0.0%) | 0 (0.0%) |
Disability Class: Self-Care Difficulty
| Age Bracket | Male | Female |
| 5 to 17 Years | 0 (0.0%) | 0 (0.0%) |
| 18 to 34 Years | 0 (0.0%) | 0 (0.0%) |
| 35 to 64 Years | 0 (0.0%) | 0 (0.0%) |
| 65 to 74 Years | 0 (0.0%) | 0 (0.0%) |
| 75 Years and over | 0 (0.0%) | 0 (0.0%) |
Technology Access in Clarita
Computing Device Access in Clarita
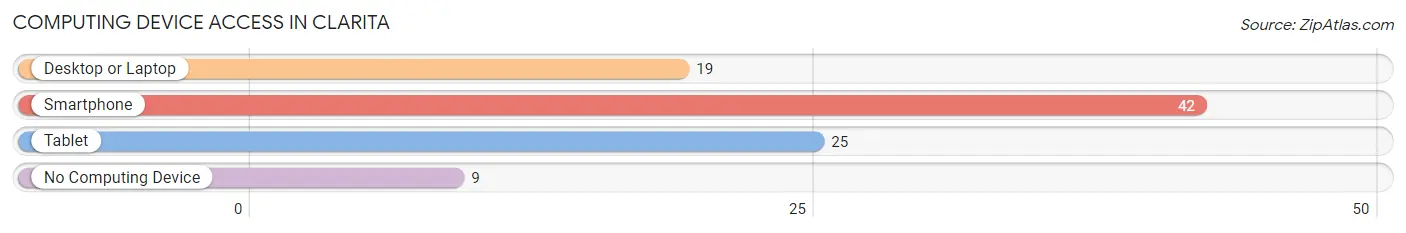
| Device Type | # Households | % Households |
| Desktop or Laptop | 19 | 37.2% |
| Smartphone | 42 | 82.4% |
| Tablet | 25 | 49.0% |
| No Computing Device | 9 | 17.6% |
| Total | 51 | 100.0% |
Internet Access in Clarita
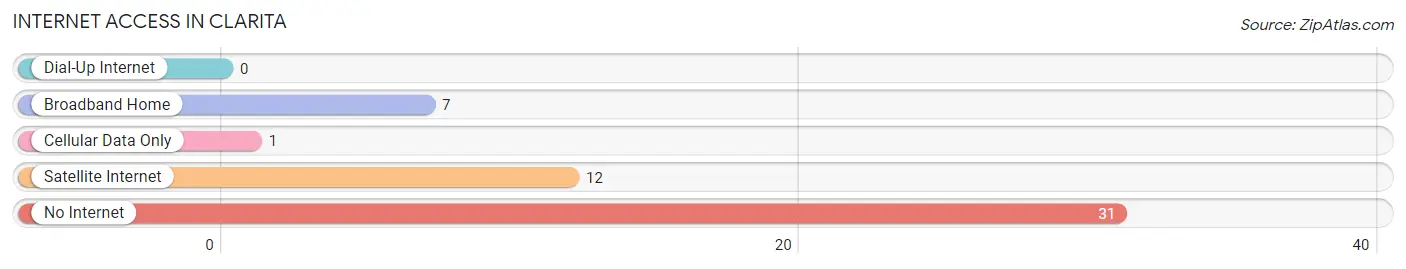
| Internet Type | # Households | % Households |
| Dial-Up Internet | 0 | 0.0% |
| Broadband Home | 7 | 13.7% |
| Cellular Data Only | 1 | 2.0% |
| Satellite Internet | 12 | 23.5% |
| No Internet | 31 | 60.8% |
| Total | 51 | 100.0% |
Clarita Summary
History
The town of Clarita, Oklahoma is located in the southeastern part of the state, in Coal County. It was founded in 1891 by the Choctaw Nation, and was named after the daughter of a local Choctaw chief. The town was originally a trading post, and was the first settlement in the area.
The town grew quickly, and by the early 1900s, it had become a bustling center of commerce. The town was home to several businesses, including a general store, a hotel, a bank, and a post office. The town also had a school, a church, and a newspaper.
In the early 1900s, the town was also home to a large number of coal mines. The coal industry was the main source of employment for the town, and it provided a steady income for many of the residents.
The town continued to grow throughout the 20th century, and by the 1950s, it had become a thriving community. The town was home to several businesses, including a grocery store, a hardware store, a drug store, and a movie theater.
The town also had a hospital, a library, and a number of churches. The town was also home to a number of civic organizations, including the Lions Club, the Rotary Club, and the Chamber of Commerce.
Geography
Clarita is located in the southeastern part of Oklahoma, in Coal County. The town is situated on the banks of the Clear Boggy River, and is surrounded by rolling hills and wooded areas. The town is located about 30 miles from the nearest major city, McAlester.
The town has a total area of 1.2 square miles, and has a population of approximately 1,000 people. The town is located at an elevation of 890 feet above sea level.
Economy
The economy of Clarita is largely based on agriculture and coal mining. The town is home to several farms, and the surrounding area is known for its production of wheat, corn, and soybeans. The town is also home to several coal mines, which provide employment for many of the town’s residents.
The town is also home to several small businesses, including a grocery store, a hardware store, a drug store, and a movie theater. The town also has a hospital, a library, and a number of churches.
Demographics
As of the 2010 census, the population of Clarita was 1,000 people. The town is predominantly white, with approximately 95% of the population being white. The town also has a small Hispanic population, with approximately 4% of the population being Hispanic.
The median household income in Clarita is $35,000, and the median home value is $80,000. The town has a poverty rate of approximately 15%, and the unemployment rate is around 5%.
Conclusion
Clarita, Oklahoma is a small town located in the southeastern part of the state. The town was founded in 1891 by the Choctaw Nation, and was originally a trading post. The town has grown over the years, and is now home to several businesses, a hospital, a library, and a number of churches. The economy of the town is largely based on agriculture and coal mining, and the town has a population of approximately 1,000 people. The town is predominantly white, with a small Hispanic population. The median household income in Clarita is $35,000, and the median home value is $80,000.
Common Questions
What is Per Capita Income in Clarita?
Per Capita income in Clarita is $14,707.
What is the Median Household income in Clarita?
Median Household Income in Clarita is $35,893.
What is Inequality or Gini Index in Clarita?
Inequality or Gini Index in Clarita is 0.26.
What is the Total Population of Clarita?
Total Population of Clarita is 179.
What is the Total Male Population of Clarita?
Total Male Population of Clarita is 68.
What is the Total Female Population of Clarita?
Total Female Population of Clarita is 111.
What is the Ratio of Males per 100 Females in Clarita?
There are 61.26 Males per 100 Females in Clarita.
What is the Ratio of Females per 100 Males in Clarita?
There are 163.24 Females per 100 Males in Clarita.
What is the Median Population Age in Clarita?
Median Population Age in Clarita is 33.6 Years.
What is the Average Family Size in Clarita
Average Family Size in Clarita is 3.7 People.
What is the Average Household Size in Clarita
Average Household Size in Clarita is 3.5 People.
How Large is the Labor Force in Clarita?
There are 38 People in the Labor Forcein in Clarita.
What is the Percentage of People in the Labor Force in Clarita?
31.1% of People are in the Labor Force in Clarita.
What is the Unemployment Rate in Clarita?
Unemployment Rate in Clarita is 18.4%.