Cedar Valley, OK Map & Demographics
Cedar Valley Map
Cedar Valley Overview
$55,823
PER CAPITA INCOME
$124,213
AVG FAMILY INCOME
$123,287
AVG HOUSEHOLD INCOME
26.0%
WAGE / INCOME GAP [ % ]
74.0¢/ $1
WAGE / INCOME GAP [ $ ]
0.37
INEQUALITY / GINI INDEX
500
TOTAL POPULATION
225
MALE POPULATION
275
FEMALE POPULATION
81.82
MALES / 100 FEMALES
122.22
FEMALES / 100 MALES
60.9
MEDIAN AGE
2.8
AVG FAMILY SIZE
2.6
AVG HOUSEHOLD SIZE
184
LABOR FORCE [ PEOPLE ]
40.8%
PERCENT IN LABOR FORCE
1.6%
UNEMPLOYMENT RATE
Income in Cedar Valley
Income Overview in Cedar Valley
Per Capita Income in Cedar Valley is $55,823, while median incomes of families and households are $124,213 and $123,287 respectively.
| Characteristic | Number | Measure |
| Per Capita Income | 500 | $55,823 |
| Median Family Income | 171 | $124,213 |
| Mean Family Income | 171 | $152,569 |
| Median Household Income | 191 | $123,287 |
| Mean Household Income | 191 | $143,408 |
| Income Deficit | 171 | $0 |
| Wage / Income Gap (%) | 500 | 26.00% |
| Wage / Income Gap ($) | 500 | 74.00¢ per $1 |
| Gini / Inequality Index | 500 | 0.37 |
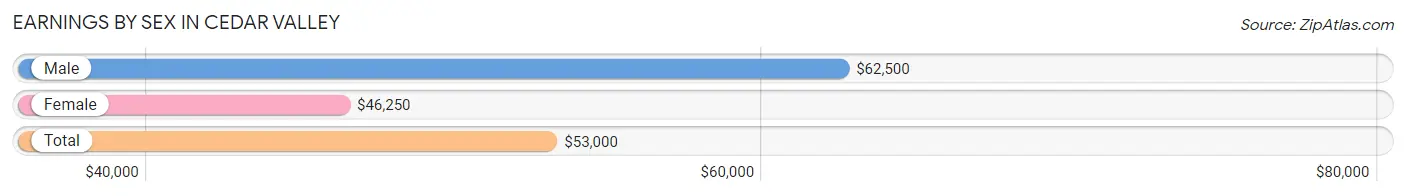
Earnings by Sex in Cedar Valley
Average Earnings in Cedar Valley are $53,000, $62,500 for men and $46,250 for women, a difference of 26.0%.
| Sex | Number | Average Earnings |
| Male | 92 (48.9%) | $62,500 |
| Female | 96 (51.1%) | $46,250 |
| Total | 188 (100.0%) | $53,000 |
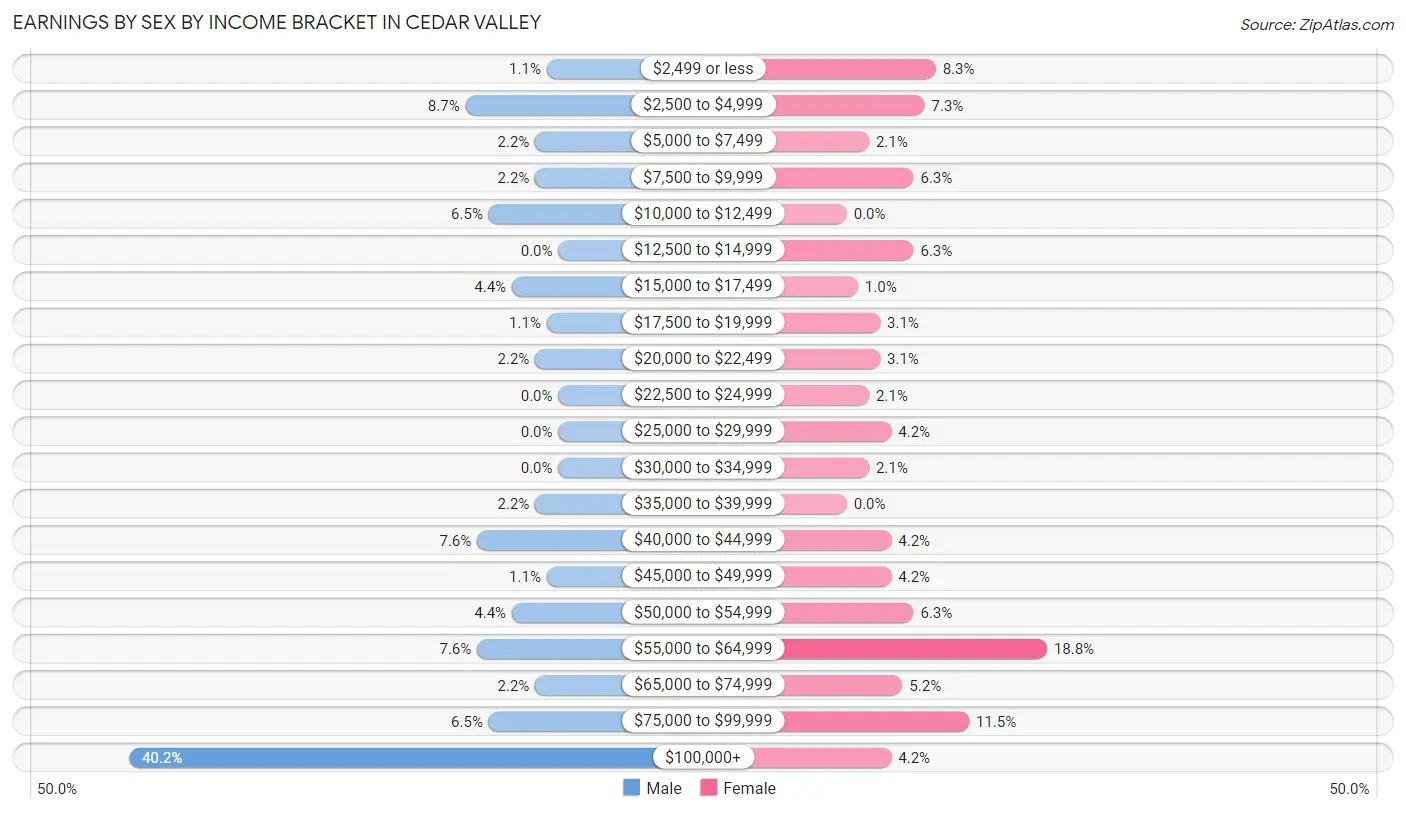
Earnings by Sex by Income Bracket in Cedar Valley
The most common earnings brackets in Cedar Valley are $100,000+ for men (37 | 40.2%) and $55,000 to $64,999 for women (18 | 18.8%).
| Income | Male | Female |
| $2,499 or less | 1 (1.1%) | 8 (8.3%) |
| $2,500 to $4,999 | 8 (8.7%) | 7 (7.3%) |
| $5,000 to $7,499 | 2 (2.2%) | 2 (2.1%) |
| $7,500 to $9,999 | 2 (2.2%) | 6 (6.2%) |
| $10,000 to $12,499 | 6 (6.5%) | 0 (0.0%) |
| $12,500 to $14,999 | 0 (0.0%) | 6 (6.2%) |
| $15,000 to $17,499 | 4 (4.3%) | 1 (1.0%) |
| $17,500 to $19,999 | 1 (1.1%) | 3 (3.1%) |
| $20,000 to $22,499 | 2 (2.2%) | 3 (3.1%) |
| $22,500 to $24,999 | 0 (0.0%) | 2 (2.1%) |
| $25,000 to $29,999 | 0 (0.0%) | 4 (4.2%) |
| $30,000 to $34,999 | 0 (0.0%) | 2 (2.1%) |
| $35,000 to $39,999 | 2 (2.2%) | 0 (0.0%) |
| $40,000 to $44,999 | 7 (7.6%) | 4 (4.2%) |
| $45,000 to $49,999 | 1 (1.1%) | 4 (4.2%) |
| $50,000 to $54,999 | 4 (4.3%) | 6 (6.2%) |
| $55,000 to $64,999 | 7 (7.6%) | 18 (18.8%) |
| $65,000 to $74,999 | 2 (2.2%) | 5 (5.2%) |
| $75,000 to $99,999 | 6 (6.5%) | 11 (11.5%) |
| $100,000+ | 37 (40.2%) | 4 (4.2%) |
| Total | 92 (100.0%) | 96 (100.0%) |
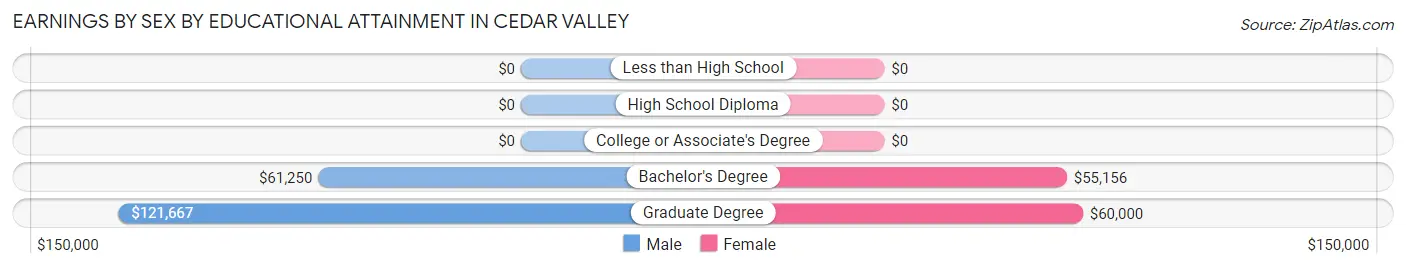
Earnings by Sex by Educational Attainment in Cedar Valley
Average earnings in Cedar Valley are $69,375 for men and $49,375 for women, a difference of 28.8%. Men with an educational attainment of graduate degree enjoy the highest average annual earnings of $121,667, while those with bachelor's degree education earn the least with $61,250. Women with an educational attainment of graduate degree earn the most with the average annual earnings of $60,000, while those with bachelor's degree education have the smallest earnings of $55,156.
| Educational Attainment | Male Income | Female Income |
| Less than High School | - | - |
| High School Diploma | - | - |
| College or Associate's Degree | - | - |
| Bachelor's Degree | $61,250 | $55,156 |
| Graduate Degree | $121,667 | $60,000 |
| Total | $69,375 | $49,375 |
Family Income in Cedar Valley
Family Income Brackets in Cedar Valley
According to the Cedar Valley family income data, there are 56 families falling into the $100,000 to $149,999 income range, which is the most common income bracket and makes up 32.8% of all families.
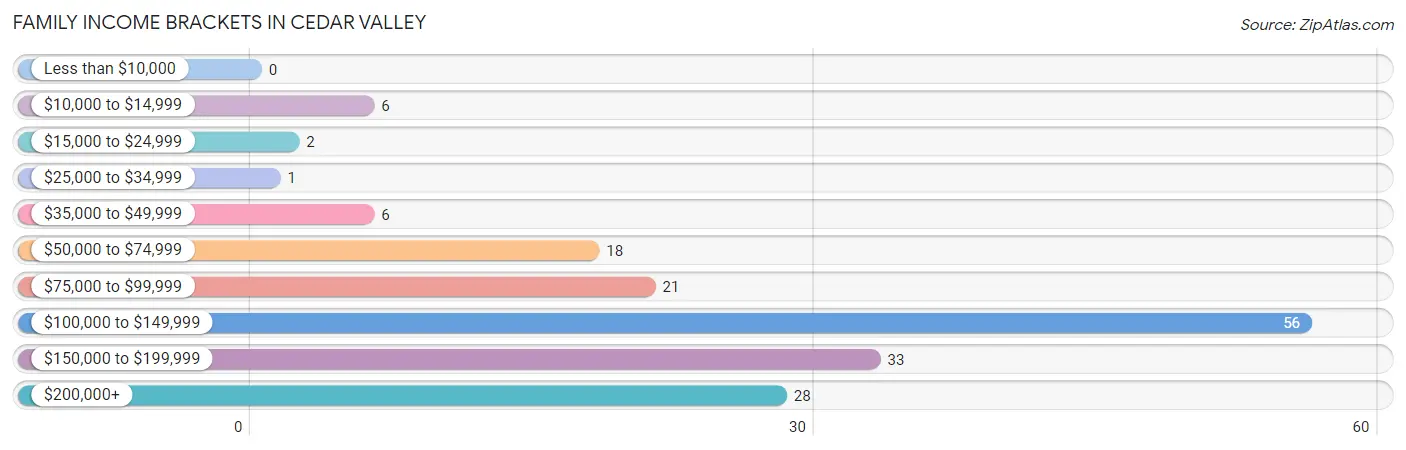
| Income Bracket | # Families | % Families |
| Less than $10,000 | 0 | 0.0% |
| $10,000 to $14,999 | 6 | 3.5% |
| $15,000 to $24,999 | 2 | 1.2% |
| $25,000 to $34,999 | 1 | 0.6% |
| $35,000 to $49,999 | 6 | 3.5% |
| $50,000 to $74,999 | 18 | 10.5% |
| $75,000 to $99,999 | 21 | 12.3% |
| $100,000 to $149,999 | 56 | 32.7% |
| $150,000 to $199,999 | 33 | 19.3% |
| $200,000+ | 28 | 16.4% |
Family Income by Famaliy Size in Cedar Valley
3-person families (22 | 12.9%) account for the highest median family income in Cedar Valley with $193,750 per family, while 3-person families (22 | 12.9%) have the highest median income of $64,583 per family member.
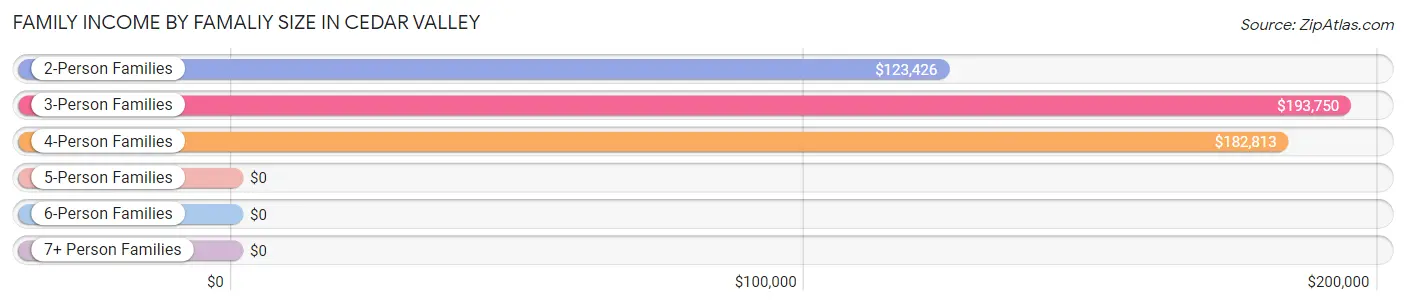
| Income Bracket | # Families | Median Income |
| 2-Person Families | 126 (73.7%) | $123,426 |
| 3-Person Families | 22 (12.9%) | $193,750 |
| 4-Person Families | 15 (8.8%) | $182,813 |
| 5-Person Families | 7 (4.1%) | $0 |
| 6-Person Families | 1 (0.6%) | $0 |
| 7+ Person Families | 0 (0.0%) | $0 |
| Total | 171 (100.0%) | $124,213 |
Family Income by Number of Earners in Cedar Valley
The median family income in Cedar Valley is $124,213, with families comprising 3+ earners (9) having the highest median family income of $206,875, while families with 1 earner (30) have the lowest median family income of $102,500, accounting for 5.3% and 17.5% of families, respectively.
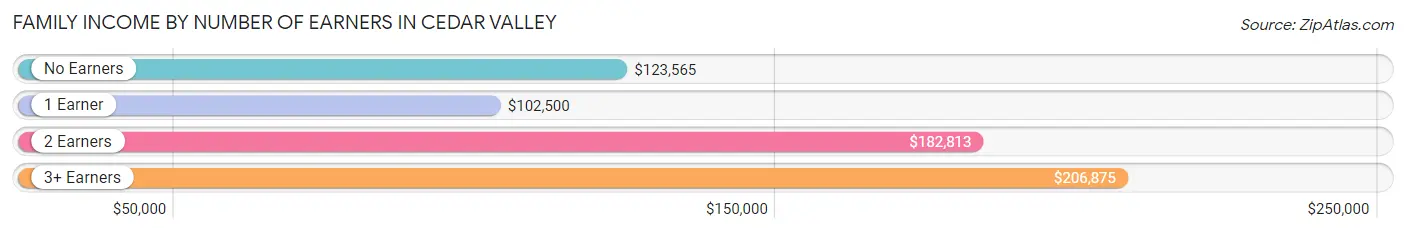
| Number of Earners | # Families | Median Income |
| No Earners | 83 (48.5%) | $123,565 |
| 1 Earner | 30 (17.5%) | $102,500 |
| 2 Earners | 49 (28.6%) | $182,813 |
| 3+ Earners | 9 (5.3%) | $206,875 |
| Total | 171 (100.0%) | $124,213 |
Household Income in Cedar Valley
Household Income Brackets in Cedar Valley
With 58 households falling in the category, the $100,000 to $149,999 income range is the most frequent in Cedar Valley, accounting for 30.4% of all households. In contrast, only 2 households (1.1%) fall into the less than $10,000 income bracket, making it the least populous group.
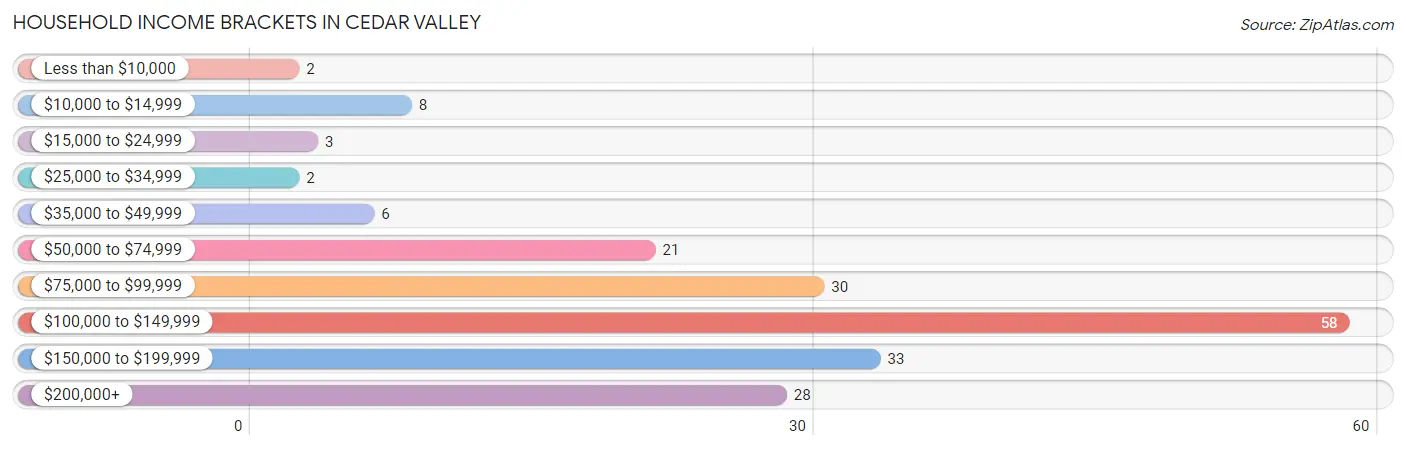
| Income Bracket | # Households | % Households |
| Less than $10,000 | 2 | 1.0% |
| $10,000 to $14,999 | 8 | 4.2% |
| $15,000 to $24,999 | 3 | 1.6% |
| $25,000 to $34,999 | 2 | 1.0% |
| $35,000 to $49,999 | 6 | 3.1% |
| $50,000 to $74,999 | 21 | 11.0% |
| $75,000 to $99,999 | 30 | 15.7% |
| $100,000 to $149,999 | 58 | 30.4% |
| $150,000 to $199,999 | 33 | 17.3% |
| $200,000+ | 28 | 14.7% |
Household Income by Householder Age in Cedar Valley
The median household income in Cedar Valley is $123,287, with the highest median household income of $153,750 found in the 45 to 64 years age bracket for the primary householder. A total of 56 households (29.3%) fall into this category.
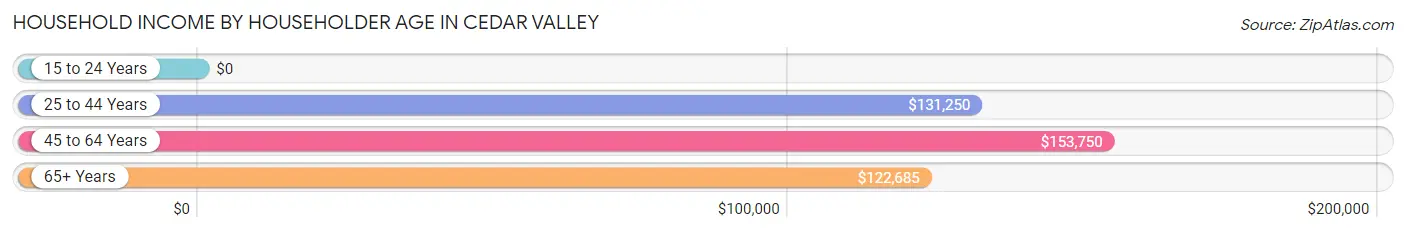
| Income Bracket | # Households | Median Income |
| 15 to 24 Years | 0 (0.0%) | $0 |
| 25 to 44 Years | 19 (10.0%) | $131,250 |
| 45 to 64 Years | 56 (29.3%) | $153,750 |
| 65+ Years | 116 (60.7%) | $122,685 |
| Total | 191 (100.0%) | $123,287 |
Poverty in Cedar Valley
Income Below Poverty by Sex and Age in Cedar Valley
With 2.7% poverty level for males and 4.4% for females among the residents of Cedar Valley, 18 to 24 year old males and 16 and 17 year old females are the most vulnerable to poverty, with 3 males (12.5%) and 1 females (16.7%) in their respective age groups living below the poverty level.
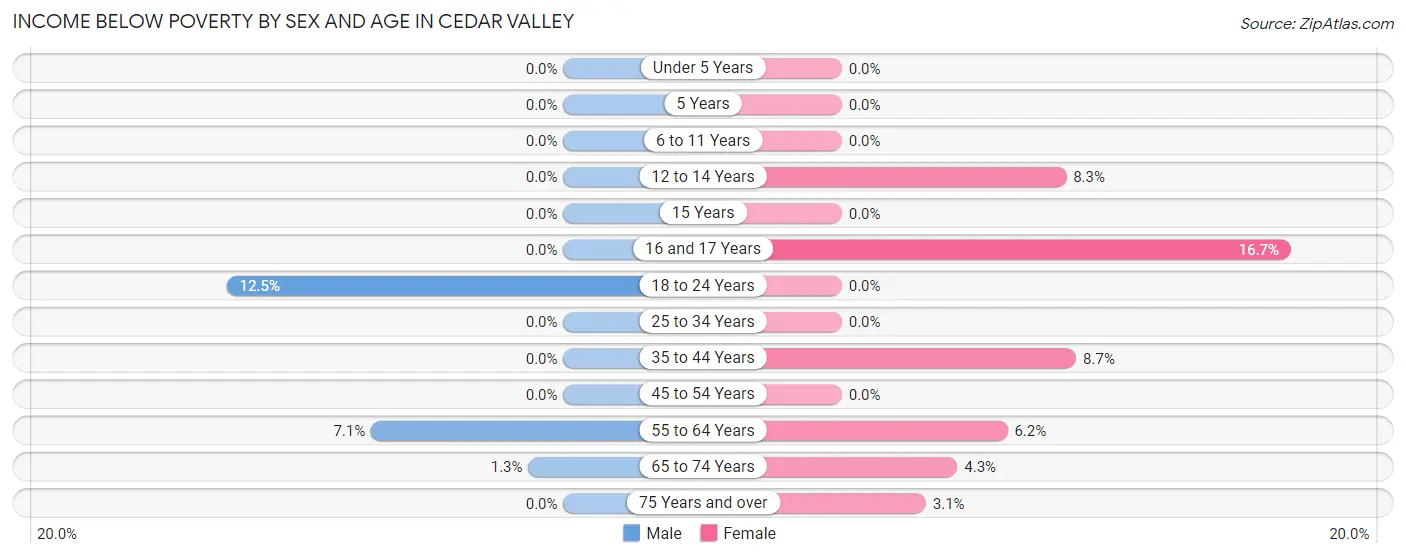
| Age Bracket | Male | Female |
| Under 5 Years | 0 (0.0%) | 0 (0.0%) |
| 5 Years | 0 (0.0%) | 0 (0.0%) |
| 6 to 11 Years | 0 (0.0%) | 0 (0.0%) |
| 12 to 14 Years | 0 (0.0%) | 1 (8.3%) |
| 15 Years | 0 (0.0%) | 0 (0.0%) |
| 16 and 17 Years | 0 (0.0%) | 1 (16.7%) |
| 18 to 24 Years | 3 (12.5%) | 0 (0.0%) |
| 25 to 34 Years | 0 (0.0%) | 0 (0.0%) |
| 35 to 44 Years | 0 (0.0%) | 2 (8.7%) |
| 45 to 54 Years | 0 (0.0%) | 0 (0.0%) |
| 55 to 64 Years | 2 (7.1%) | 4 (6.1%) |
| 65 to 74 Years | 1 (1.3%) | 3 (4.3%) |
| 75 Years and over | 0 (0.0%) | 1 (3.1%) |
| Total | 6 (2.7%) | 12 (4.4%) |
Income Above Poverty by Sex and Age in Cedar Valley
According to the poverty statistics in Cedar Valley, males aged under 5 years and females aged under 5 years are the age groups that are most secure financially, with 100.0% of males and 100.0% of females in these age groups living above the poverty line.
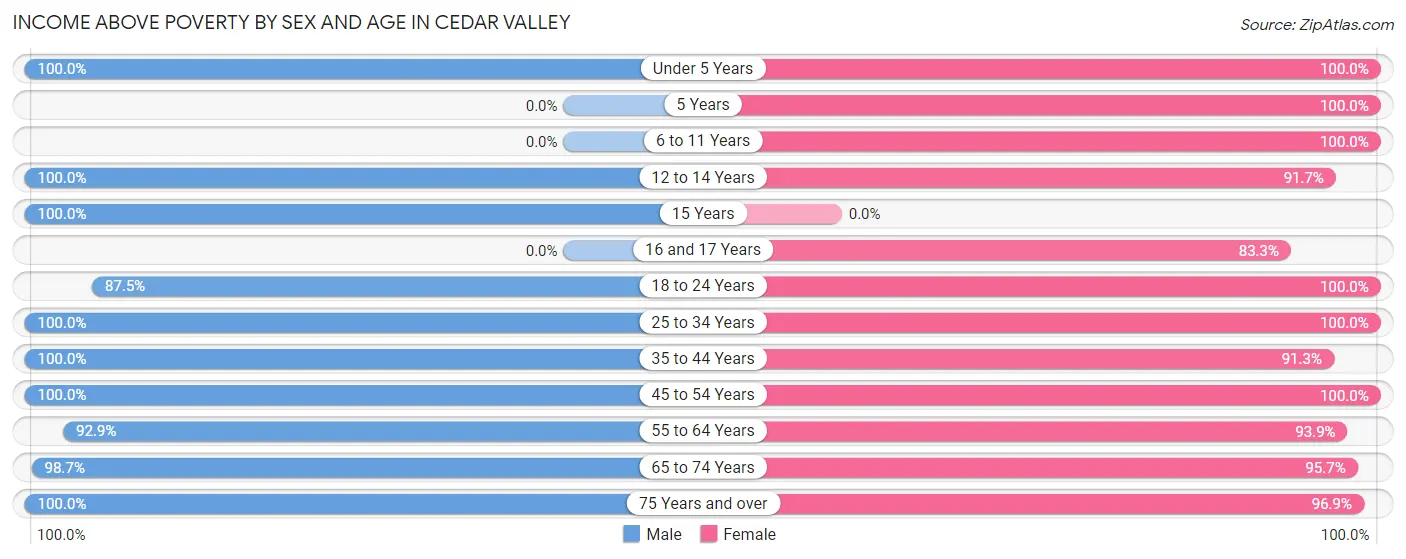
| Age Bracket | Male | Female |
| Under 5 Years | 8 (100.0%) | 6 (100.0%) |
| 5 Years | 0 (0.0%) | 4 (100.0%) |
| 6 to 11 Years | 0 (0.0%) | 14 (100.0%) |
| 12 to 14 Years | 3 (100.0%) | 11 (91.7%) |
| 15 Years | 2 (100.0%) | 0 (0.0%) |
| 16 and 17 Years | 0 (0.0%) | 5 (83.3%) |
| 18 to 24 Years | 21 (87.5%) | 12 (100.0%) |
| 25 to 34 Years | 14 (100.0%) | 13 (100.0%) |
| 35 to 44 Years | 21 (100.0%) | 21 (91.3%) |
| 45 to 54 Years | 23 (100.0%) | 18 (100.0%) |
| 55 to 64 Years | 26 (92.9%) | 61 (93.9%) |
| 65 to 74 Years | 76 (98.7%) | 67 (95.7%) |
| 75 Years and over | 25 (100.0%) | 31 (96.9%) |
| Total | 219 (97.3%) | 263 (95.6%) |
Income Below Poverty Among Married-Couple Families in Cedar Valley
The poverty statistics for married-couple families in Cedar Valley show that 1.9% or 3 of the total 159 families live below the poverty line. Families with no children have the highest poverty rate of 2.2%, comprising of 3 families. On the other hand, families with 1 or 2 children have the lowest poverty rate of 0.0%, which includes 0 families.
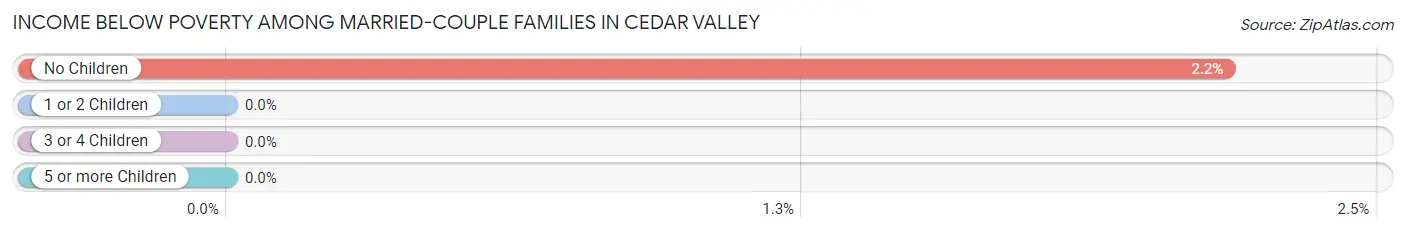
| Children | Above Poverty | Below Poverty |
| No Children | 135 (97.8%) | 3 (2.2%) |
| 1 or 2 Children | 18 (100.0%) | 0 (0.0%) |
| 3 or 4 Children | 3 (100.0%) | 0 (0.0%) |
| 5 or more Children | 0 (0.0%) | 0 (0.0%) |
| Total | 156 (98.1%) | 3 (1.9%) |
Income Below Poverty Among Single-Parent Households in Cedar Valley
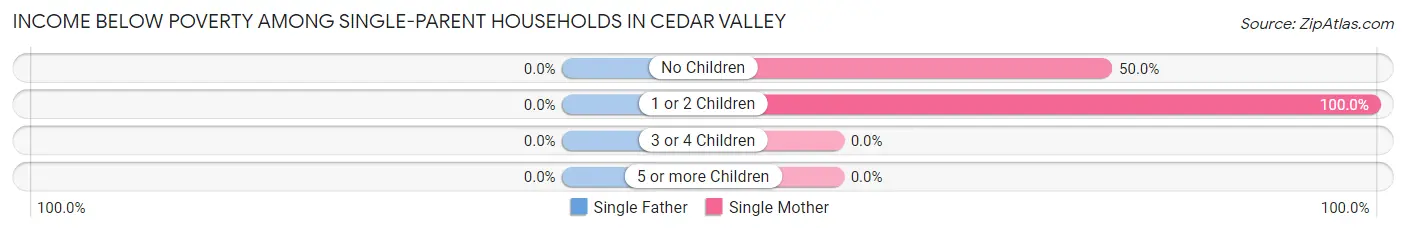
| Children | Single Father | Single Mother |
| No Children | 0 (0.0%) | 2 (50.0%) |
| 1 or 2 Children | 0 (0.0%) | 3 (100.0%) |
| 3 or 4 Children | 0 (0.0%) | 0 (0.0%) |
| 5 or more Children | 0 (0.0%) | 0 (0.0%) |
| Total | 0 (0.0%) | 5 (71.4%) |
Income Below Poverty Among Married-Couple vs Single-Parent Households in Cedar Valley
The poverty data for Cedar Valley shows that 3 of the married-couple family households (1.9%) and 5 of the single-parent households (41.7%) are living below the poverty level. Within the married-couple family households, those with no children have the highest poverty rate, with 3 households (2.2%) falling below the poverty line. Among the single-parent households, those with 1 or 2 children have the highest poverty rate, with 3 household (50.0%) living below poverty.
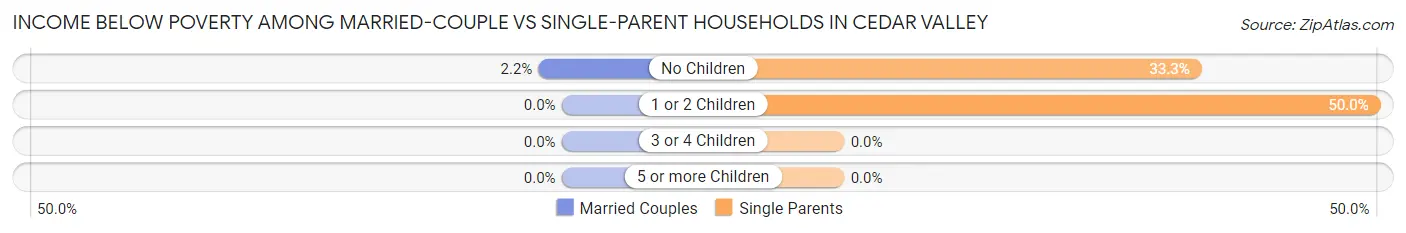
| Children | Married-Couple Families | Single-Parent Households |
| No Children | 3 (2.2%) | 2 (33.3%) |
| 1 or 2 Children | 0 (0.0%) | 3 (50.0%) |
| 3 or 4 Children | 0 (0.0%) | 0 (0.0%) |
| 5 or more Children | 0 (0.0%) | 0 (0.0%) |
| Total | 3 (1.9%) | 5 (41.7%) |
Race in Cedar Valley
The most populous races in Cedar Valley are White / Caucasian (418 | 83.6%), Two or more Races (56 | 11.2%), and Hispanic or Latino (17 | 3.4%).
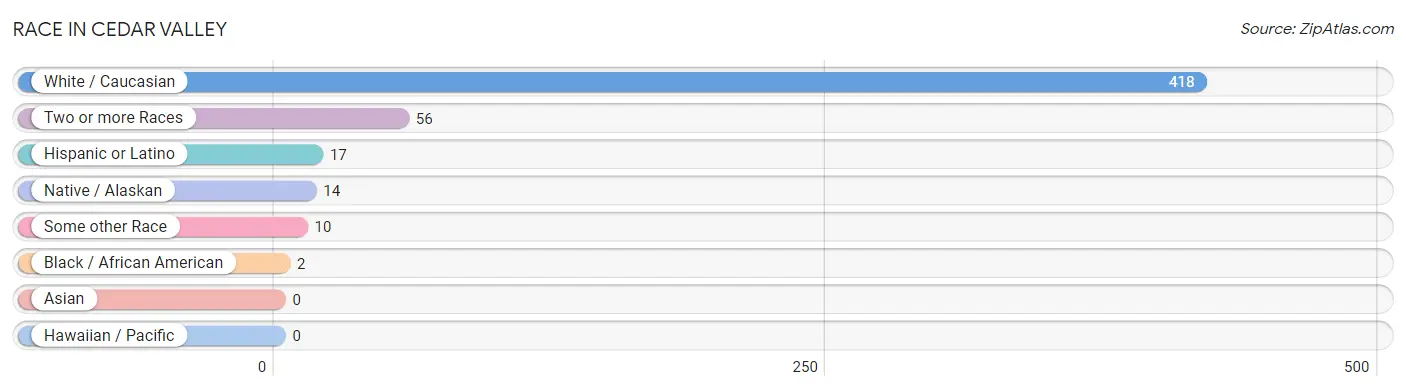
| Race | # Population | % Population |
| Asian | 0 | 0.0% |
| Black / African American | 2 | 0.4% |
| Hawaiian / Pacific | 0 | 0.0% |
| Hispanic or Latino | 17 | 3.4% |
| Native / Alaskan | 14 | 2.8% |
| White / Caucasian | 418 | 83.6% |
| Two or more Races | 56 | 11.2% |
| Some other Race | 10 | 2.0% |
| Total | 500 | 100.0% |
Ancestry in Cedar Valley
The most populous ancestries reported in Cedar Valley are English (85 | 17.0%), German (78 | 15.6%), American (49 | 9.8%), French (41 | 8.2%), and Scottish (34 | 6.8%), together accounting for 57.4% of all Cedar Valley residents.
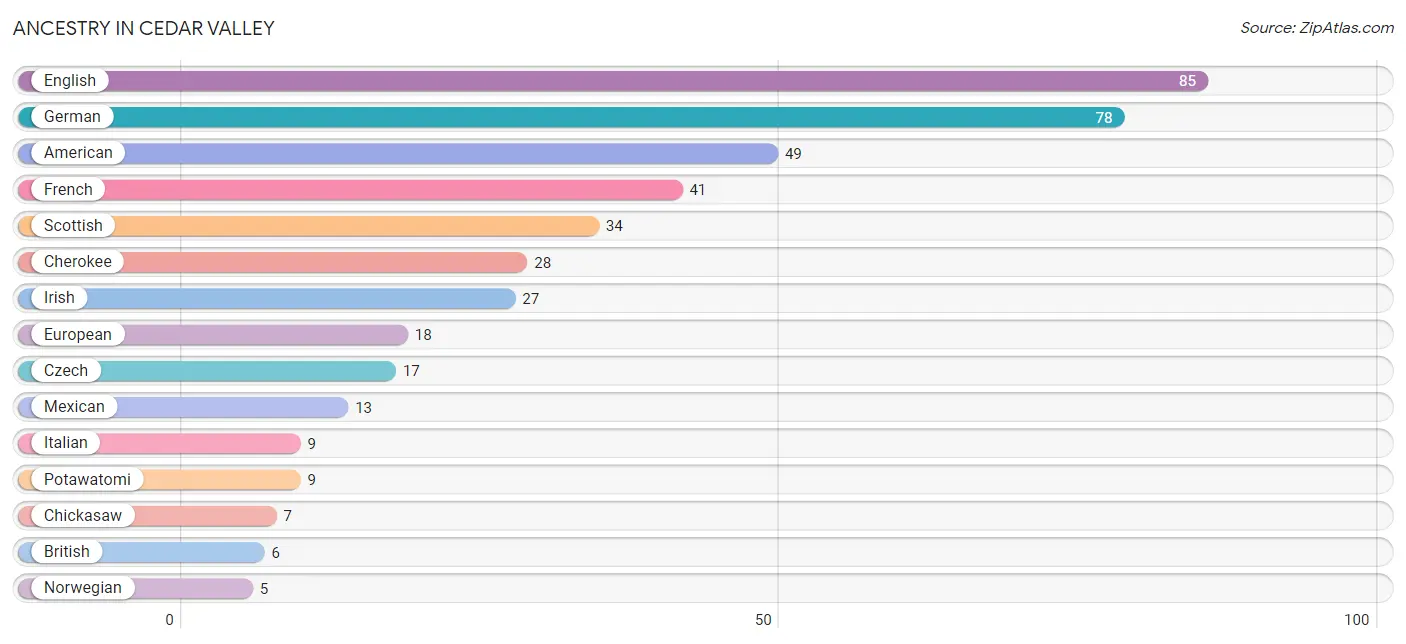
| Ancestry | # Population | % Population |
| American | 49 | 9.8% |
| Arab | 1 | 0.2% |
| Austrian | 4 | 0.8% |
| British | 6 | 1.2% |
| Central American | 4 | 0.8% |
| Cherokee | 28 | 5.6% |
| Chickasaw | 7 | 1.4% |
| Choctaw | 1 | 0.2% |
| Croatian | 2 | 0.4% |
| Czech | 17 | 3.4% |
| Danish | 4 | 0.8% |
| Dutch | 3 | 0.6% |
| English | 85 | 17.0% |
| European | 18 | 3.6% |
| French | 41 | 8.2% |
| German | 78 | 15.6% |
| Irish | 27 | 5.4% |
| Italian | 9 | 1.8% |
| Kiowa | 3 | 0.6% |
| Lebanese | 1 | 0.2% |
| Luxembourger | 1 | 0.2% |
| Mexican | 13 | 2.6% |
| Nicaraguan | 4 | 0.8% |
| Northern European | 2 | 0.4% |
| Norwegian | 5 | 1.0% |
| Polish | 5 | 1.0% |
| Potawatomi | 9 | 1.8% |
| Scandinavian | 4 | 0.8% |
| Scottish | 34 | 6.8% |
| Slovak | 1 | 0.2% |
| Swedish | 4 | 0.8% |
| Swiss | 1 | 0.2% |
| Ukrainian | 1 | 0.2% | View All 33 Rows |
Immigrants in Cedar Valley
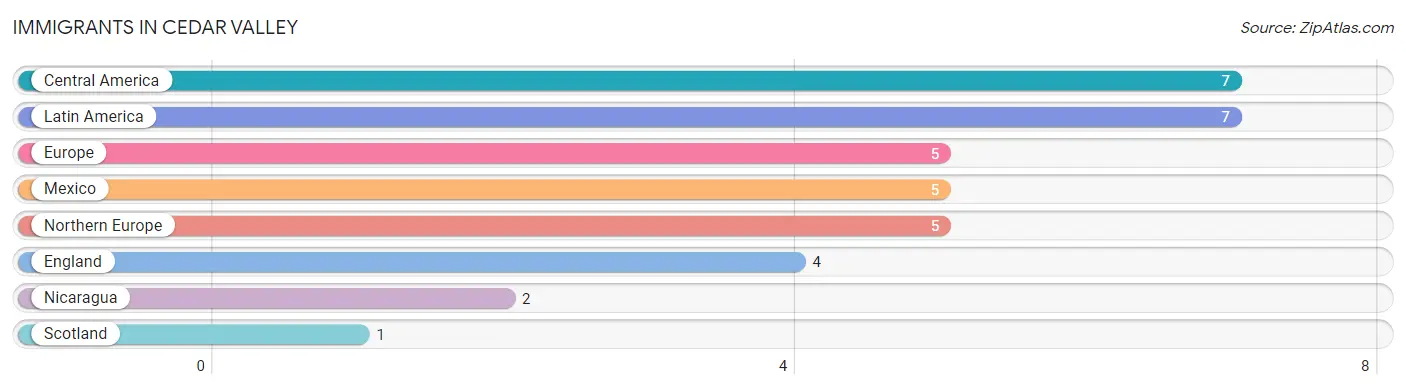
The most numerous immigrant groups reported in Cedar Valley came from Central America (7 | 1.4%), Latin America (7 | 1.4%), Europe (5 | 1.0%), Mexico (5 | 1.0%), and Northern Europe (5 | 1.0%), together accounting for 5.8% of all Cedar Valley residents.
| Immigration Origin | # Population | % Population |
| Central America | 7 | 1.4% |
| England | 4 | 0.8% |
| Europe | 5 | 1.0% |
| Latin America | 7 | 1.4% |
| Mexico | 5 | 1.0% |
| Nicaragua | 2 | 0.4% |
| Northern Europe | 5 | 1.0% |
| Scotland | 1 | 0.2% | View All 8 Rows |
Sex and Age in Cedar Valley
Sex and Age in Cedar Valley
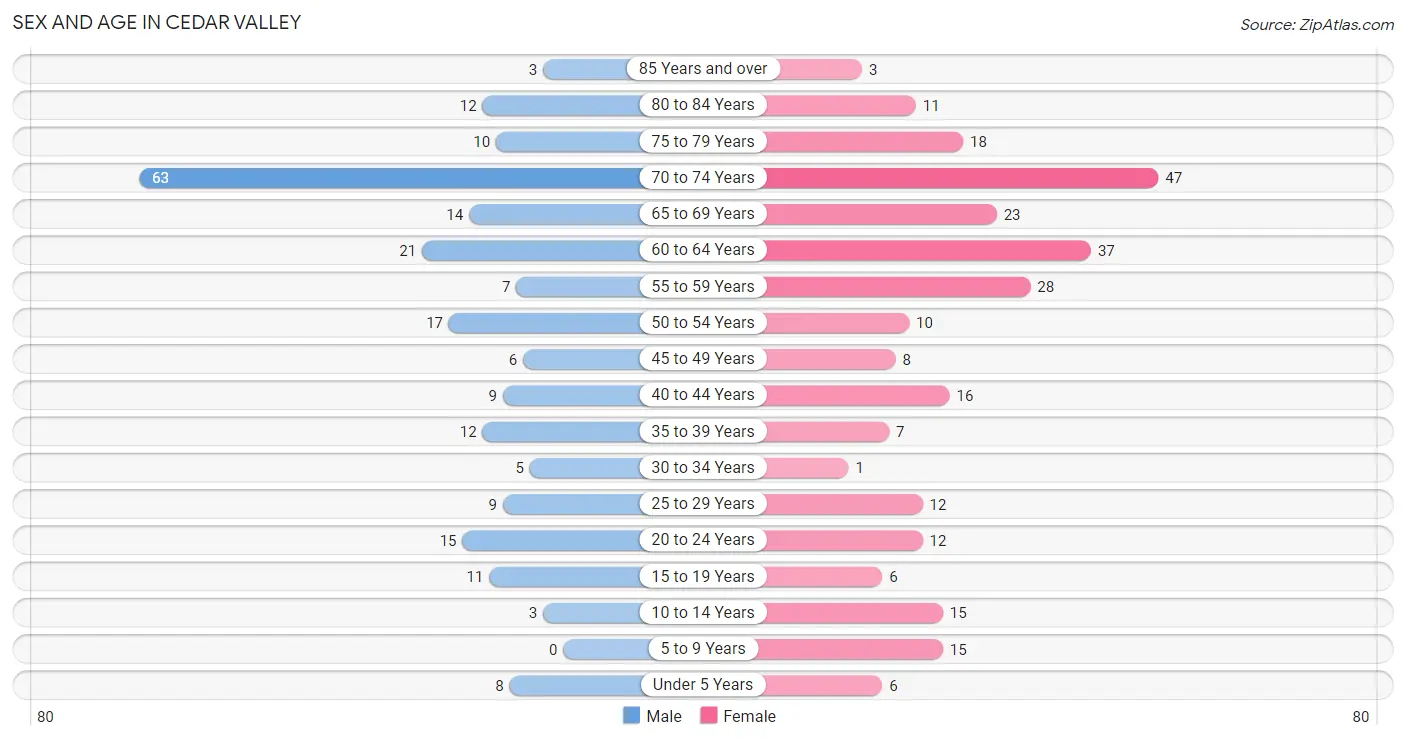
The most populous age groups in Cedar Valley are 70 to 74 Years (63 | 28.0%) for men and 70 to 74 Years (47 | 17.1%) for women.
| Age Bracket | Male | Female |
| Under 5 Years | 8 (3.6%) | 6 (2.2%) |
| 5 to 9 Years | 0 (0.0%) | 15 (5.4%) |
| 10 to 14 Years | 3 (1.3%) | 15 (5.4%) |
| 15 to 19 Years | 11 (4.9%) | 6 (2.2%) |
| 20 to 24 Years | 15 (6.7%) | 12 (4.4%) |
| 25 to 29 Years | 9 (4.0%) | 12 (4.4%) |
| 30 to 34 Years | 5 (2.2%) | 1 (0.4%) |
| 35 to 39 Years | 12 (5.3%) | 7 (2.5%) |
| 40 to 44 Years | 9 (4.0%) | 16 (5.8%) |
| 45 to 49 Years | 6 (2.7%) | 8 (2.9%) |
| 50 to 54 Years | 17 (7.6%) | 10 (3.6%) |
| 55 to 59 Years | 7 (3.1%) | 28 (10.2%) |
| 60 to 64 Years | 21 (9.3%) | 37 (13.5%) |
| 65 to 69 Years | 14 (6.2%) | 23 (8.4%) |
| 70 to 74 Years | 63 (28.0%) | 47 (17.1%) |
| 75 to 79 Years | 10 (4.4%) | 18 (6.6%) |
| 80 to 84 Years | 12 (5.3%) | 11 (4.0%) |
| 85 Years and over | 3 (1.3%) | 3 (1.1%) |
| Total | 225 (100.0%) | 275 (100.0%) |
Families and Households in Cedar Valley
Median Family Size in Cedar Valley
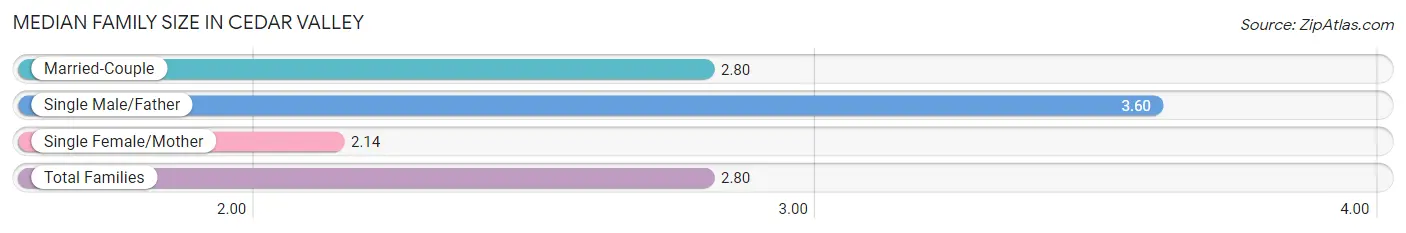
The median family size in Cedar Valley is 2.80 persons per family, with single male/father families (5 | 2.9%) accounting for the largest median family size of 3.6 persons per family. On the other hand, single female/mother families (7 | 4.1%) represent the smallest median family size with 2.14 persons per family.
| Family Type | # Families | Family Size |
| Married-Couple | 159 (93.0%) | 2.80 |
| Single Male/Father | 5 (2.9%) | 3.60 |
| Single Female/Mother | 7 (4.1%) | 2.14 |
| Total Families | 171 (100.0%) | 2.80 |
Median Household Size in Cedar Valley
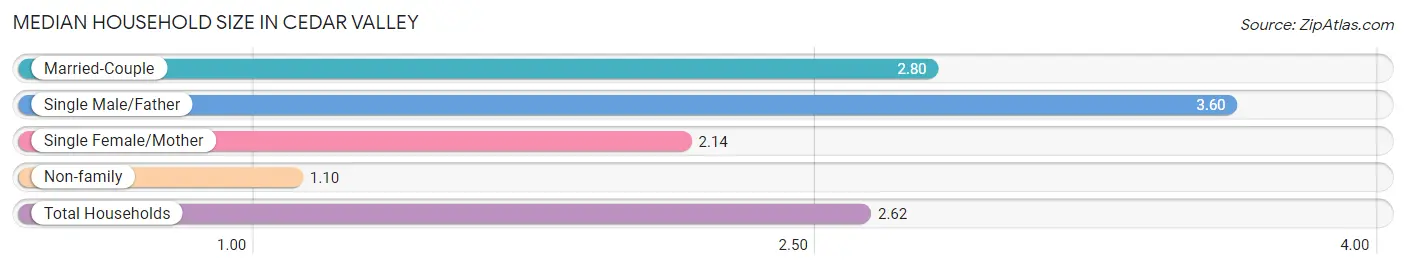
The median household size in Cedar Valley is 2.62 persons per household, with single male/father households (5 | 2.6%) accounting for the largest median household size of 3.6 persons per household. non-family households (20 | 10.5%) represent the smallest median household size with 1.10 persons per household.
| Household Type | # Households | Household Size |
| Married-Couple | 159 (83.3%) | 2.80 |
| Single Male/Father | 5 (2.6%) | 3.60 |
| Single Female/Mother | 7 (3.7%) | 2.14 |
| Non-family | 20 (10.5%) | 1.10 |
| Total Households | 191 (100.0%) | 2.62 |
Household Size by Marriage Status in Cedar Valley
Out of a total of 191 households in Cedar Valley, 171 (89.5%) are family households, while 20 (10.5%) are nonfamily households. The most numerous type of family households are 2-person households, comprising 126, and the most common type of nonfamily households are 1-person households, comprising 19.
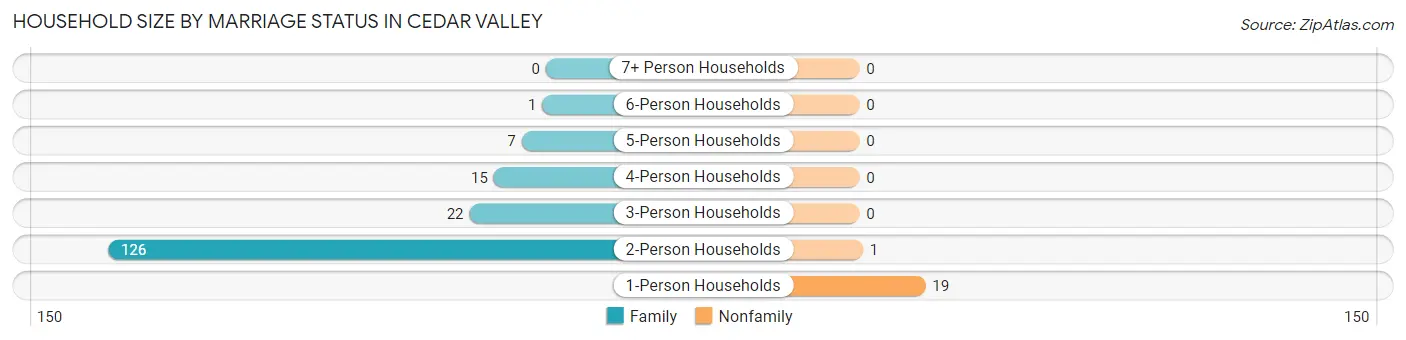
| Household Size | Family Households | Nonfamily Households |
| 1-Person Households | - | 19 (10.0%) |
| 2-Person Households | 126 (66.0%) | 1 (0.5%) |
| 3-Person Households | 22 (11.5%) | 0 (0.0%) |
| 4-Person Households | 15 (7.9%) | 0 (0.0%) |
| 5-Person Households | 7 (3.7%) | 0 (0.0%) |
| 6-Person Households | 1 (0.5%) | 0 (0.0%) |
| 7+ Person Households | 0 (0.0%) | 0 (0.0%) |
| Total | 171 (89.5%) | 20 (10.5%) |
Female Fertility in Cedar Valley
Fertility by Age in Cedar Valley
Average fertility rate in Cedar Valley is 30.0 births per 1,000 women. Women in the age bracket of 20 to 34 years have the highest fertility rate with 80.0 births per 1,000 women. Women in the age bracket of 20 to 34 years acount for 100.0% of all women with births.
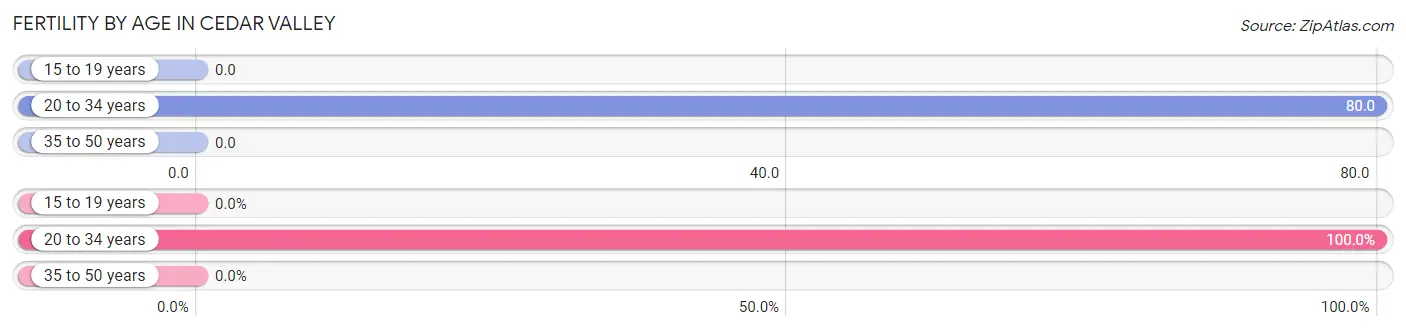
| Age Bracket | Women with Births | Births / 1,000 Women |
| 15 to 19 years | 0 (0.0%) | 0.0 |
| 20 to 34 years | 2 (100.0%) | 80.0 |
| 35 to 50 years | 0 (0.0%) | 0.0 |
| Total | 2 (100.0%) | 30.0 |
Fertility by Age by Marriage Status in Cedar Valley
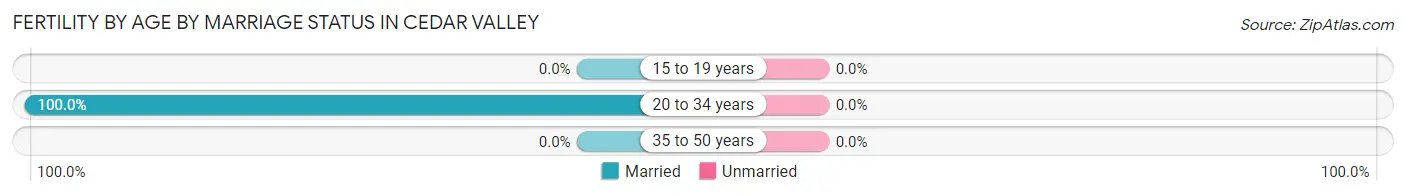
| Age Bracket | Married | Unmarried |
| 15 to 19 years | 0 (0.0%) | 0 (0.0%) |
| 20 to 34 years | 2 (100.0%) | 0 (0.0%) |
| 35 to 50 years | 0 (0.0%) | 0 (0.0%) |
| Total | 2 (100.0%) | 0 (0.0%) |
Fertility by Education in Cedar Valley
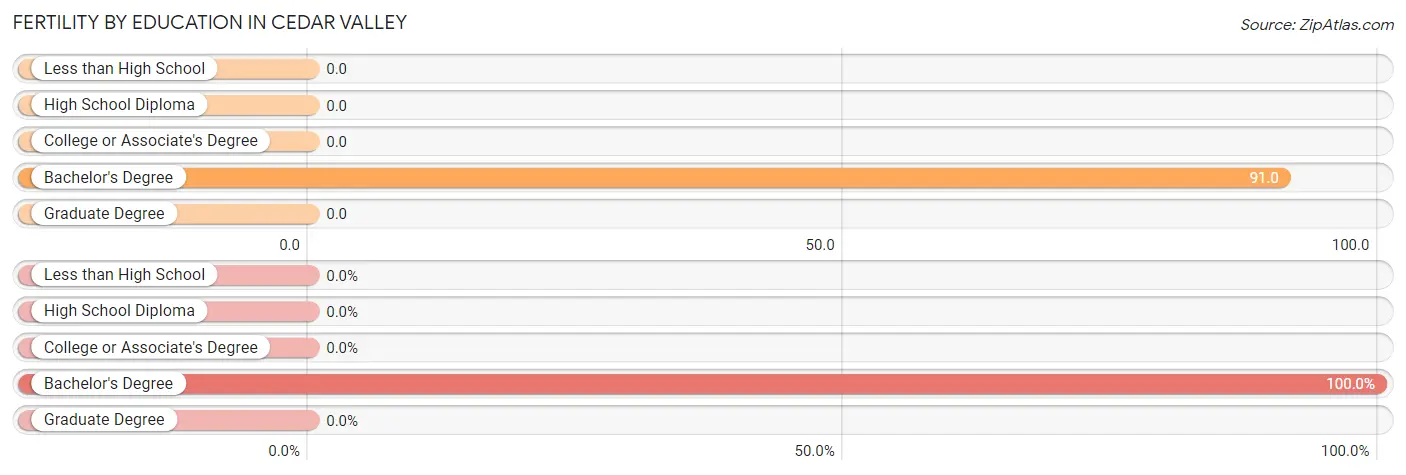
| Educational Attainment | Women with Births | Births / 1,000 Women |
| Less than High School | 0 (0.0%) | 0.0 |
| High School Diploma | 0 (0.0%) | 0.0 |
| College or Associate's Degree | 0 (0.0%) | 0.0 |
| Bachelor's Degree | 2 (100.0%) | 91.0 |
| Graduate Degree | 0 (0.0%) | 0.0 |
| Total | 2 (100.0%) | 30.0 |
Fertility by Education by Marriage Status in Cedar Valley
| Educational Attainment | Married | Unmarried |
| Less than High School | 0 (0.0%) | 0 (0.0%) |
| High School Diploma | 0 (0.0%) | 0 (0.0%) |
| College or Associate's Degree | 0 (0.0%) | 0 (0.0%) |
| Bachelor's Degree | 2 (100.0%) | 0 (0.0%) |
| Graduate Degree | 0 (0.0%) | 0 (0.0%) |
| Total | 2 (100.0%) | 0 (0.0%) |
Employment Characteristics in Cedar Valley
Employment by Class of Employer in Cedar Valley
Among the 177 employed individuals in Cedar Valley, private company employees (113 | 63.8%), local government employees (26 | 14.7%), and state government employees (10 | 5.7%) make up the most common classes of employment.
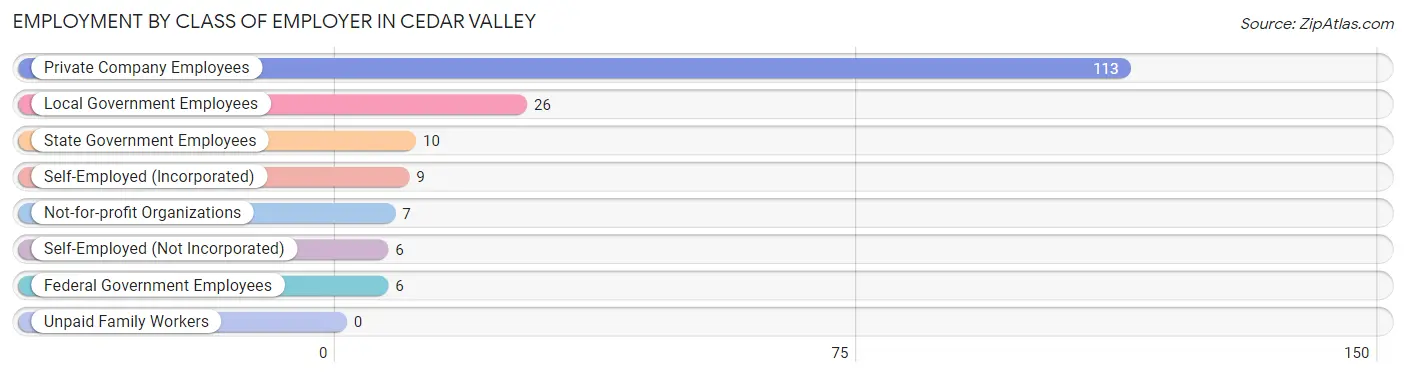
| Employer Class | # Employees | % Employees |
| Private Company Employees | 113 | 63.8% |
| Self-Employed (Incorporated) | 9 | 5.1% |
| Self-Employed (Not Incorporated) | 6 | 3.4% |
| Not-for-profit Organizations | 7 | 4.0% |
| Local Government Employees | 26 | 14.7% |
| State Government Employees | 10 | 5.7% |
| Federal Government Employees | 6 | 3.4% |
| Unpaid Family Workers | 0 | 0.0% |
| Total | 177 | 100.0% |
Employment Status by Age in Cedar Valley
According to the labor force statistics for Cedar Valley, out of the total population over 16 years of age (451), 40.8% or 184 individuals are in the labor force, with 1.6% or 3 of them unemployed. The age group with the highest labor force participation rate is 30 to 34 years, with 100.0% or 6 individuals in the labor force. Within the labor force, the 35 to 44 years age range has the highest percentage of unemployed individuals, with 5.6% or 2 of them being unemployed.
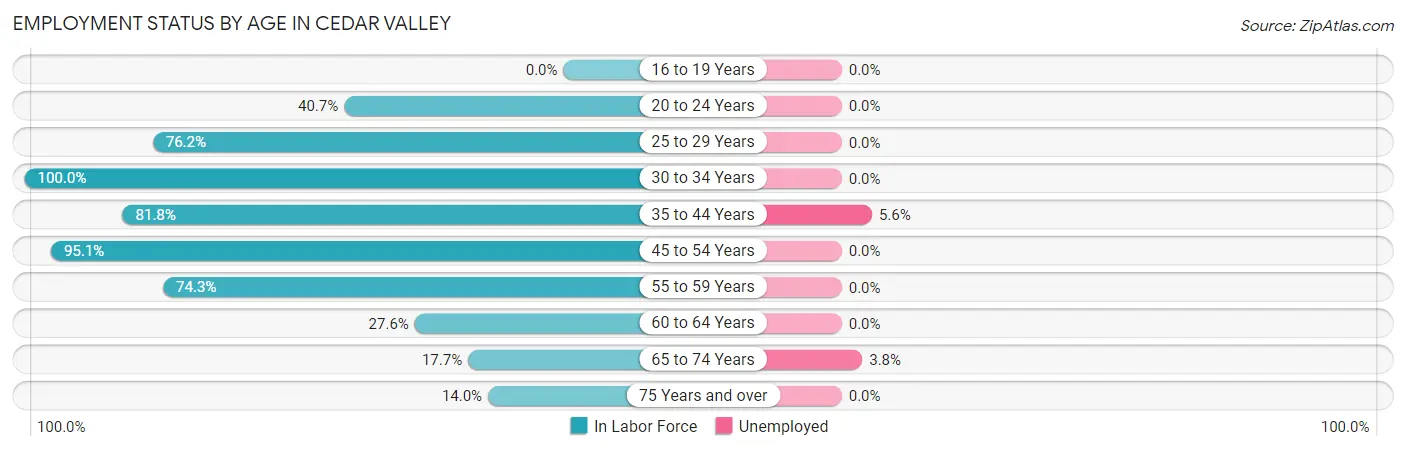
| Age Bracket | In Labor Force | Unemployed |
| 16 to 19 Years | 0 (0.0%) | 0 (0.0%) |
| 20 to 24 Years | 11 (40.7%) | 0 (0.0%) |
| 25 to 29 Years | 16 (76.2%) | 0 (0.0%) |
| 30 to 34 Years | 6 (100.0%) | 0 (0.0%) |
| 35 to 44 Years | 36 (81.8%) | 2 (5.6%) |
| 45 to 54 Years | 39 (95.1%) | 0 (0.0%) |
| 55 to 59 Years | 26 (74.3%) | 0 (0.0%) |
| 60 to 64 Years | 16 (27.6%) | 0 (0.0%) |
| 65 to 74 Years | 26 (17.7%) | 1 (3.8%) |
| 75 Years and over | 8 (14.0%) | 0 (0.0%) |
| Total | 184 (40.8%) | 3 (1.6%) |
Employment Status by Educational Attainment in Cedar Valley
According to labor force statistics for Cedar Valley, 67.8% of individuals (139) out of the total population between 25 and 64 years of age (205) are in the labor force, with 1.4% or 2 of them being unemployed. The group with the highest labor force participation rate are those with the educational attainment of less than high school, with 83.3% or 5 individuals in the labor force. Within the labor force, individuals with high school diploma education have the highest percentage of unemployment, with 7.1% or 2 of them being unemployed.
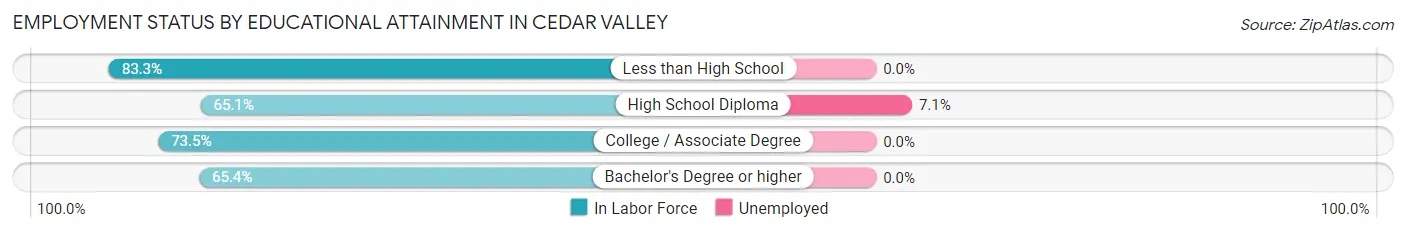
| Educational Attainment | In Labor Force | Unemployed |
| Less than High School | 5 (83.3%) | 0 (0.0%) |
| High School Diploma | 28 (65.1%) | 3 (7.1%) |
| College / Associate Degree | 36 (73.5%) | 0 (0.0%) |
| Bachelor's Degree or higher | 70 (65.4%) | 0 (0.0%) |
| Total | 139 (67.8%) | 3 (1.4%) |
Employment Occupations by Sex in Cedar Valley
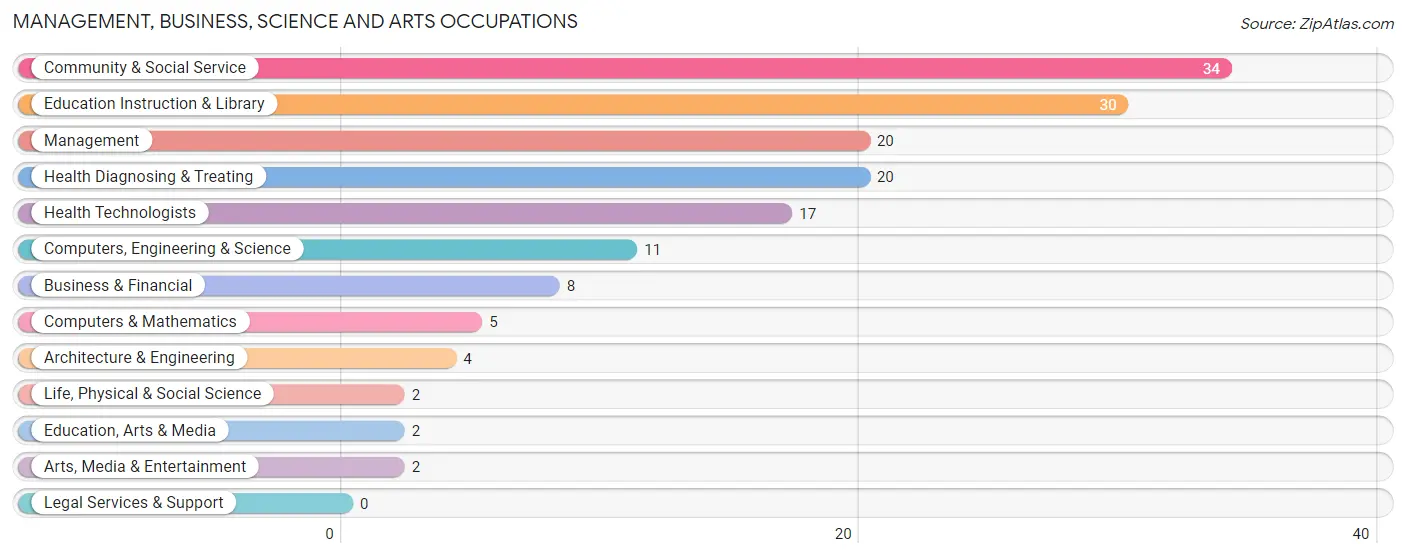
Management, Business, Science and Arts Occupations
The most common Management, Business, Science and Arts occupations in Cedar Valley are Community & Social Service (34 | 18.8%), Education Instruction & Library (30 | 16.6%), Management (20 | 11.1%), Health Diagnosing & Treating (20 | 11.1%), and Health Technologists (17 | 9.4%).
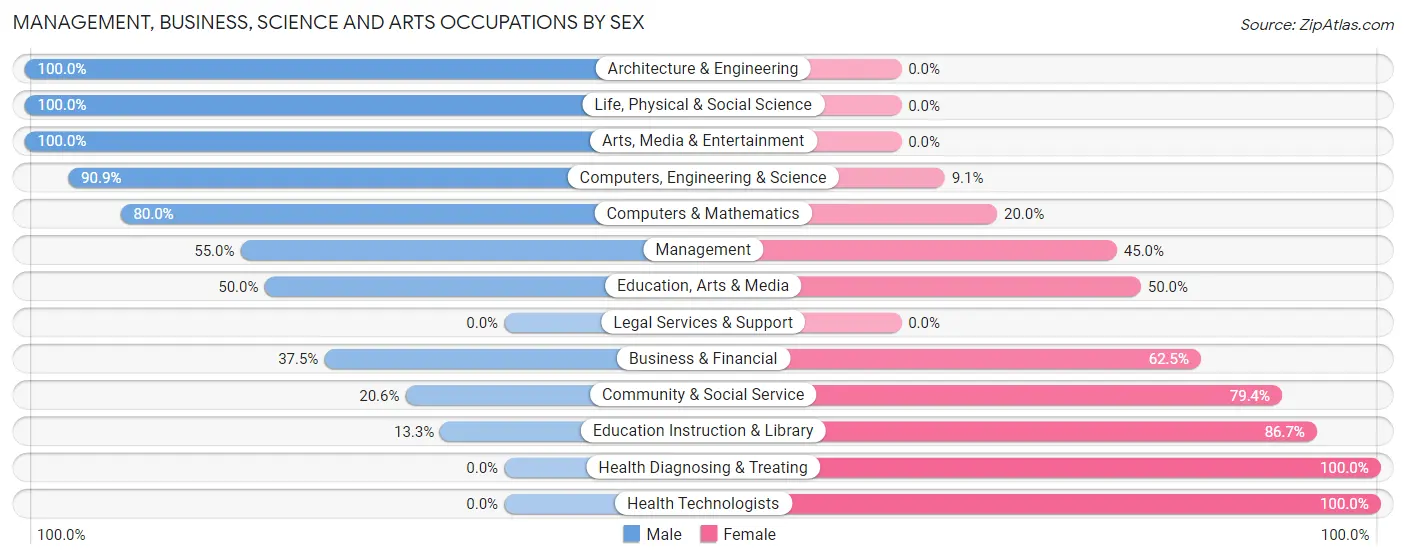
Management, Business, Science and Arts Occupations by Sex
Within the Management, Business, Science and Arts occupations in Cedar Valley, the most male-oriented occupations are Architecture & Engineering (100.0%), Life, Physical & Social Science (100.0%), and Arts, Media & Entertainment (100.0%), while the most female-oriented occupations are Health Diagnosing & Treating (100.0%), Health Technologists (100.0%), and Education Instruction & Library (86.7%).
| Occupation | Male | Female |
| Management | 11 (55.0%) | 9 (45.0%) |
| Business & Financial | 3 (37.5%) | 5 (62.5%) |
| Computers, Engineering & Science | 10 (90.9%) | 1 (9.1%) |
| Computers & Mathematics | 4 (80.0%) | 1 (20.0%) |
| Architecture & Engineering | 4 (100.0%) | 0 (0.0%) |
| Life, Physical & Social Science | 2 (100.0%) | 0 (0.0%) |
| Community & Social Service | 7 (20.6%) | 27 (79.4%) |
| Education, Arts & Media | 1 (50.0%) | 1 (50.0%) |
| Legal Services & Support | 0 (0.0%) | 0 (0.0%) |
| Education Instruction & Library | 4 (13.3%) | 26 (86.7%) |
| Arts, Media & Entertainment | 2 (100.0%) | 0 (0.0%) |
| Health Diagnosing & Treating | 0 (0.0%) | 20 (100.0%) |
| Health Technologists | 0 (0.0%) | 17 (100.0%) |
| Total (Category) | 31 (33.3%) | 62 (66.7%) |
| Total (Overall) | 90 (49.7%) | 91 (50.3%) |
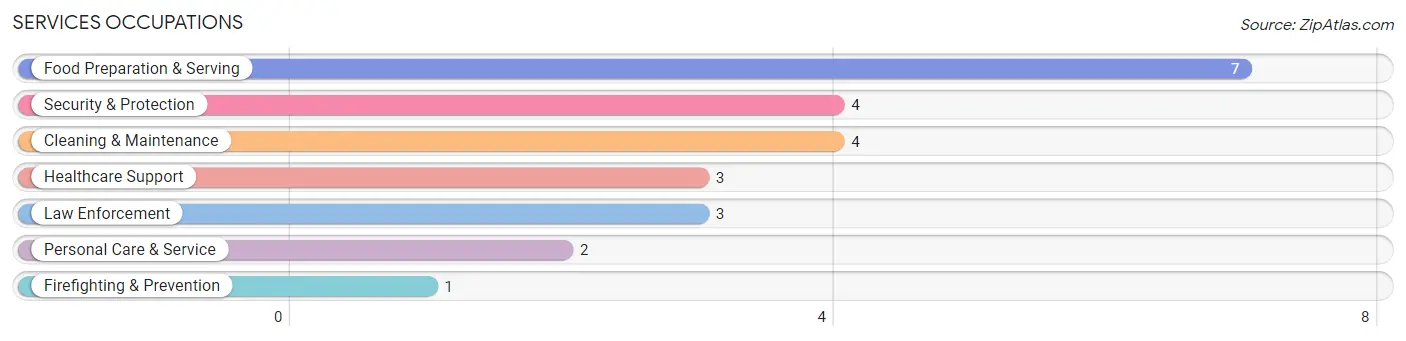
Services Occupations
The most common Services occupations in Cedar Valley are Food Preparation & Serving (7 | 3.9%), Security & Protection (4 | 2.2%), Cleaning & Maintenance (4 | 2.2%), Healthcare Support (3 | 1.7%), and Law Enforcement (3 | 1.7%).
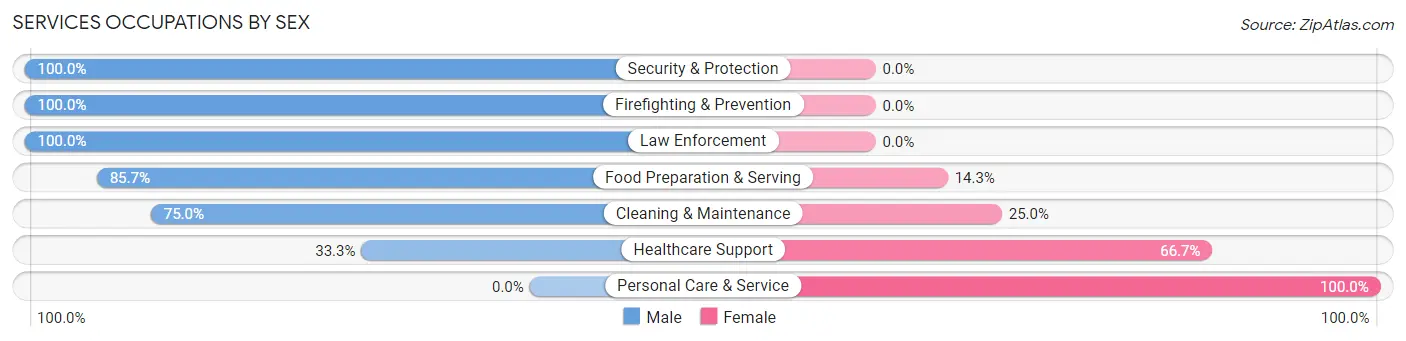
Services Occupations by Sex
Within the Services occupations in Cedar Valley, the most male-oriented occupations are Security & Protection (100.0%), Firefighting & Prevention (100.0%), and Law Enforcement (100.0%), while the most female-oriented occupations are Personal Care & Service (100.0%), Healthcare Support (66.7%), and Cleaning & Maintenance (25.0%).
| Occupation | Male | Female |
| Healthcare Support | 1 (33.3%) | 2 (66.7%) |
| Security & Protection | 4 (100.0%) | 0 (0.0%) |
| Firefighting & Prevention | 1 (100.0%) | 0 (0.0%) |
| Law Enforcement | 3 (100.0%) | 0 (0.0%) |
| Food Preparation & Serving | 6 (85.7%) | 1 (14.3%) |
| Cleaning & Maintenance | 3 (75.0%) | 1 (25.0%) |
| Personal Care & Service | 0 (0.0%) | 2 (100.0%) |
| Total (Category) | 14 (70.0%) | 6 (30.0%) |
| Total (Overall) | 90 (49.7%) | 91 (50.3%) |
Sales and Office Occupations
The most common Sales and Office occupations in Cedar Valley are Sales & Related (20 | 11.1%), and Office & Administration (18 | 9.9%).
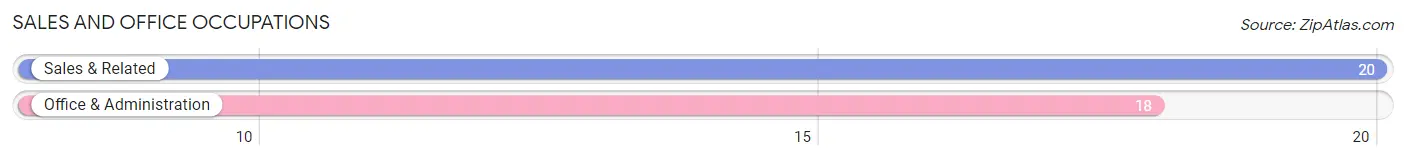
Sales and Office Occupations by Sex

| Occupation | Male | Female |
| Sales & Related | 17 (85.0%) | 3 (15.0%) |
| Office & Administration | 6 (33.3%) | 12 (66.7%) |
| Total (Category) | 23 (60.5%) | 15 (39.5%) |
| Total (Overall) | 90 (49.7%) | 91 (50.3%) |
Natural Resources, Construction and Maintenance Occupations
The most common Natural Resources, Construction and Maintenance occupations in Cedar Valley are Construction & Extraction (8 | 4.4%), and Installation, Maintenance & Repair (6 | 3.3%).
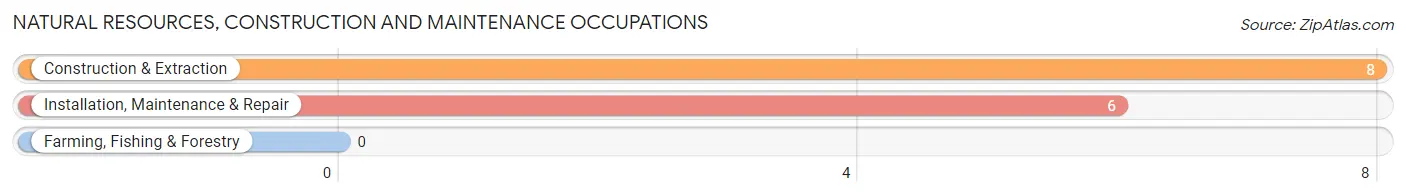
Natural Resources, Construction and Maintenance Occupations by Sex
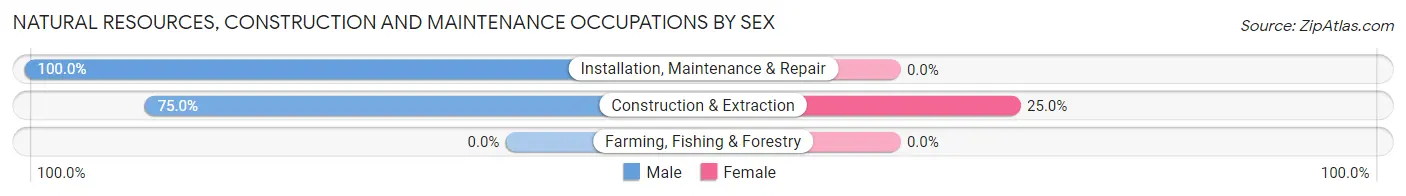
| Occupation | Male | Female |
| Farming, Fishing & Forestry | 0 (0.0%) | 0 (0.0%) |
| Construction & Extraction | 6 (75.0%) | 2 (25.0%) |
| Installation, Maintenance & Repair | 6 (100.0%) | 0 (0.0%) |
| Total (Category) | 12 (85.7%) | 2 (14.3%) |
| Total (Overall) | 90 (49.7%) | 91 (50.3%) |
Production, Transportation and Moving Occupations
The most common Production, Transportation and Moving occupations in Cedar Valley are Production (10 | 5.5%), Transportation (3 | 1.7%), and Material Moving (3 | 1.7%).
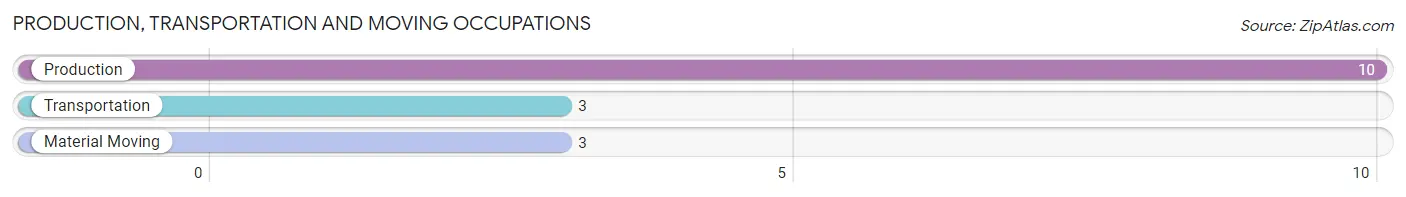
Production, Transportation and Moving Occupations by Sex
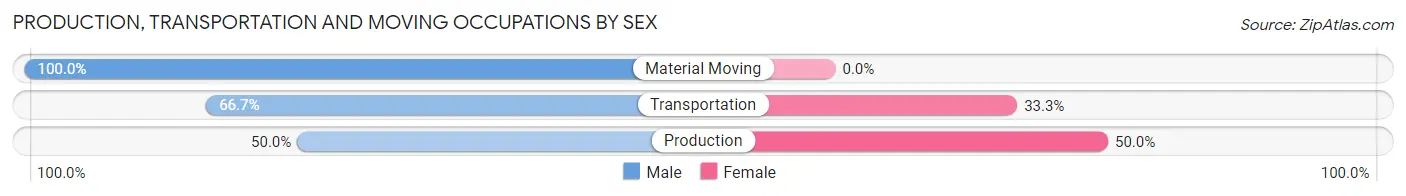
| Occupation | Male | Female |
| Production | 5 (50.0%) | 5 (50.0%) |
| Transportation | 2 (66.7%) | 1 (33.3%) |
| Material Moving | 3 (100.0%) | 0 (0.0%) |
| Total (Category) | 10 (62.5%) | 6 (37.5%) |
| Total (Overall) | 90 (49.7%) | 91 (50.3%) |
Employment Industries by Sex in Cedar Valley
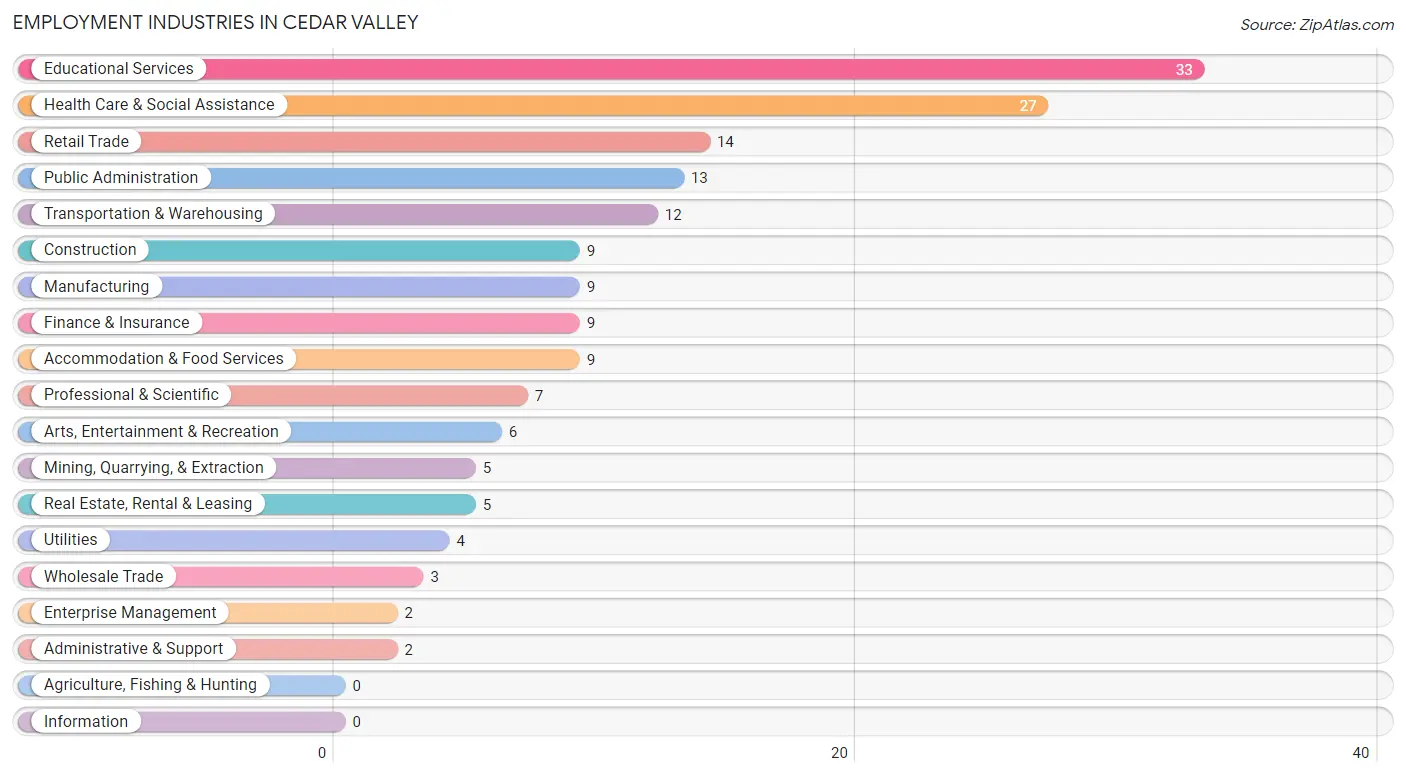
Employment Industries in Cedar Valley
The major employment industries in Cedar Valley include Educational Services (33 | 18.2%), Health Care & Social Assistance (27 | 14.9%), Retail Trade (14 | 7.7%), Public Administration (13 | 7.2%), and Transportation & Warehousing (12 | 6.6%).
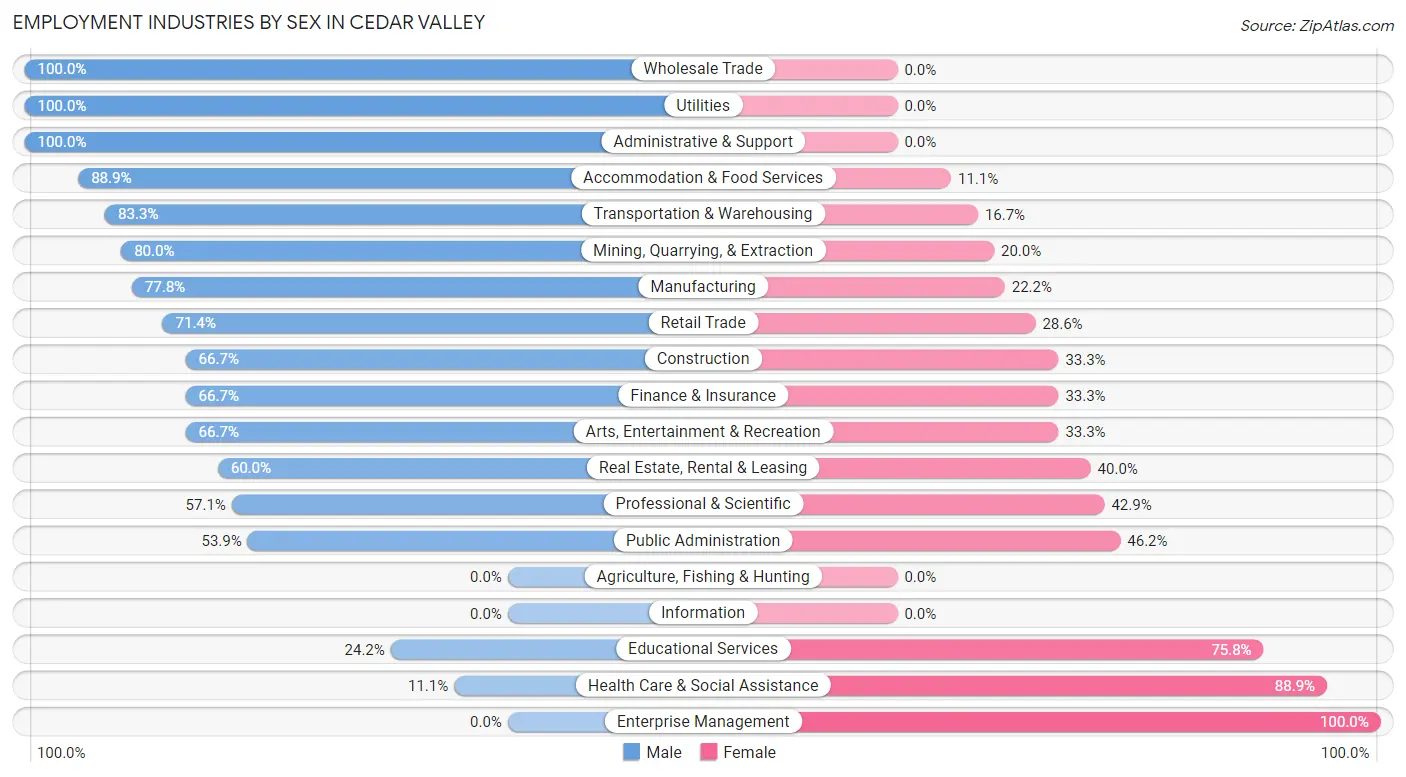
Employment Industries by Sex in Cedar Valley
The Cedar Valley industries that see more men than women are Wholesale Trade (100.0%), Utilities (100.0%), and Administrative & Support (100.0%), whereas the industries that tend to have a higher number of women are Enterprise Management (100.0%), Health Care & Social Assistance (88.9%), and Educational Services (75.8%).
| Industry | Male | Female |
| Agriculture, Fishing & Hunting | 0 (0.0%) | 0 (0.0%) |
| Mining, Quarrying, & Extraction | 4 (80.0%) | 1 (20.0%) |
| Construction | 6 (66.7%) | 3 (33.3%) |
| Manufacturing | 7 (77.8%) | 2 (22.2%) |
| Wholesale Trade | 3 (100.0%) | 0 (0.0%) |
| Retail Trade | 10 (71.4%) | 4 (28.6%) |
| Transportation & Warehousing | 10 (83.3%) | 2 (16.7%) |
| Utilities | 4 (100.0%) | 0 (0.0%) |
| Information | 0 (0.0%) | 0 (0.0%) |
| Finance & Insurance | 6 (66.7%) | 3 (33.3%) |
| Real Estate, Rental & Leasing | 3 (60.0%) | 2 (40.0%) |
| Professional & Scientific | 4 (57.1%) | 3 (42.9%) |
| Enterprise Management | 0 (0.0%) | 2 (100.0%) |
| Administrative & Support | 2 (100.0%) | 0 (0.0%) |
| Educational Services | 8 (24.2%) | 25 (75.8%) |
| Health Care & Social Assistance | 3 (11.1%) | 24 (88.9%) |
| Arts, Entertainment & Recreation | 4 (66.7%) | 2 (33.3%) |
| Accommodation & Food Services | 8 (88.9%) | 1 (11.1%) |
| Public Administration | 7 (53.8%) | 6 (46.2%) |
| Total | 90 (49.7%) | 91 (50.3%) |
Education in Cedar Valley
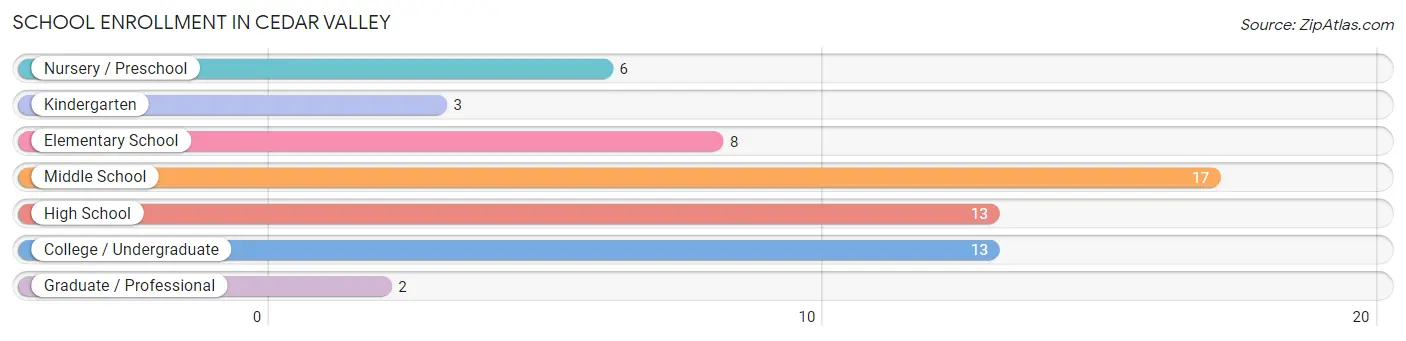
School Enrollment in Cedar Valley
The most common levels of schooling among the 62 students in Cedar Valley are middle school (17 | 27.4%), high school (13 | 21.0%), and college / undergraduate (13 | 21.0%).
| School Level | # Students | % Students |
| Nursery / Preschool | 6 | 9.7% |
| Kindergarten | 3 | 4.8% |
| Elementary School | 8 | 12.9% |
| Middle School | 17 | 27.4% |
| High School | 13 | 21.0% |
| College / Undergraduate | 13 | 21.0% |
| Graduate / Professional | 2 | 3.2% |
| Total | 62 | 100.0% |
School Enrollment by Age by Funding Source in Cedar Valley
Out of a total of 62 students who are enrolled in schools in Cedar Valley, 10 (16.1%) attend a private institution, while the remaining 52 (83.9%) are enrolled in public schools. The age group of 3 to 4 year olds has the highest likelihood of being enrolled in private schools, with 2 (100.0% in the age bracket) enrolled. Conversely, the age group of 10 to 14 year olds has the lowest likelihood of being enrolled in a private school, with 17 (100.0% in the age bracket) attending a public institution.
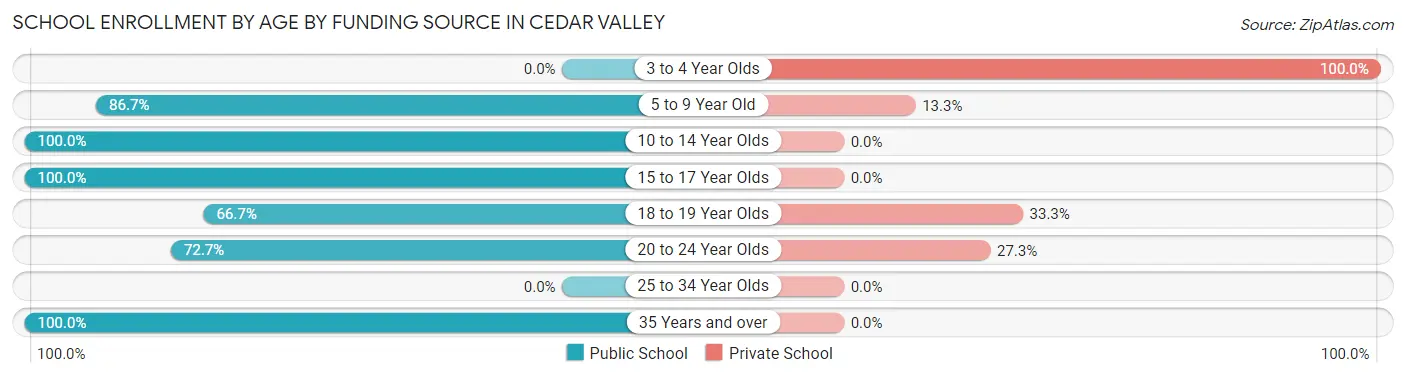
| Age Bracket | Public School | Private School |
| 3 to 4 Year Olds | 0 (0.0%) | 2 (100.0%) |
| 5 to 9 Year Old | 13 (86.7%) | 2 (13.3%) |
| 10 to 14 Year Olds | 17 (100.0%) | 0 (0.0%) |
| 15 to 17 Year Olds | 4 (100.0%) | 0 (0.0%) |
| 18 to 19 Year Olds | 6 (66.7%) | 3 (33.3%) |
| 20 to 24 Year Olds | 8 (72.7%) | 3 (27.3%) |
| 25 to 34 Year Olds | 0 (0.0%) | 0 (0.0%) |
| 35 Years and over | 4 (100.0%) | 0 (0.0%) |
| Total | 52 (83.9%) | 10 (16.1%) |
Educational Attainment by Field of Study in Cedar Valley
Education (87 | 34.9%), science & technology (37 | 14.9%), business (30 | 12.0%), communications (27 | 10.8%), and psychology (19 | 7.6%) are the most common fields of study among 249 individuals in Cedar Valley who have obtained a bachelor's degree or higher.
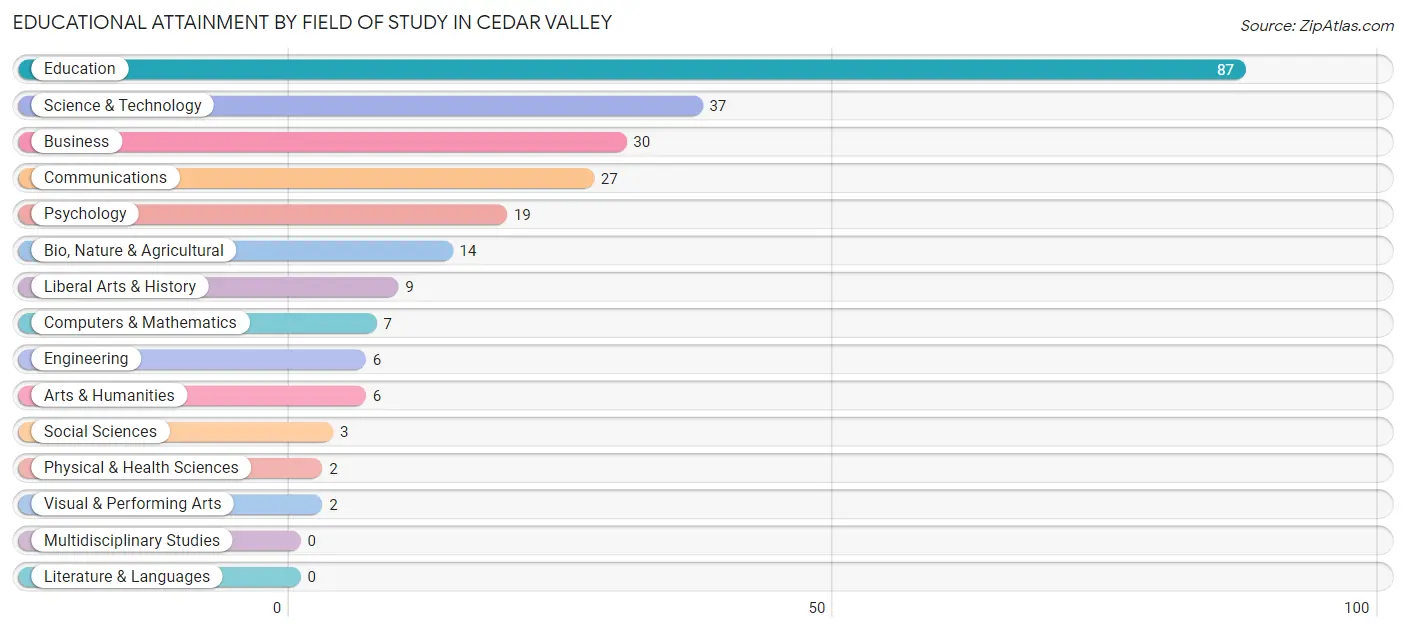
| Field of Study | # Graduates | % Graduates |
| Computers & Mathematics | 7 | 2.8% |
| Bio, Nature & Agricultural | 14 | 5.6% |
| Physical & Health Sciences | 2 | 0.8% |
| Psychology | 19 | 7.6% |
| Social Sciences | 3 | 1.2% |
| Engineering | 6 | 2.4% |
| Multidisciplinary Studies | 0 | 0.0% |
| Science & Technology | 37 | 14.9% |
| Business | 30 | 12.0% |
| Education | 87 | 34.9% |
| Literature & Languages | 0 | 0.0% |
| Liberal Arts & History | 9 | 3.6% |
| Visual & Performing Arts | 2 | 0.8% |
| Communications | 27 | 10.8% |
| Arts & Humanities | 6 | 2.4% |
| Total | 249 | 100.0% |
Transportation & Commute in Cedar Valley
Vehicle Availability by Sex in Cedar Valley
The most prevalent vehicle ownership categories in Cedar Valley are males with 2 vehicles (52, accounting for 57.8%) and females with 2 vehicles (53, making up 59.8%).
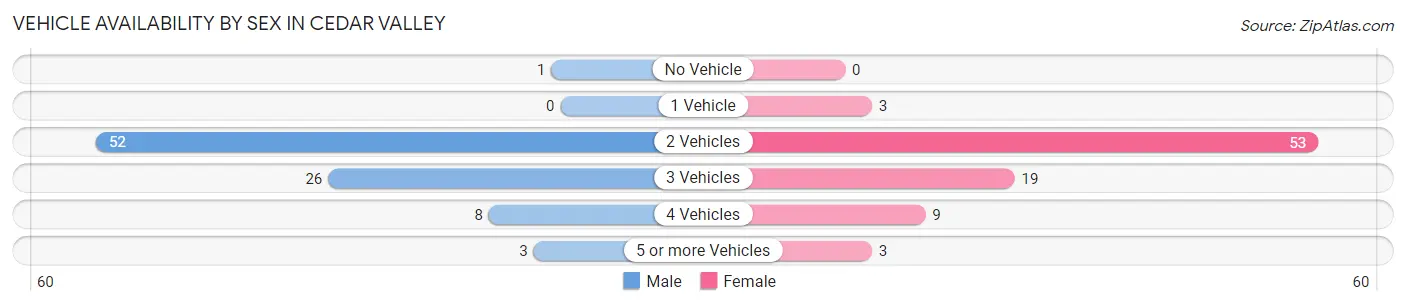
| Vehicles Available | Male | Female |
| No Vehicle | 1 (1.1%) | 0 (0.0%) |
| 1 Vehicle | 0 (0.0%) | 3 (3.5%) |
| 2 Vehicles | 52 (57.8%) | 53 (60.9%) |
| 3 Vehicles | 26 (28.9%) | 19 (21.8%) |
| 4 Vehicles | 8 (8.9%) | 9 (10.3%) |
| 5 or more Vehicles | 3 (3.3%) | 3 (3.5%) |
| Total | 90 (100.0%) | 87 (100.0%) |
Commute Time in Cedar Valley
The most frequently occuring commute durations in Cedar Valley are 20 to 24 minutes (22 commuters, 14.5%), 30 to 34 minutes (21 commuters, 13.8%), and 45 to 59 minutes (21 commuters, 13.8%).
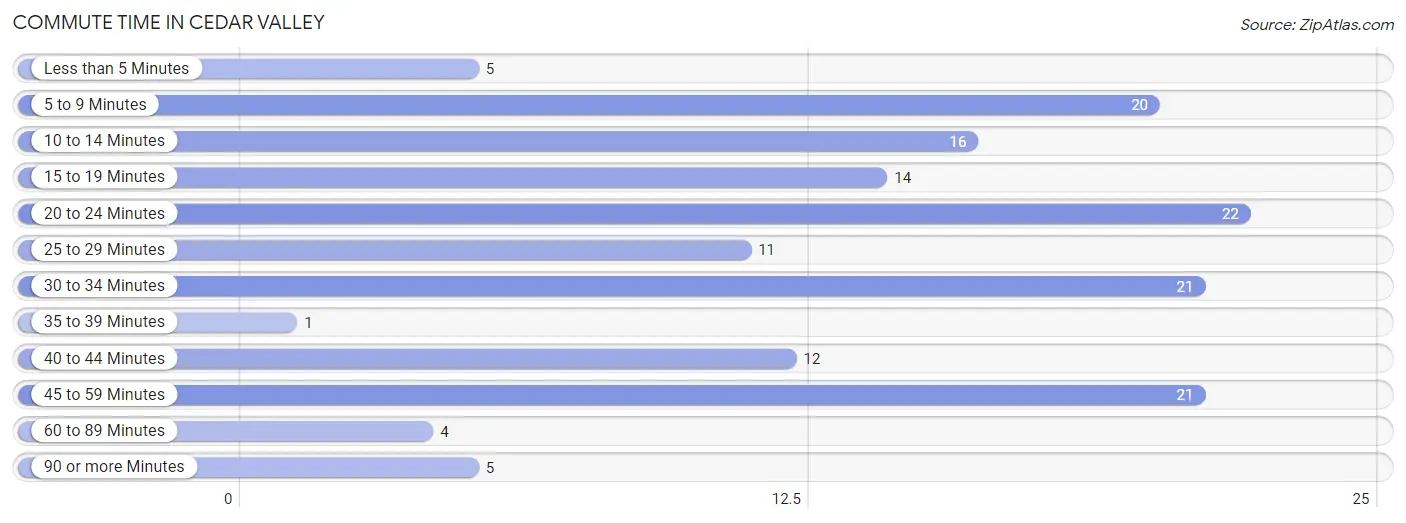
| Commute Time | # Commuters | % Commuters |
| Less than 5 Minutes | 5 | 3.3% |
| 5 to 9 Minutes | 20 | 13.2% |
| 10 to 14 Minutes | 16 | 10.5% |
| 15 to 19 Minutes | 14 | 9.2% |
| 20 to 24 Minutes | 22 | 14.5% |
| 25 to 29 Minutes | 11 | 7.2% |
| 30 to 34 Minutes | 21 | 13.8% |
| 35 to 39 Minutes | 1 | 0.7% |
| 40 to 44 Minutes | 12 | 7.9% |
| 45 to 59 Minutes | 21 | 13.8% |
| 60 to 89 Minutes | 4 | 2.6% |
| 90 or more Minutes | 5 | 3.3% |
Commute Time by Sex in Cedar Valley
The most common commute times in Cedar Valley are 20 to 24 minutes (18 commuters, 23.1%) for males and 45 to 59 minutes (15 commuters, 20.3%) for females.
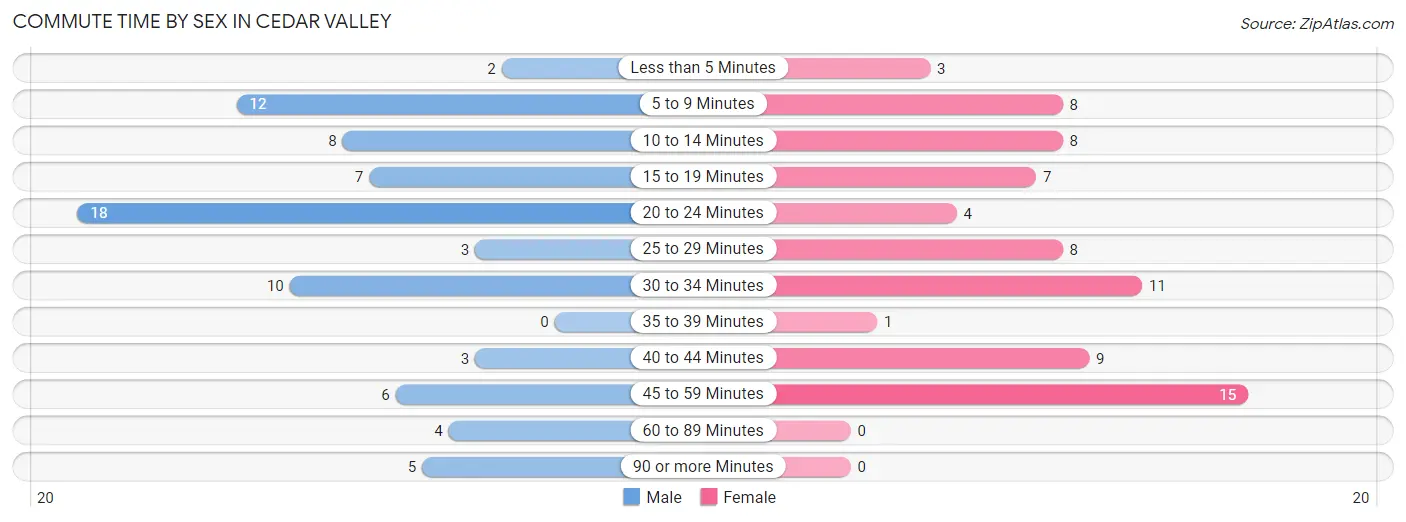
| Commute Time | Male | Female |
| Less than 5 Minutes | 2 (2.6%) | 3 (4.1%) |
| 5 to 9 Minutes | 12 (15.4%) | 8 (10.8%) |
| 10 to 14 Minutes | 8 (10.3%) | 8 (10.8%) |
| 15 to 19 Minutes | 7 (9.0%) | 7 (9.5%) |
| 20 to 24 Minutes | 18 (23.1%) | 4 (5.4%) |
| 25 to 29 Minutes | 3 (3.8%) | 8 (10.8%) |
| 30 to 34 Minutes | 10 (12.8%) | 11 (14.9%) |
| 35 to 39 Minutes | 0 (0.0%) | 1 (1.3%) |
| 40 to 44 Minutes | 3 (3.8%) | 9 (12.2%) |
| 45 to 59 Minutes | 6 (7.7%) | 15 (20.3%) |
| 60 to 89 Minutes | 4 (5.1%) | 0 (0.0%) |
| 90 or more Minutes | 5 (6.4%) | 0 (0.0%) |
Time of Departure to Work by Sex in Cedar Valley
The most frequent times of departure to work in Cedar Valley are 7:00 AM to 7:29 AM (20, 25.6%) for males and 7:00 AM to 7:29 AM (21, 28.4%) for females.
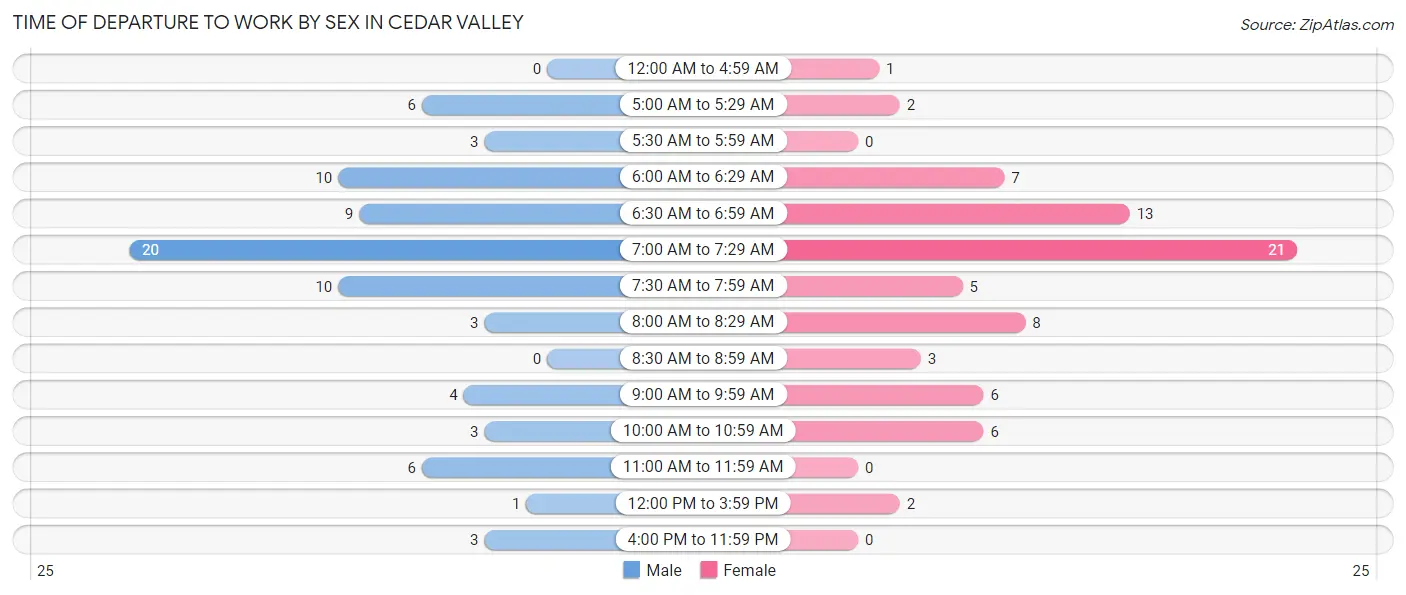
| Time of Departure | Male | Female |
| 12:00 AM to 4:59 AM | 0 (0.0%) | 1 (1.3%) |
| 5:00 AM to 5:29 AM | 6 (7.7%) | 2 (2.7%) |
| 5:30 AM to 5:59 AM | 3 (3.8%) | 0 (0.0%) |
| 6:00 AM to 6:29 AM | 10 (12.8%) | 7 (9.5%) |
| 6:30 AM to 6:59 AM | 9 (11.5%) | 13 (17.6%) |
| 7:00 AM to 7:29 AM | 20 (25.6%) | 21 (28.4%) |
| 7:30 AM to 7:59 AM | 10 (12.8%) | 5 (6.8%) |
| 8:00 AM to 8:29 AM | 3 (3.8%) | 8 (10.8%) |
| 8:30 AM to 8:59 AM | 0 (0.0%) | 3 (4.1%) |
| 9:00 AM to 9:59 AM | 4 (5.1%) | 6 (8.1%) |
| 10:00 AM to 10:59 AM | 3 (3.8%) | 6 (8.1%) |
| 11:00 AM to 11:59 AM | 6 (7.7%) | 0 (0.0%) |
| 12:00 PM to 3:59 PM | 1 (1.3%) | 2 (2.7%) |
| 4:00 PM to 11:59 PM | 3 (3.8%) | 0 (0.0%) |
| Total | 78 (100.0%) | 74 (100.0%) |
Housing Occupancy in Cedar Valley
Occupancy by Ownership in Cedar Valley
Of the total 191 dwellings in Cedar Valley, owner-occupied units account for 158 (82.7%), while renter-occupied units make up 33 (17.3%).
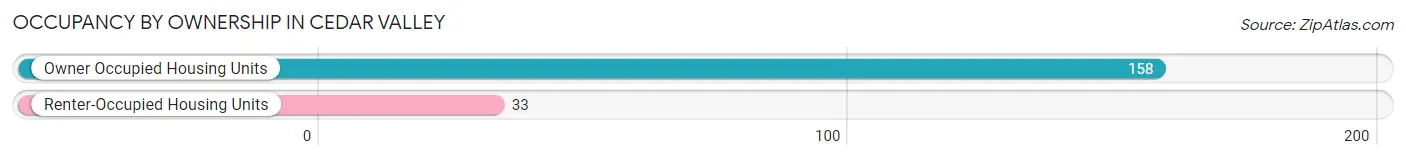
| Occupancy | # Housing Units | % Housing Units |
| Owner Occupied Housing Units | 158 | 82.7% |
| Renter-Occupied Housing Units | 33 | 17.3% |
| Total Occupied Housing Units | 191 | 100.0% |
Occupancy by Household Size in Cedar Valley
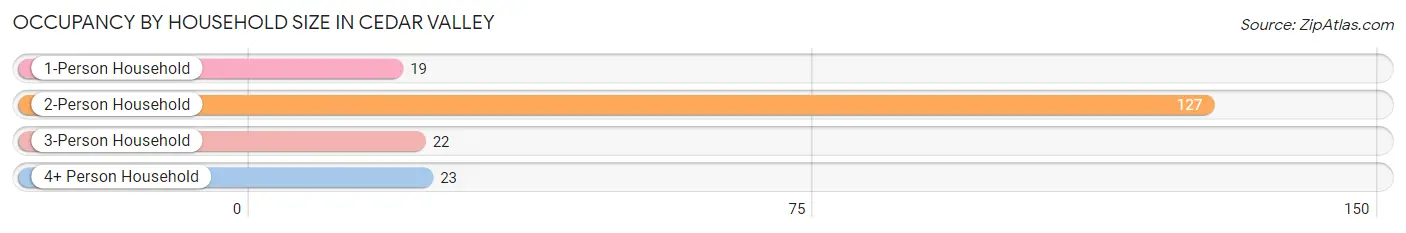
| Household Size | # Housing Units | % Housing Units |
| 1-Person Household | 19 | 10.0% |
| 2-Person Household | 127 | 66.5% |
| 3-Person Household | 22 | 11.5% |
| 4+ Person Household | 23 | 12.0% |
| Total Housing Units | 191 | 100.0% |
Occupancy by Ownership by Household Size in Cedar Valley
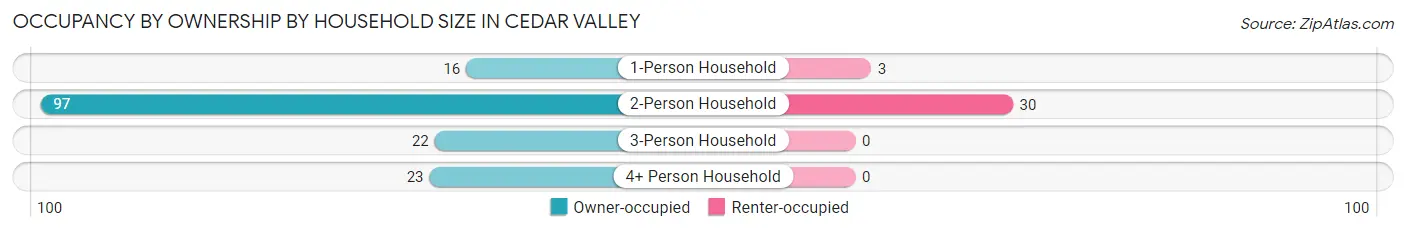
| Household Size | Owner-occupied | Renter-occupied |
| 1-Person Household | 16 (84.2%) | 3 (15.8%) |
| 2-Person Household | 97 (76.4%) | 30 (23.6%) |
| 3-Person Household | 22 (100.0%) | 0 (0.0%) |
| 4+ Person Household | 23 (100.0%) | 0 (0.0%) |
| Total Housing Units | 158 (82.7%) | 33 (17.3%) |
Occupancy by Educational Attainment in Cedar Valley
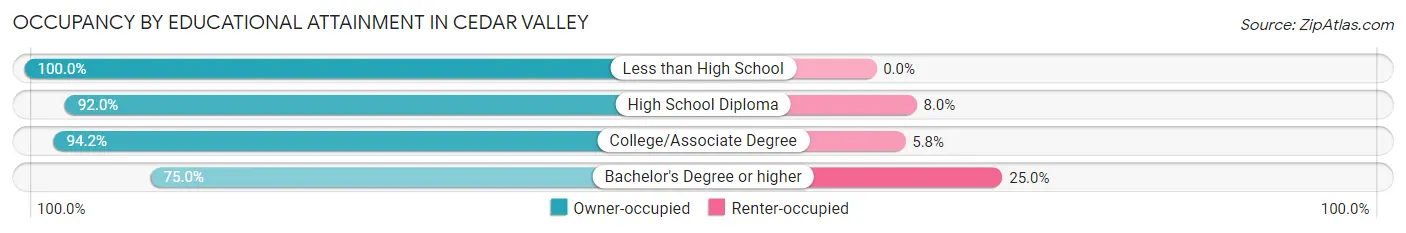
| Household Size | Owner-occupied | Renter-occupied |
| Less than High School | 2 (100.0%) | 0 (0.0%) |
| High School Diploma | 23 (92.0%) | 2 (8.0%) |
| College/Associate Degree | 49 (94.2%) | 3 (5.8%) |
| Bachelor's Degree or higher | 84 (75.0%) | 28 (25.0%) |
Occupancy by Age of Householder in Cedar Valley
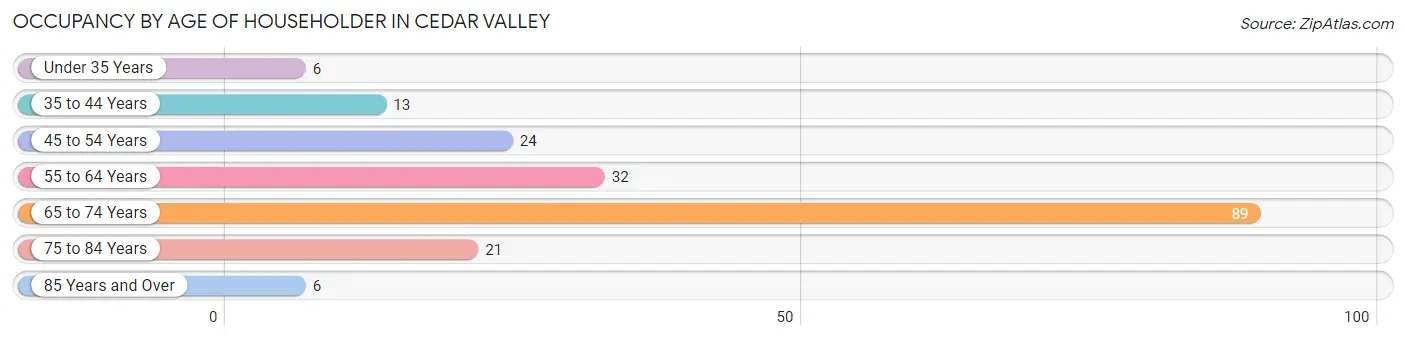
| Age Bracket | # Households | % Households |
| Under 35 Years | 6 | 3.1% |
| 35 to 44 Years | 13 | 6.8% |
| 45 to 54 Years | 24 | 12.6% |
| 55 to 64 Years | 32 | 16.8% |
| 65 to 74 Years | 89 | 46.6% |
| 75 to 84 Years | 21 | 11.0% |
| 85 Years and Over | 6 | 3.1% |
| Total | 191 | 100.0% |
Housing Finances in Cedar Valley
Median Income by Occupancy in Cedar Valley
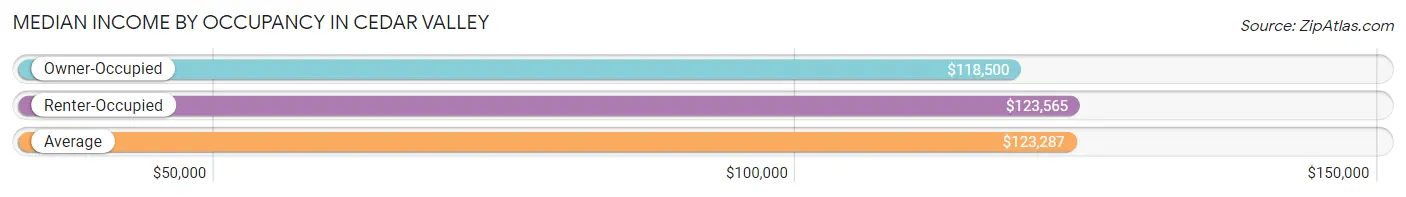
| Occupancy Type | # Households | Median Income |
| Owner-Occupied | 158 (82.7%) | $118,500 |
| Renter-Occupied | 33 (17.3%) | $123,565 |
| Average | 191 (100.0%) | $123,287 |
Occupancy by Householder Income Bracket in Cedar Valley
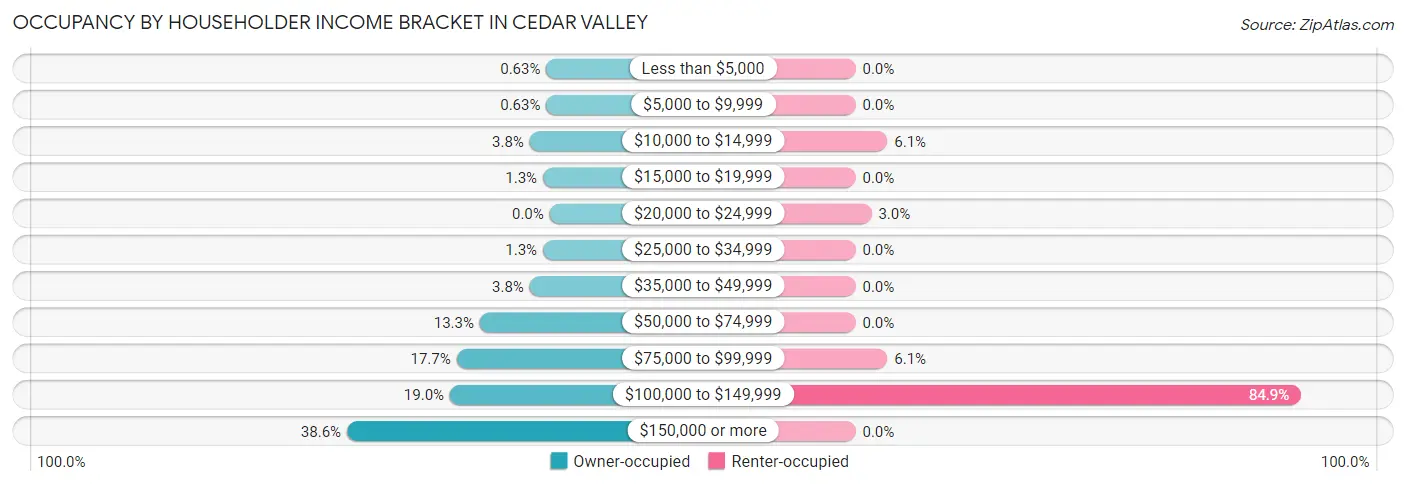
| Income Bracket | Owner-occupied | Renter-occupied |
| Less than $5,000 | 1 (0.6%) | 0 (0.0%) |
| $5,000 to $9,999 | 1 (0.6%) | 0 (0.0%) |
| $10,000 to $14,999 | 6 (3.8%) | 2 (6.1%) |
| $15,000 to $19,999 | 2 (1.3%) | 0 (0.0%) |
| $20,000 to $24,999 | 0 (0.0%) | 1 (3.0%) |
| $25,000 to $34,999 | 2 (1.3%) | 0 (0.0%) |
| $35,000 to $49,999 | 6 (3.8%) | 0 (0.0%) |
| $50,000 to $74,999 | 21 (13.3%) | 0 (0.0%) |
| $75,000 to $99,999 | 28 (17.7%) | 2 (6.1%) |
| $100,000 to $149,999 | 30 (19.0%) | 28 (84.9%) |
| $150,000 or more | 61 (38.6%) | 0 (0.0%) |
| Total | 158 (100.0%) | 33 (100.0%) |
Monthly Housing Cost Tiers in Cedar Valley
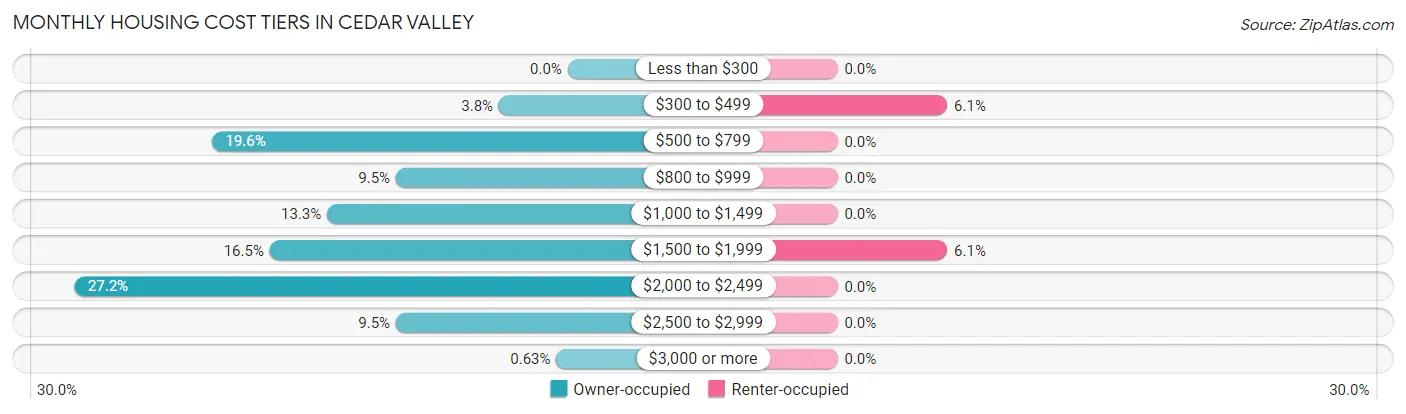
| Monthly Cost | Owner-occupied | Renter-occupied |
| Less than $300 | 0 (0.0%) | 0 (0.0%) |
| $300 to $499 | 6 (3.8%) | 2 (6.1%) |
| $500 to $799 | 31 (19.6%) | 0 (0.0%) |
| $800 to $999 | 15 (9.5%) | 0 (0.0%) |
| $1,000 to $1,499 | 21 (13.3%) | 0 (0.0%) |
| $1,500 to $1,999 | 26 (16.5%) | 2 (6.1%) |
| $2,000 to $2,499 | 43 (27.2%) | 0 (0.0%) |
| $2,500 to $2,999 | 15 (9.5%) | 0 (0.0%) |
| $3,000 or more | 1 (0.6%) | 0 (0.0%) |
| Total | 158 (100.0%) | 33 (100.0%) |
Physical Housing Characteristics in Cedar Valley
Housing Structures in Cedar Valley
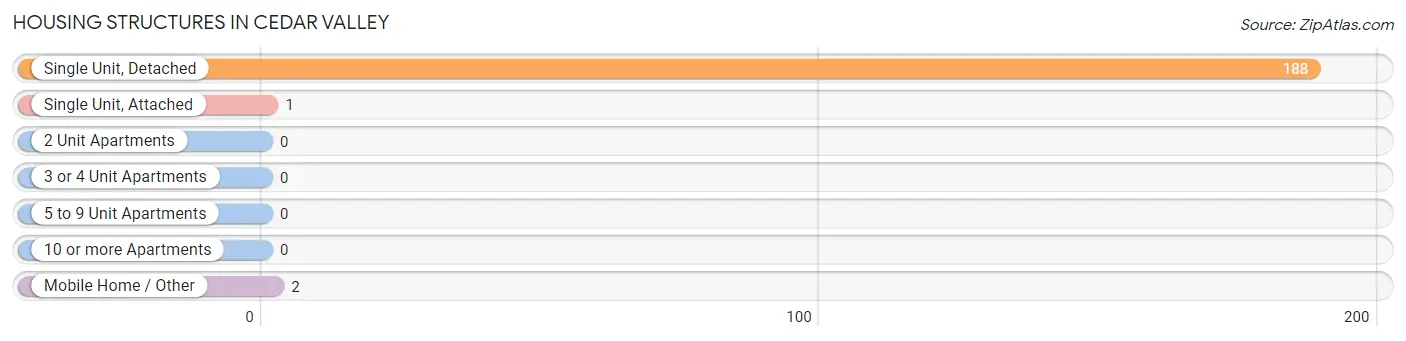
| Structure Type | # Housing Units | % Housing Units |
| Single Unit, Detached | 188 | 98.4% |
| Single Unit, Attached | 1 | 0.5% |
| 2 Unit Apartments | 0 | 0.0% |
| 3 or 4 Unit Apartments | 0 | 0.0% |
| 5 to 9 Unit Apartments | 0 | 0.0% |
| 10 or more Apartments | 0 | 0.0% |
| Mobile Home / Other | 2 | 1.1% |
| Total | 191 | 100.0% |
Housing Structures by Occupancy in Cedar Valley
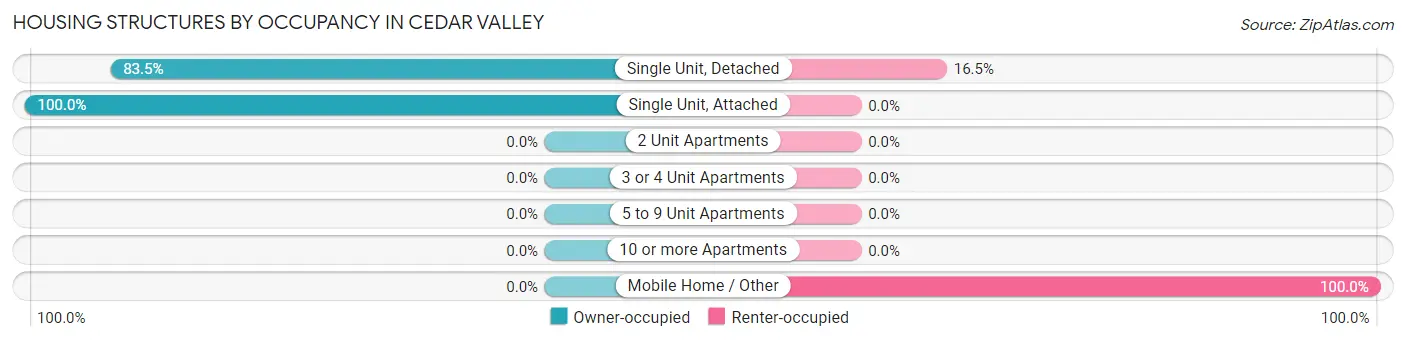
| Structure Type | Owner-occupied | Renter-occupied |
| Single Unit, Detached | 157 (83.5%) | 31 (16.5%) |
| Single Unit, Attached | 1 (100.0%) | 0 (0.0%) |
| 2 Unit Apartments | 0 (0.0%) | 0 (0.0%) |
| 3 or 4 Unit Apartments | 0 (0.0%) | 0 (0.0%) |
| 5 to 9 Unit Apartments | 0 (0.0%) | 0 (0.0%) |
| 10 or more Apartments | 0 (0.0%) | 0 (0.0%) |
| Mobile Home / Other | 0 (0.0%) | 2 (100.0%) |
| Total | 158 (82.7%) | 33 (17.3%) |
Housing Structures by Number of Rooms in Cedar Valley
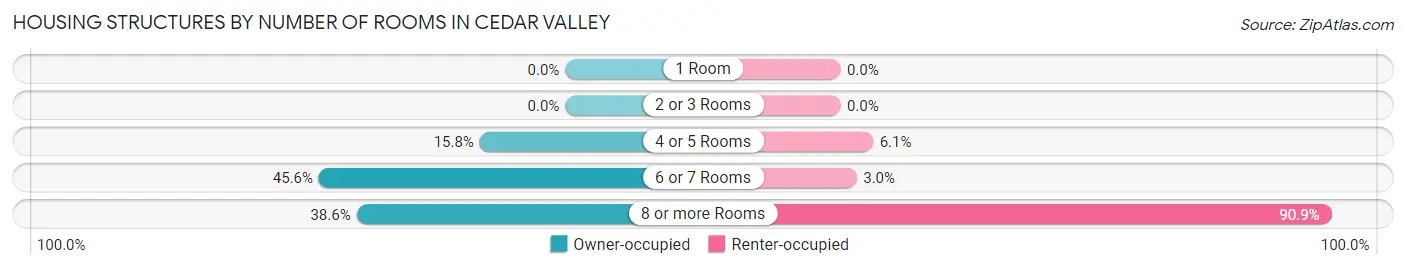
| Number of Rooms | Owner-occupied | Renter-occupied |
| 1 Room | 0 (0.0%) | 0 (0.0%) |
| 2 or 3 Rooms | 0 (0.0%) | 0 (0.0%) |
| 4 or 5 Rooms | 25 (15.8%) | 2 (6.1%) |
| 6 or 7 Rooms | 72 (45.6%) | 1 (3.0%) |
| 8 or more Rooms | 61 (38.6%) | 30 (90.9%) |
| Total | 158 (100.0%) | 33 (100.0%) |
Housing Structure by Heating Type in Cedar Valley
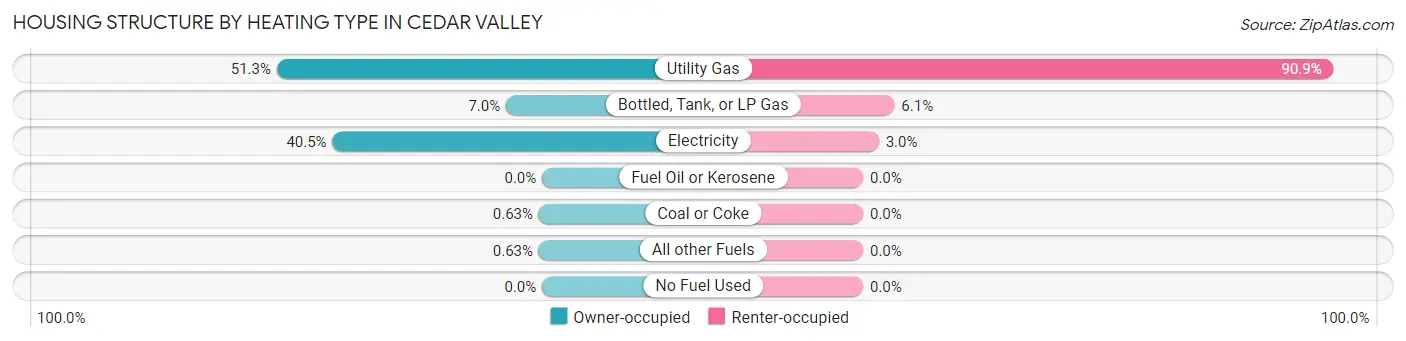
| Heating Type | Owner-occupied | Renter-occupied |
| Utility Gas | 81 (51.3%) | 30 (90.9%) |
| Bottled, Tank, or LP Gas | 11 (7.0%) | 2 (6.1%) |
| Electricity | 64 (40.5%) | 1 (3.0%) |
| Fuel Oil or Kerosene | 0 (0.0%) | 0 (0.0%) |
| Coal or Coke | 1 (0.6%) | 0 (0.0%) |
| All other Fuels | 1 (0.6%) | 0 (0.0%) |
| No Fuel Used | 0 (0.0%) | 0 (0.0%) |
| Total | 158 (100.0%) | 33 (100.0%) |
Household Vehicle Usage in Cedar Valley
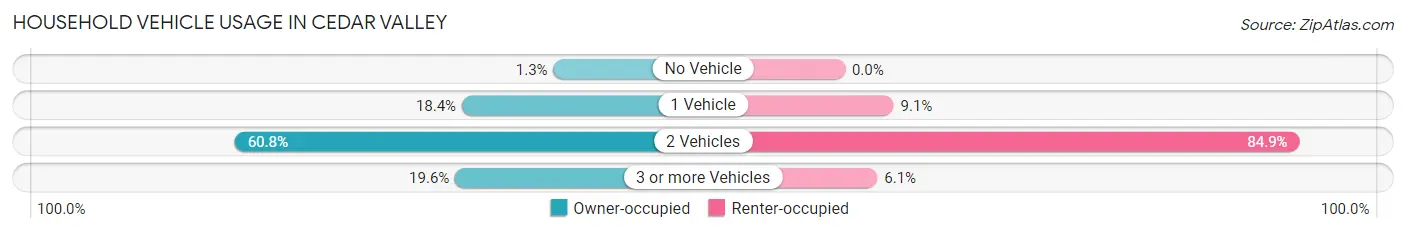
| Vehicles per Household | Owner-occupied | Renter-occupied |
| No Vehicle | 2 (1.3%) | 0 (0.0%) |
| 1 Vehicle | 29 (18.3%) | 3 (9.1%) |
| 2 Vehicles | 96 (60.8%) | 28 (84.9%) |
| 3 or more Vehicles | 31 (19.6%) | 2 (6.1%) |
| Total | 158 (100.0%) | 33 (100.0%) |
Real Estate & Mortgages in Cedar Valley
Real Estate and Mortgage Overview in Cedar Valley
| Characteristic | Without Mortgage | With Mortgage |
| Housing Units | 58 | 100 |
| Median Property Value | $342,300 | $296,300 |
| Median Household Income | $93,125 | $45 |
| Monthly Housing Costs | $738 | $1 |
| Real Estate Taxes | $2,554 | $1 |
Property Value by Mortgage Status in Cedar Valley
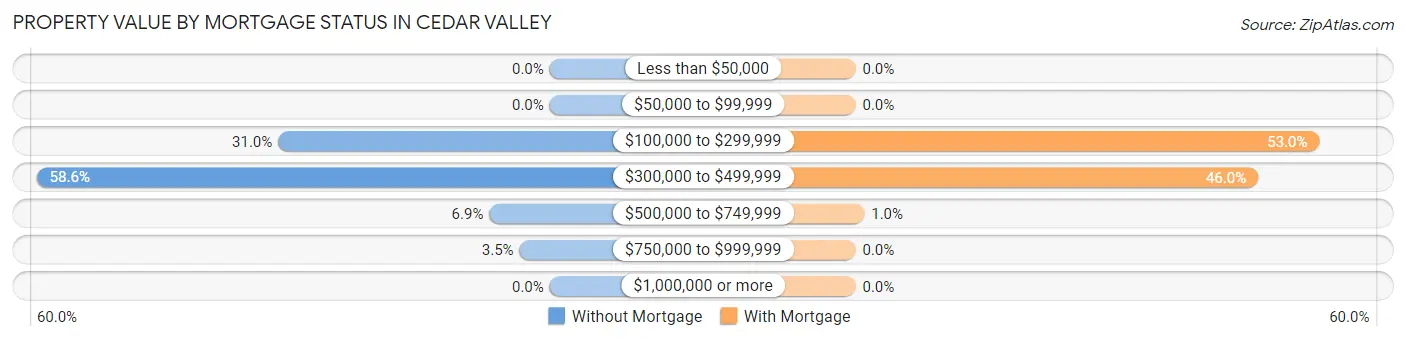
| Property Value | Without Mortgage | With Mortgage |
| Less than $50,000 | 0 (0.0%) | 0 (0.0%) |
| $50,000 to $99,999 | 0 (0.0%) | 0 (0.0%) |
| $100,000 to $299,999 | 18 (31.0%) | 53 (53.0%) |
| $300,000 to $499,999 | 34 (58.6%) | 46 (46.0%) |
| $500,000 to $749,999 | 4 (6.9%) | 1 (1.0%) |
| $750,000 to $999,999 | 2 (3.5%) | 0 (0.0%) |
| $1,000,000 or more | 0 (0.0%) | 0 (0.0%) |
| Total | 58 (100.0%) | 100 (100.0%) |
Household Income by Mortgage Status in Cedar Valley
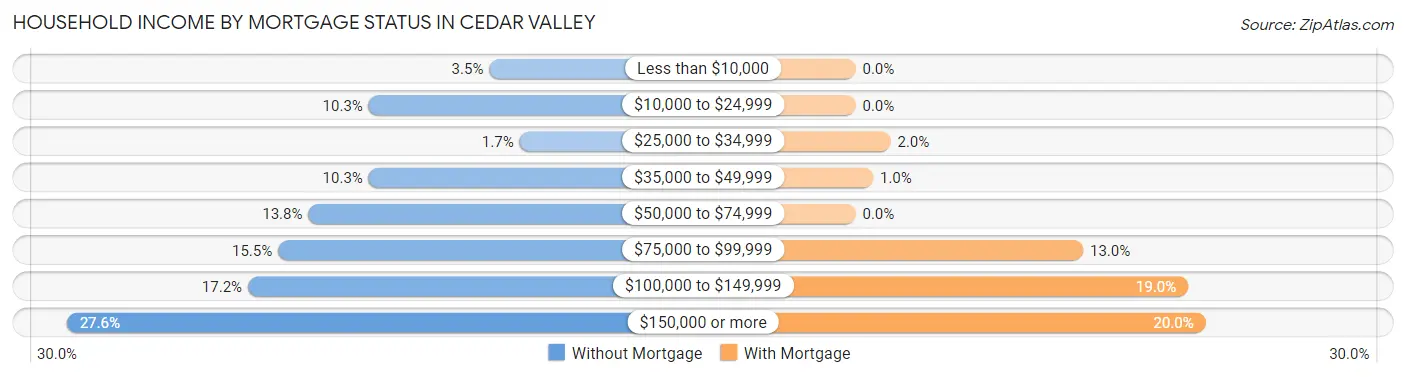
| Household Income | Without Mortgage | With Mortgage |
| Less than $10,000 | 2 (3.5%) | 0 (0.0%) |
| $10,000 to $24,999 | 6 (10.3%) | 0 (0.0%) |
| $25,000 to $34,999 | 1 (1.7%) | 2 (2.0%) |
| $35,000 to $49,999 | 6 (10.3%) | 1 (1.0%) |
| $50,000 to $74,999 | 8 (13.8%) | 0 (0.0%) |
| $75,000 to $99,999 | 9 (15.5%) | 13 (13.0%) |
| $100,000 to $149,999 | 10 (17.2%) | 19 (19.0%) |
| $150,000 or more | 16 (27.6%) | 20 (20.0%) |
| Total | 58 (100.0%) | 100 (100.0%) |
Property Value to Household Income Ratio in Cedar Valley
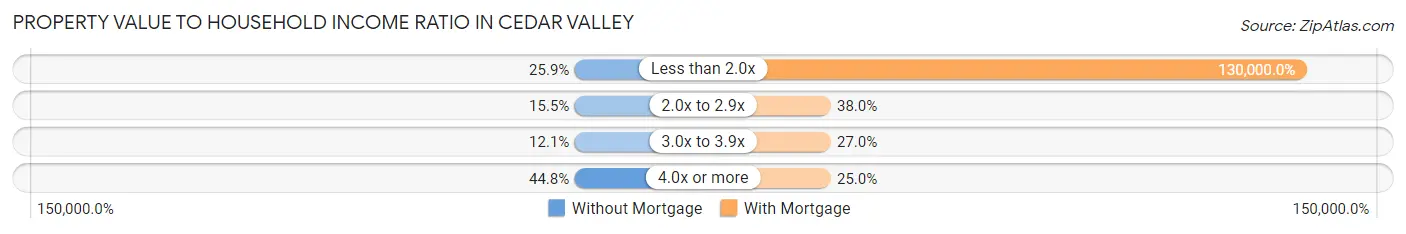
| Value-to-Income Ratio | Without Mortgage | With Mortgage |
| Less than 2.0x | 15 (25.9%) | 130,000 (130,000.0%) |
| 2.0x to 2.9x | 9 (15.5%) | 38 (38.0%) |
| 3.0x to 3.9x | 7 (12.1%) | 27 (27.0%) |
| 4.0x or more | 26 (44.8%) | 25 (25.0%) |
| Total | 58 (100.0%) | 100 (100.0%) |
Real Estate Taxes by Mortgage Status in Cedar Valley
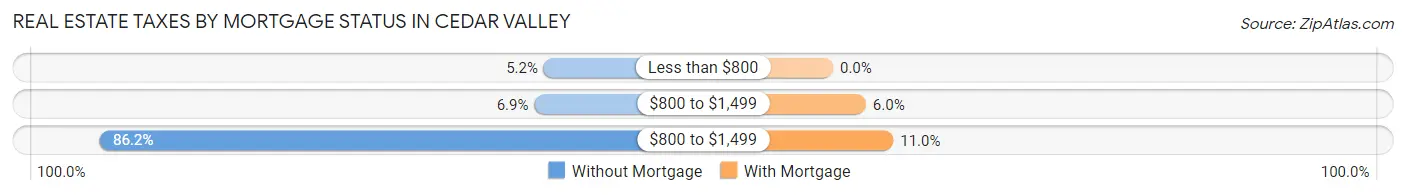
| Property Taxes | Without Mortgage | With Mortgage |
| Less than $800 | 3 (5.2%) | 0 (0.0%) |
| $800 to $1,499 | 4 (6.9%) | 6 (6.0%) |
| $800 to $1,499 | 50 (86.2%) | 11 (11.0%) |
| Total | 58 (100.0%) | 100 (100.0%) |
Health & Disability in Cedar Valley
Health Insurance Coverage by Age in Cedar Valley
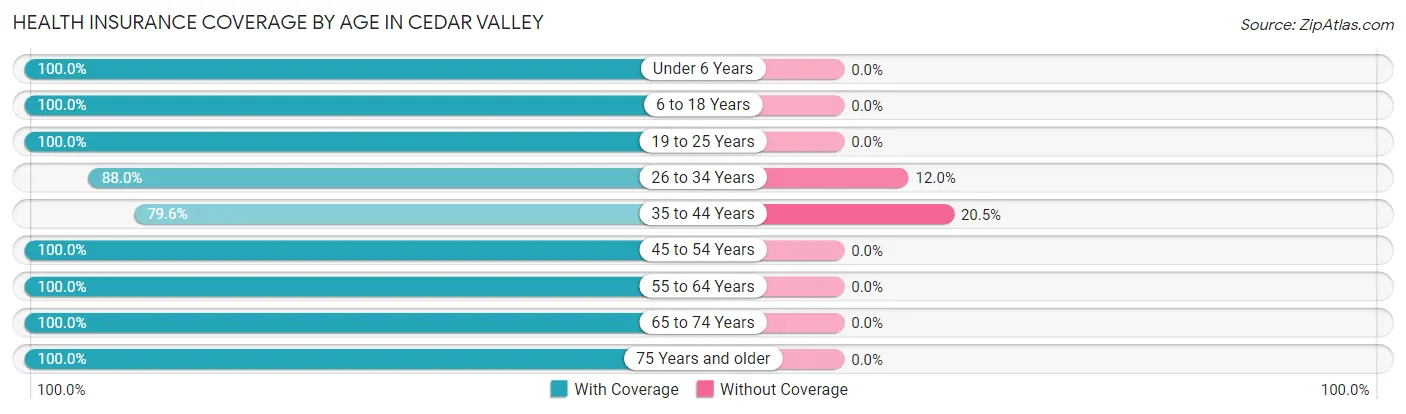
| Age Bracket | With Coverage | Without Coverage |
| Under 6 Years | 18 (100.0%) | 0 (0.0%) |
| 6 to 18 Years | 46 (100.0%) | 0 (0.0%) |
| 19 to 25 Years | 29 (100.0%) | 0 (0.0%) |
| 26 to 34 Years | 22 (88.0%) | 3 (12.0%) |
| 35 to 44 Years | 35 (79.5%) | 9 (20.4%) |
| 45 to 54 Years | 41 (100.0%) | 0 (0.0%) |
| 55 to 64 Years | 93 (100.0%) | 0 (0.0%) |
| 65 to 74 Years | 147 (100.0%) | 0 (0.0%) |
| 75 Years and older | 57 (100.0%) | 0 (0.0%) |
| Total | 488 (97.6%) | 12 (2.4%) |
Health Insurance Coverage by Citizenship Status in Cedar Valley
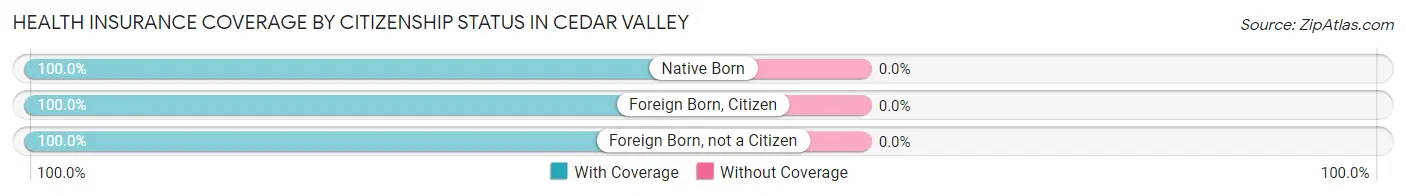
| Citizenship Status | With Coverage | Without Coverage |
| Native Born | 18 (100.0%) | 0 (0.0%) |
| Foreign Born, Citizen | 46 (100.0%) | 0 (0.0%) |
| Foreign Born, not a Citizen | 29 (100.0%) | 0 (0.0%) |
Health Insurance Coverage by Household Income in Cedar Valley
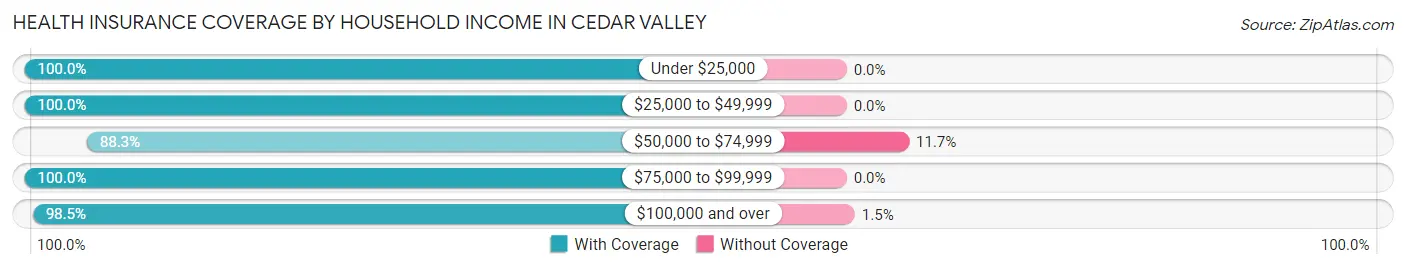
| Household Income | With Coverage | Without Coverage |
| Under $25,000 | 21 (100.0%) | 0 (0.0%) |
| $25,000 to $49,999 | 15 (100.0%) | 0 (0.0%) |
| $50,000 to $74,999 | 53 (88.3%) | 7 (11.7%) |
| $75,000 to $99,999 | 74 (100.0%) | 0 (0.0%) |
| $100,000 and over | 325 (98.5%) | 5 (1.5%) |
Public vs Private Health Insurance Coverage by Age in Cedar Valley
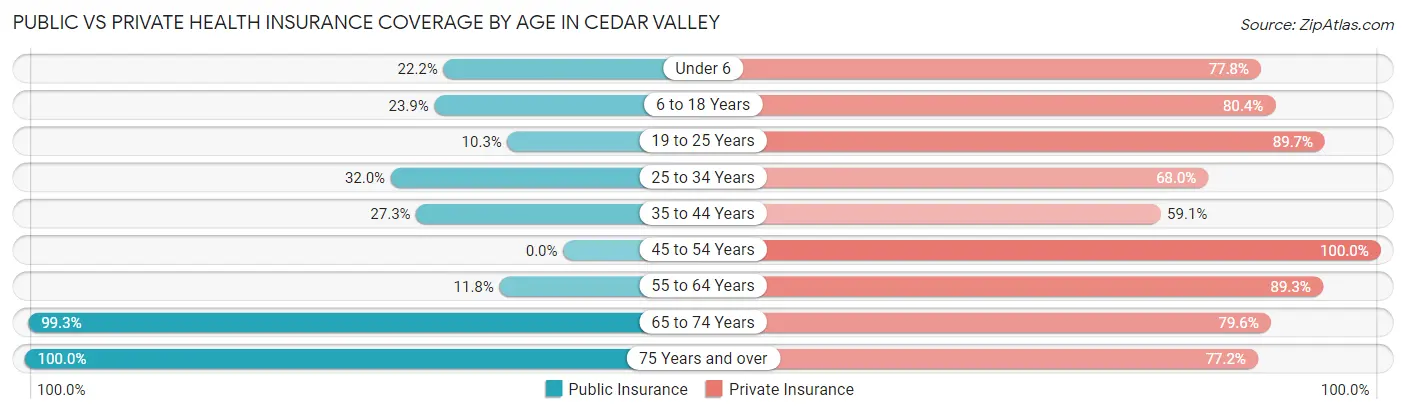
| Age Bracket | Public Insurance | Private Insurance |
| Under 6 | 4 (22.2%) | 14 (77.8%) |
| 6 to 18 Years | 11 (23.9%) | 37 (80.4%) |
| 19 to 25 Years | 3 (10.3%) | 26 (89.7%) |
| 25 to 34 Years | 8 (32.0%) | 17 (68.0%) |
| 35 to 44 Years | 12 (27.3%) | 26 (59.1%) |
| 45 to 54 Years | 0 (0.0%) | 41 (100.0%) |
| 55 to 64 Years | 11 (11.8%) | 83 (89.2%) |
| 65 to 74 Years | 146 (99.3%) | 117 (79.6%) |
| 75 Years and over | 57 (100.0%) | 44 (77.2%) |
| Total | 252 (50.4%) | 405 (81.0%) |
Disability Status by Sex by Age in Cedar Valley
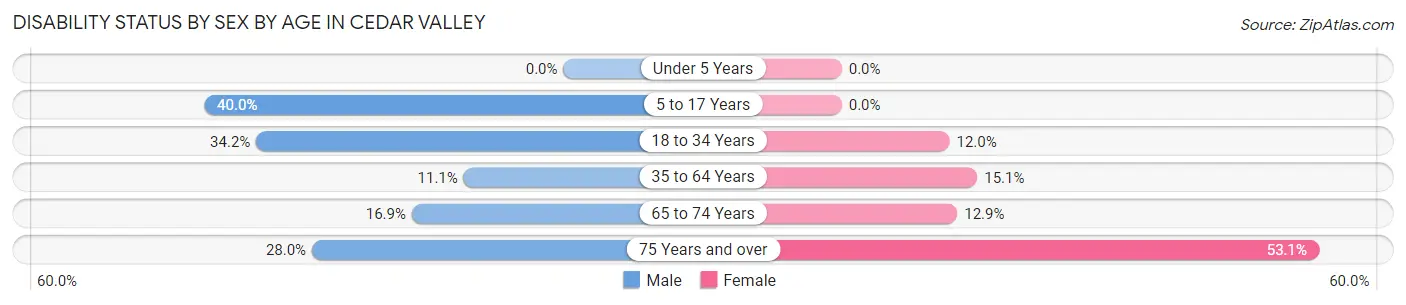
| Age Bracket | Male | Female |
| Under 5 Years | 0 (0.0%) | 0 (0.0%) |
| 5 to 17 Years | 2 (40.0%) | 0 (0.0%) |
| 18 to 34 Years | 13 (34.2%) | 3 (12.0%) |
| 35 to 64 Years | 8 (11.1%) | 16 (15.1%) |
| 65 to 74 Years | 13 (16.9%) | 9 (12.9%) |
| 75 Years and over | 7 (28.0%) | 17 (53.1%) |
Disability Class by Sex by Age in Cedar Valley
Disability Class: Hearing Difficulty
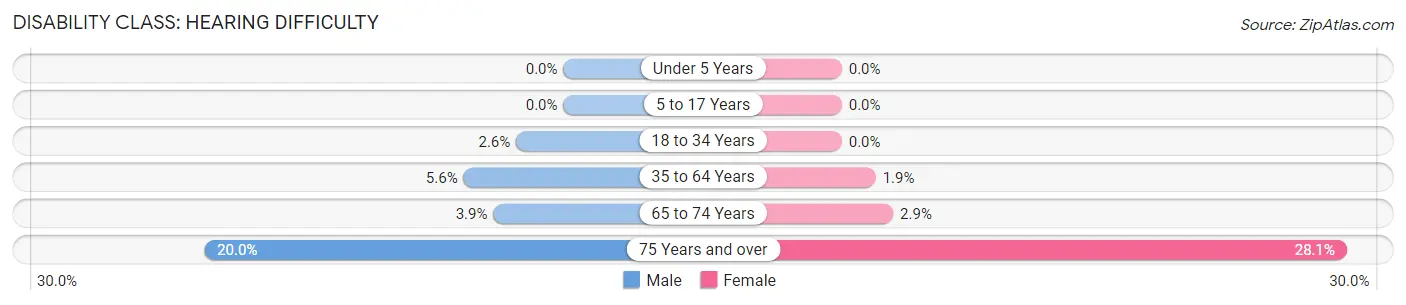
| Age Bracket | Male | Female |
| Under 5 Years | 0 (0.0%) | 0 (0.0%) |
| 5 to 17 Years | 0 (0.0%) | 0 (0.0%) |
| 18 to 34 Years | 1 (2.6%) | 0 (0.0%) |
| 35 to 64 Years | 4 (5.6%) | 2 (1.9%) |
| 65 to 74 Years | 3 (3.9%) | 2 (2.9%) |
| 75 Years and over | 5 (20.0%) | 9 (28.1%) |
Disability Class: Vision Difficulty
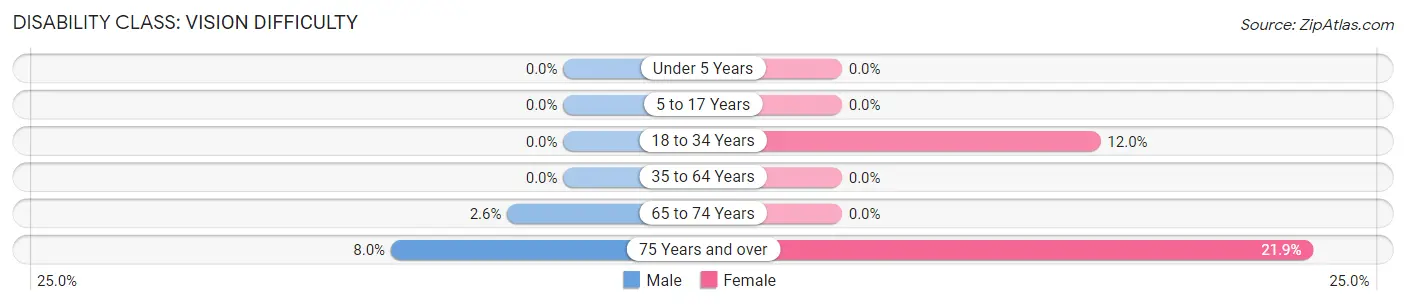
| Age Bracket | Male | Female |
| Under 5 Years | 0 (0.0%) | 0 (0.0%) |
| 5 to 17 Years | 0 (0.0%) | 0 (0.0%) |
| 18 to 34 Years | 0 (0.0%) | 3 (12.0%) |
| 35 to 64 Years | 0 (0.0%) | 0 (0.0%) |
| 65 to 74 Years | 2 (2.6%) | 0 (0.0%) |
| 75 Years and over | 2 (8.0%) | 7 (21.9%) |
Disability Class: Cognitive Difficulty
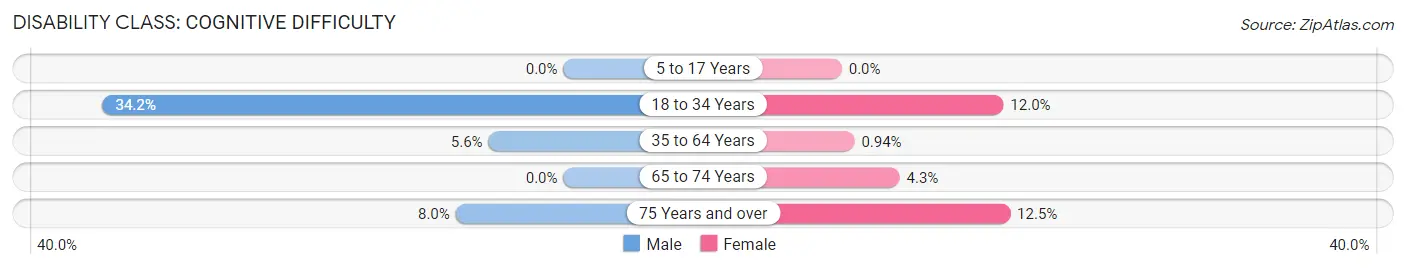
| Age Bracket | Male | Female |
| 5 to 17 Years | 0 (0.0%) | 0 (0.0%) |
| 18 to 34 Years | 13 (34.2%) | 3 (12.0%) |
| 35 to 64 Years | 4 (5.6%) | 1 (0.9%) |
| 65 to 74 Years | 0 (0.0%) | 3 (4.3%) |
| 75 Years and over | 2 (8.0%) | 4 (12.5%) |
Disability Class: Ambulatory Difficulty
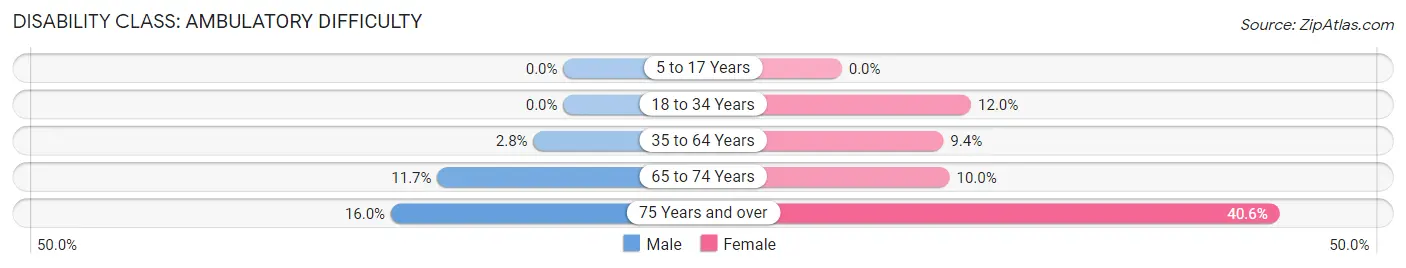
| Age Bracket | Male | Female |
| 5 to 17 Years | 0 (0.0%) | 0 (0.0%) |
| 18 to 34 Years | 0 (0.0%) | 3 (12.0%) |
| 35 to 64 Years | 2 (2.8%) | 10 (9.4%) |
| 65 to 74 Years | 9 (11.7%) | 7 (10.0%) |
| 75 Years and over | 4 (16.0%) | 13 (40.6%) |
Disability Class: Self-Care Difficulty
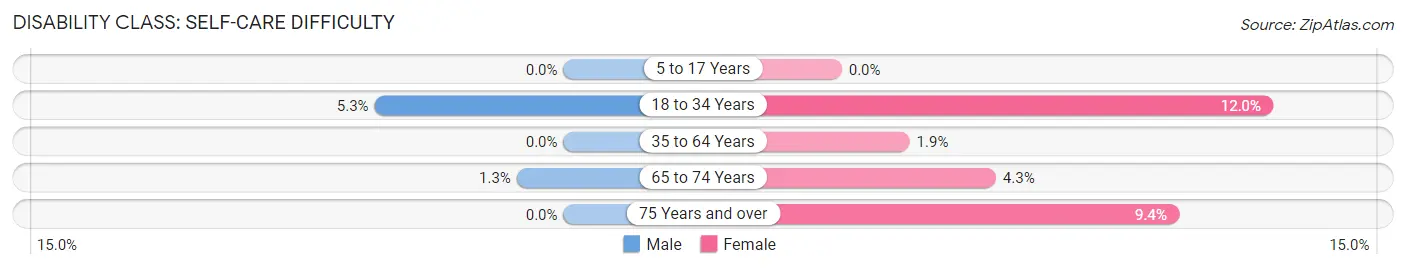
| Age Bracket | Male | Female |
| 5 to 17 Years | 0 (0.0%) | 0 (0.0%) |
| 18 to 34 Years | 2 (5.3%) | 3 (12.0%) |
| 35 to 64 Years | 0 (0.0%) | 2 (1.9%) |
| 65 to 74 Years | 1 (1.3%) | 3 (4.3%) |
| 75 Years and over | 0 (0.0%) | 3 (9.4%) |
Technology Access in Cedar Valley
Computing Device Access in Cedar Valley
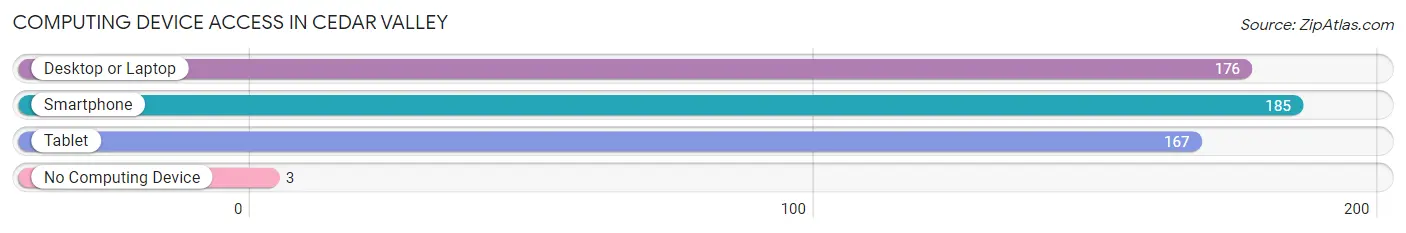
| Device Type | # Households | % Households |
| Desktop or Laptop | 176 | 92.1% |
| Smartphone | 185 | 96.9% |
| Tablet | 167 | 87.4% |
| No Computing Device | 3 | 1.6% |
| Total | 191 | 100.0% |
Internet Access in Cedar Valley
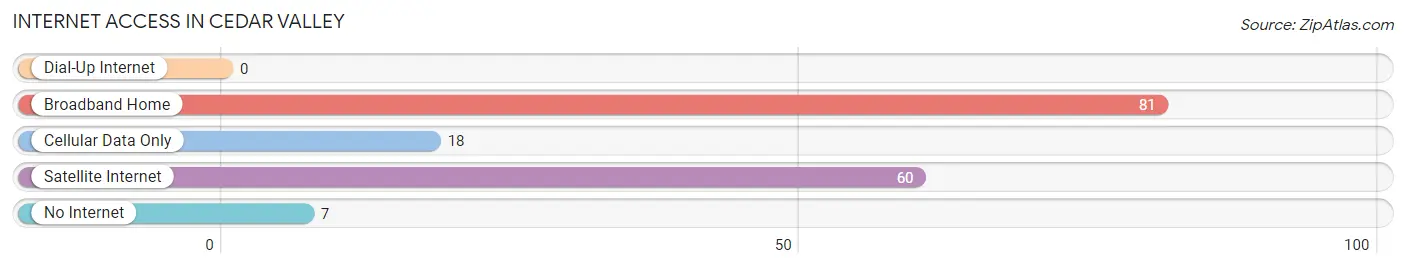
| Internet Type | # Households | % Households |
| Dial-Up Internet | 0 | 0.0% |
| Broadband Home | 81 | 42.4% |
| Cellular Data Only | 18 | 9.4% |
| Satellite Internet | 60 | 31.4% |
| No Internet | 7 | 3.7% |
| Total | 191 | 100.0% |
Cedar Valley Summary
Cedar Valley is a small unincorporated community located in the northeastern corner of Oklahoma, in the foothills of the Ozark Mountains. It is situated in Adair County, approximately 10 miles south of the Arkansas border. The town is home to a population of just over 200 people, and is known for its rural charm and small-town atmosphere.
History
The area that is now Cedar Valley was first settled in the late 1800s by a group of settlers from Arkansas. The settlers were attracted to the area due to its abundance of natural resources, including timber and water. The town was originally known as “Cedar Valley” due to the abundance of cedar trees in the area.
In the early 1900s, the town began to grow and develop. A post office was established in 1906, and a school was built in 1908. The town also had a general store, a blacksmith shop, and a cotton gin.
In the 1920s, the town experienced a period of growth and prosperity. The population increased to over 500 people, and the town had several businesses, including a bank, a hotel, and a movie theater.
In the 1930s, the Great Depression hit the town hard. Many of the businesses closed, and the population decreased to just over 200 people. The town was able to survive, however, and the population has remained relatively stable since then.
Geography
Cedar Valley is located in the foothills of the Ozark Mountains, in the northeastern corner of Oklahoma. The town is situated in Adair County, approximately 10 miles south of the Arkansas border. The town is surrounded by rolling hills and lush forests, and is home to a variety of wildlife, including deer, turkey, and other small game.
The town is located near several major highways, including Interstate 40, US Highway 59, and US Highway 412. The nearest major city is Tulsa, which is approximately 70 miles away.
Economy
The economy of Cedar Valley is largely based on agriculture and tourism. The town is home to several farms, which produce a variety of crops, including corn, soybeans, and wheat. The town also has several small businesses, including a general store, a gas station, and a restaurant.
Tourism is also an important part of the local economy. The town is home to several attractions, including a historic church, a museum, and a nature preserve. The town also hosts several annual events, including a Fourth of July celebration and a fall festival.
Demographics
As of the 2010 census, the population of Cedar Valley was 203 people. The racial makeup of the town was 97.5% White, 0.5% African American, 0.5% Native American, and 1.5% from other races. The median household income was $30,000, and the median age was 44 years.
Conclusion
Cedar Valley is a small unincorporated community located in the northeastern corner of Oklahoma. The town is home to a population of just over 200 people, and is known for its rural charm and small-town atmosphere. The economy of the town is largely based on agriculture and tourism, and the town is home to several attractions, including a historic church, a museum, and a nature preserve. The town is also home to a diverse population, with a median age of 44 years and a median household income of $30,000.
Common Questions
What is Per Capita Income in Cedar Valley?
Per Capita income in Cedar Valley is $55,823.
What is the Median Family Income in Cedar Valley?
Median Family Income in Cedar Valley is $124,213.
What is the Median Household income in Cedar Valley?
Median Household Income in Cedar Valley is $123,287.
What is Income or Wage Gap in Cedar Valley?
Income or Wage Gap in Cedar Valley is 26.0%.
Women in Cedar Valley earn 74.0 cents for every dollar earned by a man.
What is Inequality or Gini Index in Cedar Valley?
Inequality or Gini Index in Cedar Valley is 0.37.
What is the Total Population of Cedar Valley?
Total Population of Cedar Valley is 500.
What is the Total Male Population of Cedar Valley?
Total Male Population of Cedar Valley is 225.
What is the Total Female Population of Cedar Valley?
Total Female Population of Cedar Valley is 275.
What is the Ratio of Males per 100 Females in Cedar Valley?
There are 81.82 Males per 100 Females in Cedar Valley.
What is the Ratio of Females per 100 Males in Cedar Valley?
There are 122.22 Females per 100 Males in Cedar Valley.
What is the Median Population Age in Cedar Valley?
Median Population Age in Cedar Valley is 60.9 Years.
What is the Average Family Size in Cedar Valley
Average Family Size in Cedar Valley is 2.8 People.
What is the Average Household Size in Cedar Valley
Average Household Size in Cedar Valley is 2.6 People.
How Large is the Labor Force in Cedar Valley?
There are 184 People in the Labor Forcein in Cedar Valley.
What is the Percentage of People in the Labor Force in Cedar Valley?
40.8% of People are in the Labor Force in Cedar Valley.
What is the Unemployment Rate in Cedar Valley?
Unemployment Rate in Cedar Valley is 1.6%.