Catoosa, OK Map & Demographics
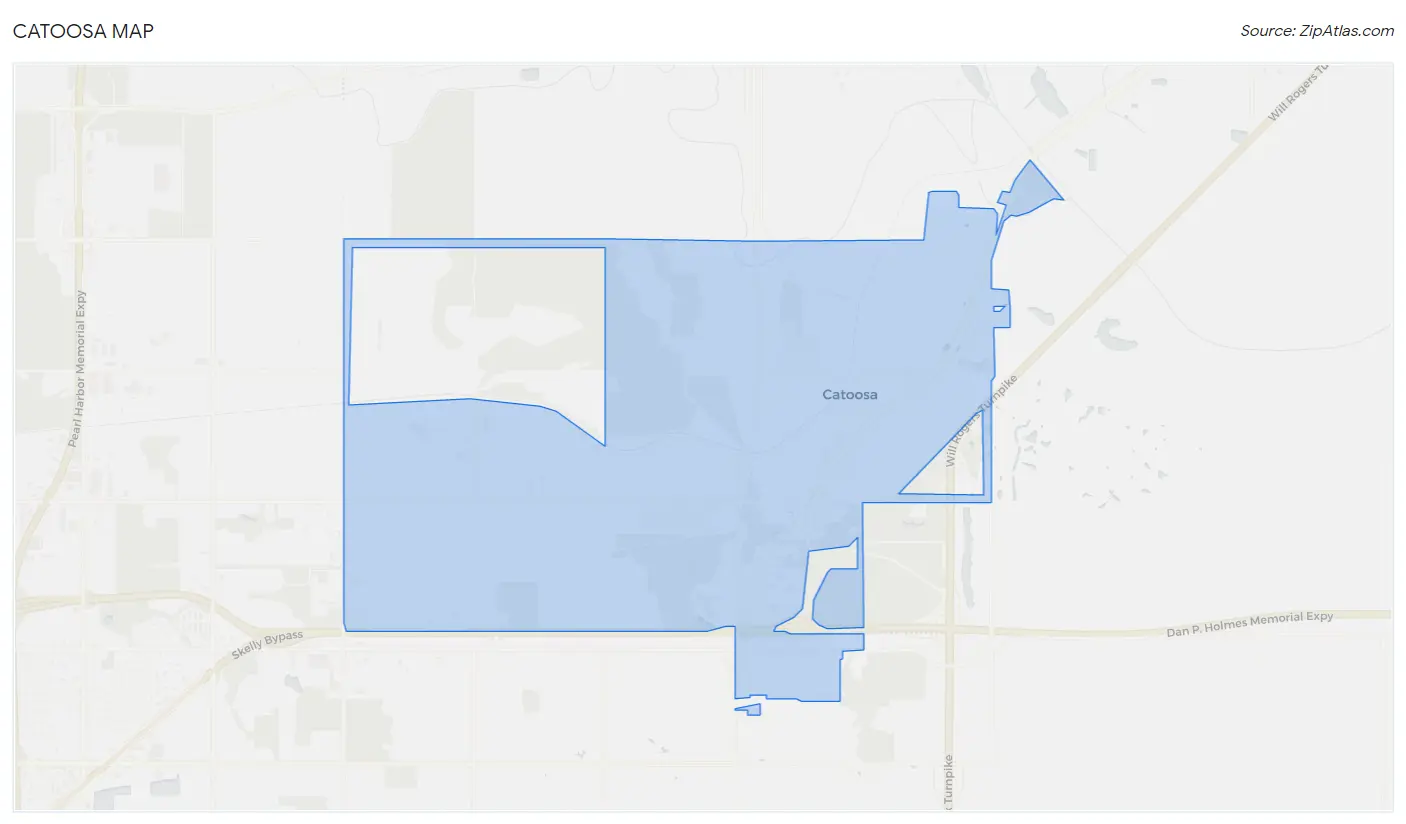
Catoosa Map
Catoosa Overview
$32,620
PER CAPITA INCOME
$78,446
AVG FAMILY INCOME
$67,143
AVG HOUSEHOLD INCOME
28.1%
WAGE / INCOME GAP [ % ]
71.9¢/ $1
WAGE / INCOME GAP [ $ ]
$11,236
FAMILY INCOME DEFICIT
0.40
INEQUALITY / GINI INDEX
7,680
TOTAL POPULATION
3,945
MALE POPULATION
3,735
FEMALE POPULATION
105.62
MALES / 100 FEMALES
94.68
FEMALES / 100 MALES
37.8
MEDIAN AGE
3.0
AVG FAMILY SIZE
2.5
AVG HOUSEHOLD SIZE
4,153
LABOR FORCE [ PEOPLE ]
66.6%
PERCENT IN LABOR FORCE
5.6%
UNEMPLOYMENT RATE
Catoosa Zip Codes
Catoosa Area Codes
Income in Catoosa
Income Overview in Catoosa
Per Capita Income in Catoosa is $32,620, while median incomes of families and households are $78,446 and $67,143 respectively.
| Characteristic | Number | Measure |
| Per Capita Income | 7,680 | $32,620 |
| Median Family Income | 1,953 | $78,446 |
| Mean Family Income | 1,953 | $90,047 |
| Median Household Income | 3,002 | $67,143 |
| Mean Household Income | 3,002 | $79,506 |
| Income Deficit | 1,953 | $11,236 |
| Wage / Income Gap (%) | 7,680 | 28.11% |
| Wage / Income Gap ($) | 7,680 | 71.89¢ per $1 |
| Gini / Inequality Index | 7,680 | 0.40 |
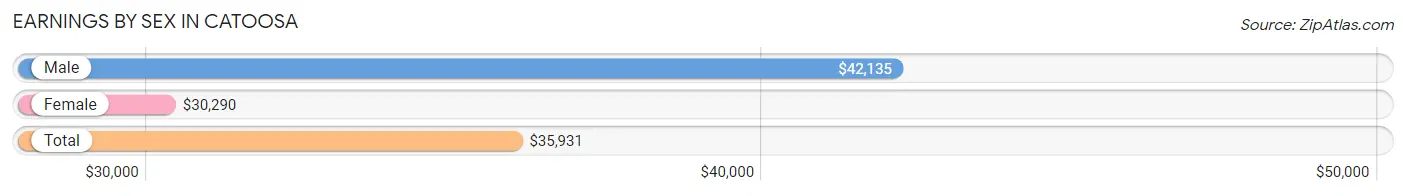
Earnings by Sex in Catoosa
Average Earnings in Catoosa are $35,931, $42,135 for men and $30,290 for women, a difference of 28.1%.
| Sex | Number | Average Earnings |
| Male | 2,350 (54.5%) | $42,135 |
| Female | 1,961 (45.5%) | $30,290 |
| Total | 4,311 (100.0%) | $35,931 |
Earnings by Sex by Income Bracket in Catoosa
The most common earnings brackets in Catoosa are $65,000 to $74,999 for men (232 | 9.9%) and $30,000 to $34,999 for women (163 | 8.3%).
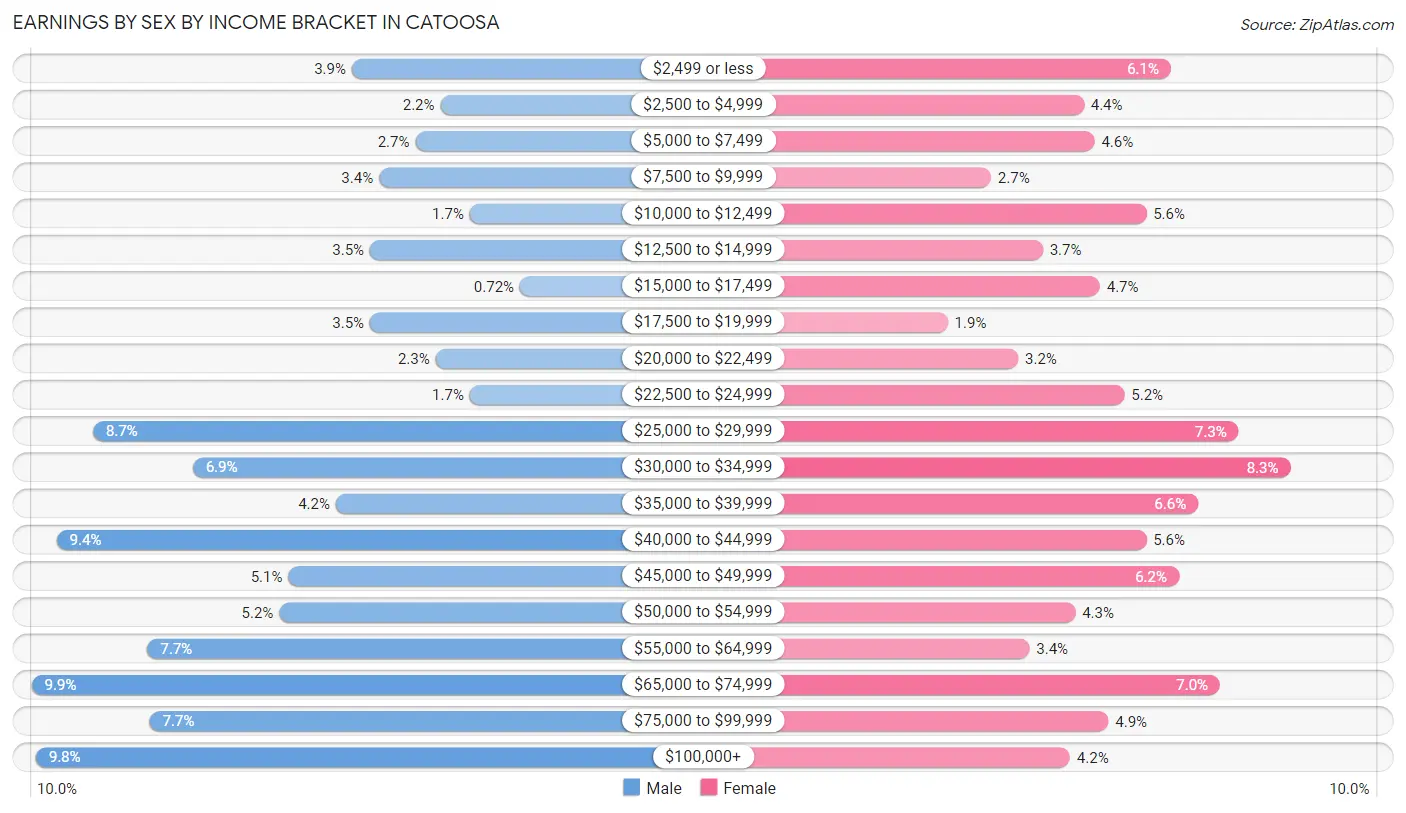
| Income | Male | Female |
| $2,499 or less | 91 (3.9%) | 119 (6.1%) |
| $2,500 to $4,999 | 52 (2.2%) | 87 (4.4%) |
| $5,000 to $7,499 | 63 (2.7%) | 91 (4.6%) |
| $7,500 to $9,999 | 79 (3.4%) | 53 (2.7%) |
| $10,000 to $12,499 | 39 (1.7%) | 110 (5.6%) |
| $12,500 to $14,999 | 83 (3.5%) | 72 (3.7%) |
| $15,000 to $17,499 | 17 (0.7%) | 93 (4.7%) |
| $17,500 to $19,999 | 83 (3.5%) | 37 (1.9%) |
| $20,000 to $22,499 | 54 (2.3%) | 63 (3.2%) |
| $22,500 to $24,999 | 39 (1.7%) | 102 (5.2%) |
| $25,000 to $29,999 | 205 (8.7%) | 144 (7.3%) |
| $30,000 to $34,999 | 161 (6.9%) | 163 (8.3%) |
| $35,000 to $39,999 | 98 (4.2%) | 129 (6.6%) |
| $40,000 to $44,999 | 221 (9.4%) | 110 (5.6%) |
| $45,000 to $49,999 | 119 (5.1%) | 122 (6.2%) |
| $50,000 to $54,999 | 123 (5.2%) | 84 (4.3%) |
| $55,000 to $64,999 | 181 (7.7%) | 67 (3.4%) |
| $65,000 to $74,999 | 232 (9.9%) | 137 (7.0%) |
| $75,000 to $99,999 | 180 (7.7%) | 96 (4.9%) |
| $100,000+ | 230 (9.8%) | 82 (4.2%) |
| Total | 2,350 (100.0%) | 1,961 (100.0%) |
Earnings by Sex by Educational Attainment in Catoosa
Average earnings in Catoosa are $45,675 for men and $34,503 for women, a difference of 24.5%. Men with an educational attainment of bachelor's degree enjoy the highest average annual earnings of $66,528, while those with high school diploma education earn the least with $42,452. Women with an educational attainment of bachelor's degree earn the most with the average annual earnings of $58,125, while those with less than high school education have the smallest earnings of $13,750.
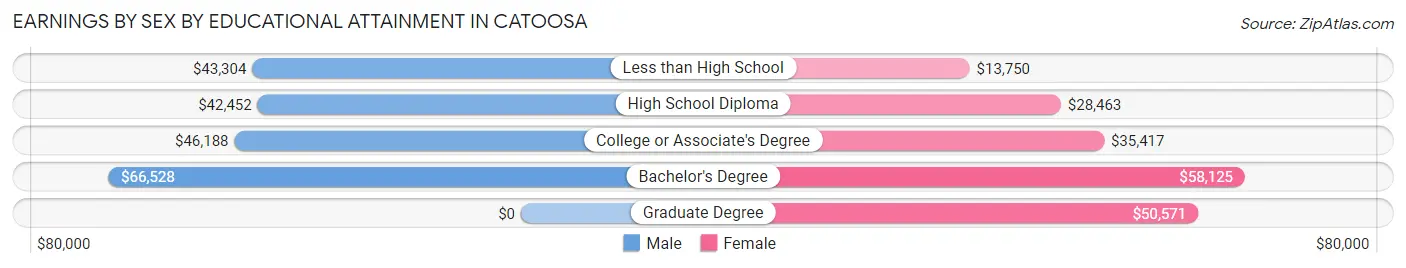
| Educational Attainment | Male Income | Female Income |
| Less than High School | $43,304 | $13,750 |
| High School Diploma | $42,452 | $28,463 |
| College or Associate's Degree | $46,188 | $35,417 |
| Bachelor's Degree | $66,528 | $58,125 |
| Graduate Degree | - | - |
| Total | $45,675 | $34,503 |
Family Income in Catoosa
Family Income Brackets in Catoosa
According to the Catoosa family income data, there are 424 families falling into the $75,000 to $99,999 income range, which is the most common income bracket and makes up 21.7% of all families. Conversely, the less than $10,000 income bracket is the least frequent group with only 57 families (2.9%) belonging to this category.
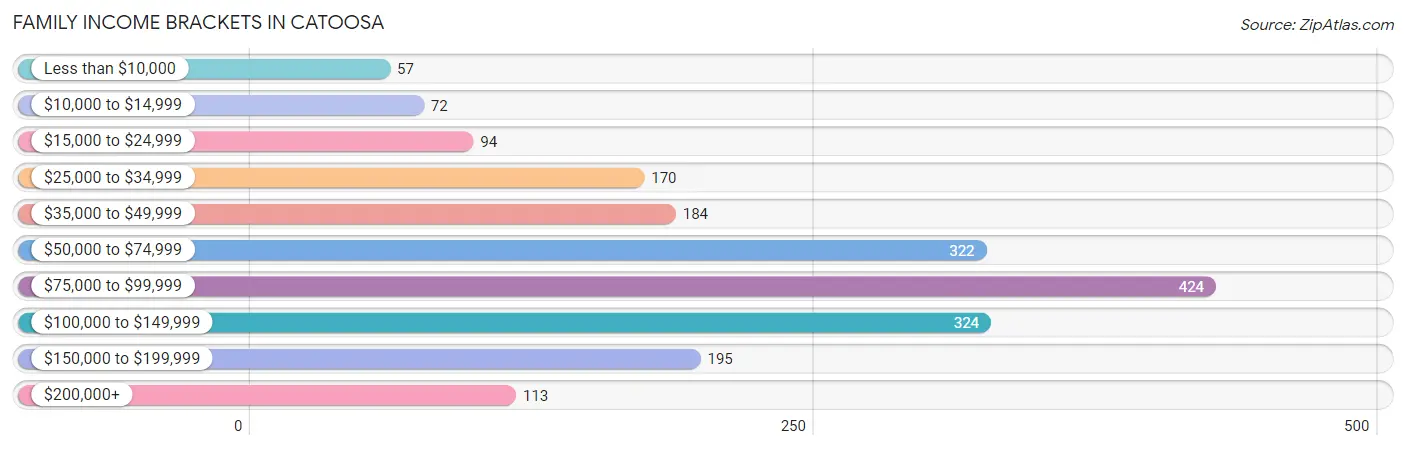
| Income Bracket | # Families | % Families |
| Less than $10,000 | 57 | 2.9% |
| $10,000 to $14,999 | 72 | 3.7% |
| $15,000 to $24,999 | 94 | 4.8% |
| $25,000 to $34,999 | 170 | 8.7% |
| $35,000 to $49,999 | 184 | 9.4% |
| $50,000 to $74,999 | 322 | 16.5% |
| $75,000 to $99,999 | 424 | 21.7% |
| $100,000 to $149,999 | 324 | 16.6% |
| $150,000 to $199,999 | 195 | 10.0% |
| $200,000+ | 113 | 5.8% |
Family Income by Famaliy Size in Catoosa
5-person families (118 | 6.0%) account for the highest median family income in Catoosa with $108,478 per family, while 2-person families (909 | 46.5%) have the highest median income of $38,824 per family member.
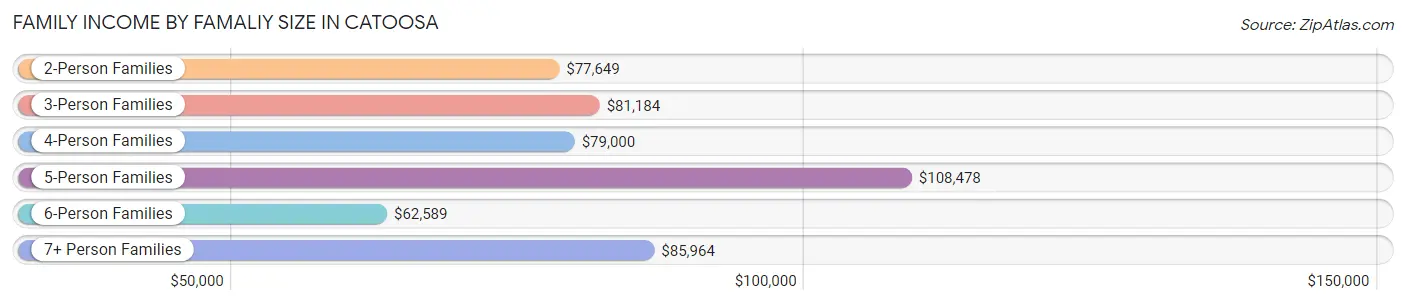
| Income Bracket | # Families | Median Income |
| 2-Person Families | 909 (46.5%) | $77,649 |
| 3-Person Families | 430 (22.0%) | $81,184 |
| 4-Person Families | 354 (18.1%) | $79,000 |
| 5-Person Families | 118 (6.0%) | $108,478 |
| 6-Person Families | 99 (5.1%) | $62,589 |
| 7+ Person Families | 43 (2.2%) | $85,964 |
| Total | 1,953 (100.0%) | $78,446 |
Family Income by Number of Earners in Catoosa
The median family income in Catoosa is $78,446, with families comprising 3+ earners (247) having the highest median family income of $117,596, while families with no earners (145) have the lowest median family income of $27,625, accounting for 12.7% and 7.4% of families, respectively.
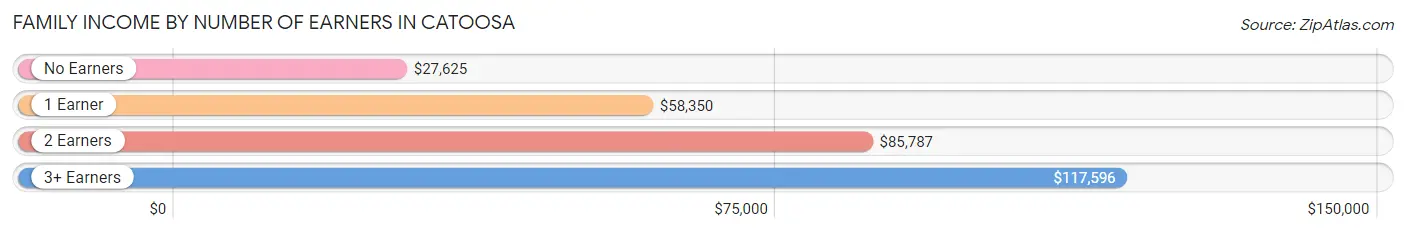
| Number of Earners | # Families | Median Income |
| No Earners | 145 (7.4%) | $27,625 |
| 1 Earner | 806 (41.3%) | $58,350 |
| 2 Earners | 755 (38.7%) | $85,787 |
| 3+ Earners | 247 (12.7%) | $117,596 |
| Total | 1,953 (100.0%) | $78,446 |
Household Income in Catoosa
Household Income Brackets in Catoosa
With 603 households falling in the category, the $50,000 to $74,999 income range is the most frequent in Catoosa, accounting for 20.1% of all households. In contrast, only 93 households (3.1%) fall into the less than $10,000 income bracket, making it the least populous group.
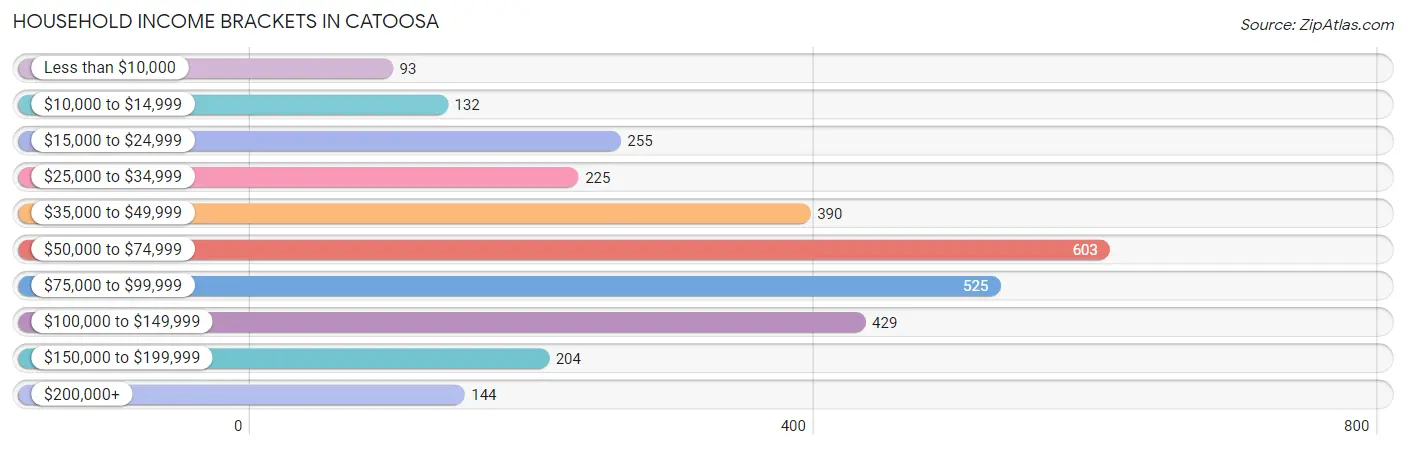
| Income Bracket | # Households | % Households |
| Less than $10,000 | 93 | 3.1% |
| $10,000 to $14,999 | 132 | 4.4% |
| $15,000 to $24,999 | 255 | 8.5% |
| $25,000 to $34,999 | 225 | 7.5% |
| $35,000 to $49,999 | 390 | 13.0% |
| $50,000 to $74,999 | 603 | 20.1% |
| $75,000 to $99,999 | 525 | 17.5% |
| $100,000 to $149,999 | 429 | 14.3% |
| $150,000 to $199,999 | 204 | 6.8% |
| $200,000+ | 144 | 4.8% |
Household Income by Householder Age in Catoosa
The median household income in Catoosa is $67,143, with the highest median household income of $75,096 found in the 45 to 64 years age bracket for the primary householder. A total of 1,133 households (37.7%) fall into this category. Meanwhile, the 25 to 44 years age bracket for the primary householder has the lowest median household income of $59,734, with 1,040 households (34.6%) in this group.
| Income Bracket | # Households | Median Income |
| 15 to 24 Years | 139 (4.6%) | $61,250 |
| 25 to 44 Years | 1,040 (34.6%) | $59,734 |
| 45 to 64 Years | 1,133 (37.7%) | $75,096 |
| 65+ Years | 690 (23.0%) | $68,043 |
| Total | 3,002 (100.0%) | $67,143 |
Poverty in Catoosa
Income Below Poverty by Sex and Age in Catoosa
With 12.6% poverty level for males and 18.3% for females among the residents of Catoosa, 12 to 14 year old males and 5 year old females are the most vulnerable to poverty, with 43 males (28.3%) and 47 females (62.7%) in their respective age groups living below the poverty level.
| Age Bracket | Male | Female |
| Under 5 Years | 16 (14.5%) | 35 (19.6%) |
| 5 Years | 6 (24.0%) | 47 (62.7%) |
| 6 to 11 Years | 111 (27.7%) | 35 (17.0%) |
| 12 to 14 Years | 43 (28.3%) | 16 (11.8%) |
| 15 Years | 6 (16.7%) | 12 (23.1%) |
| 16 and 17 Years | 18 (18.0%) | 28 (31.5%) |
| 18 to 24 Years | 31 (8.0%) | 103 (23.8%) |
| 25 to 34 Years | 49 (8.4%) | 116 (24.0%) |
| 35 to 44 Years | 134 (24.3%) | 134 (24.1%) |
| 45 to 54 Years | 15 (3.0%) | 58 (13.0%) |
| 55 to 64 Years | 41 (8.5%) | 40 (8.2%) |
| 65 to 74 Years | 0 (0.0%) | 6 (2.4%) |
| 75 Years and over | 19 (7.1%) | 41 (15.1%) |
| Total | 489 (12.6%) | 671 (18.3%) |
Income Above Poverty by Sex and Age in Catoosa
According to the poverty statistics in Catoosa, males aged 65 to 74 years and females aged 65 to 74 years are the age groups that are most secure financially, with 100.0% of males and 97.6% of females in these age groups living above the poverty line.
| Age Bracket | Male | Female |
| Under 5 Years | 94 (85.5%) | 144 (80.4%) |
| 5 Years | 19 (76.0%) | 28 (37.3%) |
| 6 to 11 Years | 290 (72.3%) | 171 (83.0%) |
| 12 to 14 Years | 109 (71.7%) | 120 (88.2%) |
| 15 Years | 30 (83.3%) | 40 (76.9%) |
| 16 and 17 Years | 82 (82.0%) | 61 (68.5%) |
| 18 to 24 Years | 359 (92.0%) | 330 (76.2%) |
| 25 to 34 Years | 537 (91.6%) | 367 (76.0%) |
| 35 to 44 Years | 418 (75.7%) | 421 (75.9%) |
| 45 to 54 Years | 489 (97.0%) | 390 (87.1%) |
| 55 to 64 Years | 444 (91.5%) | 448 (91.8%) |
| 65 to 74 Years | 260 (100.0%) | 242 (97.6%) |
| 75 Years and over | 248 (92.9%) | 231 (84.9%) |
| Total | 3,379 (87.4%) | 2,993 (81.7%) |
Income Below Poverty Among Married-Couple Families in Catoosa
The poverty statistics for married-couple families in Catoosa show that 5.5% or 79 of the total 1,425 families live below the poverty line. Families with 5 or more children have the highest poverty rate of 100.0%, comprising of 7 families. On the other hand, families with 1 or 2 children have the lowest poverty rate of 2.7%, which includes 11 families.
| Children | Above Poverty | Below Poverty |
| No Children | 842 (97.1%) | 25 (2.9%) |
| 1 or 2 Children | 393 (97.3%) | 11 (2.7%) |
| 3 or 4 Children | 111 (75.5%) | 36 (24.5%) |
| 5 or more Children | 0 (0.0%) | 7 (100.0%) |
| Total | 1,346 (94.5%) | 79 (5.5%) |
Income Below Poverty Among Single-Parent Households in Catoosa
According to the poverty data in Catoosa, 28.4% or 40 single-father households and 32.0% or 124 single-mother households are living below the poverty line. Among single-father households, those with 1 or 2 children have the highest poverty rate, with 23 households (36.5%) experiencing poverty. Likewise, among single-mother households, those with 3 or 4 children have the highest poverty rate, with 36 households (48.0%) falling below the poverty line.
| Children | Single Father | Single Mother |
| No Children | 17 (27.4%) | 0 (0.0%) |
| 1 or 2 Children | 23 (36.5%) | 88 (36.4%) |
| 3 or 4 Children | 0 (0.0%) | 36 (48.0%) |
| 5 or more Children | 0 (0.0%) | 0 (0.0%) |
| Total | 40 (28.4%) | 124 (32.0%) |
Income Below Poverty Among Married-Couple vs Single-Parent Households in Catoosa
The poverty data for Catoosa shows that 79 of the married-couple family households (5.5%) and 164 of the single-parent households (31.1%) are living below the poverty level. Within the married-couple family households, those with 5 or more children have the highest poverty rate, with 7 households (100.0%) falling below the poverty line. Among the single-parent households, those with 3 or 4 children have the highest poverty rate, with 36 household (39.6%) living below poverty.
| Children | Married-Couple Families | Single-Parent Households |
| No Children | 25 (2.9%) | 17 (12.9%) |
| 1 or 2 Children | 11 (2.7%) | 111 (36.4%) |
| 3 or 4 Children | 36 (24.5%) | 36 (39.6%) |
| 5 or more Children | 7 (100.0%) | 0 (0.0%) |
| Total | 79 (5.5%) | 164 (31.1%) |
Race in Catoosa
The most populous races in Catoosa are White / Caucasian (4,811 | 62.6%), Two or more Races (1,299 | 16.9%), and Native / Alaskan (1,051 | 13.7%).
| Race | # Population | % Population |
| Asian | 111 | 1.5% |
| Black / African American | 143 | 1.9% |
| Hawaiian / Pacific | 0 | 0.0% |
| Hispanic or Latino | 1,037 | 13.5% |
| Native / Alaskan | 1,051 | 13.7% |
| White / Caucasian | 4,811 | 62.6% |
| Two or more Races | 1,299 | 16.9% |
| Some other Race | 265 | 3.5% |
| Total | 7,680 | 100.0% |
Ancestry in Catoosa
The most populous ancestries reported in Catoosa are Cherokee (1,430 | 18.6%), German (971 | 12.6%), Mexican (733 | 9.5%), American (655 | 8.5%), and Irish (638 | 8.3%), together accounting for 57.6% of all Catoosa residents.
| Ancestry | # Population | % Population |
| African | 18 | 0.2% |
| American | 655 | 8.5% |
| Apache | 13 | 0.2% |
| Arab | 8 | 0.1% |
| Argentinean | 8 | 0.1% |
| Bangladeshi | 93 | 1.2% |
| Belgian | 5 | 0.1% |
| Blackfeet | 15 | 0.2% |
| Bolivian | 18 | 0.2% |
| British | 99 | 1.3% |
| Central American | 35 | 0.5% |
| Cherokee | 1,430 | 18.6% |
| Cheyenne | 6 | 0.1% |
| Chickasaw | 52 | 0.7% |
| Choctaw | 180 | 2.3% |
| Colombian | 44 | 0.6% |
| Comanche | 6 | 0.1% |
| Creek | 71 | 0.9% |
| Cuban | 17 | 0.2% |
| Czech | 13 | 0.2% |
| Czechoslovakian | 23 | 0.3% |
| Danish | 7 | 0.1% |
| Delaware | 25 | 0.3% |
| Dominican | 11 | 0.1% |
| Dutch | 106 | 1.4% |
| Dutch West Indian | 14 | 0.2% |
| English | 604 | 7.9% |
| European | 107 | 1.4% |
| French | 96 | 1.3% |
| French Canadian | 87 | 1.1% |
| German | 971 | 12.6% |
| Greek | 24 | 0.3% |
| Honduran | 20 | 0.3% |
| Irish | 638 | 8.3% |
| Iroquois | 18 | 0.2% |
| Italian | 135 | 1.8% |
| Kiowa | 9 | 0.1% |
| Korean | 51 | 0.7% |
| Lebanese | 8 | 0.1% |
| Mexican | 733 | 9.5% |
| Nicaraguan | 15 | 0.2% |
| Norwegian | 24 | 0.3% |
| Osage | 61 | 0.8% |
| Peruvian | 6 | 0.1% |
| Polish | 69 | 0.9% |
| Portuguese | 14 | 0.2% |
| Potawatomi | 8 | 0.1% |
| Puerto Rican | 28 | 0.4% |
| Scandinavian | 25 | 0.3% |
| Scotch-Irish | 139 | 1.8% |
| Scottish | 170 | 2.2% |
| South American | 76 | 1.0% |
| Spaniard | 29 | 0.4% |
| Spanish | 39 | 0.5% |
| Subsaharan African | 18 | 0.2% |
| Swedish | 21 | 0.3% |
| Swiss | 3 | 0.0% |
| Thai | 12 | 0.2% |
| Ukrainian | 10 | 0.1% |
| Welsh | 18 | 0.2% | View All 60 Rows |
Immigrants in Catoosa
The most numerous immigrant groups reported in Catoosa came from Latin America (351 | 4.6%), Central America (249 | 3.2%), Mexico (235 | 3.1%), Caribbean (52 | 0.7%), and South America (50 | 0.6%), together accounting for 12.2% of all Catoosa residents.
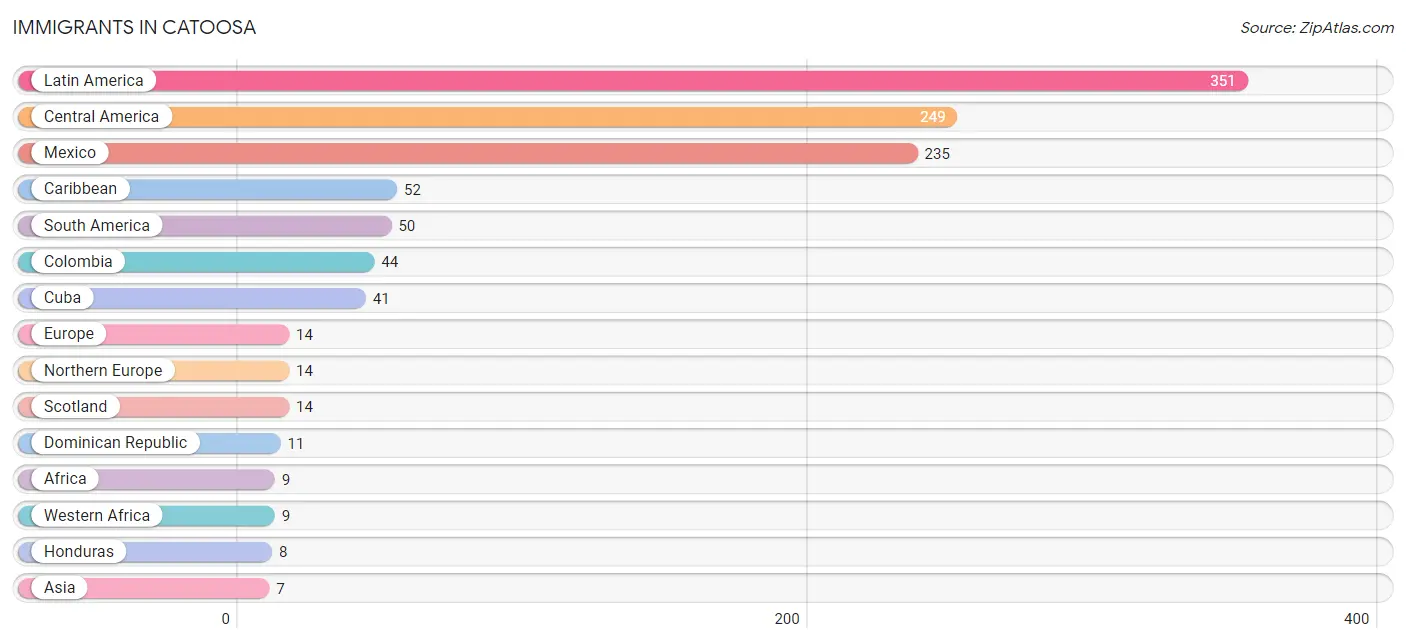
| Immigration Origin | # Population | % Population |
| Africa | 9 | 0.1% |
| Asia | 7 | 0.1% |
| Caribbean | 52 | 0.7% |
| Central America | 249 | 3.2% |
| Colombia | 44 | 0.6% |
| Cuba | 41 | 0.5% |
| Dominican Republic | 11 | 0.1% |
| Europe | 14 | 0.2% |
| Ghana | 5 | 0.1% |
| Honduras | 8 | 0.1% |
| Laos | 7 | 0.1% |
| Latin America | 351 | 4.6% |
| Mexico | 235 | 3.1% |
| Nicaragua | 6 | 0.1% |
| Nigeria | 4 | 0.1% |
| Northern Europe | 14 | 0.2% |
| Peru | 6 | 0.1% |
| Scotland | 14 | 0.2% |
| South America | 50 | 0.6% |
| South Eastern Asia | 7 | 0.1% |
| Western Africa | 9 | 0.1% | View All 21 Rows |
Sex and Age in Catoosa
Sex and Age in Catoosa
The most populous age groups in Catoosa are 20 to 24 Years (348 | 8.8%) for men and 55 to 59 Years (340 | 9.1%) for women.
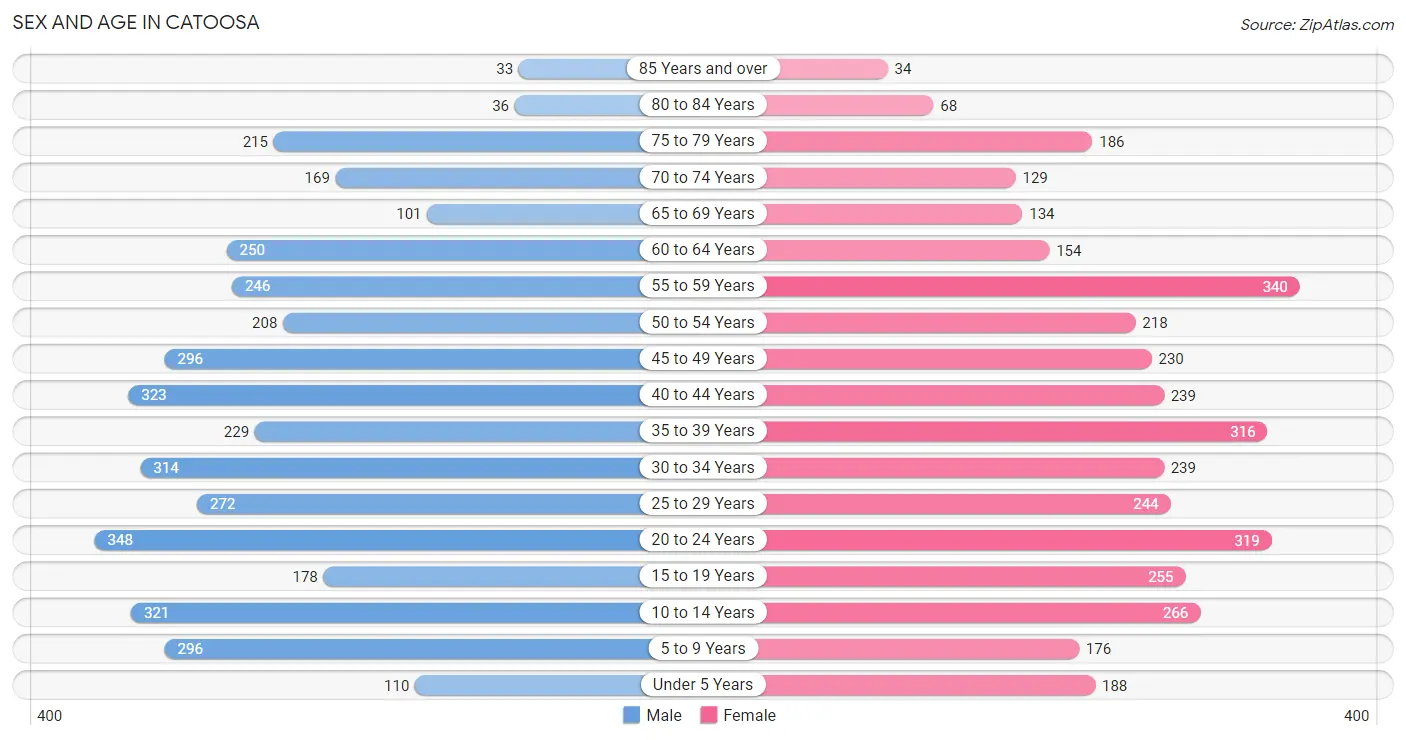
| Age Bracket | Male | Female |
| Under 5 Years | 110 (2.8%) | 188 (5.0%) |
| 5 to 9 Years | 296 (7.5%) | 176 (4.7%) |
| 10 to 14 Years | 321 (8.1%) | 266 (7.1%) |
| 15 to 19 Years | 178 (4.5%) | 255 (6.8%) |
| 20 to 24 Years | 348 (8.8%) | 319 (8.5%) |
| 25 to 29 Years | 272 (6.9%) | 244 (6.5%) |
| 30 to 34 Years | 314 (8.0%) | 239 (6.4%) |
| 35 to 39 Years | 229 (5.8%) | 316 (8.5%) |
| 40 to 44 Years | 323 (8.2%) | 239 (6.4%) |
| 45 to 49 Years | 296 (7.5%) | 230 (6.2%) |
| 50 to 54 Years | 208 (5.3%) | 218 (5.8%) |
| 55 to 59 Years | 246 (6.2%) | 340 (9.1%) |
| 60 to 64 Years | 250 (6.3%) | 154 (4.1%) |
| 65 to 69 Years | 101 (2.6%) | 134 (3.6%) |
| 70 to 74 Years | 169 (4.3%) | 129 (3.5%) |
| 75 to 79 Years | 215 (5.4%) | 186 (5.0%) |
| 80 to 84 Years | 36 (0.9%) | 68 (1.8%) |
| 85 Years and over | 33 (0.8%) | 34 (0.9%) |
| Total | 3,945 (100.0%) | 3,735 (100.0%) |
Families and Households in Catoosa
Median Family Size in Catoosa
The median family size in Catoosa is 3.05 persons per family, with single female/mother families (387 | 19.8%) accounting for the largest median family size of 3.3 persons per family. On the other hand, single male/father families (141 | 7.2%) represent the smallest median family size with 2.78 persons per family.
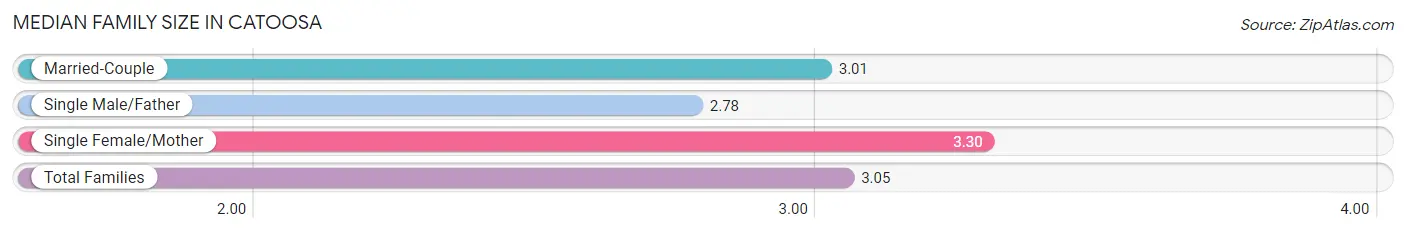
| Family Type | # Families | Family Size |
| Married-Couple | 1,425 (73.0%) | 3.01 |
| Single Male/Father | 141 (7.2%) | 2.78 |
| Single Female/Mother | 387 (19.8%) | 3.30 |
| Total Families | 1,953 (100.0%) | 3.05 |
Median Household Size in Catoosa
The median household size in Catoosa is 2.53 persons per household, with single female/mother households (387 | 12.9%) accounting for the largest median household size of 3.57 persons per household. non-family households (1,049 | 34.9%) represent the smallest median household size with 1.32 persons per household.
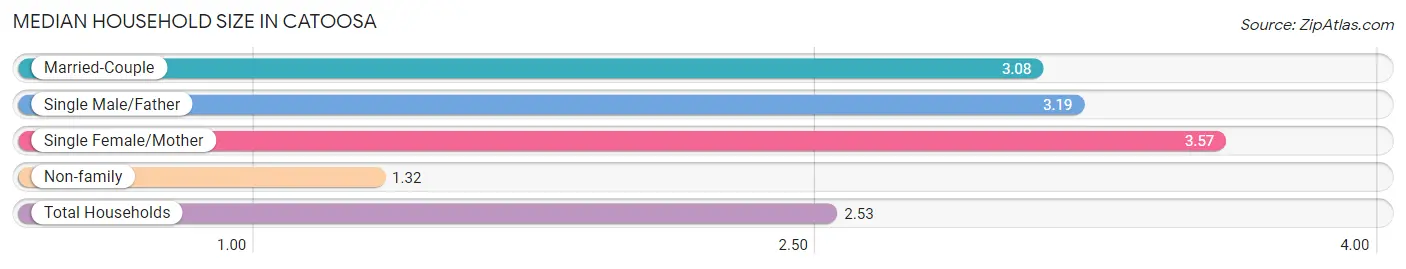
| Household Type | # Households | Household Size |
| Married-Couple | 1,425 (47.5%) | 3.08 |
| Single Male/Father | 141 (4.7%) | 3.19 |
| Single Female/Mother | 387 (12.9%) | 3.57 |
| Non-family | 1,049 (34.9%) | 1.32 |
| Total Households | 3,002 (100.0%) | 2.53 |
Household Size by Marriage Status in Catoosa
Out of a total of 3,002 households in Catoosa, 1,953 (65.1%) are family households, while 1,049 (34.9%) are nonfamily households. The most numerous type of family households are 2-person households, comprising 830, and the most common type of nonfamily households are 1-person households, comprising 817.
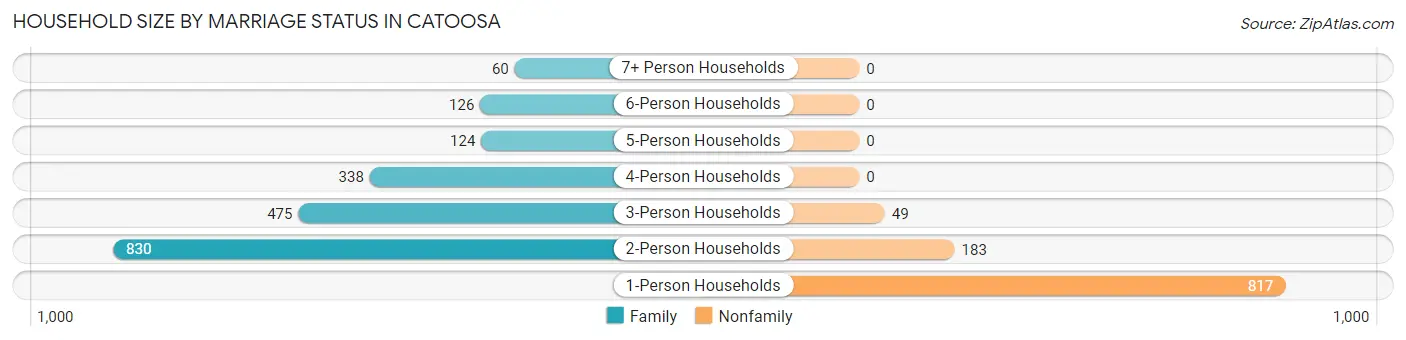
| Household Size | Family Households | Nonfamily Households |
| 1-Person Households | - | 817 (27.2%) |
| 2-Person Households | 830 (27.7%) | 183 (6.1%) |
| 3-Person Households | 475 (15.8%) | 49 (1.6%) |
| 4-Person Households | 338 (11.3%) | 0 (0.0%) |
| 5-Person Households | 124 (4.1%) | 0 (0.0%) |
| 6-Person Households | 126 (4.2%) | 0 (0.0%) |
| 7+ Person Households | 60 (2.0%) | 0 (0.0%) |
| Total | 1,953 (65.1%) | 1,049 (34.9%) |
Female Fertility in Catoosa
Fertility by Age in Catoosa
Average fertility rate in Catoosa is 46.0 births per 1,000 women. Women in the age bracket of 20 to 34 years have the highest fertility rate with 57.0 births per 1,000 women. Women in the age bracket of 20 to 34 years acount for 51.7% of all women with births.
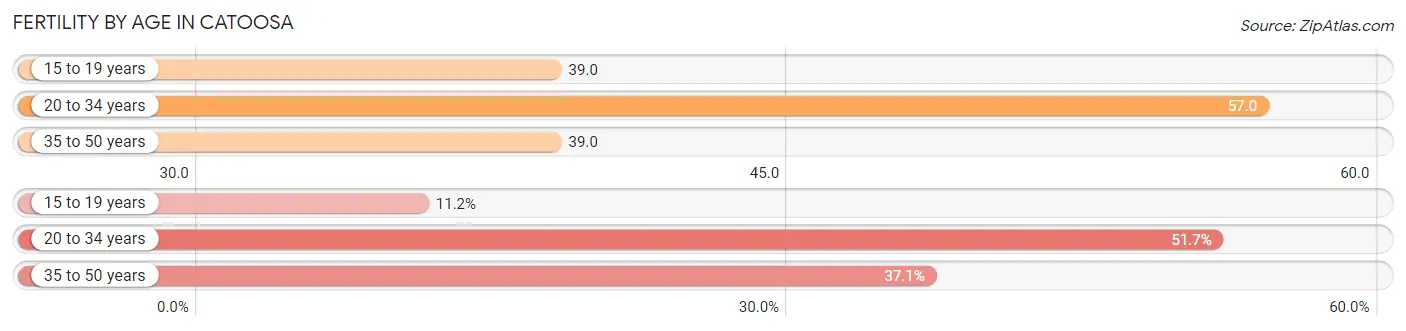
| Age Bracket | Women with Births | Births / 1,000 Women |
| 15 to 19 years | 10 (11.2%) | 39.0 |
| 20 to 34 years | 46 (51.7%) | 57.0 |
| 35 to 50 years | 33 (37.1%) | 39.0 |
| Total | 89 (100.0%) | 46.0 |
Fertility by Age by Marriage Status in Catoosa
69.7% of women with births (89) in Catoosa are married. The highest percentage of unmarried women with births falls into 20 to 34 years age bracket with 47.8% of them unmarried at the time of birth, while the lowest percentage of unmarried women with births belong to 15 to 19 years age bracket with 0.0% of them unmarried.
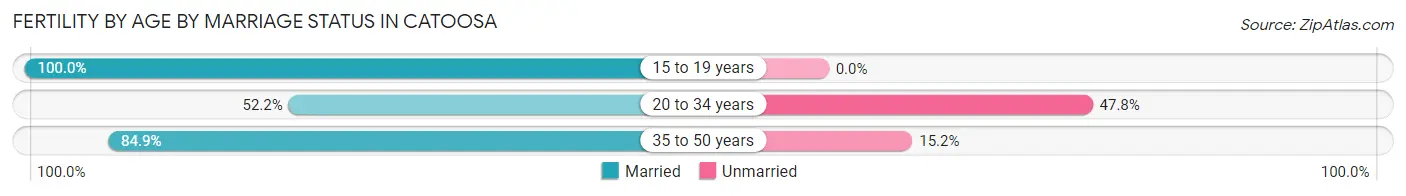
| Age Bracket | Married | Unmarried |
| 15 to 19 years | 10 (100.0%) | 0 (0.0%) |
| 20 to 34 years | 24 (52.2%) | 22 (47.8%) |
| 35 to 50 years | 28 (84.9%) | 5 (15.1%) |
| Total | 62 (69.7%) | 27 (30.3%) |
Fertility by Education in Catoosa
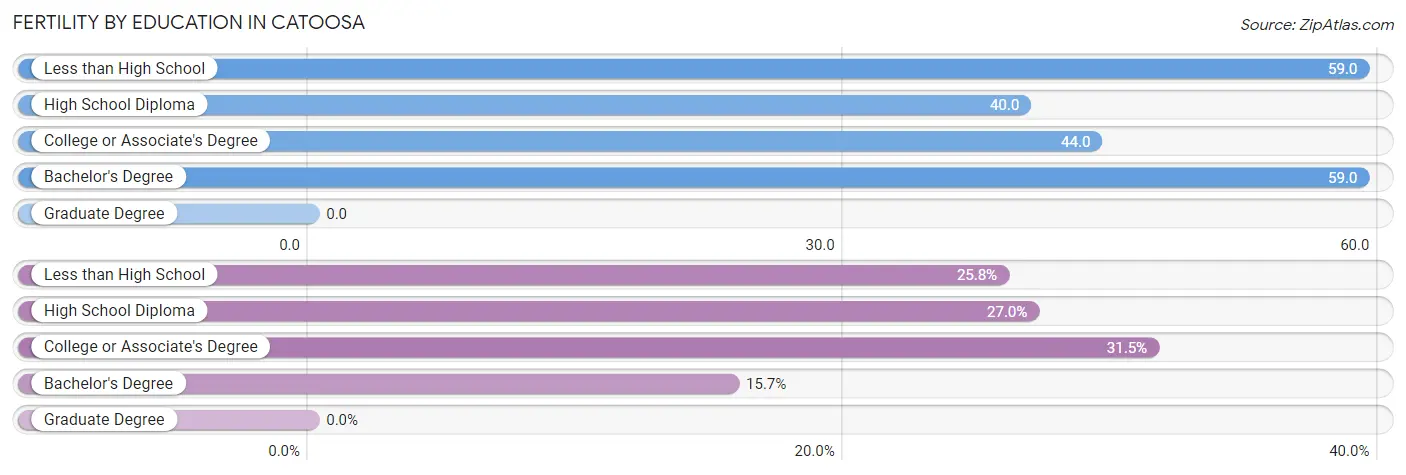
| Educational Attainment | Women with Births | Births / 1,000 Women |
| Less than High School | 23 (25.8%) | 59.0 |
| High School Diploma | 24 (27.0%) | 40.0 |
| College or Associate's Degree | 28 (31.5%) | 44.0 |
| Bachelor's Degree | 14 (15.7%) | 59.0 |
| Graduate Degree | 0 (0.0%) | 0.0 |
| Total | 89 (100.0%) | 46.0 |
Fertility by Education by Marriage Status in Catoosa
30.3% of women with births in Catoosa are unmarried. Women with the educational attainment of bachelor's degree are most likely to be married with 100.0% of them married at childbirth, while women with the educational attainment of college or associate's degree are least likely to be married with 60.7% of them unmarried at childbirth.
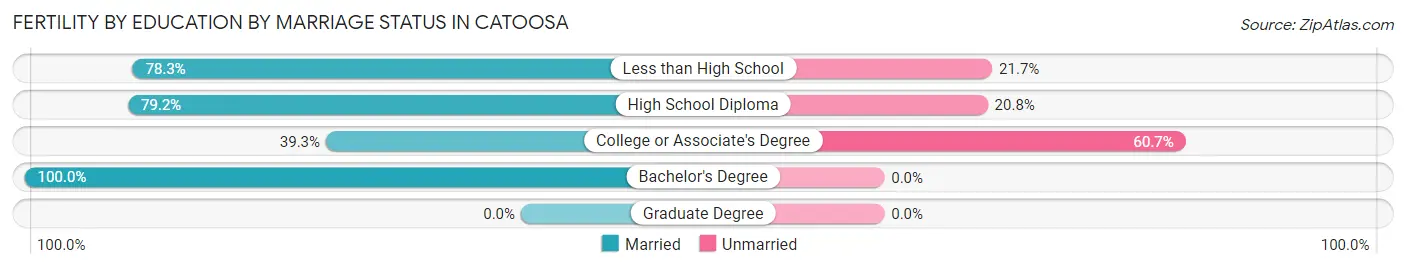
| Educational Attainment | Married | Unmarried |
| Less than High School | 18 (78.3%) | 5 (21.7%) |
| High School Diploma | 19 (79.2%) | 5 (20.8%) |
| College or Associate's Degree | 11 (39.3%) | 17 (60.7%) |
| Bachelor's Degree | 14 (100.0%) | 0 (0.0%) |
| Graduate Degree | 0 (0.0%) | 0 (0.0%) |
| Total | 62 (69.7%) | 27 (30.3%) |
Employment Characteristics in Catoosa
Employment by Class of Employer in Catoosa
Among the 3,860 employed individuals in Catoosa, private company employees (2,954 | 76.5%), not-for-profit organizations (289 | 7.5%), and self-employed (not incorporated) (177 | 4.6%) make up the most common classes of employment.
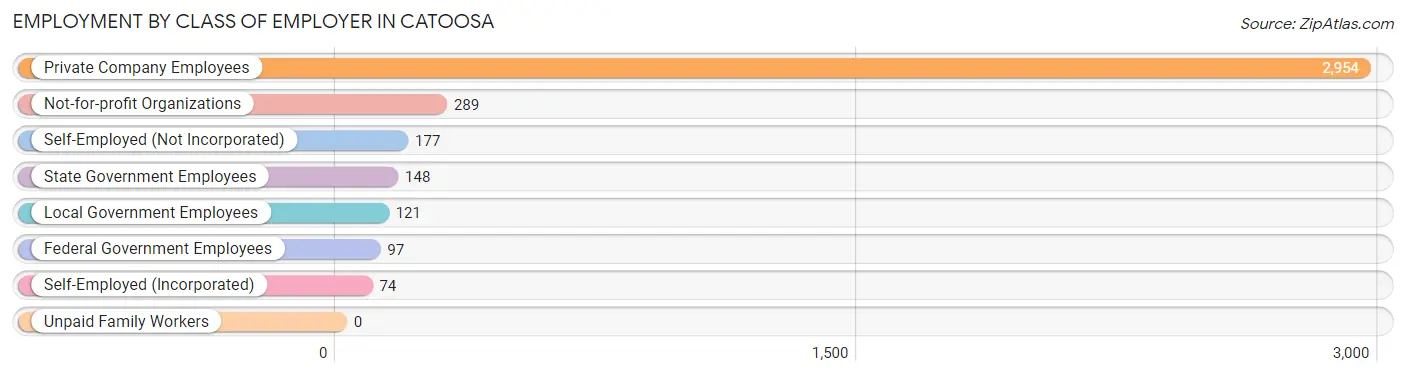
| Employer Class | # Employees | % Employees |
| Private Company Employees | 2,954 | 76.5% |
| Self-Employed (Incorporated) | 74 | 1.9% |
| Self-Employed (Not Incorporated) | 177 | 4.6% |
| Not-for-profit Organizations | 289 | 7.5% |
| Local Government Employees | 121 | 3.1% |
| State Government Employees | 148 | 3.8% |
| Federal Government Employees | 97 | 2.5% |
| Unpaid Family Workers | 0 | 0.0% |
| Total | 3,860 | 100.0% |
Employment Status by Age in Catoosa
According to the labor force statistics for Catoosa, out of the total population over 16 years of age (6,235), 66.6% or 4,153 individuals are in the labor force, with 5.6% or 233 of them unemployed. The age group with the highest labor force participation rate is 45 to 54 years, with 88.1% or 839 individuals in the labor force. Within the labor force, the 16 to 19 years age range has the highest percentage of unemployed individuals, with 37.7% or 60 of them being unemployed.
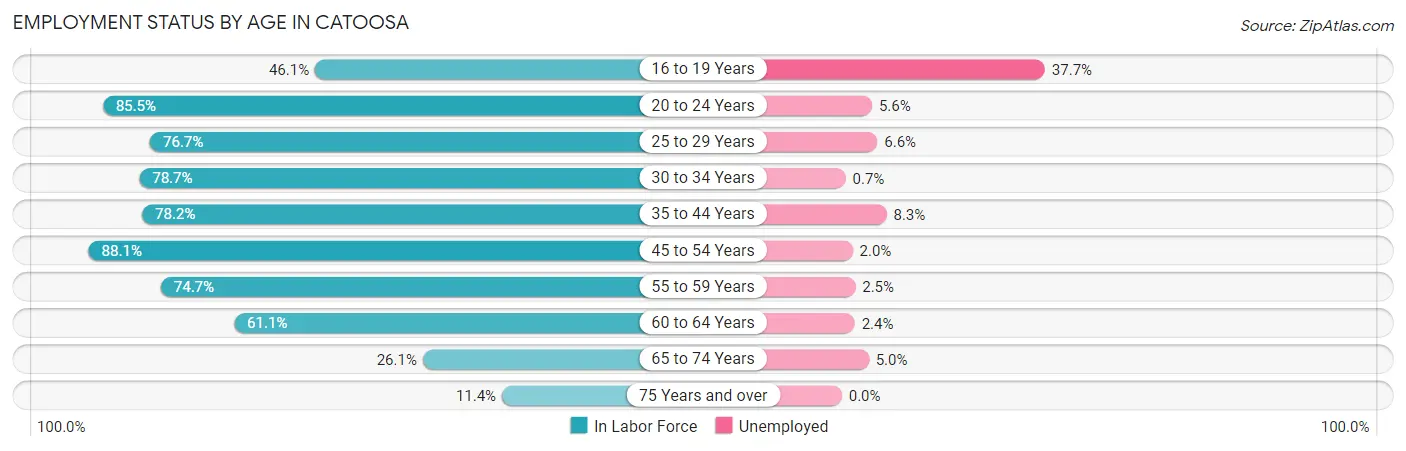
| Age Bracket | In Labor Force | Unemployed |
| 16 to 19 Years | 159 (46.1%) | 60 (37.7%) |
| 20 to 24 Years | 570 (85.5%) | 32 (5.6%) |
| 25 to 29 Years | 396 (76.7%) | 26 (6.6%) |
| 30 to 34 Years | 435 (78.7%) | 3 (0.7%) |
| 35 to 44 Years | 866 (78.2%) | 72 (8.3%) |
| 45 to 54 Years | 839 (88.1%) | 17 (2.0%) |
| 55 to 59 Years | 438 (74.7%) | 11 (2.5%) |
| 60 to 64 Years | 247 (61.1%) | 6 (2.4%) |
| 65 to 74 Years | 139 (26.1%) | 7 (5.0%) |
| 75 Years and over | 65 (11.4%) | 0 (0.0%) |
| Total | 4,153 (66.6%) | 233 (5.6%) |
Employment Status by Educational Attainment in Catoosa
According to labor force statistics for Catoosa, 78.2% of individuals (3,220) out of the total population between 25 and 64 years of age (4,118) are in the labor force, with 4.2% or 135 of them being unemployed. The group with the highest labor force participation rate are those with the educational attainment of bachelor's degree or higher, with 89.3% or 623 individuals in the labor force. Within the labor force, individuals with less than high school education have the highest percentage of unemployment, with 13.8% or 48 of them being unemployed.
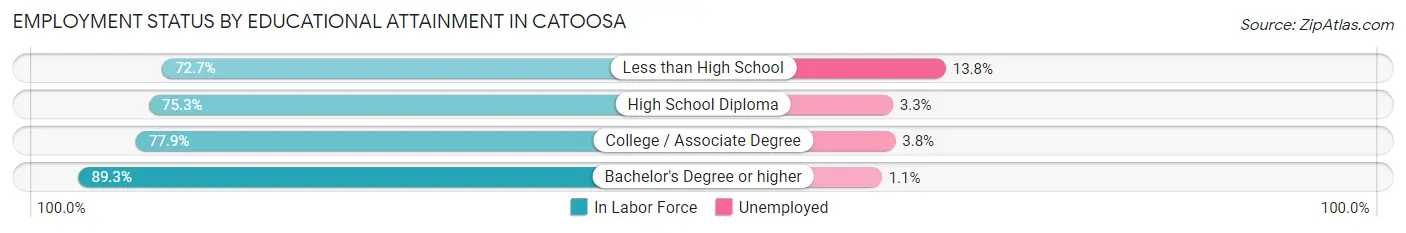
| Educational Attainment | In Labor Force | Unemployed |
| Less than High School | 349 (72.7%) | 66 (13.8%) |
| High School Diploma | 1,184 (75.3%) | 52 (3.3%) |
| College / Associate Degree | 1,066 (77.9%) | 52 (3.8%) |
| Bachelor's Degree or higher | 623 (89.3%) | 8 (1.1%) |
| Total | 3,220 (78.2%) | 173 (4.2%) |
Employment Occupations by Sex in Catoosa
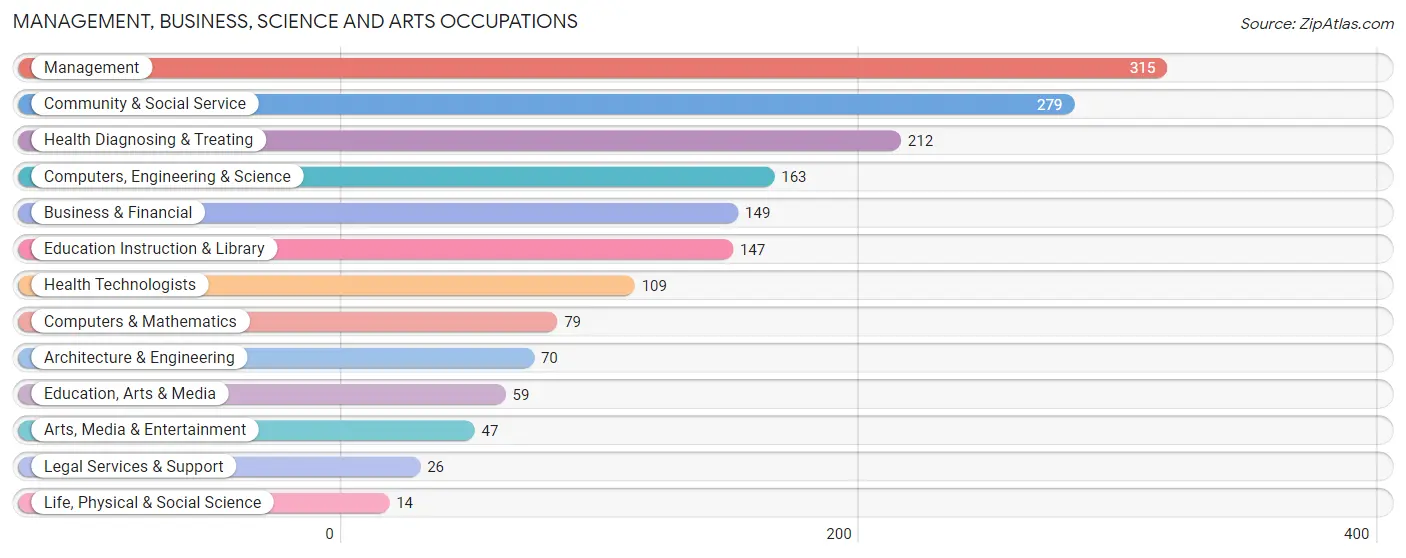
Management, Business, Science and Arts Occupations
The most common Management, Business, Science and Arts occupations in Catoosa are Management (315 | 8.0%), Community & Social Service (279 | 7.1%), Health Diagnosing & Treating (212 | 5.4%), Computers, Engineering & Science (163 | 4.2%), and Business & Financial (149 | 3.8%).
Management, Business, Science and Arts Occupations by Sex
Within the Management, Business, Science and Arts occupations in Catoosa, the most male-oriented occupations are Life, Physical & Social Science (100.0%), Architecture & Engineering (87.1%), and Arts, Media & Entertainment (80.8%), while the most female-oriented occupations are Legal Services & Support (100.0%), Education, Arts & Media (91.5%), and Education Instruction & Library (76.9%).
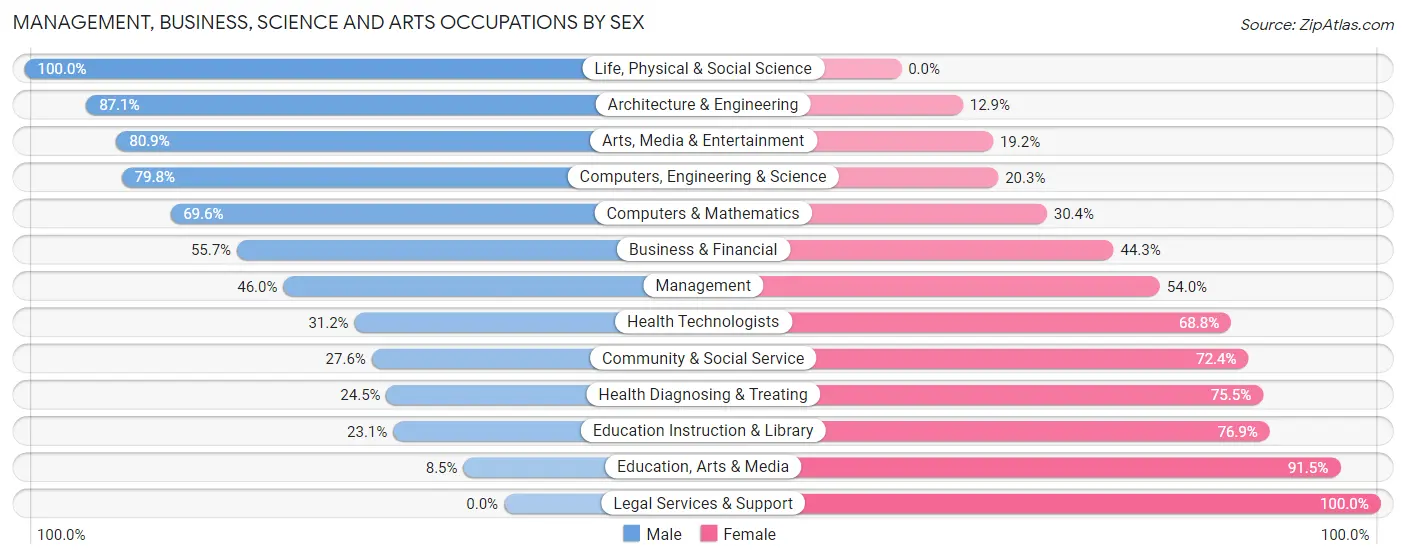
| Occupation | Male | Female |
| Management | 145 (46.0%) | 170 (54.0%) |
| Business & Financial | 83 (55.7%) | 66 (44.3%) |
| Computers, Engineering & Science | 130 (79.7%) | 33 (20.3%) |
| Computers & Mathematics | 55 (69.6%) | 24 (30.4%) |
| Architecture & Engineering | 61 (87.1%) | 9 (12.9%) |
| Life, Physical & Social Science | 14 (100.0%) | 0 (0.0%) |
| Community & Social Service | 77 (27.6%) | 202 (72.4%) |
| Education, Arts & Media | 5 (8.5%) | 54 (91.5%) |
| Legal Services & Support | 0 (0.0%) | 26 (100.0%) |
| Education Instruction & Library | 34 (23.1%) | 113 (76.9%) |
| Arts, Media & Entertainment | 38 (80.8%) | 9 (19.2%) |
| Health Diagnosing & Treating | 52 (24.5%) | 160 (75.5%) |
| Health Technologists | 34 (31.2%) | 75 (68.8%) |
| Total (Category) | 487 (43.6%) | 631 (56.4%) |
| Total (Overall) | 2,105 (53.7%) | 1,815 (46.3%) |
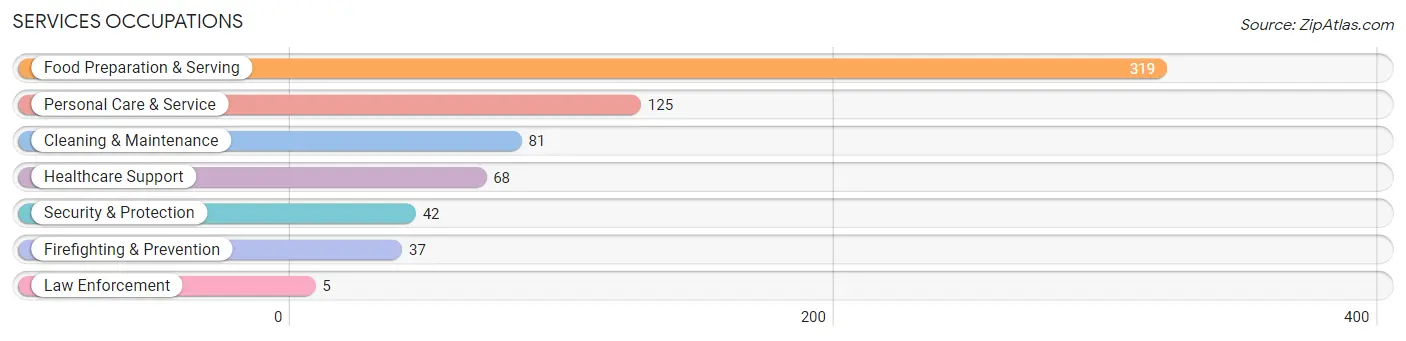
Services Occupations
The most common Services occupations in Catoosa are Food Preparation & Serving (319 | 8.1%), Personal Care & Service (125 | 3.2%), Cleaning & Maintenance (81 | 2.1%), Healthcare Support (68 | 1.7%), and Security & Protection (42 | 1.1%).
Services Occupations by Sex
Within the Services occupations in Catoosa, the most male-oriented occupations are Law Enforcement (100.0%), Cleaning & Maintenance (95.1%), and Security & Protection (40.5%), while the most female-oriented occupations are Healthcare Support (94.1%), Personal Care & Service (72.0%), and Food Preparation & Serving (70.2%).
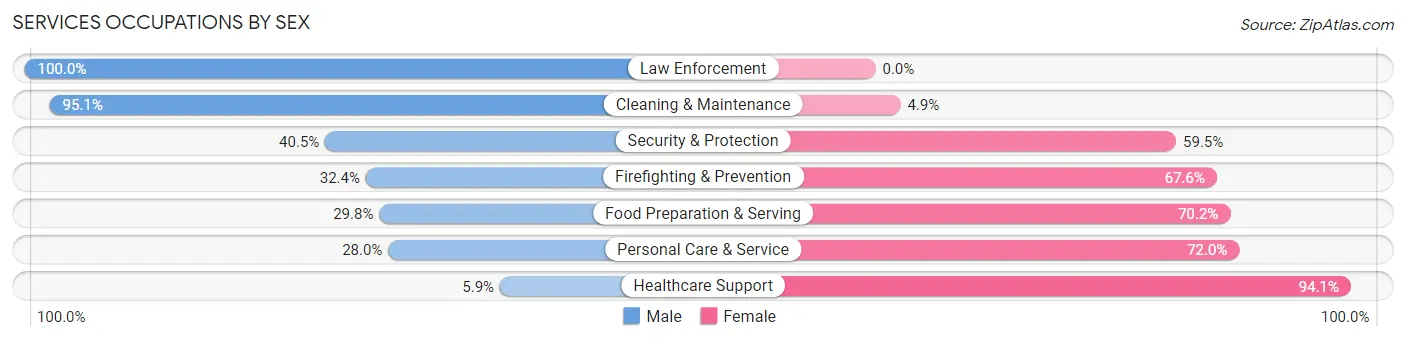
| Occupation | Male | Female |
| Healthcare Support | 4 (5.9%) | 64 (94.1%) |
| Security & Protection | 17 (40.5%) | 25 (59.5%) |
| Firefighting & Prevention | 12 (32.4%) | 25 (67.6%) |
| Law Enforcement | 5 (100.0%) | 0 (0.0%) |
| Food Preparation & Serving | 95 (29.8%) | 224 (70.2%) |
| Cleaning & Maintenance | 77 (95.1%) | 4 (4.9%) |
| Personal Care & Service | 35 (28.0%) | 90 (72.0%) |
| Total (Category) | 228 (35.9%) | 407 (64.1%) |
| Total (Overall) | 2,105 (53.7%) | 1,815 (46.3%) |
Sales and Office Occupations
The most common Sales and Office occupations in Catoosa are Office & Administration (521 | 13.3%), and Sales & Related (392 | 10.0%).
Sales and Office Occupations by Sex
| Occupation | Male | Female |
| Sales & Related | 144 (36.7%) | 248 (63.3%) |
| Office & Administration | 154 (29.6%) | 367 (70.4%) |
| Total (Category) | 298 (32.6%) | 615 (67.4%) |
| Total (Overall) | 2,105 (53.7%) | 1,815 (46.3%) |
Natural Resources, Construction and Maintenance Occupations
The most common Natural Resources, Construction and Maintenance occupations in Catoosa are Construction & Extraction (331 | 8.4%), Installation, Maintenance & Repair (235 | 6.0%), and Farming, Fishing & Forestry (6 | 0.2%).
Natural Resources, Construction and Maintenance Occupations by Sex
| Occupation | Male | Female |
| Farming, Fishing & Forestry | 6 (100.0%) | 0 (0.0%) |
| Construction & Extraction | 322 (97.3%) | 9 (2.7%) |
| Installation, Maintenance & Repair | 219 (93.2%) | 16 (6.8%) |
| Total (Category) | 547 (95.6%) | 25 (4.4%) |
| Total (Overall) | 2,105 (53.7%) | 1,815 (46.3%) |
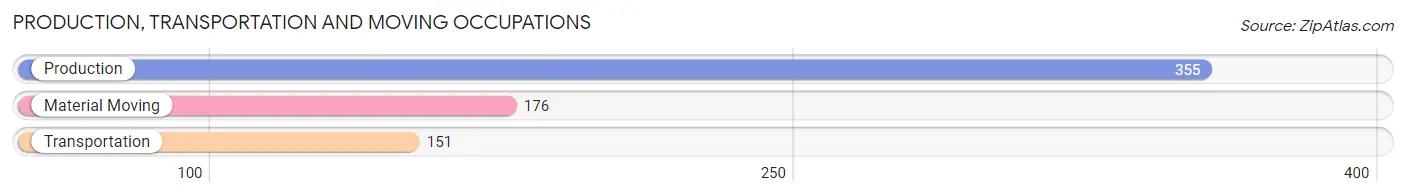
Production, Transportation and Moving Occupations
The most common Production, Transportation and Moving occupations in Catoosa are Production (355 | 9.1%), Material Moving (176 | 4.5%), and Transportation (151 | 3.8%).
Production, Transportation and Moving Occupations by Sex
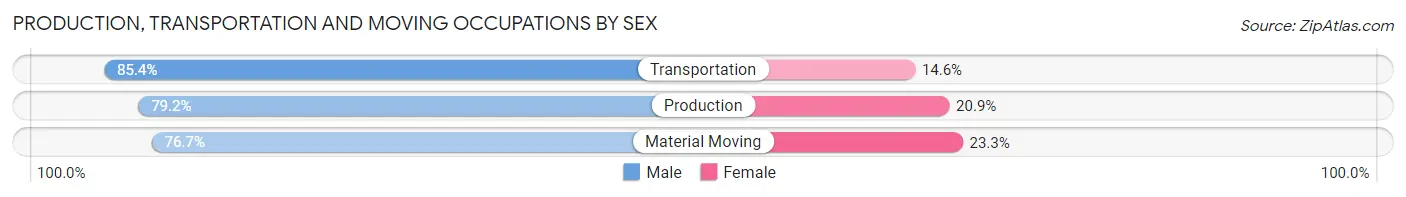
| Occupation | Male | Female |
| Production | 281 (79.1%) | 74 (20.8%) |
| Transportation | 129 (85.4%) | 22 (14.6%) |
| Material Moving | 135 (76.7%) | 41 (23.3%) |
| Total (Category) | 545 (79.9%) | 137 (20.1%) |
| Total (Overall) | 2,105 (53.7%) | 1,815 (46.3%) |
Employment Industries by Sex in Catoosa
Employment Industries in Catoosa
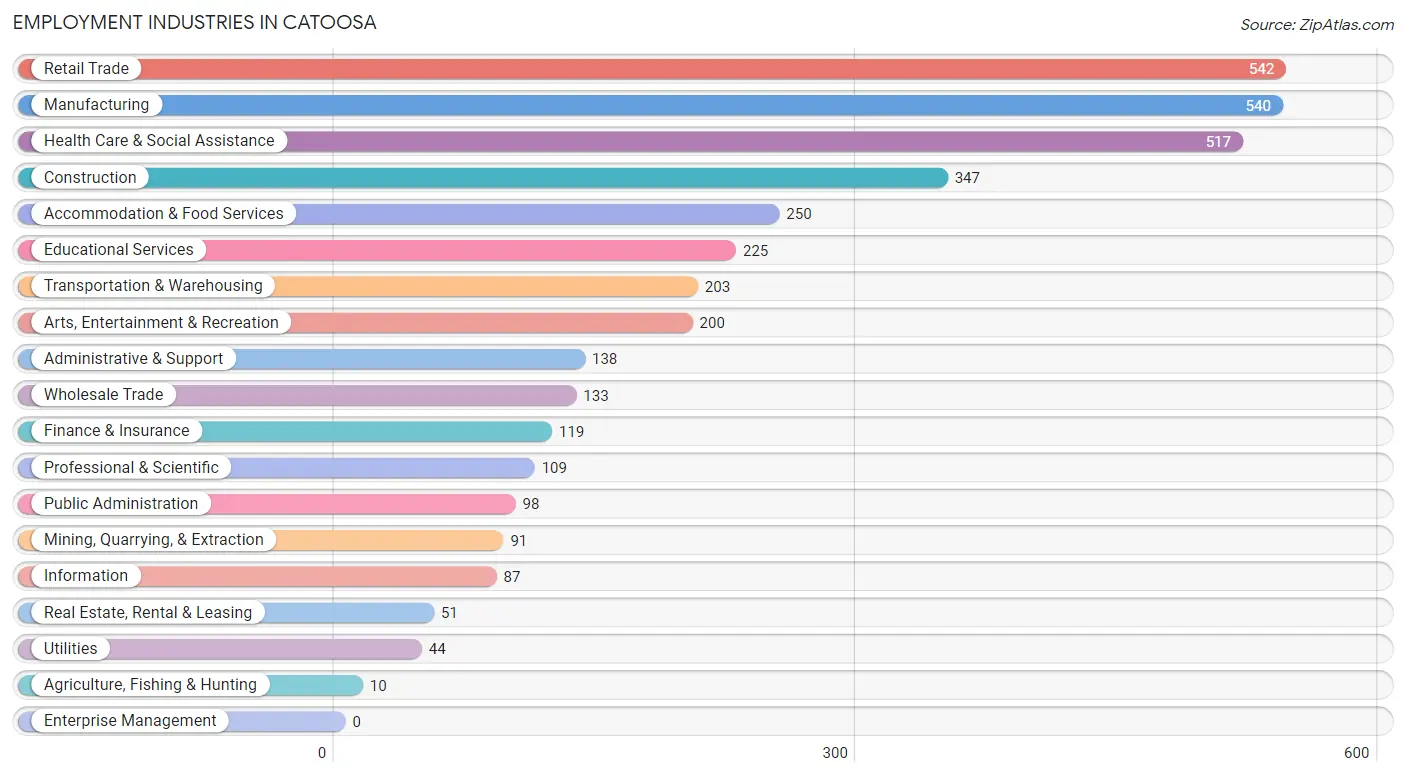
The major employment industries in Catoosa include Retail Trade (542 | 13.8%), Manufacturing (540 | 13.8%), Health Care & Social Assistance (517 | 13.2%), Construction (347 | 8.8%), and Accommodation & Food Services (250 | 6.4%).
Employment Industries by Sex in Catoosa
The Catoosa industries that see more men than women are Agriculture, Fishing & Hunting (100.0%), Construction (93.1%), and Manufacturing (78.3%), whereas the industries that tend to have a higher number of women are Health Care & Social Assistance (78.9%), Accommodation & Food Services (70.0%), and Educational Services (67.1%).
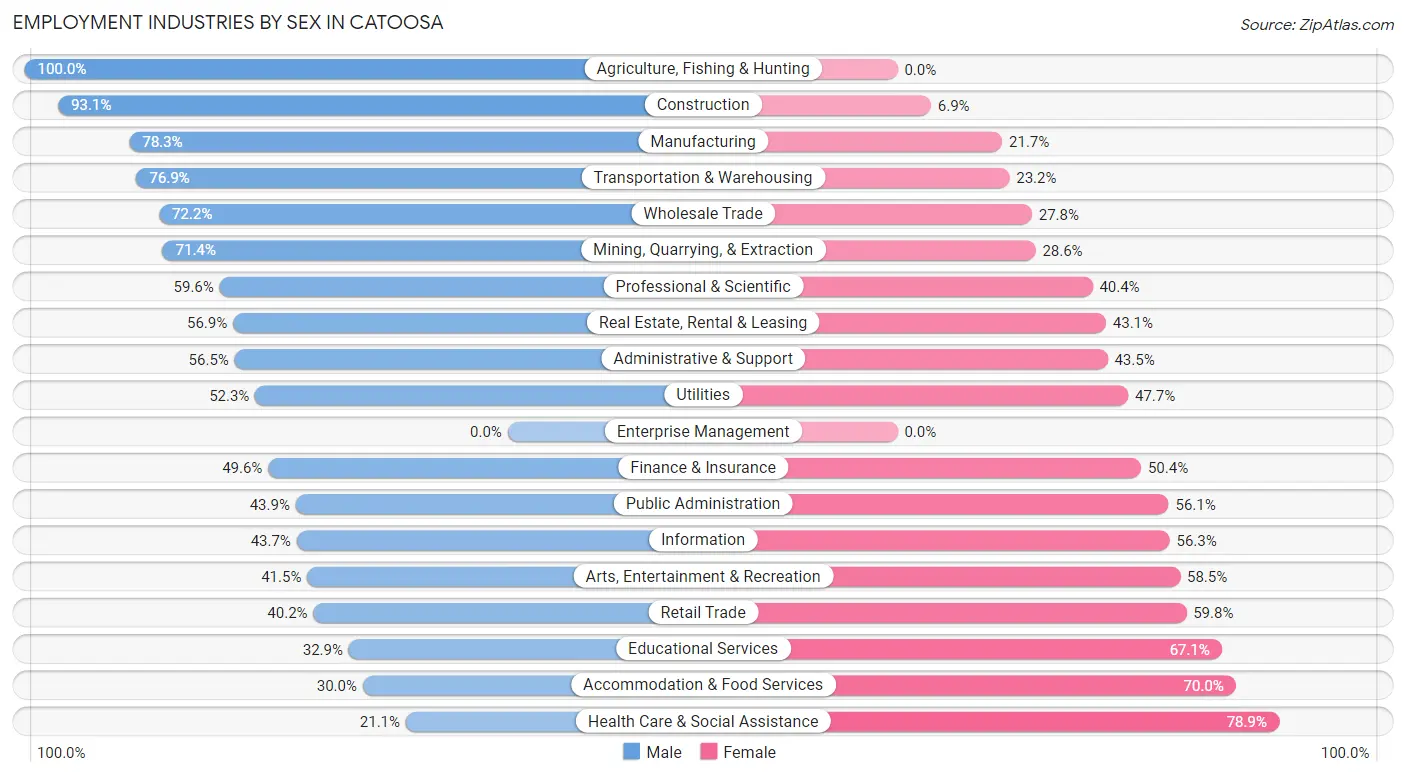
| Industry | Male | Female |
| Agriculture, Fishing & Hunting | 10 (100.0%) | 0 (0.0%) |
| Mining, Quarrying, & Extraction | 65 (71.4%) | 26 (28.6%) |
| Construction | 323 (93.1%) | 24 (6.9%) |
| Manufacturing | 423 (78.3%) | 117 (21.7%) |
| Wholesale Trade | 96 (72.2%) | 37 (27.8%) |
| Retail Trade | 218 (40.2%) | 324 (59.8%) |
| Transportation & Warehousing | 156 (76.8%) | 47 (23.2%) |
| Utilities | 23 (52.3%) | 21 (47.7%) |
| Information | 38 (43.7%) | 49 (56.3%) |
| Finance & Insurance | 59 (49.6%) | 60 (50.4%) |
| Real Estate, Rental & Leasing | 29 (56.9%) | 22 (43.1%) |
| Professional & Scientific | 65 (59.6%) | 44 (40.4%) |
| Enterprise Management | 0 (0.0%) | 0 (0.0%) |
| Administrative & Support | 78 (56.5%) | 60 (43.5%) |
| Educational Services | 74 (32.9%) | 151 (67.1%) |
| Health Care & Social Assistance | 109 (21.1%) | 408 (78.9%) |
| Arts, Entertainment & Recreation | 83 (41.5%) | 117 (58.5%) |
| Accommodation & Food Services | 75 (30.0%) | 175 (70.0%) |
| Public Administration | 43 (43.9%) | 55 (56.1%) |
| Total | 2,105 (53.7%) | 1,815 (46.3%) |
Education in Catoosa
School Enrollment in Catoosa
The most common levels of schooling among the 1,774 students in Catoosa are middle school (465 | 26.2%), high school (444 | 25.0%), and elementary school (397 | 22.4%).
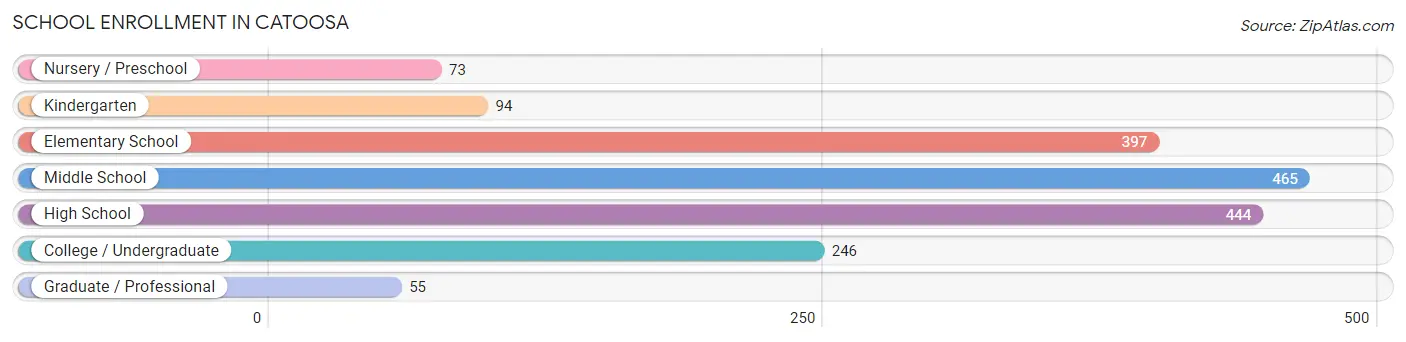
| School Level | # Students | % Students |
| Nursery / Preschool | 73 | 4.1% |
| Kindergarten | 94 | 5.3% |
| Elementary School | 397 | 22.4% |
| Middle School | 465 | 26.2% |
| High School | 444 | 25.0% |
| College / Undergraduate | 246 | 13.9% |
| Graduate / Professional | 55 | 3.1% |
| Total | 1,774 | 100.0% |
School Enrollment by Age by Funding Source in Catoosa
Out of a total of 1,774 students who are enrolled in schools in Catoosa, 321 (18.1%) attend a private institution, while the remaining 1,453 (81.9%) are enrolled in public schools. The age group of 20 to 24 year olds has the highest likelihood of being enrolled in private schools, with 63 (46.3% in the age bracket) enrolled. Conversely, the age group of 18 to 19 year olds has the lowest likelihood of being enrolled in a private school, with 118 (98.3% in the age bracket) attending a public institution.
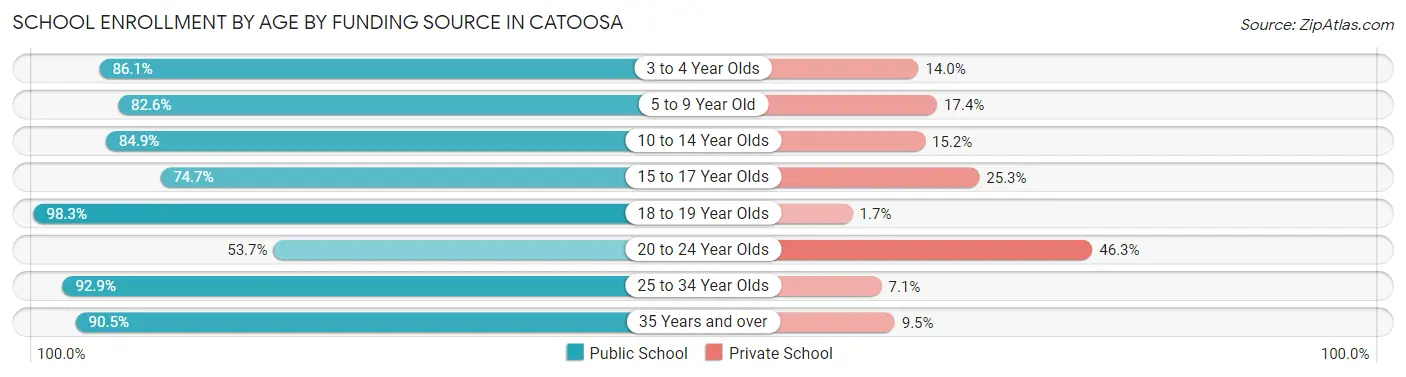
| Age Bracket | Public School | Private School |
| 3 to 4 Year Olds | 37 (86.1%) | 6 (14.0%) |
| 5 to 9 Year Old | 370 (82.6%) | 78 (17.4%) |
| 10 to 14 Year Olds | 493 (84.9%) | 88 (15.1%) |
| 15 to 17 Year Olds | 207 (74.7%) | 70 (25.3%) |
| 18 to 19 Year Olds | 118 (98.3%) | 2 (1.7%) |
| 20 to 24 Year Olds | 73 (53.7%) | 63 (46.3%) |
| 25 to 34 Year Olds | 79 (92.9%) | 6 (7.1%) |
| 35 Years and over | 76 (90.5%) | 8 (9.5%) |
| Total | 1,453 (81.9%) | 321 (18.1%) |
Educational Attainment by Field of Study in Catoosa
Business (253 | 23.4%), education (172 | 15.9%), arts & humanities (163 | 15.1%), science & technology (158 | 14.6%), and engineering (76 | 7.0%) are the most common fields of study among 1,081 individuals in Catoosa who have obtained a bachelor's degree or higher.
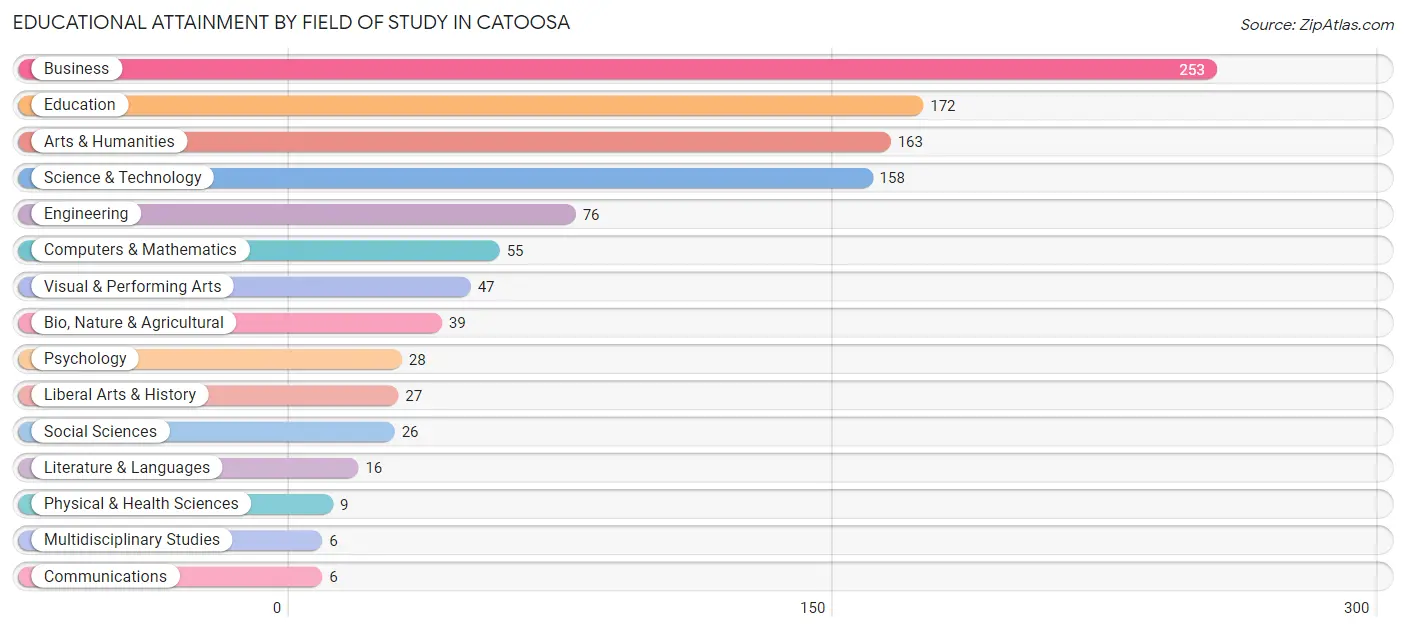
| Field of Study | # Graduates | % Graduates |
| Computers & Mathematics | 55 | 5.1% |
| Bio, Nature & Agricultural | 39 | 3.6% |
| Physical & Health Sciences | 9 | 0.8% |
| Psychology | 28 | 2.6% |
| Social Sciences | 26 | 2.4% |
| Engineering | 76 | 7.0% |
| Multidisciplinary Studies | 6 | 0.6% |
| Science & Technology | 158 | 14.6% |
| Business | 253 | 23.4% |
| Education | 172 | 15.9% |
| Literature & Languages | 16 | 1.5% |
| Liberal Arts & History | 27 | 2.5% |
| Visual & Performing Arts | 47 | 4.3% |
| Communications | 6 | 0.6% |
| Arts & Humanities | 163 | 15.1% |
| Total | 1,081 | 100.0% |
Transportation & Commute in Catoosa
Vehicle Availability by Sex in Catoosa
The most prevalent vehicle ownership categories in Catoosa are males with 2 vehicles (759, accounting for 36.4%) and females with 2 vehicles (715, making up 42.8%).
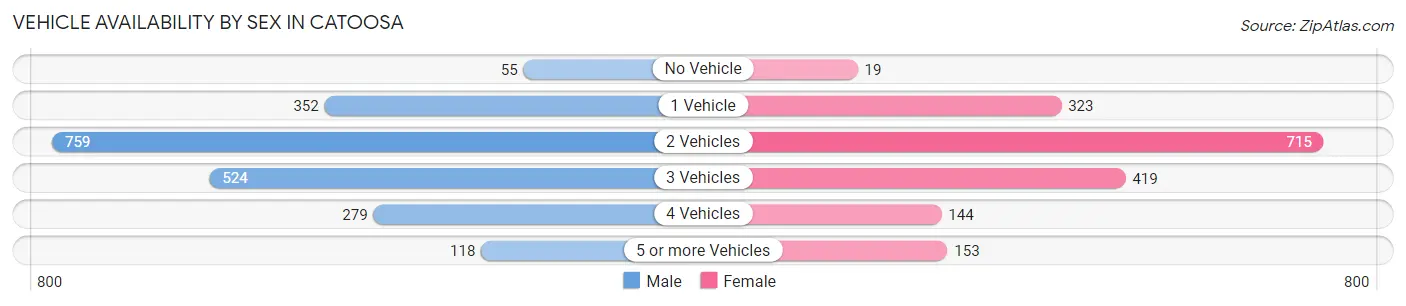
| Vehicles Available | Male | Female |
| No Vehicle | 55 (2.6%) | 19 (1.1%) |
| 1 Vehicle | 352 (16.9%) | 323 (18.2%) |
| 2 Vehicles | 759 (36.4%) | 715 (40.3%) |
| 3 Vehicles | 524 (25.1%) | 419 (23.6%) |
| 4 Vehicles | 279 (13.4%) | 144 (8.1%) |
| 5 or more Vehicles | 118 (5.7%) | 153 (8.6%) |
| Total | 2,087 (100.0%) | 1,773 (100.0%) |
Commute Time in Catoosa
The most frequently occuring commute durations in Catoosa are 20 to 24 minutes (960 commuters, 26.3%), 15 to 19 minutes (558 commuters, 15.3%), and 5 to 9 minutes (469 commuters, 12.9%).
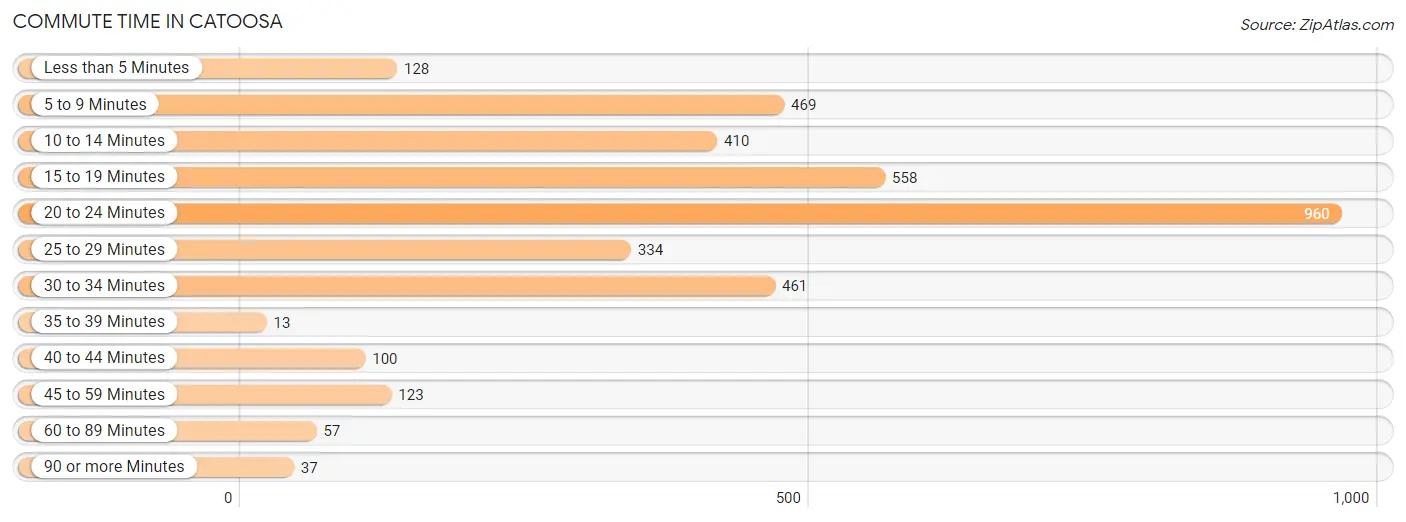
| Commute Time | # Commuters | % Commuters |
| Less than 5 Minutes | 128 | 3.5% |
| 5 to 9 Minutes | 469 | 12.9% |
| 10 to 14 Minutes | 410 | 11.2% |
| 15 to 19 Minutes | 558 | 15.3% |
| 20 to 24 Minutes | 960 | 26.3% |
| 25 to 29 Minutes | 334 | 9.1% |
| 30 to 34 Minutes | 461 | 12.6% |
| 35 to 39 Minutes | 13 | 0.4% |
| 40 to 44 Minutes | 100 | 2.7% |
| 45 to 59 Minutes | 123 | 3.4% |
| 60 to 89 Minutes | 57 | 1.6% |
| 90 or more Minutes | 37 | 1.0% |
Commute Time by Sex in Catoosa
The most common commute times in Catoosa are 20 to 24 minutes (477 commuters, 24.1%) for males and 20 to 24 minutes (483 commuters, 28.9%) for females.
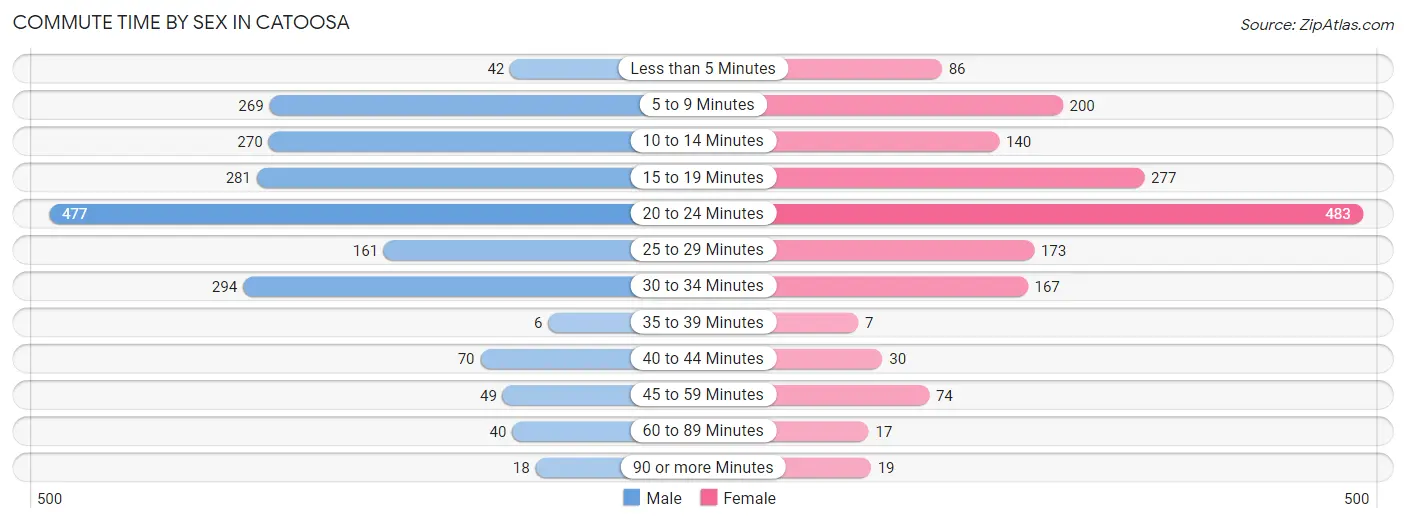
| Commute Time | Male | Female |
| Less than 5 Minutes | 42 (2.1%) | 86 (5.1%) |
| 5 to 9 Minutes | 269 (13.6%) | 200 (11.9%) |
| 10 to 14 Minutes | 270 (13.7%) | 140 (8.4%) |
| 15 to 19 Minutes | 281 (14.2%) | 277 (16.6%) |
| 20 to 24 Minutes | 477 (24.1%) | 483 (28.9%) |
| 25 to 29 Minutes | 161 (8.1%) | 173 (10.3%) |
| 30 to 34 Minutes | 294 (14.9%) | 167 (10.0%) |
| 35 to 39 Minutes | 6 (0.3%) | 7 (0.4%) |
| 40 to 44 Minutes | 70 (3.5%) | 30 (1.8%) |
| 45 to 59 Minutes | 49 (2.5%) | 74 (4.4%) |
| 60 to 89 Minutes | 40 (2.0%) | 17 (1.0%) |
| 90 or more Minutes | 18 (0.9%) | 19 (1.1%) |
Time of Departure to Work by Sex in Catoosa
The most frequent times of departure to work in Catoosa are 6:30 AM to 6:59 AM (319, 16.1%) for males and 7:00 AM to 7:29 AM (319, 19.1%) for females.
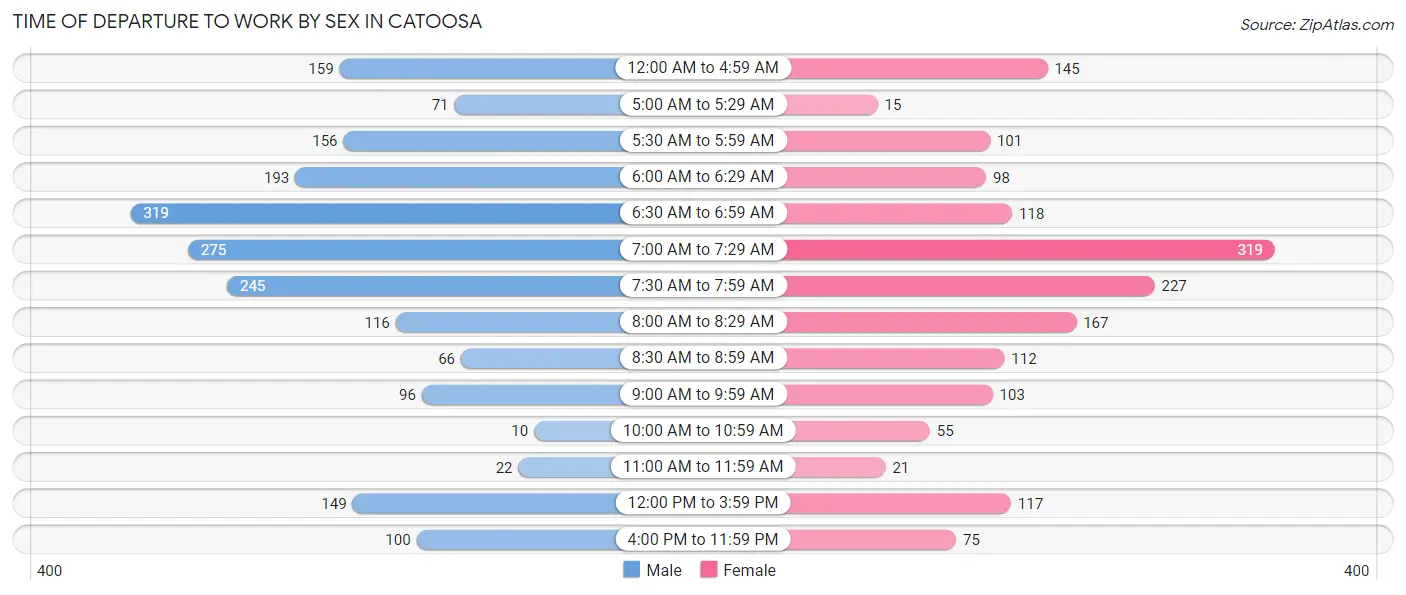
| Time of Departure | Male | Female |
| 12:00 AM to 4:59 AM | 159 (8.0%) | 145 (8.7%) |
| 5:00 AM to 5:29 AM | 71 (3.6%) | 15 (0.9%) |
| 5:30 AM to 5:59 AM | 156 (7.9%) | 101 (6.0%) |
| 6:00 AM to 6:29 AM | 193 (9.8%) | 98 (5.9%) |
| 6:30 AM to 6:59 AM | 319 (16.1%) | 118 (7.0%) |
| 7:00 AM to 7:29 AM | 275 (13.9%) | 319 (19.1%) |
| 7:30 AM to 7:59 AM | 245 (12.4%) | 227 (13.6%) |
| 8:00 AM to 8:29 AM | 116 (5.9%) | 167 (10.0%) |
| 8:30 AM to 8:59 AM | 66 (3.3%) | 112 (6.7%) |
| 9:00 AM to 9:59 AM | 96 (4.9%) | 103 (6.2%) |
| 10:00 AM to 10:59 AM | 10 (0.5%) | 55 (3.3%) |
| 11:00 AM to 11:59 AM | 22 (1.1%) | 21 (1.3%) |
| 12:00 PM to 3:59 PM | 149 (7.5%) | 117 (7.0%) |
| 4:00 PM to 11:59 PM | 100 (5.1%) | 75 (4.5%) |
| Total | 1,977 (100.0%) | 1,673 (100.0%) |
Housing Occupancy in Catoosa
Occupancy by Ownership in Catoosa
Of the total 3,002 dwellings in Catoosa, owner-occupied units account for 1,836 (61.2%), while renter-occupied units make up 1,166 (38.8%).
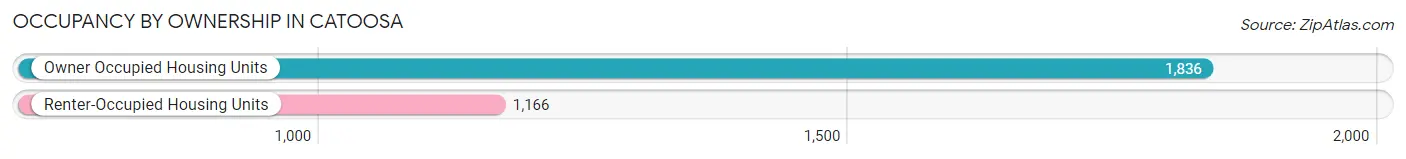
| Occupancy | # Housing Units | % Housing Units |
| Owner Occupied Housing Units | 1,836 | 61.2% |
| Renter-Occupied Housing Units | 1,166 | 38.8% |
| Total Occupied Housing Units | 3,002 | 100.0% |
Occupancy by Household Size in Catoosa
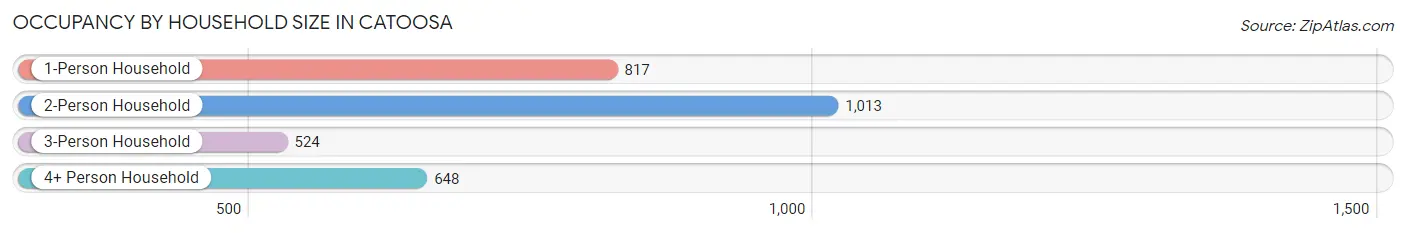
| Household Size | # Housing Units | % Housing Units |
| 1-Person Household | 817 | 27.2% |
| 2-Person Household | 1,013 | 33.7% |
| 3-Person Household | 524 | 17.5% |
| 4+ Person Household | 648 | 21.6% |
| Total Housing Units | 3,002 | 100.0% |
Occupancy by Ownership by Household Size in Catoosa
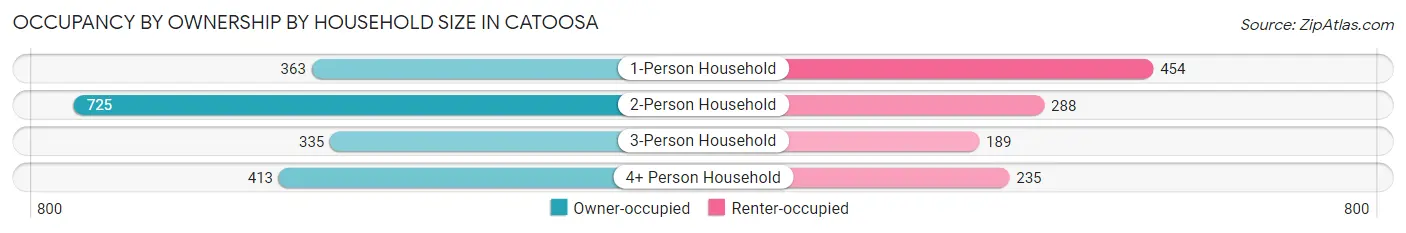
| Household Size | Owner-occupied | Renter-occupied |
| 1-Person Household | 363 (44.4%) | 454 (55.6%) |
| 2-Person Household | 725 (71.6%) | 288 (28.4%) |
| 3-Person Household | 335 (63.9%) | 189 (36.1%) |
| 4+ Person Household | 413 (63.7%) | 235 (36.3%) |
| Total Housing Units | 1,836 (61.2%) | 1,166 (38.8%) |
Occupancy by Educational Attainment in Catoosa
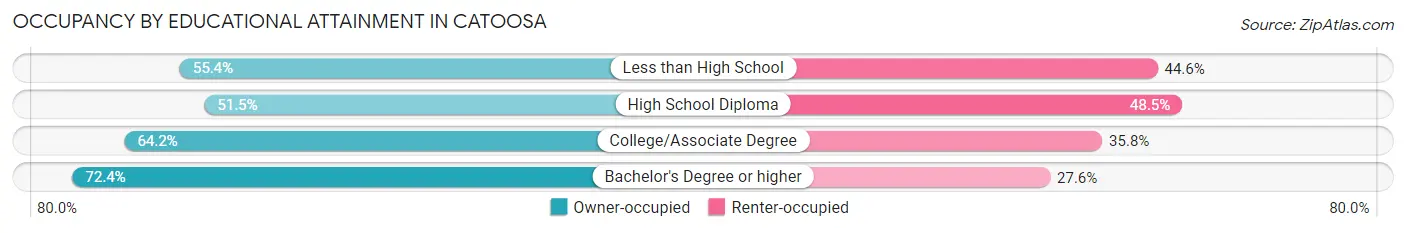
| Household Size | Owner-occupied | Renter-occupied |
| Less than High School | 134 (55.4%) | 108 (44.6%) |
| High School Diploma | 503 (51.5%) | 474 (48.5%) |
| College/Associate Degree | 716 (64.2%) | 400 (35.8%) |
| Bachelor's Degree or higher | 483 (72.4%) | 184 (27.6%) |
Occupancy by Age of Householder in Catoosa
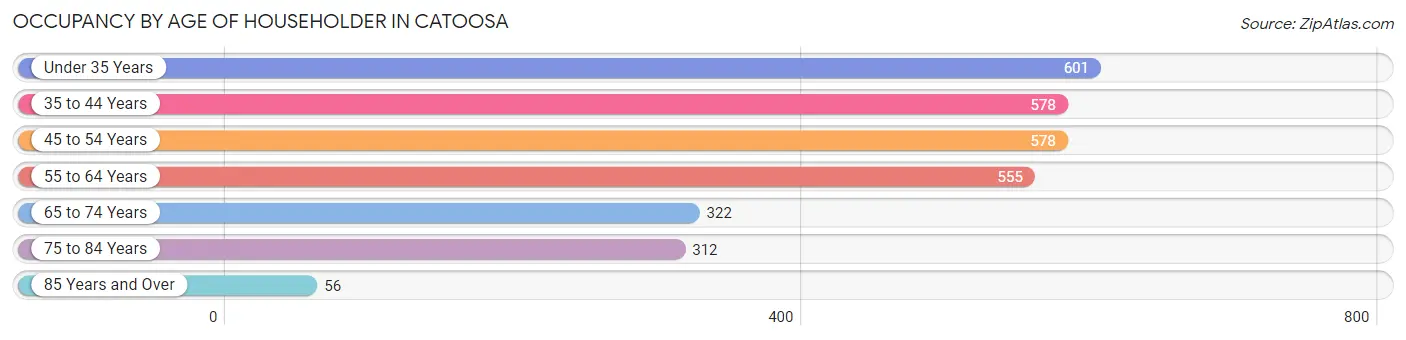
| Age Bracket | # Households | % Households |
| Under 35 Years | 601 | 20.0% |
| 35 to 44 Years | 578 | 19.3% |
| 45 to 54 Years | 578 | 19.3% |
| 55 to 64 Years | 555 | 18.5% |
| 65 to 74 Years | 322 | 10.7% |
| 75 to 84 Years | 312 | 10.4% |
| 85 Years and Over | 56 | 1.9% |
| Total | 3,002 | 100.0% |
Housing Finances in Catoosa
Median Income by Occupancy in Catoosa
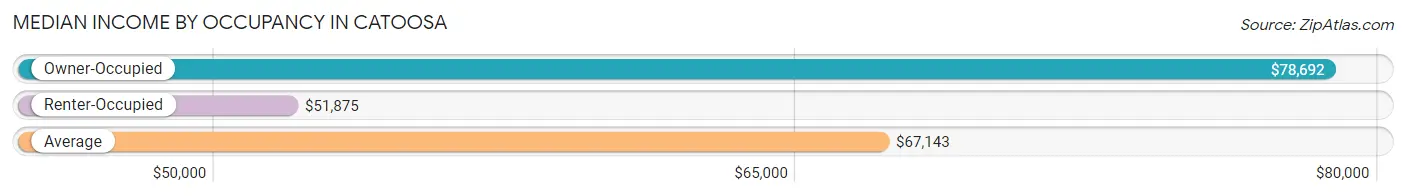
| Occupancy Type | # Households | Median Income |
| Owner-Occupied | 1,836 (61.2%) | $78,692 |
| Renter-Occupied | 1,166 (38.8%) | $51,875 |
| Average | 3,002 (100.0%) | $67,143 |
Occupancy by Householder Income Bracket in Catoosa
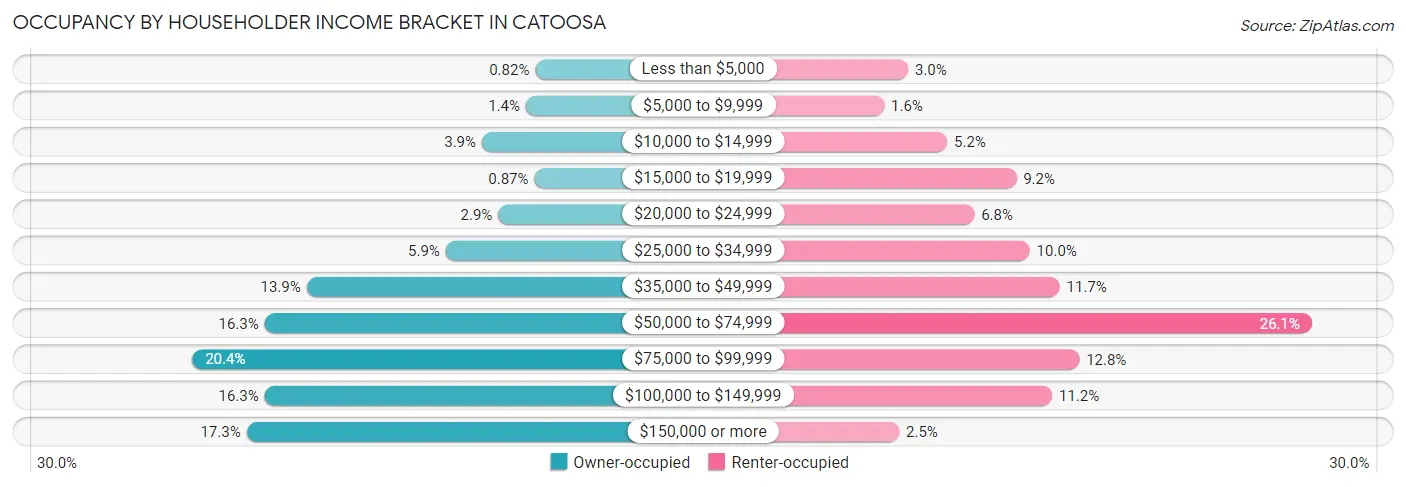
| Income Bracket | Owner-occupied | Renter-occupied |
| Less than $5,000 | 15 (0.8%) | 35 (3.0%) |
| $5,000 to $9,999 | 25 (1.4%) | 19 (1.6%) |
| $10,000 to $14,999 | 71 (3.9%) | 61 (5.2%) |
| $15,000 to $19,999 | 16 (0.9%) | 107 (9.2%) |
| $20,000 to $24,999 | 54 (2.9%) | 79 (6.8%) |
| $25,000 to $34,999 | 109 (5.9%) | 116 (10.0%) |
| $35,000 to $49,999 | 255 (13.9%) | 136 (11.7%) |
| $50,000 to $74,999 | 299 (16.3%) | 304 (26.1%) |
| $75,000 to $99,999 | 375 (20.4%) | 149 (12.8%) |
| $100,000 to $149,999 | 299 (16.3%) | 131 (11.2%) |
| $150,000 or more | 318 (17.3%) | 29 (2.5%) |
| Total | 1,836 (100.0%) | 1,166 (100.0%) |
Monthly Housing Cost Tiers in Catoosa
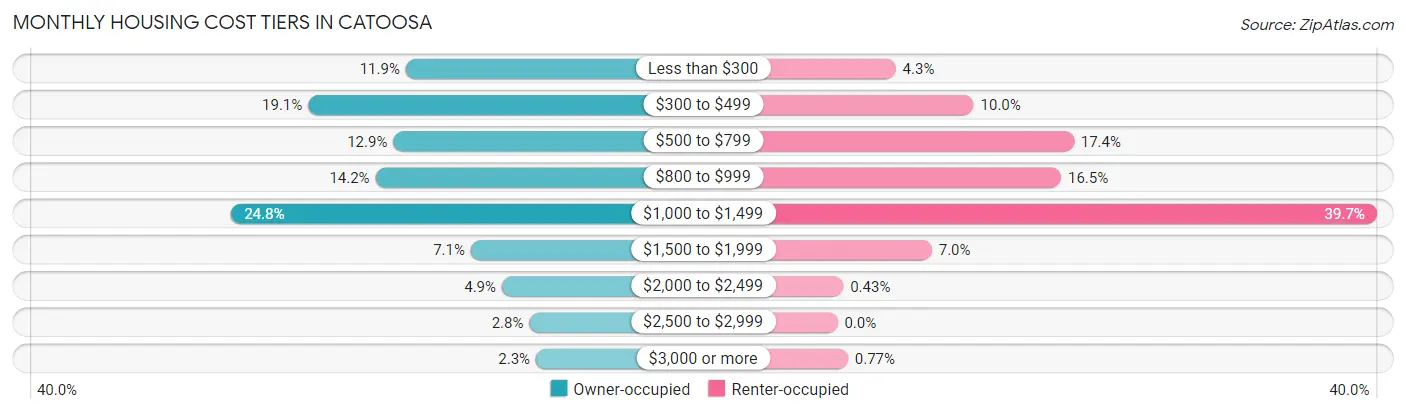
| Monthly Cost | Owner-occupied | Renter-occupied |
| Less than $300 | 219 (11.9%) | 50 (4.3%) |
| $300 to $499 | 351 (19.1%) | 117 (10.0%) |
| $500 to $799 | 236 (12.9%) | 203 (17.4%) |
| $800 to $999 | 260 (14.2%) | 192 (16.5%) |
| $1,000 to $1,499 | 455 (24.8%) | 463 (39.7%) |
| $1,500 to $1,999 | 131 (7.1%) | 81 (7.0%) |
| $2,000 to $2,499 | 89 (4.9%) | 5 (0.4%) |
| $2,500 to $2,999 | 52 (2.8%) | 0 (0.0%) |
| $3,000 or more | 43 (2.3%) | 9 (0.8%) |
| Total | 1,836 (100.0%) | 1,166 (100.0%) |
Physical Housing Characteristics in Catoosa
Housing Structures in Catoosa
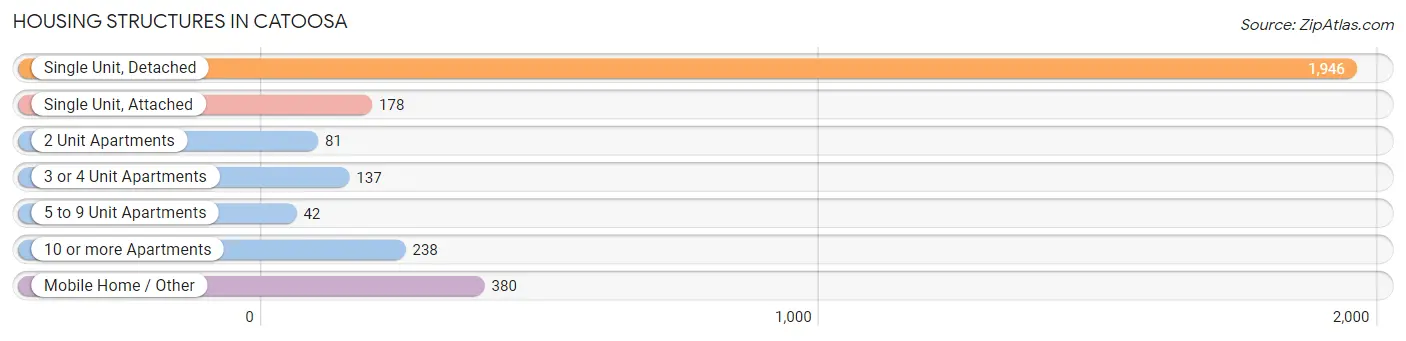
| Structure Type | # Housing Units | % Housing Units |
| Single Unit, Detached | 1,946 | 64.8% |
| Single Unit, Attached | 178 | 5.9% |
| 2 Unit Apartments | 81 | 2.7% |
| 3 or 4 Unit Apartments | 137 | 4.6% |
| 5 to 9 Unit Apartments | 42 | 1.4% |
| 10 or more Apartments | 238 | 7.9% |
| Mobile Home / Other | 380 | 12.7% |
| Total | 3,002 | 100.0% |
Housing Structures by Occupancy in Catoosa
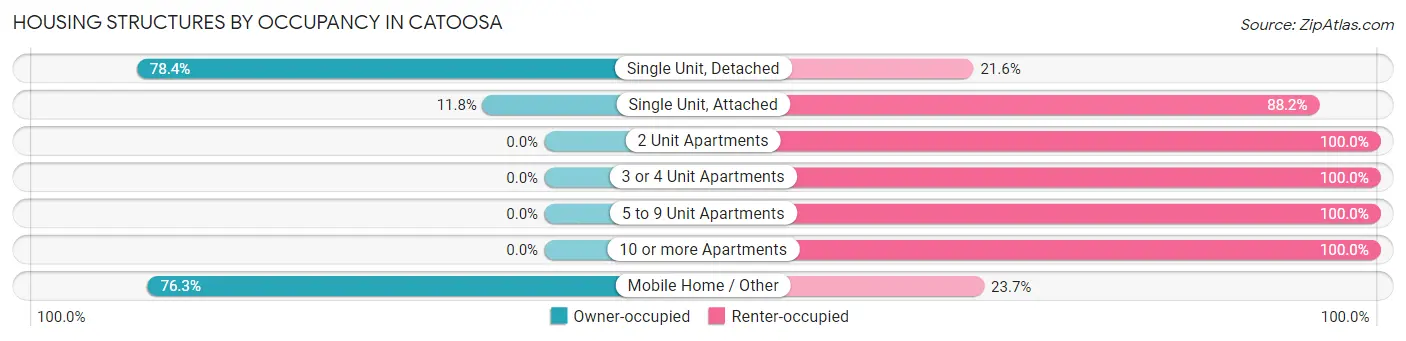
| Structure Type | Owner-occupied | Renter-occupied |
| Single Unit, Detached | 1,525 (78.4%) | 421 (21.6%) |
| Single Unit, Attached | 21 (11.8%) | 157 (88.2%) |
| 2 Unit Apartments | 0 (0.0%) | 81 (100.0%) |
| 3 or 4 Unit Apartments | 0 (0.0%) | 137 (100.0%) |
| 5 to 9 Unit Apartments | 0 (0.0%) | 42 (100.0%) |
| 10 or more Apartments | 0 (0.0%) | 238 (100.0%) |
| Mobile Home / Other | 290 (76.3%) | 90 (23.7%) |
| Total | 1,836 (61.2%) | 1,166 (38.8%) |
Housing Structures by Number of Rooms in Catoosa
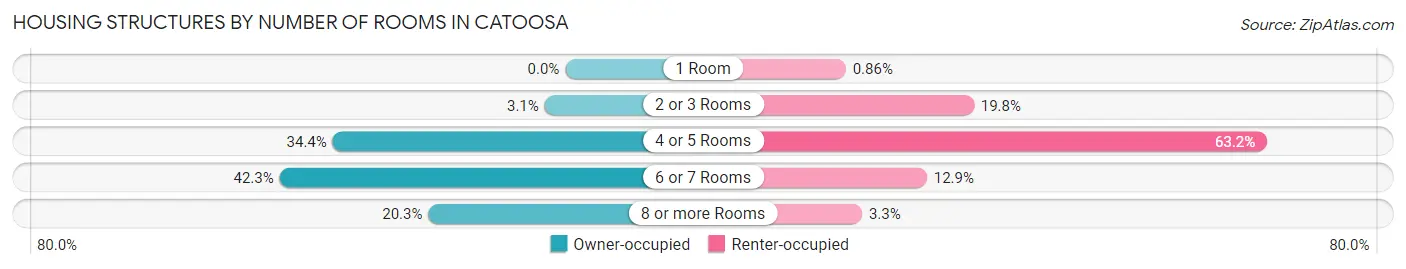
| Number of Rooms | Owner-occupied | Renter-occupied |
| 1 Room | 0 (0.0%) | 10 (0.9%) |
| 2 or 3 Rooms | 56 (3.0%) | 231 (19.8%) |
| 4 or 5 Rooms | 632 (34.4%) | 737 (63.2%) |
| 6 or 7 Rooms | 776 (42.3%) | 150 (12.9%) |
| 8 or more Rooms | 372 (20.3%) | 38 (3.3%) |
| Total | 1,836 (100.0%) | 1,166 (100.0%) |
Housing Structure by Heating Type in Catoosa
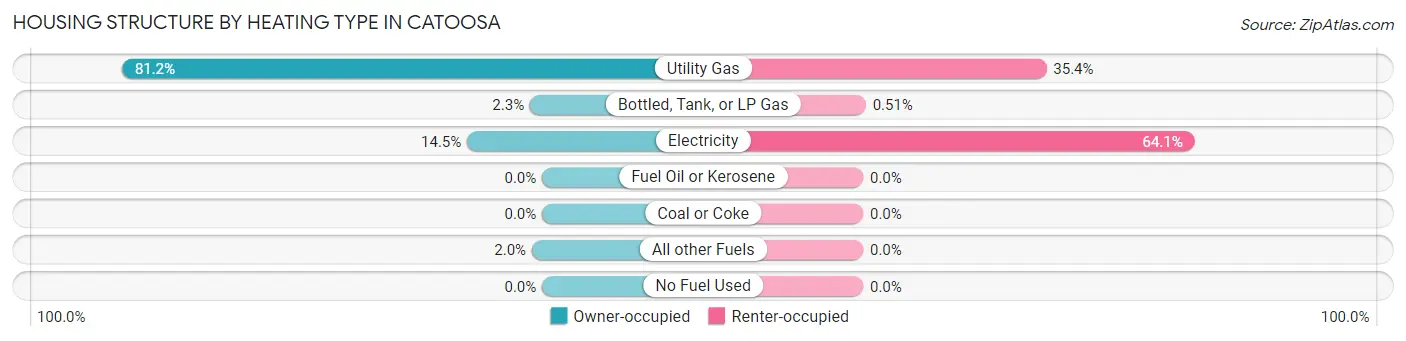
| Heating Type | Owner-occupied | Renter-occupied |
| Utility Gas | 1,491 (81.2%) | 413 (35.4%) |
| Bottled, Tank, or LP Gas | 43 (2.3%) | 6 (0.5%) |
| Electricity | 266 (14.5%) | 747 (64.1%) |
| Fuel Oil or Kerosene | 0 (0.0%) | 0 (0.0%) |
| Coal or Coke | 0 (0.0%) | 0 (0.0%) |
| All other Fuels | 36 (2.0%) | 0 (0.0%) |
| No Fuel Used | 0 (0.0%) | 0 (0.0%) |
| Total | 1,836 (100.0%) | 1,166 (100.0%) |
Household Vehicle Usage in Catoosa
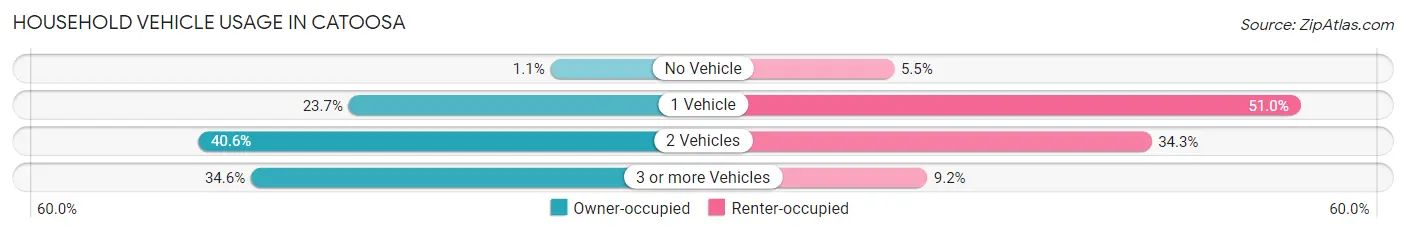
| Vehicles per Household | Owner-occupied | Renter-occupied |
| No Vehicle | 20 (1.1%) | 64 (5.5%) |
| 1 Vehicle | 435 (23.7%) | 595 (51.0%) |
| 2 Vehicles | 745 (40.6%) | 400 (34.3%) |
| 3 or more Vehicles | 636 (34.6%) | 107 (9.2%) |
| Total | 1,836 (100.0%) | 1,166 (100.0%) |
Real Estate & Mortgages in Catoosa
Real Estate and Mortgage Overview in Catoosa
| Characteristic | Without Mortgage | With Mortgage |
| Housing Units | 817 | 1,019 |
| Median Property Value | $107,300 | $172,400 |
| Median Household Income | $68,063 | $201 |
| Monthly Housing Costs | $413 | $43 |
| Real Estate Taxes | $692 | $32 |
Property Value by Mortgage Status in Catoosa
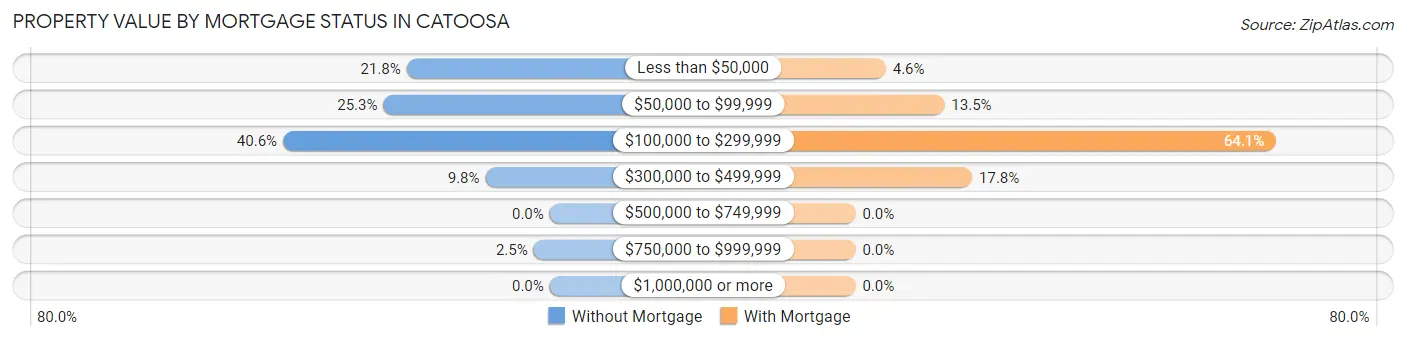
| Property Value | Without Mortgage | With Mortgage |
| Less than $50,000 | 178 (21.8%) | 47 (4.6%) |
| $50,000 to $99,999 | 207 (25.3%) | 138 (13.5%) |
| $100,000 to $299,999 | 332 (40.6%) | 653 (64.1%) |
| $300,000 to $499,999 | 80 (9.8%) | 181 (17.8%) |
| $500,000 to $749,999 | 0 (0.0%) | 0 (0.0%) |
| $750,000 to $999,999 | 20 (2.5%) | 0 (0.0%) |
| $1,000,000 or more | 0 (0.0%) | 0 (0.0%) |
| Total | 817 (100.0%) | 1,019 (100.0%) |
Household Income by Mortgage Status in Catoosa
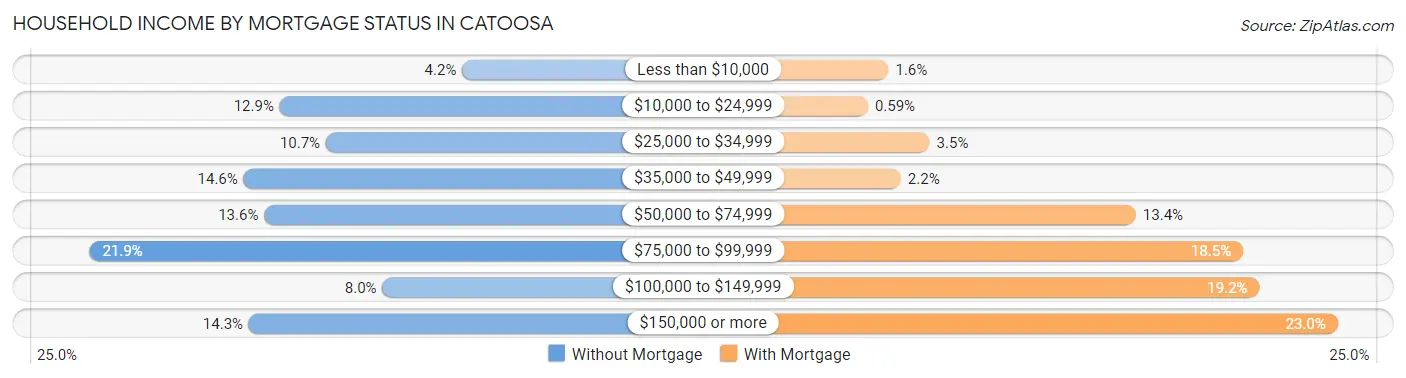
| Household Income | Without Mortgage | With Mortgage |
| Less than $10,000 | 34 (4.2%) | 16 (1.6%) |
| $10,000 to $24,999 | 105 (12.9%) | 6 (0.6%) |
| $25,000 to $34,999 | 87 (10.6%) | 36 (3.5%) |
| $35,000 to $49,999 | 119 (14.6%) | 22 (2.2%) |
| $50,000 to $74,999 | 111 (13.6%) | 136 (13.4%) |
| $75,000 to $99,999 | 179 (21.9%) | 188 (18.4%) |
| $100,000 to $149,999 | 65 (8.0%) | 196 (19.2%) |
| $150,000 or more | 117 (14.3%) | 234 (23.0%) |
| Total | 817 (100.0%) | 1,019 (100.0%) |
Property Value to Household Income Ratio in Catoosa
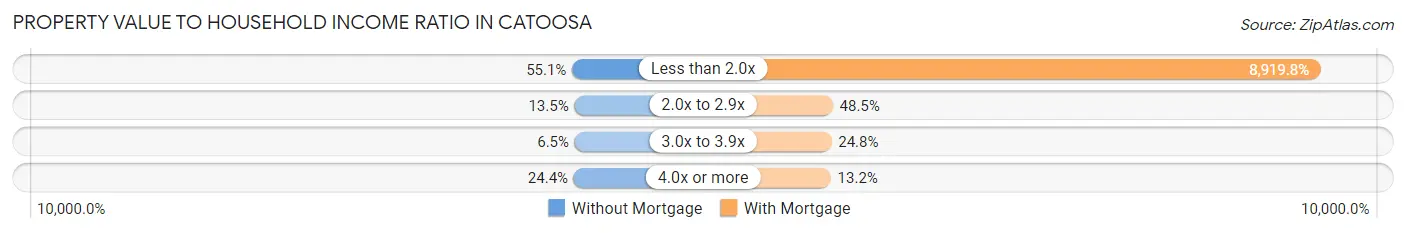
| Value-to-Income Ratio | Without Mortgage | With Mortgage |
| Less than 2.0x | 450 (55.1%) | 90,893 (8,919.8%) |
| 2.0x to 2.9x | 110 (13.5%) | 494 (48.5%) |
| 3.0x to 3.9x | 53 (6.5%) | 253 (24.8%) |
| 4.0x or more | 199 (24.4%) | 134 (13.2%) |
| Total | 817 (100.0%) | 1,019 (100.0%) |
Real Estate Taxes by Mortgage Status in Catoosa
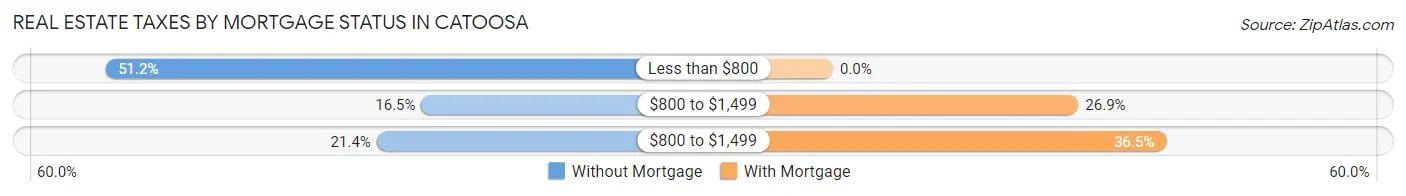
| Property Taxes | Without Mortgage | With Mortgage |
| Less than $800 | 418 (51.2%) | 0 (0.0%) |
| $800 to $1,499 | 135 (16.5%) | 274 (26.9%) |
| $800 to $1,499 | 175 (21.4%) | 372 (36.5%) |
| Total | 817 (100.0%) | 1,019 (100.0%) |
Health & Disability in Catoosa
Health Insurance Coverage by Age in Catoosa
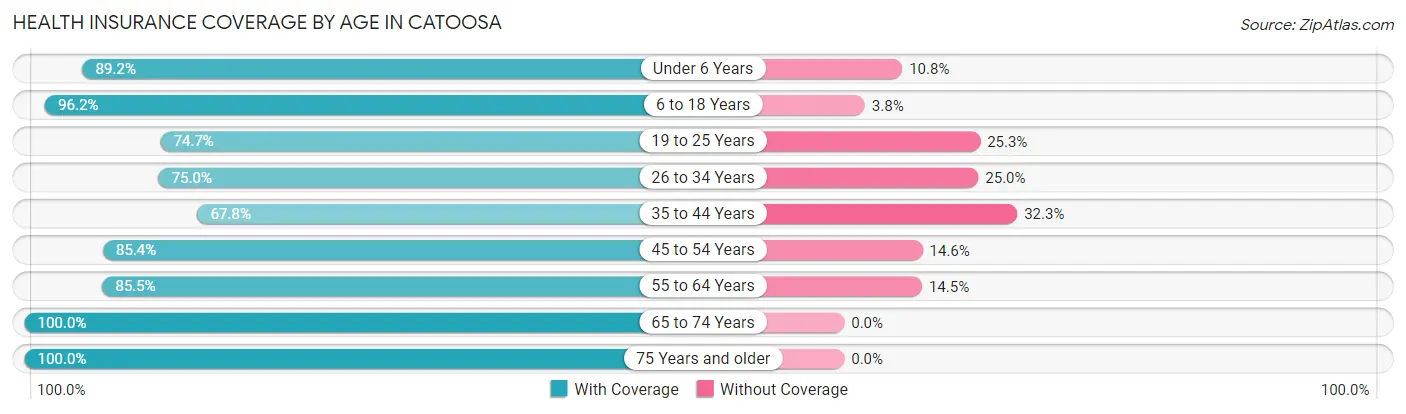
| Age Bracket | With Coverage | Without Coverage |
| Under 6 Years | 355 (89.2%) | 43 (10.8%) |
| 6 to 18 Years | 1,303 (96.2%) | 52 (3.8%) |
| 19 to 25 Years | 601 (74.7%) | 204 (25.3%) |
| 26 to 34 Years | 726 (75.0%) | 242 (25.0%) |
| 35 to 44 Years | 750 (67.7%) | 357 (32.3%) |
| 45 to 54 Years | 813 (85.4%) | 139 (14.6%) |
| 55 to 64 Years | 832 (85.5%) | 141 (14.5%) |
| 65 to 74 Years | 508 (100.0%) | 0 (0.0%) |
| 75 Years and older | 539 (100.0%) | 0 (0.0%) |
| Total | 6,427 (84.5%) | 1,178 (15.5%) |
Health Insurance Coverage by Citizenship Status in Catoosa
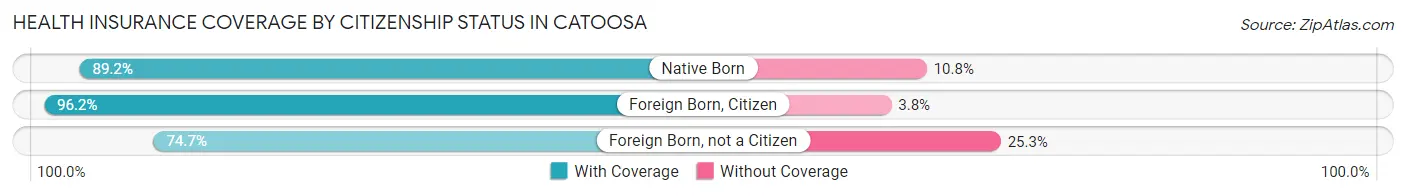
| Citizenship Status | With Coverage | Without Coverage |
| Native Born | 355 (89.2%) | 43 (10.8%) |
| Foreign Born, Citizen | 1,303 (96.2%) | 52 (3.8%) |
| Foreign Born, not a Citizen | 601 (74.7%) | 204 (25.3%) |
Health Insurance Coverage by Household Income in Catoosa
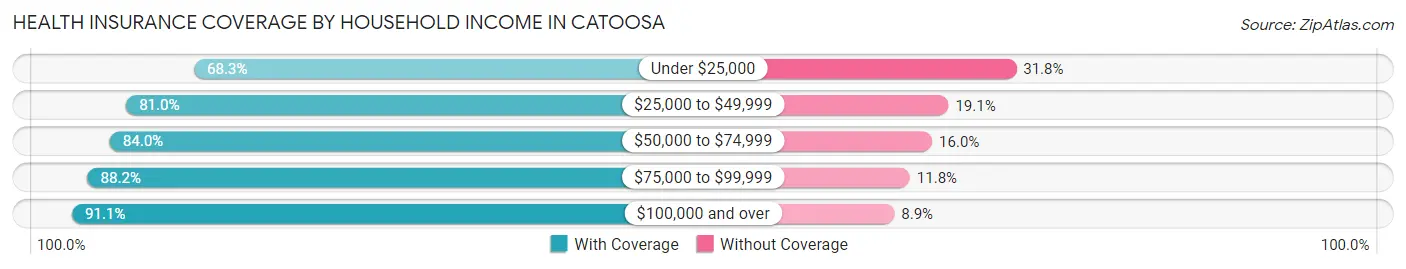
| Household Income | With Coverage | Without Coverage |
| Under $25,000 | 589 (68.2%) | 274 (31.8%) |
| $25,000 to $49,999 | 1,215 (80.9%) | 286 (19.1%) |
| $50,000 to $74,999 | 1,277 (84.0%) | 243 (16.0%) |
| $75,000 to $99,999 | 1,321 (88.2%) | 177 (11.8%) |
| $100,000 and over | 2,025 (91.1%) | 198 (8.9%) |
Public vs Private Health Insurance Coverage by Age in Catoosa
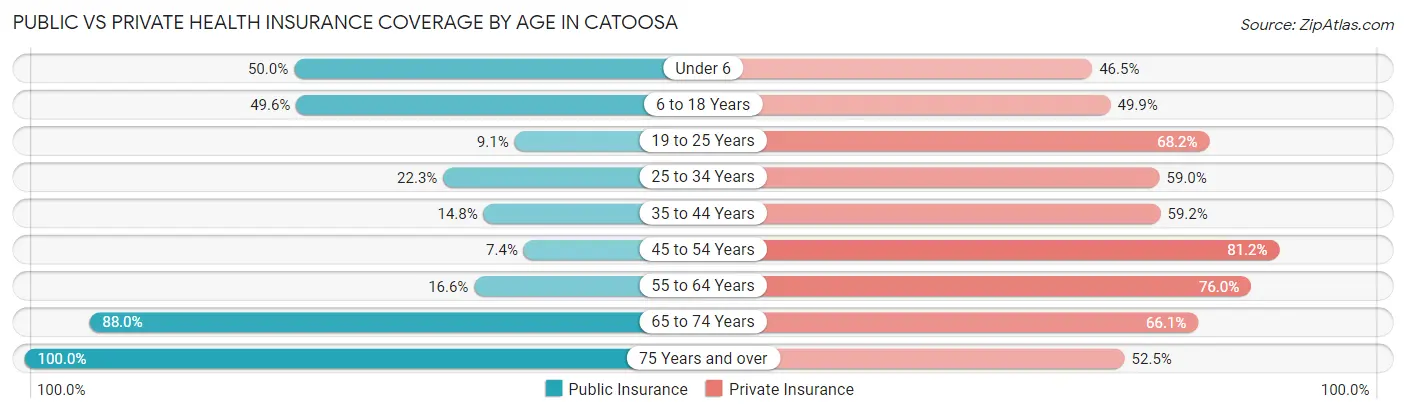
| Age Bracket | Public Insurance | Private Insurance |
| Under 6 | 199 (50.0%) | 185 (46.5%) |
| 6 to 18 Years | 672 (49.6%) | 676 (49.9%) |
| 19 to 25 Years | 73 (9.1%) | 549 (68.2%) |
| 25 to 34 Years | 216 (22.3%) | 571 (59.0%) |
| 35 to 44 Years | 164 (14.8%) | 655 (59.2%) |
| 45 to 54 Years | 70 (7.3%) | 773 (81.2%) |
| 55 to 64 Years | 161 (16.6%) | 739 (75.9%) |
| 65 to 74 Years | 447 (88.0%) | 336 (66.1%) |
| 75 Years and over | 539 (100.0%) | 283 (52.5%) |
| Total | 2,541 (33.4%) | 4,767 (62.7%) |
Disability Status by Sex by Age in Catoosa
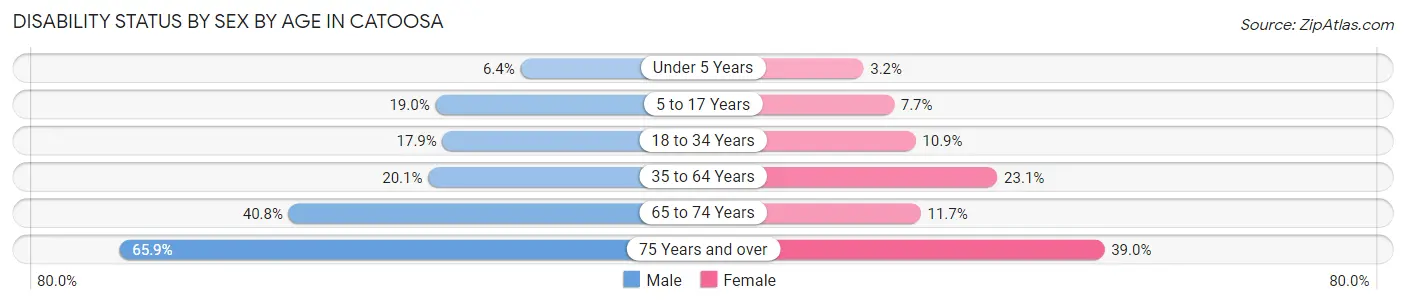
| Age Bracket | Male | Female |
| Under 5 Years | 7 (6.4%) | 6 (3.2%) |
| 5 to 17 Years | 143 (19.0%) | 45 (7.7%) |
| 18 to 34 Years | 175 (17.9%) | 100 (10.9%) |
| 35 to 64 Years | 309 (20.1%) | 344 (23.1%) |
| 65 to 74 Years | 106 (40.8%) | 29 (11.7%) |
| 75 Years and over | 176 (65.9%) | 106 (39.0%) |
Disability Class by Sex by Age in Catoosa
Disability Class: Hearing Difficulty
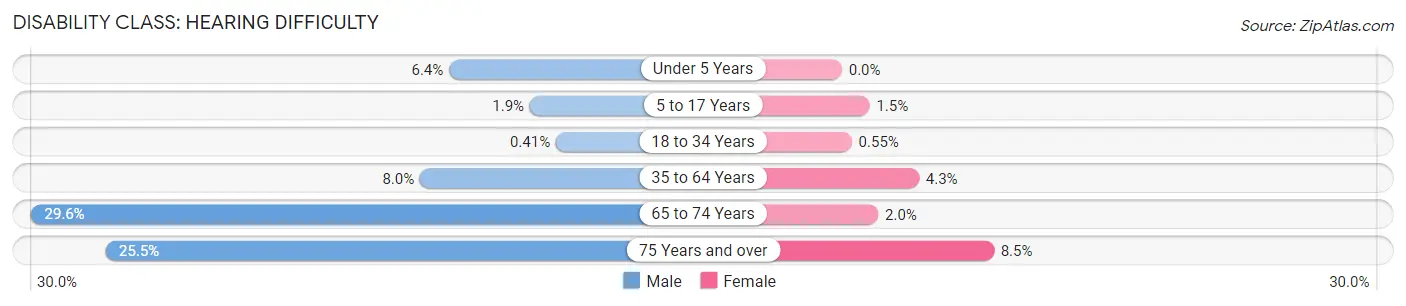
| Age Bracket | Male | Female |
| Under 5 Years | 7 (6.4%) | 0 (0.0%) |
| 5 to 17 Years | 14 (1.9%) | 9 (1.5%) |
| 18 to 34 Years | 4 (0.4%) | 5 (0.5%) |
| 35 to 64 Years | 123 (8.0%) | 64 (4.3%) |
| 65 to 74 Years | 77 (29.6%) | 5 (2.0%) |
| 75 Years and over | 68 (25.5%) | 23 (8.5%) |
Disability Class: Vision Difficulty
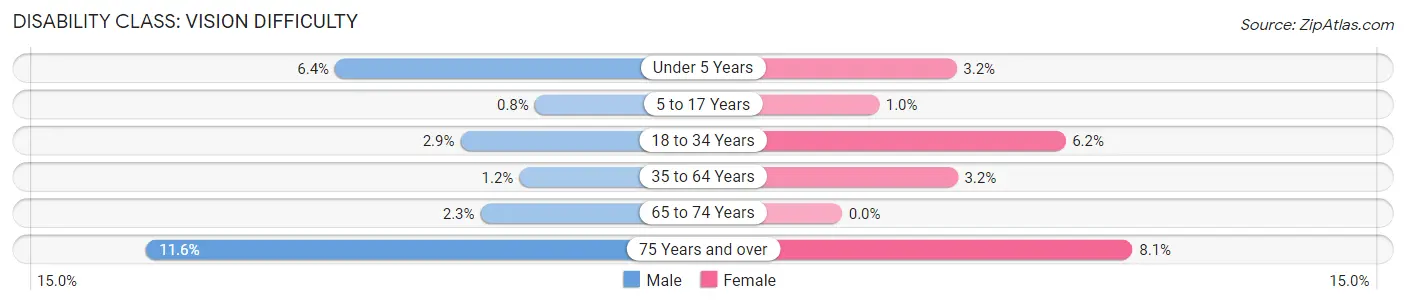
| Age Bracket | Male | Female |
| Under 5 Years | 7 (6.4%) | 6 (3.2%) |
| 5 to 17 Years | 6 (0.8%) | 6 (1.0%) |
| 18 to 34 Years | 28 (2.9%) | 57 (6.2%) |
| 35 to 64 Years | 19 (1.2%) | 48 (3.2%) |
| 65 to 74 Years | 6 (2.3%) | 0 (0.0%) |
| 75 Years and over | 31 (11.6%) | 22 (8.1%) |
Disability Class: Cognitive Difficulty
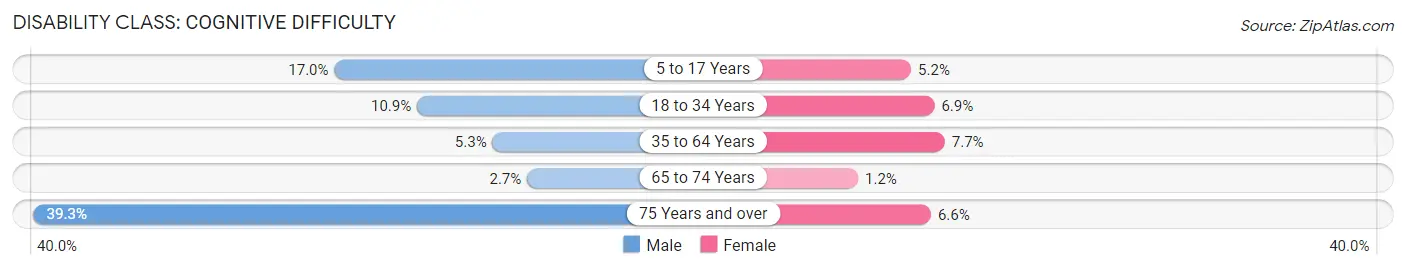
| Age Bracket | Male | Female |
| 5 to 17 Years | 128 (17.0%) | 30 (5.1%) |
| 18 to 34 Years | 106 (10.9%) | 63 (6.9%) |
| 35 to 64 Years | 81 (5.3%) | 114 (7.6%) |
| 65 to 74 Years | 7 (2.7%) | 3 (1.2%) |
| 75 Years and over | 105 (39.3%) | 18 (6.6%) |
Disability Class: Ambulatory Difficulty
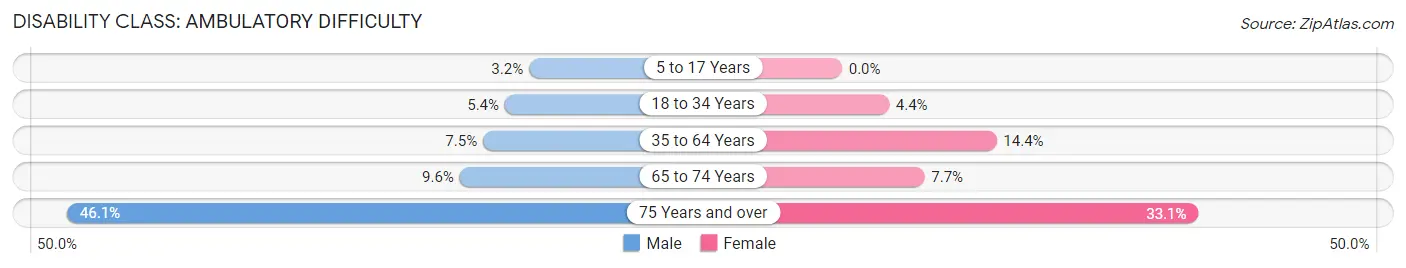
| Age Bracket | Male | Female |
| 5 to 17 Years | 24 (3.2%) | 0 (0.0%) |
| 18 to 34 Years | 53 (5.4%) | 40 (4.4%) |
| 35 to 64 Years | 115 (7.5%) | 214 (14.3%) |
| 65 to 74 Years | 25 (9.6%) | 19 (7.7%) |
| 75 Years and over | 123 (46.1%) | 90 (33.1%) |
Disability Class: Self-Care Difficulty
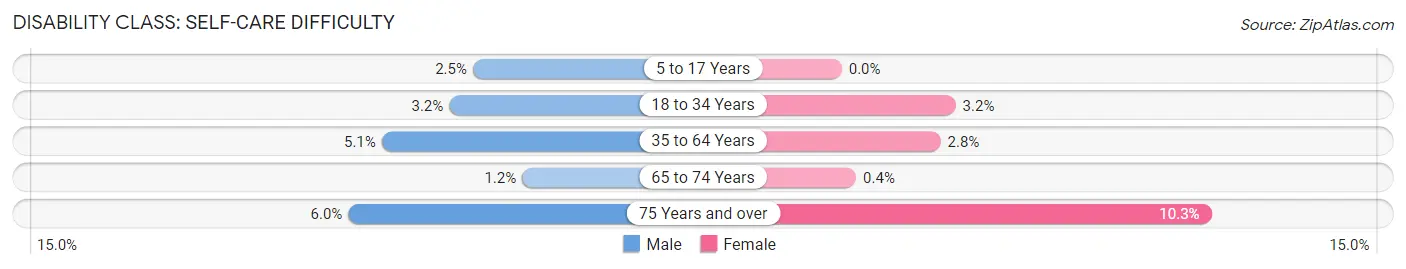
| Age Bracket | Male | Female |
| 5 to 17 Years | 19 (2.5%) | 0 (0.0%) |
| 18 to 34 Years | 31 (3.2%) | 29 (3.2%) |
| 35 to 64 Years | 78 (5.1%) | 41 (2.8%) |
| 65 to 74 Years | 3 (1.1%) | 1 (0.4%) |
| 75 Years and over | 16 (6.0%) | 28 (10.3%) |
Technology Access in Catoosa
Computing Device Access in Catoosa
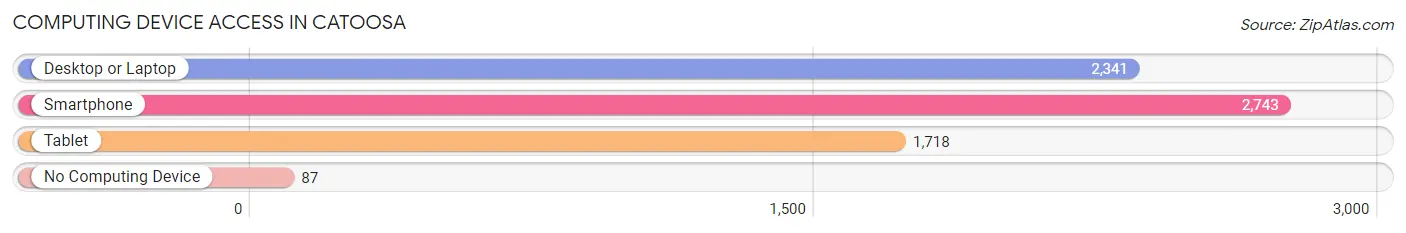
| Device Type | # Households | % Households |
| Desktop or Laptop | 2,341 | 78.0% |
| Smartphone | 2,743 | 91.4% |
| Tablet | 1,718 | 57.2% |
| No Computing Device | 87 | 2.9% |
| Total | 3,002 | 100.0% |
Internet Access in Catoosa
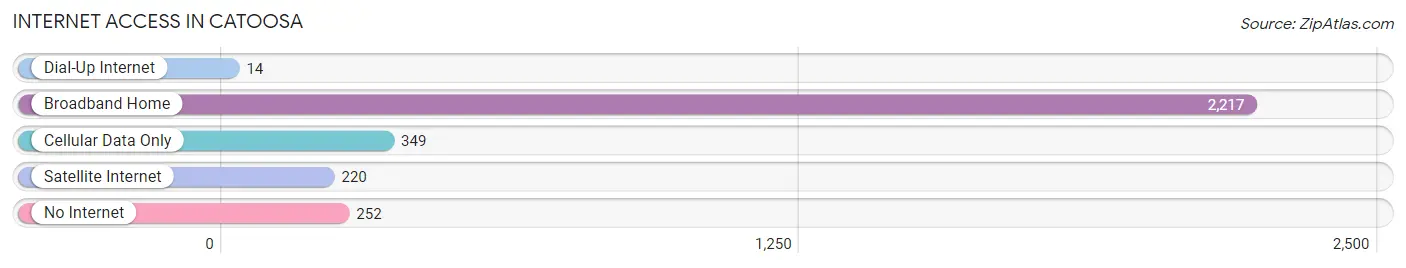
| Internet Type | # Households | % Households |
| Dial-Up Internet | 14 | 0.5% |
| Broadband Home | 2,217 | 73.9% |
| Cellular Data Only | 349 | 11.6% |
| Satellite Internet | 220 | 7.3% |
| No Internet | 252 | 8.4% |
| Total | 3,002 | 100.0% |
Catoosa Summary
Catoosa is a city located in Rogers County, Oklahoma, United States. The population was 7,159 at the 2010 census, an increase of 11.2 percent from 6,419 at the 2000 census. It is part of the Tulsa Metropolitan Statistical Area.
History
Catoosa was founded in 1872 by the Missouri, Kansas and Texas Railway. The town was named after Chief Catoosa of the Cherokee Nation. The town was incorporated in Indian Territory in 1898.
Geography
Catoosa is located at 36°11′45″N 95°48′17″W (36.195833, -95.804722). According to the United States Census Bureau, the city has a total area of 5.2 square miles (13.4 km2), all land.
Economy
Catoosa is home to several large industrial parks, including the Port of Catoosa, which is the largest inland port in the United States. The port is located on the McClellan-Kerr Arkansas River Navigation System and is connected to the Gulf of Mexico via the Arkansas River. The port is home to several large companies, including the Tulsa Port of Catoosa, which is the largest inland port in the United States.
The city is also home to several large manufacturing companies, including the Tulsa Refinery, which is the largest refinery in the United States. The refinery is owned by Valero Energy Corporation and produces gasoline, diesel fuel, jet fuel, and other petroleum products.
Demographics
As of the census of 2000, there were 6,419 people, 2,541 households, and 1,845 families residing in the city. The population density was 1,231.2 people per square mile (475.2/km2). There were 2,717 housing units at an average density of 522.2 per square mile (201.6/km2). The racial makeup of the city was 79.2% White, 1.2% African American, 11.7% Native American, 0.3% Asian, 0.1% Pacific Islander, 4.2% from other races, and 3.4% from two or more races. Hispanic or Latino of any race were 8.2% of the population.
There were 2,541 households, out of which 33.2% had children under the age of 18 living with them, 56.2% were married couples living together, 12.2% had a female householder with no husband present, and 27.2% were non-families. 23.2% of all households were made up of individuals, and 9.2% had someone living alone who was 65 years of age or older. The average household size was 2.52 and the average family size was 2.96.
In the city, the population was spread out, with 25.7% under the age of 18, 8.2% from 18 to 24, 28.3% from 25 to 44, 24.2% from 45 to 64, and 13.6% who were 65 years of age or older. The median age was 37 years. For every 100 females, there were 93.2 males. For every 100 females age 18 and over, there were 89.7 males.
The median income for a household in the city was $35,938, and the median income for a family was $41,944. Males had a median income of $31,912 versus $22,917 for females. The per capita income for the city was $17,890. About 8.2% of families and 10.3% of the population were below the poverty line, including 13.2% of those under age 18 and 8.2% of those age 65 or over.
Common Questions
What is Per Capita Income in Catoosa?
Per Capita income in Catoosa is $32,620.
What is the Median Family Income in Catoosa?
Median Family Income in Catoosa is $78,446.
What is the Median Household income in Catoosa?
Median Household Income in Catoosa is $67,143.
What is Income or Wage Gap in Catoosa?
Income or Wage Gap in Catoosa is 28.1%.
Women in Catoosa earn 71.9 cents for every dollar earned by a man.
What is Family Income Deficit in Catoosa?
Family Income Deficit in Catoosa is $11,236.
Families that are below poverty line in Catoosa earn $11,236 less on average than the poverty threshold level.
What is Inequality or Gini Index in Catoosa?
Inequality or Gini Index in Catoosa is 0.40.
What is the Total Population of Catoosa?
Total Population of Catoosa is 7,680.
What is the Total Male Population of Catoosa?
Total Male Population of Catoosa is 3,945.
What is the Total Female Population of Catoosa?
Total Female Population of Catoosa is 3,735.
What is the Ratio of Males per 100 Females in Catoosa?
There are 105.62 Males per 100 Females in Catoosa.
What is the Ratio of Females per 100 Males in Catoosa?
There are 94.68 Females per 100 Males in Catoosa.
What is the Median Population Age in Catoosa?
Median Population Age in Catoosa is 37.8 Years.
What is the Average Family Size in Catoosa
Average Family Size in Catoosa is 3.0 People.
What is the Average Household Size in Catoosa
Average Household Size in Catoosa is 2.5 People.
How Large is the Labor Force in Catoosa?
There are 4,153 People in the Labor Forcein in Catoosa.
What is the Percentage of People in the Labor Force in Catoosa?
66.6% of People are in the Labor Force in Catoosa.
What is the Unemployment Rate in Catoosa?
Unemployment Rate in Catoosa is 5.6%.