Caney, OK Map & Demographics
Caney Map
Caney Overview
$29,734
PER CAPITA INCOME
$100,938
AVG FAMILY INCOME
$63,750
AVG HOUSEHOLD INCOME
38.8%
WAGE / INCOME GAP [ % ]
61.2¢/ $1
WAGE / INCOME GAP [ $ ]
0.52
INEQUALITY / GINI INDEX
401
TOTAL POPULATION
234
MALE POPULATION
167
FEMALE POPULATION
140.12
MALES / 100 FEMALES
71.37
FEMALES / 100 MALES
31.1
MEDIAN AGE
4.5
AVG FAMILY SIZE
3.1
AVG HOUSEHOLD SIZE
238
LABOR FORCE [ PEOPLE ]
76.8%
PERCENT IN LABOR FORCE
0.4%
UNEMPLOYMENT RATE
Caney Zip Codes
Income in Caney
Income Overview in Caney
Per Capita Income in Caney is $29,734, while median incomes of families and households are $100,938 and $63,750 respectively.
| Characteristic | Number | Measure |
| Per Capita Income | 401 | $29,734 |
| Median Family Income | 74 | $100,938 |
| Mean Family Income | 74 | $117,173 |
| Median Household Income | 130 | $63,750 |
| Mean Household Income | 130 | $79,683 |
| Income Deficit | 74 | $0 |
| Wage / Income Gap (%) | 401 | 38.78% |
| Wage / Income Gap ($) | 401 | 61.22¢ per $1 |
| Gini / Inequality Index | 401 | 0.52 |
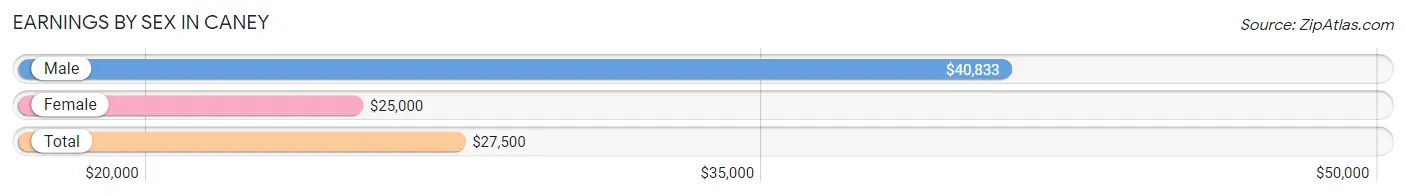
Earnings by Sex in Caney
Average Earnings in Caney are $27,500, $40,833 for men and $25,000 for women, a difference of 38.8%.
| Sex | Number | Average Earnings |
| Male | 153 (64.3%) | $40,833 |
| Female | 85 (35.7%) | $25,000 |
| Total | 238 (100.0%) | $27,500 |
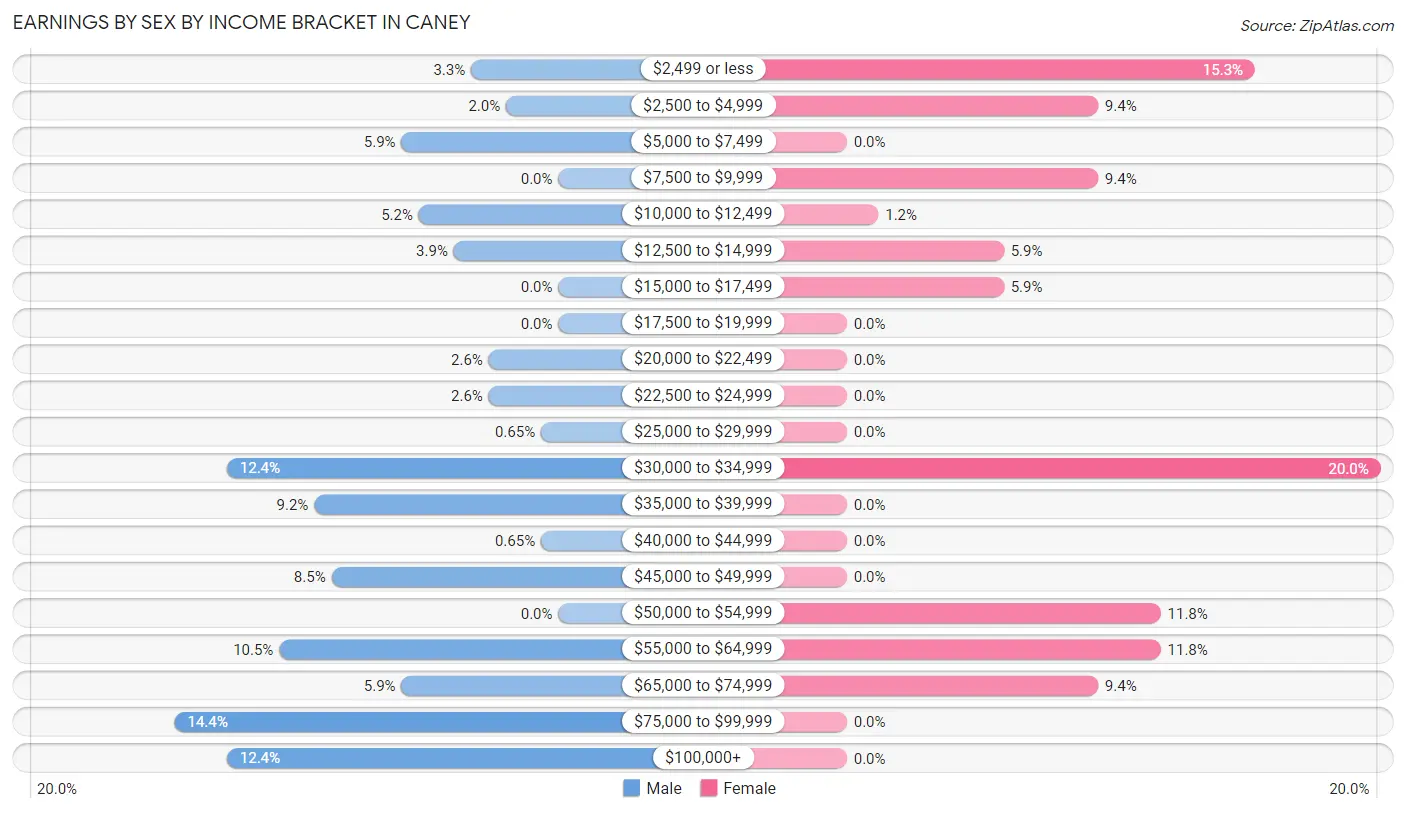
Earnings by Sex by Income Bracket in Caney
The most common earnings brackets in Caney are $75,000 to $99,999 for men (22 | 14.4%) and $30,000 to $34,999 for women (17 | 20.0%).
| Income | Male | Female |
| $2,499 or less | 5 (3.3%) | 13 (15.3%) |
| $2,500 to $4,999 | 3 (2.0%) | 8 (9.4%) |
| $5,000 to $7,499 | 9 (5.9%) | 0 (0.0%) |
| $7,500 to $9,999 | 0 (0.0%) | 8 (9.4%) |
| $10,000 to $12,499 | 8 (5.2%) | 1 (1.2%) |
| $12,500 to $14,999 | 6 (3.9%) | 5 (5.9%) |
| $15,000 to $17,499 | 0 (0.0%) | 5 (5.9%) |
| $17,500 to $19,999 | 0 (0.0%) | 0 (0.0%) |
| $20,000 to $22,499 | 4 (2.6%) | 0 (0.0%) |
| $22,500 to $24,999 | 4 (2.6%) | 0 (0.0%) |
| $25,000 to $29,999 | 1 (0.6%) | 0 (0.0%) |
| $30,000 to $34,999 | 19 (12.4%) | 17 (20.0%) |
| $35,000 to $39,999 | 14 (9.1%) | 0 (0.0%) |
| $40,000 to $44,999 | 1 (0.6%) | 0 (0.0%) |
| $45,000 to $49,999 | 13 (8.5%) | 0 (0.0%) |
| $50,000 to $54,999 | 0 (0.0%) | 10 (11.8%) |
| $55,000 to $64,999 | 16 (10.5%) | 10 (11.8%) |
| $65,000 to $74,999 | 9 (5.9%) | 8 (9.4%) |
| $75,000 to $99,999 | 22 (14.4%) | 0 (0.0%) |
| $100,000+ | 19 (12.4%) | 0 (0.0%) |
| Total | 153 (100.0%) | 85 (100.0%) |
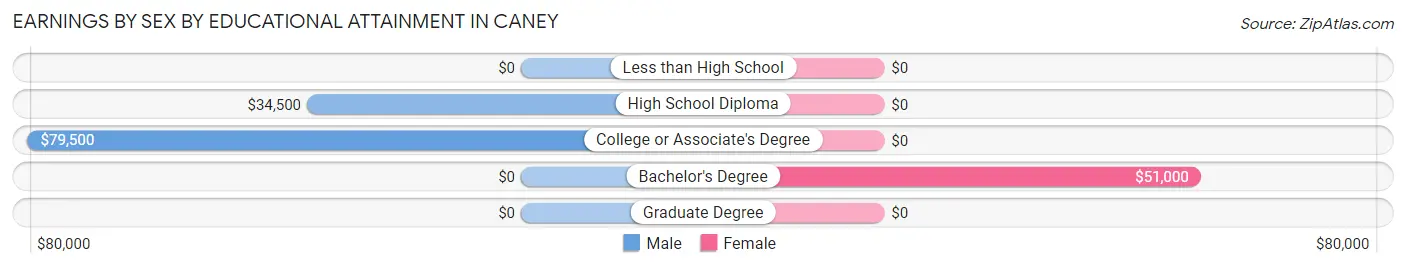
Earnings by Sex by Educational Attainment in Caney
Average earnings in Caney are $59,063 for men and $34,219 for women, a difference of 42.1%. Men with an educational attainment of college or associate's degree enjoy the highest average annual earnings of $79,500, while those with high school diploma education earn the least with $34,500. Women with an educational attainment of bachelor's degree earn the most with the average annual earnings of $51,000, while those with bachelor's degree education have the smallest earnings of $51,000.
| Educational Attainment | Male Income | Female Income |
| Less than High School | - | - |
| High School Diploma | $34,500 | $0 |
| College or Associate's Degree | $79,500 | $0 |
| Bachelor's Degree | - | - |
| Graduate Degree | - | - |
| Total | $59,063 | $34,219 |
Family Income in Caney
Family Income Brackets in Caney
According to the Caney family income data, there are 17 families falling into the $100,000 to $149,999 income range, which is the most common income bracket and makes up 23.0% of all families.
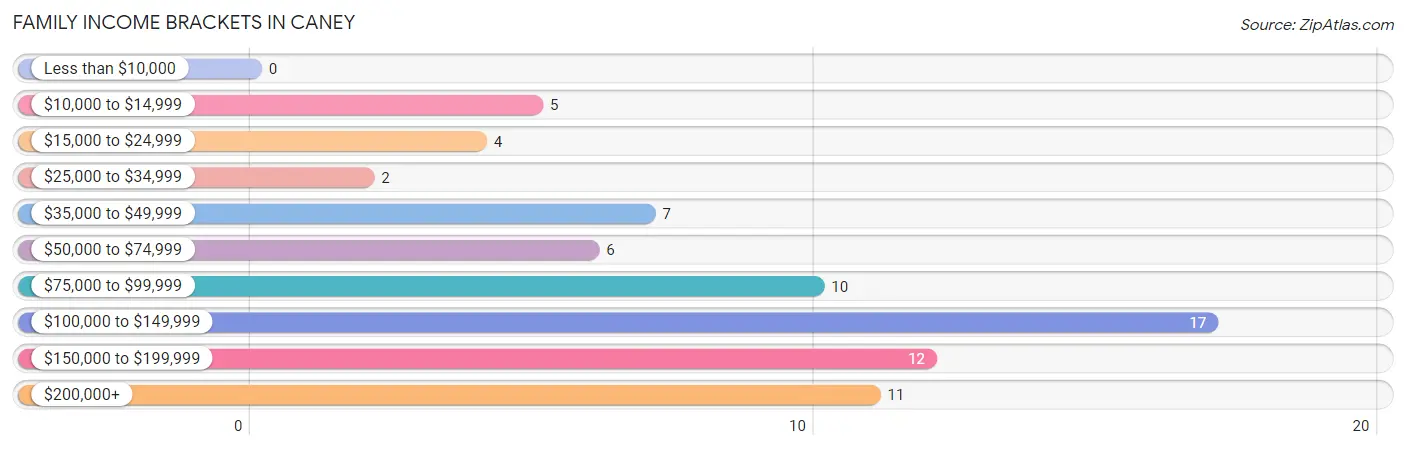
| Income Bracket | # Families | % Families |
| Less than $10,000 | 0 | 0.0% |
| $10,000 to $14,999 | 5 | 6.8% |
| $15,000 to $24,999 | 4 | 5.4% |
| $25,000 to $34,999 | 2 | 2.7% |
| $35,000 to $49,999 | 7 | 9.5% |
| $50,000 to $74,999 | 6 | 8.1% |
| $75,000 to $99,999 | 10 | 13.5% |
| $100,000 to $149,999 | 17 | 23.0% |
| $150,000 to $199,999 | 12 | 16.2% |
| $200,000+ | 11 | 14.9% |
Family Income by Famaliy Size in Caney
2-person families (21 | 28.4%) account for the highest median family income in Caney with $99,250 per family, while 2-person families (21 | 28.4%) have the highest median income of $49,625 per family member.
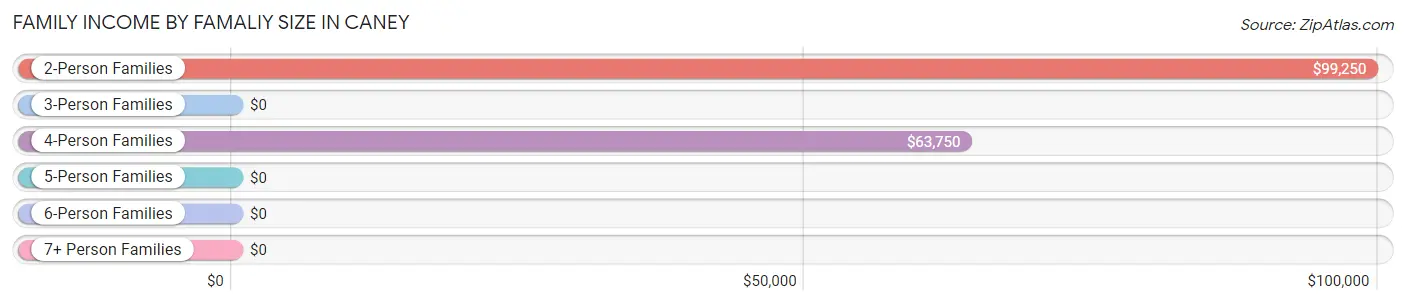
| Income Bracket | # Families | Median Income |
| 2-Person Families | 21 (28.4%) | $99,250 |
| 3-Person Families | 7 (9.5%) | $0 |
| 4-Person Families | 18 (24.3%) | $63,750 |
| 5-Person Families | 20 (27.0%) | $0 |
| 6-Person Families | 8 (10.8%) | $0 |
| 7+ Person Families | 0 (0.0%) | $0 |
| Total | 74 (100.0%) | $100,938 |
Family Income by Number of Earners in Caney
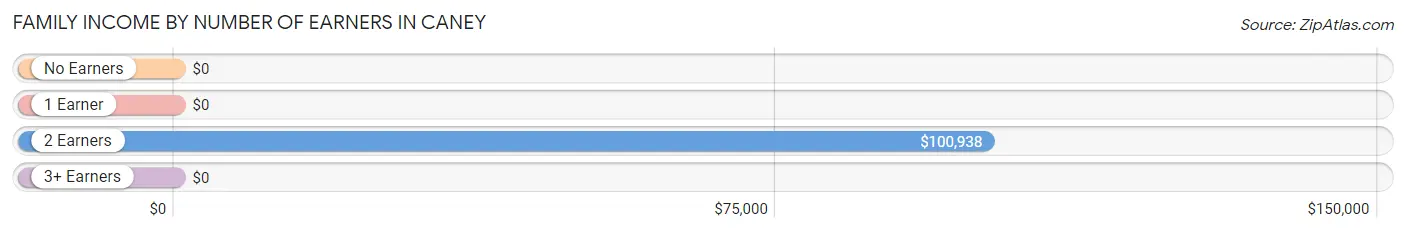
| Number of Earners | # Families | Median Income |
| No Earners | 2 (2.7%) | $0 |
| 1 Earner | 7 (9.5%) | $0 |
| 2 Earners | 38 (51.3%) | $100,938 |
| 3+ Earners | 27 (36.5%) | $0 |
| Total | 74 (100.0%) | $100,938 |
Household Income in Caney
Household Income Brackets in Caney
With 26 households falling in the category, the less than $10,000 income range is the most frequent in Caney, accounting for 20.0% of all households.
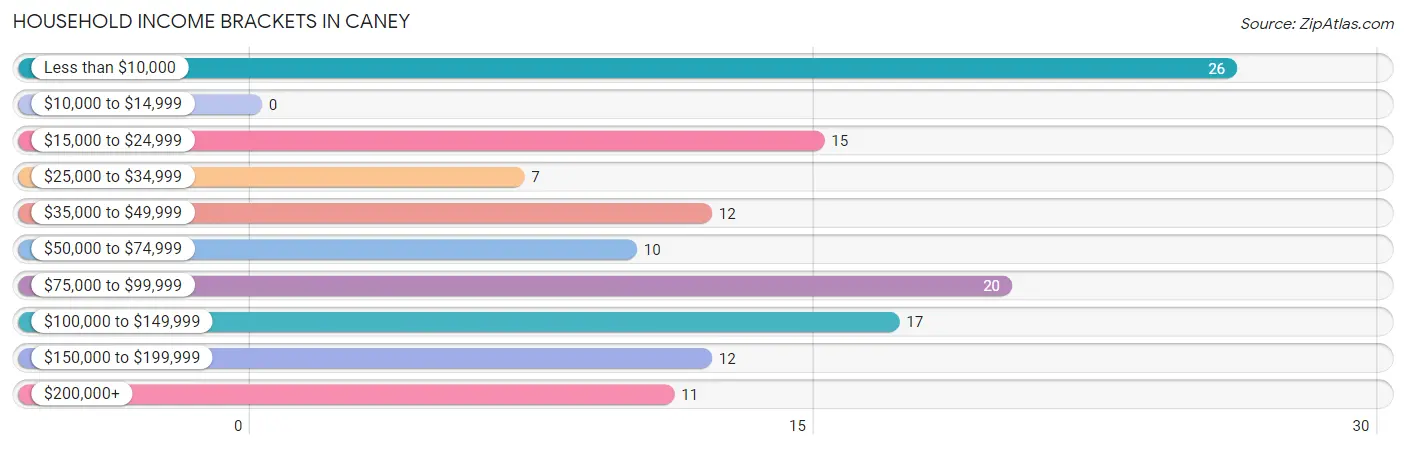
| Income Bracket | # Households | % Households |
| Less than $10,000 | 26 | 20.0% |
| $10,000 to $14,999 | 0 | 0.0% |
| $15,000 to $24,999 | 15 | 11.5% |
| $25,000 to $34,999 | 7 | 5.4% |
| $35,000 to $49,999 | 12 | 9.2% |
| $50,000 to $74,999 | 10 | 7.7% |
| $75,000 to $99,999 | 20 | 15.4% |
| $100,000 to $149,999 | 17 | 13.1% |
| $150,000 to $199,999 | 12 | 9.2% |
| $200,000+ | 11 | 8.5% |
Household Income by Householder Age in Caney
The median household income in Caney is $63,750, with the highest median household income of $100,313 found in the 45 to 64 years age bracket for the primary householder. A total of 54 households (41.5%) fall into this category. Meanwhile, the 15 to 24 years age bracket for the primary householder has the lowest median household income of $0, with 13 households (10.0%) in this group.
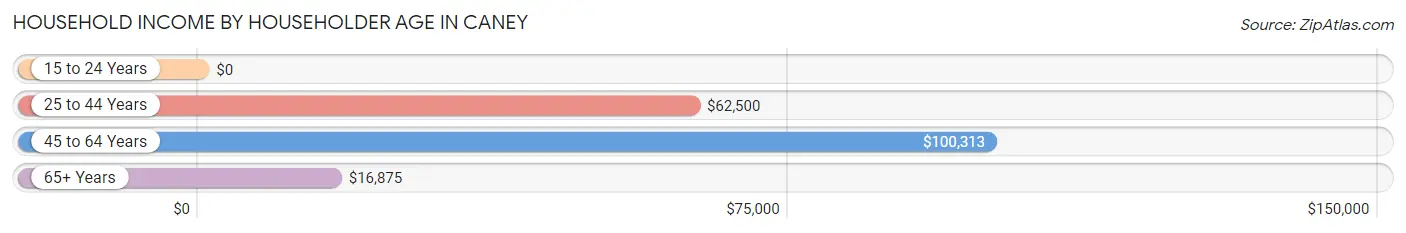
| Income Bracket | # Households | Median Income |
| 15 to 24 Years | 13 (10.0%) | $0 |
| 25 to 44 Years | 40 (30.8%) | $62,500 |
| 45 to 64 Years | 54 (41.5%) | $100,313 |
| 65+ Years | 23 (17.7%) | $16,875 |
| Total | 130 (100.0%) | $63,750 |
Poverty in Caney
Income Below Poverty by Sex and Age in Caney
With 21.4% poverty level for males and 22.2% for females among the residents of Caney, 55 to 64 year old males and 25 to 34 year old females are the most vulnerable to poverty, with 16 males (51.6%) and 11 females (100.0%) in their respective age groups living below the poverty level.
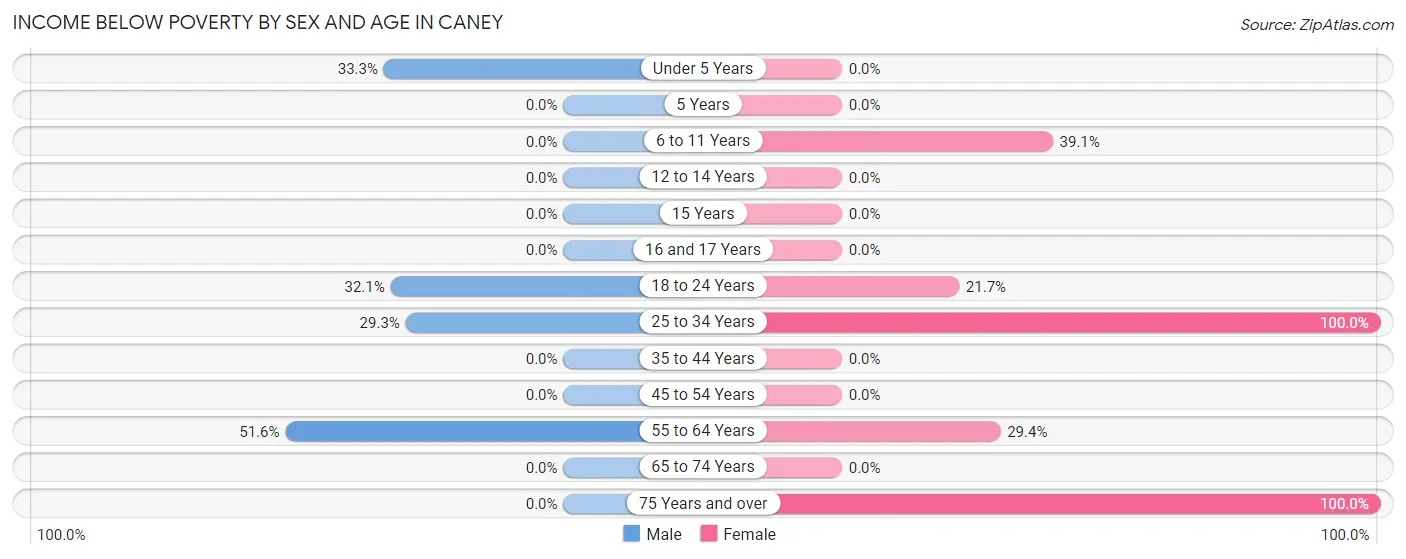
| Age Bracket | Male | Female |
| Under 5 Years | 5 (33.3%) | 0 (0.0%) |
| 5 Years | 0 (0.0%) | 0 (0.0%) |
| 6 to 11 Years | 0 (0.0%) | 9 (39.1%) |
| 12 to 14 Years | 0 (0.0%) | 0 (0.0%) |
| 15 Years | 0 (0.0%) | 0 (0.0%) |
| 16 and 17 Years | 0 (0.0%) | 0 (0.0%) |
| 18 to 24 Years | 17 (32.1%) | 5 (21.7%) |
| 25 to 34 Years | 12 (29.3%) | 11 (100.0%) |
| 35 to 44 Years | 0 (0.0%) | 0 (0.0%) |
| 45 to 54 Years | 0 (0.0%) | 0 (0.0%) |
| 55 to 64 Years | 16 (51.6%) | 5 (29.4%) |
| 65 to 74 Years | 0 (0.0%) | 0 (0.0%) |
| 75 Years and over | 0 (0.0%) | 7 (100.0%) |
| Total | 50 (21.4%) | 37 (22.2%) |
Income Above Poverty by Sex and Age in Caney
According to the poverty statistics in Caney, males aged 6 to 11 years and females aged 12 to 14 years are the age groups that are most secure financially, with 100.0% of males and 100.0% of females in these age groups living above the poverty line.
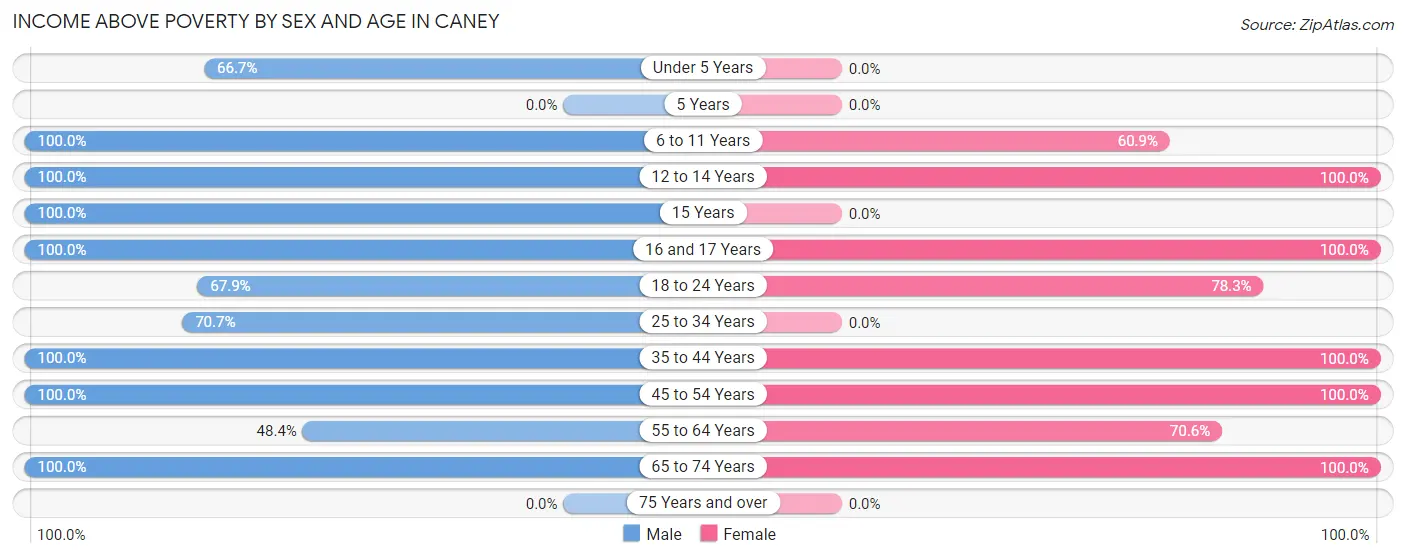
| Age Bracket | Male | Female |
| Under 5 Years | 10 (66.7%) | 0 (0.0%) |
| 5 Years | 0 (0.0%) | 0 (0.0%) |
| 6 to 11 Years | 8 (100.0%) | 14 (60.9%) |
| 12 to 14 Years | 11 (100.0%) | 15 (100.0%) |
| 15 Years | 19 (100.0%) | 0 (0.0%) |
| 16 and 17 Years | 3 (100.0%) | 1 (100.0%) |
| 18 to 24 Years | 36 (67.9%) | 18 (78.3%) |
| 25 to 34 Years | 29 (70.7%) | 0 (0.0%) |
| 35 to 44 Years | 11 (100.0%) | 21 (100.0%) |
| 45 to 54 Years | 34 (100.0%) | 29 (100.0%) |
| 55 to 64 Years | 15 (48.4%) | 12 (70.6%) |
| 65 to 74 Years | 8 (100.0%) | 20 (100.0%) |
| 75 Years and over | 0 (0.0%) | 0 (0.0%) |
| Total | 184 (78.6%) | 130 (77.8%) |
Income Below Poverty Among Married-Couple Families in Caney
The poverty statistics for married-couple families in Caney show that 13.0% or 9 of the total 69 families live below the poverty line. Families with 1 or 2 children have the highest poverty rate of 30.0%, comprising of 9 families. On the other hand, families with no children have the lowest poverty rate of 0.0%, which includes 0 families.
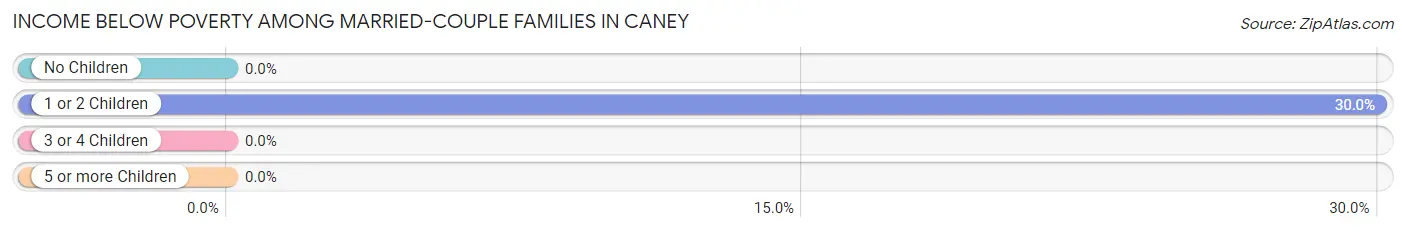
| Children | Above Poverty | Below Poverty |
| No Children | 31 (100.0%) | 0 (0.0%) |
| 1 or 2 Children | 21 (70.0%) | 9 (30.0%) |
| 3 or 4 Children | 8 (100.0%) | 0 (0.0%) |
| 5 or more Children | 0 (0.0%) | 0 (0.0%) |
| Total | 60 (87.0%) | 9 (13.0%) |
Income Below Poverty Among Single-Parent Households in Caney
| Children | Single Father | Single Mother |
| No Children | 0 (0.0%) | 0 (0.0%) |
| 1 or 2 Children | 0 (0.0%) | 0 (0.0%) |
| 3 or 4 Children | 0 (0.0%) | 0 (0.0%) |
| 5 or more Children | 0 (0.0%) | 0 (0.0%) |
| Total | 0 (0.0%) | 0 (0.0%) |
Income Below Poverty Among Married-Couple vs Single-Parent Households in Caney
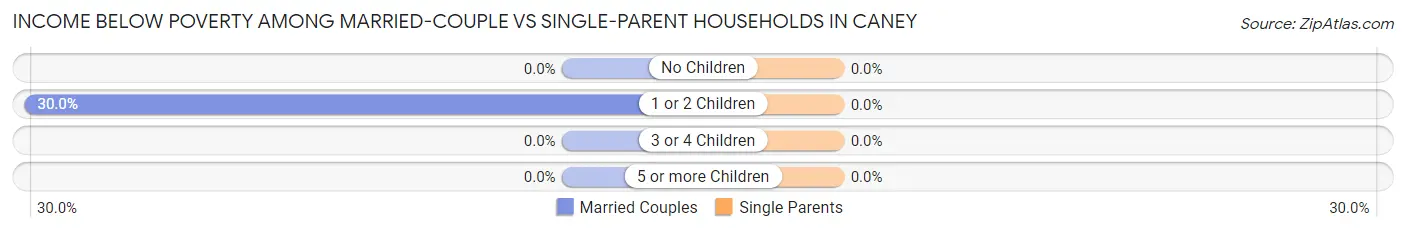
| Children | Married-Couple Families | Single-Parent Households |
| No Children | 0 (0.0%) | 0 (0.0%) |
| 1 or 2 Children | 9 (30.0%) | 0 (0.0%) |
| 3 or 4 Children | 0 (0.0%) | 0 (0.0%) |
| 5 or more Children | 0 (0.0%) | 0 (0.0%) |
| Total | 9 (13.0%) | 0 (0.0%) |
Race in Caney
The most populous races in Caney are White / Caucasian (207 | 51.6%), Native / Alaskan (118 | 29.4%), and Two or more Races (71 | 17.7%).
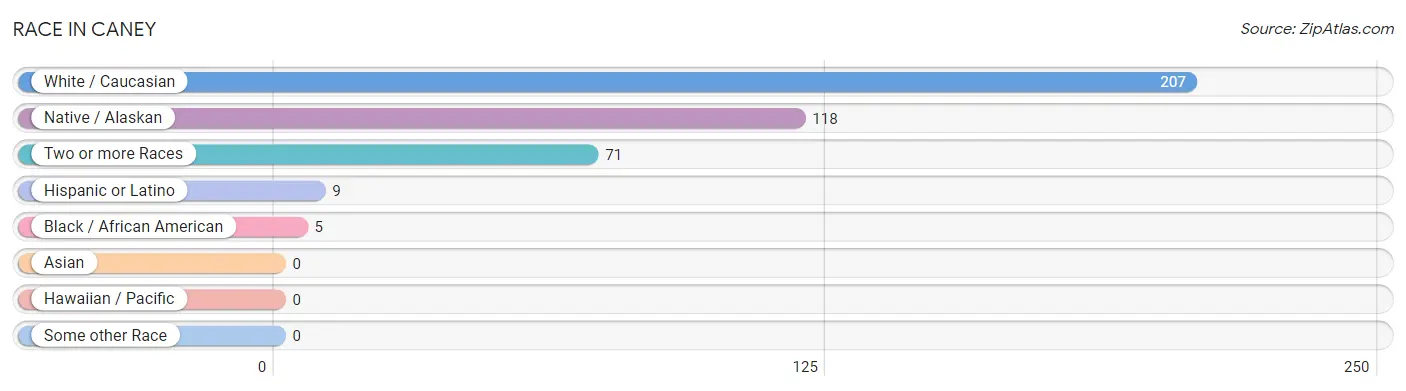
| Race | # Population | % Population |
| Asian | 0 | 0.0% |
| Black / African American | 5 | 1.3% |
| Hawaiian / Pacific | 0 | 0.0% |
| Hispanic or Latino | 9 | 2.2% |
| Native / Alaskan | 118 | 29.4% |
| White / Caucasian | 207 | 51.6% |
| Two or more Races | 71 | 17.7% |
| Some other Race | 0 | 0.0% |
| Total | 401 | 100.0% |
Ancestry in Caney
The most populous ancestries reported in Caney are Cherokee (176 | 43.9%), American (41 | 10.2%), English (39 | 9.7%), Irish (24 | 6.0%), and German (15 | 3.7%), together accounting for 73.6% of all Caney residents.
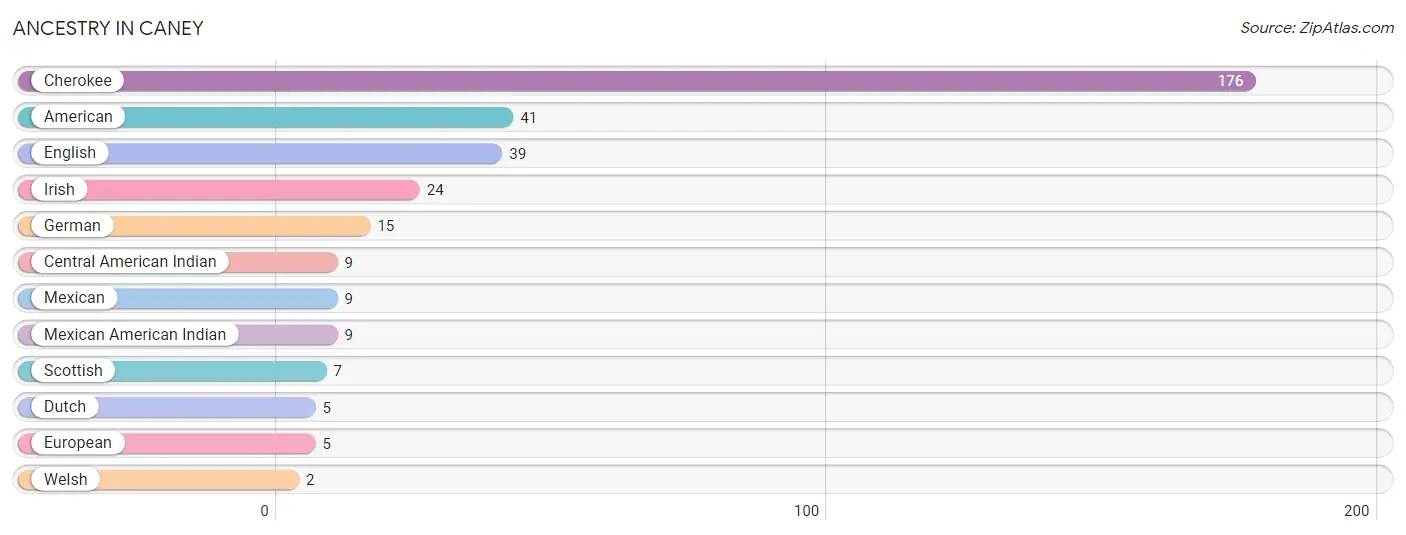
| Ancestry | # Population | % Population |
| American | 41 | 10.2% |
| Central American Indian | 9 | 2.2% |
| Cherokee | 176 | 43.9% |
| Dutch | 5 | 1.3% |
| English | 39 | 9.7% |
| European | 5 | 1.3% |
| German | 15 | 3.7% |
| Irish | 24 | 6.0% |
| Mexican | 9 | 2.2% |
| Mexican American Indian | 9 | 2.2% |
| Scottish | 7 | 1.8% |
| Welsh | 2 | 0.5% | View All 12 Rows |
Immigrants in Caney

| Immigration Origin | # Population | % Population | View All 0 Rows |
Sex and Age in Caney
Sex and Age in Caney
The most populous age groups in Caney are 20 to 24 Years (40 | 17.1%) for men and 10 to 14 Years (22 | 13.2%) for women.
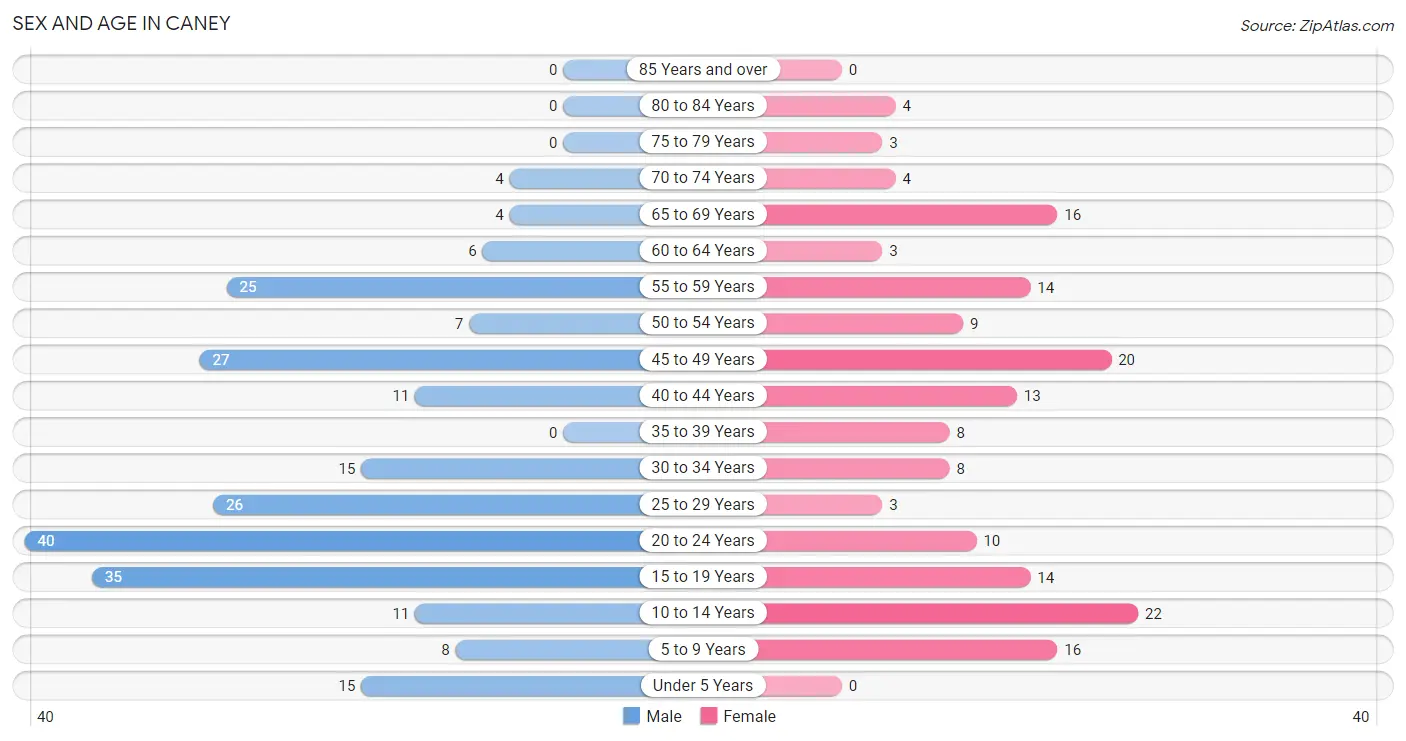
| Age Bracket | Male | Female |
| Under 5 Years | 15 (6.4%) | 0 (0.0%) |
| 5 to 9 Years | 8 (3.4%) | 16 (9.6%) |
| 10 to 14 Years | 11 (4.7%) | 22 (13.2%) |
| 15 to 19 Years | 35 (15.0%) | 14 (8.4%) |
| 20 to 24 Years | 40 (17.1%) | 10 (6.0%) |
| 25 to 29 Years | 26 (11.1%) | 3 (1.8%) |
| 30 to 34 Years | 15 (6.4%) | 8 (4.8%) |
| 35 to 39 Years | 0 (0.0%) | 8 (4.8%) |
| 40 to 44 Years | 11 (4.7%) | 13 (7.8%) |
| 45 to 49 Years | 27 (11.5%) | 20 (12.0%) |
| 50 to 54 Years | 7 (3.0%) | 9 (5.4%) |
| 55 to 59 Years | 25 (10.7%) | 14 (8.4%) |
| 60 to 64 Years | 6 (2.6%) | 3 (1.8%) |
| 65 to 69 Years | 4 (1.7%) | 16 (9.6%) |
| 70 to 74 Years | 4 (1.7%) | 4 (2.4%) |
| 75 to 79 Years | 0 (0.0%) | 3 (1.8%) |
| 80 to 84 Years | 0 (0.0%) | 4 (2.4%) |
| 85 Years and over | 0 (0.0%) | 0 (0.0%) |
| Total | 234 (100.0%) | 167 (100.0%) |
Families and Households in Caney
Median Family Size in Caney
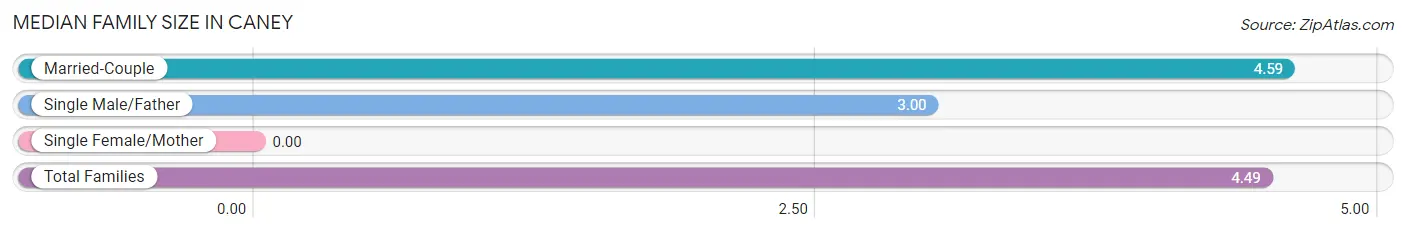
| Family Type | # Families | Family Size |
| Married-Couple | 69 (93.2%) | 4.59 |
| Single Male/Father | 5 (6.8%) | 3.00 |
| Single Female/Mother | 0 (0.0%) | - |
| Total Families | 74 (100.0%) | 4.49 |
Median Household Size in Caney
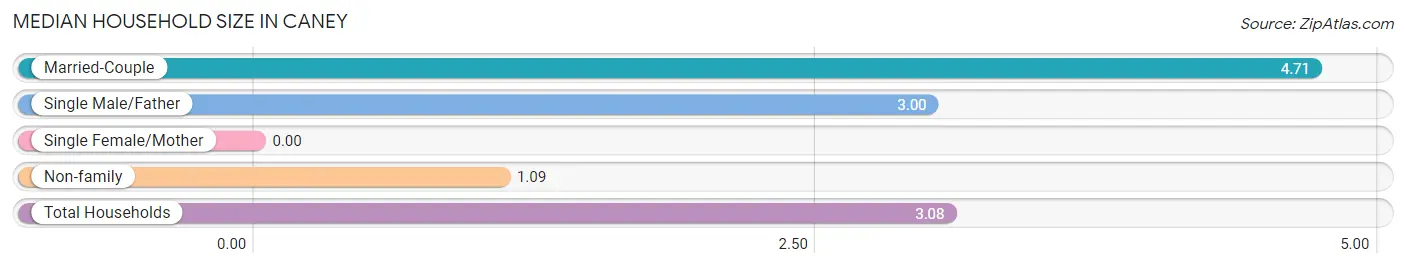
| Household Type | # Households | Household Size |
| Married-Couple | 69 (53.1%) | 4.71 |
| Single Male/Father | 5 (3.8%) | 3.00 |
| Single Female/Mother | 0 (0.0%) | - |
| Non-family | 56 (43.1%) | 1.09 |
| Total Households | 130 (100.0%) | 3.08 |
Household Size by Marriage Status in Caney
Out of a total of 130 households in Caney, 74 (56.9%) are family households, while 56 (43.1%) are nonfamily households. The most numerous type of family households are 2-person households, comprising 21, and the most common type of nonfamily households are 1-person households, comprising 46.
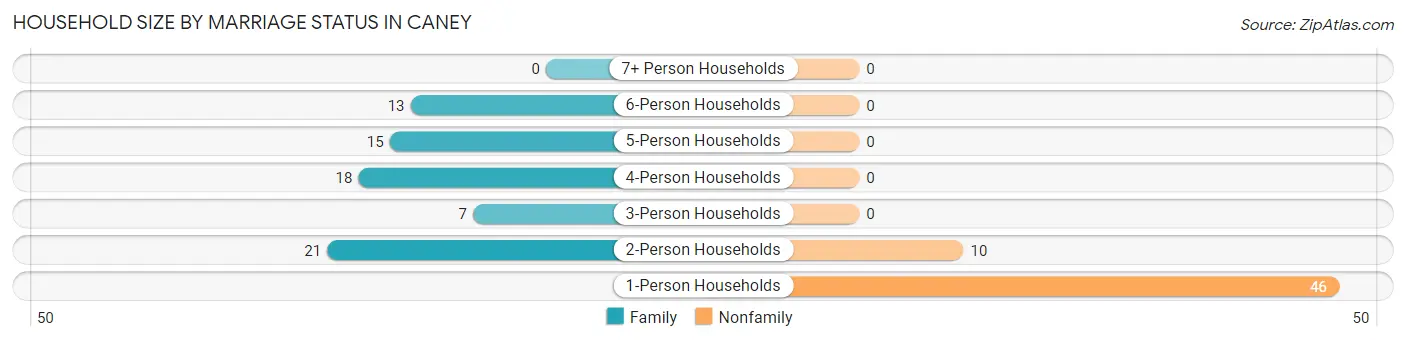
| Household Size | Family Households | Nonfamily Households |
| 1-Person Households | - | 46 (35.4%) |
| 2-Person Households | 21 (16.2%) | 10 (7.7%) |
| 3-Person Households | 7 (5.4%) | 0 (0.0%) |
| 4-Person Households | 18 (13.9%) | 0 (0.0%) |
| 5-Person Households | 15 (11.5%) | 0 (0.0%) |
| 6-Person Households | 13 (10.0%) | 0 (0.0%) |
| 7+ Person Households | 0 (0.0%) | 0 (0.0%) |
| Total | 74 (56.9%) | 56 (43.1%) |
Female Fertility in Caney
Fertility by Age in Caney
| Age Bracket | Women with Births | Births / 1,000 Women |
| 15 to 19 years | 0 (0.0%) | 0.0 |
| 20 to 34 years | 0 (0.0%) | 0.0 |
| 35 to 50 years | 0 (0.0%) | 0.0 |
| Total | 0 (0.0%) | 0.0 |
Fertility by Age by Marriage Status in Caney
| Age Bracket | Married | Unmarried |
| 15 to 19 years | 0 (0.0%) | 0 (0.0%) |
| 20 to 34 years | 0 (0.0%) | 0 (0.0%) |
| 35 to 50 years | 0 (0.0%) | 0 (0.0%) |
| Total | 0 (0.0%) | 0 (0.0%) |
Fertility by Education in Caney
| Educational Attainment | Women with Births | Births / 1,000 Women |
| Less than High School | 0 (0.0%) | 0.0 |
| High School Diploma | 0 (0.0%) | 0.0 |
| College or Associate's Degree | 0 (0.0%) | 0.0 |
| Bachelor's Degree | 0 (0.0%) | 0.0 |
| Graduate Degree | 0 (0.0%) | 0.0 |
| Total | 0 (0.0%) | 0.0 |
Fertility by Education by Marriage Status in Caney
| Educational Attainment | Married | Unmarried |
| Less than High School | 0 (0.0%) | 0 (0.0%) |
| High School Diploma | 0 (0.0%) | 0 (0.0%) |
| College or Associate's Degree | 0 (0.0%) | 0 (0.0%) |
| Bachelor's Degree | 0 (0.0%) | 0 (0.0%) |
| Graduate Degree | 0 (0.0%) | 0 (0.0%) |
| Total | 0 (0.0%) | 0 (0.0%) |
Employment Characteristics in Caney
Employment by Class of Employer in Caney
Among the 224 employed individuals in Caney, private company employees (107 | 47.8%), not-for-profit organizations (34 | 15.2%), and self-employed (incorporated) (21 | 9.4%) make up the most common classes of employment.
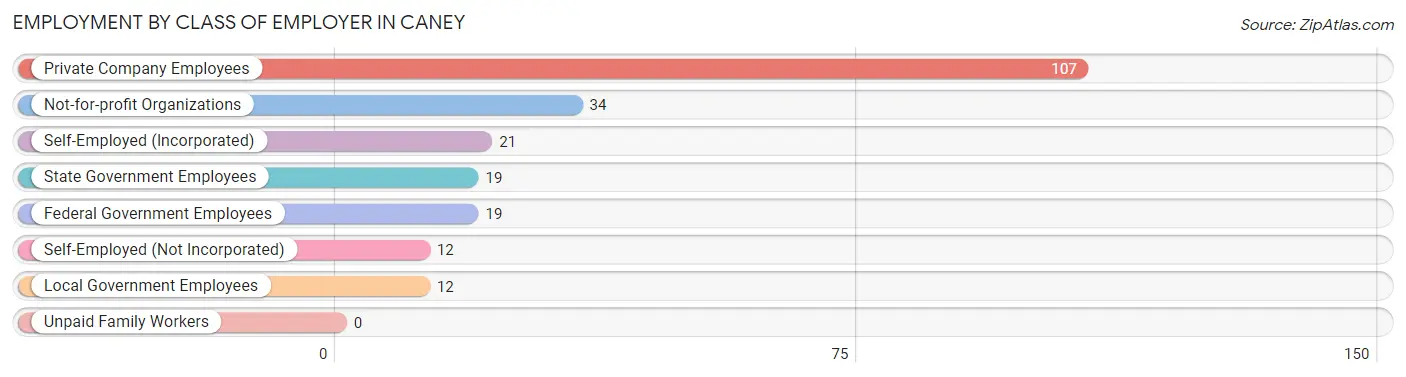
| Employer Class | # Employees | % Employees |
| Private Company Employees | 107 | 47.8% |
| Self-Employed (Incorporated) | 21 | 9.4% |
| Self-Employed (Not Incorporated) | 12 | 5.4% |
| Not-for-profit Organizations | 34 | 15.2% |
| Local Government Employees | 12 | 5.4% |
| State Government Employees | 19 | 8.5% |
| Federal Government Employees | 19 | 8.5% |
| Unpaid Family Workers | 0 | 0.0% |
| Total | 224 | 100.0% |
Employment Status by Age in Caney
According to the labor force statistics for Caney, out of the total population over 16 years of age (310), 76.8% or 238 individuals are in the labor force, with 0.4% or 1 of them unemployed. The age group with the highest labor force participation rate is 30 to 34 years, with 100.0% or 23 individuals in the labor force. Within the labor force, the 30 to 34 years age range has the highest percentage of unemployed individuals, with 4.3% or 1 of them being unemployed.
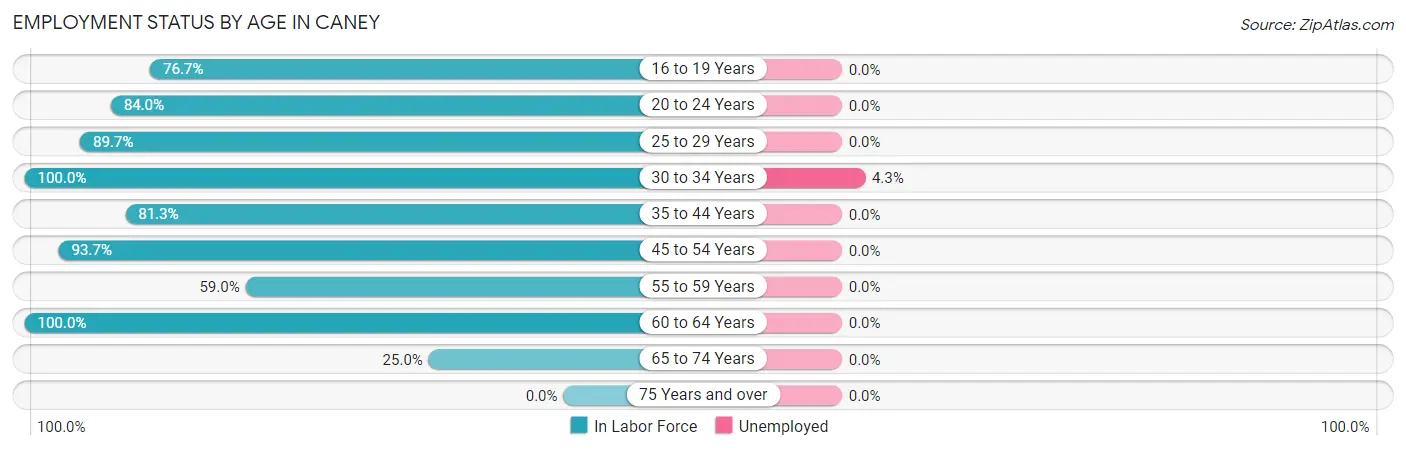
| Age Bracket | In Labor Force | Unemployed |
| 16 to 19 Years | 23 (76.7%) | 0 (0.0%) |
| 20 to 24 Years | 42 (84.0%) | 0 (0.0%) |
| 25 to 29 Years | 26 (89.7%) | 0 (0.0%) |
| 30 to 34 Years | 23 (100.0%) | 1 (4.3%) |
| 35 to 44 Years | 26 (81.3%) | 0 (0.0%) |
| 45 to 54 Years | 59 (93.7%) | 0 (0.0%) |
| 55 to 59 Years | 23 (59.0%) | 0 (0.0%) |
| 60 to 64 Years | 9 (100.0%) | 0 (0.0%) |
| 65 to 74 Years | 7 (25.0%) | 0 (0.0%) |
| 75 Years and over | 0 (0.0%) | 0 (0.0%) |
| Total | 238 (76.8%) | 1 (0.4%) |
Employment Status by Educational Attainment in Caney
According to labor force statistics for Caney, 85.1% of individuals (166) out of the total population between 25 and 64 years of age (195) are in the labor force, with 0.6% or 1 of them being unemployed. The group with the highest labor force participation rate are those with the educational attainment of less than high school, with 100.0% or 7 individuals in the labor force. Within the labor force, individuals with college / associate degree education have the highest percentage of unemployment, with 1.7% or 1 of them being unemployed.
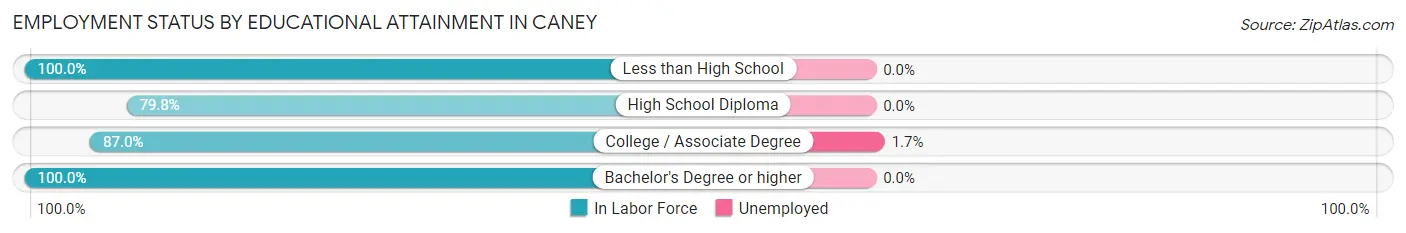
| Educational Attainment | In Labor Force | Unemployed |
| Less than High School | 7 (100.0%) | 0 (0.0%) |
| High School Diploma | 79 (79.8%) | 0 (0.0%) |
| College / Associate Degree | 60 (87.0%) | 1 (1.7%) |
| Bachelor's Degree or higher | 20 (100.0%) | 0 (0.0%) |
| Total | 166 (85.1%) | 1 (0.6%) |
Employment Occupations by Sex in Caney
Management, Business, Science and Arts Occupations
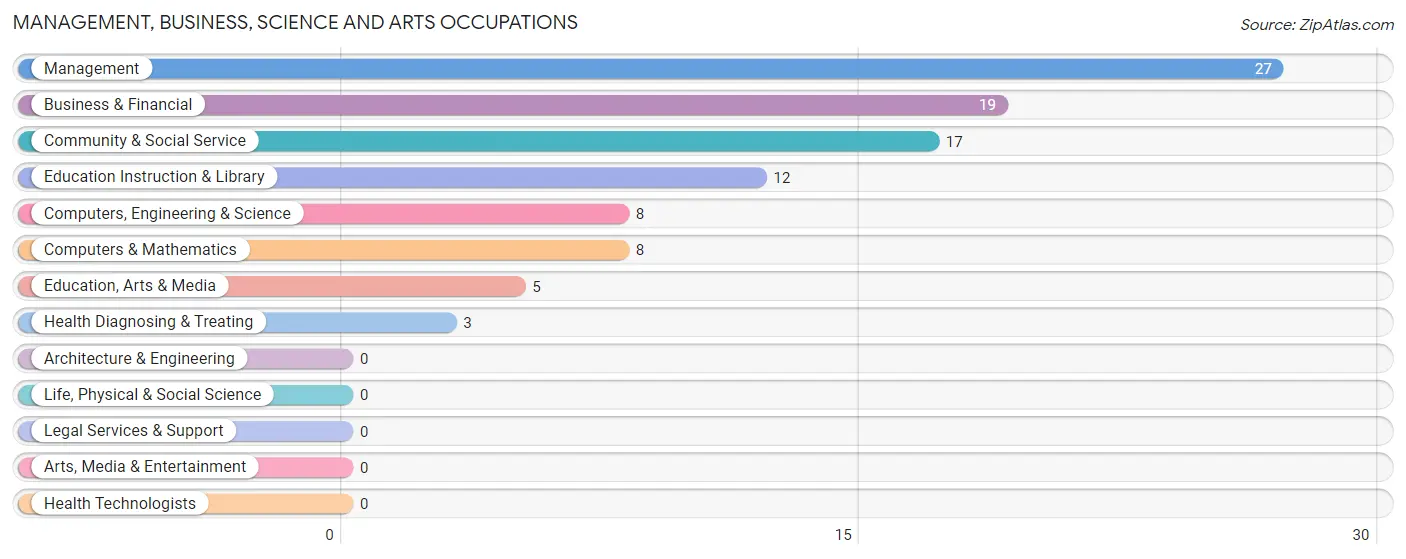
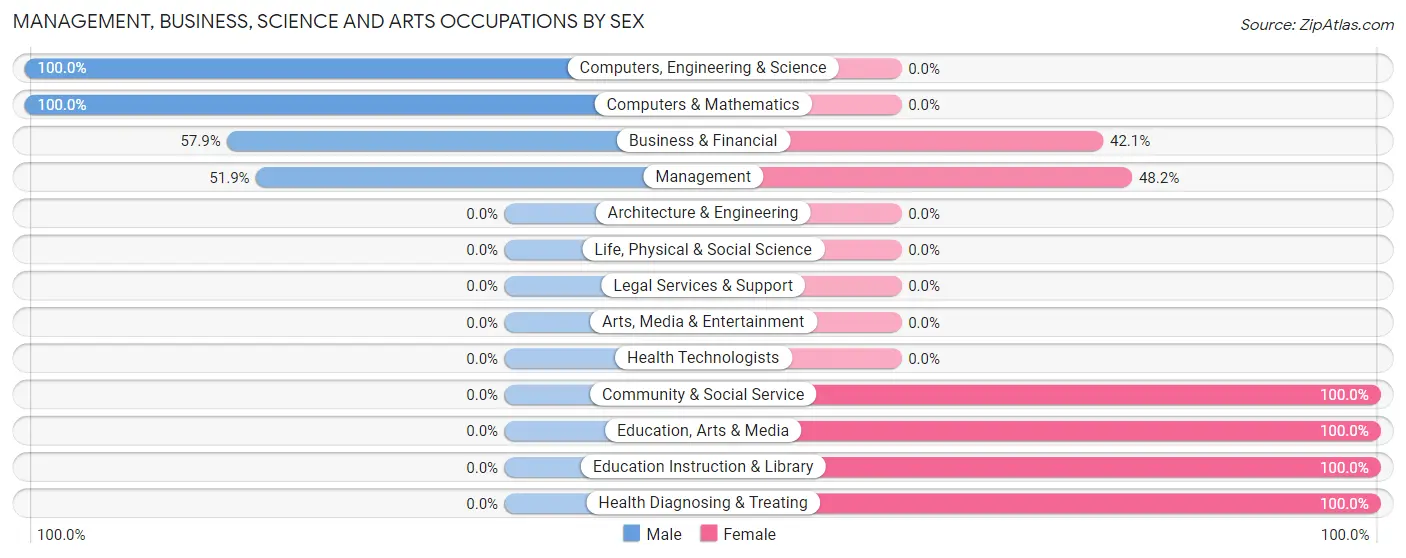
The most common Management, Business, Science and Arts occupations in Caney are Management (27 | 11.4%), Business & Financial (19 | 8.0%), Community & Social Service (17 | 7.2%), Education Instruction & Library (12 | 5.1%), and Computers, Engineering & Science (8 | 3.4%).
Management, Business, Science and Arts Occupations by Sex
Within the Management, Business, Science and Arts occupations in Caney, the most male-oriented occupations are Computers, Engineering & Science (100.0%), Computers & Mathematics (100.0%), and Business & Financial (57.9%), while the most female-oriented occupations are Community & Social Service (100.0%), Education, Arts & Media (100.0%), and Education Instruction & Library (100.0%).
| Occupation | Male | Female |
| Management | 14 (51.8%) | 13 (48.1%) |
| Business & Financial | 11 (57.9%) | 8 (42.1%) |
| Computers, Engineering & Science | 8 (100.0%) | 0 (0.0%) |
| Computers & Mathematics | 8 (100.0%) | 0 (0.0%) |
| Architecture & Engineering | 0 (0.0%) | 0 (0.0%) |
| Life, Physical & Social Science | 0 (0.0%) | 0 (0.0%) |
| Community & Social Service | 0 (0.0%) | 17 (100.0%) |
| Education, Arts & Media | 0 (0.0%) | 5 (100.0%) |
| Legal Services & Support | 0 (0.0%) | 0 (0.0%) |
| Education Instruction & Library | 0 (0.0%) | 12 (100.0%) |
| Arts, Media & Entertainment | 0 (0.0%) | 0 (0.0%) |
| Health Diagnosing & Treating | 0 (0.0%) | 3 (100.0%) |
| Health Technologists | 0 (0.0%) | 0 (0.0%) |
| Total (Category) | 33 (44.6%) | 41 (55.4%) |
| Total (Overall) | 152 (64.1%) | 85 (35.9%) |
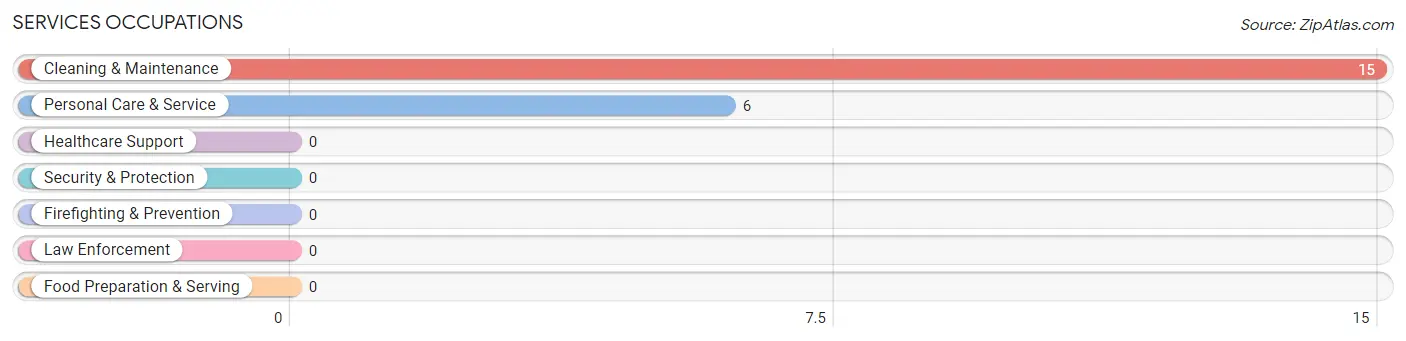
Services Occupations
The most common Services occupations in Caney are Cleaning & Maintenance (15 | 6.3%), and Personal Care & Service (6 | 2.5%).
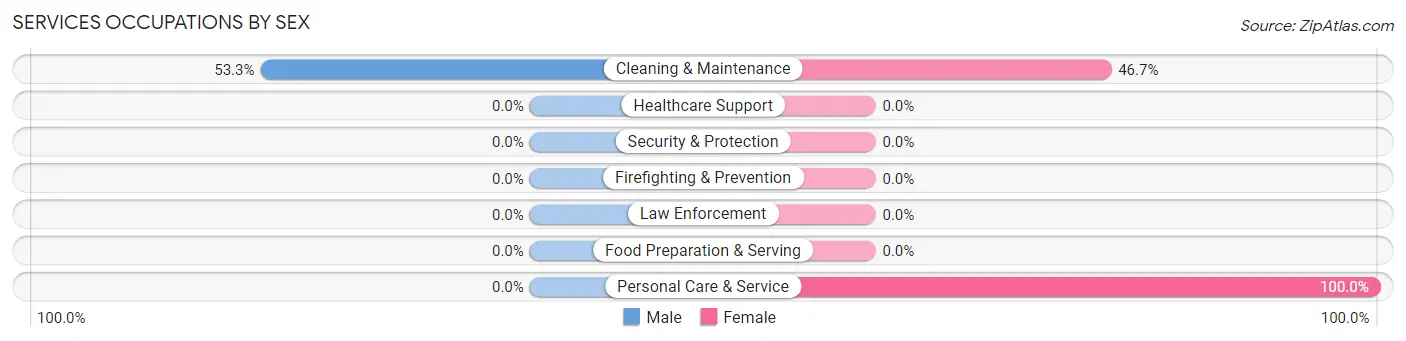
Services Occupations by Sex
| Occupation | Male | Female |
| Healthcare Support | 0 (0.0%) | 0 (0.0%) |
| Security & Protection | 0 (0.0%) | 0 (0.0%) |
| Firefighting & Prevention | 0 (0.0%) | 0 (0.0%) |
| Law Enforcement | 0 (0.0%) | 0 (0.0%) |
| Food Preparation & Serving | 0 (0.0%) | 0 (0.0%) |
| Cleaning & Maintenance | 8 (53.3%) | 7 (46.7%) |
| Personal Care & Service | 0 (0.0%) | 6 (100.0%) |
| Total (Category) | 8 (38.1%) | 13 (61.9%) |
| Total (Overall) | 152 (64.1%) | 85 (35.9%) |
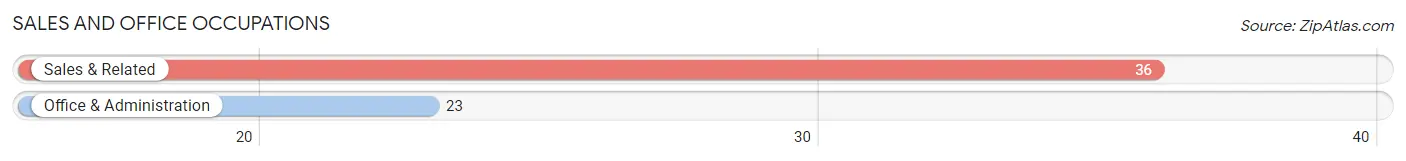
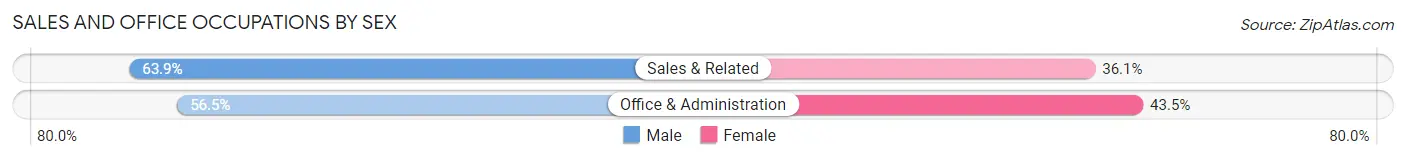
Sales and Office Occupations
The most common Sales and Office occupations in Caney are Sales & Related (36 | 15.2%), and Office & Administration (23 | 9.7%).
Sales and Office Occupations by Sex
| Occupation | Male | Female |
| Sales & Related | 23 (63.9%) | 13 (36.1%) |
| Office & Administration | 13 (56.5%) | 10 (43.5%) |
| Total (Category) | 36 (61.0%) | 23 (39.0%) |
| Total (Overall) | 152 (64.1%) | 85 (35.9%) |
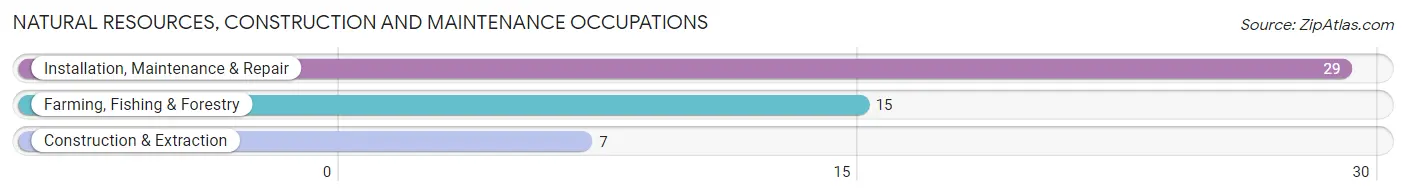
Natural Resources, Construction and Maintenance Occupations
The most common Natural Resources, Construction and Maintenance occupations in Caney are Installation, Maintenance & Repair (29 | 12.2%), Farming, Fishing & Forestry (15 | 6.3%), and Construction & Extraction (7 | 2.9%).
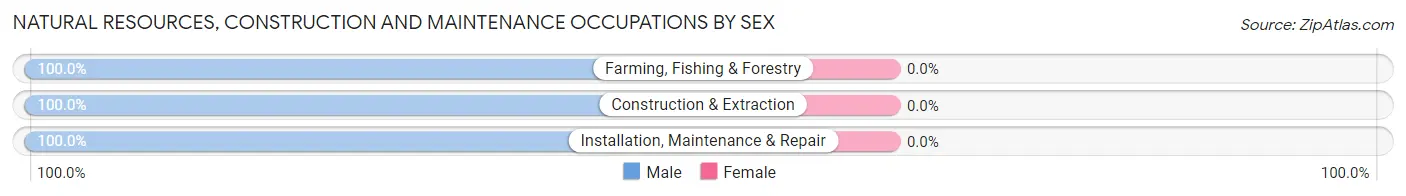
Natural Resources, Construction and Maintenance Occupations by Sex
| Occupation | Male | Female |
| Farming, Fishing & Forestry | 15 (100.0%) | 0 (0.0%) |
| Construction & Extraction | 7 (100.0%) | 0 (0.0%) |
| Installation, Maintenance & Repair | 29 (100.0%) | 0 (0.0%) |
| Total (Category) | 51 (100.0%) | 0 (0.0%) |
| Total (Overall) | 152 (64.1%) | 85 (35.9%) |
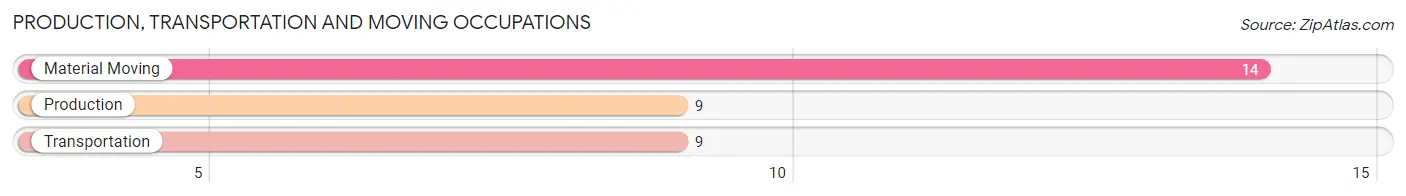
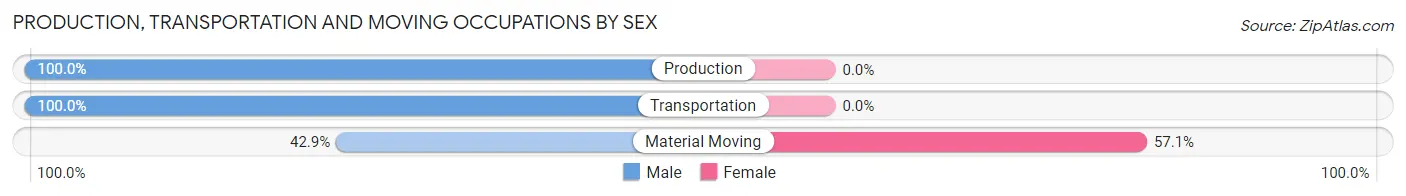
Production, Transportation and Moving Occupations
The most common Production, Transportation and Moving occupations in Caney are Material Moving (14 | 5.9%), Production (9 | 3.8%), and Transportation (9 | 3.8%).
Production, Transportation and Moving Occupations by Sex
| Occupation | Male | Female |
| Production | 9 (100.0%) | 0 (0.0%) |
| Transportation | 9 (100.0%) | 0 (0.0%) |
| Material Moving | 6 (42.9%) | 8 (57.1%) |
| Total (Category) | 24 (75.0%) | 8 (25.0%) |
| Total (Overall) | 152 (64.1%) | 85 (35.9%) |
Employment Industries by Sex in Caney
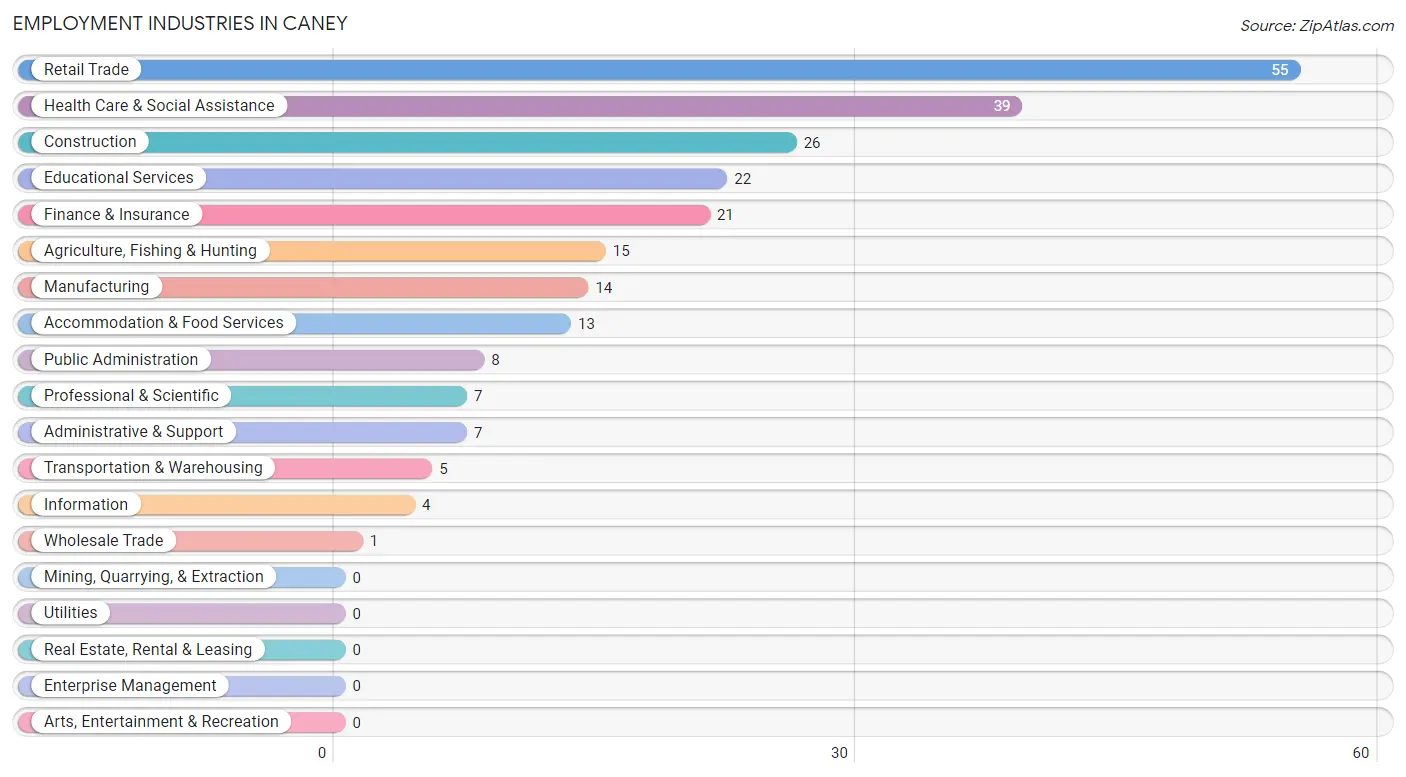
Employment Industries in Caney
The major employment industries in Caney include Retail Trade (55 | 23.2%), Health Care & Social Assistance (39 | 16.5%), Construction (26 | 11.0%), Educational Services (22 | 9.3%), and Finance & Insurance (21 | 8.9%).
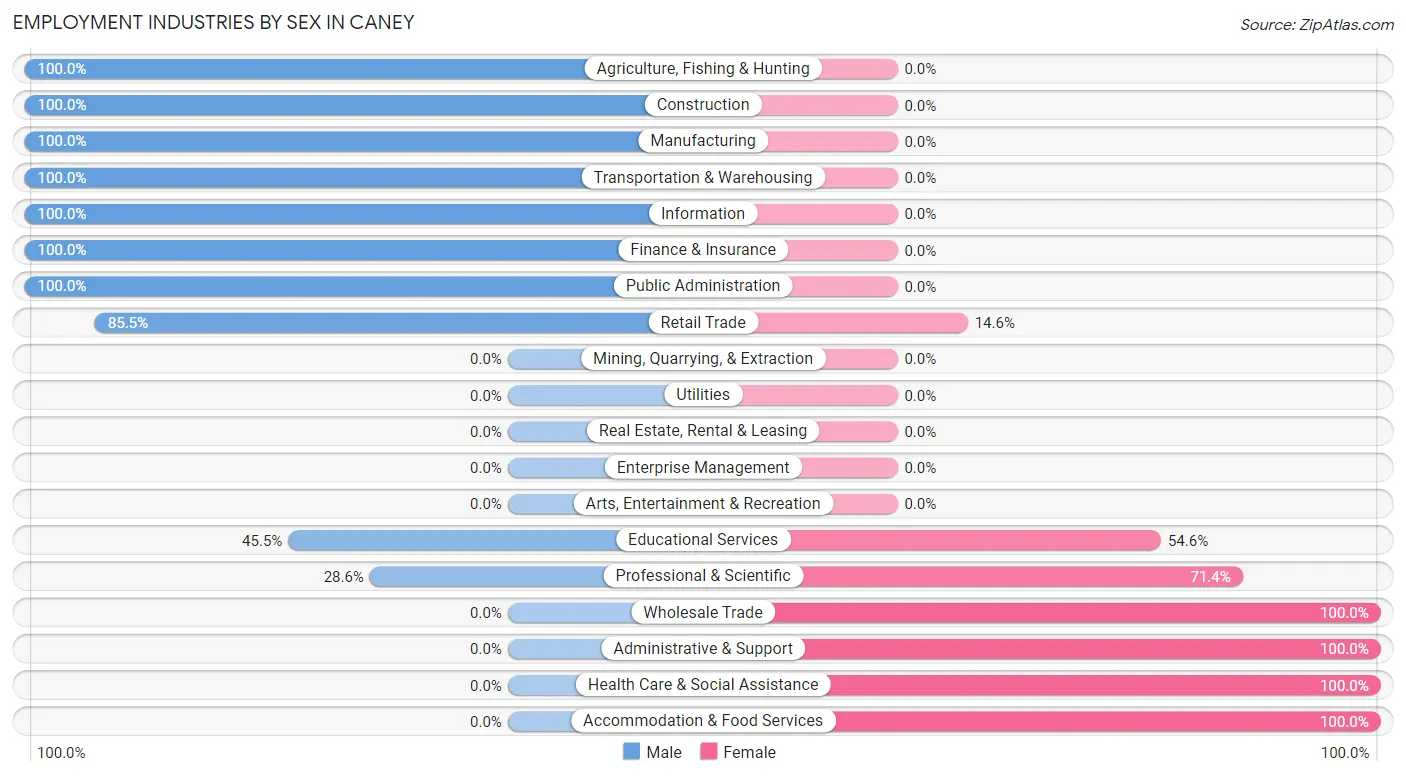
Employment Industries by Sex in Caney
The Caney industries that see more men than women are Agriculture, Fishing & Hunting (100.0%), Construction (100.0%), and Manufacturing (100.0%), whereas the industries that tend to have a higher number of women are Wholesale Trade (100.0%), Administrative & Support (100.0%), and Health Care & Social Assistance (100.0%).
| Industry | Male | Female |
| Agriculture, Fishing & Hunting | 15 (100.0%) | 0 (0.0%) |
| Mining, Quarrying, & Extraction | 0 (0.0%) | 0 (0.0%) |
| Construction | 26 (100.0%) | 0 (0.0%) |
| Manufacturing | 14 (100.0%) | 0 (0.0%) |
| Wholesale Trade | 0 (0.0%) | 1 (100.0%) |
| Retail Trade | 47 (85.5%) | 8 (14.5%) |
| Transportation & Warehousing | 5 (100.0%) | 0 (0.0%) |
| Utilities | 0 (0.0%) | 0 (0.0%) |
| Information | 4 (100.0%) | 0 (0.0%) |
| Finance & Insurance | 21 (100.0%) | 0 (0.0%) |
| Real Estate, Rental & Leasing | 0 (0.0%) | 0 (0.0%) |
| Professional & Scientific | 2 (28.6%) | 5 (71.4%) |
| Enterprise Management | 0 (0.0%) | 0 (0.0%) |
| Administrative & Support | 0 (0.0%) | 7 (100.0%) |
| Educational Services | 10 (45.5%) | 12 (54.5%) |
| Health Care & Social Assistance | 0 (0.0%) | 39 (100.0%) |
| Arts, Entertainment & Recreation | 0 (0.0%) | 0 (0.0%) |
| Accommodation & Food Services | 0 (0.0%) | 13 (100.0%) |
| Public Administration | 8 (100.0%) | 0 (0.0%) |
| Total | 152 (64.1%) | 85 (35.9%) |
Education in Caney
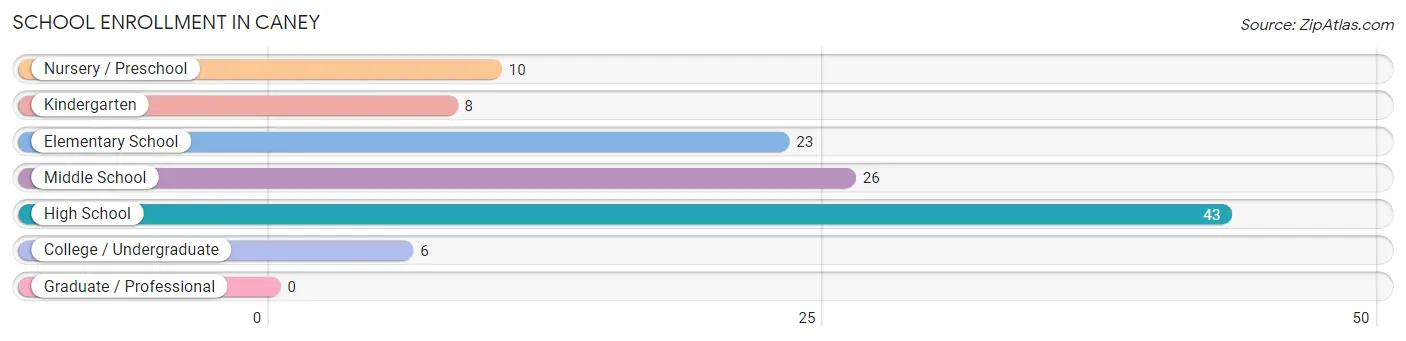
School Enrollment in Caney
The most common levels of schooling among the 116 students in Caney are high school (43 | 37.1%), middle school (26 | 22.4%), and elementary school (23 | 19.8%).
| School Level | # Students | % Students |
| Nursery / Preschool | 10 | 8.6% |
| Kindergarten | 8 | 6.9% |
| Elementary School | 23 | 19.8% |
| Middle School | 26 | 22.4% |
| High School | 43 | 37.1% |
| College / Undergraduate | 6 | 5.2% |
| Graduate / Professional | 0 | 0.0% |
| Total | 116 | 100.0% |
School Enrollment by Age by Funding Source in Caney
Out of a total of 116 students who are enrolled in schools in Caney, 33 (28.4%) attend a private institution, while the remaining 83 (71.6%) are enrolled in public schools. The age group of 10 to 14 year olds has the highest likelihood of being enrolled in private schools, with 15 (45.5% in the age bracket) enrolled. Conversely, the age group of 3 to 4 year olds has the lowest likelihood of being enrolled in a private school, with 10 (100.0% in the age bracket) attending a public institution.
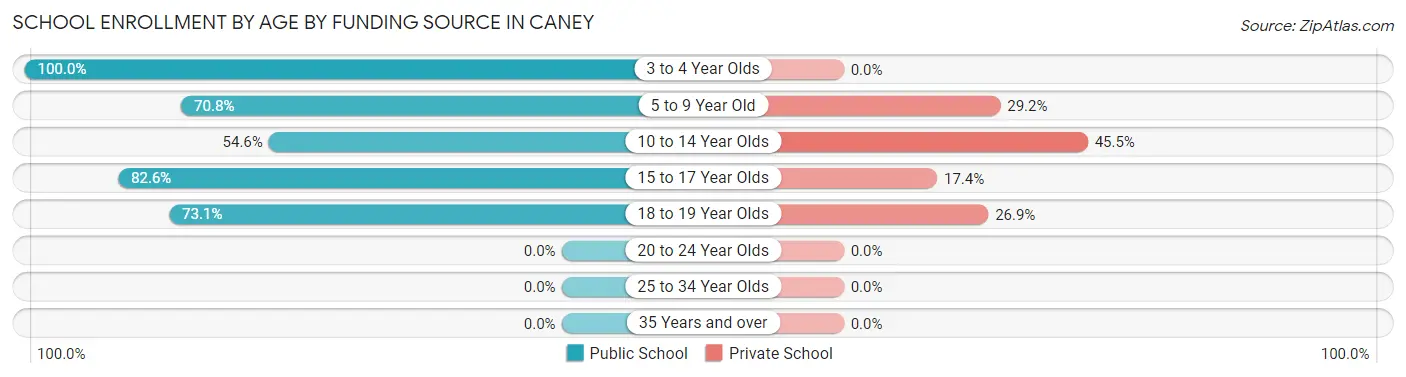
| Age Bracket | Public School | Private School |
| 3 to 4 Year Olds | 10 (100.0%) | 0 (0.0%) |
| 5 to 9 Year Old | 17 (70.8%) | 7 (29.2%) |
| 10 to 14 Year Olds | 18 (54.5%) | 15 (45.5%) |
| 15 to 17 Year Olds | 19 (82.6%) | 4 (17.4%) |
| 18 to 19 Year Olds | 19 (73.1%) | 7 (26.9%) |
| 20 to 24 Year Olds | 0 (0.0%) | 0 (0.0%) |
| 25 to 34 Year Olds | 0 (0.0%) | 0 (0.0%) |
| 35 Years and over | 0 (0.0%) | 0 (0.0%) |
| Total | 83 (71.6%) | 33 (28.4%) |
Educational Attainment by Field of Study in Caney
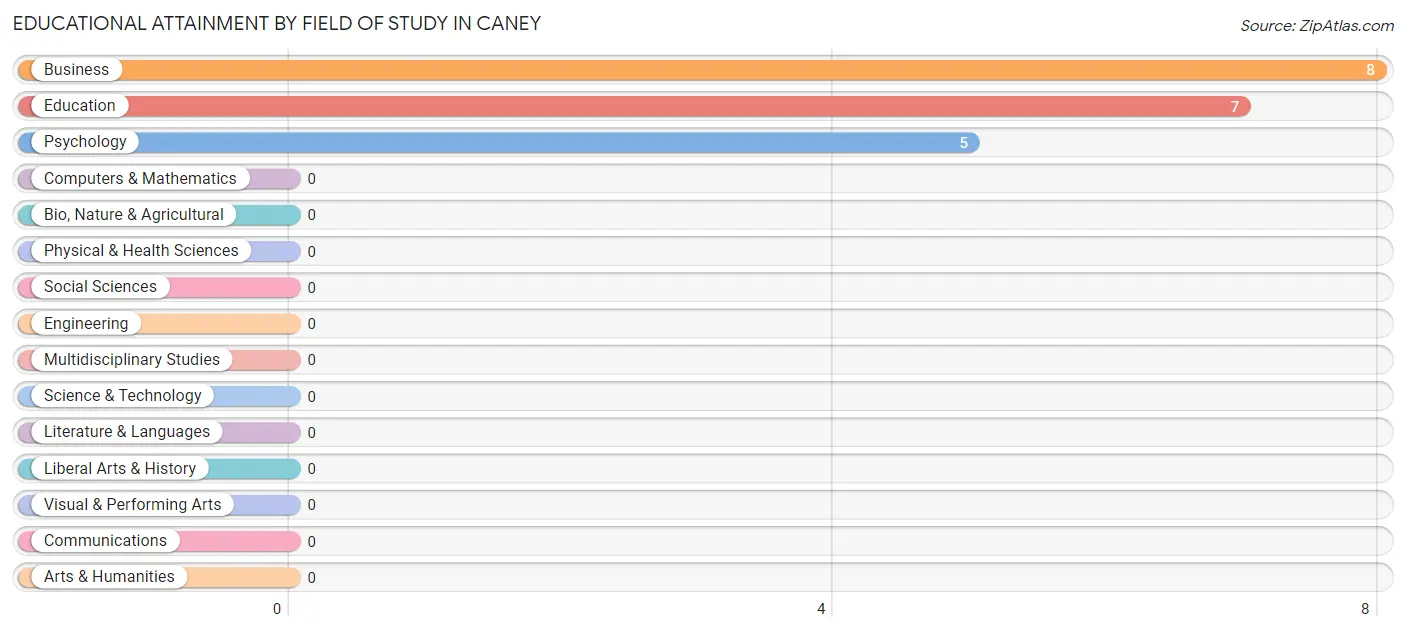
Business (8 | 40.0%), education (7 | 35.0%), and psychology (5 | 25.0%) are the most common fields of study among 20 individuals in Caney who have obtained a bachelor's degree or higher.
| Field of Study | # Graduates | % Graduates |
| Computers & Mathematics | 0 | 0.0% |
| Bio, Nature & Agricultural | 0 | 0.0% |
| Physical & Health Sciences | 0 | 0.0% |
| Psychology | 5 | 25.0% |
| Social Sciences | 0 | 0.0% |
| Engineering | 0 | 0.0% |
| Multidisciplinary Studies | 0 | 0.0% |
| Science & Technology | 0 | 0.0% |
| Business | 8 | 40.0% |
| Education | 7 | 35.0% |
| Literature & Languages | 0 | 0.0% |
| Liberal Arts & History | 0 | 0.0% |
| Visual & Performing Arts | 0 | 0.0% |
| Communications | 0 | 0.0% |
| Arts & Humanities | 0 | 0.0% |
| Total | 20 | 100.0% |
Transportation & Commute in Caney
Vehicle Availability by Sex in Caney
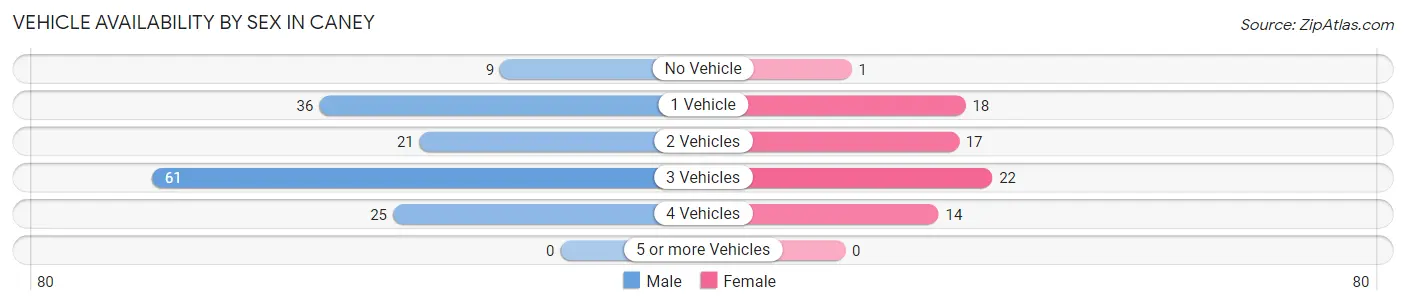
The most prevalent vehicle ownership categories in Caney are males with 3 vehicles (61, accounting for 40.1%) and females with 3 vehicles (22, making up 84.7%).
| Vehicles Available | Male | Female |
| No Vehicle | 9 (5.9%) | 1 (1.4%) |
| 1 Vehicle | 36 (23.7%) | 18 (25.0%) |
| 2 Vehicles | 21 (13.8%) | 17 (23.6%) |
| 3 Vehicles | 61 (40.1%) | 22 (30.6%) |
| 4 Vehicles | 25 (16.5%) | 14 (19.4%) |
| 5 or more Vehicles | 0 (0.0%) | 0 (0.0%) |
| Total | 152 (100.0%) | 72 (100.0%) |
Commute Time in Caney
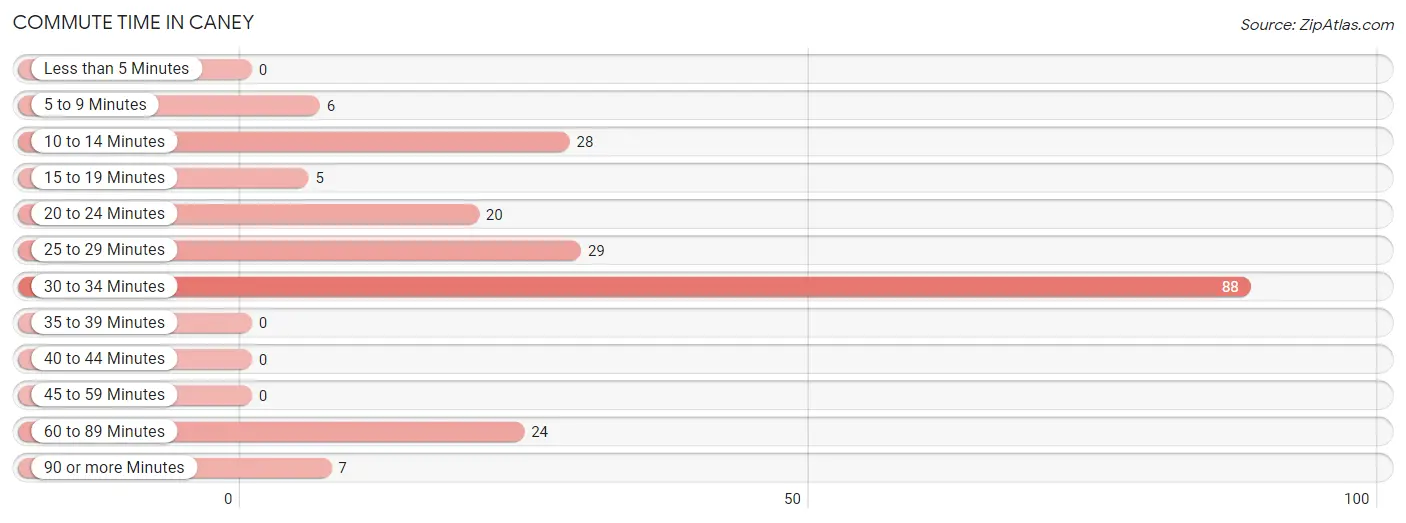
The most frequently occuring commute durations in Caney are 30 to 34 minutes (88 commuters, 42.5%), 25 to 29 minutes (29 commuters, 14.0%), and 10 to 14 minutes (28 commuters, 13.5%).
| Commute Time | # Commuters | % Commuters |
| Less than 5 Minutes | 0 | 0.0% |
| 5 to 9 Minutes | 6 | 2.9% |
| 10 to 14 Minutes | 28 | 13.5% |
| 15 to 19 Minutes | 5 | 2.4% |
| 20 to 24 Minutes | 20 | 9.7% |
| 25 to 29 Minutes | 29 | 14.0% |
| 30 to 34 Minutes | 88 | 42.5% |
| 35 to 39 Minutes | 0 | 0.0% |
| 40 to 44 Minutes | 0 | 0.0% |
| 45 to 59 Minutes | 0 | 0.0% |
| 60 to 89 Minutes | 24 | 11.6% |
| 90 or more Minutes | 7 | 3.4% |
Commute Time by Sex in Caney
The most common commute times in Caney are 30 to 34 minutes (61 commuters, 41.2%) for males and 30 to 34 minutes (27 commuters, 45.8%) for females.
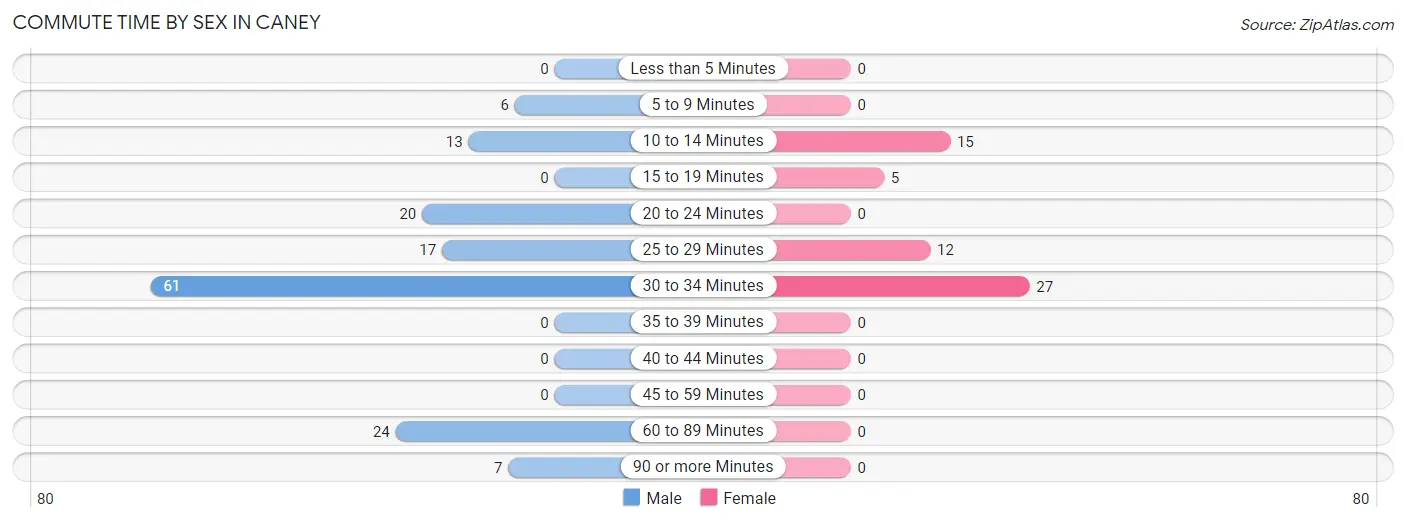
| Commute Time | Male | Female |
| Less than 5 Minutes | 0 (0.0%) | 0 (0.0%) |
| 5 to 9 Minutes | 6 (4.1%) | 0 (0.0%) |
| 10 to 14 Minutes | 13 (8.8%) | 15 (25.4%) |
| 15 to 19 Minutes | 0 (0.0%) | 5 (8.5%) |
| 20 to 24 Minutes | 20 (13.5%) | 0 (0.0%) |
| 25 to 29 Minutes | 17 (11.5%) | 12 (20.3%) |
| 30 to 34 Minutes | 61 (41.2%) | 27 (45.8%) |
| 35 to 39 Minutes | 0 (0.0%) | 0 (0.0%) |
| 40 to 44 Minutes | 0 (0.0%) | 0 (0.0%) |
| 45 to 59 Minutes | 0 (0.0%) | 0 (0.0%) |
| 60 to 89 Minutes | 24 (16.2%) | 0 (0.0%) |
| 90 or more Minutes | 7 (4.7%) | 0 (0.0%) |
Time of Departure to Work by Sex in Caney
The most frequent times of departure to work in Caney are 6:30 AM to 6:59 AM (51, 34.5%) for males and 7:00 AM to 7:29 AM (16, 27.1%) for females.
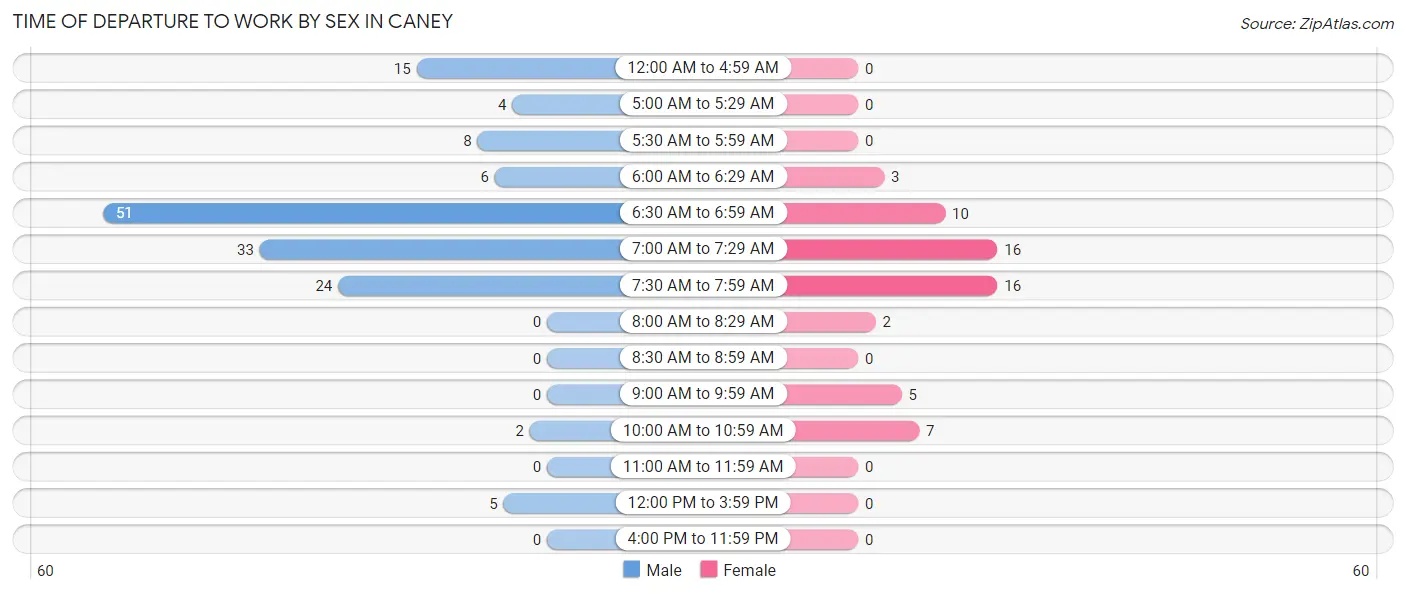
| Time of Departure | Male | Female |
| 12:00 AM to 4:59 AM | 15 (10.1%) | 0 (0.0%) |
| 5:00 AM to 5:29 AM | 4 (2.7%) | 0 (0.0%) |
| 5:30 AM to 5:59 AM | 8 (5.4%) | 0 (0.0%) |
| 6:00 AM to 6:29 AM | 6 (4.1%) | 3 (5.1%) |
| 6:30 AM to 6:59 AM | 51 (34.5%) | 10 (17.0%) |
| 7:00 AM to 7:29 AM | 33 (22.3%) | 16 (27.1%) |
| 7:30 AM to 7:59 AM | 24 (16.2%) | 16 (27.1%) |
| 8:00 AM to 8:29 AM | 0 (0.0%) | 2 (3.4%) |
| 8:30 AM to 8:59 AM | 0 (0.0%) | 0 (0.0%) |
| 9:00 AM to 9:59 AM | 0 (0.0%) | 5 (8.5%) |
| 10:00 AM to 10:59 AM | 2 (1.3%) | 7 (11.9%) |
| 11:00 AM to 11:59 AM | 0 (0.0%) | 0 (0.0%) |
| 12:00 PM to 3:59 PM | 5 (3.4%) | 0 (0.0%) |
| 4:00 PM to 11:59 PM | 0 (0.0%) | 0 (0.0%) |
| Total | 148 (100.0%) | 59 (100.0%) |
Housing Occupancy in Caney
Occupancy by Ownership in Caney
Of the total 59 dwellings in Caney, owner-occupied units account for 36 (61.0%), while renter-occupied units make up 23 (39.0%).
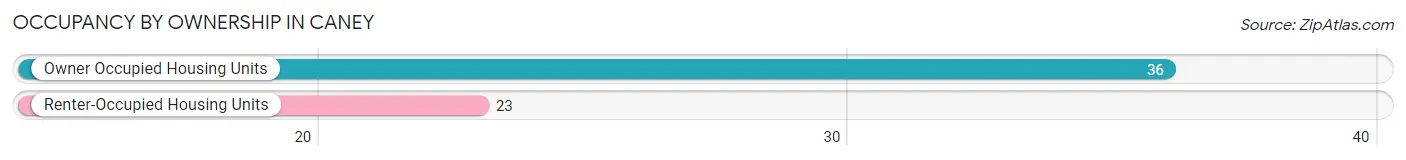
| Occupancy | # Housing Units | % Housing Units |
| Owner Occupied Housing Units | 36 | 61.0% |
| Renter-Occupied Housing Units | 23 | 39.0% |
| Total Occupied Housing Units | 59 | 100.0% |
Occupancy by Household Size in Caney
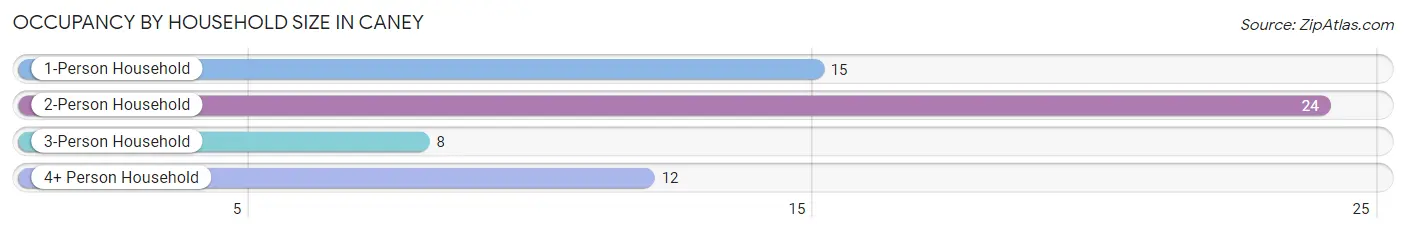
| Household Size | # Housing Units | % Housing Units |
| 1-Person Household | 15 | 25.4% |
| 2-Person Household | 24 | 40.7% |
| 3-Person Household | 8 | 13.6% |
| 4+ Person Household | 12 | 20.3% |
| Total Housing Units | 59 | 100.0% |
Occupancy by Ownership by Household Size in Caney
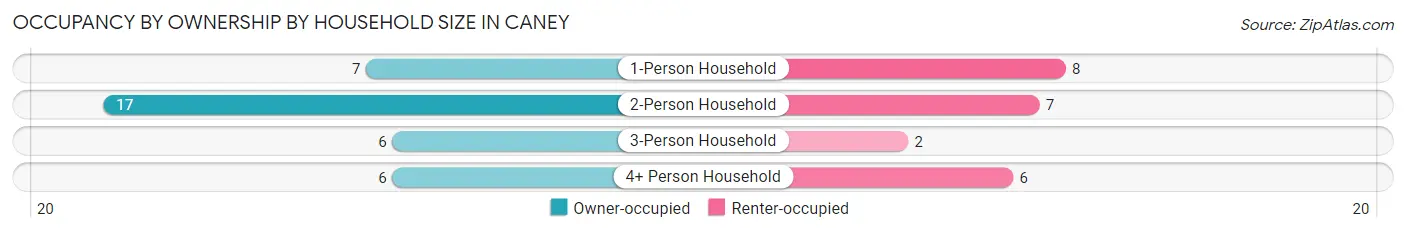
| Household Size | Owner-occupied | Renter-occupied |
| 1-Person Household | 7 (46.7%) | 8 (53.3%) |
| 2-Person Household | 17 (70.8%) | 7 (29.2%) |
| 3-Person Household | 6 (75.0%) | 2 (25.0%) |
| 4+ Person Household | 6 (50.0%) | 6 (50.0%) |
| Total Housing Units | 36 (61.0%) | 23 (39.0%) |
Occupancy by Educational Attainment in Caney
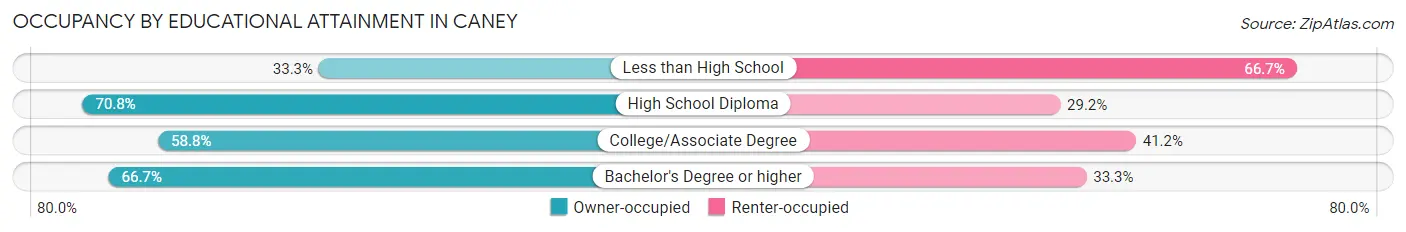
| Household Size | Owner-occupied | Renter-occupied |
| Less than High School | 3 (33.3%) | 6 (66.7%) |
| High School Diploma | 17 (70.8%) | 7 (29.2%) |
| College/Associate Degree | 10 (58.8%) | 7 (41.2%) |
| Bachelor's Degree or higher | 6 (66.7%) | 3 (33.3%) |
Occupancy by Age of Householder in Caney
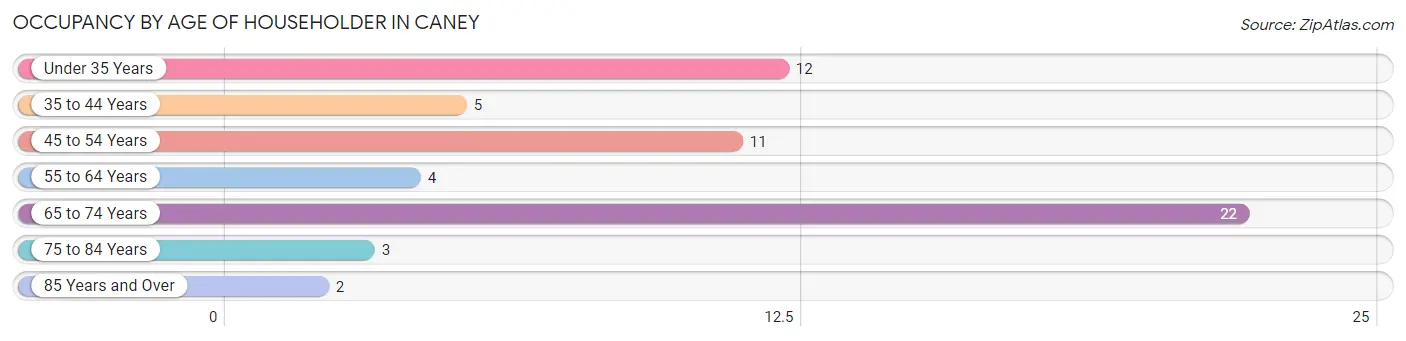
| Age Bracket | # Households | % Households |
| Under 35 Years | 12 | 20.3% |
| 35 to 44 Years | 5 | 8.5% |
| 45 to 54 Years | 11 | 18.6% |
| 55 to 64 Years | 4 | 6.8% |
| 65 to 74 Years | 22 | 37.3% |
| 75 to 84 Years | 3 | 5.1% |
| 85 Years and Over | 2 | 3.4% |
| Total | 59 | 100.0% |
Housing Finances in Caney
Median Income by Occupancy in Caney
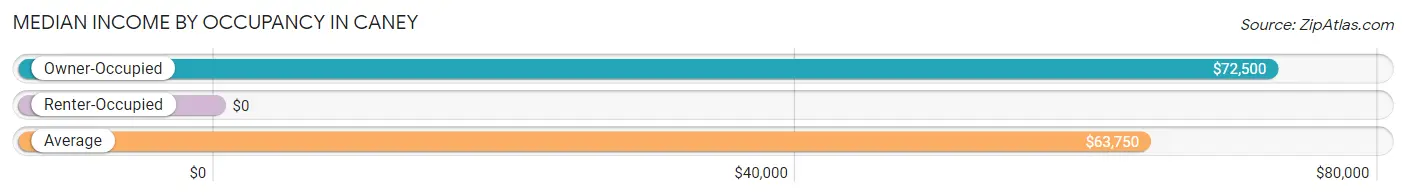
| Occupancy Type | # Households | Median Income |
| Owner-Occupied | 100 (76.9%) | $72,500 |
| Renter-Occupied | 30 (23.1%) | $0 |
| Average | 130 (100.0%) | $63,750 |
Occupancy by Householder Income Bracket in Caney
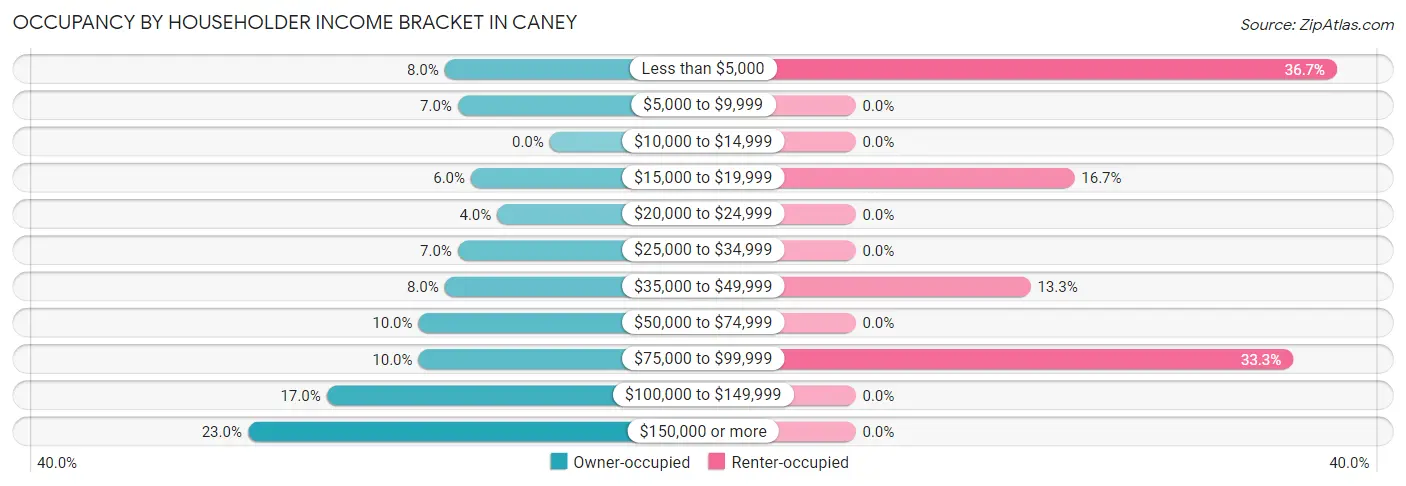
| Income Bracket | Owner-occupied | Renter-occupied |
| Less than $5,000 | 8 (8.0%) | 11 (36.7%) |
| $5,000 to $9,999 | 7 (7.0%) | 0 (0.0%) |
| $10,000 to $14,999 | 0 (0.0%) | 0 (0.0%) |
| $15,000 to $19,999 | 6 (6.0%) | 5 (16.7%) |
| $20,000 to $24,999 | 4 (4.0%) | 0 (0.0%) |
| $25,000 to $34,999 | 7 (7.0%) | 0 (0.0%) |
| $35,000 to $49,999 | 8 (8.0%) | 4 (13.3%) |
| $50,000 to $74,999 | 10 (10.0%) | 0 (0.0%) |
| $75,000 to $99,999 | 10 (10.0%) | 10 (33.3%) |
| $100,000 to $149,999 | 17 (17.0%) | 0 (0.0%) |
| $150,000 or more | 23 (23.0%) | 0 (0.0%) |
| Total | 100 (100.0%) | 30 (100.0%) |
Monthly Housing Cost Tiers in Caney
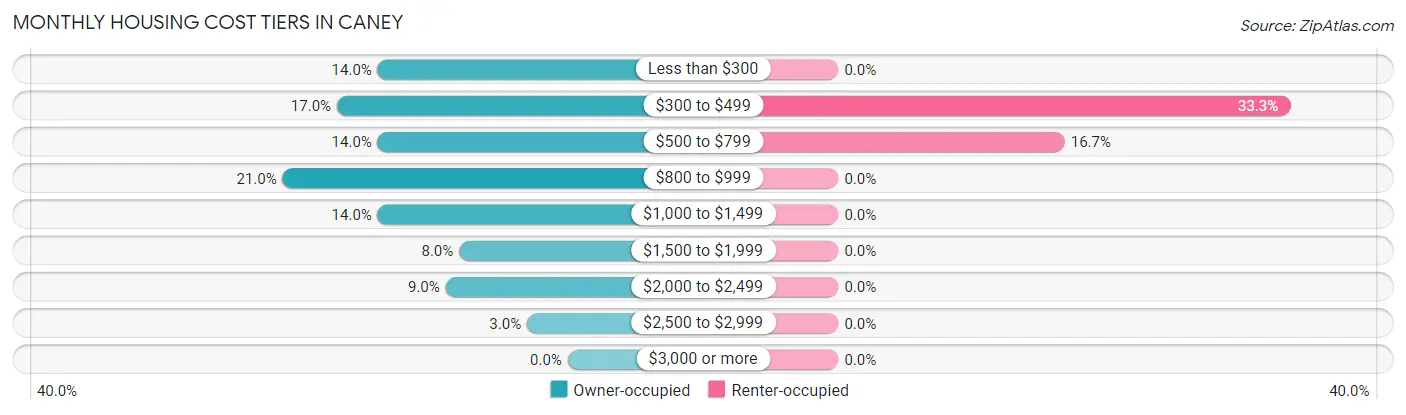
| Monthly Cost | Owner-occupied | Renter-occupied |
| Less than $300 | 14 (14.0%) | 0 (0.0%) |
| $300 to $499 | 17 (17.0%) | 10 (33.3%) |
| $500 to $799 | 14 (14.0%) | 5 (16.7%) |
| $800 to $999 | 21 (21.0%) | 0 (0.0%) |
| $1,000 to $1,499 | 14 (14.0%) | 0 (0.0%) |
| $1,500 to $1,999 | 8 (8.0%) | 0 (0.0%) |
| $2,000 to $2,499 | 9 (9.0%) | 0 (0.0%) |
| $2,500 to $2,999 | 3 (3.0%) | 0 (0.0%) |
| $3,000 or more | 0 (0.0%) | 0 (0.0%) |
| Total | 100 (100.0%) | 30 (100.0%) |
Physical Housing Characteristics in Caney
Housing Structures in Caney
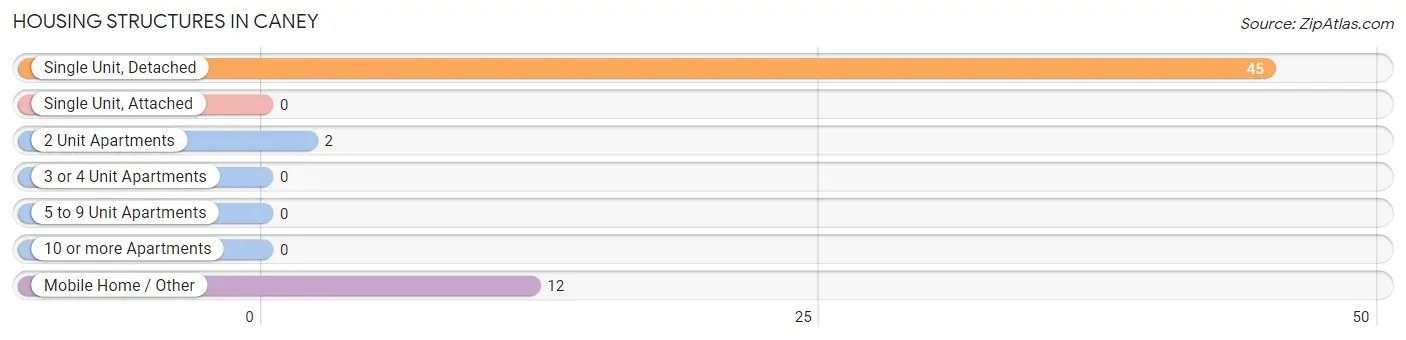
| Structure Type | # Housing Units | % Housing Units |
| Single Unit, Detached | 45 | 76.3% |
| Single Unit, Attached | 0 | 0.0% |
| 2 Unit Apartments | 2 | 3.4% |
| 3 or 4 Unit Apartments | 0 | 0.0% |
| 5 to 9 Unit Apartments | 0 | 0.0% |
| 10 or more Apartments | 0 | 0.0% |
| Mobile Home / Other | 12 | 20.3% |
| Total | 59 | 100.0% |
Housing Structures by Occupancy in Caney
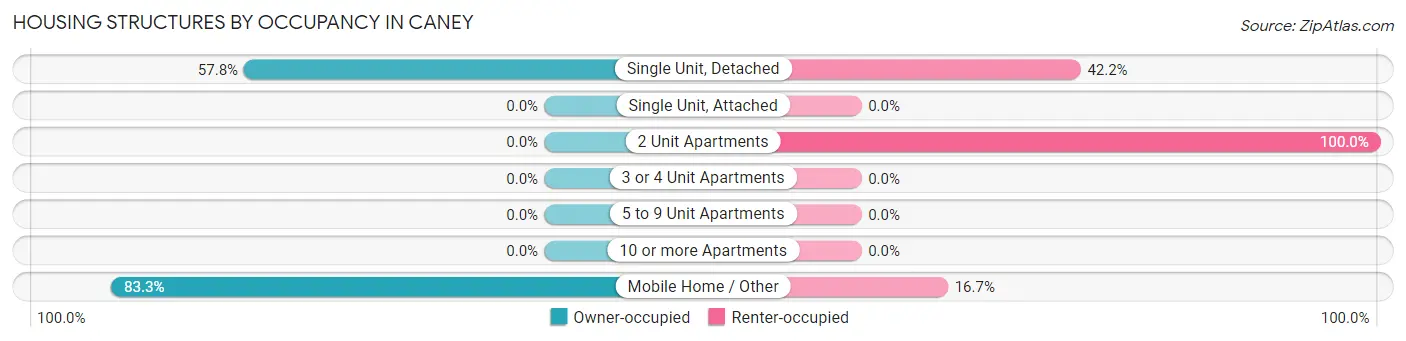
| Structure Type | Owner-occupied | Renter-occupied |
| Single Unit, Detached | 26 (57.8%) | 19 (42.2%) |
| Single Unit, Attached | 0 (0.0%) | 0 (0.0%) |
| 2 Unit Apartments | 0 (0.0%) | 2 (100.0%) |
| 3 or 4 Unit Apartments | 0 (0.0%) | 0 (0.0%) |
| 5 to 9 Unit Apartments | 0 (0.0%) | 0 (0.0%) |
| 10 or more Apartments | 0 (0.0%) | 0 (0.0%) |
| Mobile Home / Other | 10 (83.3%) | 2 (16.7%) |
| Total | 36 (61.0%) | 23 (39.0%) |
Housing Structures by Number of Rooms in Caney
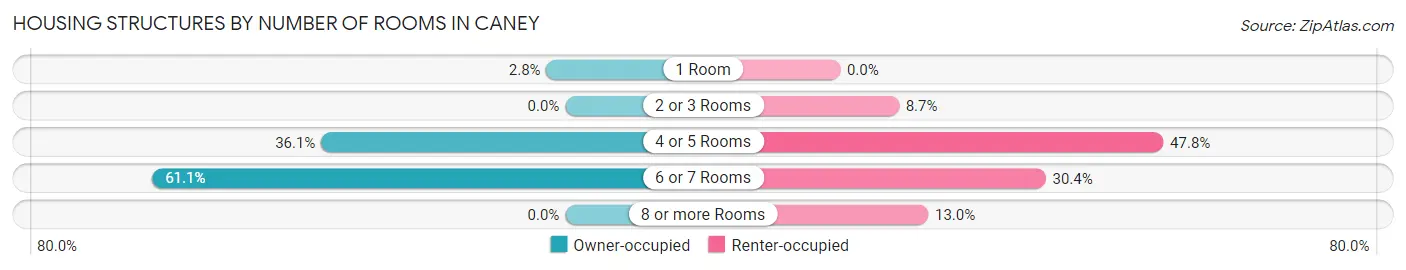
| Number of Rooms | Owner-occupied | Renter-occupied |
| 1 Room | 1 (2.8%) | 0 (0.0%) |
| 2 or 3 Rooms | 0 (0.0%) | 2 (8.7%) |
| 4 or 5 Rooms | 13 (36.1%) | 11 (47.8%) |
| 6 or 7 Rooms | 22 (61.1%) | 7 (30.4%) |
| 8 or more Rooms | 0 (0.0%) | 3 (13.0%) |
| Total | 36 (100.0%) | 23 (100.0%) |
Housing Structure by Heating Type in Caney
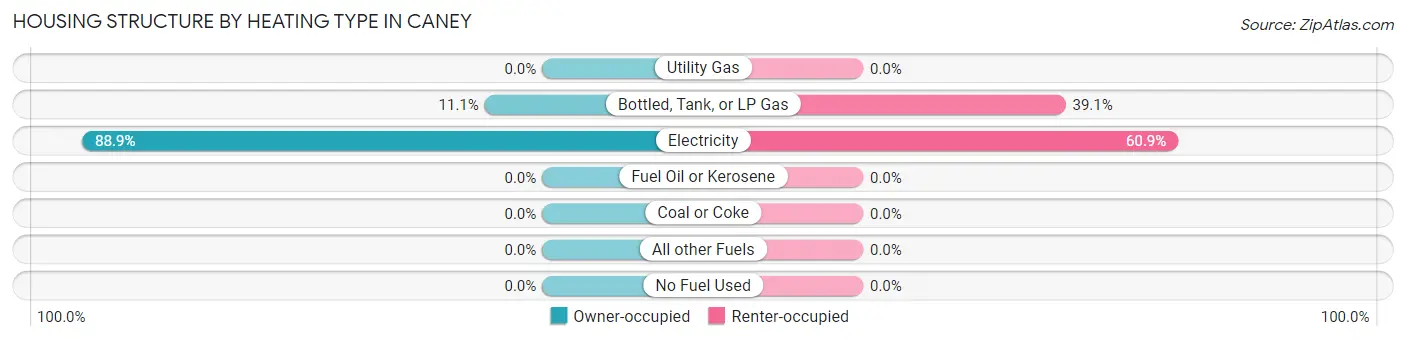
| Heating Type | Owner-occupied | Renter-occupied |
| Utility Gas | 0 (0.0%) | 0 (0.0%) |
| Bottled, Tank, or LP Gas | 4 (11.1%) | 9 (39.1%) |
| Electricity | 32 (88.9%) | 14 (60.9%) |
| Fuel Oil or Kerosene | 0 (0.0%) | 0 (0.0%) |
| Coal or Coke | 0 (0.0%) | 0 (0.0%) |
| All other Fuels | 0 (0.0%) | 0 (0.0%) |
| No Fuel Used | 0 (0.0%) | 0 (0.0%) |
| Total | 36 (100.0%) | 23 (100.0%) |
Household Vehicle Usage in Caney
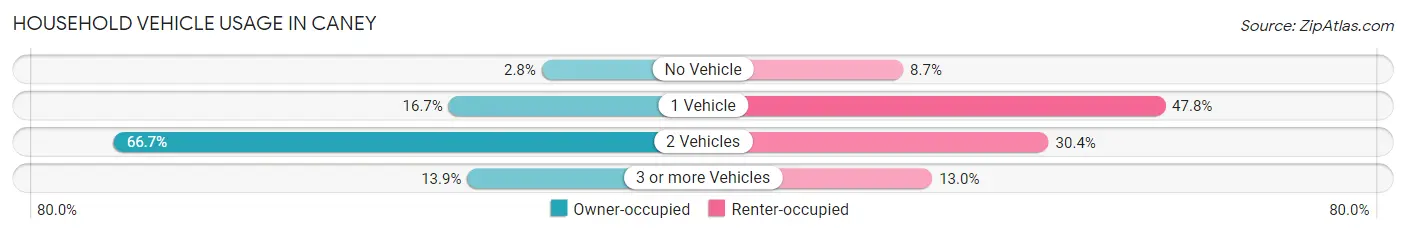
| Vehicles per Household | Owner-occupied | Renter-occupied |
| No Vehicle | 1 (2.8%) | 2 (8.7%) |
| 1 Vehicle | 6 (16.7%) | 11 (47.8%) |
| 2 Vehicles | 24 (66.7%) | 7 (30.4%) |
| 3 or more Vehicles | 5 (13.9%) | 3 (13.0%) |
| Total | 36 (100.0%) | 23 (100.0%) |
Real Estate & Mortgages in Caney
Real Estate and Mortgage Overview in Caney
| Characteristic | Without Mortgage | With Mortgage |
| Housing Units | 28 | 61 |
| Median Property Value | $97,500 | $117,500 |
| Median Household Income | $40,833 | $23 |
| Monthly Housing Costs | $450 | $0 |
| Real Estate Taxes | $433 | $0 |
Property Value by Mortgage Status in Caney
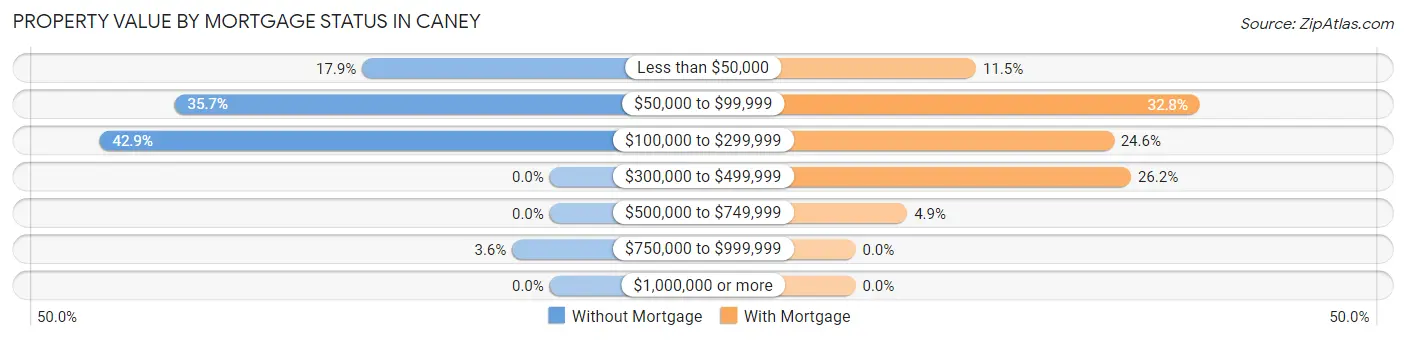
| Property Value | Without Mortgage | With Mortgage |
| Less than $50,000 | 5 (17.9%) | 7 (11.5%) |
| $50,000 to $99,999 | 10 (35.7%) | 20 (32.8%) |
| $100,000 to $299,999 | 12 (42.9%) | 15 (24.6%) |
| $300,000 to $499,999 | 0 (0.0%) | 16 (26.2%) |
| $500,000 to $749,999 | 0 (0.0%) | 3 (4.9%) |
| $750,000 to $999,999 | 1 (3.6%) | 0 (0.0%) |
| $1,000,000 or more | 0 (0.0%) | 0 (0.0%) |
| Total | 28 (100.0%) | 61 (100.0%) |
Household Income by Mortgage Status in Caney
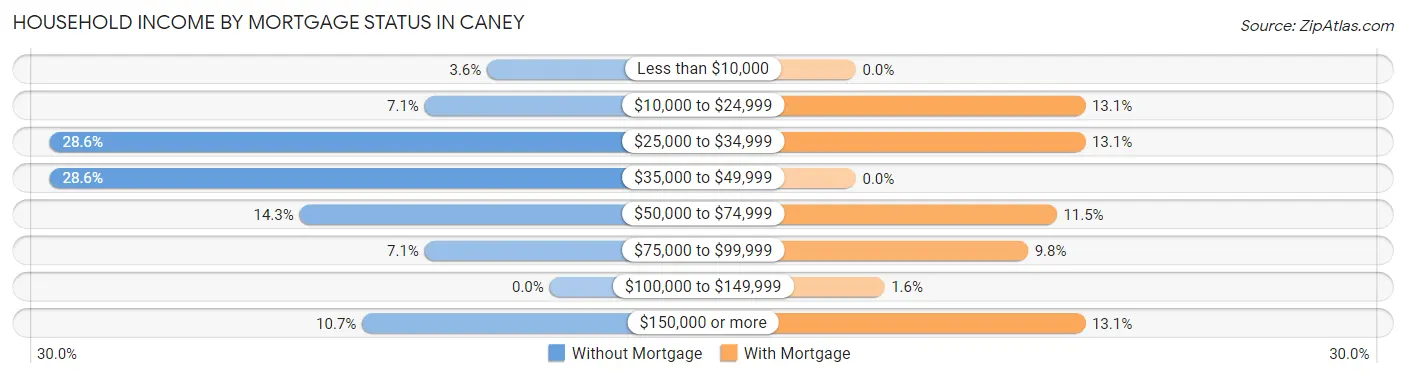
| Household Income | Without Mortgage | With Mortgage |
| Less than $10,000 | 1 (3.6%) | 0 (0.0%) |
| $10,000 to $24,999 | 2 (7.1%) | 8 (13.1%) |
| $25,000 to $34,999 | 8 (28.6%) | 8 (13.1%) |
| $35,000 to $49,999 | 8 (28.6%) | 0 (0.0%) |
| $50,000 to $74,999 | 4 (14.3%) | 7 (11.5%) |
| $75,000 to $99,999 | 2 (7.1%) | 6 (9.8%) |
| $100,000 to $149,999 | 0 (0.0%) | 1 (1.6%) |
| $150,000 or more | 3 (10.7%) | 8 (13.1%) |
| Total | 28 (100.0%) | 61 (100.0%) |
Property Value to Household Income Ratio in Caney
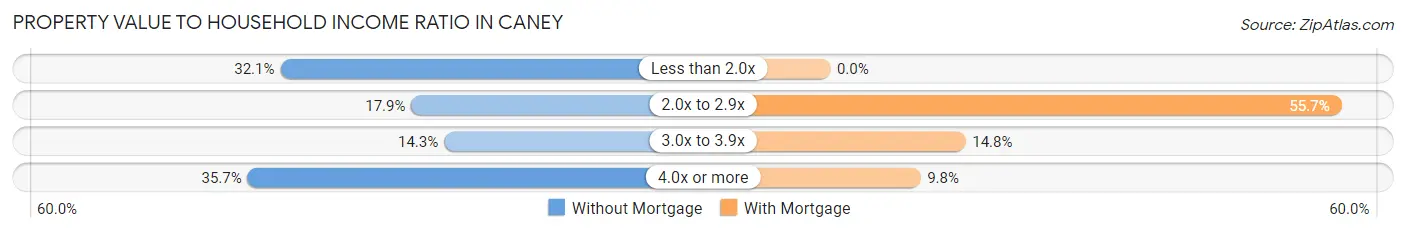
| Value-to-Income Ratio | Without Mortgage | With Mortgage |
| Less than 2.0x | 9 (32.1%) | 0 (0.0%) |
| 2.0x to 2.9x | 5 (17.9%) | 34 (55.7%) |
| 3.0x to 3.9x | 4 (14.3%) | 9 (14.7%) |
| 4.0x or more | 10 (35.7%) | 6 (9.8%) |
| Total | 28 (100.0%) | 61 (100.0%) |
Real Estate Taxes by Mortgage Status in Caney
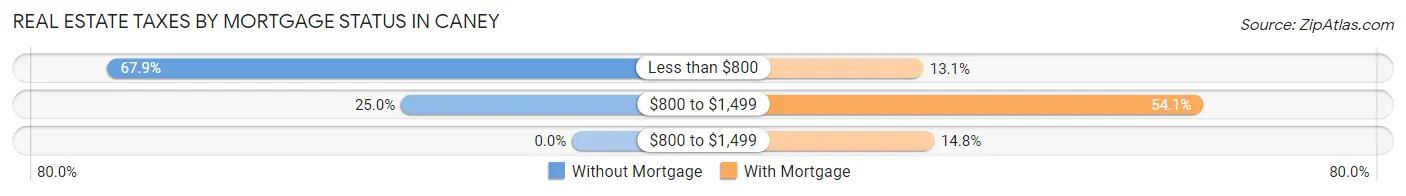
| Property Taxes | Without Mortgage | With Mortgage |
| Less than $800 | 19 (67.9%) | 8 (13.1%) |
| $800 to $1,499 | 7 (25.0%) | 33 (54.1%) |
| $800 to $1,499 | 0 (0.0%) | 9 (14.7%) |
| Total | 28 (100.0%) | 61 (100.0%) |
Health & Disability in Caney
Health Insurance Coverage by Age in Caney
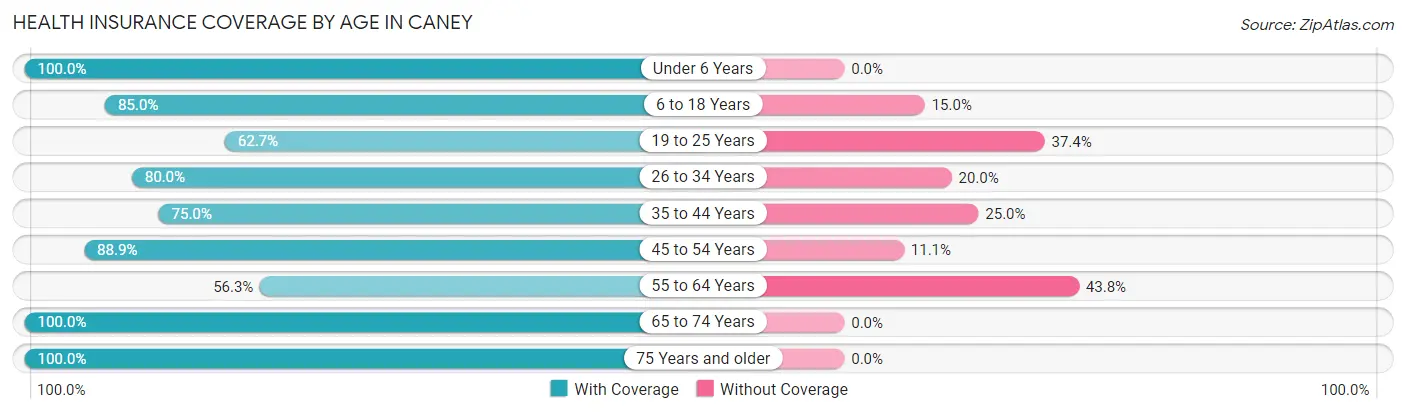
| Age Bracket | With Coverage | Without Coverage |
| Under 6 Years | 15 (100.0%) | 0 (0.0%) |
| 6 to 18 Years | 68 (85.0%) | 12 (15.0%) |
| 19 to 25 Years | 52 (62.6%) | 31 (37.3%) |
| 26 to 34 Years | 36 (80.0%) | 9 (20.0%) |
| 35 to 44 Years | 24 (75.0%) | 8 (25.0%) |
| 45 to 54 Years | 56 (88.9%) | 7 (11.1%) |
| 55 to 64 Years | 27 (56.2%) | 21 (43.8%) |
| 65 to 74 Years | 28 (100.0%) | 0 (0.0%) |
| 75 Years and older | 7 (100.0%) | 0 (0.0%) |
| Total | 313 (78.0%) | 88 (22.0%) |
Health Insurance Coverage by Citizenship Status in Caney
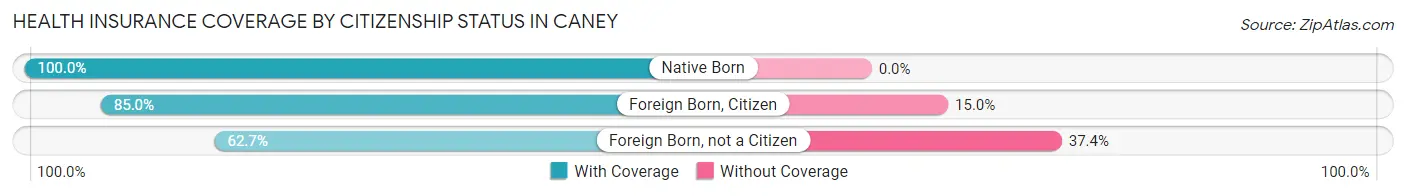
| Citizenship Status | With Coverage | Without Coverage |
| Native Born | 15 (100.0%) | 0 (0.0%) |
| Foreign Born, Citizen | 68 (85.0%) | 12 (15.0%) |
| Foreign Born, not a Citizen | 52 (62.6%) | 31 (37.3%) |
Health Insurance Coverage by Household Income in Caney
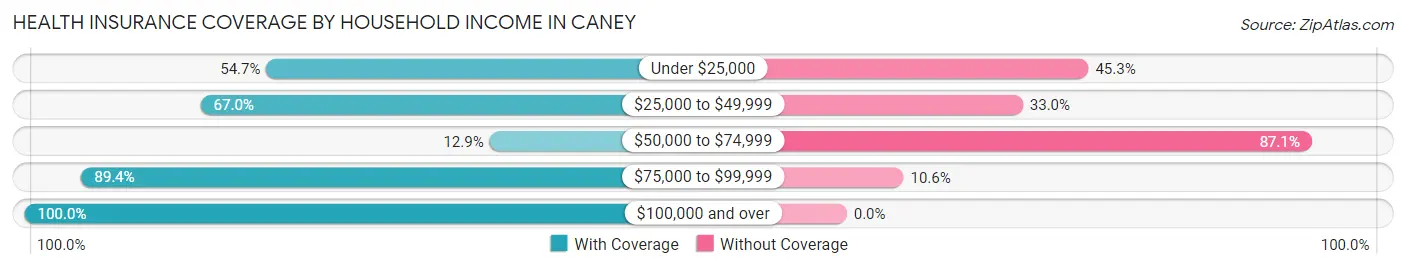
| Household Income | With Coverage | Without Coverage |
| Under $25,000 | 29 (54.7%) | 24 (45.3%) |
| $25,000 to $49,999 | 65 (67.0%) | 32 (33.0%) |
| $50,000 to $74,999 | 4 (12.9%) | 27 (87.1%) |
| $75,000 to $99,999 | 42 (89.4%) | 5 (10.6%) |
| $100,000 and over | 173 (100.0%) | 0 (0.0%) |
Public vs Private Health Insurance Coverage by Age in Caney
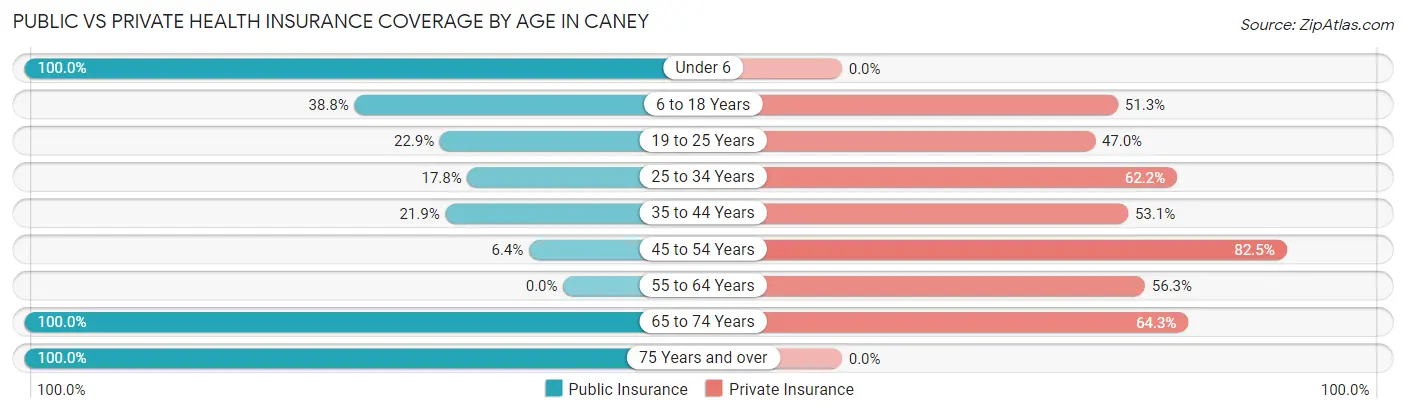
| Age Bracket | Public Insurance | Private Insurance |
| Under 6 | 15 (100.0%) | 0 (0.0%) |
| 6 to 18 Years | 31 (38.8%) | 41 (51.2%) |
| 19 to 25 Years | 19 (22.9%) | 39 (47.0%) |
| 25 to 34 Years | 8 (17.8%) | 28 (62.2%) |
| 35 to 44 Years | 7 (21.9%) | 17 (53.1%) |
| 45 to 54 Years | 4 (6.4%) | 52 (82.5%) |
| 55 to 64 Years | 0 (0.0%) | 27 (56.2%) |
| 65 to 74 Years | 28 (100.0%) | 18 (64.3%) |
| 75 Years and over | 7 (100.0%) | 0 (0.0%) |
| Total | 119 (29.7%) | 222 (55.4%) |
Disability Status by Sex by Age in Caney
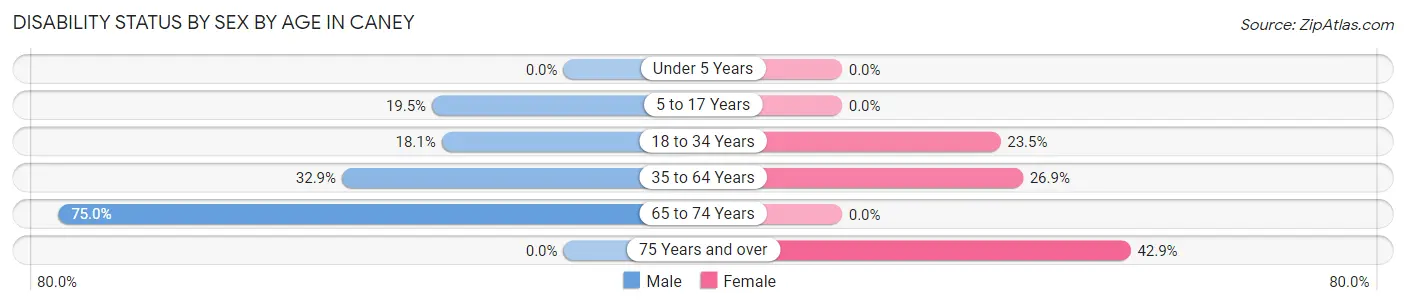
| Age Bracket | Male | Female |
| Under 5 Years | 0 (0.0%) | 0 (0.0%) |
| 5 to 17 Years | 8 (19.5%) | 0 (0.0%) |
| 18 to 34 Years | 17 (18.1%) | 8 (23.5%) |
| 35 to 64 Years | 25 (32.9%) | 18 (26.9%) |
| 65 to 74 Years | 6 (75.0%) | 0 (0.0%) |
| 75 Years and over | 0 (0.0%) | 3 (42.9%) |
Disability Class by Sex by Age in Caney
Disability Class: Hearing Difficulty
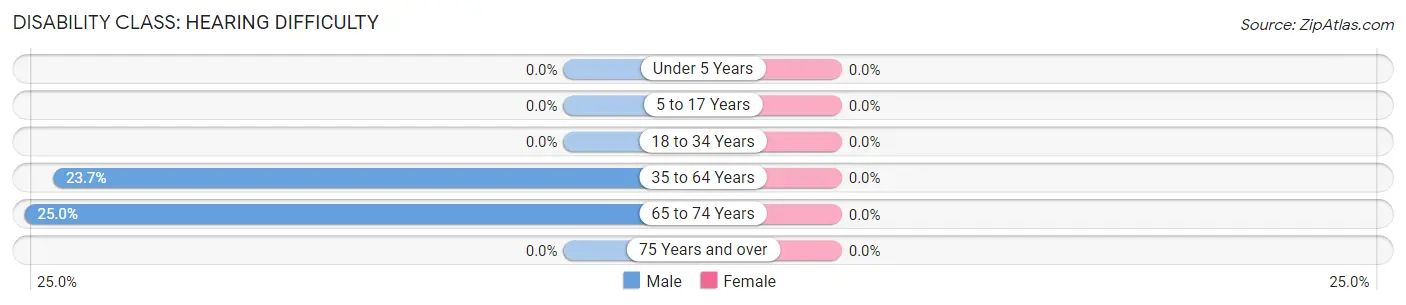
| Age Bracket | Male | Female |
| Under 5 Years | 0 (0.0%) | 0 (0.0%) |
| 5 to 17 Years | 0 (0.0%) | 0 (0.0%) |
| 18 to 34 Years | 0 (0.0%) | 0 (0.0%) |
| 35 to 64 Years | 18 (23.7%) | 0 (0.0%) |
| 65 to 74 Years | 2 (25.0%) | 0 (0.0%) |
| 75 Years and over | 0 (0.0%) | 0 (0.0%) |
Disability Class: Vision Difficulty
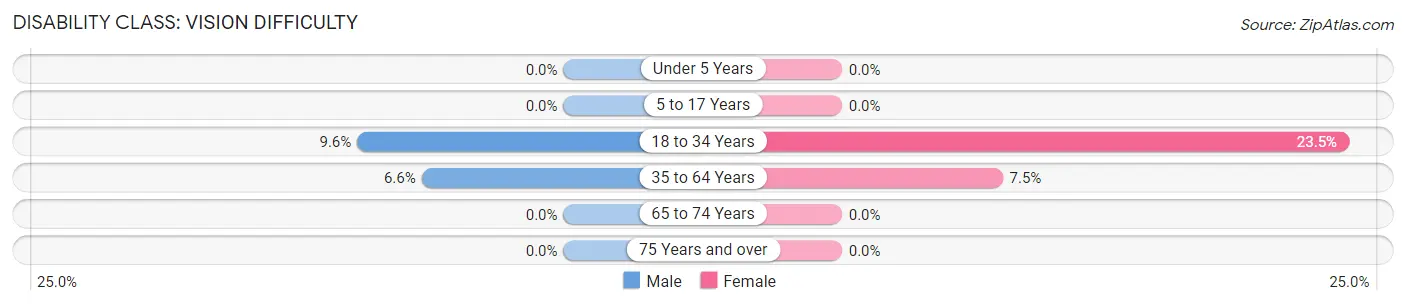
| Age Bracket | Male | Female |
| Under 5 Years | 0 (0.0%) | 0 (0.0%) |
| 5 to 17 Years | 0 (0.0%) | 0 (0.0%) |
| 18 to 34 Years | 9 (9.6%) | 8 (23.5%) |
| 35 to 64 Years | 5 (6.6%) | 5 (7.5%) |
| 65 to 74 Years | 0 (0.0%) | 0 (0.0%) |
| 75 Years and over | 0 (0.0%) | 0 (0.0%) |
Disability Class: Cognitive Difficulty
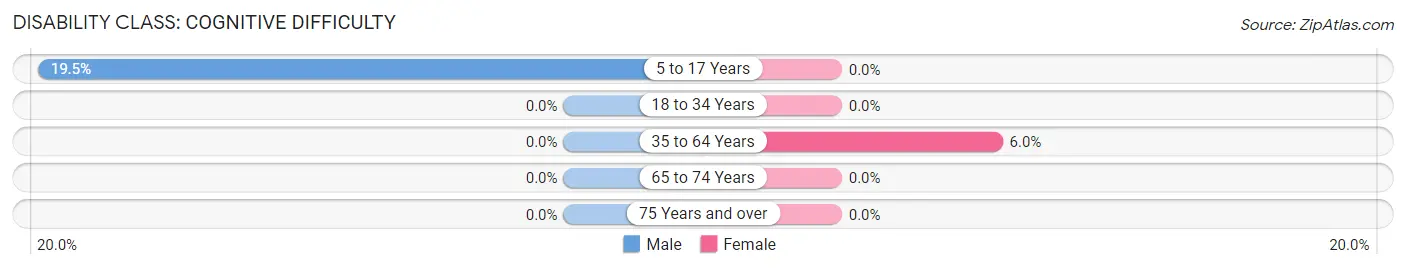
| Age Bracket | Male | Female |
| 5 to 17 Years | 8 (19.5%) | 0 (0.0%) |
| 18 to 34 Years | 0 (0.0%) | 0 (0.0%) |
| 35 to 64 Years | 0 (0.0%) | 4 (6.0%) |
| 65 to 74 Years | 0 (0.0%) | 0 (0.0%) |
| 75 Years and over | 0 (0.0%) | 0 (0.0%) |
Disability Class: Ambulatory Difficulty
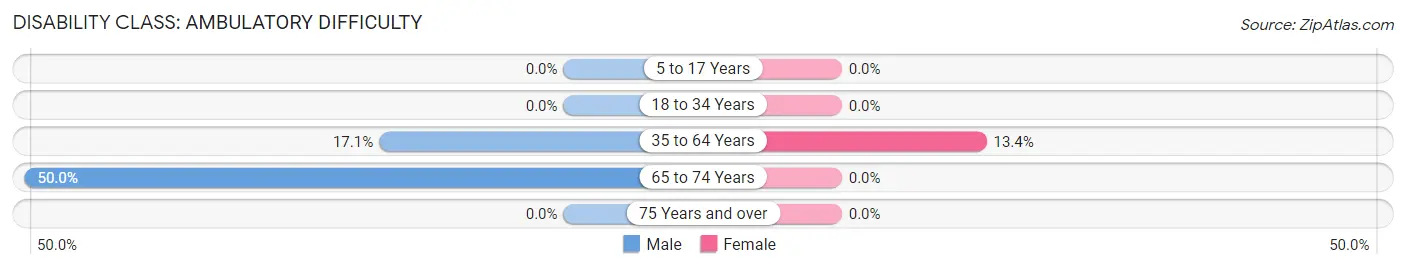
| Age Bracket | Male | Female |
| 5 to 17 Years | 0 (0.0%) | 0 (0.0%) |
| 18 to 34 Years | 0 (0.0%) | 0 (0.0%) |
| 35 to 64 Years | 13 (17.1%) | 9 (13.4%) |
| 65 to 74 Years | 4 (50.0%) | 0 (0.0%) |
| 75 Years and over | 0 (0.0%) | 0 (0.0%) |
Disability Class: Self-Care Difficulty
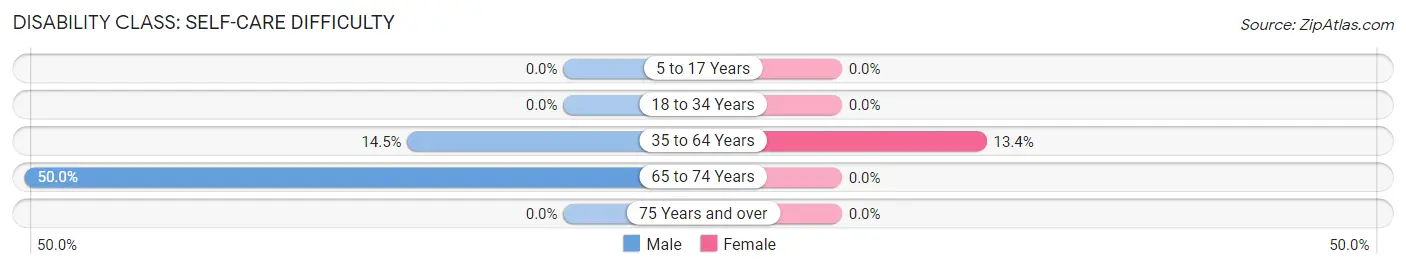
| Age Bracket | Male | Female |
| 5 to 17 Years | 0 (0.0%) | 0 (0.0%) |
| 18 to 34 Years | 0 (0.0%) | 0 (0.0%) |
| 35 to 64 Years | 11 (14.5%) | 9 (13.4%) |
| 65 to 74 Years | 4 (50.0%) | 0 (0.0%) |
| 75 Years and over | 0 (0.0%) | 0 (0.0%) |
Technology Access in Caney
Computing Device Access in Caney
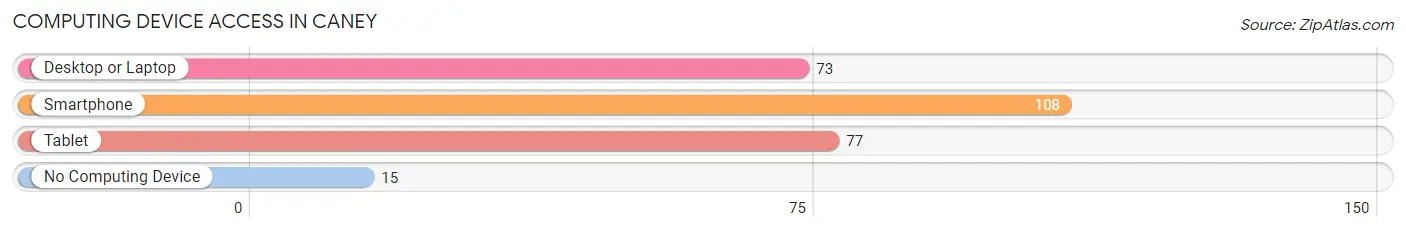
| Device Type | # Households | % Households |
| Desktop or Laptop | 73 | 56.1% |
| Smartphone | 108 | 83.1% |
| Tablet | 77 | 59.2% |
| No Computing Device | 15 | 11.5% |
| Total | 130 | 100.0% |
Internet Access in Caney
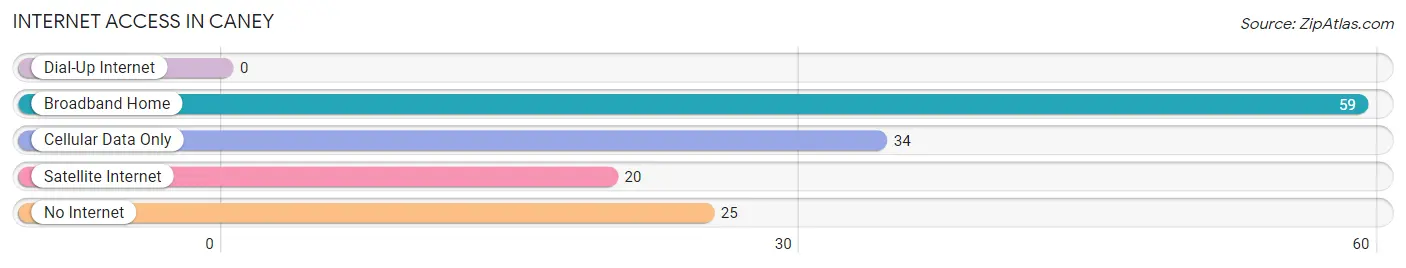
| Internet Type | # Households | % Households |
| Dial-Up Internet | 0 | 0.0% |
| Broadband Home | 59 | 45.4% |
| Cellular Data Only | 34 | 26.2% |
| Satellite Internet | 20 | 15.4% |
| No Internet | 25 | 19.2% |
| Total | 130 | 100.0% |
Caney Summary
Caney, Oklahoma is a small town located in the northeastern corner of Oklahoma, in the foothills of the Ozark Mountains. It is situated in the county of Delaware, and is part of the Fort Smith metropolitan area. The town has a population of approximately 1,000 people, and is known for its rural charm and friendly atmosphere.
History
Caney was founded in 1872 by a group of settlers from Arkansas. The town was named after the nearby Caney Creek, which was named after the Caddo Indians who once lived in the area. The town was originally a farming community, and the main crops grown were cotton, corn, and wheat. In the early 1900s, the town began to grow and develop, and by the 1920s, it had become a thriving community.
In the 1930s, the Great Depression hit the town hard, and many of the businesses and farms closed. However, the town was able to survive, and by the 1950s, it had become a popular tourist destination. The town was known for its beautiful scenery, and many people came to visit the nearby lakes and rivers.
In the 1960s, the town began to experience a period of growth and development. The town was connected to the nearby cities of Tulsa and Fort Smith by a new highway, and the population began to increase. In the 1970s, the town was incorporated, and the population continued to grow.
Geography
Caney is located in the northeastern corner of Oklahoma, in the foothills of the Ozark Mountains. The town is situated in the county of Delaware, and is part of the Fort Smith metropolitan area. The town is located at the intersection of US Highway 59 and State Highway 10. The town is surrounded by rolling hills and forests, and is known for its beautiful scenery.
The climate in Caney is generally mild, with hot summers and cold winters. The average temperature in the summer is around 80 degrees Fahrenheit, and the average temperature in the winter is around 40 degrees Fahrenheit. The town receives an average of 40 inches of rain per year, and the average snowfall is around 10 inches per year.
Economy
The economy of Caney is largely based on agriculture and tourism. The town is home to several farms, which produce a variety of crops, including cotton, corn, and wheat. The town is also home to several tourist attractions, including the nearby lakes and rivers, which attract visitors from all over the country.
In addition to agriculture and tourism, the town is also home to several small businesses, including restaurants, shops, and other services. The town is also home to several manufacturing companies, which produce a variety of products, including furniture, clothing, and electronics.
Demographics
As of the 2010 census, the population of Caney was 1,000 people. The town is predominantly white, with a small percentage of African Americans, Hispanics, and Native Americans. The median household income in the town is around $35,000, and the median home value is around $90,000. The town has a low unemployment rate, and the majority of the population is employed in the agricultural and tourism industries.
Common Questions
What is Per Capita Income in Caney?
Per Capita income in Caney is $29,734.
What is the Median Family Income in Caney?
Median Family Income in Caney is $100,938.
What is the Median Household income in Caney?
Median Household Income in Caney is $63,750.
What is Income or Wage Gap in Caney?
Income or Wage Gap in Caney is 38.8%.
Women in Caney earn 61.2 cents for every dollar earned by a man.
What is Inequality or Gini Index in Caney?
Inequality or Gini Index in Caney is 0.52.
What is the Total Population of Caney?
Total Population of Caney is 401.
What is the Total Male Population of Caney?
Total Male Population of Caney is 234.
What is the Total Female Population of Caney?
Total Female Population of Caney is 167.
What is the Ratio of Males per 100 Females in Caney?
There are 140.12 Males per 100 Females in Caney.
What is the Ratio of Females per 100 Males in Caney?
There are 71.37 Females per 100 Males in Caney.
What is the Median Population Age in Caney?
Median Population Age in Caney is 31.1 Years.
What is the Average Family Size in Caney
Average Family Size in Caney is 4.5 People.
What is the Average Household Size in Caney
Average Household Size in Caney is 3.1 People.
How Large is the Labor Force in Caney?
There are 238 People in the Labor Forcein in Caney.
What is the Percentage of People in the Labor Force in Caney?
76.8% of People are in the Labor Force in Caney.
What is the Unemployment Rate in Caney?
Unemployment Rate in Caney is 0.4%.