Calumet, OK Map & Demographics
Calumet Map
Calumet Overview
$23,186
PER CAPITA INCOME
$85,556
AVG FAMILY INCOME
$56,875
AVG HOUSEHOLD INCOME
6.7%
WAGE / INCOME GAP [ % ]
93.3¢/ $1
WAGE / INCOME GAP [ $ ]
0.47
INEQUALITY / GINI INDEX
435
TOTAL POPULATION
179
MALE POPULATION
256
FEMALE POPULATION
69.92
MALES / 100 FEMALES
143.02
FEMALES / 100 MALES
25.5
MEDIAN AGE
4.8
AVG FAMILY SIZE
3.4
AVG HOUSEHOLD SIZE
139
LABOR FORCE [ PEOPLE ]
54.5%
PERCENT IN LABOR FORCE
2.9%
UNEMPLOYMENT RATE
Calumet Zip Codes
Calumet Area Codes
Income in Calumet
Income Overview in Calumet
Per Capita Income in Calumet is $23,186, while median incomes of families and households are $85,556 and $56,875 respectively.
| Characteristic | Number | Measure |
| Per Capita Income | 435 | $23,186 |
| Median Family Income | 80 | $85,556 |
| Mean Family Income | 80 | $98,099 |
| Median Household Income | 127 | $56,875 |
| Mean Household Income | 127 | $77,220 |
| Income Deficit | 80 | $0 |
| Wage / Income Gap (%) | 435 | 6.69% |
| Wage / Income Gap ($) | 435 | 93.31¢ per $1 |
| Gini / Inequality Index | 435 | 0.47 |
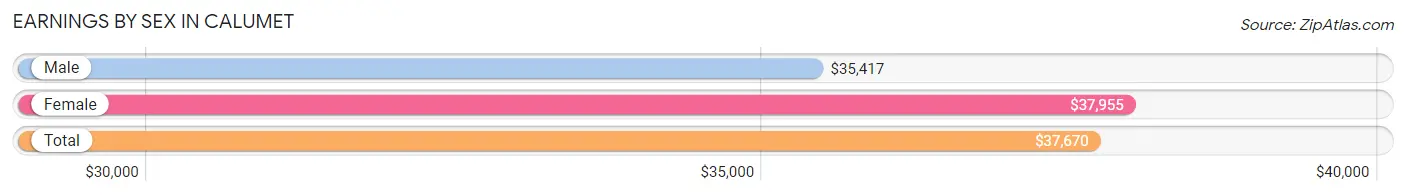
Earnings by Sex in Calumet
Average Earnings in Calumet are $37,670, $35,417 for men and $37,955 for women, a difference of 6.7%.
| Sex | Number | Average Earnings |
| Male | 77 (56.2%) | $35,417 |
| Female | 60 (43.8%) | $37,955 |
| Total | 137 (100.0%) | $37,670 |
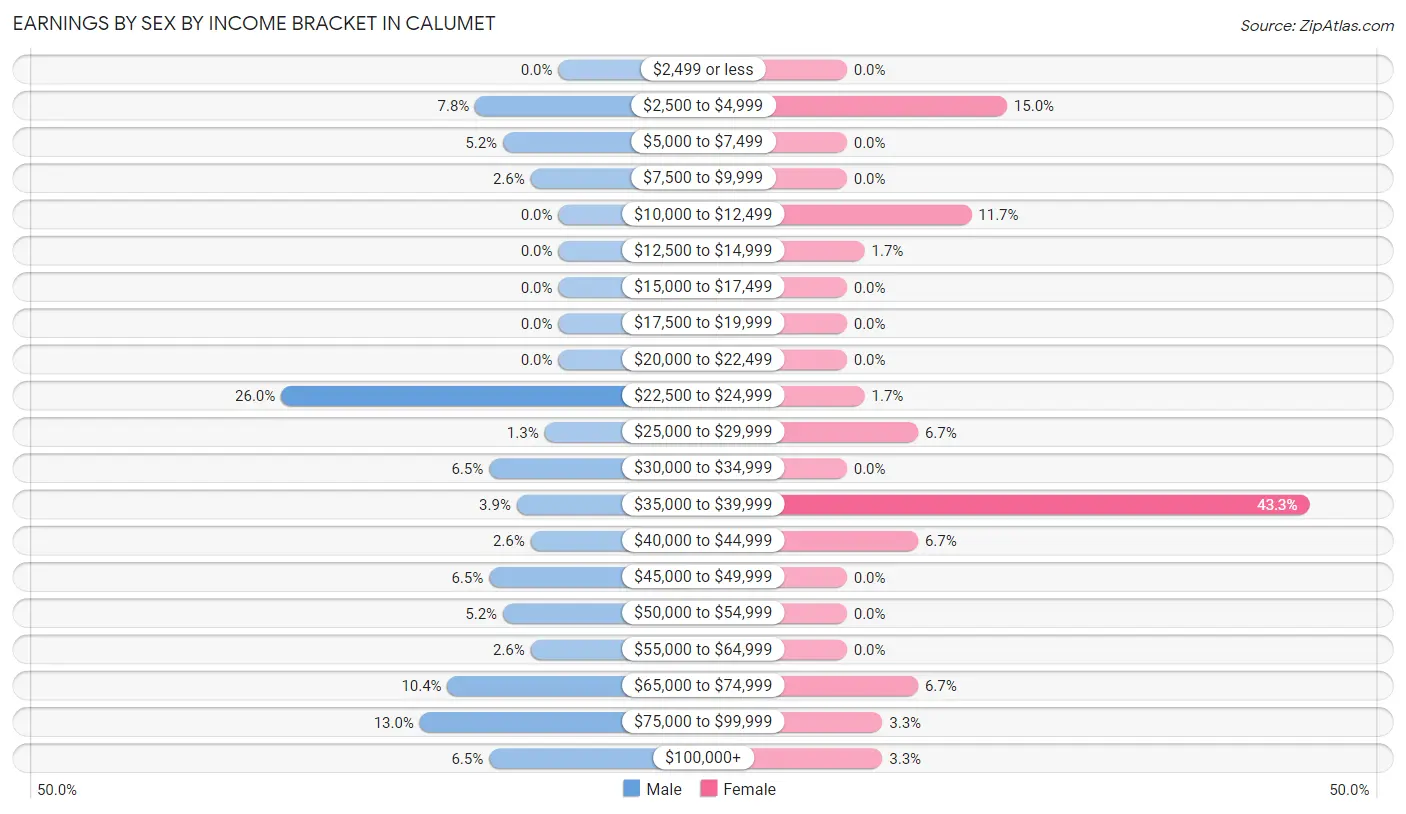
Earnings by Sex by Income Bracket in Calumet
The most common earnings brackets in Calumet are $22,500 to $24,999 for men (20 | 26.0%) and $35,000 to $39,999 for women (26 | 43.3%).
| Income | Male | Female |
| $2,499 or less | 0 (0.0%) | 0 (0.0%) |
| $2,500 to $4,999 | 6 (7.8%) | 9 (15.0%) |
| $5,000 to $7,499 | 4 (5.2%) | 0 (0.0%) |
| $7,500 to $9,999 | 2 (2.6%) | 0 (0.0%) |
| $10,000 to $12,499 | 0 (0.0%) | 7 (11.7%) |
| $12,500 to $14,999 | 0 (0.0%) | 1 (1.7%) |
| $15,000 to $17,499 | 0 (0.0%) | 0 (0.0%) |
| $17,500 to $19,999 | 0 (0.0%) | 0 (0.0%) |
| $20,000 to $22,499 | 0 (0.0%) | 0 (0.0%) |
| $22,500 to $24,999 | 20 (26.0%) | 1 (1.7%) |
| $25,000 to $29,999 | 1 (1.3%) | 4 (6.7%) |
| $30,000 to $34,999 | 5 (6.5%) | 0 (0.0%) |
| $35,000 to $39,999 | 3 (3.9%) | 26 (43.3%) |
| $40,000 to $44,999 | 2 (2.6%) | 4 (6.7%) |
| $45,000 to $49,999 | 5 (6.5%) | 0 (0.0%) |
| $50,000 to $54,999 | 4 (5.2%) | 0 (0.0%) |
| $55,000 to $64,999 | 2 (2.6%) | 0 (0.0%) |
| $65,000 to $74,999 | 8 (10.4%) | 4 (6.7%) |
| $75,000 to $99,999 | 10 (13.0%) | 2 (3.3%) |
| $100,000+ | 5 (6.5%) | 2 (3.3%) |
| Total | 77 (100.0%) | 60 (100.0%) |
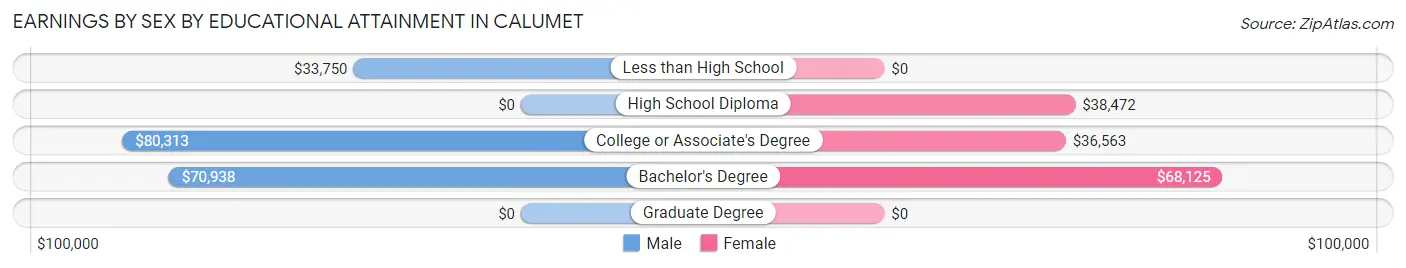
Earnings by Sex by Educational Attainment in Calumet
Average earnings in Calumet are $35,833 for men and $38,421 for women, a difference of 6.7%. Men with an educational attainment of college or associate's degree enjoy the highest average annual earnings of $80,313, while those with less than high school education earn the least with $33,750. Women with an educational attainment of bachelor's degree earn the most with the average annual earnings of $68,125, while those with college or associate's degree education have the smallest earnings of $36,563.
| Educational Attainment | Male Income | Female Income |
| Less than High School | $33,750 | $0 |
| High School Diploma | - | - |
| College or Associate's Degree | $80,313 | $36,563 |
| Bachelor's Degree | $70,938 | $68,125 |
| Graduate Degree | - | - |
| Total | $35,833 | $38,421 |
Family Income in Calumet
Family Income Brackets in Calumet
According to the Calumet family income data, there are 31 families falling into the $75,000 to $99,999 income range, which is the most common income bracket and makes up 38.8% of all families.
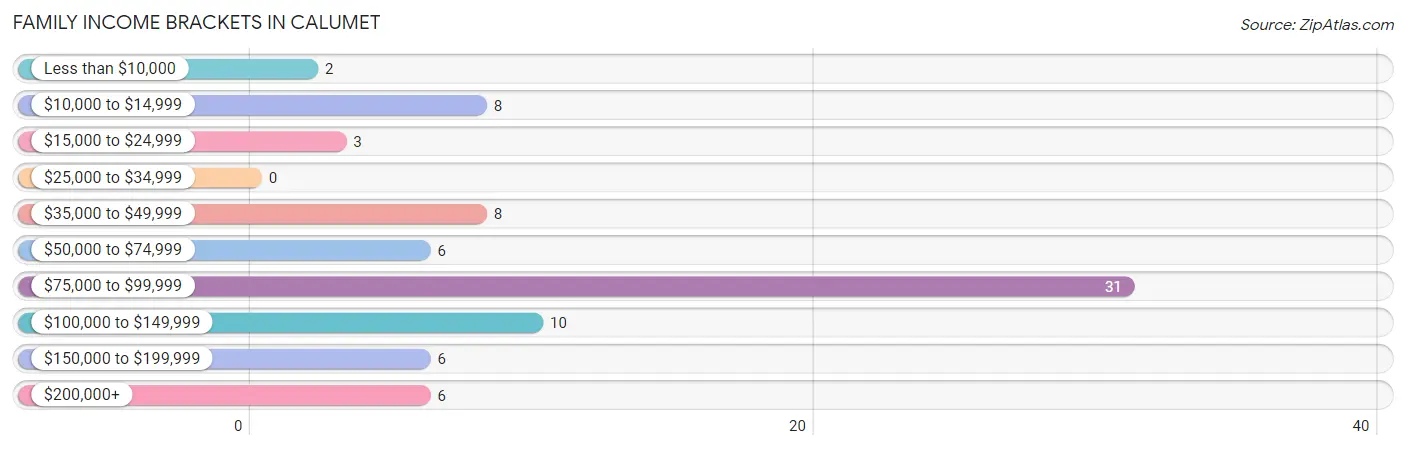
| Income Bracket | # Families | % Families |
| Less than $10,000 | 2 | 2.5% |
| $10,000 to $14,999 | 8 | 10.0% |
| $15,000 to $24,999 | 3 | 3.8% |
| $25,000 to $34,999 | 0 | 0.0% |
| $35,000 to $49,999 | 8 | 10.0% |
| $50,000 to $74,999 | 6 | 7.5% |
| $75,000 to $99,999 | 31 | 38.8% |
| $100,000 to $149,999 | 10 | 12.5% |
| $150,000 to $199,999 | 6 | 7.5% |
| $200,000+ | 6 | 7.5% |
Family Income by Famaliy Size in Calumet
3-person families (13 | 16.3%) account for the highest median family income in Calumet with $143,438 per family, while 3-person families (13 | 16.3%) have the highest median income of $47,813 per family member.
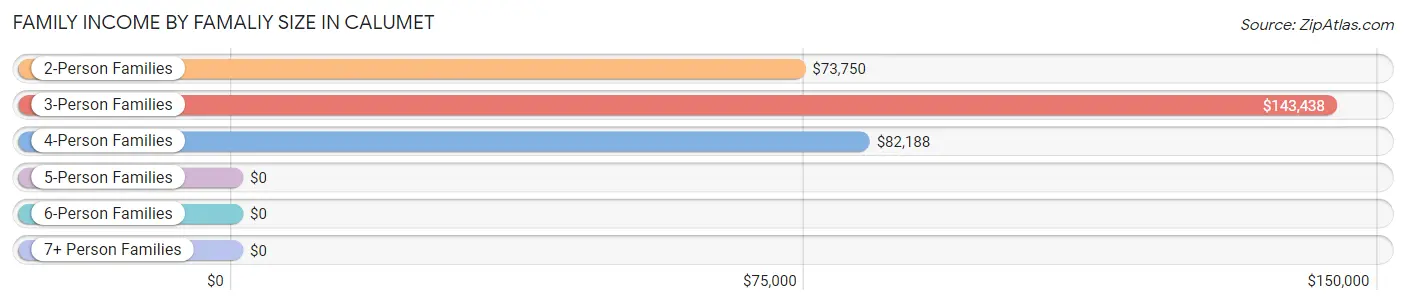
| Income Bracket | # Families | Median Income |
| 2-Person Families | 25 (31.2%) | $73,750 |
| 3-Person Families | 13 (16.3%) | $143,438 |
| 4-Person Families | 9 (11.3%) | $82,188 |
| 5-Person Families | 9 (11.3%) | $0 |
| 6-Person Families | 22 (27.5%) | $0 |
| 7+ Person Families | 2 (2.5%) | $0 |
| Total | 80 (100.0%) | $85,556 |
Family Income by Number of Earners in Calumet
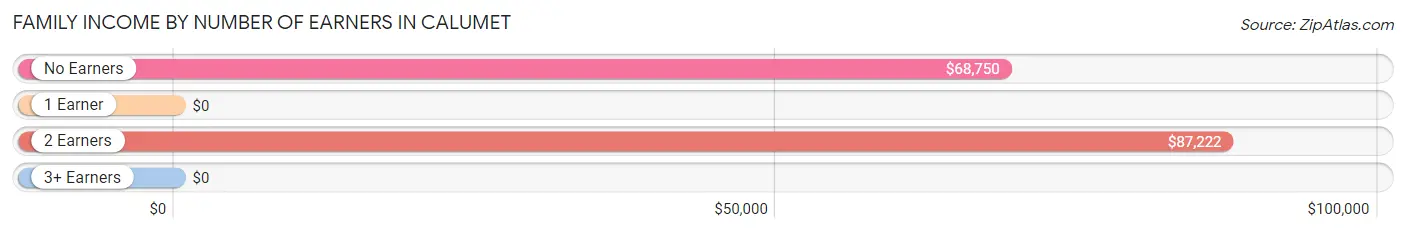
| Number of Earners | # Families | Median Income |
| No Earners | 16 (20.0%) | $68,750 |
| 1 Earner | 11 (13.8%) | $0 |
| 2 Earners | 48 (60.0%) | $87,222 |
| 3+ Earners | 5 (6.2%) | $0 |
| Total | 80 (100.0%) | $85,556 |
Household Income in Calumet
Household Income Brackets in Calumet
With 33 households falling in the category, the $75,000 to $99,999 income range is the most frequent in Calumet, accounting for 26.0% of all households. In contrast, only 5 households (3.9%) fall into the $25,000 to $34,999 income bracket, making it the least populous group.
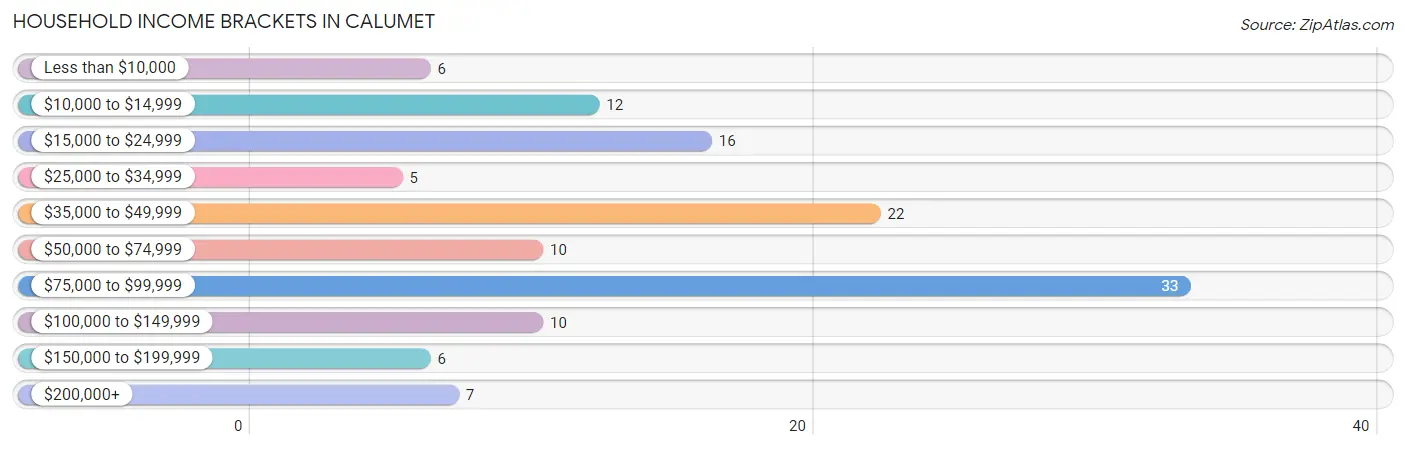
| Income Bracket | # Households | % Households |
| Less than $10,000 | 6 | 4.7% |
| $10,000 to $14,999 | 12 | 9.4% |
| $15,000 to $24,999 | 16 | 12.6% |
| $25,000 to $34,999 | 5 | 3.9% |
| $35,000 to $49,999 | 22 | 17.3% |
| $50,000 to $74,999 | 10 | 7.9% |
| $75,000 to $99,999 | 33 | 26.0% |
| $100,000 to $149,999 | 10 | 7.9% |
| $150,000 to $199,999 | 6 | 4.7% |
| $200,000+ | 7 | 5.5% |
Household Income by Householder Age in Calumet
The median household income in Calumet is $56,875, with the highest median household income of $86,736 found in the 25 to 44 years age bracket for the primary householder. A total of 43 households (33.9%) fall into this category. Meanwhile, the 45 to 64 years age bracket for the primary householder has the lowest median household income of $0, with 22 households (17.3%) in this group.
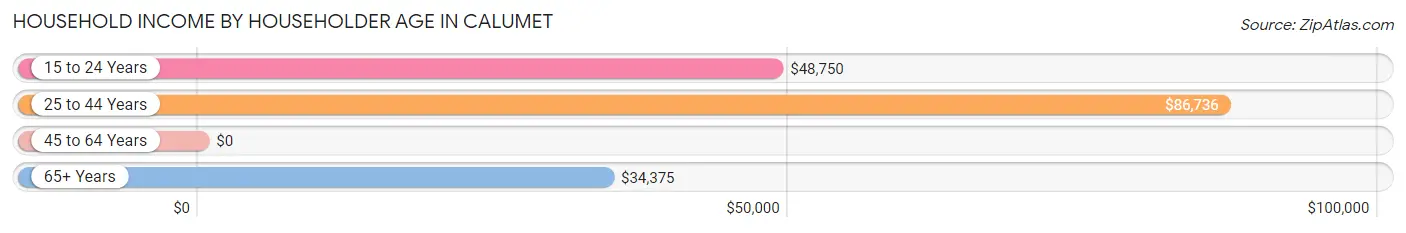
| Income Bracket | # Households | Median Income |
| 15 to 24 Years | 11 (8.7%) | $48,750 |
| 25 to 44 Years | 43 (33.9%) | $86,736 |
| 45 to 64 Years | 22 (17.3%) | $0 |
| 65+ Years | 51 (40.2%) | $34,375 |
| Total | 127 (100.0%) | $56,875 |
Poverty in Calumet
Income Below Poverty by Sex and Age in Calumet
With 14.0% poverty level for males and 11.7% for females among the residents of Calumet, 5 year old males and 18 to 24 year old females are the most vulnerable to poverty, with 3 males (100.0%) and 8 females (40.0%) in their respective age groups living below the poverty level.
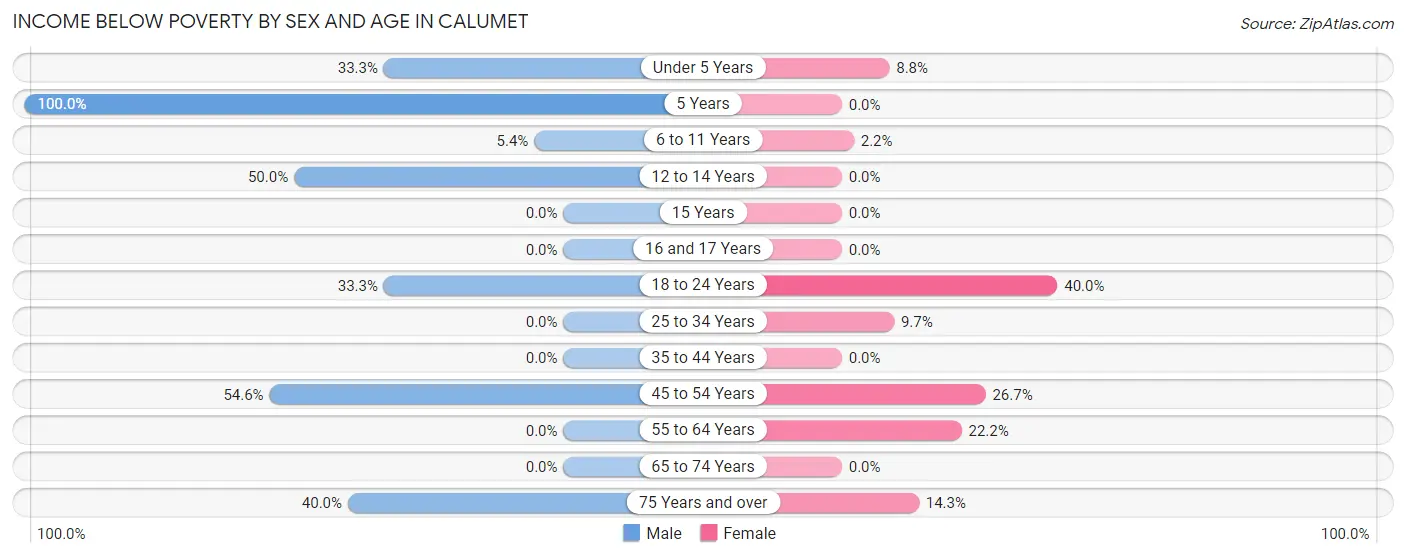
| Age Bracket | Male | Female |
| Under 5 Years | 3 (33.3%) | 6 (8.8%) |
| 5 Years | 3 (100.0%) | 0 (0.0%) |
| 6 to 11 Years | 2 (5.4%) | 1 (2.2%) |
| 12 to 14 Years | 3 (50.0%) | 0 (0.0%) |
| 15 Years | 0 (0.0%) | 0 (0.0%) |
| 16 and 17 Years | 0 (0.0%) | 0 (0.0%) |
| 18 to 24 Years | 4 (33.3%) | 8 (40.0%) |
| 25 to 34 Years | 0 (0.0%) | 3 (9.7%) |
| 35 to 44 Years | 0 (0.0%) | 0 (0.0%) |
| 45 to 54 Years | 6 (54.5%) | 4 (26.7%) |
| 55 to 64 Years | 0 (0.0%) | 4 (22.2%) |
| 65 to 74 Years | 0 (0.0%) | 0 (0.0%) |
| 75 Years and over | 4 (40.0%) | 4 (14.3%) |
| Total | 25 (14.0%) | 30 (11.7%) |
Income Above Poverty by Sex and Age in Calumet
According to the poverty statistics in Calumet, males aged 15 years and females aged 12 to 14 years are the age groups that are most secure financially, with 100.0% of males and 100.0% of females in these age groups living above the poverty line.
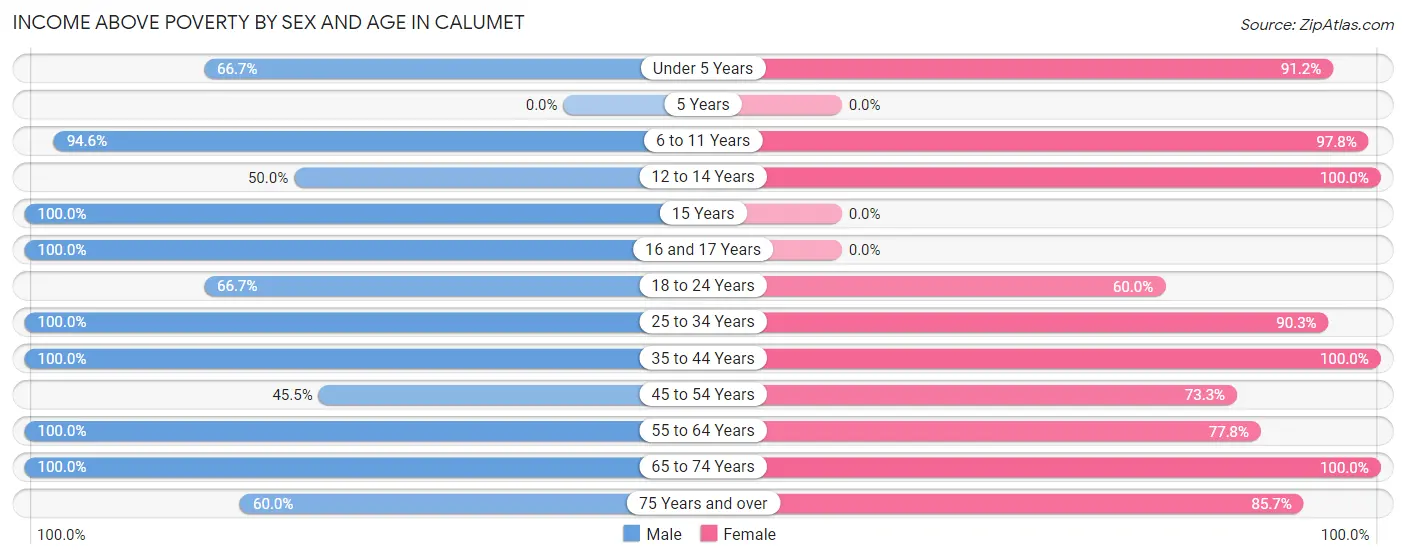
| Age Bracket | Male | Female |
| Under 5 Years | 6 (66.7%) | 62 (91.2%) |
| 5 Years | 0 (0.0%) | 0 (0.0%) |
| 6 to 11 Years | 35 (94.6%) | 44 (97.8%) |
| 12 to 14 Years | 3 (50.0%) | 7 (100.0%) |
| 15 Years | 5 (100.0%) | 0 (0.0%) |
| 16 and 17 Years | 4 (100.0%) | 0 (0.0%) |
| 18 to 24 Years | 8 (66.7%) | 12 (60.0%) |
| 25 to 34 Years | 29 (100.0%) | 28 (90.3%) |
| 35 to 44 Years | 23 (100.0%) | 6 (100.0%) |
| 45 to 54 Years | 5 (45.5%) | 11 (73.3%) |
| 55 to 64 Years | 21 (100.0%) | 14 (77.8%) |
| 65 to 74 Years | 9 (100.0%) | 18 (100.0%) |
| 75 Years and over | 6 (60.0%) | 24 (85.7%) |
| Total | 154 (86.0%) | 226 (88.3%) |
Income Below Poverty Among Married-Couple Families in Calumet
The poverty statistics for married-couple families in Calumet show that 9.4% or 6 of the total 64 families live below the poverty line. Families with no children have the highest poverty rate of 24.0%, comprising of 6 families. On the other hand, families with 1 or 2 children have the lowest poverty rate of 0.0%, which includes 0 families.
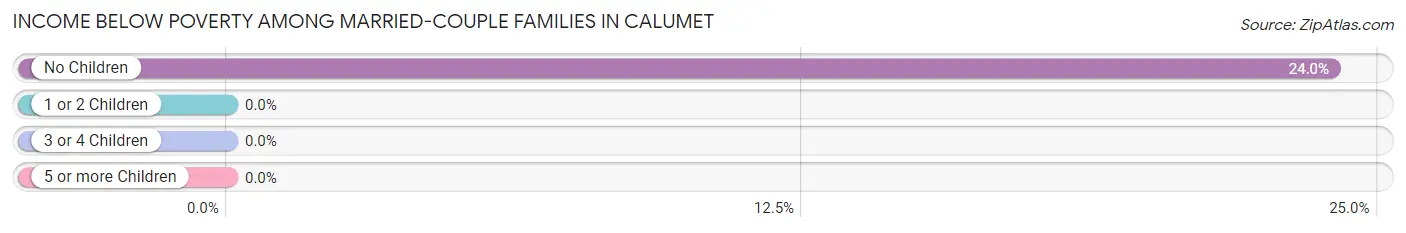
| Children | Above Poverty | Below Poverty |
| No Children | 19 (76.0%) | 6 (24.0%) |
| 1 or 2 Children | 17 (100.0%) | 0 (0.0%) |
| 3 or 4 Children | 22 (100.0%) | 0 (0.0%) |
| 5 or more Children | 0 (0.0%) | 0 (0.0%) |
| Total | 58 (90.6%) | 6 (9.4%) |
Income Below Poverty Among Single-Parent Households in Calumet
According to the poverty data in Calumet, 44.4% or 4 single-father households and 42.9% or 3 single-mother households are living below the poverty line. Among single-father households, those with 1 or 2 children have the highest poverty rate, with 4 households (44.4%) experiencing poverty. Likewise, among single-mother households, those with 1 or 2 children have the highest poverty rate, with 1 households (100.0%) falling below the poverty line.
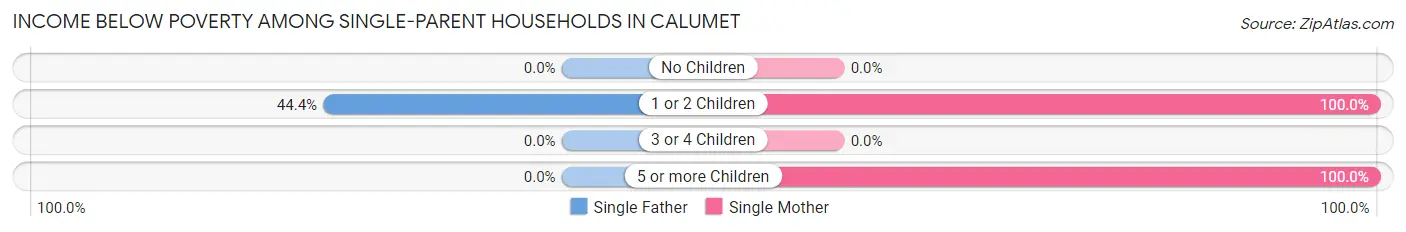
| Children | Single Father | Single Mother |
| No Children | 0 (0.0%) | 0 (0.0%) |
| 1 or 2 Children | 4 (44.4%) | 1 (100.0%) |
| 3 or 4 Children | 0 (0.0%) | 0 (0.0%) |
| 5 or more Children | 0 (0.0%) | 2 (100.0%) |
| Total | 4 (44.4%) | 3 (42.9%) |
Income Below Poverty Among Married-Couple vs Single-Parent Households in Calumet
The poverty data for Calumet shows that 6 of the married-couple family households (9.4%) and 7 of the single-parent households (43.8%) are living below the poverty level. Within the married-couple family households, those with no children have the highest poverty rate, with 6 households (24.0%) falling below the poverty line. Among the single-parent households, those with 5 or more children have the highest poverty rate, with 2 household (100.0%) living below poverty.
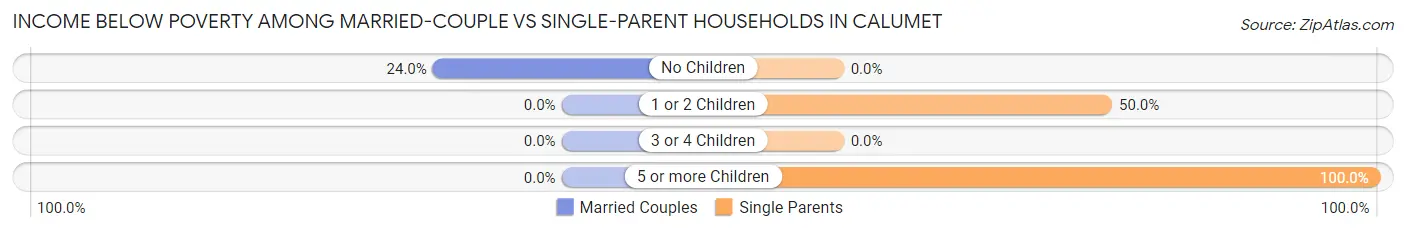
| Children | Married-Couple Families | Single-Parent Households |
| No Children | 6 (24.0%) | 0 (0.0%) |
| 1 or 2 Children | 0 (0.0%) | 5 (50.0%) |
| 3 or 4 Children | 0 (0.0%) | 0 (0.0%) |
| 5 or more Children | 0 (0.0%) | 2 (100.0%) |
| Total | 6 (9.4%) | 7 (43.8%) |
Race in Calumet
The most populous races in Calumet are White / Caucasian (234 | 53.8%), Native / Alaskan (96 | 22.1%), and Two or more Races (82 | 18.9%).
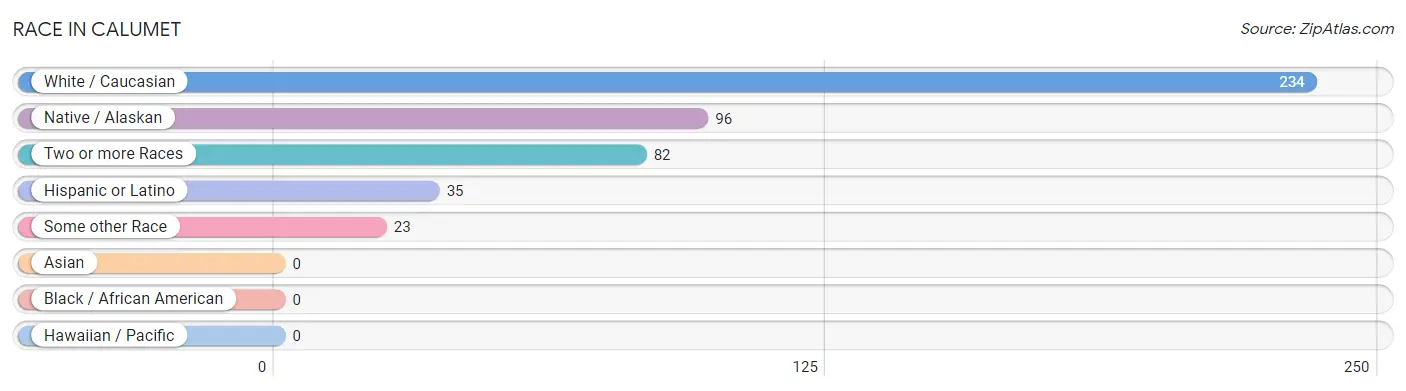
| Race | # Population | % Population |
| Asian | 0 | 0.0% |
| Black / African American | 0 | 0.0% |
| Hawaiian / Pacific | 0 | 0.0% |
| Hispanic or Latino | 35 | 8.1% |
| Native / Alaskan | 96 | 22.1% |
| White / Caucasian | 234 | 53.8% |
| Two or more Races | 82 | 18.9% |
| Some other Race | 23 | 5.3% |
| Total | 435 | 100.0% |
Ancestry in Calumet
The most populous ancestries reported in Calumet are Choctaw (90 | 20.7%), Mexican (35 | 8.1%), German (34 | 7.8%), American (15 | 3.5%), and Irish (11 | 2.5%), together accounting for 42.5% of all Calumet residents.
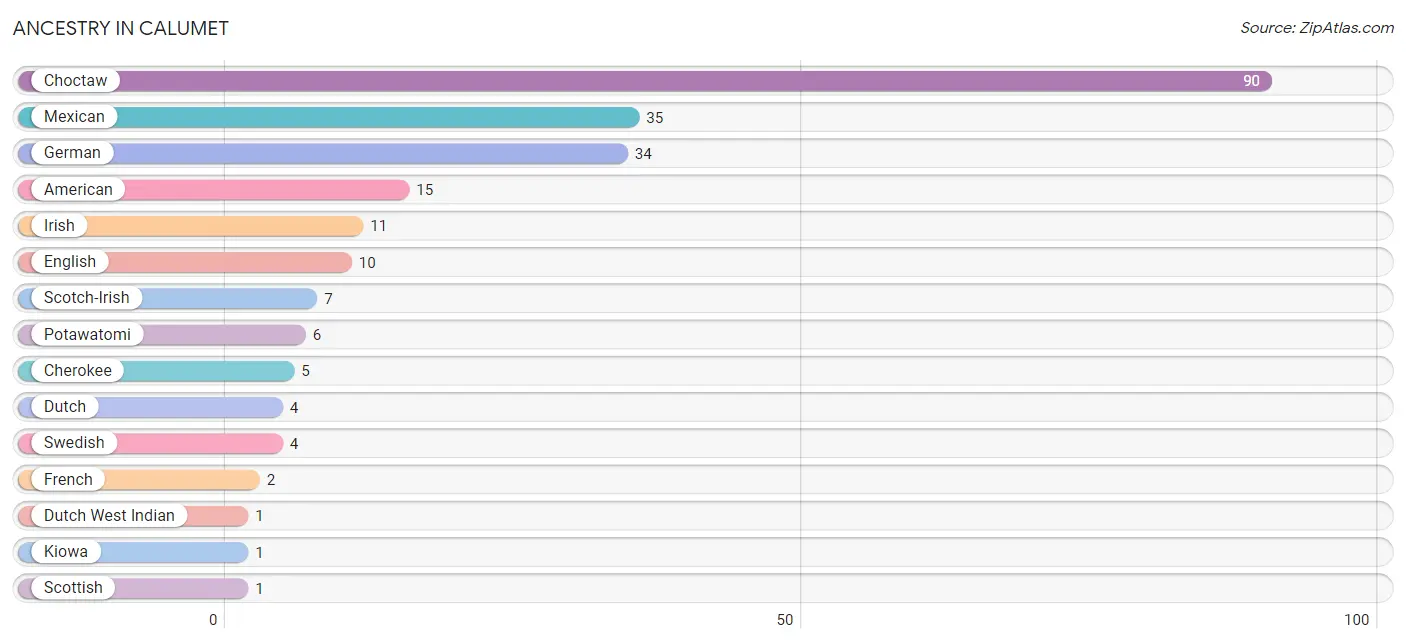
| Ancestry | # Population | % Population |
| American | 15 | 3.5% |
| Cherokee | 5 | 1.1% |
| Choctaw | 90 | 20.7% |
| Dutch | 4 | 0.9% |
| Dutch West Indian | 1 | 0.2% |
| English | 10 | 2.3% |
| French | 2 | 0.5% |
| German | 34 | 7.8% |
| Irish | 11 | 2.5% |
| Kiowa | 1 | 0.2% |
| Mexican | 35 | 8.1% |
| Potawatomi | 6 | 1.4% |
| Scotch-Irish | 7 | 1.6% |
| Scottish | 1 | 0.2% |
| Swedish | 4 | 0.9% | View All 15 Rows |
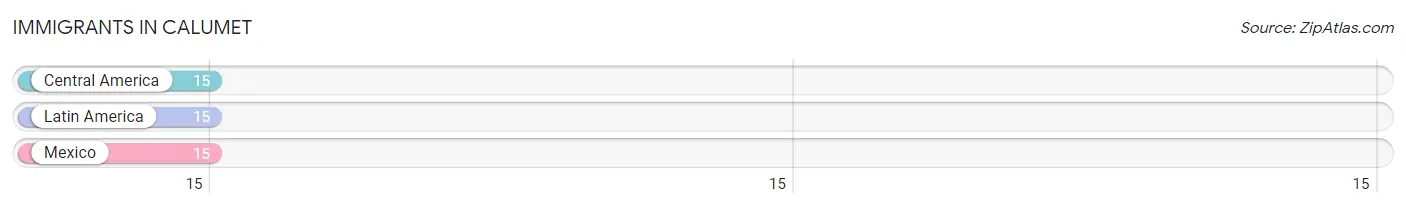
Immigrants in Calumet
The most numerous immigrant groups reported in Calumet came from Central America (15 | 3.5%), Latin America (15 | 3.5%), and Mexico (15 | 3.5%), together accounting for 10.4% of all Calumet residents.
| Immigration Origin | # Population | % Population |
| Central America | 15 | 3.5% |
| Latin America | 15 | 3.5% |
| Mexico | 15 | 3.5% | View All 3 Rows |
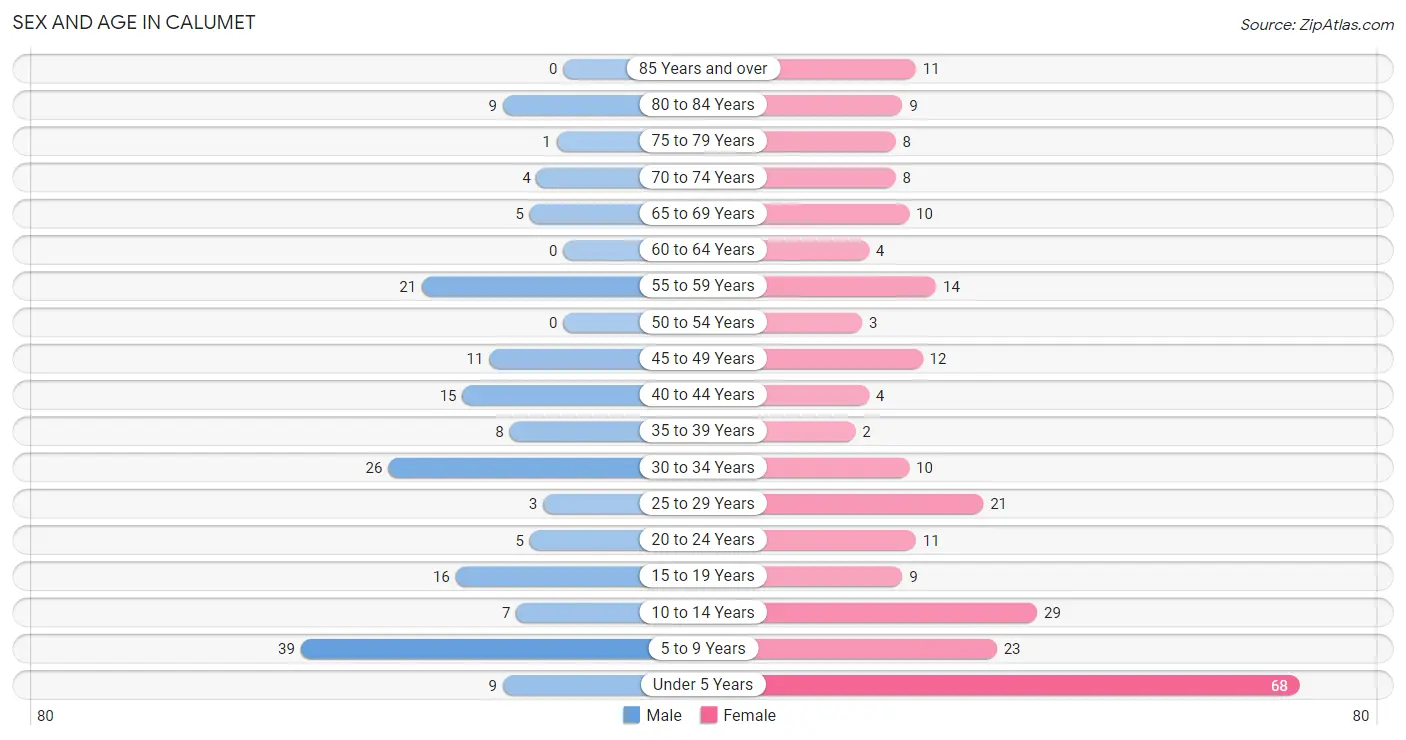
Sex and Age in Calumet
Sex and Age in Calumet
The most populous age groups in Calumet are 5 to 9 Years (39 | 21.8%) for men and Under 5 Years (68 | 26.6%) for women.
| Age Bracket | Male | Female |
| Under 5 Years | 9 (5.0%) | 68 (26.6%) |
| 5 to 9 Years | 39 (21.8%) | 23 (9.0%) |
| 10 to 14 Years | 7 (3.9%) | 29 (11.3%) |
| 15 to 19 Years | 16 (8.9%) | 9 (3.5%) |
| 20 to 24 Years | 5 (2.8%) | 11 (4.3%) |
| 25 to 29 Years | 3 (1.7%) | 21 (8.2%) |
| 30 to 34 Years | 26 (14.5%) | 10 (3.9%) |
| 35 to 39 Years | 8 (4.5%) | 2 (0.8%) |
| 40 to 44 Years | 15 (8.4%) | 4 (1.6%) |
| 45 to 49 Years | 11 (6.1%) | 12 (4.7%) |
| 50 to 54 Years | 0 (0.0%) | 3 (1.2%) |
| 55 to 59 Years | 21 (11.7%) | 14 (5.5%) |
| 60 to 64 Years | 0 (0.0%) | 4 (1.6%) |
| 65 to 69 Years | 5 (2.8%) | 10 (3.9%) |
| 70 to 74 Years | 4 (2.2%) | 8 (3.1%) |
| 75 to 79 Years | 1 (0.6%) | 8 (3.1%) |
| 80 to 84 Years | 9 (5.0%) | 9 (3.5%) |
| 85 Years and over | 0 (0.0%) | 11 (4.3%) |
| Total | 179 (100.0%) | 256 (100.0%) |
Families and Households in Calumet
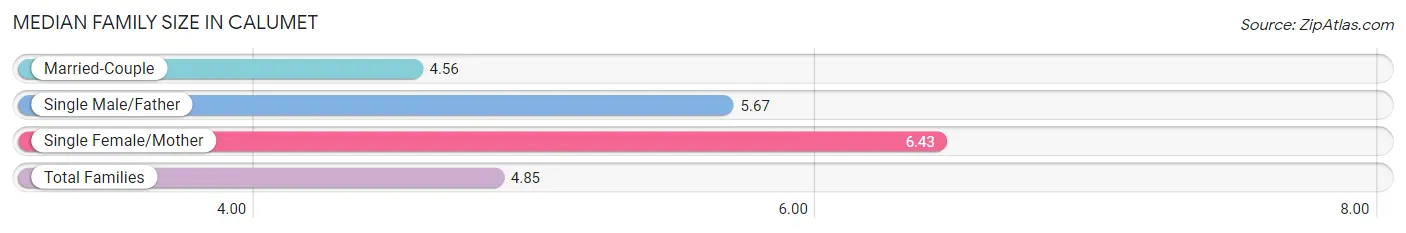
Median Family Size in Calumet
The median family size in Calumet is 4.85 persons per family, with single female/mother families (7 | 8.7%) accounting for the largest median family size of 6.43 persons per family. On the other hand, married-couple families (64 | 80.0%) represent the smallest median family size with 4.56 persons per family.
| Family Type | # Families | Family Size |
| Married-Couple | 64 (80.0%) | 4.56 |
| Single Male/Father | 9 (11.3%) | 5.67 |
| Single Female/Mother | 7 (8.7%) | 6.43 |
| Total Families | 80 (100.0%) | 4.85 |
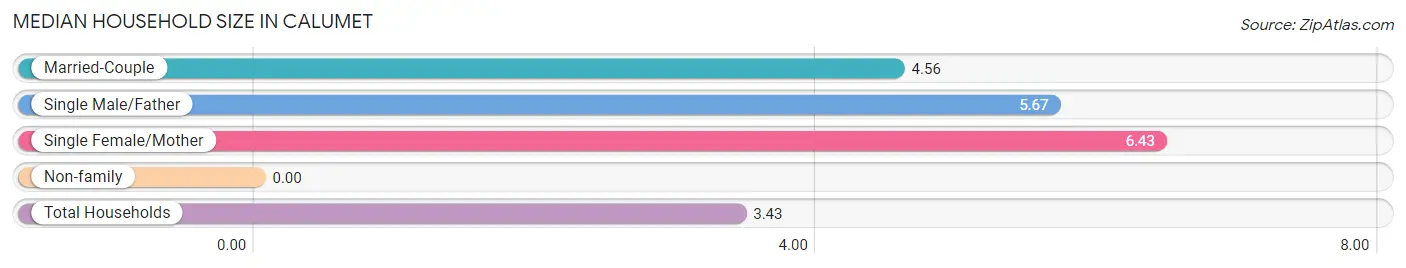
Median Household Size in Calumet
| Household Type | # Households | Household Size |
| Married-Couple | 64 (50.4%) | 4.56 |
| Single Male/Father | 9 (7.1%) | 5.67 |
| Single Female/Mother | 7 (5.5%) | 6.43 |
| Non-family | 47 (37.0%) | - |
| Total Households | 127 (100.0%) | 3.43 |
Household Size by Marriage Status in Calumet
Out of a total of 127 households in Calumet, 80 (63.0%) are family households, while 47 (37.0%) are nonfamily households. The most numerous type of family households are 2-person households, comprising 25, and the most common type of nonfamily households are 1-person households, comprising 47.
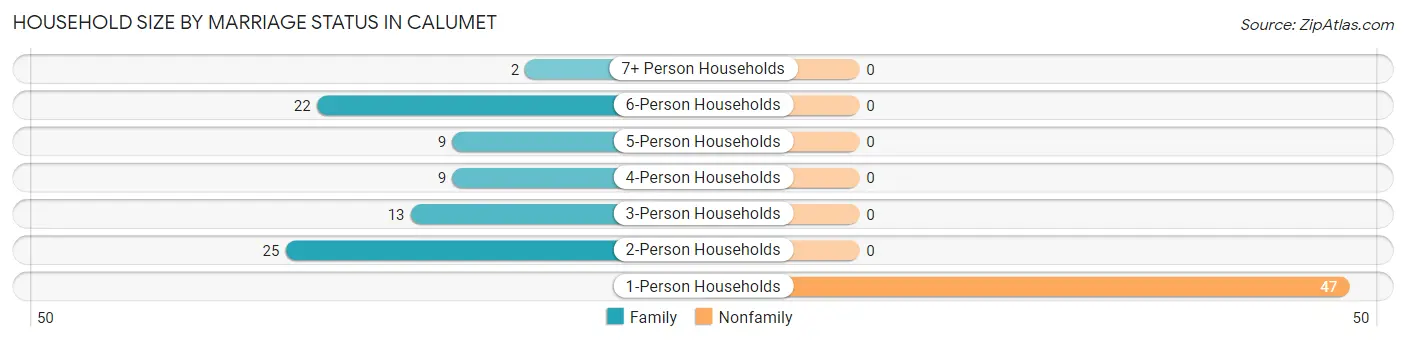
| Household Size | Family Households | Nonfamily Households |
| 1-Person Households | - | 47 (37.0%) |
| 2-Person Households | 25 (19.7%) | 0 (0.0%) |
| 3-Person Households | 13 (10.2%) | 0 (0.0%) |
| 4-Person Households | 9 (7.1%) | 0 (0.0%) |
| 5-Person Households | 9 (7.1%) | 0 (0.0%) |
| 6-Person Households | 22 (17.3%) | 0 (0.0%) |
| 7+ Person Households | 2 (1.6%) | 0 (0.0%) |
| Total | 80 (63.0%) | 47 (37.0%) |
Female Fertility in Calumet
Fertility by Age in Calumet
| Age Bracket | Women with Births | Births / 1,000 Women |
| 15 to 19 years | 0 (0.0%) | 0.0 |
| 20 to 34 years | 0 (0.0%) | 0.0 |
| 35 to 50 years | 0 (0.0%) | 0.0 |
| Total | 0 (0.0%) | 0.0 |
Fertility by Age by Marriage Status in Calumet
| Age Bracket | Married | Unmarried |
| 15 to 19 years | 0 (0.0%) | 0 (0.0%) |
| 20 to 34 years | 0 (0.0%) | 0 (0.0%) |
| 35 to 50 years | 0 (0.0%) | 0 (0.0%) |
| Total | 0 (0.0%) | 0 (0.0%) |
Fertility by Education in Calumet
| Educational Attainment | Women with Births | Births / 1,000 Women |
| Less than High School | 0 (0.0%) | 0.0 |
| High School Diploma | 0 (0.0%) | 0.0 |
| College or Associate's Degree | 0 (0.0%) | 0.0 |
| Bachelor's Degree | 0 (0.0%) | 0.0 |
| Graduate Degree | 0 (0.0%) | 0.0 |
| Total | 0 (0.0%) | 0.0 |
Fertility by Education by Marriage Status in Calumet
| Educational Attainment | Married | Unmarried |
| Less than High School | 0 (0.0%) | 0 (0.0%) |
| High School Diploma | 0 (0.0%) | 0 (0.0%) |
| College or Associate's Degree | 0 (0.0%) | 0 (0.0%) |
| Bachelor's Degree | 0 (0.0%) | 0 (0.0%) |
| Graduate Degree | 0 (0.0%) | 0 (0.0%) |
| Total | 0 (0.0%) | 0 (0.0%) |
Employment Characteristics in Calumet
Employment by Class of Employer in Calumet
Among the 133 employed individuals in Calumet, private company employees (60 | 45.1%), self-employed (not incorporated) (24 | 18.0%), and local government employees (24 | 18.0%) make up the most common classes of employment.
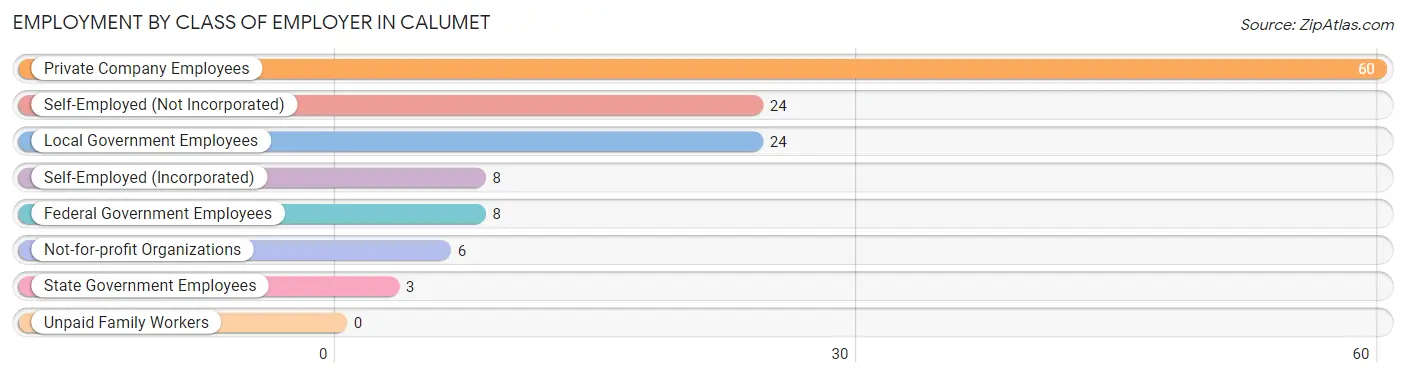
| Employer Class | # Employees | % Employees |
| Private Company Employees | 60 | 45.1% |
| Self-Employed (Incorporated) | 8 | 6.0% |
| Self-Employed (Not Incorporated) | 24 | 18.0% |
| Not-for-profit Organizations | 6 | 4.5% |
| Local Government Employees | 24 | 18.0% |
| State Government Employees | 3 | 2.3% |
| Federal Government Employees | 8 | 6.0% |
| Unpaid Family Workers | 0 | 0.0% |
| Total | 133 | 100.0% |
Employment Status by Age in Calumet
According to the labor force statistics for Calumet, out of the total population over 16 years of age (255), 54.5% or 139 individuals are in the labor force, with 2.9% or 4 of them unemployed. The age group with the highest labor force participation rate is 25 to 29 years, with 100.0% or 24 individuals in the labor force. Within the labor force, the 60 to 64 years age range has the highest percentage of unemployed individuals, with 100.0% or 4 of them being unemployed.
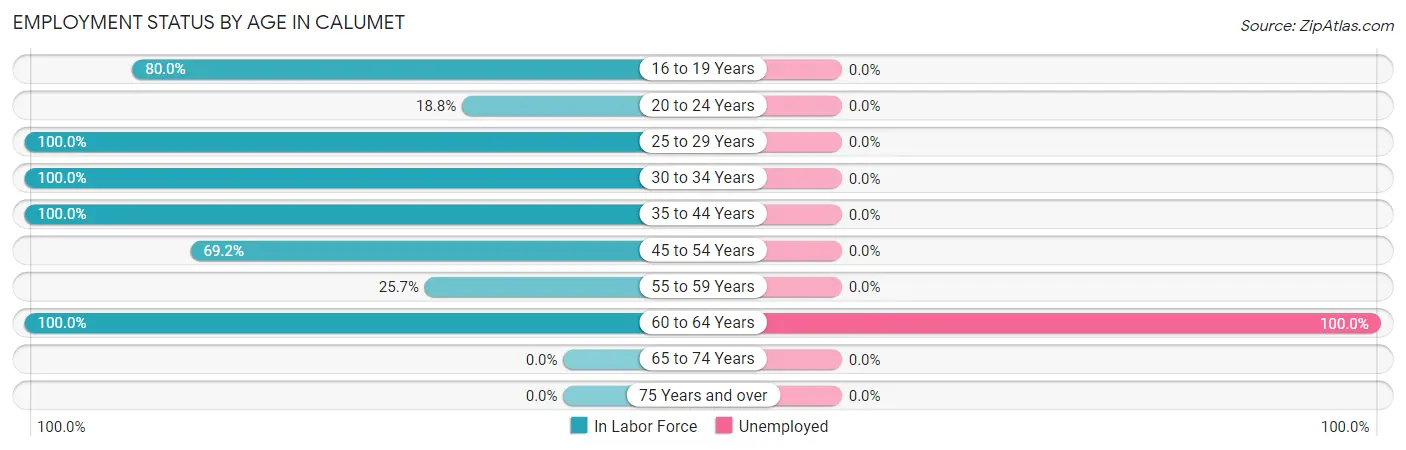
| Age Bracket | In Labor Force | Unemployed |
| 16 to 19 Years | 16 (80.0%) | 0 (0.0%) |
| 20 to 24 Years | 3 (18.8%) | 0 (0.0%) |
| 25 to 29 Years | 24 (100.0%) | 0 (0.0%) |
| 30 to 34 Years | 36 (100.0%) | 0 (0.0%) |
| 35 to 44 Years | 29 (100.0%) | 0 (0.0%) |
| 45 to 54 Years | 18 (69.2%) | 0 (0.0%) |
| 55 to 59 Years | 9 (25.7%) | 0 (0.0%) |
| 60 to 64 Years | 4 (100.0%) | 4 (100.0%) |
| 65 to 74 Years | 0 (0.0%) | 0 (0.0%) |
| 75 Years and over | 0 (0.0%) | 0 (0.0%) |
| Total | 139 (54.5%) | 4 (2.9%) |
Employment Status by Educational Attainment in Calumet
According to labor force statistics for Calumet, 77.9% of individuals (120) out of the total population between 25 and 64 years of age (154) are in the labor force, with 3.3% or 4 of them being unemployed. The group with the highest labor force participation rate are those with the educational attainment of high school diploma, with 98.4% or 62 individuals in the labor force. Within the labor force, individuals with college / associate degree education have the highest percentage of unemployment, with 15.4% or 4 of them being unemployed.
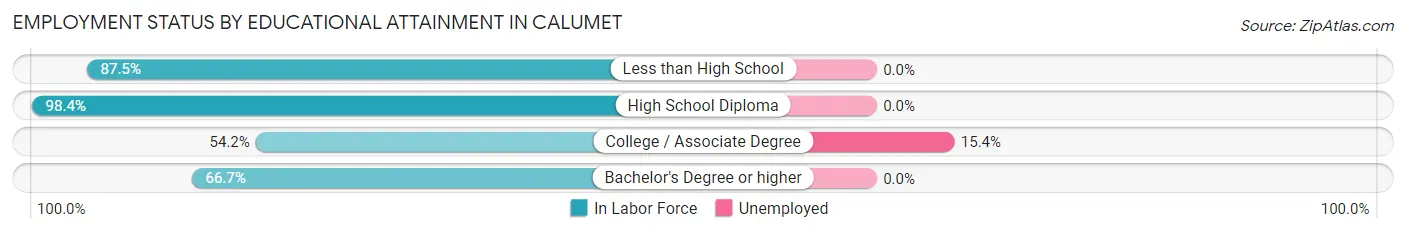
| Educational Attainment | In Labor Force | Unemployed |
| Less than High School | 14 (87.5%) | 0 (0.0%) |
| High School Diploma | 62 (98.4%) | 0 (0.0%) |
| College / Associate Degree | 26 (54.2%) | 7 (15.4%) |
| Bachelor's Degree or higher | 18 (66.7%) | 0 (0.0%) |
| Total | 120 (77.9%) | 5 (3.3%) |
Employment Occupations by Sex in Calumet
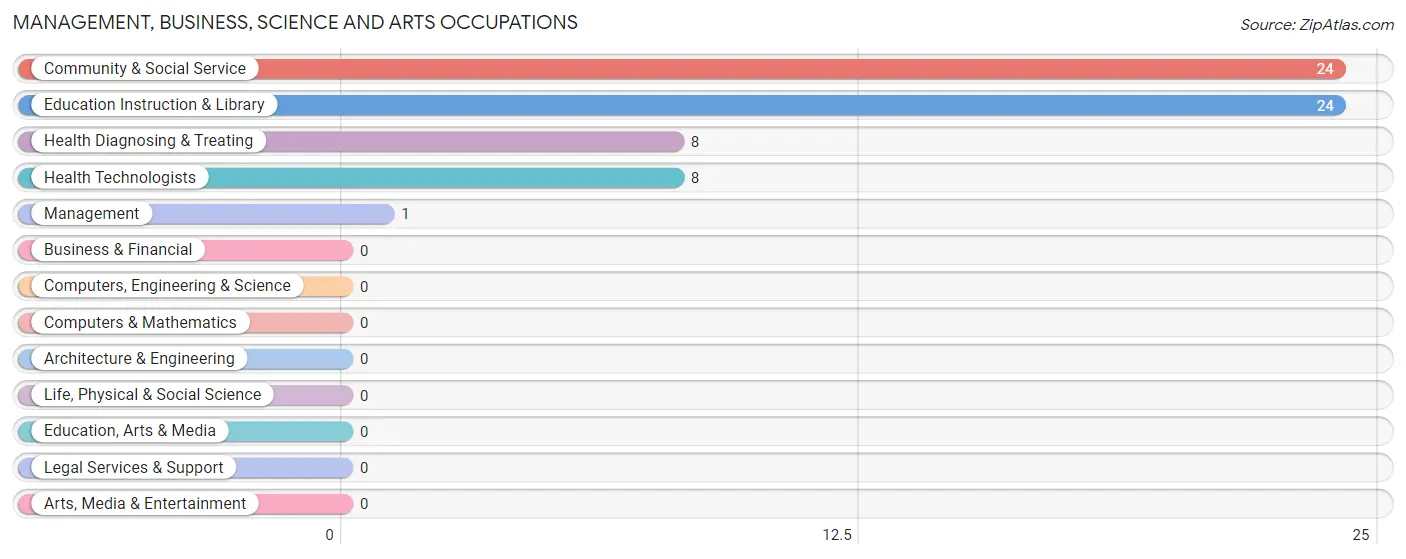
Management, Business, Science and Arts Occupations
The most common Management, Business, Science and Arts occupations in Calumet are Community & Social Service (24 | 17.8%), Education Instruction & Library (24 | 17.8%), Health Diagnosing & Treating (8 | 5.9%), Health Technologists (8 | 5.9%), and Management (1 | 0.7%).
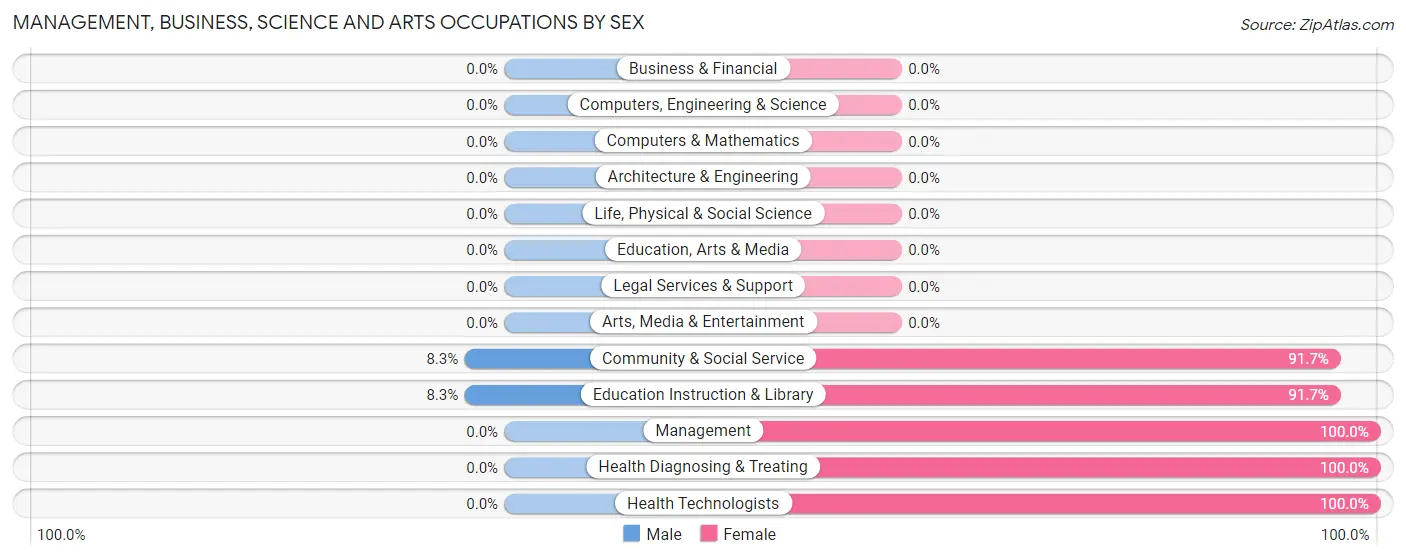
Management, Business, Science and Arts Occupations by Sex
Within the Management, Business, Science and Arts occupations in Calumet, the most male-oriented occupations are Community & Social Service (8.3%), and Education Instruction & Library (8.3%), while the most female-oriented occupations are Management (100.0%), Health Diagnosing & Treating (100.0%), and Health Technologists (100.0%).
| Occupation | Male | Female |
| Management | 0 (0.0%) | 1 (100.0%) |
| Business & Financial | 0 (0.0%) | 0 (0.0%) |
| Computers, Engineering & Science | 0 (0.0%) | 0 (0.0%) |
| Computers & Mathematics | 0 (0.0%) | 0 (0.0%) |
| Architecture & Engineering | 0 (0.0%) | 0 (0.0%) |
| Life, Physical & Social Science | 0 (0.0%) | 0 (0.0%) |
| Community & Social Service | 2 (8.3%) | 22 (91.7%) |
| Education, Arts & Media | 0 (0.0%) | 0 (0.0%) |
| Legal Services & Support | 0 (0.0%) | 0 (0.0%) |
| Education Instruction & Library | 2 (8.3%) | 22 (91.7%) |
| Arts, Media & Entertainment | 0 (0.0%) | 0 (0.0%) |
| Health Diagnosing & Treating | 0 (0.0%) | 8 (100.0%) |
| Health Technologists | 0 (0.0%) | 8 (100.0%) |
| Total (Category) | 2 (6.1%) | 31 (93.9%) |
| Total (Overall) | 75 (55.6%) | 60 (44.4%) |
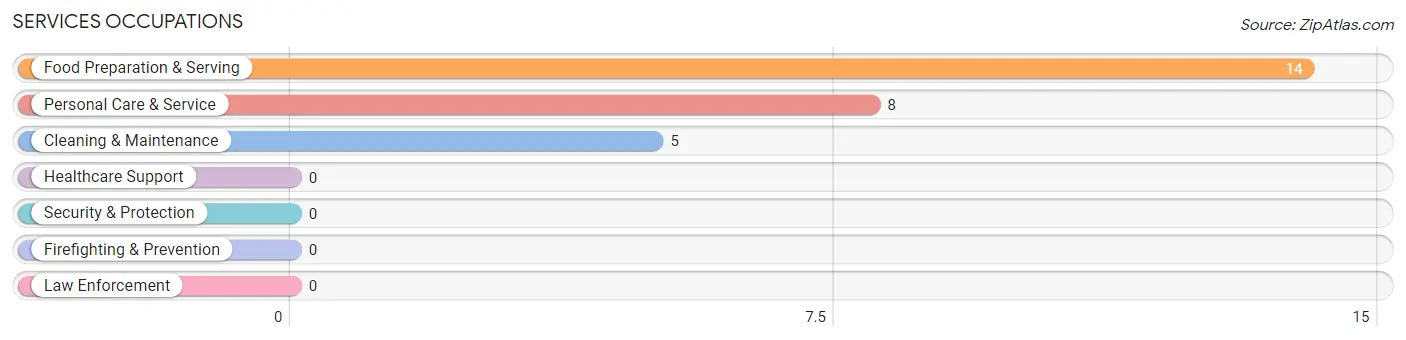
Services Occupations
The most common Services occupations in Calumet are Food Preparation & Serving (14 | 10.4%), Personal Care & Service (8 | 5.9%), and Cleaning & Maintenance (5 | 3.7%).
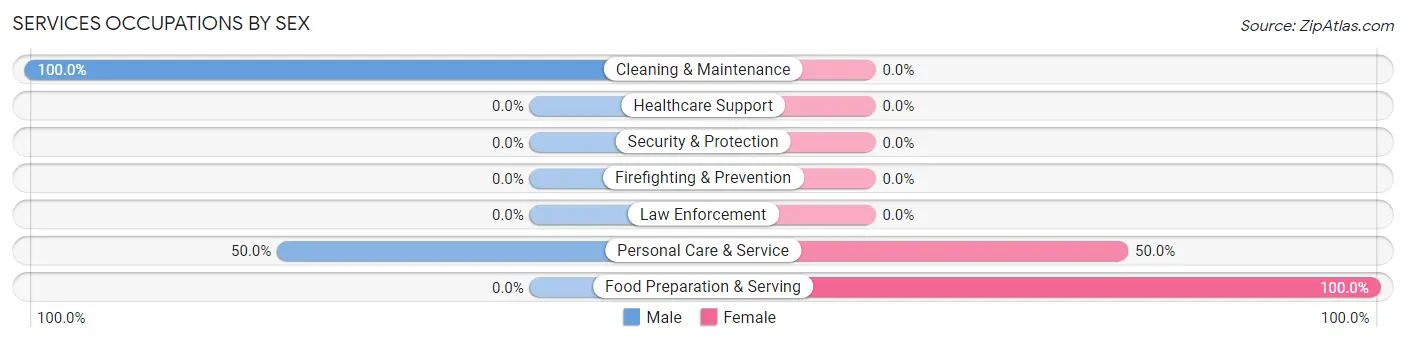
Services Occupations by Sex
Within the Services occupations in Calumet, the most male-oriented occupations are Cleaning & Maintenance (100.0%), and Personal Care & Service (50.0%), while the most female-oriented occupations are Food Preparation & Serving (100.0%), and Personal Care & Service (50.0%).
| Occupation | Male | Female |
| Healthcare Support | 0 (0.0%) | 0 (0.0%) |
| Security & Protection | 0 (0.0%) | 0 (0.0%) |
| Firefighting & Prevention | 0 (0.0%) | 0 (0.0%) |
| Law Enforcement | 0 (0.0%) | 0 (0.0%) |
| Food Preparation & Serving | 0 (0.0%) | 14 (100.0%) |
| Cleaning & Maintenance | 5 (100.0%) | 0 (0.0%) |
| Personal Care & Service | 4 (50.0%) | 4 (50.0%) |
| Total (Category) | 9 (33.3%) | 18 (66.7%) |
| Total (Overall) | 75 (55.6%) | 60 (44.4%) |
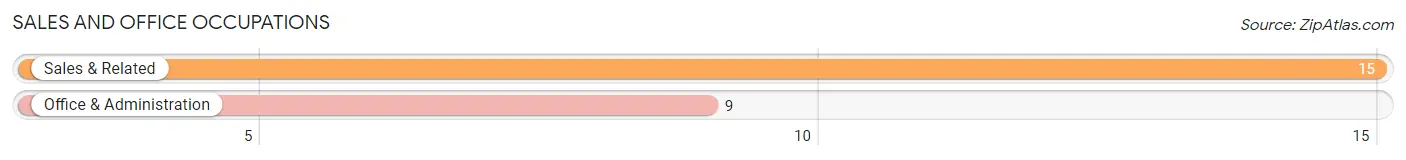
Sales and Office Occupations
The most common Sales and Office occupations in Calumet are Sales & Related (15 | 11.1%), and Office & Administration (9 | 6.7%).
Sales and Office Occupations by Sex
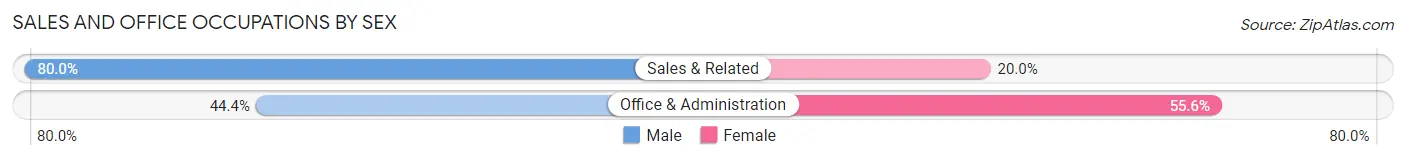
| Occupation | Male | Female |
| Sales & Related | 12 (80.0%) | 3 (20.0%) |
| Office & Administration | 4 (44.4%) | 5 (55.6%) |
| Total (Category) | 16 (66.7%) | 8 (33.3%) |
| Total (Overall) | 75 (55.6%) | 60 (44.4%) |
Natural Resources, Construction and Maintenance Occupations
The most common Natural Resources, Construction and Maintenance occupations in Calumet are Installation, Maintenance & Repair (25 | 18.5%), and Construction & Extraction (9 | 6.7%).
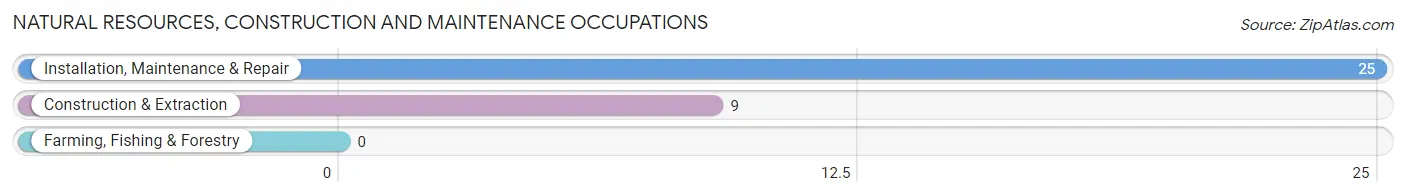
Natural Resources, Construction and Maintenance Occupations by Sex
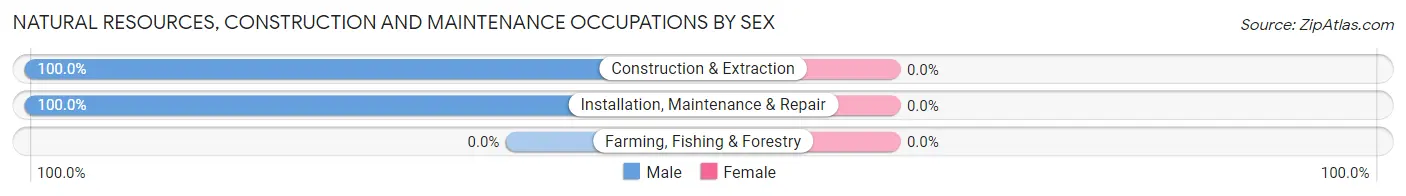
| Occupation | Male | Female |
| Farming, Fishing & Forestry | 0 (0.0%) | 0 (0.0%) |
| Construction & Extraction | 9 (100.0%) | 0 (0.0%) |
| Installation, Maintenance & Repair | 25 (100.0%) | 0 (0.0%) |
| Total (Category) | 34 (100.0%) | 0 (0.0%) |
| Total (Overall) | 75 (55.6%) | 60 (44.4%) |
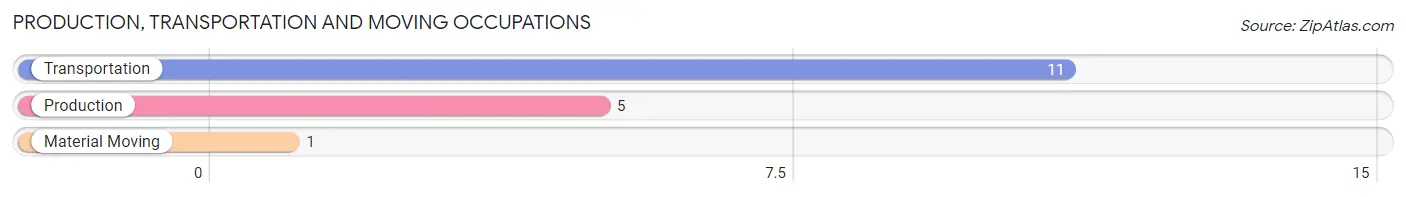
Production, Transportation and Moving Occupations
The most common Production, Transportation and Moving occupations in Calumet are Transportation (11 | 8.2%), Production (5 | 3.7%), and Material Moving (1 | 0.7%).
Production, Transportation and Moving Occupations by Sex
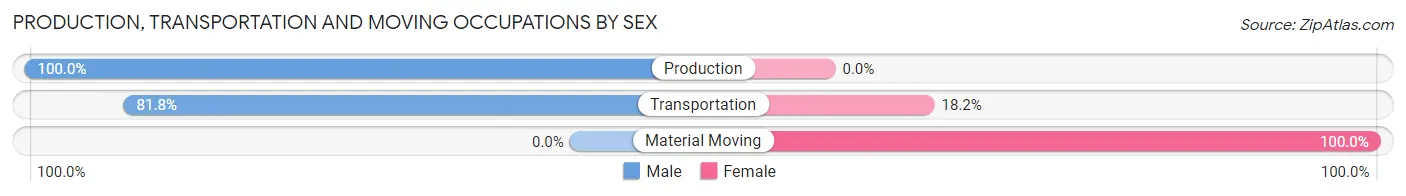
| Occupation | Male | Female |
| Production | 5 (100.0%) | 0 (0.0%) |
| Transportation | 9 (81.8%) | 2 (18.2%) |
| Material Moving | 0 (0.0%) | 1 (100.0%) |
| Total (Category) | 14 (82.4%) | 3 (17.6%) |
| Total (Overall) | 75 (55.6%) | 60 (44.4%) |
Employment Industries by Sex in Calumet
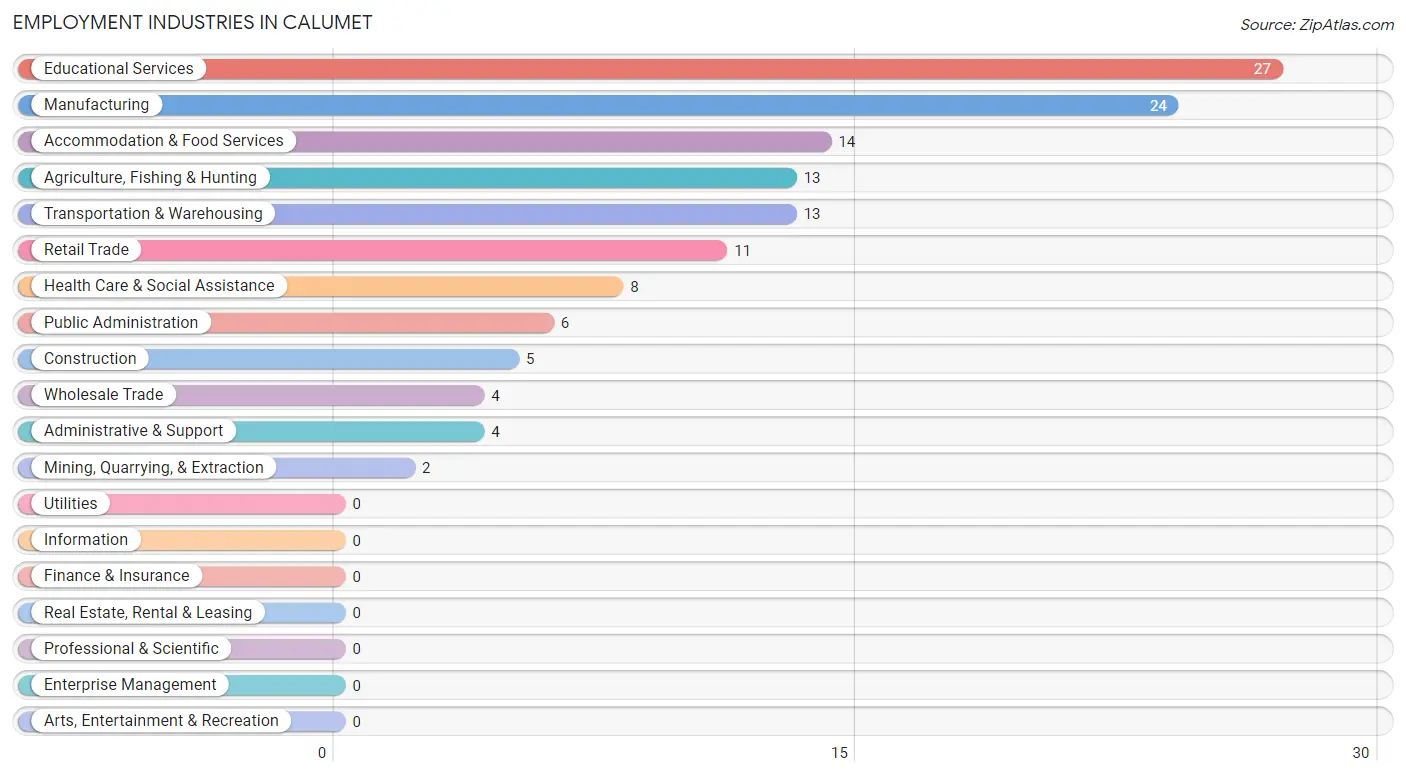
Employment Industries in Calumet
The major employment industries in Calumet include Educational Services (27 | 20.0%), Manufacturing (24 | 17.8%), Accommodation & Food Services (14 | 10.4%), Agriculture, Fishing & Hunting (13 | 9.6%), and Transportation & Warehousing (13 | 9.6%).
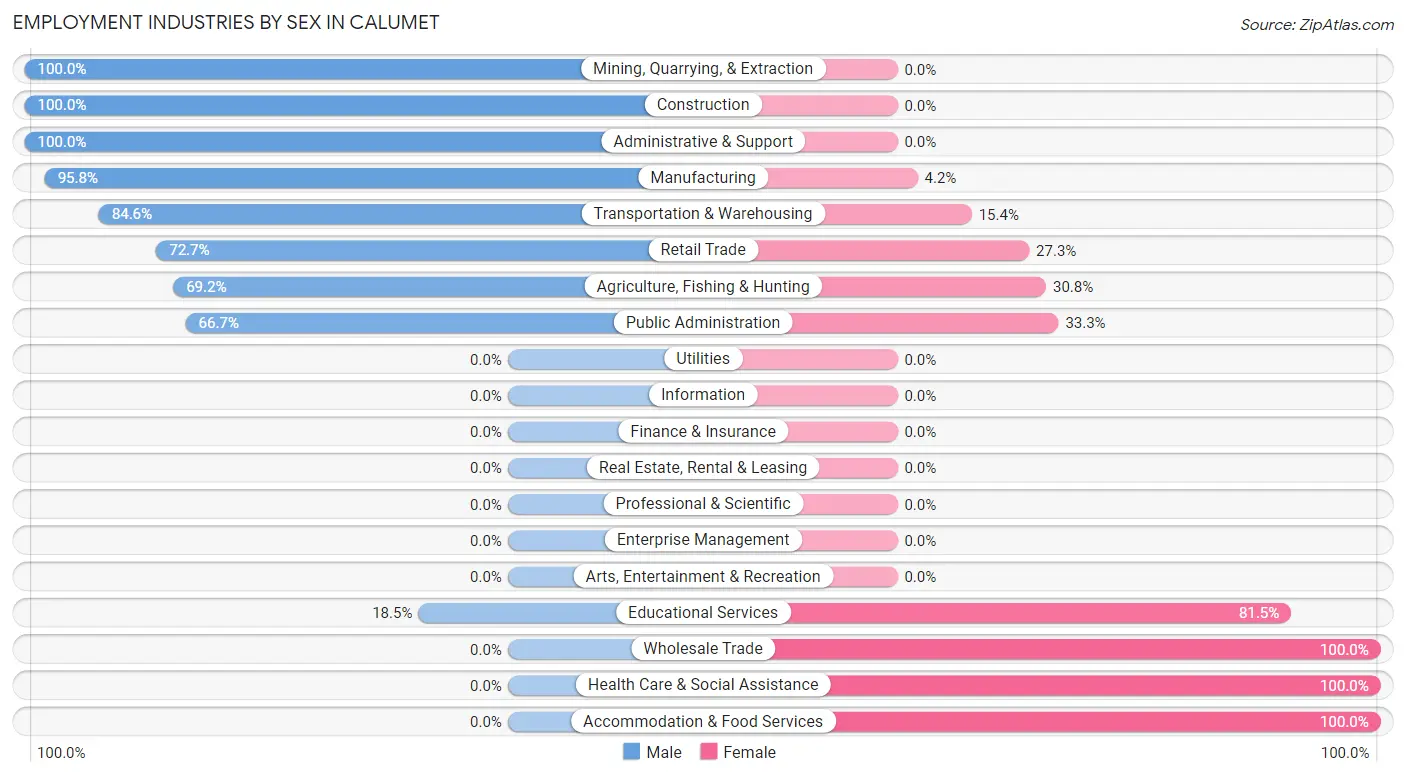
Employment Industries by Sex in Calumet
The Calumet industries that see more men than women are Mining, Quarrying, & Extraction (100.0%), Construction (100.0%), and Administrative & Support (100.0%), whereas the industries that tend to have a higher number of women are Wholesale Trade (100.0%), Health Care & Social Assistance (100.0%), and Accommodation & Food Services (100.0%).
| Industry | Male | Female |
| Agriculture, Fishing & Hunting | 9 (69.2%) | 4 (30.8%) |
| Mining, Quarrying, & Extraction | 2 (100.0%) | 0 (0.0%) |
| Construction | 5 (100.0%) | 0 (0.0%) |
| Manufacturing | 23 (95.8%) | 1 (4.2%) |
| Wholesale Trade | 0 (0.0%) | 4 (100.0%) |
| Retail Trade | 8 (72.7%) | 3 (27.3%) |
| Transportation & Warehousing | 11 (84.6%) | 2 (15.4%) |
| Utilities | 0 (0.0%) | 0 (0.0%) |
| Information | 0 (0.0%) | 0 (0.0%) |
| Finance & Insurance | 0 (0.0%) | 0 (0.0%) |
| Real Estate, Rental & Leasing | 0 (0.0%) | 0 (0.0%) |
| Professional & Scientific | 0 (0.0%) | 0 (0.0%) |
| Enterprise Management | 0 (0.0%) | 0 (0.0%) |
| Administrative & Support | 4 (100.0%) | 0 (0.0%) |
| Educational Services | 5 (18.5%) | 22 (81.5%) |
| Health Care & Social Assistance | 0 (0.0%) | 8 (100.0%) |
| Arts, Entertainment & Recreation | 0 (0.0%) | 0 (0.0%) |
| Accommodation & Food Services | 0 (0.0%) | 14 (100.0%) |
| Public Administration | 4 (66.7%) | 2 (33.3%) |
| Total | 75 (55.6%) | 60 (44.4%) |
Education in Calumet
School Enrollment in Calumet
The most common levels of schooling among the 121 students in Calumet are elementary school (59 | 48.8%), middle school (34 | 28.1%), and college / undergraduate (15 | 12.4%).
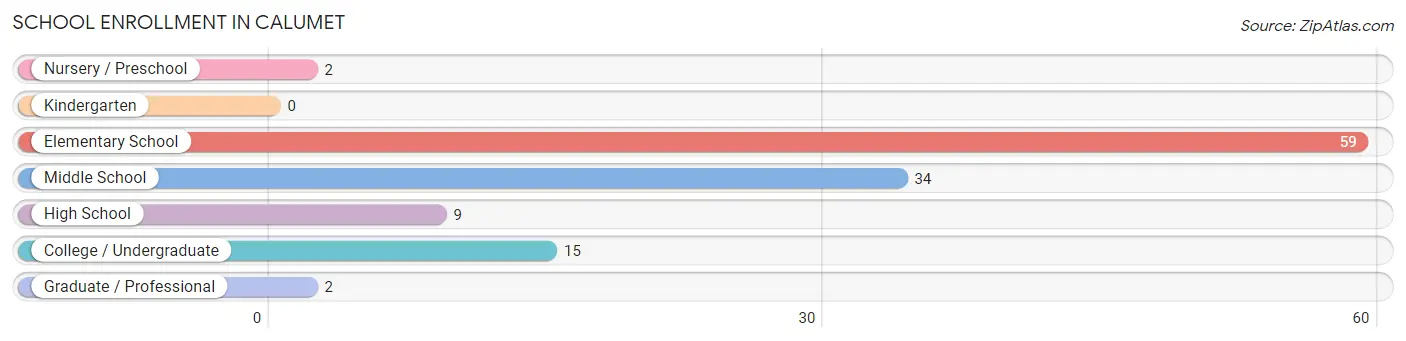
| School Level | # Students | % Students |
| Nursery / Preschool | 2 | 1.7% |
| Kindergarten | 0 | 0.0% |
| Elementary School | 59 | 48.8% |
| Middle School | 34 | 28.1% |
| High School | 9 | 7.4% |
| College / Undergraduate | 15 | 12.4% |
| Graduate / Professional | 2 | 1.7% |
| Total | 121 | 100.0% |
School Enrollment by Age by Funding Source in Calumet
Out of a total of 121 students who are enrolled in schools in Calumet, 6 (5.0%) attend a private institution, while the remaining 115 (95.0%) are enrolled in public schools. The age group of 20 to 24 year olds has the highest likelihood of being enrolled in private schools, with 5 (100.0% in the age bracket) enrolled. Conversely, the age group of 3 to 4 year olds has the lowest likelihood of being enrolled in a private school, with 2 (100.0% in the age bracket) attending a public institution.
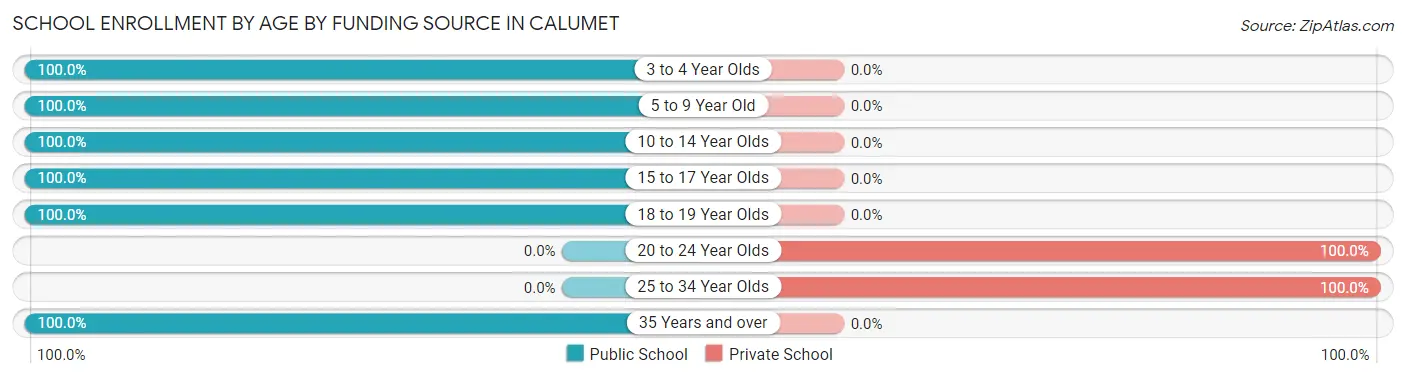
| Age Bracket | Public School | Private School |
| 3 to 4 Year Olds | 2 (100.0%) | 0 (0.0%) |
| 5 to 9 Year Old | 59 (100.0%) | 0 (0.0%) |
| 10 to 14 Year Olds | 34 (100.0%) | 0 (0.0%) |
| 15 to 17 Year Olds | 9 (100.0%) | 0 (0.0%) |
| 18 to 19 Year Olds | 9 (100.0%) | 0 (0.0%) |
| 20 to 24 Year Olds | 0 (0.0%) | 5 (100.0%) |
| 25 to 34 Year Olds | 0 (0.0%) | 1 (100.0%) |
| 35 Years and over | 2 (100.0%) | 0 (0.0%) |
| Total | 115 (95.0%) | 6 (5.0%) |
Educational Attainment by Field of Study in Calumet
Education (15 | 37.5%), science & technology (11 | 27.5%), psychology (5 | 12.5%), business (5 | 12.5%), and bio, nature & agricultural (4 | 10.0%) are the most common fields of study among 40 individuals in Calumet who have obtained a bachelor's degree or higher.
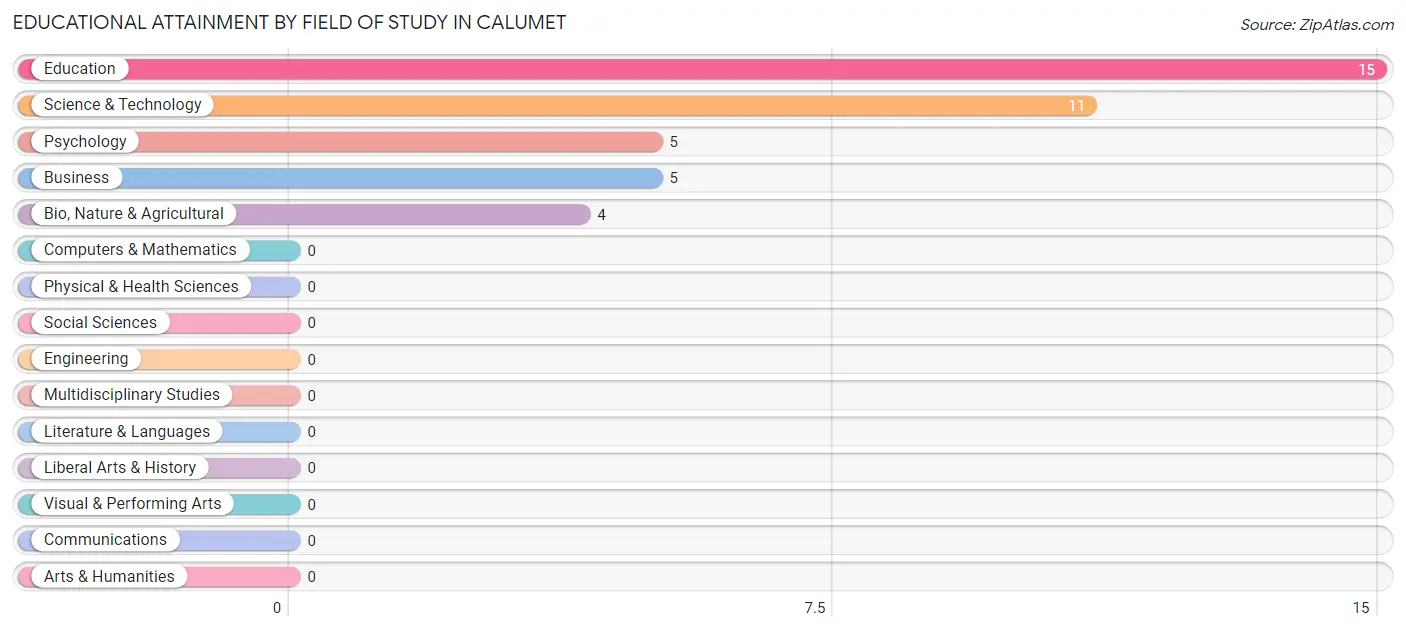
| Field of Study | # Graduates | % Graduates |
| Computers & Mathematics | 0 | 0.0% |
| Bio, Nature & Agricultural | 4 | 10.0% |
| Physical & Health Sciences | 0 | 0.0% |
| Psychology | 5 | 12.5% |
| Social Sciences | 0 | 0.0% |
| Engineering | 0 | 0.0% |
| Multidisciplinary Studies | 0 | 0.0% |
| Science & Technology | 11 | 27.5% |
| Business | 5 | 12.5% |
| Education | 15 | 37.5% |
| Literature & Languages | 0 | 0.0% |
| Liberal Arts & History | 0 | 0.0% |
| Visual & Performing Arts | 0 | 0.0% |
| Communications | 0 | 0.0% |
| Arts & Humanities | 0 | 0.0% |
| Total | 40 | 100.0% |
Transportation & Commute in Calumet
Vehicle Availability by Sex in Calumet
The most prevalent vehicle ownership categories in Calumet are males with 2 vehicles (51, accounting for 68.0%) and females with 2 vehicles (38, making up 87.9%).
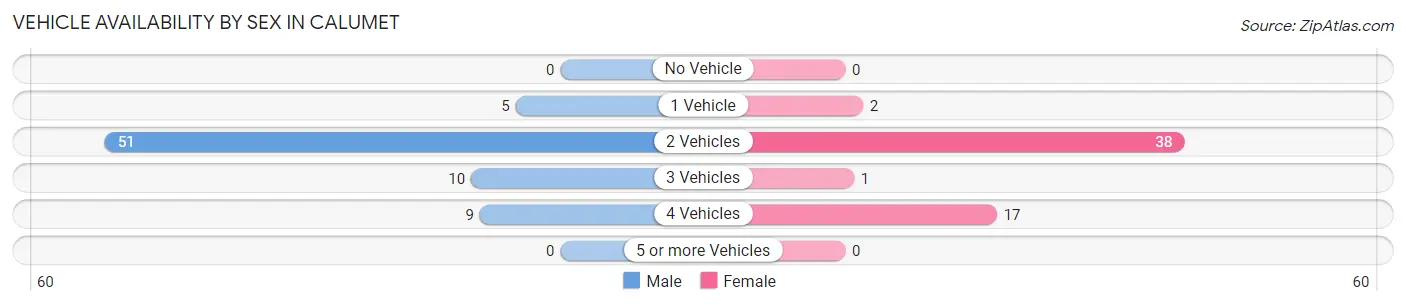
| Vehicles Available | Male | Female |
| No Vehicle | 0 (0.0%) | 0 (0.0%) |
| 1 Vehicle | 5 (6.7%) | 2 (3.5%) |
| 2 Vehicles | 51 (68.0%) | 38 (65.5%) |
| 3 Vehicles | 10 (13.3%) | 1 (1.7%) |
| 4 Vehicles | 9 (12.0%) | 17 (29.3%) |
| 5 or more Vehicles | 0 (0.0%) | 0 (0.0%) |
| Total | 75 (100.0%) | 58 (100.0%) |
Commute Time in Calumet
The most frequently occuring commute durations in Calumet are less than 5 minutes (30 commuters, 24.0%), 30 to 34 minutes (20 commuters, 16.0%), and 45 to 59 minutes (20 commuters, 16.0%).
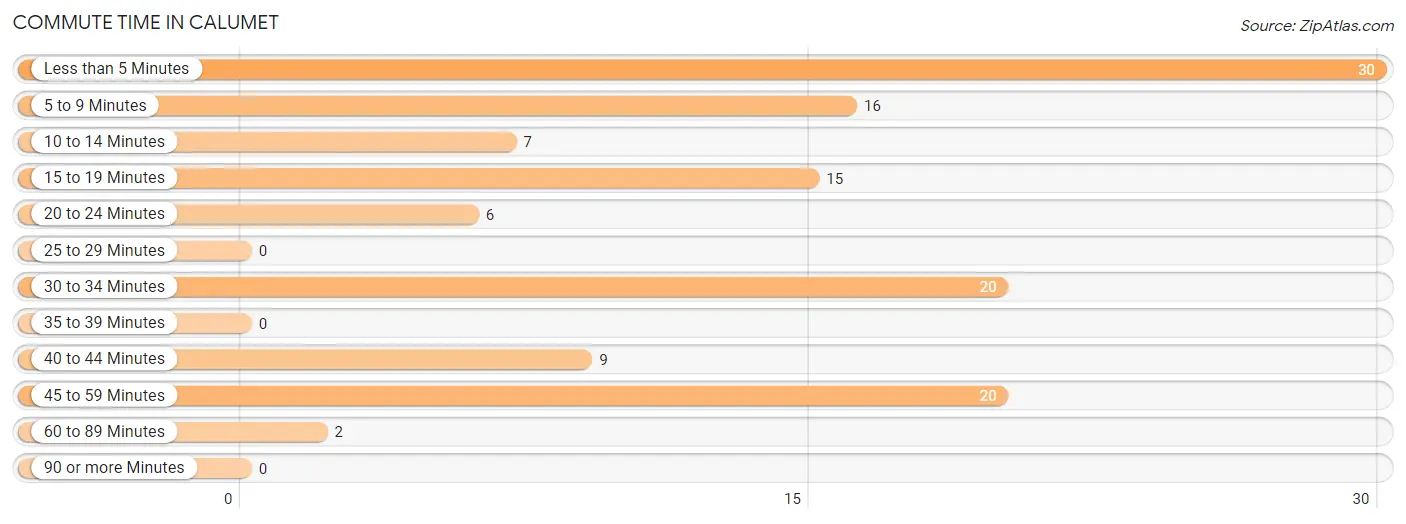
| Commute Time | # Commuters | % Commuters |
| Less than 5 Minutes | 30 | 24.0% |
| 5 to 9 Minutes | 16 | 12.8% |
| 10 to 14 Minutes | 7 | 5.6% |
| 15 to 19 Minutes | 15 | 12.0% |
| 20 to 24 Minutes | 6 | 4.8% |
| 25 to 29 Minutes | 0 | 0.0% |
| 30 to 34 Minutes | 20 | 16.0% |
| 35 to 39 Minutes | 0 | 0.0% |
| 40 to 44 Minutes | 9 | 7.2% |
| 45 to 59 Minutes | 20 | 16.0% |
| 60 to 89 Minutes | 2 | 1.6% |
| 90 or more Minutes | 0 | 0.0% |
Commute Time by Sex in Calumet
The most common commute times in Calumet are 45 to 59 minutes (20 commuters, 28.2%) for males and less than 5 minutes (27 commuters, 50.0%) for females.
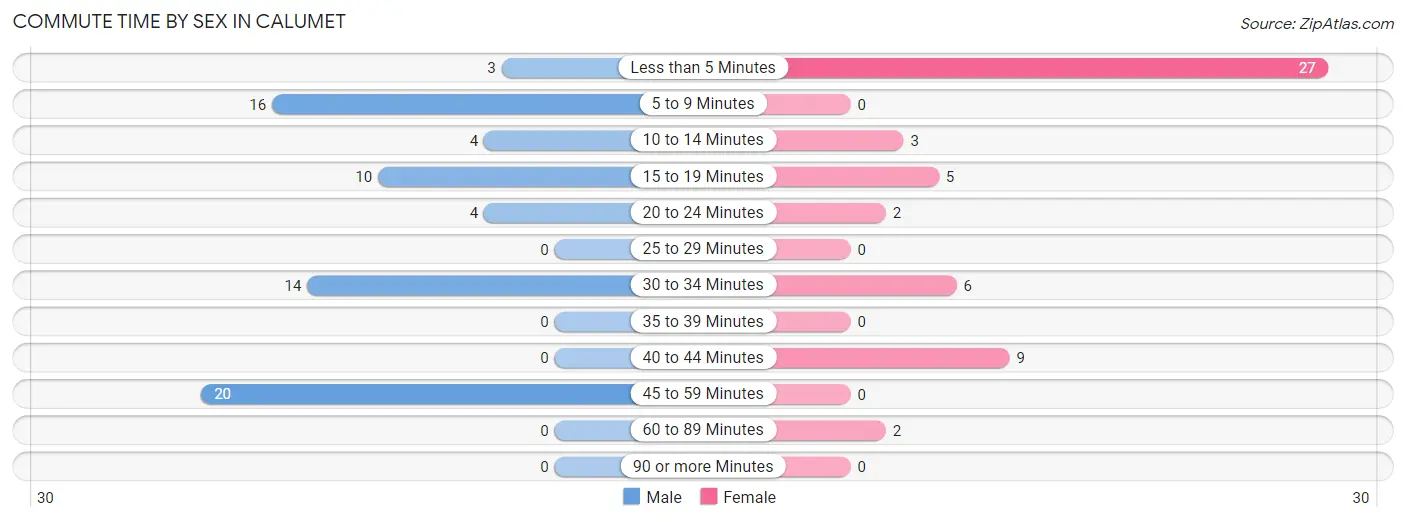
| Commute Time | Male | Female |
| Less than 5 Minutes | 3 (4.2%) | 27 (50.0%) |
| 5 to 9 Minutes | 16 (22.5%) | 0 (0.0%) |
| 10 to 14 Minutes | 4 (5.6%) | 3 (5.6%) |
| 15 to 19 Minutes | 10 (14.1%) | 5 (9.3%) |
| 20 to 24 Minutes | 4 (5.6%) | 2 (3.7%) |
| 25 to 29 Minutes | 0 (0.0%) | 0 (0.0%) |
| 30 to 34 Minutes | 14 (19.7%) | 6 (11.1%) |
| 35 to 39 Minutes | 0 (0.0%) | 0 (0.0%) |
| 40 to 44 Minutes | 0 (0.0%) | 9 (16.7%) |
| 45 to 59 Minutes | 20 (28.2%) | 0 (0.0%) |
| 60 to 89 Minutes | 0 (0.0%) | 2 (3.7%) |
| 90 or more Minutes | 0 (0.0%) | 0 (0.0%) |
Time of Departure to Work by Sex in Calumet
The most frequent times of departure to work in Calumet are 12:00 AM to 4:59 AM (20, 28.2%) for males and 8:00 AM to 8:29 AM (22, 40.7%) for females.
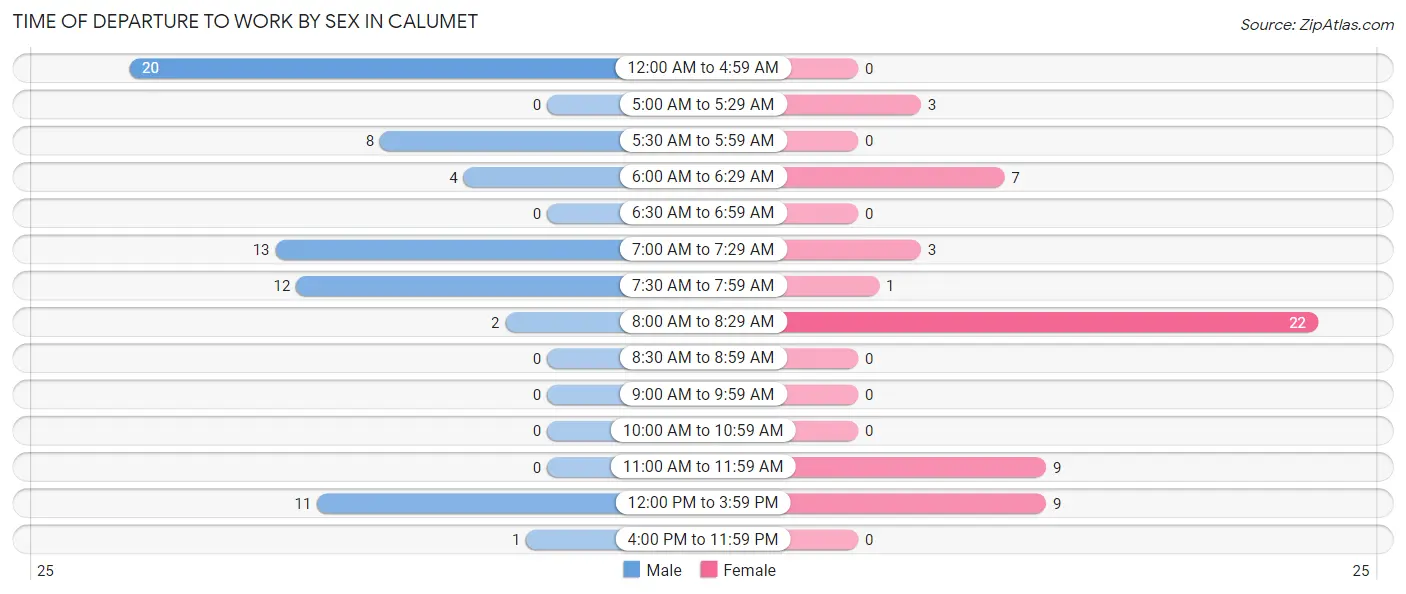
| Time of Departure | Male | Female |
| 12:00 AM to 4:59 AM | 20 (28.2%) | 0 (0.0%) |
| 5:00 AM to 5:29 AM | 0 (0.0%) | 3 (5.6%) |
| 5:30 AM to 5:59 AM | 8 (11.3%) | 0 (0.0%) |
| 6:00 AM to 6:29 AM | 4 (5.6%) | 7 (13.0%) |
| 6:30 AM to 6:59 AM | 0 (0.0%) | 0 (0.0%) |
| 7:00 AM to 7:29 AM | 13 (18.3%) | 3 (5.6%) |
| 7:30 AM to 7:59 AM | 12 (16.9%) | 1 (1.8%) |
| 8:00 AM to 8:29 AM | 2 (2.8%) | 22 (40.7%) |
| 8:30 AM to 8:59 AM | 0 (0.0%) | 0 (0.0%) |
| 9:00 AM to 9:59 AM | 0 (0.0%) | 0 (0.0%) |
| 10:00 AM to 10:59 AM | 0 (0.0%) | 0 (0.0%) |
| 11:00 AM to 11:59 AM | 0 (0.0%) | 9 (16.7%) |
| 12:00 PM to 3:59 PM | 11 (15.5%) | 9 (16.7%) |
| 4:00 PM to 11:59 PM | 1 (1.4%) | 0 (0.0%) |
| Total | 71 (100.0%) | 54 (100.0%) |
Housing Occupancy in Calumet
Occupancy by Ownership in Calumet
Of the total 127 dwellings in Calumet, owner-occupied units account for 85 (66.9%), while renter-occupied units make up 42 (33.1%).
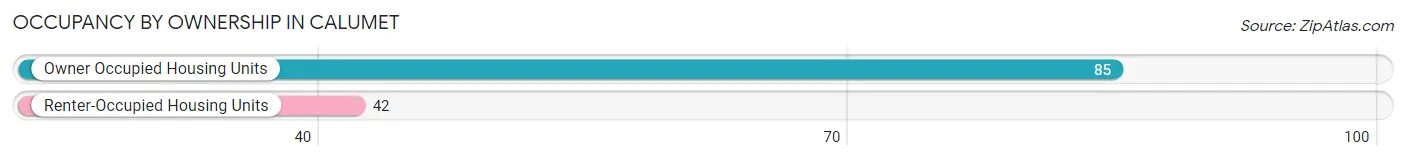
| Occupancy | # Housing Units | % Housing Units |
| Owner Occupied Housing Units | 85 | 66.9% |
| Renter-Occupied Housing Units | 42 | 33.1% |
| Total Occupied Housing Units | 127 | 100.0% |
Occupancy by Household Size in Calumet
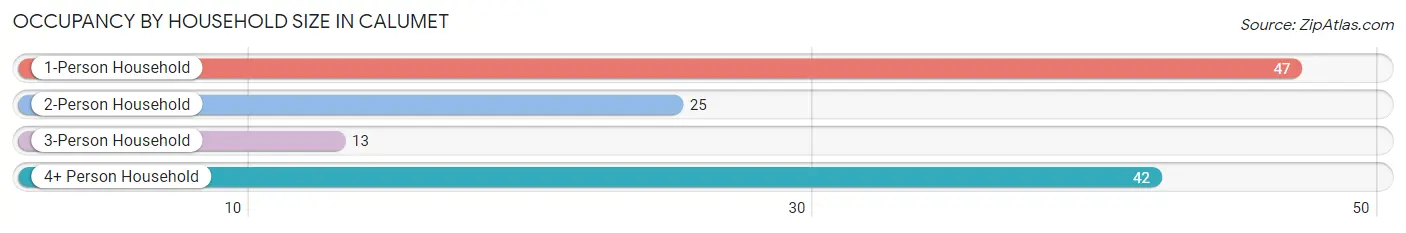
| Household Size | # Housing Units | % Housing Units |
| 1-Person Household | 47 | 37.0% |
| 2-Person Household | 25 | 19.7% |
| 3-Person Household | 13 | 10.2% |
| 4+ Person Household | 42 | 33.1% |
| Total Housing Units | 127 | 100.0% |
Occupancy by Ownership by Household Size in Calumet
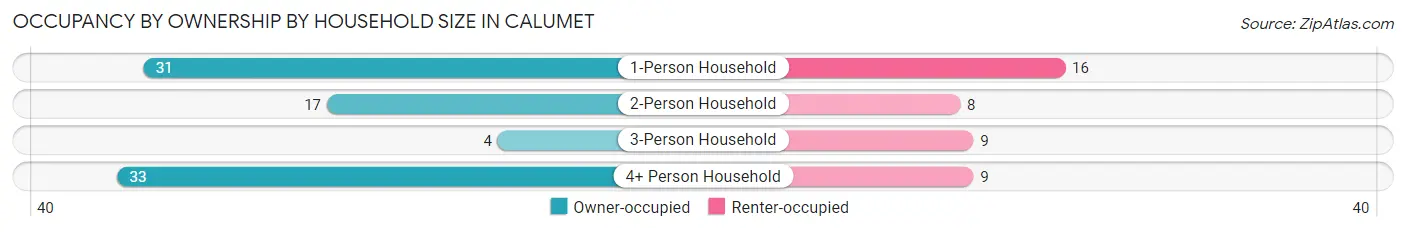
| Household Size | Owner-occupied | Renter-occupied |
| 1-Person Household | 31 (66.0%) | 16 (34.0%) |
| 2-Person Household | 17 (68.0%) | 8 (32.0%) |
| 3-Person Household | 4 (30.8%) | 9 (69.2%) |
| 4+ Person Household | 33 (78.6%) | 9 (21.4%) |
| Total Housing Units | 85 (66.9%) | 42 (33.1%) |
Occupancy by Educational Attainment in Calumet
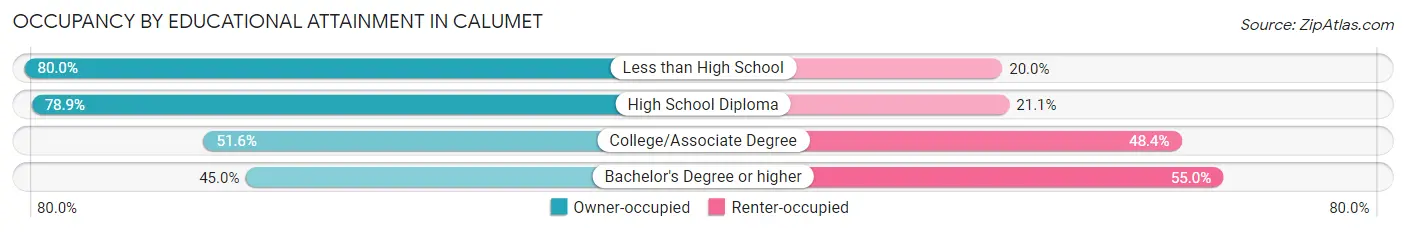
| Household Size | Owner-occupied | Renter-occupied |
| Less than High School | 4 (80.0%) | 1 (20.0%) |
| High School Diploma | 56 (78.9%) | 15 (21.1%) |
| College/Associate Degree | 16 (51.6%) | 15 (48.4%) |
| Bachelor's Degree or higher | 9 (45.0%) | 11 (55.0%) |
Occupancy by Age of Householder in Calumet
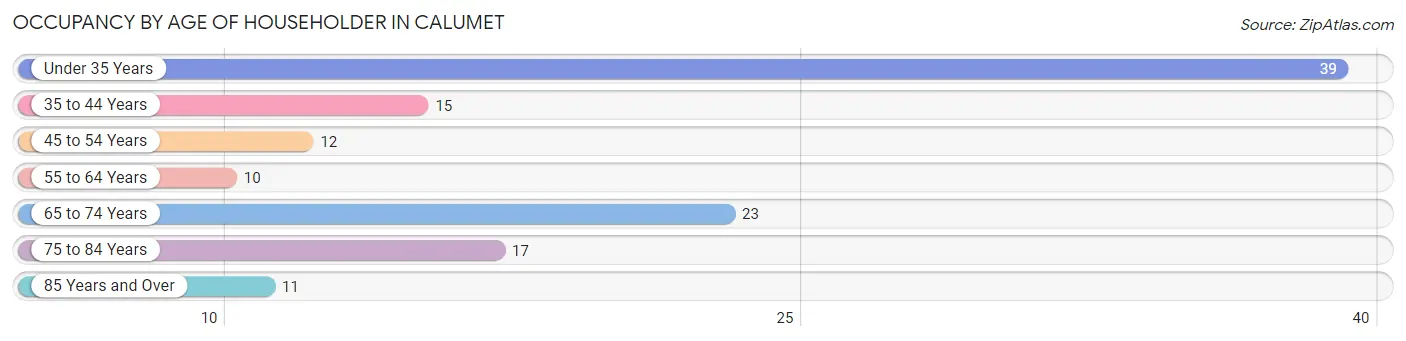
| Age Bracket | # Households | % Households |
| Under 35 Years | 39 | 30.7% |
| 35 to 44 Years | 15 | 11.8% |
| 45 to 54 Years | 12 | 9.5% |
| 55 to 64 Years | 10 | 7.9% |
| 65 to 74 Years | 23 | 18.1% |
| 75 to 84 Years | 17 | 13.4% |
| 85 Years and Over | 11 | 8.7% |
| Total | 127 | 100.0% |
Housing Finances in Calumet
Median Income by Occupancy in Calumet
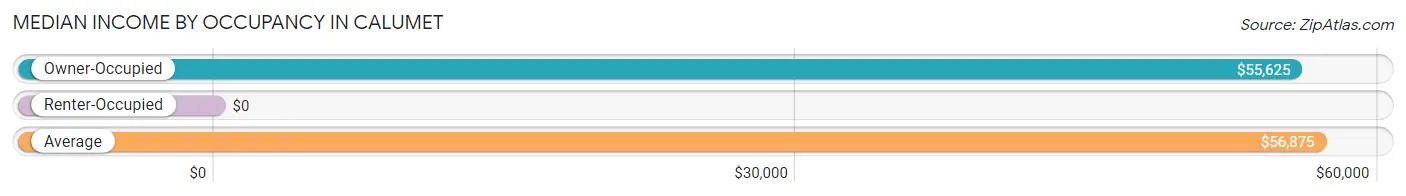
| Occupancy Type | # Households | Median Income |
| Owner-Occupied | 85 (66.9%) | $55,625 |
| Renter-Occupied | 42 (33.1%) | $0 |
| Average | 127 (100.0%) | $56,875 |
Occupancy by Householder Income Bracket in Calumet
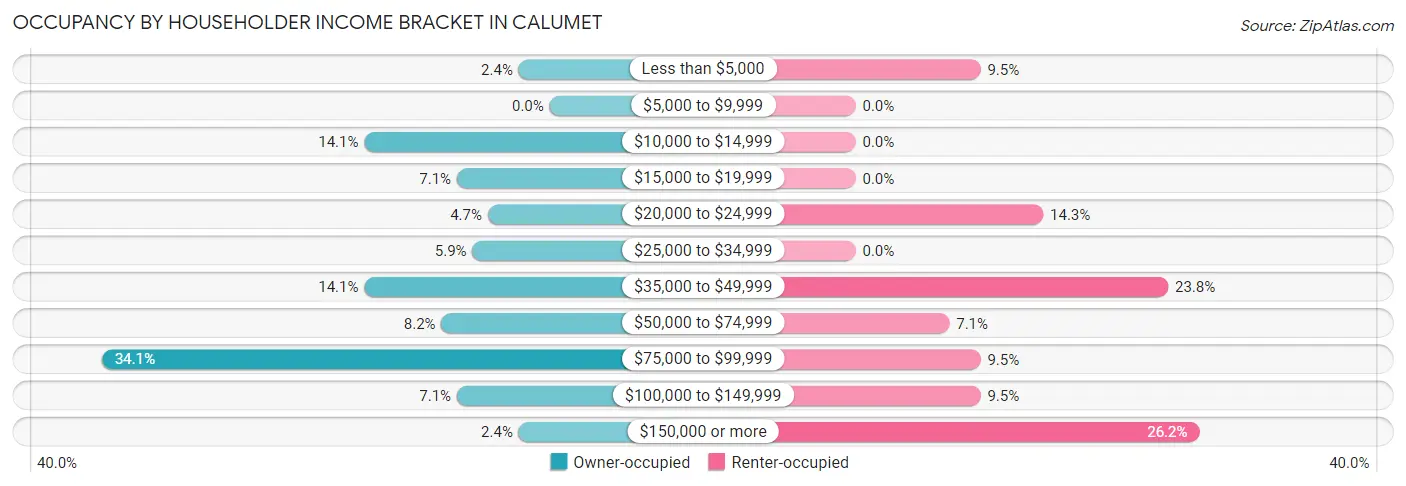
| Income Bracket | Owner-occupied | Renter-occupied |
| Less than $5,000 | 2 (2.4%) | 4 (9.5%) |
| $5,000 to $9,999 | 0 (0.0%) | 0 (0.0%) |
| $10,000 to $14,999 | 12 (14.1%) | 0 (0.0%) |
| $15,000 to $19,999 | 6 (7.1%) | 0 (0.0%) |
| $20,000 to $24,999 | 4 (4.7%) | 6 (14.3%) |
| $25,000 to $34,999 | 5 (5.9%) | 0 (0.0%) |
| $35,000 to $49,999 | 12 (14.1%) | 10 (23.8%) |
| $50,000 to $74,999 | 7 (8.2%) | 3 (7.1%) |
| $75,000 to $99,999 | 29 (34.1%) | 4 (9.5%) |
| $100,000 to $149,999 | 6 (7.1%) | 4 (9.5%) |
| $150,000 or more | 2 (2.4%) | 11 (26.2%) |
| Total | 85 (100.0%) | 42 (100.0%) |
Monthly Housing Cost Tiers in Calumet
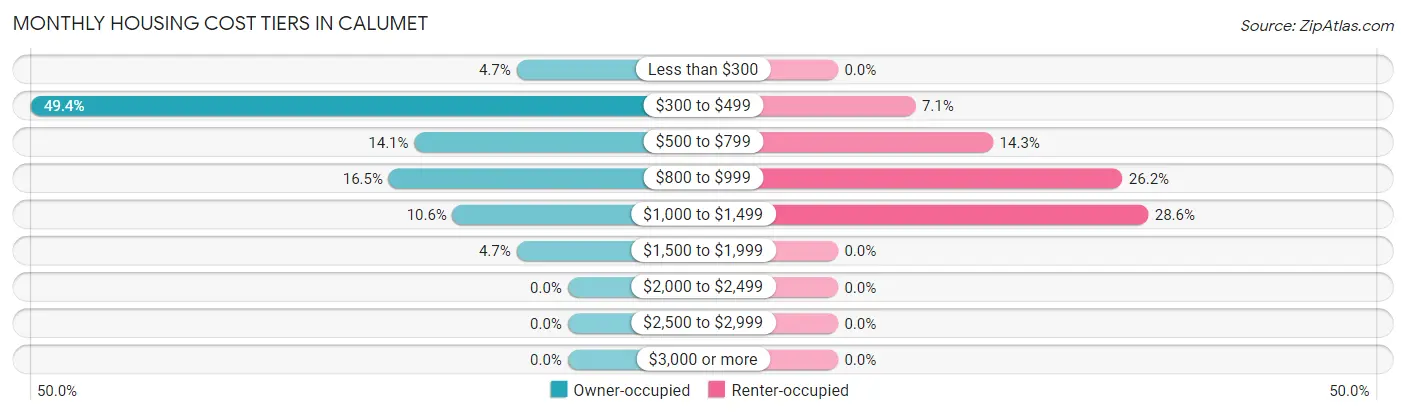
| Monthly Cost | Owner-occupied | Renter-occupied |
| Less than $300 | 4 (4.7%) | 0 (0.0%) |
| $300 to $499 | 42 (49.4%) | 3 (7.1%) |
| $500 to $799 | 12 (14.1%) | 6 (14.3%) |
| $800 to $999 | 14 (16.5%) | 11 (26.2%) |
| $1,000 to $1,499 | 9 (10.6%) | 12 (28.6%) |
| $1,500 to $1,999 | 4 (4.7%) | 0 (0.0%) |
| $2,000 to $2,499 | 0 (0.0%) | 0 (0.0%) |
| $2,500 to $2,999 | 0 (0.0%) | 0 (0.0%) |
| $3,000 or more | 0 (0.0%) | 0 (0.0%) |
| Total | 85 (100.0%) | 42 (100.0%) |
Physical Housing Characteristics in Calumet
Housing Structures in Calumet
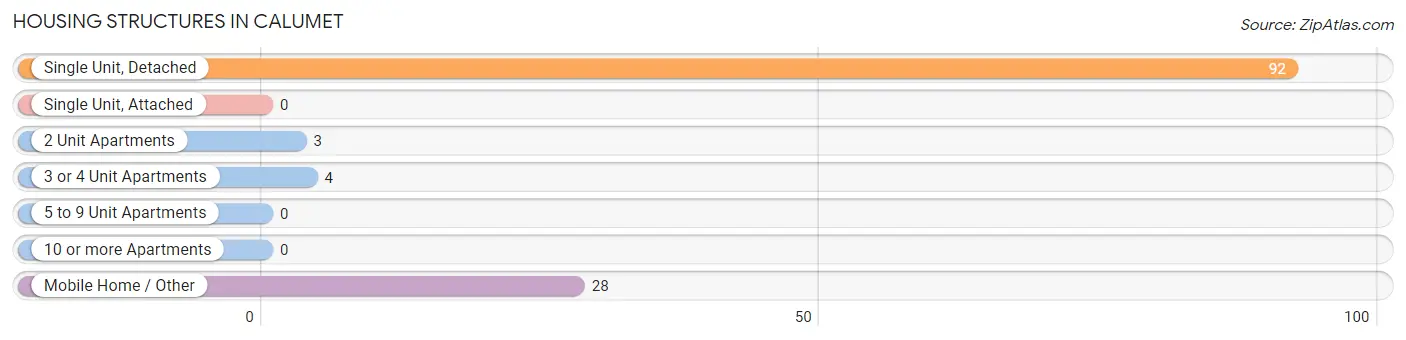
| Structure Type | # Housing Units | % Housing Units |
| Single Unit, Detached | 92 | 72.4% |
| Single Unit, Attached | 0 | 0.0% |
| 2 Unit Apartments | 3 | 2.4% |
| 3 or 4 Unit Apartments | 4 | 3.2% |
| 5 to 9 Unit Apartments | 0 | 0.0% |
| 10 or more Apartments | 0 | 0.0% |
| Mobile Home / Other | 28 | 22.1% |
| Total | 127 | 100.0% |
Housing Structures by Occupancy in Calumet
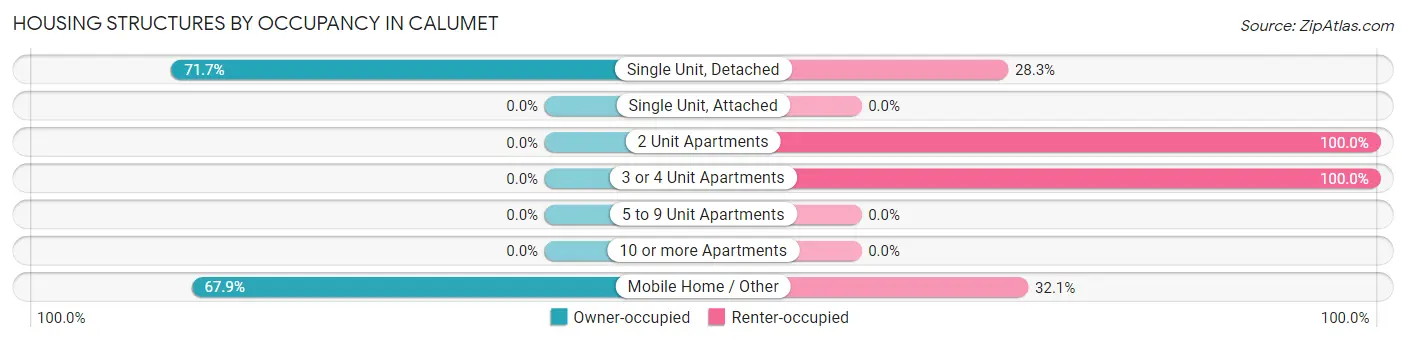
| Structure Type | Owner-occupied | Renter-occupied |
| Single Unit, Detached | 66 (71.7%) | 26 (28.3%) |
| Single Unit, Attached | 0 (0.0%) | 0 (0.0%) |
| 2 Unit Apartments | 0 (0.0%) | 3 (100.0%) |
| 3 or 4 Unit Apartments | 0 (0.0%) | 4 (100.0%) |
| 5 to 9 Unit Apartments | 0 (0.0%) | 0 (0.0%) |
| 10 or more Apartments | 0 (0.0%) | 0 (0.0%) |
| Mobile Home / Other | 19 (67.9%) | 9 (32.1%) |
| Total | 85 (66.9%) | 42 (33.1%) |
Housing Structures by Number of Rooms in Calumet
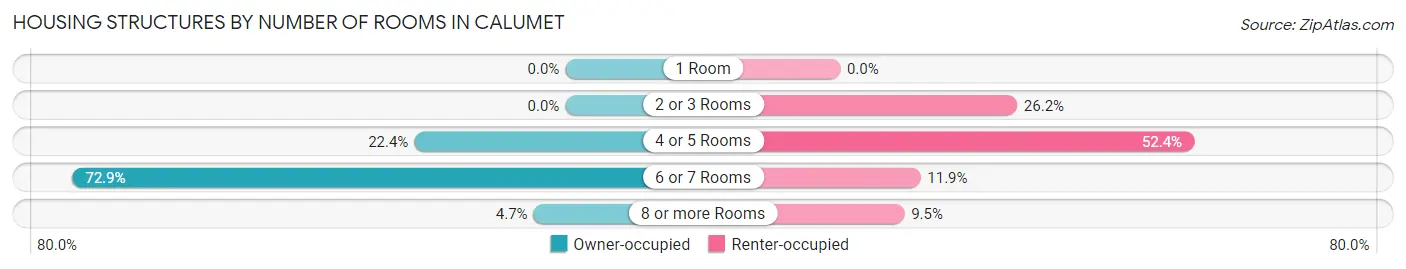
| Number of Rooms | Owner-occupied | Renter-occupied |
| 1 Room | 0 (0.0%) | 0 (0.0%) |
| 2 or 3 Rooms | 0 (0.0%) | 11 (26.2%) |
| 4 or 5 Rooms | 19 (22.4%) | 22 (52.4%) |
| 6 or 7 Rooms | 62 (72.9%) | 5 (11.9%) |
| 8 or more Rooms | 4 (4.7%) | 4 (9.5%) |
| Total | 85 (100.0%) | 42 (100.0%) |
Housing Structure by Heating Type in Calumet
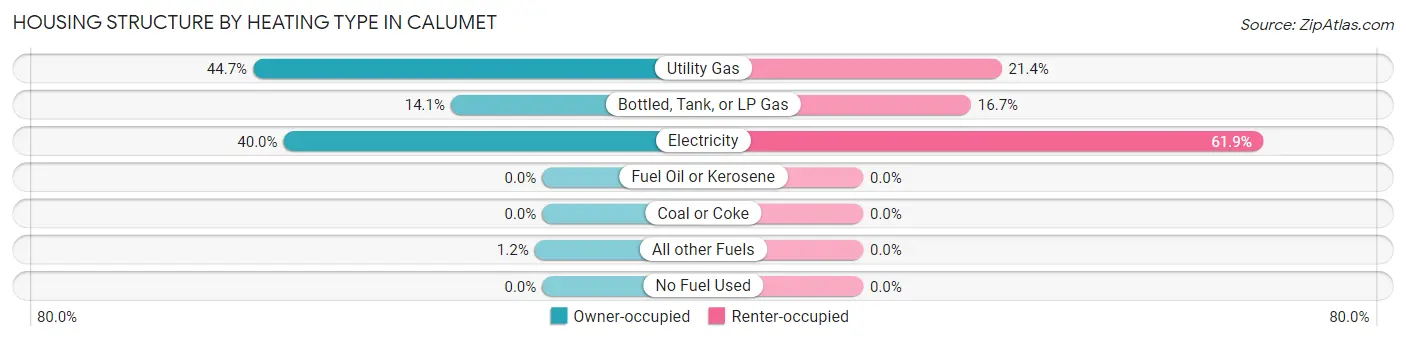
| Heating Type | Owner-occupied | Renter-occupied |
| Utility Gas | 38 (44.7%) | 9 (21.4%) |
| Bottled, Tank, or LP Gas | 12 (14.1%) | 7 (16.7%) |
| Electricity | 34 (40.0%) | 26 (61.9%) |
| Fuel Oil or Kerosene | 0 (0.0%) | 0 (0.0%) |
| Coal or Coke | 0 (0.0%) | 0 (0.0%) |
| All other Fuels | 1 (1.2%) | 0 (0.0%) |
| No Fuel Used | 0 (0.0%) | 0 (0.0%) |
| Total | 85 (100.0%) | 42 (100.0%) |
Household Vehicle Usage in Calumet
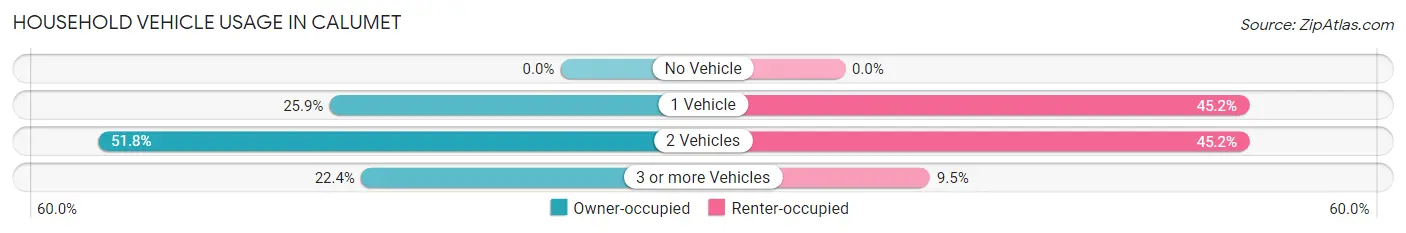
| Vehicles per Household | Owner-occupied | Renter-occupied |
| No Vehicle | 0 (0.0%) | 0 (0.0%) |
| 1 Vehicle | 22 (25.9%) | 19 (45.2%) |
| 2 Vehicles | 44 (51.8%) | 19 (45.2%) |
| 3 or more Vehicles | 19 (22.4%) | 4 (9.5%) |
| Total | 85 (100.0%) | 42 (100.0%) |
Real Estate & Mortgages in Calumet
Real Estate and Mortgage Overview in Calumet
| Characteristic | Without Mortgage | With Mortgage |
| Housing Units | 59 | 26 |
| Median Property Value | $70,500 | $154,500 |
| Median Household Income | - | - |
| Monthly Housing Costs | $347 | $0 |
| Real Estate Taxes | $520 | $0 |
Property Value by Mortgage Status in Calumet
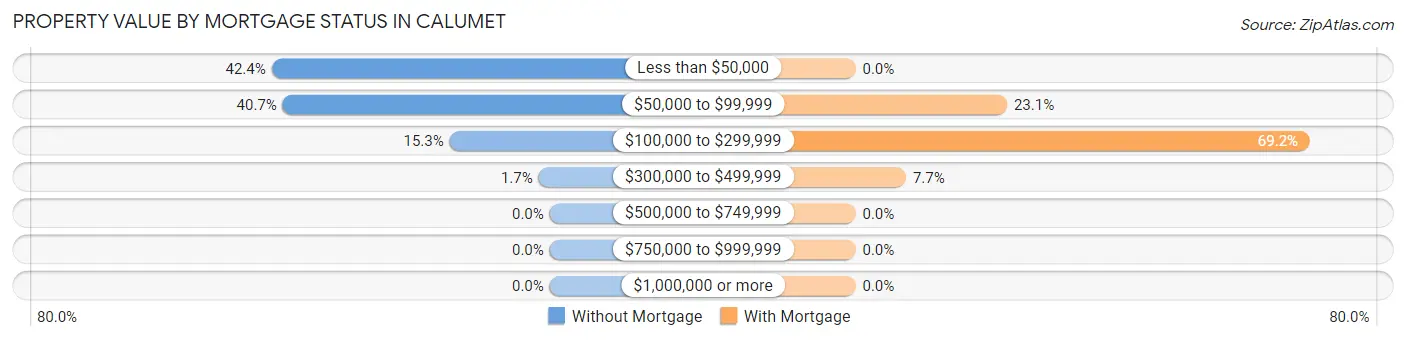
| Property Value | Without Mortgage | With Mortgage |
| Less than $50,000 | 25 (42.4%) | 0 (0.0%) |
| $50,000 to $99,999 | 24 (40.7%) | 6 (23.1%) |
| $100,000 to $299,999 | 9 (15.2%) | 18 (69.2%) |
| $300,000 to $499,999 | 1 (1.7%) | 2 (7.7%) |
| $500,000 to $749,999 | 0 (0.0%) | 0 (0.0%) |
| $750,000 to $999,999 | 0 (0.0%) | 0 (0.0%) |
| $1,000,000 or more | 0 (0.0%) | 0 (0.0%) |
| Total | 59 (100.0%) | 26 (100.0%) |
Household Income by Mortgage Status in Calumet
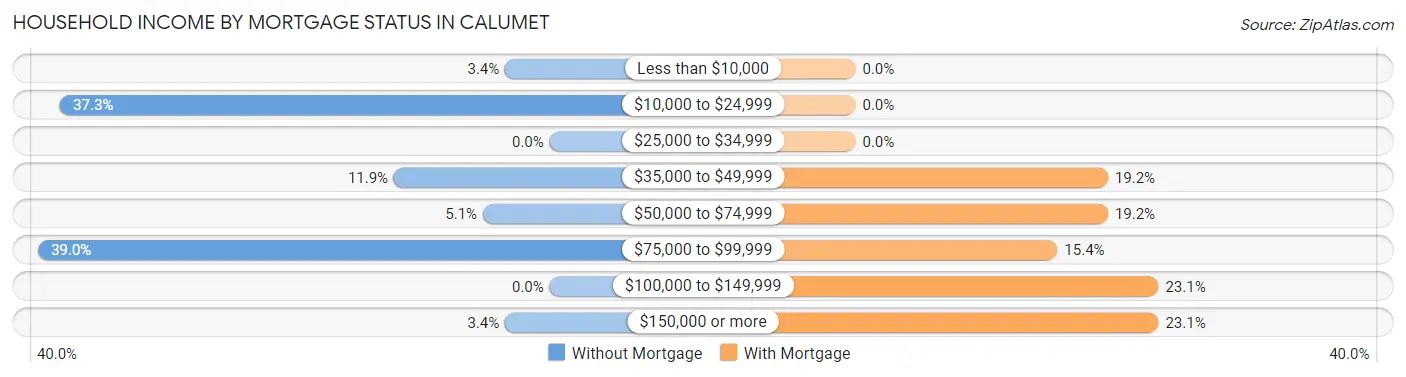
| Household Income | Without Mortgage | With Mortgage |
| Less than $10,000 | 2 (3.4%) | 0 (0.0%) |
| $10,000 to $24,999 | 22 (37.3%) | 0 (0.0%) |
| $25,000 to $34,999 | 0 (0.0%) | 0 (0.0%) |
| $35,000 to $49,999 | 7 (11.9%) | 5 (19.2%) |
| $50,000 to $74,999 | 3 (5.1%) | 5 (19.2%) |
| $75,000 to $99,999 | 23 (39.0%) | 4 (15.4%) |
| $100,000 to $149,999 | 0 (0.0%) | 6 (23.1%) |
| $150,000 or more | 2 (3.4%) | 6 (23.1%) |
| Total | 59 (100.0%) | 26 (100.0%) |
Property Value to Household Income Ratio in Calumet
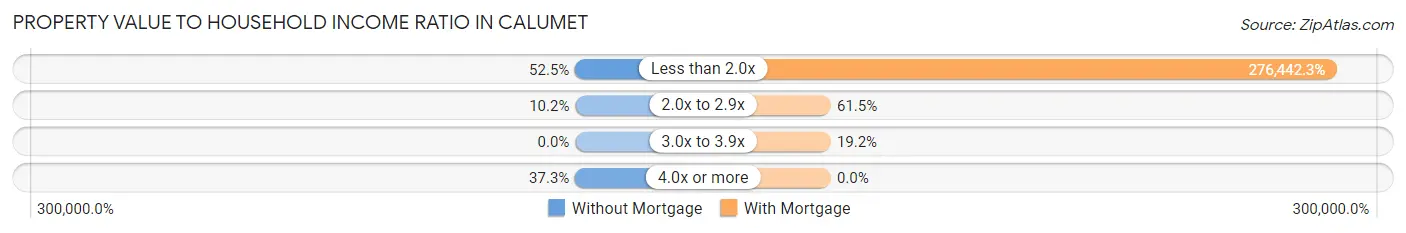
| Value-to-Income Ratio | Without Mortgage | With Mortgage |
| Less than 2.0x | 31 (52.5%) | 71,875 (276,442.3%) |
| 2.0x to 2.9x | 6 (10.2%) | 16 (61.5%) |
| 3.0x to 3.9x | 0 (0.0%) | 5 (19.2%) |
| 4.0x or more | 22 (37.3%) | 0 (0.0%) |
| Total | 59 (100.0%) | 26 (100.0%) |
Real Estate Taxes by Mortgage Status in Calumet
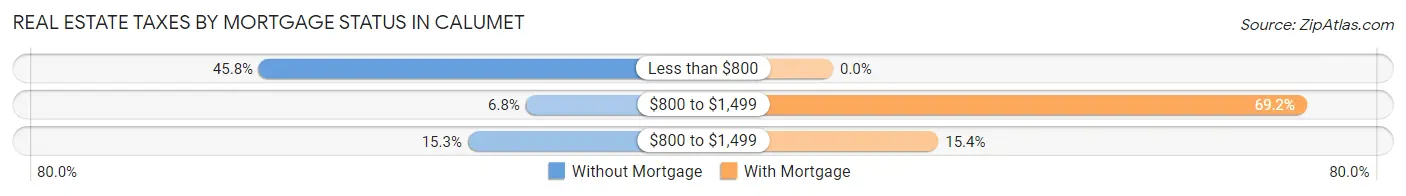
| Property Taxes | Without Mortgage | With Mortgage |
| Less than $800 | 27 (45.8%) | 0 (0.0%) |
| $800 to $1,499 | 4 (6.8%) | 18 (69.2%) |
| $800 to $1,499 | 9 (15.2%) | 4 (15.4%) |
| Total | 59 (100.0%) | 26 (100.0%) |
Health & Disability in Calumet
Health Insurance Coverage by Age in Calumet
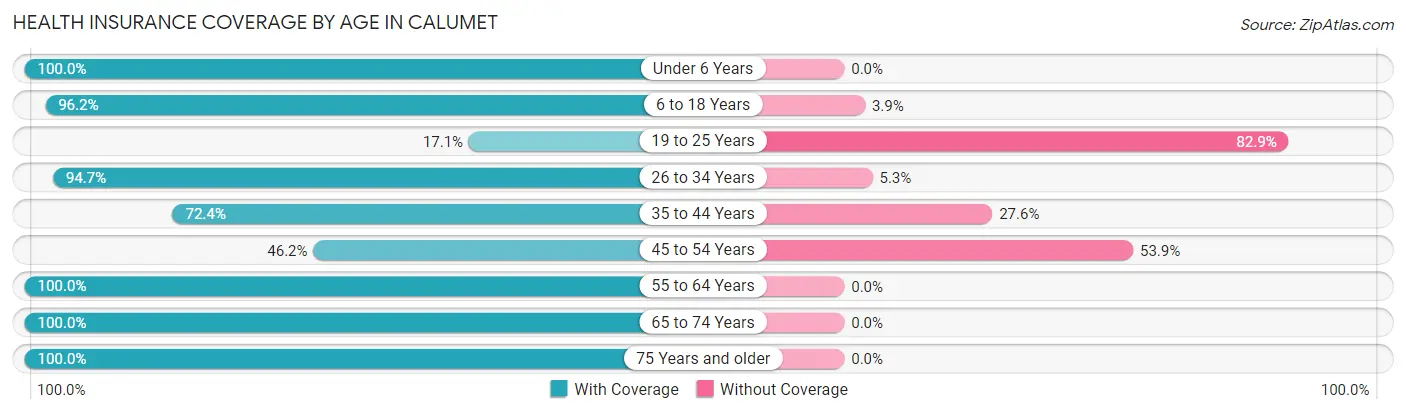
| Age Bracket | With Coverage | Without Coverage |
| Under 6 Years | 80 (100.0%) | 0 (0.0%) |
| 6 to 18 Years | 100 (96.2%) | 4 (3.8%) |
| 19 to 25 Years | 6 (17.1%) | 29 (82.9%) |
| 26 to 34 Years | 54 (94.7%) | 3 (5.3%) |
| 35 to 44 Years | 21 (72.4%) | 8 (27.6%) |
| 45 to 54 Years | 12 (46.2%) | 14 (53.8%) |
| 55 to 64 Years | 39 (100.0%) | 0 (0.0%) |
| 65 to 74 Years | 27 (100.0%) | 0 (0.0%) |
| 75 Years and older | 38 (100.0%) | 0 (0.0%) |
| Total | 377 (86.7%) | 58 (13.3%) |
Health Insurance Coverage by Citizenship Status in Calumet
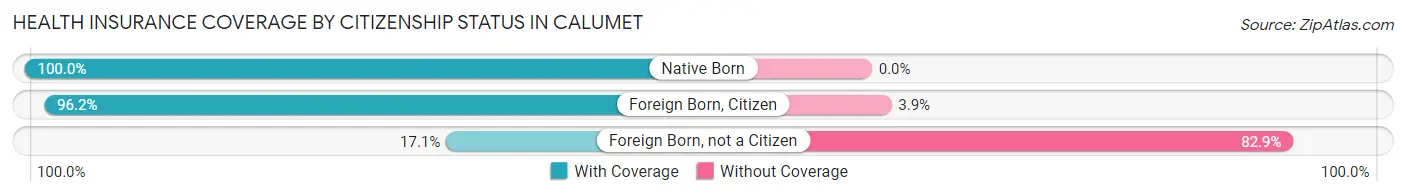
| Citizenship Status | With Coverage | Without Coverage |
| Native Born | 80 (100.0%) | 0 (0.0%) |
| Foreign Born, Citizen | 100 (96.2%) | 4 (3.8%) |
| Foreign Born, not a Citizen | 6 (17.1%) | 29 (82.9%) |
Health Insurance Coverage by Household Income in Calumet
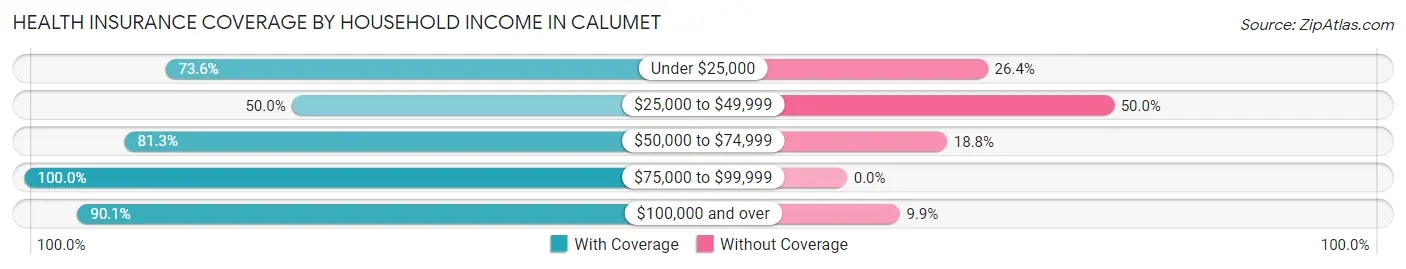
| Household Income | With Coverage | Without Coverage |
| Under $25,000 | 53 (73.6%) | 19 (26.4%) |
| $25,000 to $49,999 | 28 (50.0%) | 28 (50.0%) |
| $50,000 to $74,999 | 13 (81.2%) | 3 (18.8%) |
| $75,000 to $99,999 | 210 (100.0%) | 0 (0.0%) |
| $100,000 and over | 73 (90.1%) | 8 (9.9%) |
Public vs Private Health Insurance Coverage by Age in Calumet
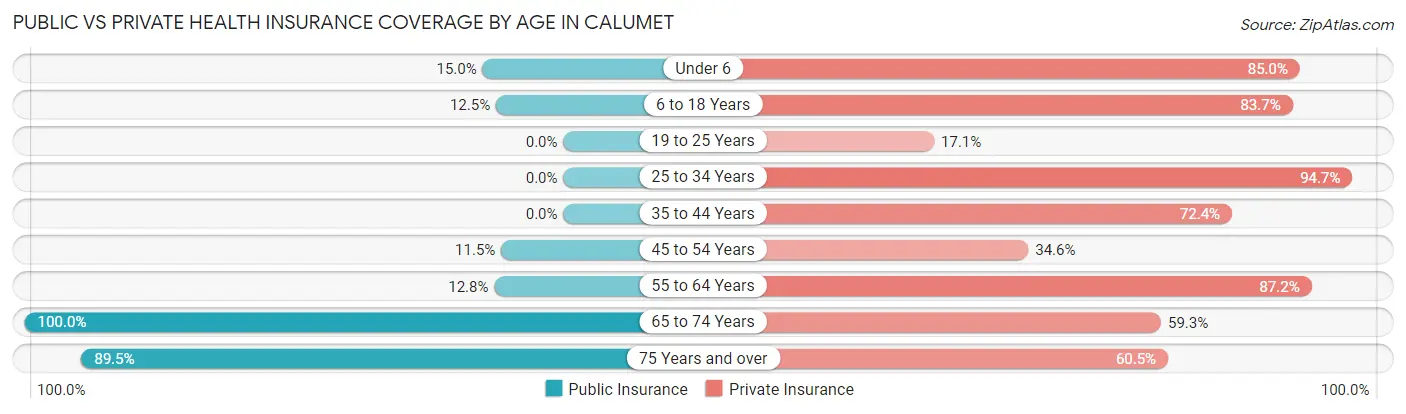
| Age Bracket | Public Insurance | Private Insurance |
| Under 6 | 12 (15.0%) | 68 (85.0%) |
| 6 to 18 Years | 13 (12.5%) | 87 (83.7%) |
| 19 to 25 Years | 0 (0.0%) | 6 (17.1%) |
| 25 to 34 Years | 0 (0.0%) | 54 (94.7%) |
| 35 to 44 Years | 0 (0.0%) | 21 (72.4%) |
| 45 to 54 Years | 3 (11.5%) | 9 (34.6%) |
| 55 to 64 Years | 5 (12.8%) | 34 (87.2%) |
| 65 to 74 Years | 27 (100.0%) | 16 (59.3%) |
| 75 Years and over | 34 (89.5%) | 23 (60.5%) |
| Total | 94 (21.6%) | 318 (73.1%) |
Disability Status by Sex by Age in Calumet
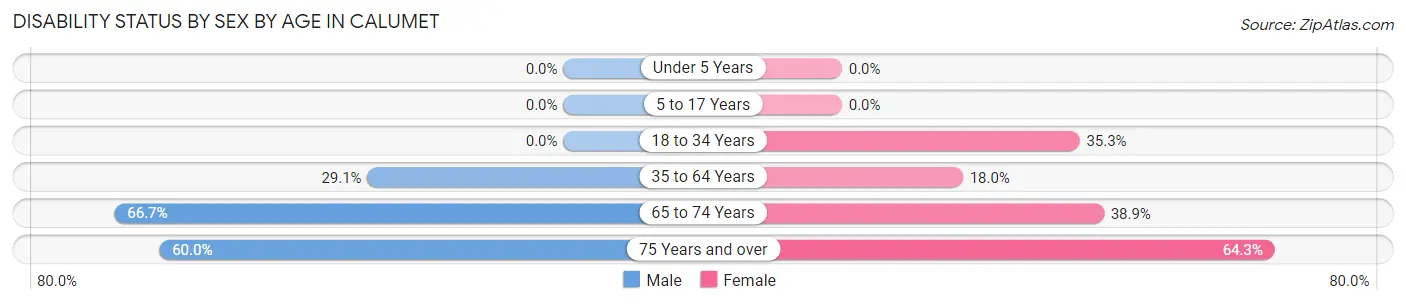
| Age Bracket | Male | Female |
| Under 5 Years | 0 (0.0%) | 0 (0.0%) |
| 5 to 17 Years | 0 (0.0%) | 0 (0.0%) |
| 18 to 34 Years | 0 (0.0%) | 18 (35.3%) |
| 35 to 64 Years | 16 (29.1%) | 7 (17.9%) |
| 65 to 74 Years | 6 (66.7%) | 7 (38.9%) |
| 75 Years and over | 6 (60.0%) | 18 (64.3%) |
Disability Class by Sex by Age in Calumet
Disability Class: Hearing Difficulty
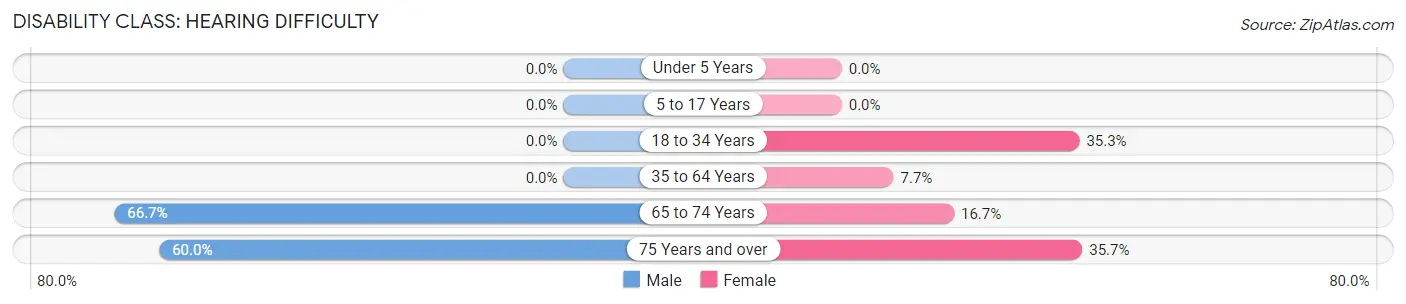
| Age Bracket | Male | Female |
| Under 5 Years | 0 (0.0%) | 0 (0.0%) |
| 5 to 17 Years | 0 (0.0%) | 0 (0.0%) |
| 18 to 34 Years | 0 (0.0%) | 18 (35.3%) |
| 35 to 64 Years | 0 (0.0%) | 3 (7.7%) |
| 65 to 74 Years | 6 (66.7%) | 3 (16.7%) |
| 75 Years and over | 6 (60.0%) | 10 (35.7%) |
Disability Class: Vision Difficulty
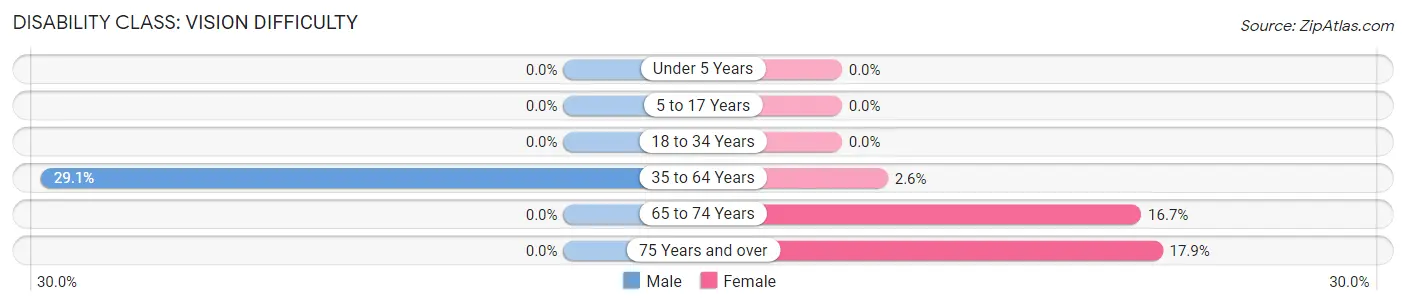
| Age Bracket | Male | Female |
| Under 5 Years | 0 (0.0%) | 0 (0.0%) |
| 5 to 17 Years | 0 (0.0%) | 0 (0.0%) |
| 18 to 34 Years | 0 (0.0%) | 0 (0.0%) |
| 35 to 64 Years | 16 (29.1%) | 1 (2.6%) |
| 65 to 74 Years | 0 (0.0%) | 3 (16.7%) |
| 75 Years and over | 0 (0.0%) | 5 (17.9%) |
Disability Class: Cognitive Difficulty
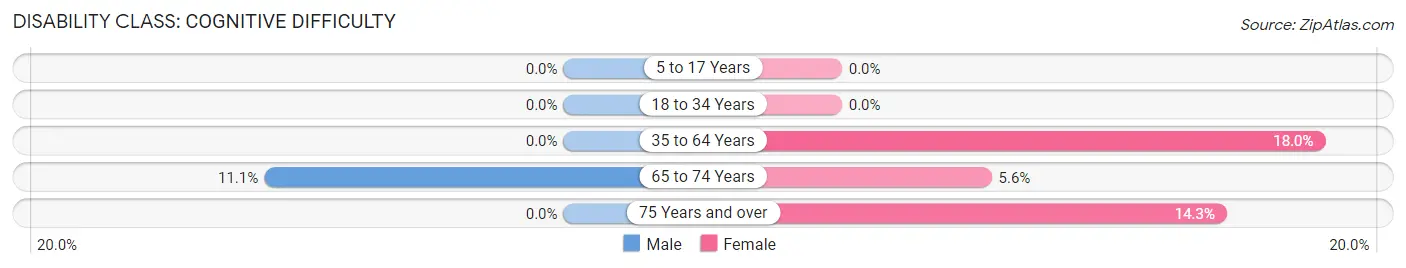
| Age Bracket | Male | Female |
| 5 to 17 Years | 0 (0.0%) | 0 (0.0%) |
| 18 to 34 Years | 0 (0.0%) | 0 (0.0%) |
| 35 to 64 Years | 0 (0.0%) | 7 (17.9%) |
| 65 to 74 Years | 1 (11.1%) | 1 (5.6%) |
| 75 Years and over | 0 (0.0%) | 4 (14.3%) |
Disability Class: Ambulatory Difficulty
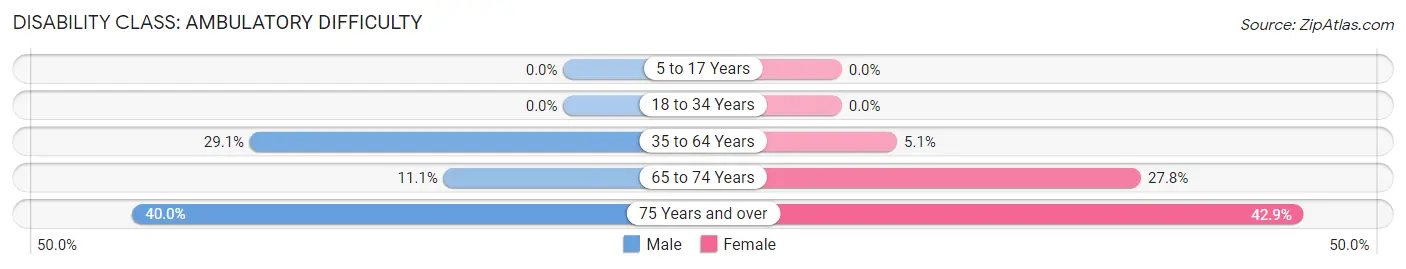
| Age Bracket | Male | Female |
| 5 to 17 Years | 0 (0.0%) | 0 (0.0%) |
| 18 to 34 Years | 0 (0.0%) | 0 (0.0%) |
| 35 to 64 Years | 16 (29.1%) | 2 (5.1%) |
| 65 to 74 Years | 1 (11.1%) | 5 (27.8%) |
| 75 Years and over | 4 (40.0%) | 12 (42.9%) |
Disability Class: Self-Care Difficulty
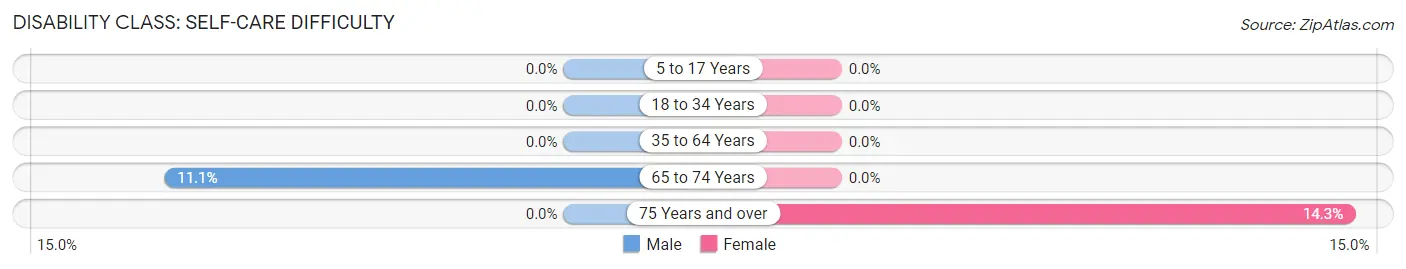
| Age Bracket | Male | Female |
| 5 to 17 Years | 0 (0.0%) | 0 (0.0%) |
| 18 to 34 Years | 0 (0.0%) | 0 (0.0%) |
| 35 to 64 Years | 0 (0.0%) | 0 (0.0%) |
| 65 to 74 Years | 1 (11.1%) | 0 (0.0%) |
| 75 Years and over | 0 (0.0%) | 4 (14.3%) |
Technology Access in Calumet
Computing Device Access in Calumet
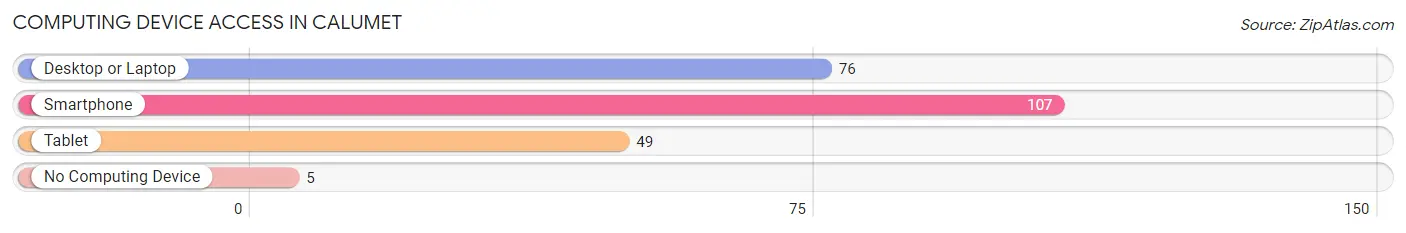
| Device Type | # Households | % Households |
| Desktop or Laptop | 76 | 59.8% |
| Smartphone | 107 | 84.3% |
| Tablet | 49 | 38.6% |
| No Computing Device | 5 | 3.9% |
| Total | 127 | 100.0% |
Internet Access in Calumet
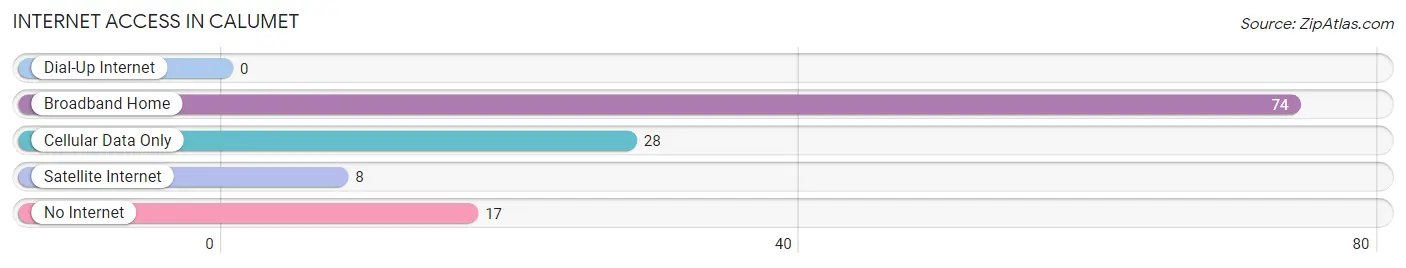
| Internet Type | # Households | % Households |
| Dial-Up Internet | 0 | 0.0% |
| Broadband Home | 74 | 58.3% |
| Cellular Data Only | 28 | 22.1% |
| Satellite Internet | 8 | 6.3% |
| No Internet | 17 | 13.4% |
| Total | 127 | 100.0% |
Calumet Summary
Calumet is a small town located in Canadian County, Oklahoma. It is situated about 25 miles northwest of Oklahoma City and is part of the Oklahoma City metropolitan area. The town was founded in 1891 and was named after the Calumet Oil Company, which was established in the area in the late 19th century. The population of Calumet was 1,093 at the 2010 census.
Geography
Calumet is located at 35°37'25" North, 97°51'45" West (35.623, -97.862). It is situated in the western part of Canadian County, about 25 miles northwest of Oklahoma City. The town is located in the Red Bed Plains region of Oklahoma, which is characterized by flat terrain and red-colored soil. The town is situated on the banks of the North Canadian River.
Climate
Calumet has a humid subtropical climate, with hot summers and mild winters. The average annual temperature is 63°F (17°C). The average annual precipitation is 33.5 inches (851 mm).
Demographics
As of the 2010 census, the population of Calumet was 1,093. The racial makeup of the town was 94.2% White, 0.7% African American, 0.7% Native American, 0.2% Asian, 0.1% Pacific Islander, 0.7% from other races, and 3.4% from two or more races. Hispanic or Latino of any race were 2.2% of the population.
Economy
Calumet is a small, rural town with a primarily agricultural economy. The town is home to several farms and ranches, as well as a few small businesses. The town is also home to a few oil and gas wells.
Education
Calumet is served by the Calumet Public School District. The district operates one elementary school, one middle school, and one high school.
Transportation
Calumet is served by two major highways, Interstate 40 and State Highway 66. The town is also served by a few local roads.
Culture
Calumet is home to a few annual events, including the Calumet Rodeo, which is held every summer. The town also hosts a few other events throughout the year, such as the Calumet Music Festival and the Calumet Arts Festival.
Conclusion
Calumet is a small town located in Canadian County, Oklahoma. It is situated about 25 miles northwest of Oklahoma City and is part of the Oklahoma City metropolitan area. The town was founded in 1891 and was named after the Calumet Oil Company, which was established in the area in the late 19th century. The population of Calumet was 1,093 at the 2010 census. The town has a humid subtropical climate and is home to a primarily agricultural economy. Calumet is served by the Calumet Public School District and is home to a few annual events, such as the Calumet Rodeo and the Calumet Music Festival.
Common Questions
What is Per Capita Income in Calumet?
Per Capita income in Calumet is $23,186.
What is the Median Family Income in Calumet?
Median Family Income in Calumet is $85,556.
What is the Median Household income in Calumet?
Median Household Income in Calumet is $56,875.
What is Income or Wage Gap in Calumet?
Income or Wage Gap in Calumet is 6.7%.
Women in Calumet earn 93.3 cents for every dollar earned by a man.
What is Inequality or Gini Index in Calumet?
Inequality or Gini Index in Calumet is 0.47.
What is the Total Population of Calumet?
Total Population of Calumet is 435.
What is the Total Male Population of Calumet?
Total Male Population of Calumet is 179.
What is the Total Female Population of Calumet?
Total Female Population of Calumet is 256.
What is the Ratio of Males per 100 Females in Calumet?
There are 69.92 Males per 100 Females in Calumet.
What is the Ratio of Females per 100 Males in Calumet?
There are 143.02 Females per 100 Males in Calumet.
What is the Median Population Age in Calumet?
Median Population Age in Calumet is 25.5 Years.
What is the Average Family Size in Calumet
Average Family Size in Calumet is 4.8 People.
What is the Average Household Size in Calumet
Average Household Size in Calumet is 3.4 People.
How Large is the Labor Force in Calumet?
There are 139 People in the Labor Forcein in Calumet.
What is the Percentage of People in the Labor Force in Calumet?
54.5% of People are in the Labor Force in Calumet.
What is the Unemployment Rate in Calumet?
Unemployment Rate in Calumet is 2.9%.