Cache, OK Map & Demographics
Cache Map
Cache Overview
$27,634
PER CAPITA INCOME
$67,287
AVG FAMILY INCOME
$59,834
AVG HOUSEHOLD INCOME
28.0%
WAGE / INCOME GAP [ % ]
72.0¢/ $1
WAGE / INCOME GAP [ $ ]
0.34
INEQUALITY / GINI INDEX
2,974
TOTAL POPULATION
1,448
MALE POPULATION
1,526
FEMALE POPULATION
94.89
MALES / 100 FEMALES
105.39
FEMALES / 100 MALES
37.4
MEDIAN AGE
3.2
AVG FAMILY SIZE
2.6
AVG HOUSEHOLD SIZE
1,374
LABOR FORCE [ PEOPLE ]
59.9%
PERCENT IN LABOR FORCE
6.1%
UNEMPLOYMENT RATE
Cache Zip Codes
Cache Area Codes
Income in Cache
Income Overview in Cache
Per Capita Income in Cache is $27,634, while median incomes of families and households are $67,287 and $59,834 respectively.
| Characteristic | Number | Measure |
| Per Capita Income | 2,974 | $27,634 |
| Median Family Income | 775 | $67,287 |
| Mean Family Income | 775 | $80,654 |
| Median Household Income | 1,141 | $59,834 |
| Mean Household Income | 1,141 | $70,861 |
| Income Deficit | 775 | $0 |
| Wage / Income Gap (%) | 2,974 | 28.02% |
| Wage / Income Gap ($) | 2,974 | 71.98¢ per $1 |
| Gini / Inequality Index | 2,974 | 0.34 |
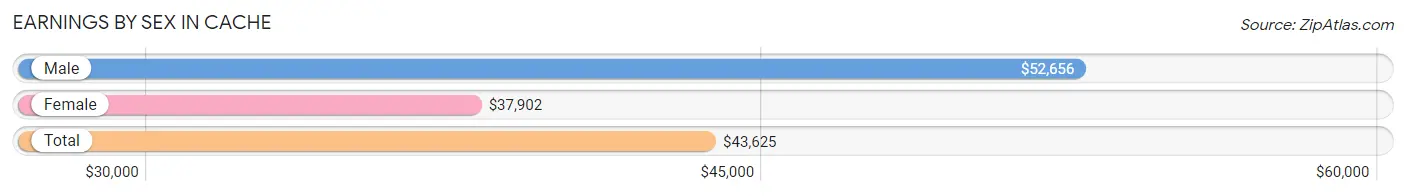
Earnings by Sex in Cache
Average Earnings in Cache are $43,625, $52,656 for men and $37,902 for women, a difference of 28.0%.
| Sex | Number | Average Earnings |
| Male | 740 (49.8%) | $52,656 |
| Female | 745 (50.2%) | $37,902 |
| Total | 1,485 (100.0%) | $43,625 |
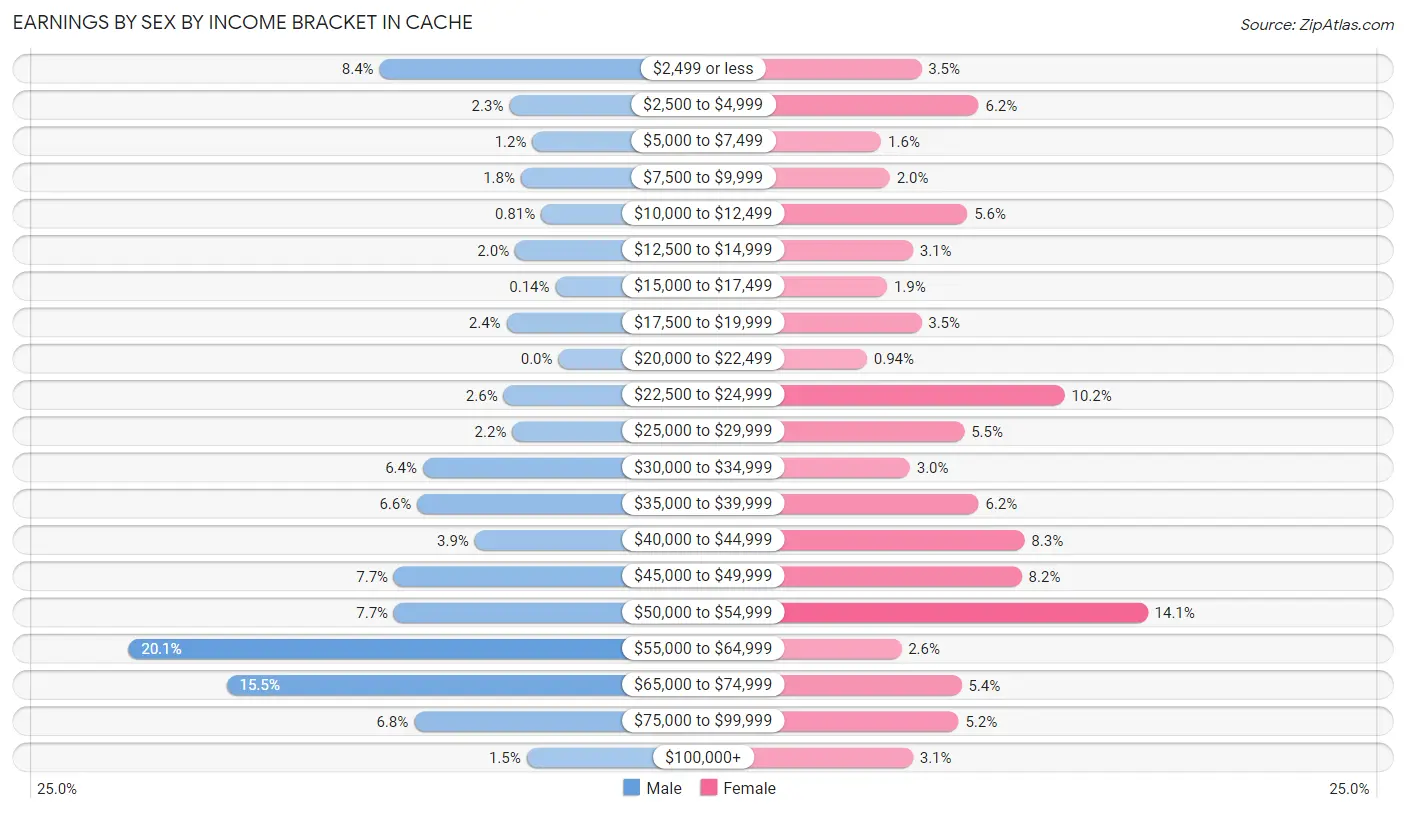
Earnings by Sex by Income Bracket in Cache
The most common earnings brackets in Cache are $55,000 to $64,999 for men (149 | 20.1%) and $50,000 to $54,999 for women (105 | 14.1%).
| Income | Male | Female |
| $2,499 or less | 62 (8.4%) | 26 (3.5%) |
| $2,500 to $4,999 | 17 (2.3%) | 46 (6.2%) |
| $5,000 to $7,499 | 9 (1.2%) | 12 (1.6%) |
| $7,500 to $9,999 | 13 (1.8%) | 15 (2.0%) |
| $10,000 to $12,499 | 6 (0.8%) | 42 (5.6%) |
| $12,500 to $14,999 | 15 (2.0%) | 23 (3.1%) |
| $15,000 to $17,499 | 1 (0.1%) | 14 (1.9%) |
| $17,500 to $19,999 | 18 (2.4%) | 26 (3.5%) |
| $20,000 to $22,499 | 0 (0.0%) | 7 (0.9%) |
| $22,500 to $24,999 | 19 (2.6%) | 76 (10.2%) |
| $25,000 to $29,999 | 16 (2.2%) | 41 (5.5%) |
| $30,000 to $34,999 | 47 (6.4%) | 22 (2.9%) |
| $35,000 to $39,999 | 49 (6.6%) | 46 (6.2%) |
| $40,000 to $44,999 | 29 (3.9%) | 62 (8.3%) |
| $45,000 to $49,999 | 57 (7.7%) | 61 (8.2%) |
| $50,000 to $54,999 | 57 (7.7%) | 105 (14.1%) |
| $55,000 to $64,999 | 149 (20.1%) | 19 (2.5%) |
| $65,000 to $74,999 | 115 (15.5%) | 40 (5.4%) |
| $75,000 to $99,999 | 50 (6.8%) | 39 (5.2%) |
| $100,000+ | 11 (1.5%) | 23 (3.1%) |
| Total | 740 (100.0%) | 745 (100.0%) |
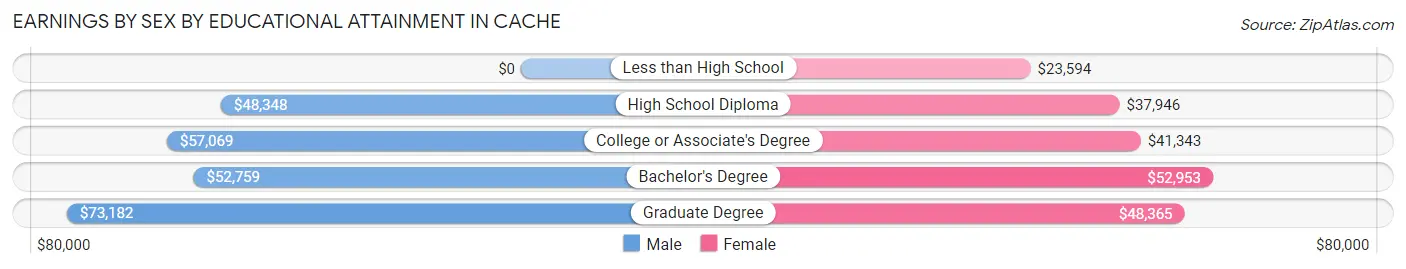
Earnings by Sex by Educational Attainment in Cache
Average earnings in Cache are $53,594 for men and $41,655 for women, a difference of 22.3%. Men with an educational attainment of graduate degree enjoy the highest average annual earnings of $73,182, while those with high school diploma education earn the least with $48,348. Women with an educational attainment of bachelor's degree earn the most with the average annual earnings of $52,953, while those with less than high school education have the smallest earnings of $23,594.
| Educational Attainment | Male Income | Female Income |
| Less than High School | - | - |
| High School Diploma | $48,348 | $37,946 |
| College or Associate's Degree | $57,069 | $41,343 |
| Bachelor's Degree | $52,759 | $52,953 |
| Graduate Degree | $73,182 | $48,365 |
| Total | $53,594 | $41,655 |
Family Income in Cache
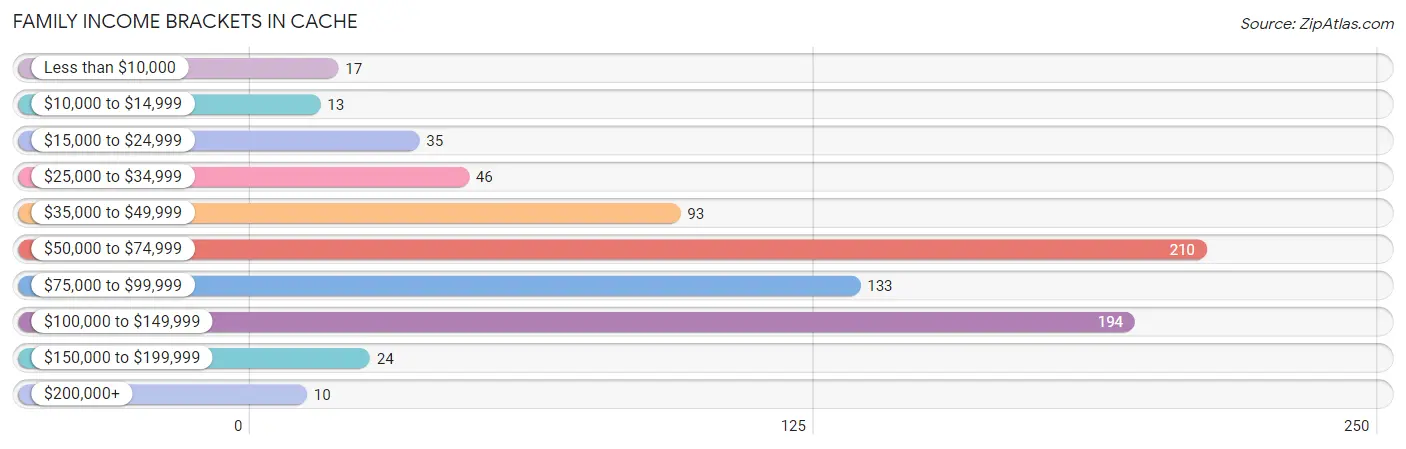
Family Income Brackets in Cache
According to the Cache family income data, there are 210 families falling into the $50,000 to $74,999 income range, which is the most common income bracket and makes up 27.1% of all families. Conversely, the $200,000+ income bracket is the least frequent group with only 10 families (1.3%) belonging to this category.
| Income Bracket | # Families | % Families |
| Less than $10,000 | 17 | 2.2% |
| $10,000 to $14,999 | 13 | 1.7% |
| $15,000 to $24,999 | 35 | 4.5% |
| $25,000 to $34,999 | 46 | 5.9% |
| $35,000 to $49,999 | 93 | 12.0% |
| $50,000 to $74,999 | 210 | 27.1% |
| $75,000 to $99,999 | 133 | 17.2% |
| $100,000 to $149,999 | 194 | 25.0% |
| $150,000 to $199,999 | 24 | 3.1% |
| $200,000+ | 10 | 1.3% |
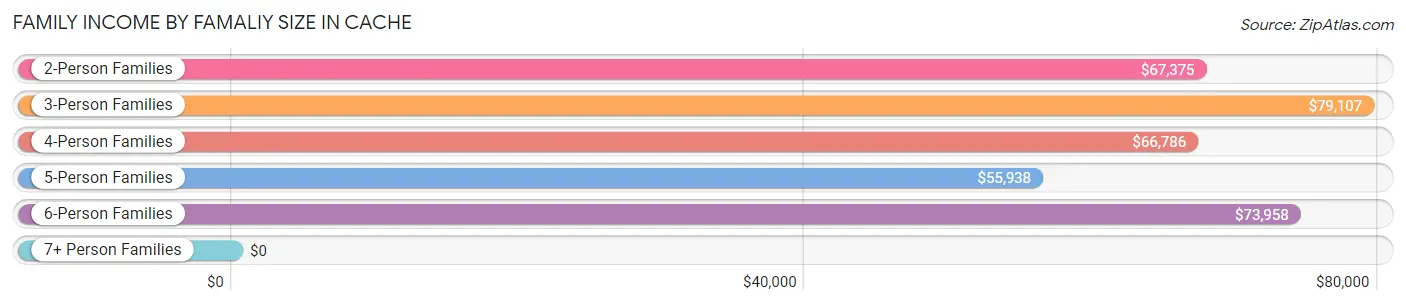
Family Income by Famaliy Size in Cache
3-person families (239 | 30.8%) account for the highest median family income in Cache with $79,107 per family, while 2-person families (312 | 40.3%) have the highest median income of $33,688 per family member.
| Income Bracket | # Families | Median Income |
| 2-Person Families | 312 (40.3%) | $67,375 |
| 3-Person Families | 239 (30.8%) | $79,107 |
| 4-Person Families | 146 (18.8%) | $66,786 |
| 5-Person Families | 35 (4.5%) | $55,938 |
| 6-Person Families | 31 (4.0%) | $73,958 |
| 7+ Person Families | 12 (1.5%) | $0 |
| Total | 775 (100.0%) | $67,287 |
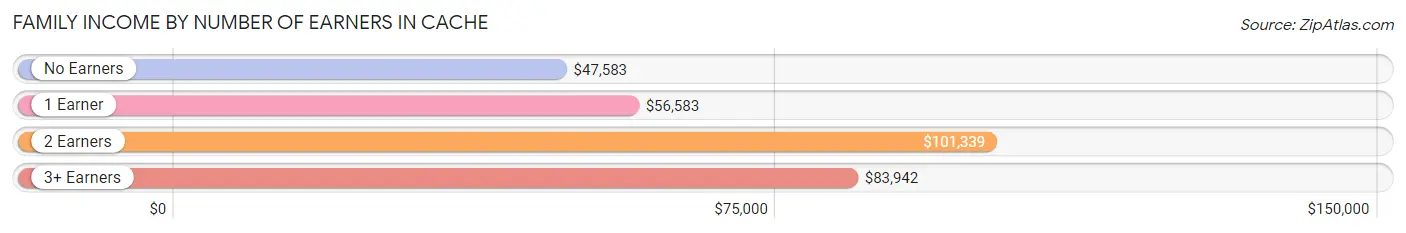
Family Income by Number of Earners in Cache
The median family income in Cache is $67,287, with families comprising 2 earners (303) having the highest median family income of $101,339, while families with no earners (95) have the lowest median family income of $47,583, accounting for 39.1% and 12.3% of families, respectively.
| Number of Earners | # Families | Median Income |
| No Earners | 95 (12.3%) | $47,583 |
| 1 Earner | 316 (40.8%) | $56,583 |
| 2 Earners | 303 (39.1%) | $101,339 |
| 3+ Earners | 61 (7.9%) | $83,942 |
| Total | 775 (100.0%) | $67,287 |
Household Income in Cache
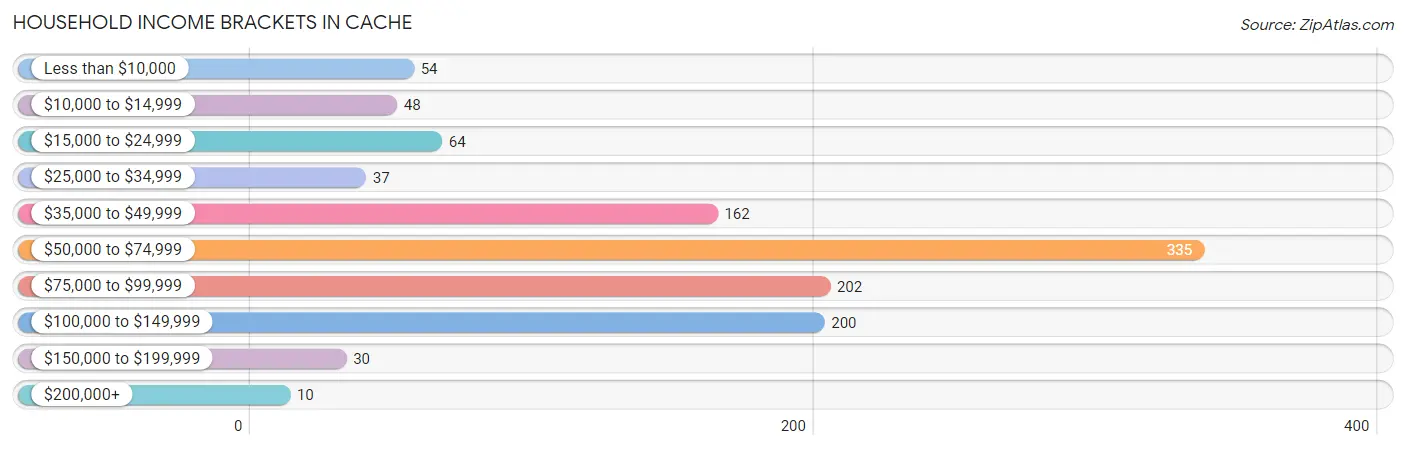
Household Income Brackets in Cache
With 335 households falling in the category, the $50,000 to $74,999 income range is the most frequent in Cache, accounting for 29.4% of all households. In contrast, only 10 households (0.9%) fall into the $200,000+ income bracket, making it the least populous group.
| Income Bracket | # Households | % Households |
| Less than $10,000 | 54 | 4.7% |
| $10,000 to $14,999 | 48 | 4.2% |
| $15,000 to $24,999 | 64 | 5.6% |
| $25,000 to $34,999 | 37 | 3.2% |
| $35,000 to $49,999 | 162 | 14.2% |
| $50,000 to $74,999 | 335 | 29.4% |
| $75,000 to $99,999 | 202 | 17.7% |
| $100,000 to $149,999 | 200 | 17.5% |
| $150,000 to $199,999 | 30 | 2.6% |
| $200,000+ | 10 | 0.9% |
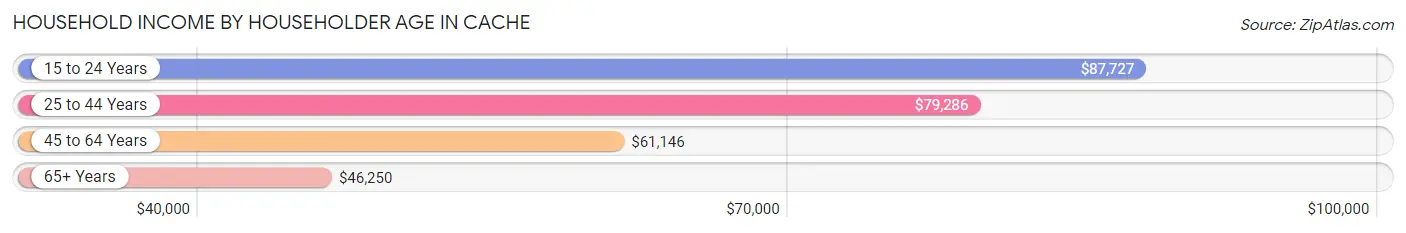
Household Income by Householder Age in Cache
The median household income in Cache is $59,834, with the highest median household income of $87,727 found in the 15 to 24 years age bracket for the primary householder. A total of 40 households (3.5%) fall into this category. Meanwhile, the 65+ years age bracket for the primary householder has the lowest median household income of $46,250, with 271 households (23.7%) in this group.
| Income Bracket | # Households | Median Income |
| 15 to 24 Years | 40 (3.5%) | $87,727 |
| 25 to 44 Years | 416 (36.5%) | $79,286 |
| 45 to 64 Years | 414 (36.3%) | $61,146 |
| 65+ Years | 271 (23.7%) | $46,250 |
| Total | 1,141 (100.0%) | $59,834 |
Poverty in Cache
Income Below Poverty by Sex and Age in Cache
With 13.1% poverty level for males and 16.5% for females among the residents of Cache, 16 and 17 year old males and 15 year old females are the most vulnerable to poverty, with 26 males (56.5%) and 20 females (52.6%) in their respective age groups living below the poverty level.
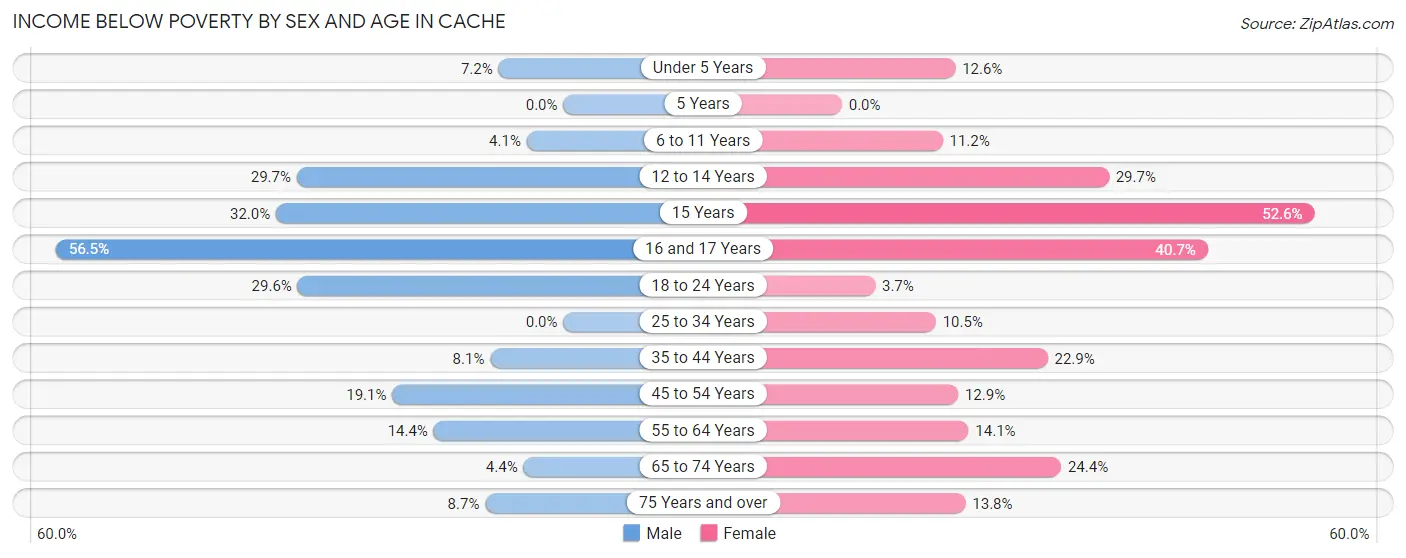
| Age Bracket | Male | Female |
| Under 5 Years | 7 (7.2%) | 12 (12.6%) |
| 5 Years | 0 (0.0%) | 0 (0.0%) |
| 6 to 11 Years | 6 (4.1%) | 11 (11.2%) |
| 12 to 14 Years | 19 (29.7%) | 11 (29.7%) |
| 15 Years | 16 (32.0%) | 20 (52.6%) |
| 16 and 17 Years | 26 (56.5%) | 22 (40.7%) |
| 18 to 24 Years | 29 (29.6%) | 4 (3.7%) |
| 25 to 34 Years | 0 (0.0%) | 25 (10.5%) |
| 35 to 44 Years | 21 (8.1%) | 41 (22.9%) |
| 45 to 54 Years | 28 (19.1%) | 22 (12.9%) |
| 55 to 64 Years | 27 (14.4%) | 32 (14.1%) |
| 65 to 74 Years | 4 (4.4%) | 31 (24.4%) |
| 75 Years and over | 6 (8.7%) | 15 (13.8%) |
| Total | 189 (13.1%) | 246 (16.5%) |
Income Above Poverty by Sex and Age in Cache
According to the poverty statistics in Cache, males aged 5 years and females aged 5 years are the age groups that are most secure financially, with 100.0% of males and 100.0% of females in these age groups living above the poverty line.
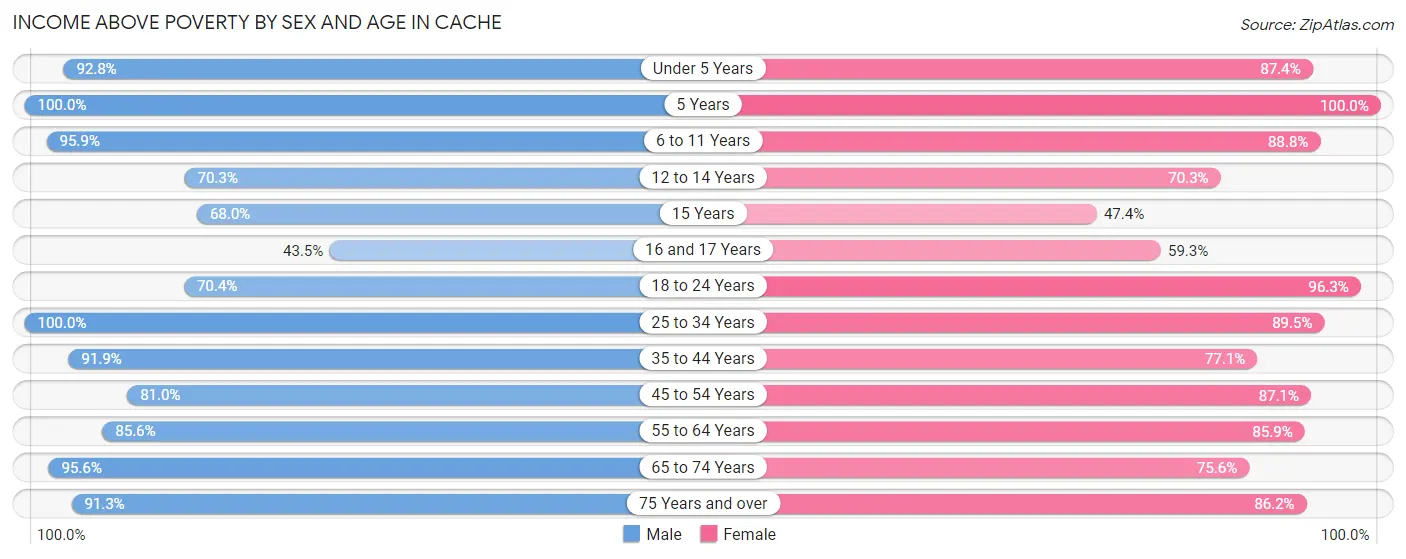
| Age Bracket | Male | Female |
| Under 5 Years | 90 (92.8%) | 83 (87.4%) |
| 5 Years | 9 (100.0%) | 12 (100.0%) |
| 6 to 11 Years | 141 (95.9%) | 87 (88.8%) |
| 12 to 14 Years | 45 (70.3%) | 26 (70.3%) |
| 15 Years | 34 (68.0%) | 18 (47.4%) |
| 16 and 17 Years | 20 (43.5%) | 32 (59.3%) |
| 18 to 24 Years | 69 (70.4%) | 104 (96.3%) |
| 25 to 34 Years | 186 (100.0%) | 214 (89.5%) |
| 35 to 44 Years | 237 (91.9%) | 138 (77.1%) |
| 45 to 54 Years | 119 (80.9%) | 148 (87.1%) |
| 55 to 64 Years | 160 (85.6%) | 195 (85.9%) |
| 65 to 74 Years | 86 (95.6%) | 96 (75.6%) |
| 75 Years and over | 63 (91.3%) | 94 (86.2%) |
| Total | 1,259 (87.0%) | 1,247 (83.5%) |
Income Below Poverty Among Married-Couple Families in Cache
The poverty statistics for married-couple families in Cache show that 8.7% or 50 of the total 576 families live below the poverty line. Families with no children have the highest poverty rate of 11.8%, comprising of 33 families. On the other hand, families with 3 or 4 children have the lowest poverty rate of 0.0%, which includes 0 families.
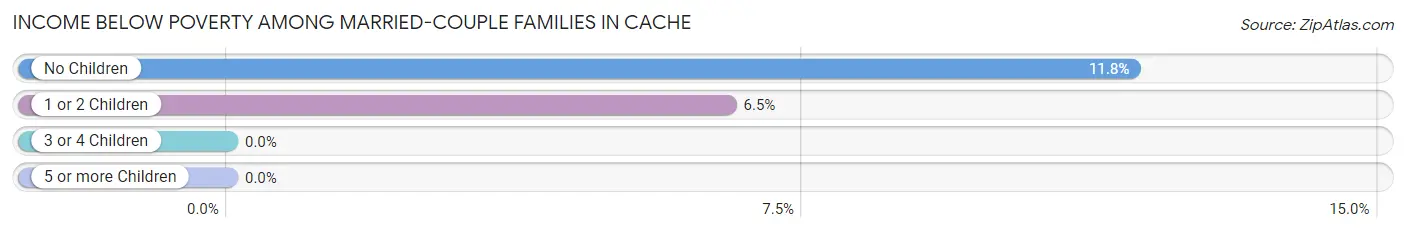
| Children | Above Poverty | Below Poverty |
| No Children | 247 (88.2%) | 33 (11.8%) |
| 1 or 2 Children | 244 (93.5%) | 17 (6.5%) |
| 3 or 4 Children | 31 (100.0%) | 0 (0.0%) |
| 5 or more Children | 4 (100.0%) | 0 (0.0%) |
| Total | 526 (91.3%) | 50 (8.7%) |
Income Below Poverty Among Single-Parent Households in Cache
According to the poverty data in Cache, 20.0% or 4 single-father households and 22.9% or 41 single-mother households are living below the poverty line. Among single-father households, those with 5 or more children have the highest poverty rate, with 4 households (100.0%) experiencing poverty. Likewise, among single-mother households, those with 3 or 4 children have the highest poverty rate, with 18 households (52.9%) falling below the poverty line.
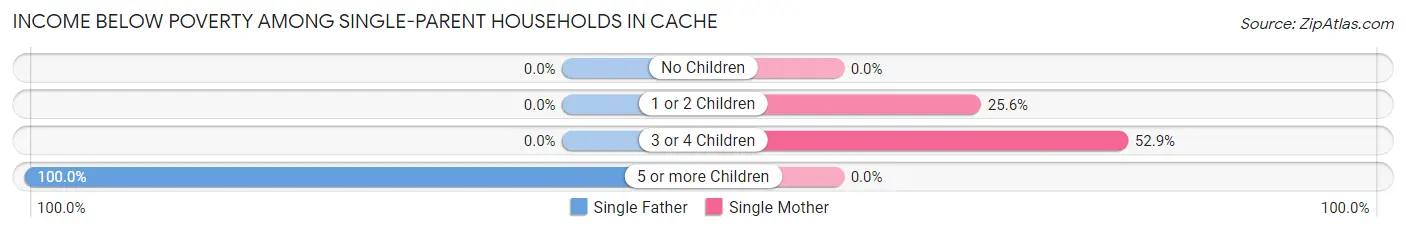
| Children | Single Father | Single Mother |
| No Children | 0 (0.0%) | 0 (0.0%) |
| 1 or 2 Children | 0 (0.0%) | 23 (25.6%) |
| 3 or 4 Children | 0 (0.0%) | 18 (52.9%) |
| 5 or more Children | 4 (100.0%) | 0 (0.0%) |
| Total | 4 (20.0%) | 41 (22.9%) |
Income Below Poverty Among Married-Couple vs Single-Parent Households in Cache
The poverty data for Cache shows that 50 of the married-couple family households (8.7%) and 45 of the single-parent households (22.6%) are living below the poverty level. Within the married-couple family households, those with no children have the highest poverty rate, with 33 households (11.8%) falling below the poverty line. Among the single-parent households, those with 5 or more children have the highest poverty rate, with 4 household (100.0%) living below poverty.
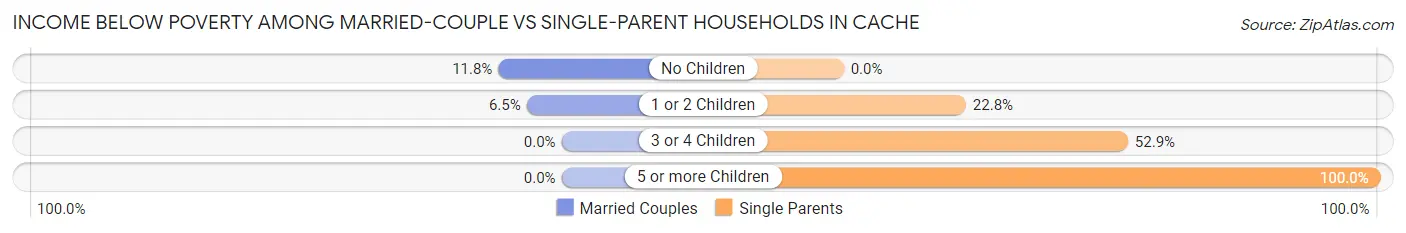
| Children | Married-Couple Families | Single-Parent Households |
| No Children | 33 (11.8%) | 0 (0.0%) |
| 1 or 2 Children | 17 (6.5%) | 23 (22.8%) |
| 3 or 4 Children | 0 (0.0%) | 18 (52.9%) |
| 5 or more Children | 0 (0.0%) | 4 (100.0%) |
| Total | 50 (8.7%) | 45 (22.6%) |
Race in Cache
The most populous races in Cache are White / Caucasian (1,985 | 66.7%), Hispanic or Latino (469 | 15.8%), and Two or more Races (455 | 15.3%).
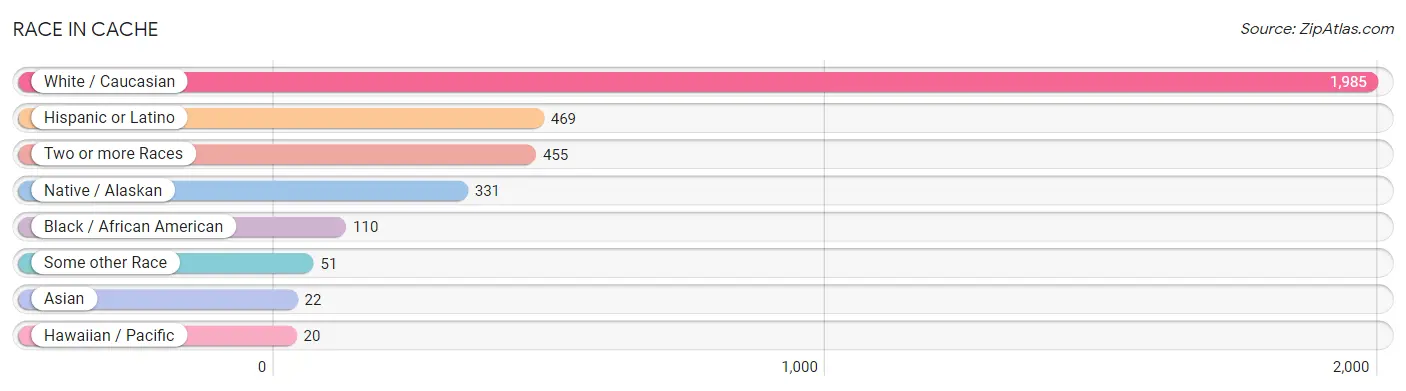
| Race | # Population | % Population |
| Asian | 22 | 0.7% |
| Black / African American | 110 | 3.7% |
| Hawaiian / Pacific | 20 | 0.7% |
| Hispanic or Latino | 469 | 15.8% |
| Native / Alaskan | 331 | 11.1% |
| White / Caucasian | 1,985 | 66.7% |
| Two or more Races | 455 | 15.3% |
| Some other Race | 51 | 1.7% |
| Total | 2,974 | 100.0% |
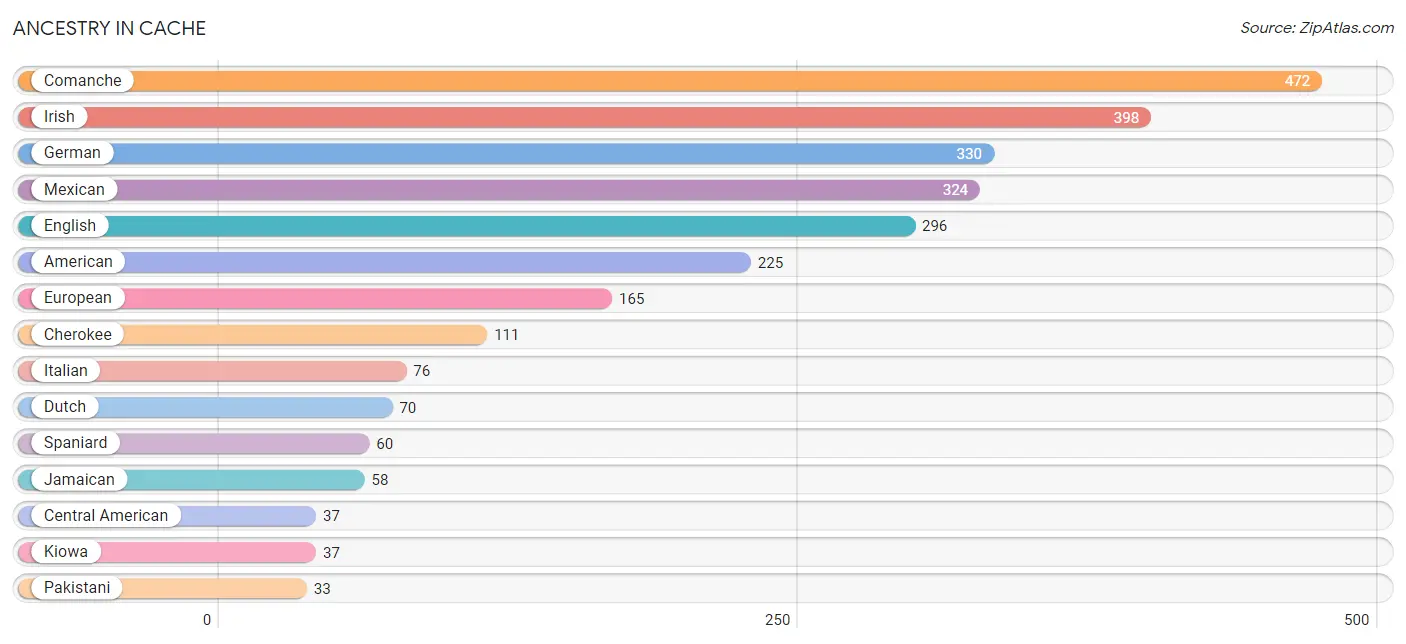
Ancestry in Cache
The most populous ancestries reported in Cache are Comanche (472 | 15.9%), Irish (398 | 13.4%), German (330 | 11.1%), Mexican (324 | 10.9%), and English (296 | 10.0%), together accounting for 61.2% of all Cache residents.
| Ancestry | # Population | % Population |
| African | 6 | 0.2% |
| American | 225 | 7.6% |
| Apache | 16 | 0.5% |
| Australian | 6 | 0.2% |
| Belgian | 1 | 0.0% |
| Bhutanese | 4 | 0.1% |
| Bolivian | 18 | 0.6% |
| British | 4 | 0.1% |
| Central American | 37 | 1.2% |
| Cherokee | 111 | 3.7% |
| Choctaw | 19 | 0.6% |
| Comanche | 472 | 15.9% |
| Czech | 6 | 0.2% |
| Delaware | 4 | 0.1% |
| Dutch | 70 | 2.4% |
| English | 296 | 10.0% |
| European | 165 | 5.6% |
| French | 18 | 0.6% |
| German | 330 | 11.1% |
| Guamanian / Chamorro | 20 | 0.7% |
| Guatemalan | 10 | 0.3% |
| Irish | 398 | 13.4% |
| Italian | 76 | 2.6% |
| Jamaican | 58 | 1.9% |
| Kiowa | 37 | 1.2% |
| Korean | 4 | 0.1% |
| Mexican | 324 | 10.9% |
| Mexican American Indian | 16 | 0.5% |
| Nigerian | 10 | 0.3% |
| Northern European | 6 | 0.2% |
| Norwegian | 21 | 0.7% |
| Pakistani | 33 | 1.1% |
| Polish | 9 | 0.3% |
| Puerto Rican | 30 | 1.0% |
| Russian | 4 | 0.1% |
| Salvadoran | 27 | 0.9% |
| Scandinavian | 21 | 0.7% |
| Scotch-Irish | 1 | 0.0% |
| Seminole | 3 | 0.1% |
| South American | 18 | 0.6% |
| Spaniard | 60 | 2.0% |
| Subsaharan African | 16 | 0.5% |
| Welsh | 5 | 0.2% | View All 43 Rows |
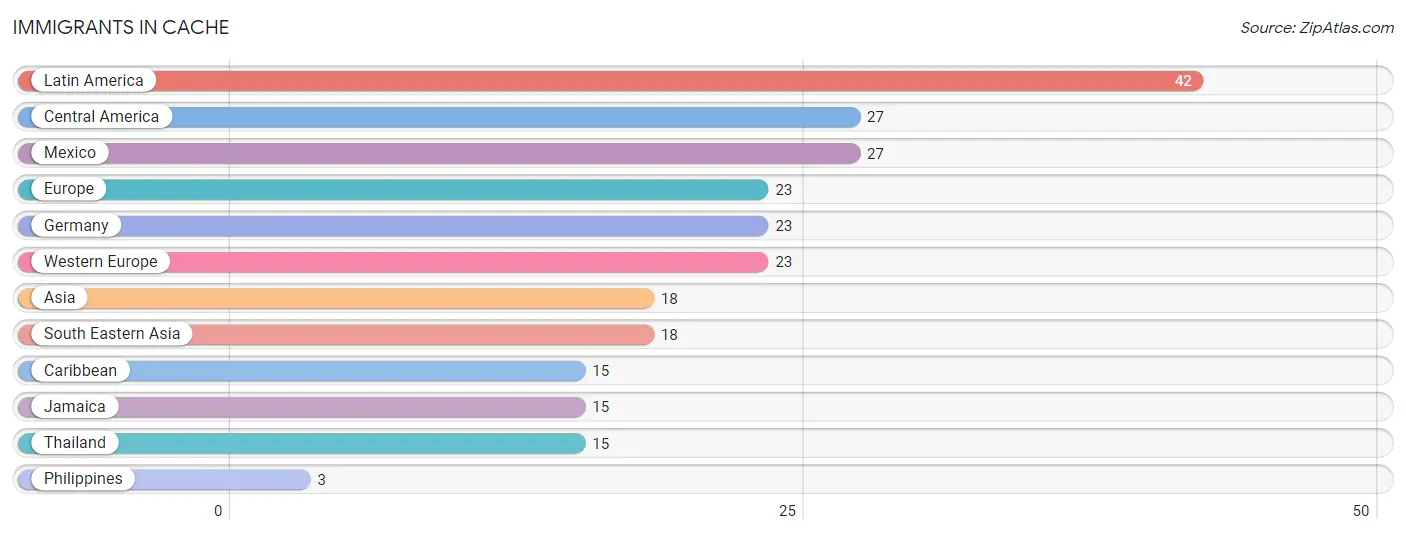
Immigrants in Cache
The most numerous immigrant groups reported in Cache came from Latin America (42 | 1.4%), Central America (27 | 0.9%), Mexico (27 | 0.9%), Europe (23 | 0.8%), and Germany (23 | 0.8%), together accounting for 4.8% of all Cache residents.
| Immigration Origin | # Population | % Population |
| Asia | 18 | 0.6% |
| Caribbean | 15 | 0.5% |
| Central America | 27 | 0.9% |
| Europe | 23 | 0.8% |
| Germany | 23 | 0.8% |
| Jamaica | 15 | 0.5% |
| Latin America | 42 | 1.4% |
| Mexico | 27 | 0.9% |
| Philippines | 3 | 0.1% |
| South Eastern Asia | 18 | 0.6% |
| Thailand | 15 | 0.5% |
| Western Europe | 23 | 0.8% | View All 12 Rows |
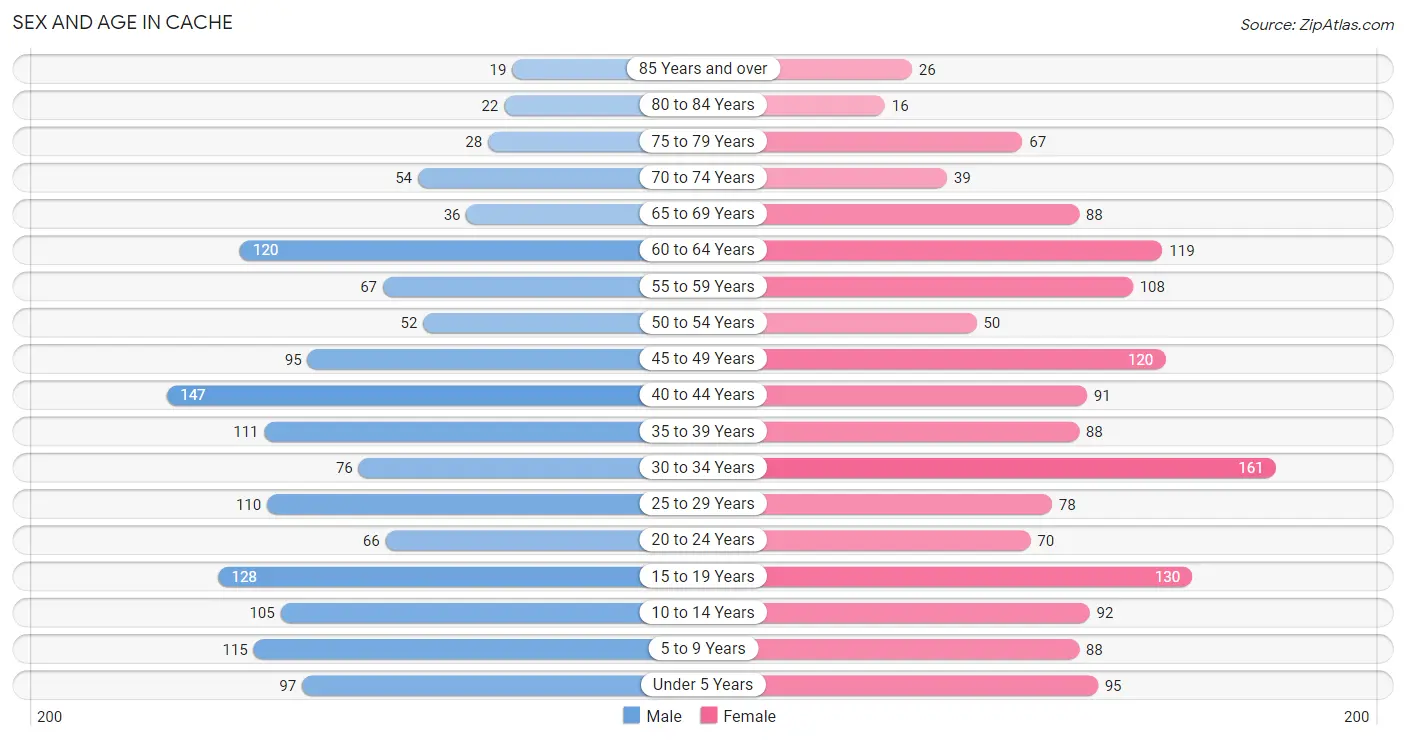
Sex and Age in Cache
Sex and Age in Cache
The most populous age groups in Cache are 40 to 44 Years (147 | 10.2%) for men and 30 to 34 Years (161 | 10.5%) for women.
| Age Bracket | Male | Female |
| Under 5 Years | 97 (6.7%) | 95 (6.2%) |
| 5 to 9 Years | 115 (7.9%) | 88 (5.8%) |
| 10 to 14 Years | 105 (7.2%) | 92 (6.0%) |
| 15 to 19 Years | 128 (8.8%) | 130 (8.5%) |
| 20 to 24 Years | 66 (4.6%) | 70 (4.6%) |
| 25 to 29 Years | 110 (7.6%) | 78 (5.1%) |
| 30 to 34 Years | 76 (5.2%) | 161 (10.5%) |
| 35 to 39 Years | 111 (7.7%) | 88 (5.8%) |
| 40 to 44 Years | 147 (10.2%) | 91 (6.0%) |
| 45 to 49 Years | 95 (6.6%) | 120 (7.9%) |
| 50 to 54 Years | 52 (3.6%) | 50 (3.3%) |
| 55 to 59 Years | 67 (4.6%) | 108 (7.1%) |
| 60 to 64 Years | 120 (8.3%) | 119 (7.8%) |
| 65 to 69 Years | 36 (2.5%) | 88 (5.8%) |
| 70 to 74 Years | 54 (3.7%) | 39 (2.6%) |
| 75 to 79 Years | 28 (1.9%) | 67 (4.4%) |
| 80 to 84 Years | 22 (1.5%) | 16 (1.1%) |
| 85 Years and over | 19 (1.3%) | 26 (1.7%) |
| Total | 1,448 (100.0%) | 1,526 (100.0%) |
Families and Households in Cache
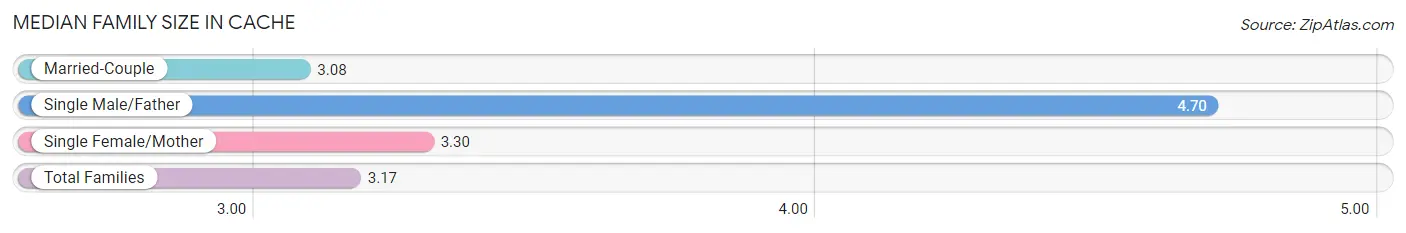
Median Family Size in Cache
The median family size in Cache is 3.17 persons per family, with single male/father families (20 | 2.6%) accounting for the largest median family size of 4.7 persons per family. On the other hand, married-couple families (576 | 74.3%) represent the smallest median family size with 3.08 persons per family.
| Family Type | # Families | Family Size |
| Married-Couple | 576 (74.3%) | 3.08 |
| Single Male/Father | 20 (2.6%) | 4.70 |
| Single Female/Mother | 179 (23.1%) | 3.30 |
| Total Families | 775 (100.0%) | 3.17 |
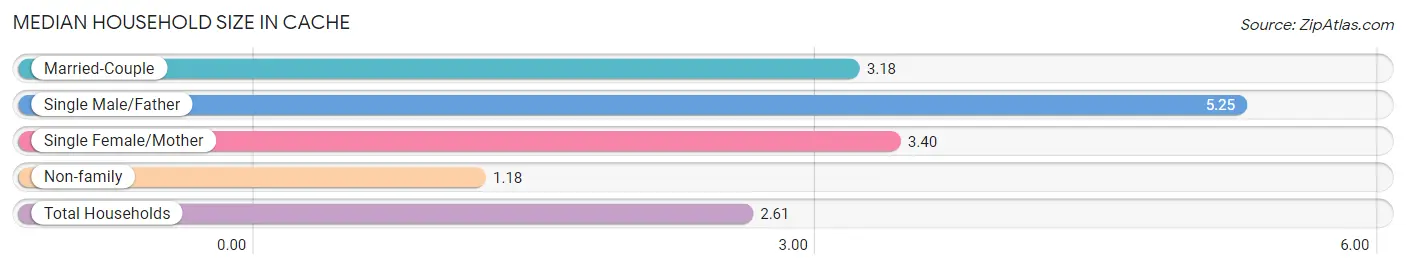
Median Household Size in Cache
The median household size in Cache is 2.61 persons per household, with single male/father households (20 | 1.8%) accounting for the largest median household size of 5.25 persons per household. non-family households (366 | 32.1%) represent the smallest median household size with 1.18 persons per household.
| Household Type | # Households | Household Size |
| Married-Couple | 576 (50.5%) | 3.18 |
| Single Male/Father | 20 (1.8%) | 5.25 |
| Single Female/Mother | 179 (15.7%) | 3.40 |
| Non-family | 366 (32.1%) | 1.18 |
| Total Households | 1,141 (100.0%) | 2.61 |
Household Size by Marriage Status in Cache
Out of a total of 1,141 households in Cache, 775 (67.9%) are family households, while 366 (32.1%) are nonfamily households. The most numerous type of family households are 2-person households, comprising 312, and the most common type of nonfamily households are 1-person households, comprising 309.
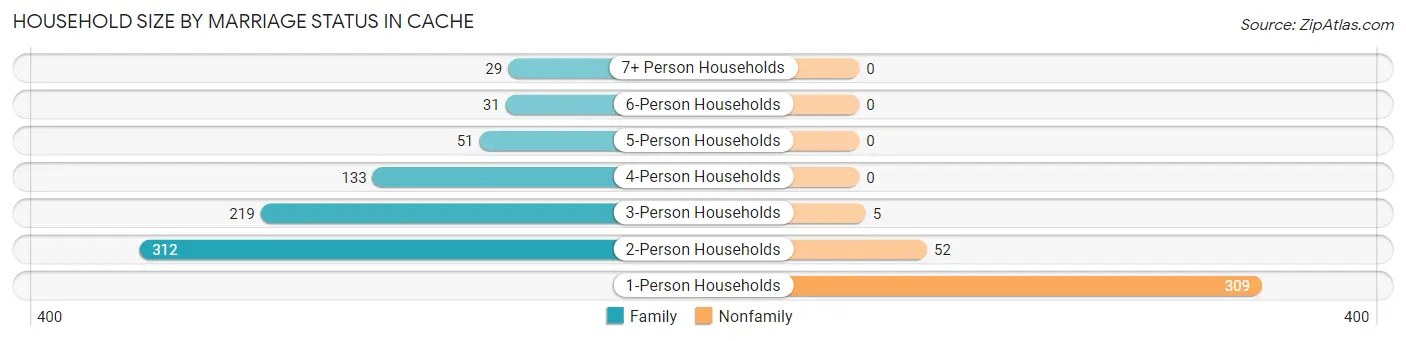
| Household Size | Family Households | Nonfamily Households |
| 1-Person Households | - | 309 (27.1%) |
| 2-Person Households | 312 (27.3%) | 52 (4.6%) |
| 3-Person Households | 219 (19.2%) | 5 (0.4%) |
| 4-Person Households | 133 (11.7%) | 0 (0.0%) |
| 5-Person Households | 51 (4.5%) | 0 (0.0%) |
| 6-Person Households | 31 (2.7%) | 0 (0.0%) |
| 7+ Person Households | 29 (2.5%) | 0 (0.0%) |
| Total | 775 (67.9%) | 366 (32.1%) |
Female Fertility in Cache
Fertility by Age in Cache
Average fertility rate in Cache is 45.0 births per 1,000 women. Women in the age bracket of 20 to 34 years have the highest fertility rate with 71.0 births per 1,000 women. Women in the age bracket of 20 to 34 years acount for 64.7% of all women with births.
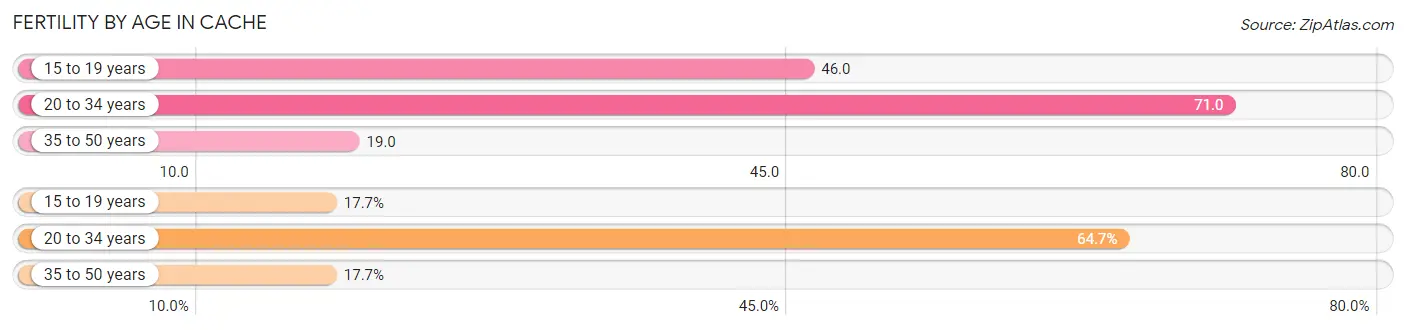
| Age Bracket | Women with Births | Births / 1,000 Women |
| 15 to 19 years | 6 (17.6%) | 46.0 |
| 20 to 34 years | 22 (64.7%) | 71.0 |
| 35 to 50 years | 6 (17.6%) | 19.0 |
| Total | 34 (100.0%) | 45.0 |
Fertility by Age by Marriage Status in Cache
50.0% of women with births (34) in Cache are married. The highest percentage of unmarried women with births falls into 35 to 50 years age bracket with 100.0% of them unmarried at the time of birth, while the lowest percentage of unmarried women with births belong to 15 to 19 years age bracket with 0.0% of them unmarried.
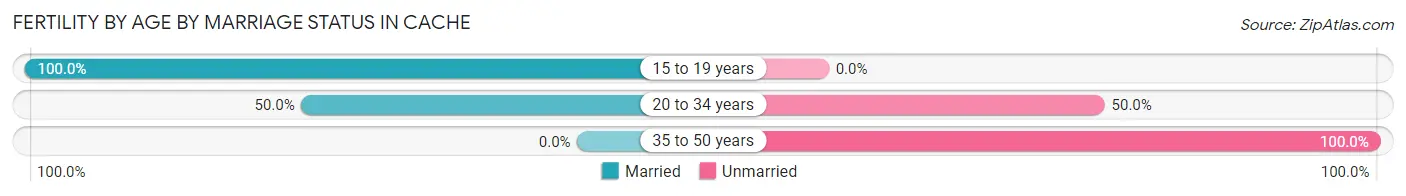
| Age Bracket | Married | Unmarried |
| 15 to 19 years | 6 (100.0%) | 0 (0.0%) |
| 20 to 34 years | 11 (50.0%) | 11 (50.0%) |
| 35 to 50 years | 0 (0.0%) | 6 (100.0%) |
| Total | 17 (50.0%) | 17 (50.0%) |
Fertility by Education in Cache
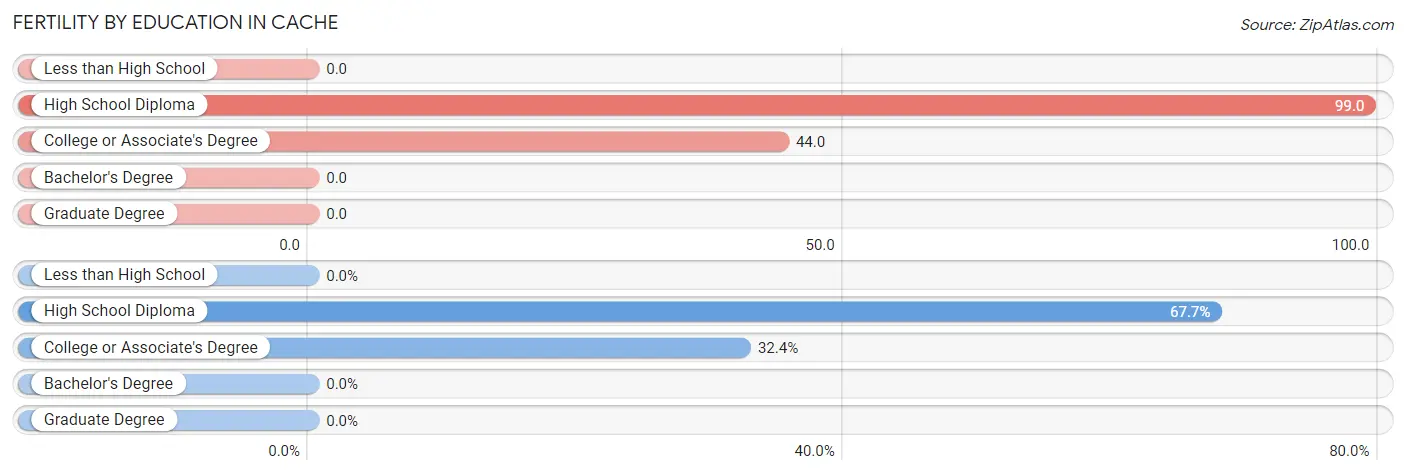
| Educational Attainment | Women with Births | Births / 1,000 Women |
| Less than High School | 0 (0.0%) | 0.0 |
| High School Diploma | 23 (67.6%) | 99.0 |
| College or Associate's Degree | 11 (32.4%) | 44.0 |
| Bachelor's Degree | 0 (0.0%) | 0.0 |
| Graduate Degree | 0 (0.0%) | 0.0 |
| Total | 34 (100.0%) | 45.0 |
Fertility by Education by Marriage Status in Cache
50.0% of women with births in Cache are unmarried. Women with the educational attainment of college or associate's degree are most likely to be married with 100.0% of them married at childbirth, while women with the educational attainment of high school diploma are least likely to be married with 73.9% of them unmarried at childbirth.
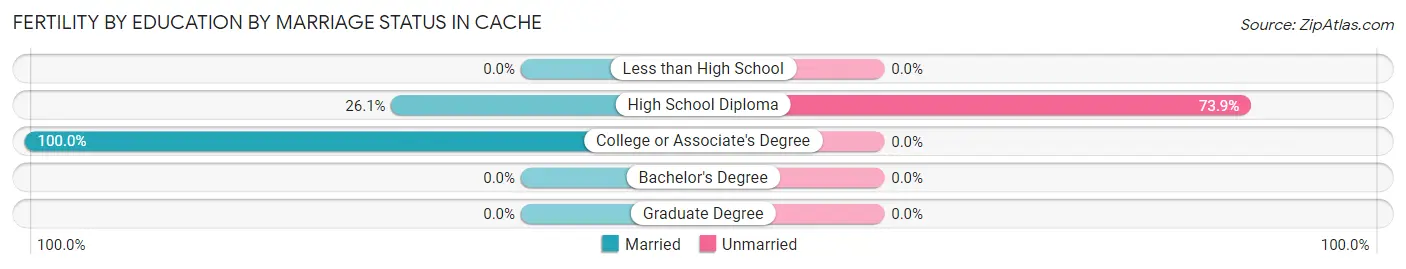
| Educational Attainment | Married | Unmarried |
| Less than High School | 0 (0.0%) | 0 (0.0%) |
| High School Diploma | 6 (26.1%) | 17 (73.9%) |
| College or Associate's Degree | 11 (100.0%) | 0 (0.0%) |
| Bachelor's Degree | 0 (0.0%) | 0 (0.0%) |
| Graduate Degree | 0 (0.0%) | 0 (0.0%) |
| Total | 17 (50.0%) | 17 (50.0%) |
Employment Characteristics in Cache
Employment by Class of Employer in Cache
Among the 1,266 employed individuals in Cache, private company employees (730 | 57.7%), local government employees (171 | 13.5%), and federal government employees (103 | 8.1%) make up the most common classes of employment.
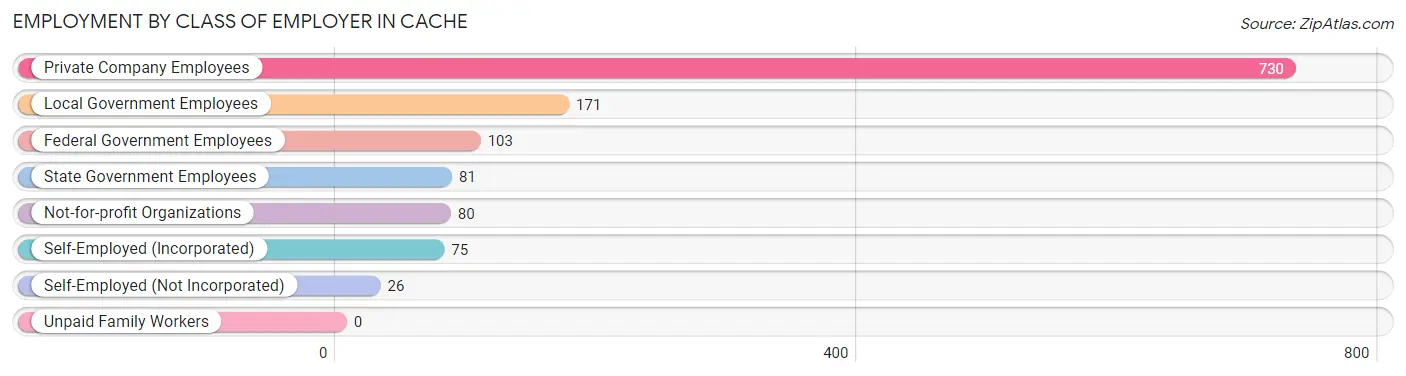
| Employer Class | # Employees | % Employees |
| Private Company Employees | 730 | 57.7% |
| Self-Employed (Incorporated) | 75 | 5.9% |
| Self-Employed (Not Incorporated) | 26 | 2.1% |
| Not-for-profit Organizations | 80 | 6.3% |
| Local Government Employees | 171 | 13.5% |
| State Government Employees | 81 | 6.4% |
| Federal Government Employees | 103 | 8.1% |
| Unpaid Family Workers | 0 | 0.0% |
| Total | 1,266 | 100.0% |
Employment Status by Age in Cache
According to the labor force statistics for Cache, out of the total population over 16 years of age (2,294), 59.9% or 1,374 individuals are in the labor force, with 6.1% or 84 of them unemployed. The age group with the highest labor force participation rate is 55 to 59 years, with 86.3% or 151 individuals in the labor force. Within the labor force, the 60 to 64 years age range has the highest percentage of unemployed individuals, with 22.4% or 32 of them being unemployed.
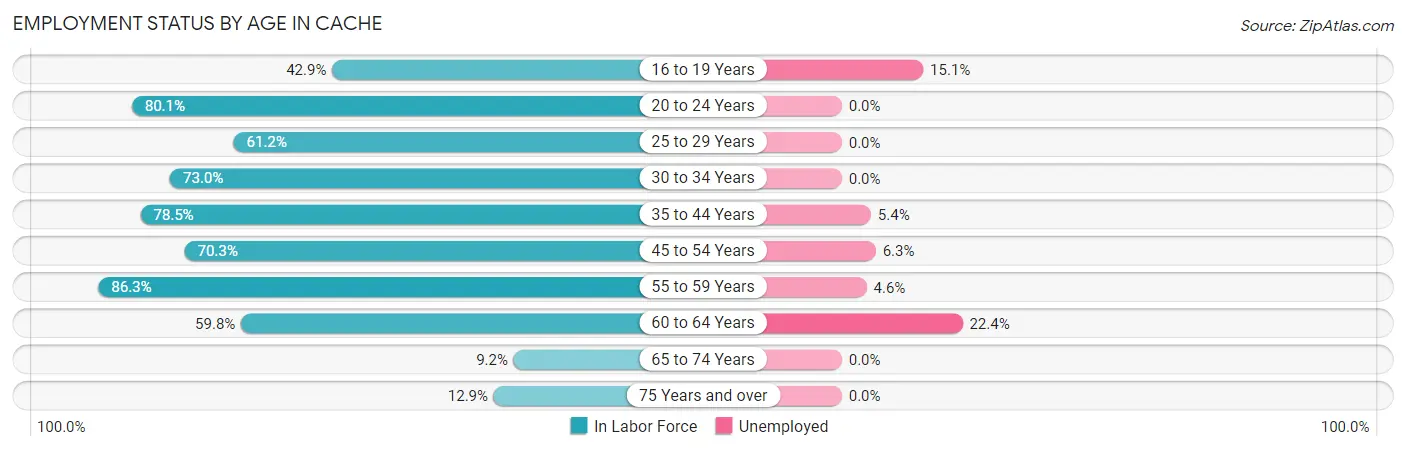
| Age Bracket | In Labor Force | Unemployed |
| 16 to 19 Years | 73 (42.9%) | 11 (15.1%) |
| 20 to 24 Years | 109 (80.1%) | 0 (0.0%) |
| 25 to 29 Years | 115 (61.2%) | 0 (0.0%) |
| 30 to 34 Years | 173 (73.0%) | 0 (0.0%) |
| 35 to 44 Years | 343 (78.5%) | 19 (5.4%) |
| 45 to 54 Years | 223 (70.3%) | 14 (6.3%) |
| 55 to 59 Years | 151 (86.3%) | 7 (4.6%) |
| 60 to 64 Years | 143 (59.8%) | 32 (22.4%) |
| 65 to 74 Years | 20 (9.2%) | 0 (0.0%) |
| 75 Years and over | 23 (12.9%) | 0 (0.0%) |
| Total | 1,374 (59.9%) | 84 (6.1%) |
Employment Status by Educational Attainment in Cache
According to labor force statistics for Cache, 72.1% of individuals (1,149) out of the total population between 25 and 64 years of age (1,593) are in the labor force, with 6.3% or 72 of them being unemployed. The group with the highest labor force participation rate are those with the educational attainment of bachelor's degree or higher, with 89.2% or 296 individuals in the labor force. Within the labor force, individuals with high school diploma education have the highest percentage of unemployment, with 18.1% or 68 of them being unemployed.
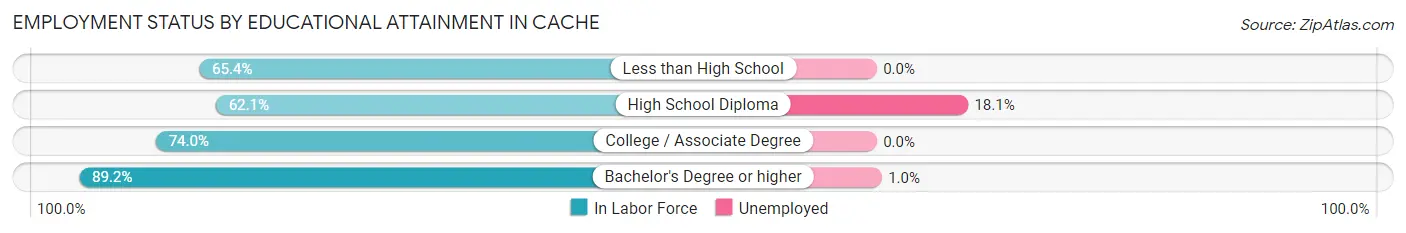
| Educational Attainment | In Labor Force | Unemployed |
| Less than High School | 70 (65.4%) | 0 (0.0%) |
| High School Diploma | 375 (62.1%) | 109 (18.1%) |
| College / Associate Degree | 407 (74.0%) | 0 (0.0%) |
| Bachelor's Degree or higher | 296 (89.2%) | 3 (1.0%) |
| Total | 1,149 (72.1%) | 100 (6.3%) |
Employment Occupations by Sex in Cache
Management, Business, Science and Arts Occupations
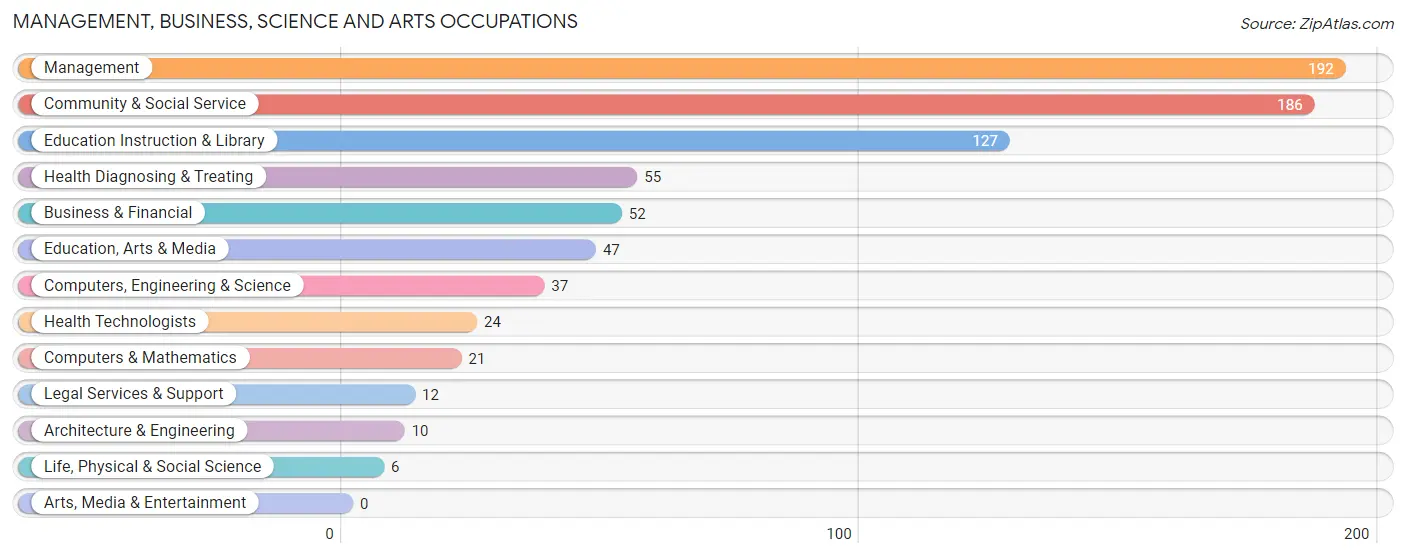
The most common Management, Business, Science and Arts occupations in Cache are Management (192 | 15.2%), Community & Social Service (186 | 14.7%), Education Instruction & Library (127 | 10.0%), Health Diagnosing & Treating (55 | 4.3%), and Business & Financial (52 | 4.1%).
Management, Business, Science and Arts Occupations by Sex
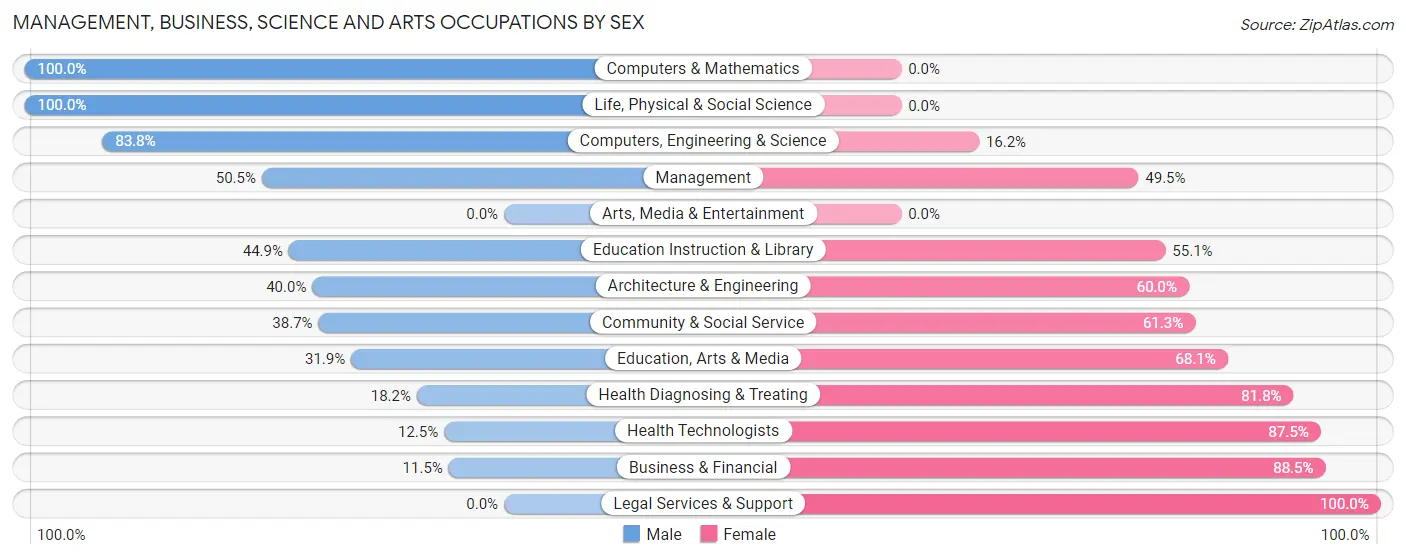
Within the Management, Business, Science and Arts occupations in Cache, the most male-oriented occupations are Computers & Mathematics (100.0%), Life, Physical & Social Science (100.0%), and Computers, Engineering & Science (83.8%), while the most female-oriented occupations are Legal Services & Support (100.0%), Business & Financial (88.5%), and Health Technologists (87.5%).
| Occupation | Male | Female |
| Management | 97 (50.5%) | 95 (49.5%) |
| Business & Financial | 6 (11.5%) | 46 (88.5%) |
| Computers, Engineering & Science | 31 (83.8%) | 6 (16.2%) |
| Computers & Mathematics | 21 (100.0%) | 0 (0.0%) |
| Architecture & Engineering | 4 (40.0%) | 6 (60.0%) |
| Life, Physical & Social Science | 6 (100.0%) | 0 (0.0%) |
| Community & Social Service | 72 (38.7%) | 114 (61.3%) |
| Education, Arts & Media | 15 (31.9%) | 32 (68.1%) |
| Legal Services & Support | 0 (0.0%) | 12 (100.0%) |
| Education Instruction & Library | 57 (44.9%) | 70 (55.1%) |
| Arts, Media & Entertainment | 0 (0.0%) | 0 (0.0%) |
| Health Diagnosing & Treating | 10 (18.2%) | 45 (81.8%) |
| Health Technologists | 3 (12.5%) | 21 (87.5%) |
| Total (Category) | 216 (41.4%) | 306 (58.6%) |
| Total (Overall) | 639 (50.5%) | 627 (49.5%) |
Services Occupations
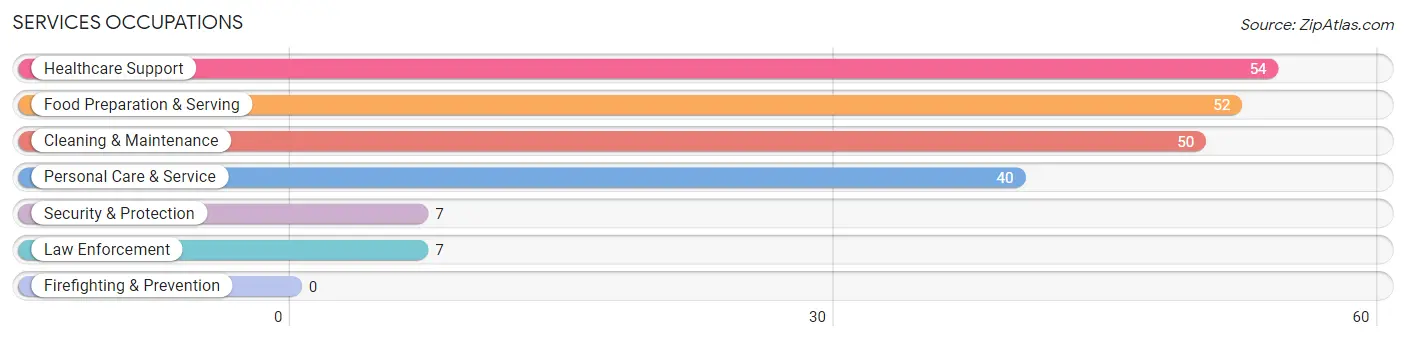
The most common Services occupations in Cache are Healthcare Support (54 | 4.3%), Food Preparation & Serving (52 | 4.1%), Cleaning & Maintenance (50 | 4.0%), Personal Care & Service (40 | 3.2%), and Security & Protection (7 | 0.5%).
Services Occupations by Sex
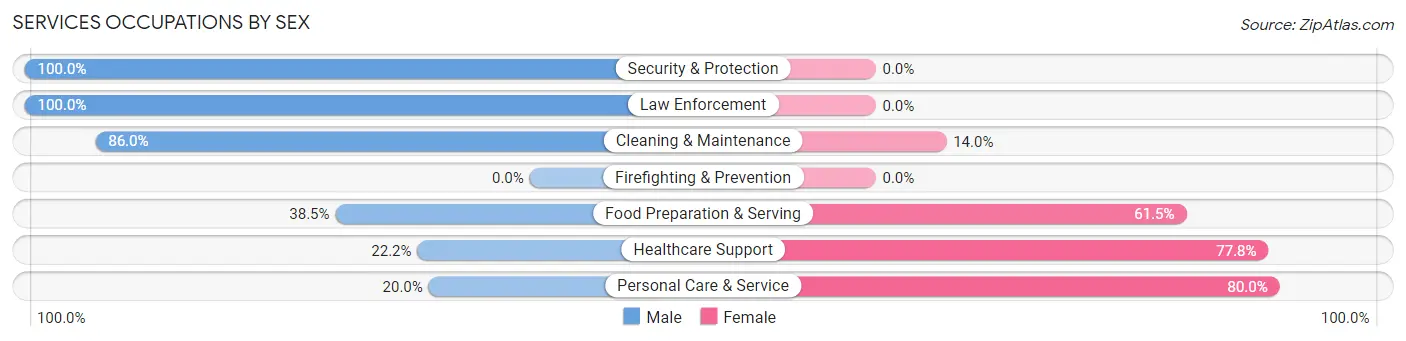
Within the Services occupations in Cache, the most male-oriented occupations are Security & Protection (100.0%), Law Enforcement (100.0%), and Cleaning & Maintenance (86.0%), while the most female-oriented occupations are Personal Care & Service (80.0%), Healthcare Support (77.8%), and Food Preparation & Serving (61.5%).
| Occupation | Male | Female |
| Healthcare Support | 12 (22.2%) | 42 (77.8%) |
| Security & Protection | 7 (100.0%) | 0 (0.0%) |
| Firefighting & Prevention | 0 (0.0%) | 0 (0.0%) |
| Law Enforcement | 7 (100.0%) | 0 (0.0%) |
| Food Preparation & Serving | 20 (38.5%) | 32 (61.5%) |
| Cleaning & Maintenance | 43 (86.0%) | 7 (14.0%) |
| Personal Care & Service | 8 (20.0%) | 32 (80.0%) |
| Total (Category) | 90 (44.3%) | 113 (55.7%) |
| Total (Overall) | 639 (50.5%) | 627 (49.5%) |
Sales and Office Occupations
The most common Sales and Office occupations in Cache are Office & Administration (165 | 13.0%), and Sales & Related (67 | 5.3%).
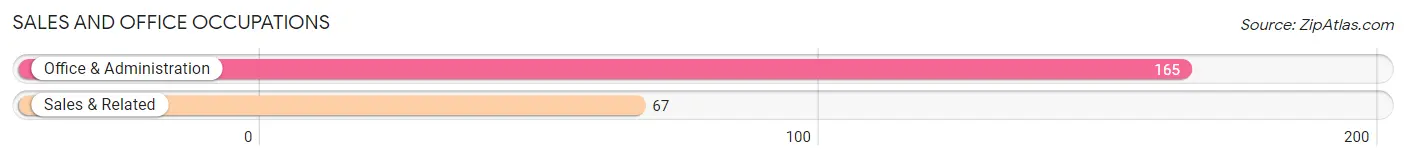
Sales and Office Occupations by Sex

| Occupation | Male | Female |
| Sales & Related | 36 (53.7%) | 31 (46.3%) |
| Office & Administration | 20 (12.1%) | 145 (87.9%) |
| Total (Category) | 56 (24.1%) | 176 (75.9%) |
| Total (Overall) | 639 (50.5%) | 627 (49.5%) |
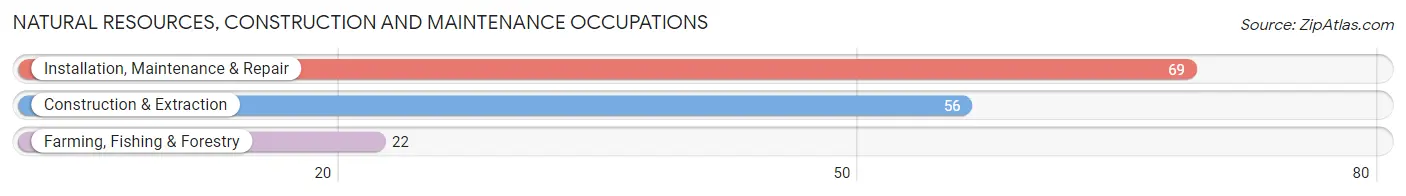
Natural Resources, Construction and Maintenance Occupations
The most common Natural Resources, Construction and Maintenance occupations in Cache are Installation, Maintenance & Repair (69 | 5.4%), Construction & Extraction (56 | 4.4%), and Farming, Fishing & Forestry (22 | 1.7%).
Natural Resources, Construction and Maintenance Occupations by Sex
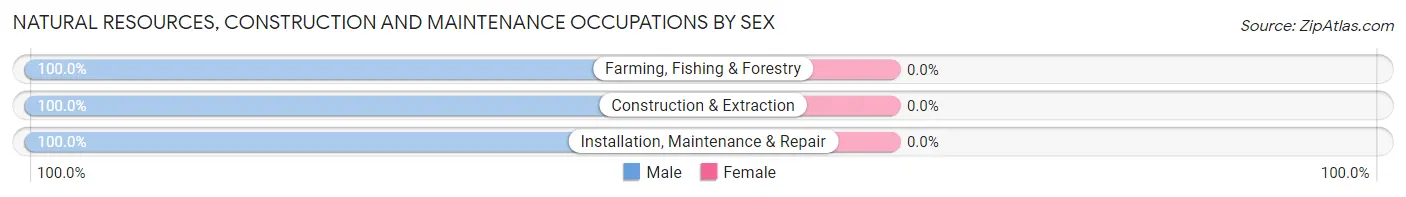
| Occupation | Male | Female |
| Farming, Fishing & Forestry | 22 (100.0%) | 0 (0.0%) |
| Construction & Extraction | 56 (100.0%) | 0 (0.0%) |
| Installation, Maintenance & Repair | 69 (100.0%) | 0 (0.0%) |
| Total (Category) | 147 (100.0%) | 0 (0.0%) |
| Total (Overall) | 639 (50.5%) | 627 (49.5%) |
Production, Transportation and Moving Occupations
The most common Production, Transportation and Moving occupations in Cache are Production (79 | 6.2%), Transportation (70 | 5.5%), and Material Moving (13 | 1.0%).
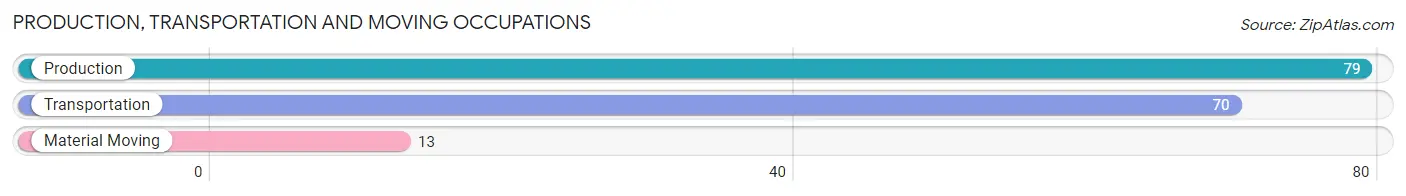
Production, Transportation and Moving Occupations by Sex
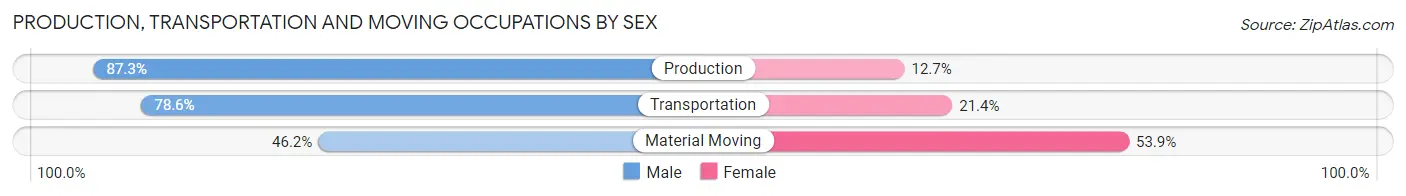
| Occupation | Male | Female |
| Production | 69 (87.3%) | 10 (12.7%) |
| Transportation | 55 (78.6%) | 15 (21.4%) |
| Material Moving | 6 (46.2%) | 7 (53.8%) |
| Total (Category) | 130 (80.2%) | 32 (19.8%) |
| Total (Overall) | 639 (50.5%) | 627 (49.5%) |
Employment Industries by Sex in Cache
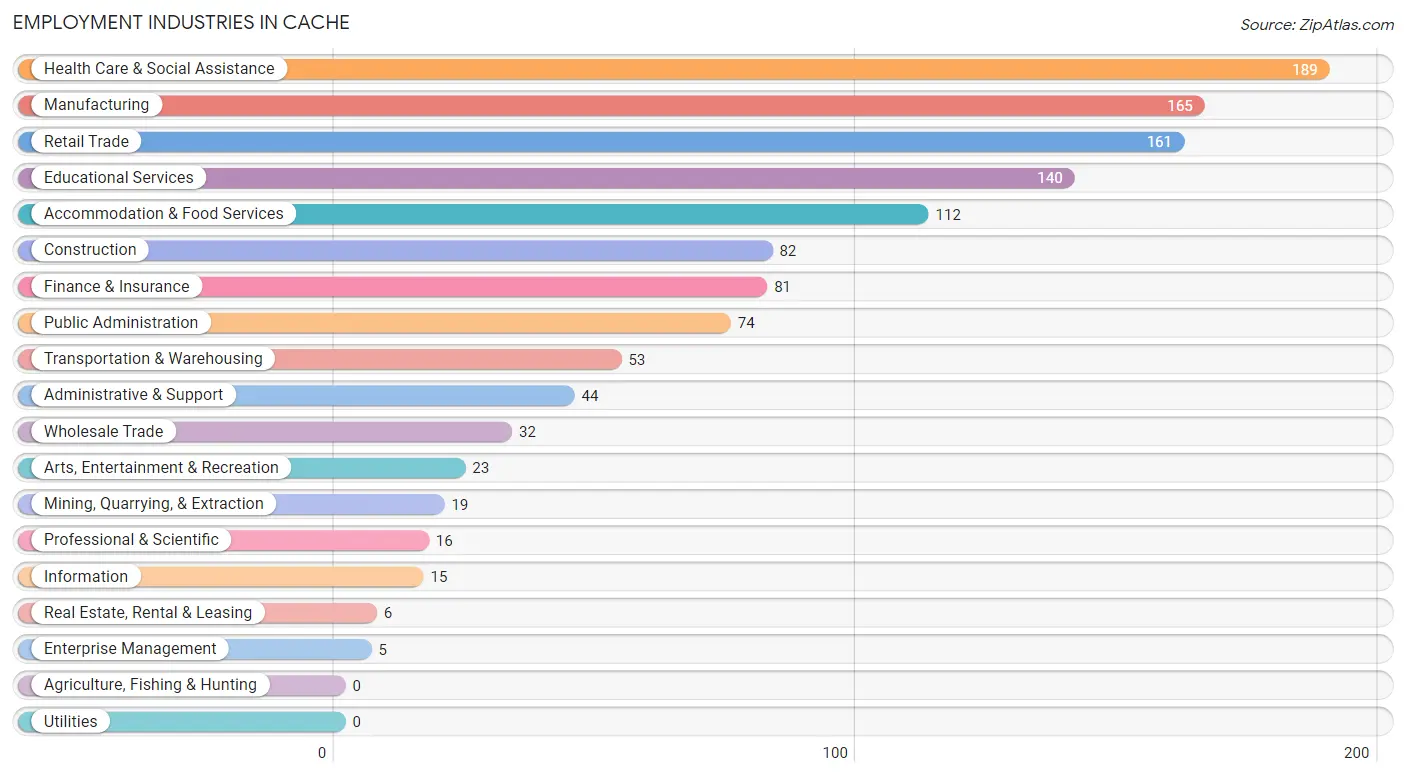
Employment Industries in Cache
The major employment industries in Cache include Health Care & Social Assistance (189 | 14.9%), Manufacturing (165 | 13.0%), Retail Trade (161 | 12.7%), Educational Services (140 | 11.1%), and Accommodation & Food Services (112 | 8.8%).
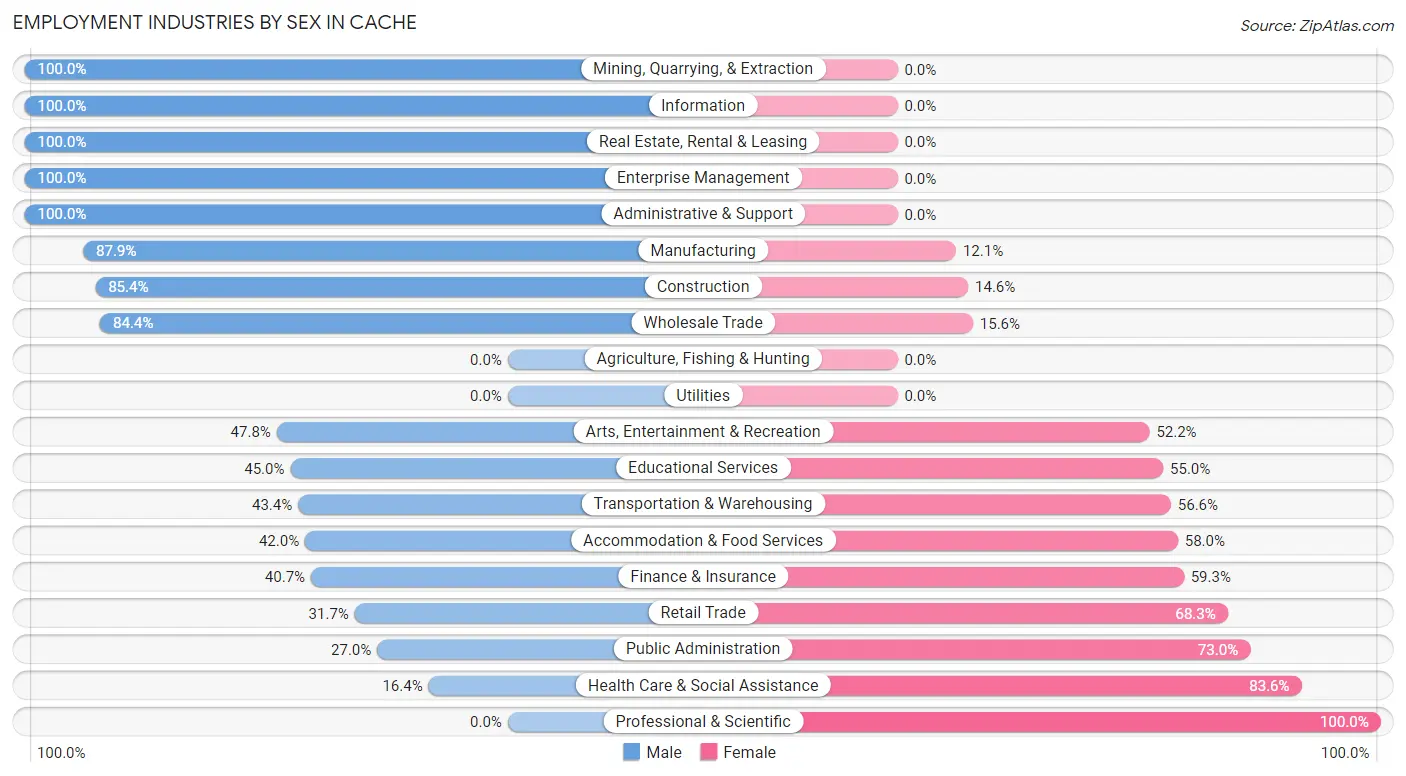
Employment Industries by Sex in Cache
The Cache industries that see more men than women are Mining, Quarrying, & Extraction (100.0%), Information (100.0%), and Real Estate, Rental & Leasing (100.0%), whereas the industries that tend to have a higher number of women are Professional & Scientific (100.0%), Health Care & Social Assistance (83.6%), and Public Administration (73.0%).
| Industry | Male | Female |
| Agriculture, Fishing & Hunting | 0 (0.0%) | 0 (0.0%) |
| Mining, Quarrying, & Extraction | 19 (100.0%) | 0 (0.0%) |
| Construction | 70 (85.4%) | 12 (14.6%) |
| Manufacturing | 145 (87.9%) | 20 (12.1%) |
| Wholesale Trade | 27 (84.4%) | 5 (15.6%) |
| Retail Trade | 51 (31.7%) | 110 (68.3%) |
| Transportation & Warehousing | 23 (43.4%) | 30 (56.6%) |
| Utilities | 0 (0.0%) | 0 (0.0%) |
| Information | 15 (100.0%) | 0 (0.0%) |
| Finance & Insurance | 33 (40.7%) | 48 (59.3%) |
| Real Estate, Rental & Leasing | 6 (100.0%) | 0 (0.0%) |
| Professional & Scientific | 0 (0.0%) | 16 (100.0%) |
| Enterprise Management | 5 (100.0%) | 0 (0.0%) |
| Administrative & Support | 44 (100.0%) | 0 (0.0%) |
| Educational Services | 63 (45.0%) | 77 (55.0%) |
| Health Care & Social Assistance | 31 (16.4%) | 158 (83.6%) |
| Arts, Entertainment & Recreation | 11 (47.8%) | 12 (52.2%) |
| Accommodation & Food Services | 47 (42.0%) | 65 (58.0%) |
| Public Administration | 20 (27.0%) | 54 (73.0%) |
| Total | 639 (50.5%) | 627 (49.5%) |
Education in Cache
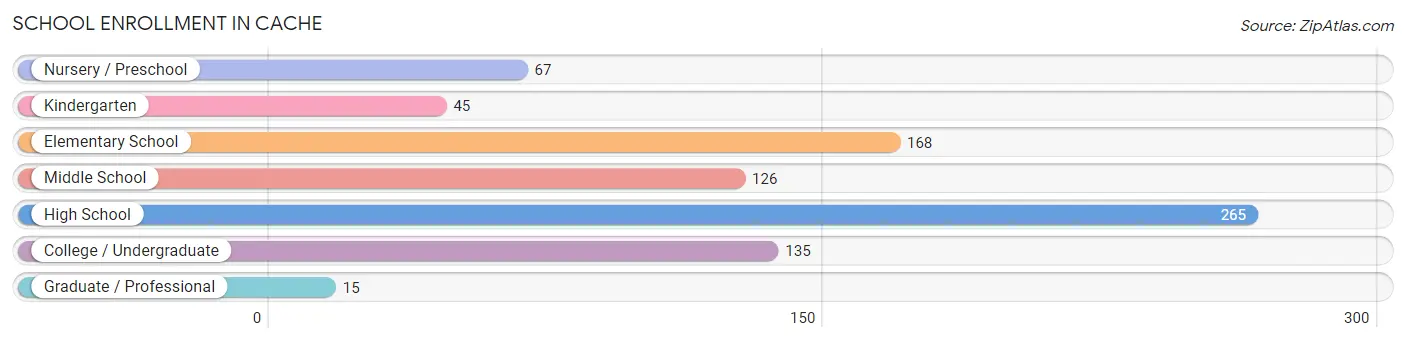
School Enrollment in Cache
The most common levels of schooling among the 821 students in Cache are high school (265 | 32.3%), elementary school (168 | 20.5%), and college / undergraduate (135 | 16.4%).
| School Level | # Students | % Students |
| Nursery / Preschool | 67 | 8.2% |
| Kindergarten | 45 | 5.5% |
| Elementary School | 168 | 20.5% |
| Middle School | 126 | 15.3% |
| High School | 265 | 32.3% |
| College / Undergraduate | 135 | 16.4% |
| Graduate / Professional | 15 | 1.8% |
| Total | 821 | 100.0% |
School Enrollment by Age by Funding Source in Cache
Out of a total of 821 students who are enrolled in schools in Cache, 67 (8.2%) attend a private institution, while the remaining 754 (91.8%) are enrolled in public schools. The age group of 5 to 9 year old has the highest likelihood of being enrolled in private schools, with 36 (19.2% in the age bracket) enrolled. Conversely, the age group of 15 to 17 year olds has the lowest likelihood of being enrolled in a private school, with 174 (100.0% in the age bracket) attending a public institution.
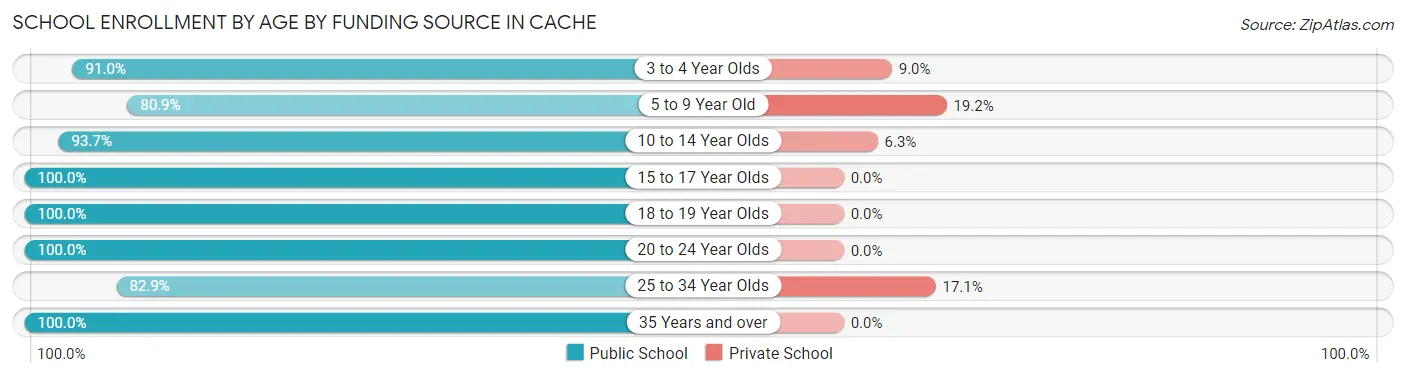
| Age Bracket | Public School | Private School |
| 3 to 4 Year Olds | 61 (91.0%) | 6 (9.0%) |
| 5 to 9 Year Old | 152 (80.8%) | 36 (19.2%) |
| 10 to 14 Year Olds | 178 (93.7%) | 12 (6.3%) |
| 15 to 17 Year Olds | 174 (100.0%) | 0 (0.0%) |
| 18 to 19 Year Olds | 58 (100.0%) | 0 (0.0%) |
| 20 to 24 Year Olds | 26 (100.0%) | 0 (0.0%) |
| 25 to 34 Year Olds | 63 (82.9%) | 13 (17.1%) |
| 35 Years and over | 42 (100.0%) | 0 (0.0%) |
| Total | 754 (91.8%) | 67 (8.2%) |
Educational Attainment by Field of Study in Cache
Education (139 | 29.8%), business (84 | 18.0%), arts & humanities (55 | 11.8%), science & technology (47 | 10.1%), and psychology (27 | 5.8%) are the most common fields of study among 466 individuals in Cache who have obtained a bachelor's degree or higher.
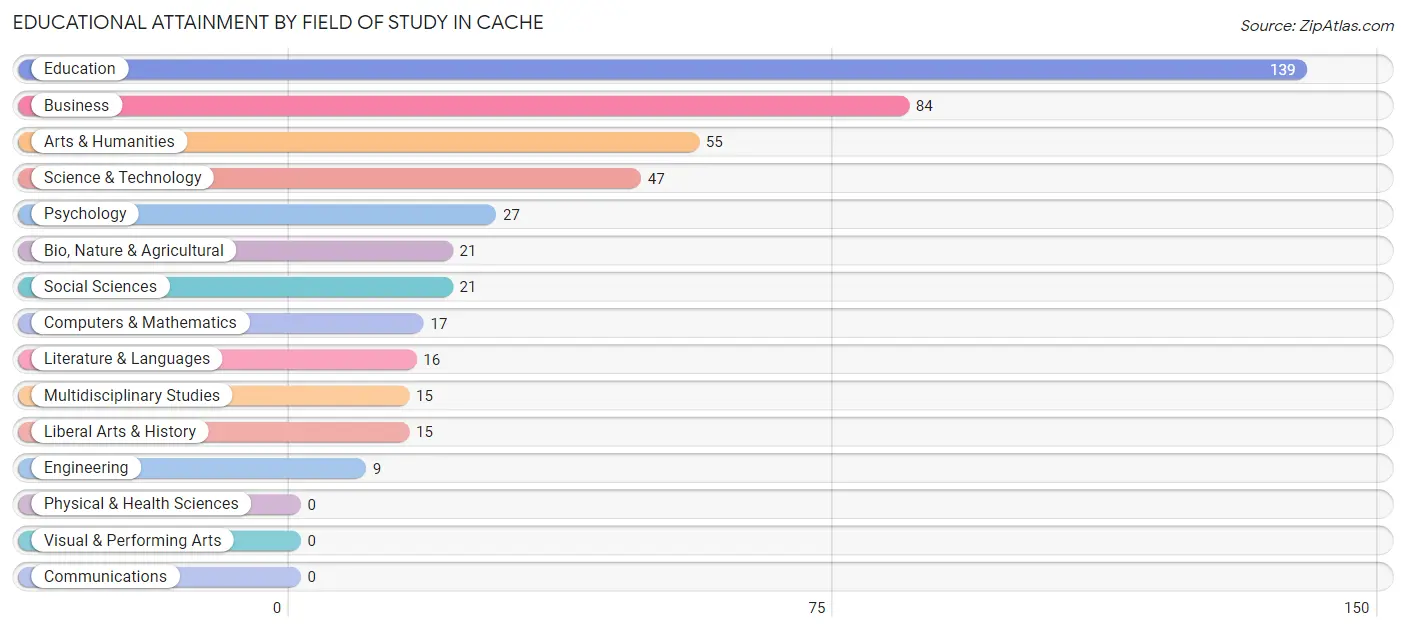
| Field of Study | # Graduates | % Graduates |
| Computers & Mathematics | 17 | 3.6% |
| Bio, Nature & Agricultural | 21 | 4.5% |
| Physical & Health Sciences | 0 | 0.0% |
| Psychology | 27 | 5.8% |
| Social Sciences | 21 | 4.5% |
| Engineering | 9 | 1.9% |
| Multidisciplinary Studies | 15 | 3.2% |
| Science & Technology | 47 | 10.1% |
| Business | 84 | 18.0% |
| Education | 139 | 29.8% |
| Literature & Languages | 16 | 3.4% |
| Liberal Arts & History | 15 | 3.2% |
| Visual & Performing Arts | 0 | 0.0% |
| Communications | 0 | 0.0% |
| Arts & Humanities | 55 | 11.8% |
| Total | 466 | 100.0% |
Transportation & Commute in Cache
Vehicle Availability by Sex in Cache
The most prevalent vehicle ownership categories in Cache are males with 2 vehicles (283, accounting for 43.9%) and females with 2 vehicles (248, making up 45.5%).
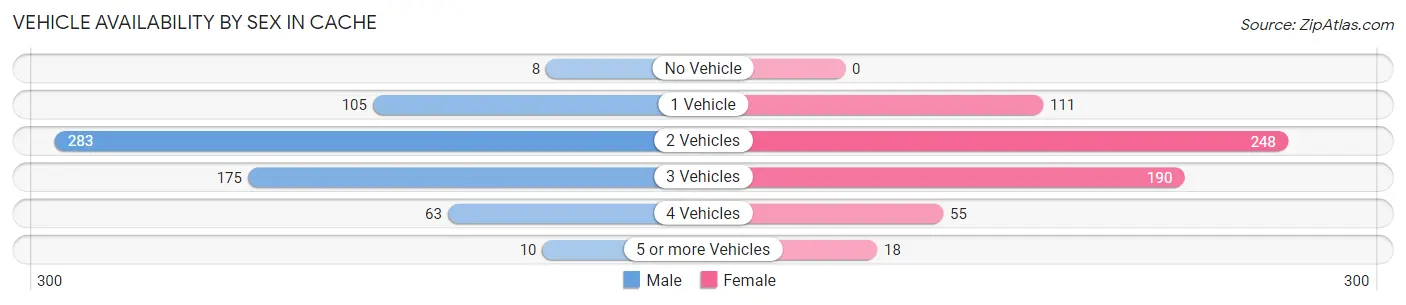
| Vehicles Available | Male | Female |
| No Vehicle | 8 (1.2%) | 0 (0.0%) |
| 1 Vehicle | 105 (16.3%) | 111 (17.8%) |
| 2 Vehicles | 283 (43.9%) | 248 (39.9%) |
| 3 Vehicles | 175 (27.2%) | 190 (30.5%) |
| 4 Vehicles | 63 (9.8%) | 55 (8.8%) |
| 5 or more Vehicles | 10 (1.5%) | 18 (2.9%) |
| Total | 644 (100.0%) | 622 (100.0%) |
Commute Time in Cache
The most frequently occuring commute durations in Cache are 20 to 24 minutes (275 commuters, 23.1%), 15 to 19 minutes (187 commuters, 15.7%), and 30 to 34 minutes (183 commuters, 15.3%).
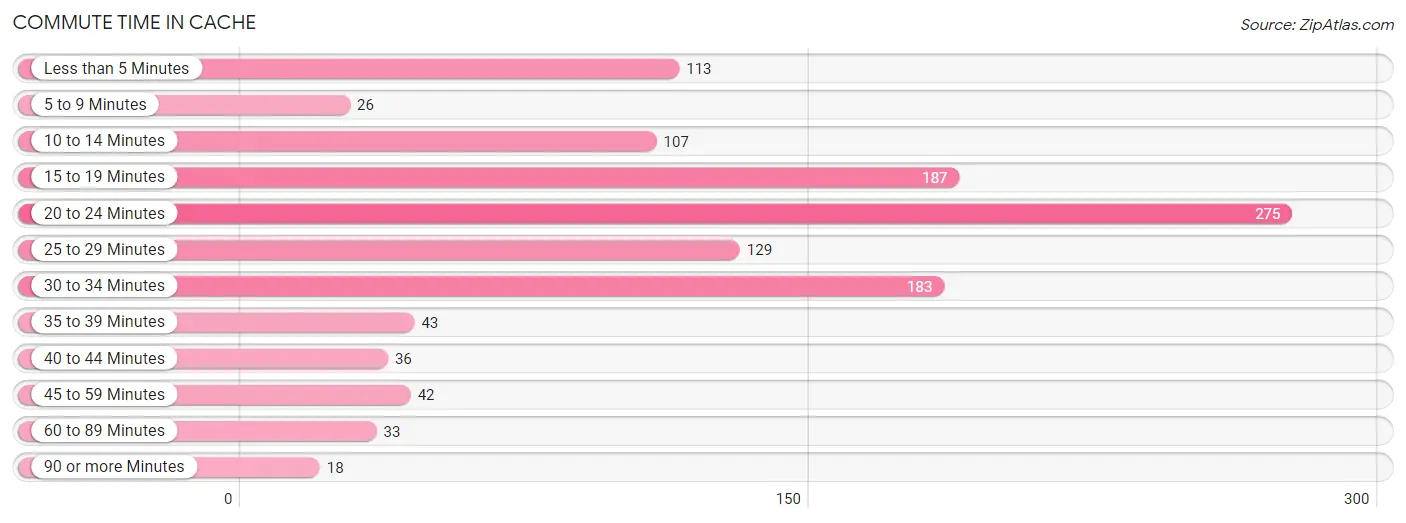
| Commute Time | # Commuters | % Commuters |
| Less than 5 Minutes | 113 | 9.5% |
| 5 to 9 Minutes | 26 | 2.2% |
| 10 to 14 Minutes | 107 | 9.0% |
| 15 to 19 Minutes | 187 | 15.7% |
| 20 to 24 Minutes | 275 | 23.1% |
| 25 to 29 Minutes | 129 | 10.8% |
| 30 to 34 Minutes | 183 | 15.3% |
| 35 to 39 Minutes | 43 | 3.6% |
| 40 to 44 Minutes | 36 | 3.0% |
| 45 to 59 Minutes | 42 | 3.5% |
| 60 to 89 Minutes | 33 | 2.8% |
| 90 or more Minutes | 18 | 1.5% |
Commute Time by Sex in Cache
The most common commute times in Cache are 20 to 24 minutes (155 commuters, 25.1%) for males and 20 to 24 minutes (120 commuters, 20.9%) for females.
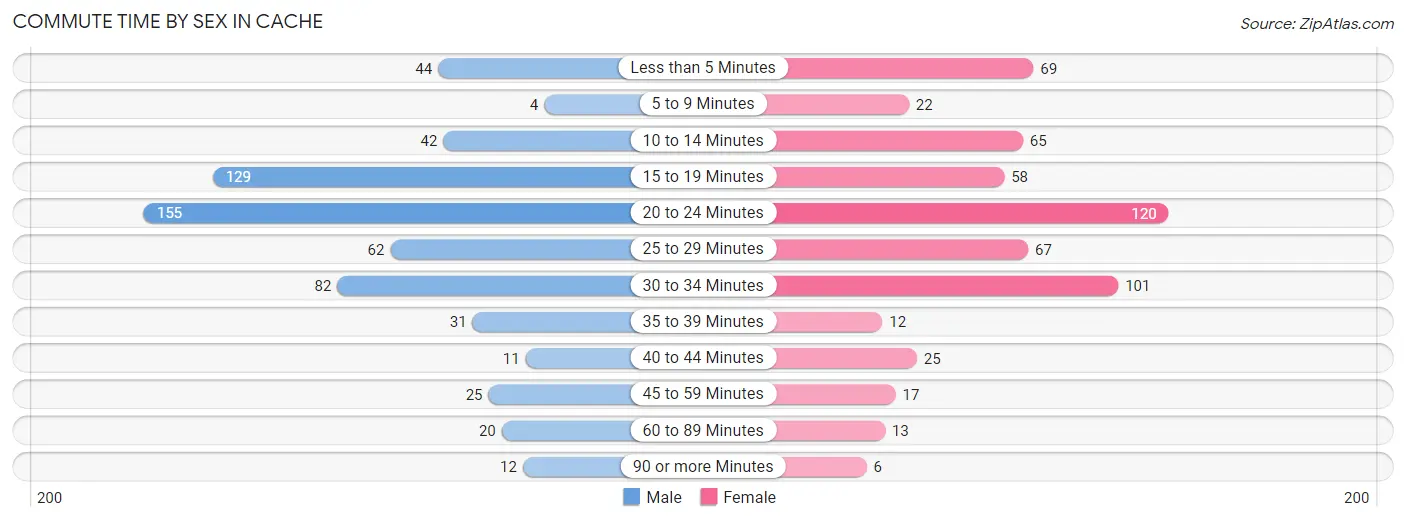
| Commute Time | Male | Female |
| Less than 5 Minutes | 44 (7.1%) | 69 (12.0%) |
| 5 to 9 Minutes | 4 (0.6%) | 22 (3.8%) |
| 10 to 14 Minutes | 42 (6.8%) | 65 (11.3%) |
| 15 to 19 Minutes | 129 (20.9%) | 58 (10.1%) |
| 20 to 24 Minutes | 155 (25.1%) | 120 (20.9%) |
| 25 to 29 Minutes | 62 (10.1%) | 67 (11.7%) |
| 30 to 34 Minutes | 82 (13.3%) | 101 (17.6%) |
| 35 to 39 Minutes | 31 (5.0%) | 12 (2.1%) |
| 40 to 44 Minutes | 11 (1.8%) | 25 (4.3%) |
| 45 to 59 Minutes | 25 (4.1%) | 17 (3.0%) |
| 60 to 89 Minutes | 20 (3.2%) | 13 (2.3%) |
| 90 or more Minutes | 12 (1.9%) | 6 (1.0%) |
Time of Departure to Work by Sex in Cache
The most frequent times of departure to work in Cache are 7:00 AM to 7:29 AM (167, 27.1%) for males and 7:30 AM to 7:59 AM (117, 20.3%) for females.
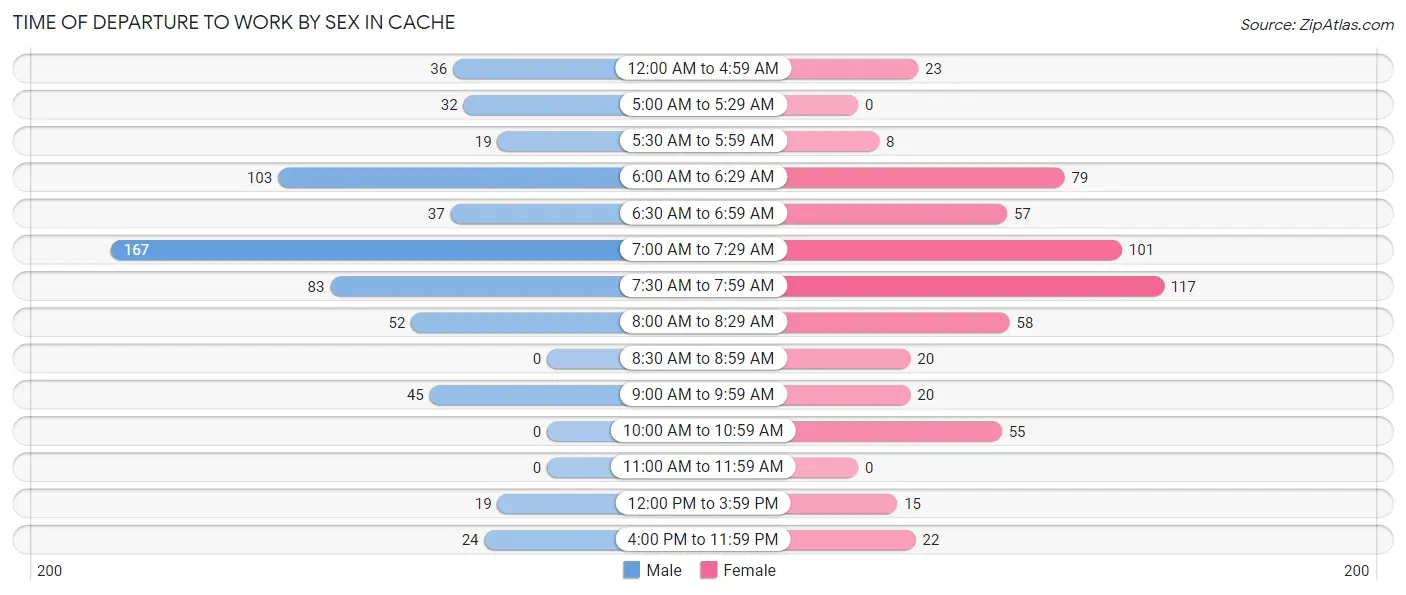
| Time of Departure | Male | Female |
| 12:00 AM to 4:59 AM | 36 (5.8%) | 23 (4.0%) |
| 5:00 AM to 5:29 AM | 32 (5.2%) | 0 (0.0%) |
| 5:30 AM to 5:59 AM | 19 (3.1%) | 8 (1.4%) |
| 6:00 AM to 6:29 AM | 103 (16.7%) | 79 (13.7%) |
| 6:30 AM to 6:59 AM | 37 (6.0%) | 57 (9.9%) |
| 7:00 AM to 7:29 AM | 167 (27.1%) | 101 (17.6%) |
| 7:30 AM to 7:59 AM | 83 (13.5%) | 117 (20.3%) |
| 8:00 AM to 8:29 AM | 52 (8.4%) | 58 (10.1%) |
| 8:30 AM to 8:59 AM | 0 (0.0%) | 20 (3.5%) |
| 9:00 AM to 9:59 AM | 45 (7.3%) | 20 (3.5%) |
| 10:00 AM to 10:59 AM | 0 (0.0%) | 55 (9.6%) |
| 11:00 AM to 11:59 AM | 0 (0.0%) | 0 (0.0%) |
| 12:00 PM to 3:59 PM | 19 (3.1%) | 15 (2.6%) |
| 4:00 PM to 11:59 PM | 24 (3.9%) | 22 (3.8%) |
| Total | 617 (100.0%) | 575 (100.0%) |
Housing Occupancy in Cache
Occupancy by Ownership in Cache
Of the total 1,141 dwellings in Cache, owner-occupied units account for 823 (72.1%), while renter-occupied units make up 318 (27.9%).
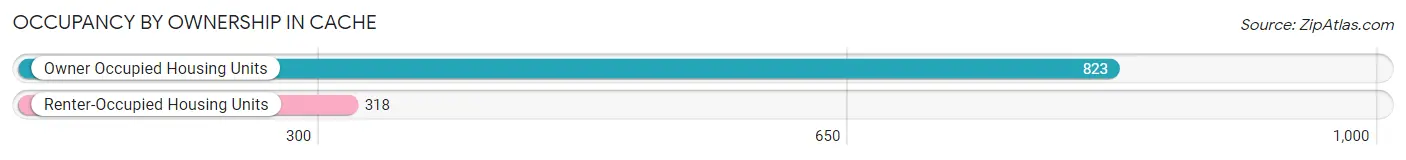
| Occupancy | # Housing Units | % Housing Units |
| Owner Occupied Housing Units | 823 | 72.1% |
| Renter-Occupied Housing Units | 318 | 27.9% |
| Total Occupied Housing Units | 1,141 | 100.0% |
Occupancy by Household Size in Cache
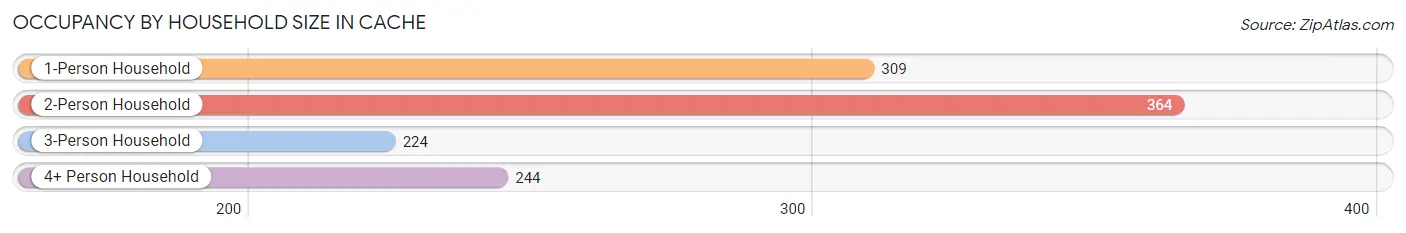
| Household Size | # Housing Units | % Housing Units |
| 1-Person Household | 309 | 27.1% |
| 2-Person Household | 364 | 31.9% |
| 3-Person Household | 224 | 19.6% |
| 4+ Person Household | 244 | 21.4% |
| Total Housing Units | 1,141 | 100.0% |
Occupancy by Ownership by Household Size in Cache
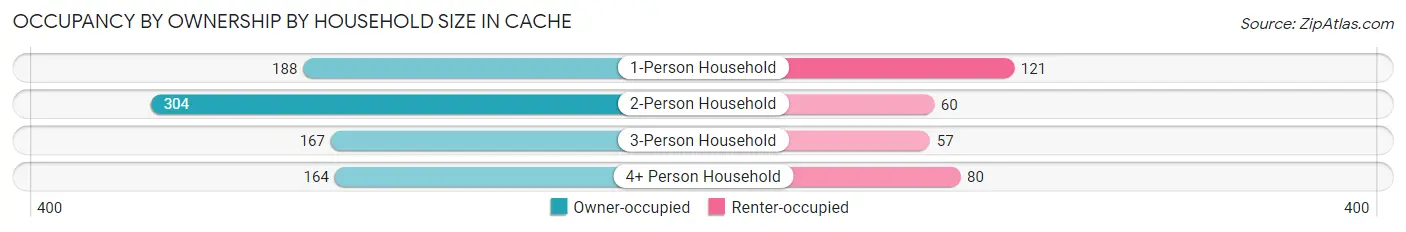
| Household Size | Owner-occupied | Renter-occupied |
| 1-Person Household | 188 (60.8%) | 121 (39.2%) |
| 2-Person Household | 304 (83.5%) | 60 (16.5%) |
| 3-Person Household | 167 (74.6%) | 57 (25.5%) |
| 4+ Person Household | 164 (67.2%) | 80 (32.8%) |
| Total Housing Units | 823 (72.1%) | 318 (27.9%) |
Occupancy by Educational Attainment in Cache
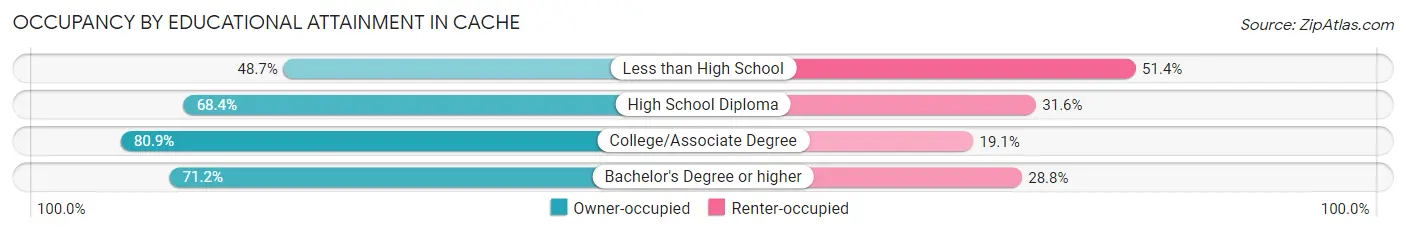
| Household Size | Owner-occupied | Renter-occupied |
| Less than High School | 36 (48.6%) | 38 (51.3%) |
| High School Diploma | 232 (68.4%) | 107 (31.6%) |
| College/Associate Degree | 305 (80.9%) | 72 (19.1%) |
| Bachelor's Degree or higher | 250 (71.2%) | 101 (28.8%) |
Occupancy by Age of Householder in Cache
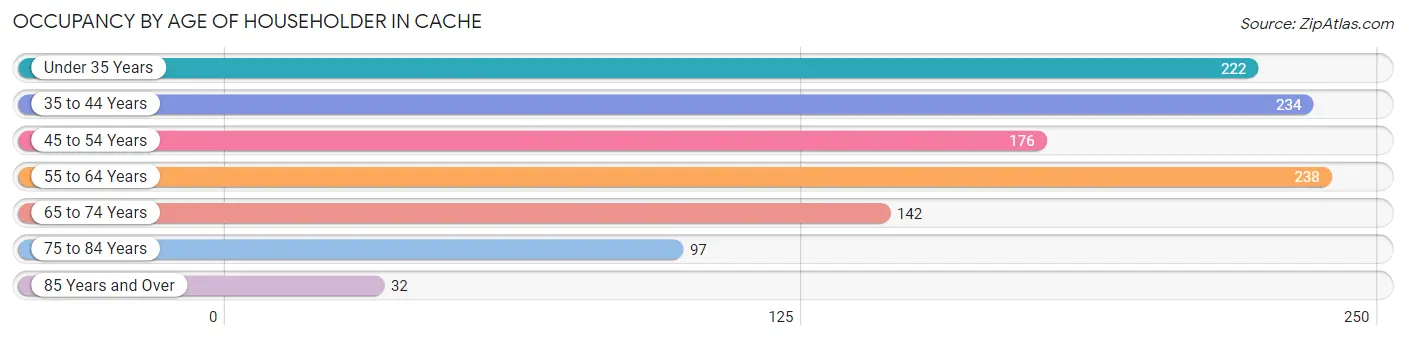
| Age Bracket | # Households | % Households |
| Under 35 Years | 222 | 19.5% |
| 35 to 44 Years | 234 | 20.5% |
| 45 to 54 Years | 176 | 15.4% |
| 55 to 64 Years | 238 | 20.9% |
| 65 to 74 Years | 142 | 12.4% |
| 75 to 84 Years | 97 | 8.5% |
| 85 Years and Over | 32 | 2.8% |
| Total | 1,141 | 100.0% |
Housing Finances in Cache
Median Income by Occupancy in Cache
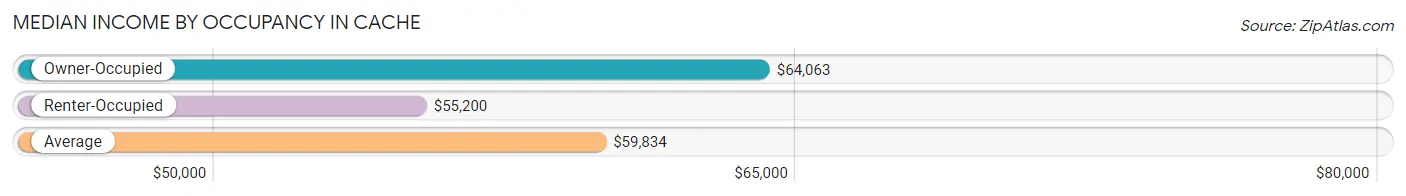
| Occupancy Type | # Households | Median Income |
| Owner-Occupied | 823 (72.1%) | $64,063 |
| Renter-Occupied | 318 (27.9%) | $55,200 |
| Average | 1,141 (100.0%) | $59,834 |
Occupancy by Householder Income Bracket in Cache
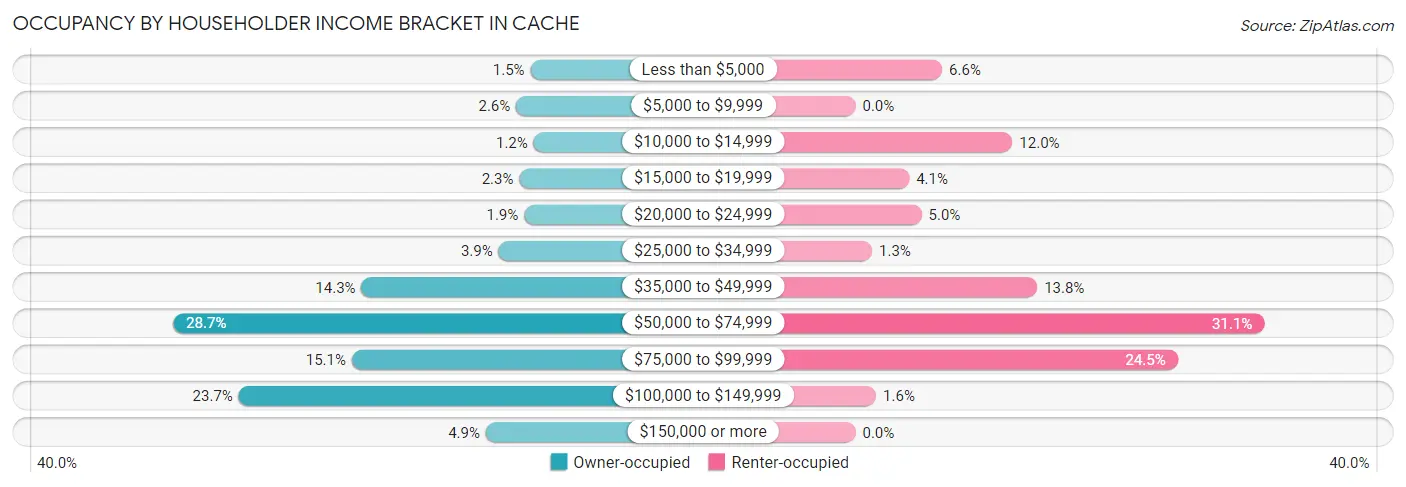
| Income Bracket | Owner-occupied | Renter-occupied |
| Less than $5,000 | 12 (1.5%) | 21 (6.6%) |
| $5,000 to $9,999 | 21 (2.5%) | 0 (0.0%) |
| $10,000 to $14,999 | 10 (1.2%) | 38 (11.9%) |
| $15,000 to $19,999 | 19 (2.3%) | 13 (4.1%) |
| $20,000 to $24,999 | 16 (1.9%) | 16 (5.0%) |
| $25,000 to $34,999 | 32 (3.9%) | 4 (1.3%) |
| $35,000 to $49,999 | 118 (14.3%) | 44 (13.8%) |
| $50,000 to $74,999 | 236 (28.7%) | 99 (31.1%) |
| $75,000 to $99,999 | 124 (15.1%) | 78 (24.5%) |
| $100,000 to $149,999 | 195 (23.7%) | 5 (1.6%) |
| $150,000 or more | 40 (4.9%) | 0 (0.0%) |
| Total | 823 (100.0%) | 318 (100.0%) |
Monthly Housing Cost Tiers in Cache
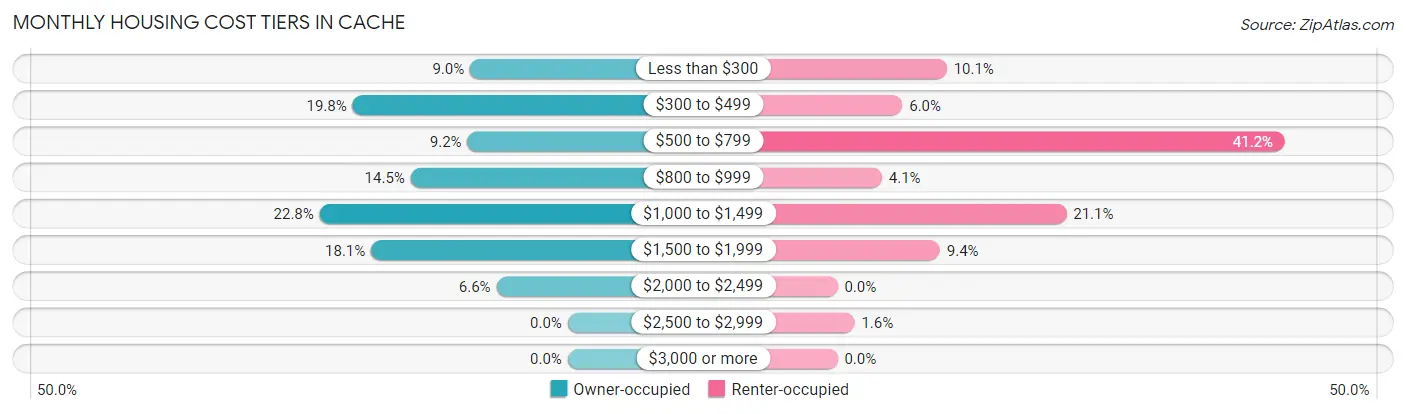
| Monthly Cost | Owner-occupied | Renter-occupied |
| Less than $300 | 74 (9.0%) | 32 (10.1%) |
| $300 to $499 | 163 (19.8%) | 19 (6.0%) |
| $500 to $799 | 76 (9.2%) | 131 (41.2%) |
| $800 to $999 | 119 (14.5%) | 13 (4.1%) |
| $1,000 to $1,499 | 188 (22.8%) | 67 (21.1%) |
| $1,500 to $1,999 | 149 (18.1%) | 30 (9.4%) |
| $2,000 to $2,499 | 54 (6.6%) | 0 (0.0%) |
| $2,500 to $2,999 | 0 (0.0%) | 5 (1.6%) |
| $3,000 or more | 0 (0.0%) | 0 (0.0%) |
| Total | 823 (100.0%) | 318 (100.0%) |
Physical Housing Characteristics in Cache
Housing Structures in Cache
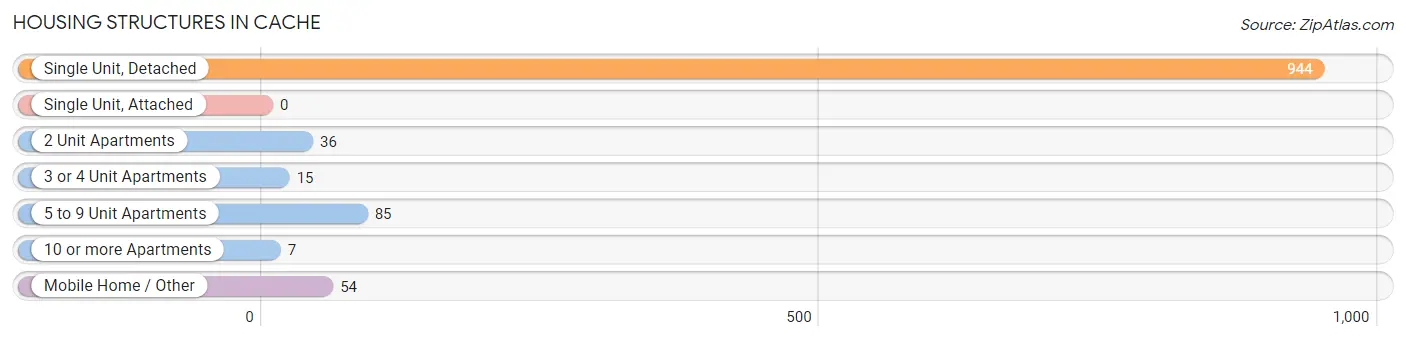
| Structure Type | # Housing Units | % Housing Units |
| Single Unit, Detached | 944 | 82.7% |
| Single Unit, Attached | 0 | 0.0% |
| 2 Unit Apartments | 36 | 3.2% |
| 3 or 4 Unit Apartments | 15 | 1.3% |
| 5 to 9 Unit Apartments | 85 | 7.4% |
| 10 or more Apartments | 7 | 0.6% |
| Mobile Home / Other | 54 | 4.7% |
| Total | 1,141 | 100.0% |
Housing Structures by Occupancy in Cache
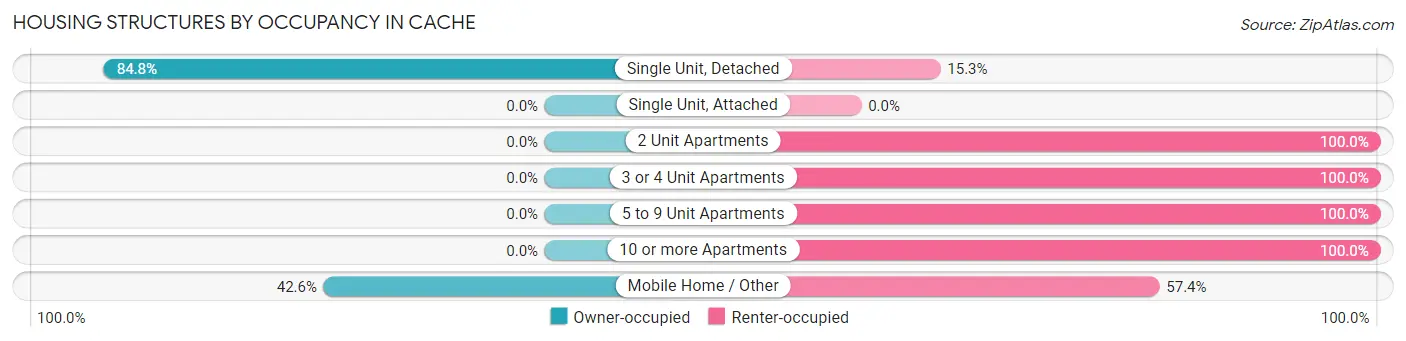
| Structure Type | Owner-occupied | Renter-occupied |
| Single Unit, Detached | 800 (84.8%) | 144 (15.2%) |
| Single Unit, Attached | 0 (0.0%) | 0 (0.0%) |
| 2 Unit Apartments | 0 (0.0%) | 36 (100.0%) |
| 3 or 4 Unit Apartments | 0 (0.0%) | 15 (100.0%) |
| 5 to 9 Unit Apartments | 0 (0.0%) | 85 (100.0%) |
| 10 or more Apartments | 0 (0.0%) | 7 (100.0%) |
| Mobile Home / Other | 23 (42.6%) | 31 (57.4%) |
| Total | 823 (72.1%) | 318 (27.9%) |
Housing Structures by Number of Rooms in Cache
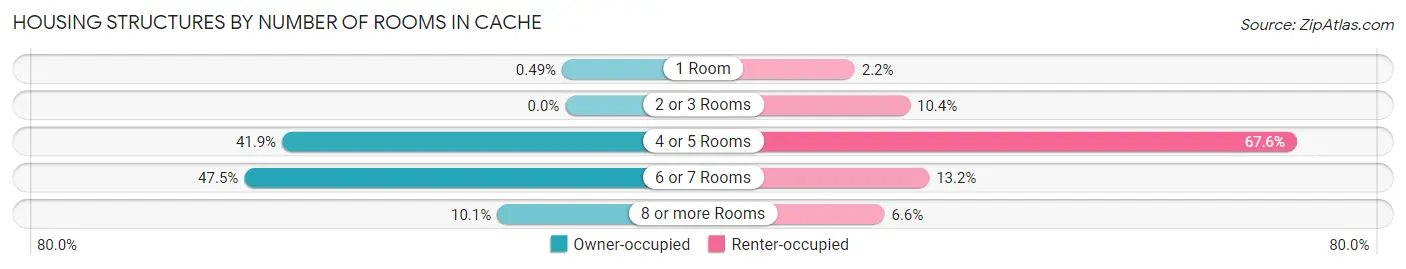
| Number of Rooms | Owner-occupied | Renter-occupied |
| 1 Room | 4 (0.5%) | 7 (2.2%) |
| 2 or 3 Rooms | 0 (0.0%) | 33 (10.4%) |
| 4 or 5 Rooms | 345 (41.9%) | 215 (67.6%) |
| 6 or 7 Rooms | 391 (47.5%) | 42 (13.2%) |
| 8 or more Rooms | 83 (10.1%) | 21 (6.6%) |
| Total | 823 (100.0%) | 318 (100.0%) |
Housing Structure by Heating Type in Cache
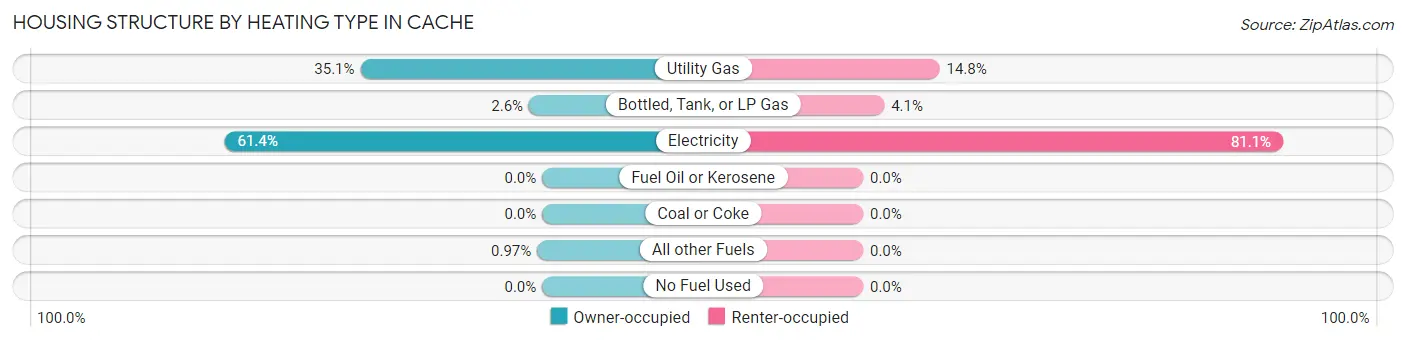
| Heating Type | Owner-occupied | Renter-occupied |
| Utility Gas | 289 (35.1%) | 47 (14.8%) |
| Bottled, Tank, or LP Gas | 21 (2.5%) | 13 (4.1%) |
| Electricity | 505 (61.4%) | 258 (81.1%) |
| Fuel Oil or Kerosene | 0 (0.0%) | 0 (0.0%) |
| Coal or Coke | 0 (0.0%) | 0 (0.0%) |
| All other Fuels | 8 (1.0%) | 0 (0.0%) |
| No Fuel Used | 0 (0.0%) | 0 (0.0%) |
| Total | 823 (100.0%) | 318 (100.0%) |
Household Vehicle Usage in Cache
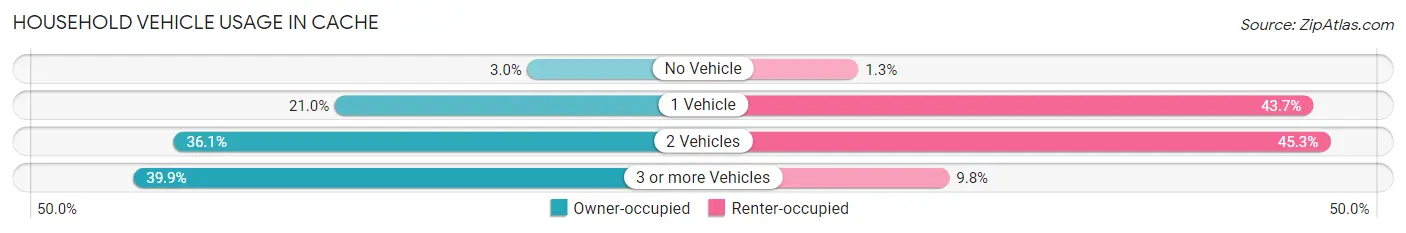
| Vehicles per Household | Owner-occupied | Renter-occupied |
| No Vehicle | 25 (3.0%) | 4 (1.3%) |
| 1 Vehicle | 173 (21.0%) | 139 (43.7%) |
| 2 Vehicles | 297 (36.1%) | 144 (45.3%) |
| 3 or more Vehicles | 328 (39.9%) | 31 (9.8%) |
| Total | 823 (100.0%) | 318 (100.0%) |
Real Estate & Mortgages in Cache
Real Estate and Mortgage Overview in Cache
| Characteristic | Without Mortgage | With Mortgage |
| Housing Units | 264 | 559 |
| Median Property Value | $100,000 | $166,500 |
| Median Household Income | $58,295 | $36 |
| Monthly Housing Costs | $380 | $0 |
| Real Estate Taxes | $931 | $40 |
Property Value by Mortgage Status in Cache
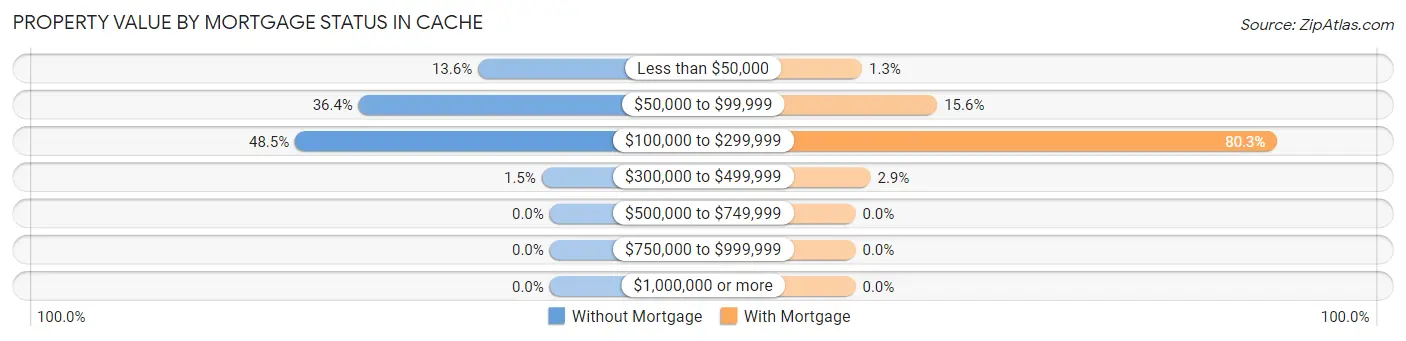
| Property Value | Without Mortgage | With Mortgage |
| Less than $50,000 | 36 (13.6%) | 7 (1.3%) |
| $50,000 to $99,999 | 96 (36.4%) | 87 (15.6%) |
| $100,000 to $299,999 | 128 (48.5%) | 449 (80.3%) |
| $300,000 to $499,999 | 4 (1.5%) | 16 (2.9%) |
| $500,000 to $749,999 | 0 (0.0%) | 0 (0.0%) |
| $750,000 to $999,999 | 0 (0.0%) | 0 (0.0%) |
| $1,000,000 or more | 0 (0.0%) | 0 (0.0%) |
| Total | 264 (100.0%) | 559 (100.0%) |
Household Income by Mortgage Status in Cache
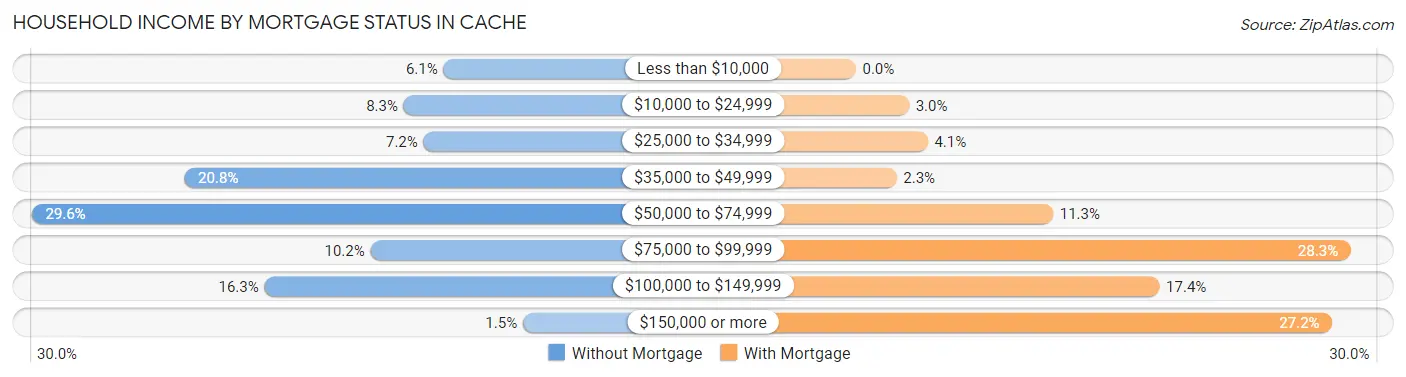
| Household Income | Without Mortgage | With Mortgage |
| Less than $10,000 | 16 (6.1%) | 0 (0.0%) |
| $10,000 to $24,999 | 22 (8.3%) | 17 (3.0%) |
| $25,000 to $34,999 | 19 (7.2%) | 23 (4.1%) |
| $35,000 to $49,999 | 55 (20.8%) | 13 (2.3%) |
| $50,000 to $74,999 | 78 (29.5%) | 63 (11.3%) |
| $75,000 to $99,999 | 27 (10.2%) | 158 (28.3%) |
| $100,000 to $149,999 | 43 (16.3%) | 97 (17.3%) |
| $150,000 or more | 4 (1.5%) | 152 (27.2%) |
| Total | 264 (100.0%) | 559 (100.0%) |
Property Value to Household Income Ratio in Cache
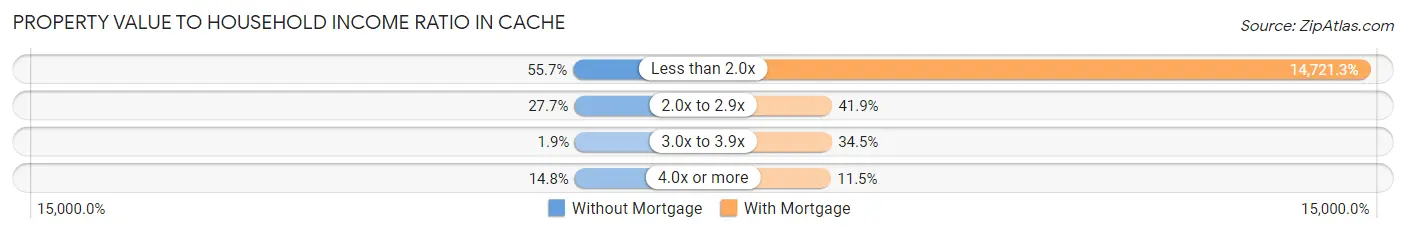
| Value-to-Income Ratio | Without Mortgage | With Mortgage |
| Less than 2.0x | 147 (55.7%) | 82,292 (14,721.3%) |
| 2.0x to 2.9x | 73 (27.7%) | 234 (41.9%) |
| 3.0x to 3.9x | 5 (1.9%) | 193 (34.5%) |
| 4.0x or more | 39 (14.8%) | 64 (11.5%) |
| Total | 264 (100.0%) | 559 (100.0%) |
Real Estate Taxes by Mortgage Status in Cache
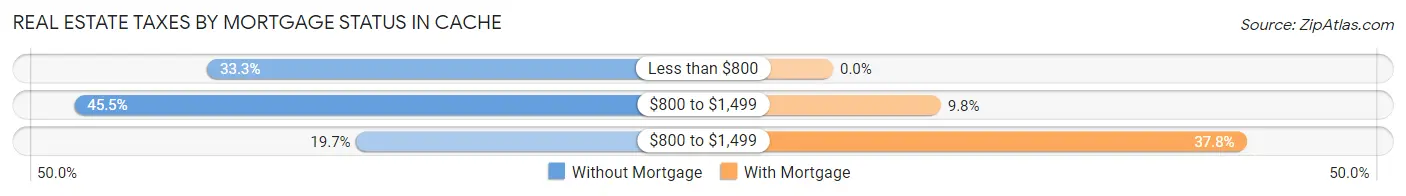
| Property Taxes | Without Mortgage | With Mortgage |
| Less than $800 | 88 (33.3%) | 0 (0.0%) |
| $800 to $1,499 | 120 (45.5%) | 55 (9.8%) |
| $800 to $1,499 | 52 (19.7%) | 211 (37.8%) |
| Total | 264 (100.0%) | 559 (100.0%) |
Health & Disability in Cache
Health Insurance Coverage by Age in Cache
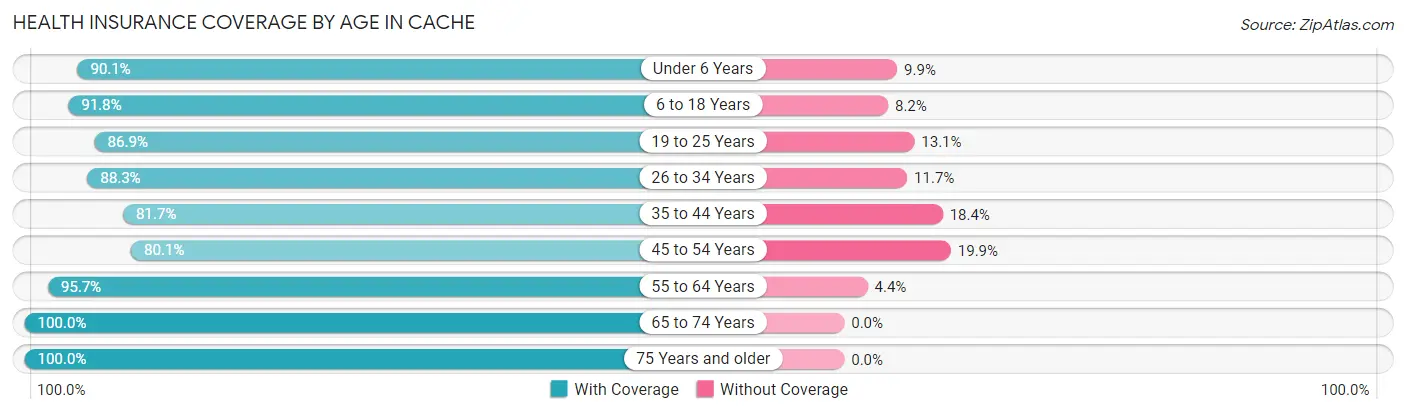
| Age Bracket | With Coverage | Without Coverage |
| Under 6 Years | 192 (90.1%) | 21 (9.9%) |
| 6 to 18 Years | 574 (91.8%) | 51 (8.2%) |
| 19 to 25 Years | 153 (86.9%) | 23 (13.1%) |
| 26 to 34 Years | 339 (88.3%) | 45 (11.7%) |
| 35 to 44 Years | 347 (81.7%) | 78 (18.3%) |
| 45 to 54 Years | 254 (80.1%) | 63 (19.9%) |
| 55 to 64 Years | 396 (95.7%) | 18 (4.3%) |
| 65 to 74 Years | 217 (100.0%) | 0 (0.0%) |
| 75 Years and older | 178 (100.0%) | 0 (0.0%) |
| Total | 2,650 (89.9%) | 299 (10.1%) |
Health Insurance Coverage by Citizenship Status in Cache
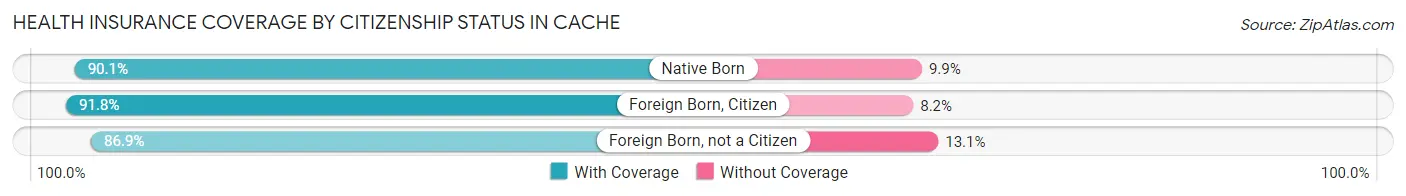
| Citizenship Status | With Coverage | Without Coverage |
| Native Born | 192 (90.1%) | 21 (9.9%) |
| Foreign Born, Citizen | 574 (91.8%) | 51 (8.2%) |
| Foreign Born, not a Citizen | 153 (86.9%) | 23 (13.1%) |
Health Insurance Coverage by Household Income in Cache
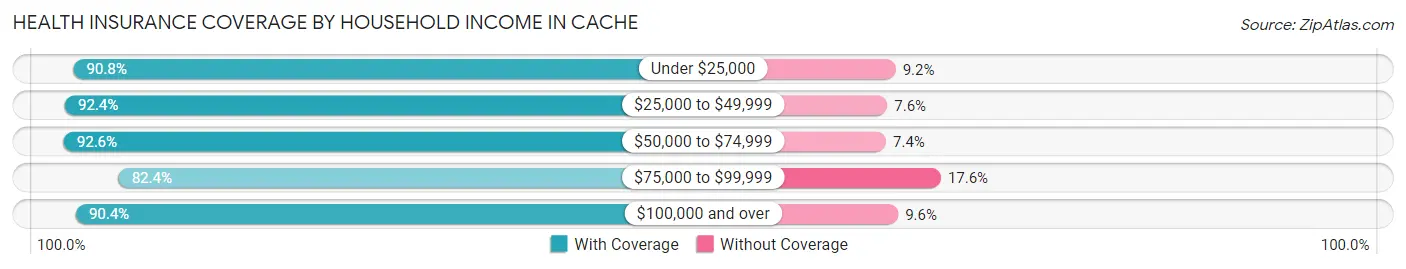
| Household Income | With Coverage | Without Coverage |
| Under $25,000 | 297 (90.8%) | 30 (9.2%) |
| $25,000 to $49,999 | 438 (92.4%) | 36 (7.6%) |
| $50,000 to $74,999 | 843 (92.6%) | 67 (7.4%) |
| $75,000 to $99,999 | 481 (82.4%) | 103 (17.6%) |
| $100,000 and over | 591 (90.4%) | 63 (9.6%) |
Public vs Private Health Insurance Coverage by Age in Cache
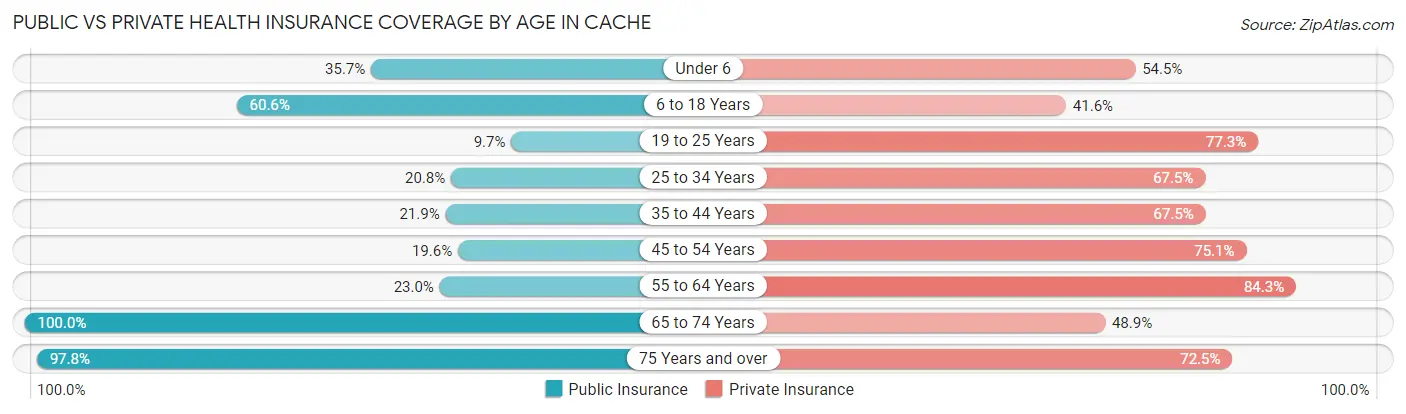
| Age Bracket | Public Insurance | Private Insurance |
| Under 6 | 76 (35.7%) | 116 (54.5%) |
| 6 to 18 Years | 379 (60.6%) | 260 (41.6%) |
| 19 to 25 Years | 17 (9.7%) | 136 (77.3%) |
| 25 to 34 Years | 80 (20.8%) | 259 (67.4%) |
| 35 to 44 Years | 93 (21.9%) | 287 (67.5%) |
| 45 to 54 Years | 62 (19.6%) | 238 (75.1%) |
| 55 to 64 Years | 95 (23.0%) | 349 (84.3%) |
| 65 to 74 Years | 217 (100.0%) | 106 (48.8%) |
| 75 Years and over | 174 (97.8%) | 129 (72.5%) |
| Total | 1,193 (40.5%) | 1,880 (63.7%) |
Disability Status by Sex by Age in Cache
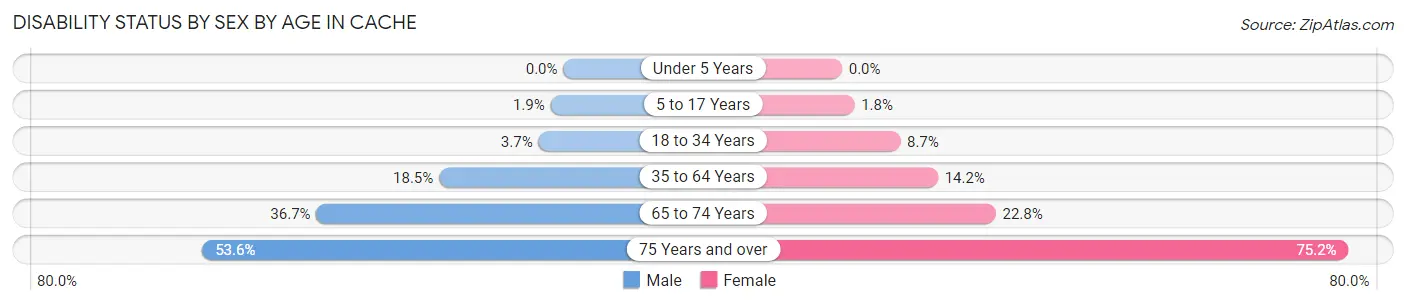
| Age Bracket | Male | Female |
| Under 5 Years | 0 (0.0%) | 0 (0.0%) |
| 5 to 17 Years | 6 (1.9%) | 5 (1.8%) |
| 18 to 34 Years | 10 (3.7%) | 30 (8.6%) |
| 35 to 64 Years | 107 (18.4%) | 82 (14.2%) |
| 65 to 74 Years | 33 (36.7%) | 29 (22.8%) |
| 75 Years and over | 37 (53.6%) | 82 (75.2%) |
Disability Class by Sex by Age in Cache
Disability Class: Hearing Difficulty
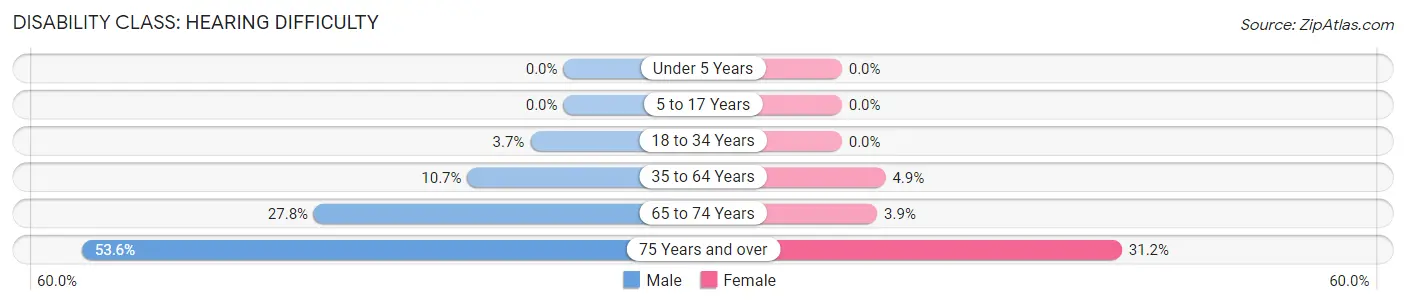
| Age Bracket | Male | Female |
| Under 5 Years | 0 (0.0%) | 0 (0.0%) |
| 5 to 17 Years | 0 (0.0%) | 0 (0.0%) |
| 18 to 34 Years | 10 (3.7%) | 0 (0.0%) |
| 35 to 64 Years | 62 (10.7%) | 28 (4.9%) |
| 65 to 74 Years | 25 (27.8%) | 5 (3.9%) |
| 75 Years and over | 37 (53.6%) | 34 (31.2%) |
Disability Class: Vision Difficulty
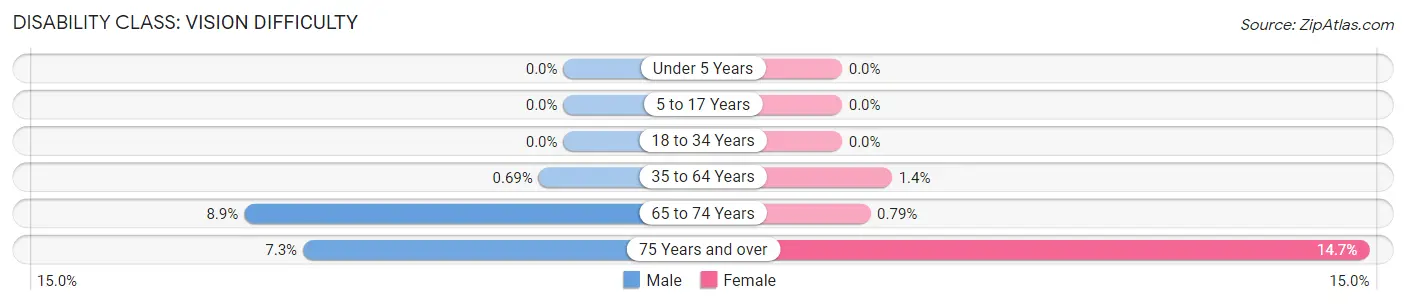
| Age Bracket | Male | Female |
| Under 5 Years | 0 (0.0%) | 0 (0.0%) |
| 5 to 17 Years | 0 (0.0%) | 0 (0.0%) |
| 18 to 34 Years | 0 (0.0%) | 0 (0.0%) |
| 35 to 64 Years | 4 (0.7%) | 8 (1.4%) |
| 65 to 74 Years | 8 (8.9%) | 1 (0.8%) |
| 75 Years and over | 5 (7.2%) | 16 (14.7%) |
Disability Class: Cognitive Difficulty
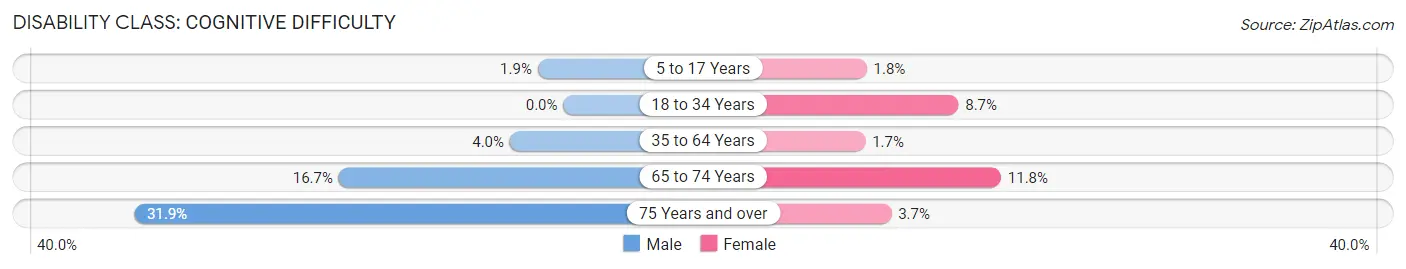
| Age Bracket | Male | Female |
| 5 to 17 Years | 6 (1.9%) | 5 (1.8%) |
| 18 to 34 Years | 0 (0.0%) | 30 (8.6%) |
| 35 to 64 Years | 23 (4.0%) | 10 (1.7%) |
| 65 to 74 Years | 15 (16.7%) | 15 (11.8%) |
| 75 Years and over | 22 (31.9%) | 4 (3.7%) |
Disability Class: Ambulatory Difficulty
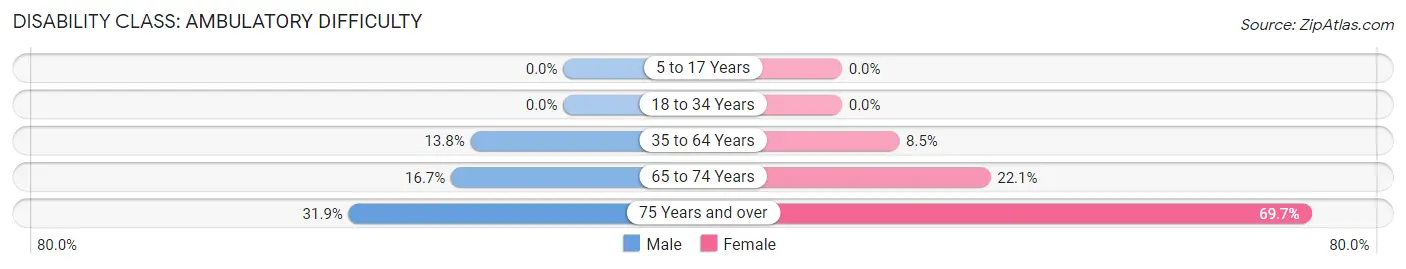
| Age Bracket | Male | Female |
| 5 to 17 Years | 0 (0.0%) | 0 (0.0%) |
| 18 to 34 Years | 0 (0.0%) | 0 (0.0%) |
| 35 to 64 Years | 80 (13.8%) | 49 (8.5%) |
| 65 to 74 Years | 15 (16.7%) | 28 (22.1%) |
| 75 Years and over | 22 (31.9%) | 76 (69.7%) |
Disability Class: Self-Care Difficulty
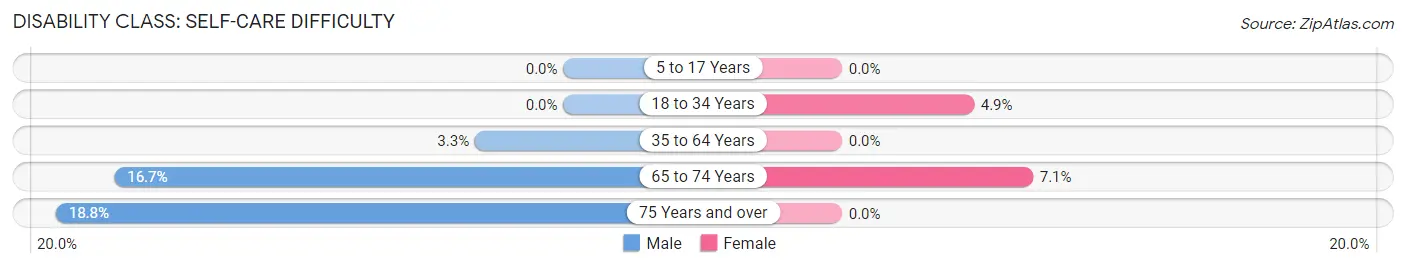
| Age Bracket | Male | Female |
| 5 to 17 Years | 0 (0.0%) | 0 (0.0%) |
| 18 to 34 Years | 0 (0.0%) | 17 (4.9%) |
| 35 to 64 Years | 19 (3.3%) | 0 (0.0%) |
| 65 to 74 Years | 15 (16.7%) | 9 (7.1%) |
| 75 Years and over | 13 (18.8%) | 0 (0.0%) |
Technology Access in Cache
Computing Device Access in Cache
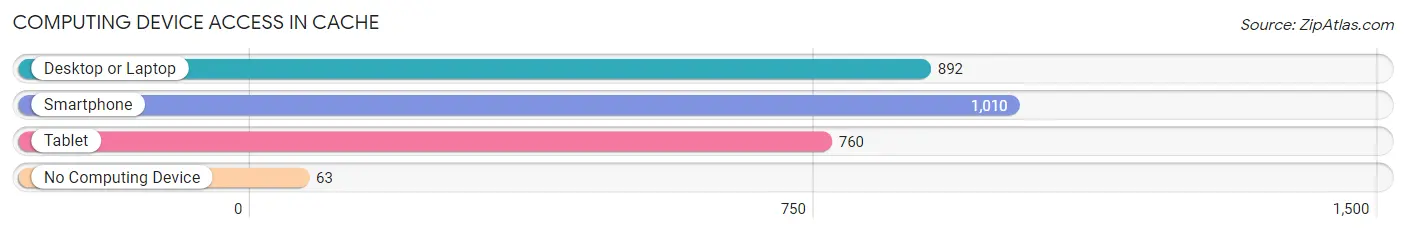
| Device Type | # Households | % Households |
| Desktop or Laptop | 892 | 78.2% |
| Smartphone | 1,010 | 88.5% |
| Tablet | 760 | 66.6% |
| No Computing Device | 63 | 5.5% |
| Total | 1,141 | 100.0% |
Internet Access in Cache
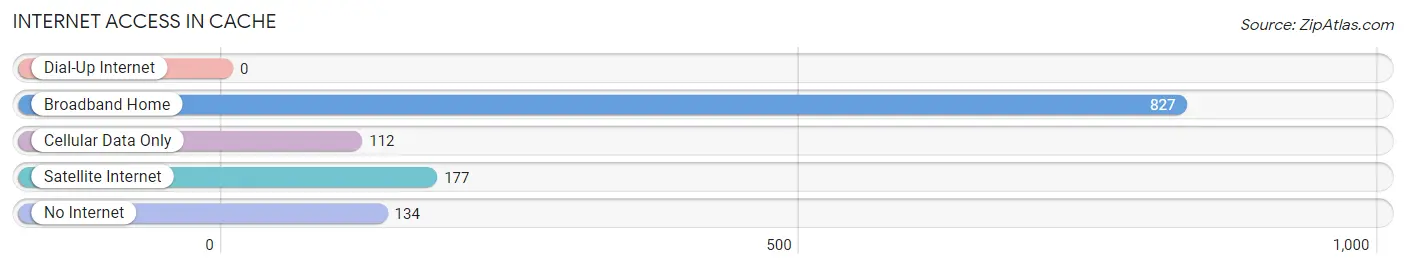
| Internet Type | # Households | % Households |
| Dial-Up Internet | 0 | 0.0% |
| Broadband Home | 827 | 72.5% |
| Cellular Data Only | 112 | 9.8% |
| Satellite Internet | 177 | 15.5% |
| No Internet | 134 | 11.7% |
| Total | 1,141 | 100.0% |
Cache Summary
Cache is a city located in northern Utah, United States. It is the county seat of Cache County and the principal city of the Logan, UT-ID Metropolitan Statistical Area, which includes Cache County and Franklin County, Idaho. As of the 2010 census, the population of Cache was 112,656, making it the fifth-largest city in Utah.
History
The area that is now Cache was originally inhabited by the Shoshone and Ute Native American tribes. The first European settlers arrived in the area in 1855, and the city was officially incorporated in 1856. The city was named after the Cache Valley, which was named by trappers in the early 19th century for the many caches of food and supplies they stored there.
The city quickly grew and became an important trading center for the region. In 1868, the Utah Northern Railroad was built through Cache, connecting it to the transcontinental railroad. This helped to further spur the city's growth and development.
In the late 19th century, Cache was a major stop on the Oregon Trail, and many of the city's early settlers were Mormon pioneers. The city was also home to several prominent Mormon leaders, including Brigham Young and Heber C. Kimball.
Geography
Cache is located in northern Utah, in the Cache Valley. It is situated at the base of the Wellsville Mountains, and is bordered by the cities of Logan to the north and Smithfield to the south. The city is located at an elevation of 4,521 feet (1,378 m).
The city has a total area of 24.3 square miles (62.8 km2), of which 24.2 square miles (62.6 km2) is land and 0.1 square miles (0.2 km2) is water.
Economy
Cache is a major economic center for the region. The city is home to several large employers, including Utah State University, Intermountain Healthcare, and the Cache Valley Hospital. The city is also home to several manufacturing companies, including Cache Valley Dairy, Cache Valley Foods, and Cache Valley Electric.
The city is also home to several retail stores including Walmart Target and Smith s Food Drug
Demographics
As of the 2010 census, there were 112,656 people, 37,945 households, and 25,945 families residing in the city. The population density was 4,637.3 people per square mile (1,789.2/km2). There were 40,845 housing units at an average density of 1,680.2 per square mile (649.3/km2).
The racial makeup of the city was 87.2% White, 0.7% African American, 0.7% Native American, 1.3% Asian, 0.2% Pacific Islander, 8.2% from other races, and 2.0% from two or more races. Hispanic or Latino of any race were 14.3% of the population.
The median income for a household in the city was $41,945, and the median income for a family was $50,945. Males had a median income of $36,945 versus $25,945 for females. The per capita income for the city was $19,945. About 8.2% of families and 11.3% of the population were below the poverty line, including 15.3% of those under age 18 and 6.2% of those age 65 or over.
Common Questions
What is Per Capita Income in Cache?
Per Capita income in Cache is $27,634.
What is the Median Family Income in Cache?
Median Family Income in Cache is $67,287.
What is the Median Household income in Cache?
Median Household Income in Cache is $59,834.
What is Income or Wage Gap in Cache?
Income or Wage Gap in Cache is 28.0%.
Women in Cache earn 72.0 cents for every dollar earned by a man.
What is Inequality or Gini Index in Cache?
Inequality or Gini Index in Cache is 0.34.
What is the Total Population of Cache?
Total Population of Cache is 2,974.
What is the Total Male Population of Cache?
Total Male Population of Cache is 1,448.
What is the Total Female Population of Cache?
Total Female Population of Cache is 1,526.
What is the Ratio of Males per 100 Females in Cache?
There are 94.89 Males per 100 Females in Cache.
What is the Ratio of Females per 100 Males in Cache?
There are 105.39 Females per 100 Males in Cache.
What is the Median Population Age in Cache?
Median Population Age in Cache is 37.4 Years.
What is the Average Family Size in Cache
Average Family Size in Cache is 3.2 People.
What is the Average Household Size in Cache
Average Household Size in Cache is 2.6 People.
How Large is the Labor Force in Cache?
There are 1,374 People in the Labor Forcein in Cache.
What is the Percentage of People in the Labor Force in Cache?
59.9% of People are in the Labor Force in Cache.
What is the Unemployment Rate in Cache?
Unemployment Rate in Cache is 6.1%.