Brushy, OK Map & Demographics
Brushy Map
Brushy Overview
$21,341
PER CAPITA INCOME
$76,250
AVG FAMILY INCOME
$67,500
AVG HOUSEHOLD INCOME
10.3%
WAGE / INCOME GAP [ % ]
89.7¢/ $1
WAGE / INCOME GAP [ $ ]
0.36
INEQUALITY / GINI INDEX
973
TOTAL POPULATION
492
MALE POPULATION
481
FEMALE POPULATION
102.29
MALES / 100 FEMALES
97.76
FEMALES / 100 MALES
36.8
MEDIAN AGE
4.0
AVG FAMILY SIZE
3.6
AVG HOUSEHOLD SIZE
418
LABOR FORCE [ PEOPLE ]
55.5%
PERCENT IN LABOR FORCE
9.3%
UNEMPLOYMENT RATE
Income in Brushy
Income Overview in Brushy
Per Capita Income in Brushy is $21,341, while median incomes of families and households are $76,250 and $67,500 respectively.
| Characteristic | Number | Measure |
| Per Capita Income | 973 | $21,341 |
| Median Family Income | 217 | $76,250 |
| Mean Family Income | 217 | $74,389 |
| Median Household Income | 272 | $67,500 |
| Mean Household Income | 272 | $69,762 |
| Income Deficit | 217 | $0 |
| Wage / Income Gap (%) | 973 | 10.26% |
| Wage / Income Gap ($) | 973 | 89.74¢ per $1 |
| Gini / Inequality Index | 973 | 0.36 |
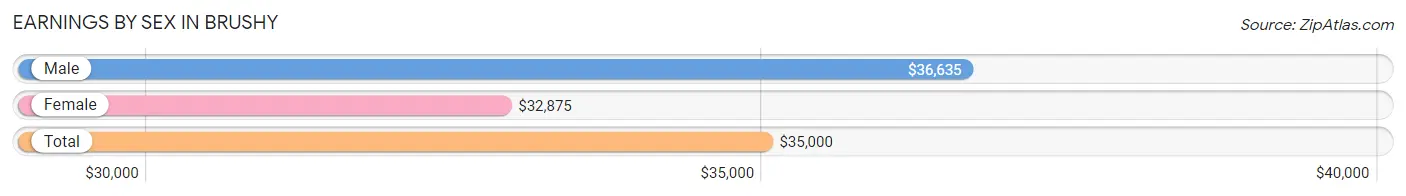
Earnings by Sex in Brushy
Average Earnings in Brushy are $35,000, $36,635 for men and $32,875 for women, a difference of 10.3%.
| Sex | Number | Average Earnings |
| Male | 254 (63.5%) | $36,635 |
| Female | 146 (36.5%) | $32,875 |
| Total | 400 (100.0%) | $35,000 |
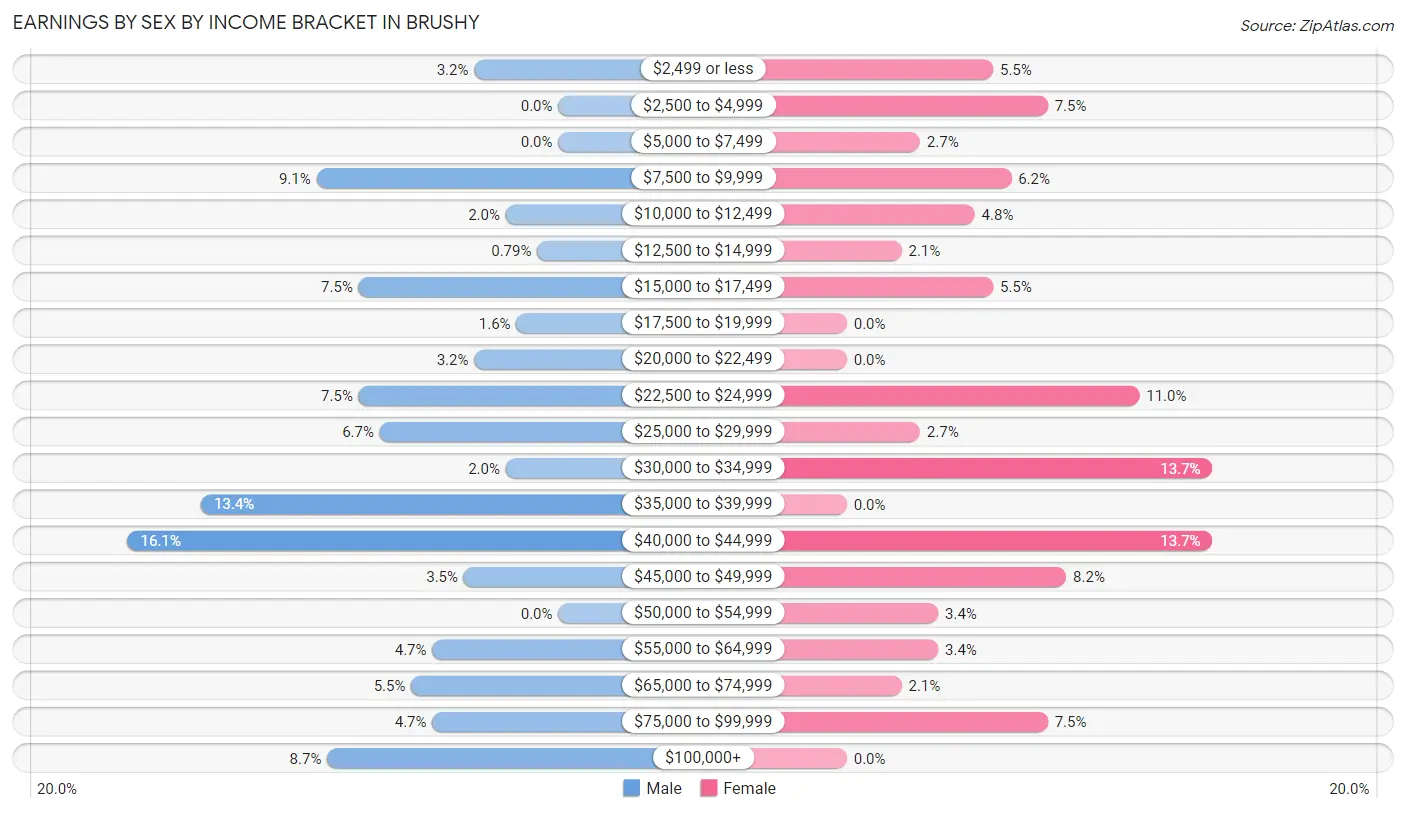
Earnings by Sex by Income Bracket in Brushy
The most common earnings brackets in Brushy are $40,000 to $44,999 for men (41 | 16.1%) and $30,000 to $34,999 for women (20 | 13.7%).
| Income | Male | Female |
| $2,499 or less | 8 (3.2%) | 8 (5.5%) |
| $2,500 to $4,999 | 0 (0.0%) | 11 (7.5%) |
| $5,000 to $7,499 | 0 (0.0%) | 4 (2.7%) |
| $7,500 to $9,999 | 23 (9.1%) | 9 (6.2%) |
| $10,000 to $12,499 | 5 (2.0%) | 7 (4.8%) |
| $12,500 to $14,999 | 2 (0.8%) | 3 (2.1%) |
| $15,000 to $17,499 | 19 (7.5%) | 8 (5.5%) |
| $17,500 to $19,999 | 4 (1.6%) | 0 (0.0%) |
| $20,000 to $22,499 | 8 (3.2%) | 0 (0.0%) |
| $22,500 to $24,999 | 19 (7.5%) | 16 (11.0%) |
| $25,000 to $29,999 | 17 (6.7%) | 4 (2.7%) |
| $30,000 to $34,999 | 5 (2.0%) | 20 (13.7%) |
| $35,000 to $39,999 | 34 (13.4%) | 0 (0.0%) |
| $40,000 to $44,999 | 41 (16.1%) | 20 (13.7%) |
| $45,000 to $49,999 | 9 (3.5%) | 12 (8.2%) |
| $50,000 to $54,999 | 0 (0.0%) | 5 (3.4%) |
| $55,000 to $64,999 | 12 (4.7%) | 5 (3.4%) |
| $65,000 to $74,999 | 14 (5.5%) | 3 (2.1%) |
| $75,000 to $99,999 | 12 (4.7%) | 11 (7.5%) |
| $100,000+ | 22 (8.7%) | 0 (0.0%) |
| Total | 254 (100.0%) | 146 (100.0%) |
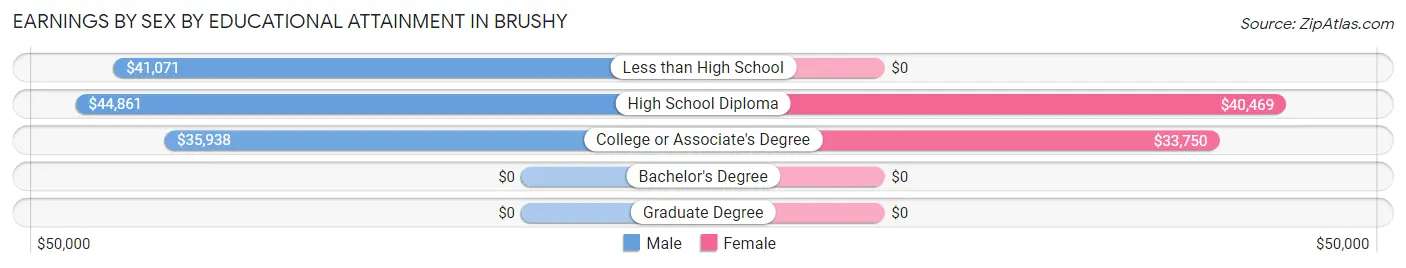
Earnings by Sex by Educational Attainment in Brushy
Average earnings in Brushy are $43,167 for men and $34,500 for women, a difference of 20.1%. Men with an educational attainment of high school diploma enjoy the highest average annual earnings of $44,861, while those with college or associate's degree education earn the least with $35,938. Women with an educational attainment of high school diploma earn the most with the average annual earnings of $40,469, while those with college or associate's degree education have the smallest earnings of $33,750.
| Educational Attainment | Male Income | Female Income |
| Less than High School | $41,071 | $0 |
| High School Diploma | $44,861 | $40,469 |
| College or Associate's Degree | $35,938 | $33,750 |
| Bachelor's Degree | - | - |
| Graduate Degree | - | - |
| Total | $43,167 | $34,500 |
Family Income in Brushy
Family Income Brackets in Brushy
According to the Brushy family income data, there are 58 families falling into the $100,000 to $149,999 income range, which is the most common income bracket and makes up 26.7% of all families.
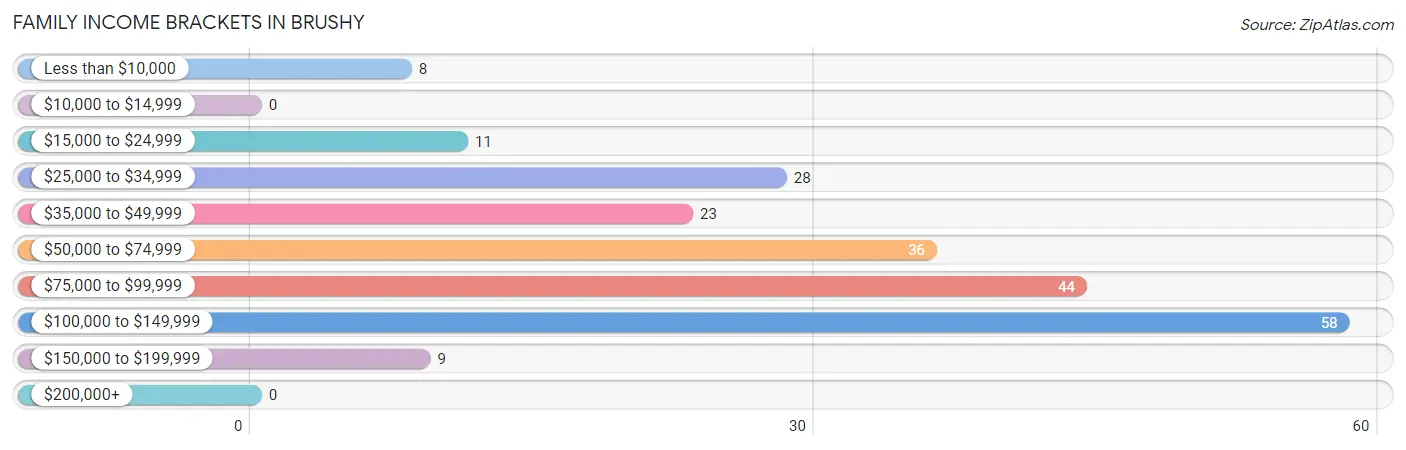
| Income Bracket | # Families | % Families |
| Less than $10,000 | 8 | 3.7% |
| $10,000 to $14,999 | 0 | 0.0% |
| $15,000 to $24,999 | 11 | 5.1% |
| $25,000 to $34,999 | 28 | 12.9% |
| $35,000 to $49,999 | 23 | 10.6% |
| $50,000 to $74,999 | 36 | 16.6% |
| $75,000 to $99,999 | 44 | 20.3% |
| $100,000 to $149,999 | 58 | 26.7% |
| $150,000 to $199,999 | 9 | 4.1% |
| $200,000+ | 0 | 0.0% |
Family Income by Famaliy Size in Brushy
4-person families (51 | 23.5%) account for the highest median family income in Brushy with $100,938 per family, while 2-person families (85 | 39.2%) have the highest median income of $33,125 per family member.
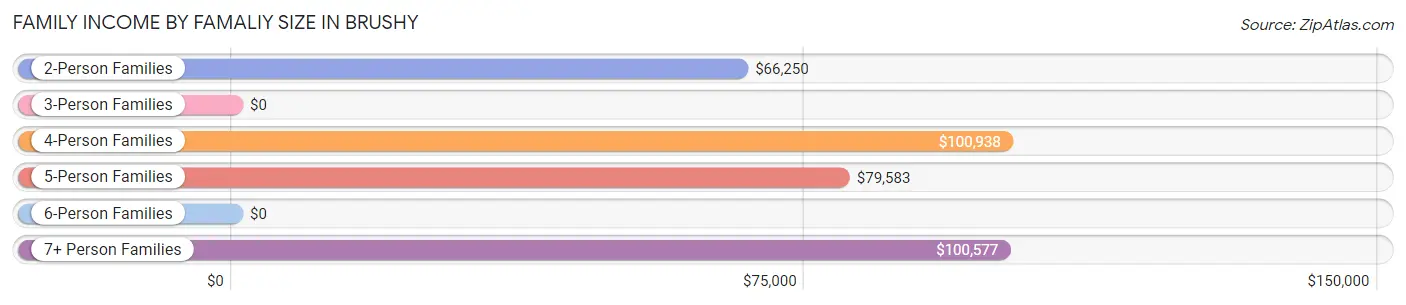
| Income Bracket | # Families | Median Income |
| 2-Person Families | 85 (39.2%) | $66,250 |
| 3-Person Families | 26 (12.0%) | $0 |
| 4-Person Families | 51 (23.5%) | $100,938 |
| 5-Person Families | 27 (12.4%) | $79,583 |
| 6-Person Families | 8 (3.7%) | $0 |
| 7+ Person Families | 20 (9.2%) | $100,577 |
| Total | 217 (100.0%) | $76,250 |
Family Income by Number of Earners in Brushy
The median family income in Brushy is $76,250, with families comprising 2 earners (81) having the highest median family income of $101,964, while families with no earners (51) have the lowest median family income of $35,313, accounting for 37.3% and 23.5% of families, respectively.
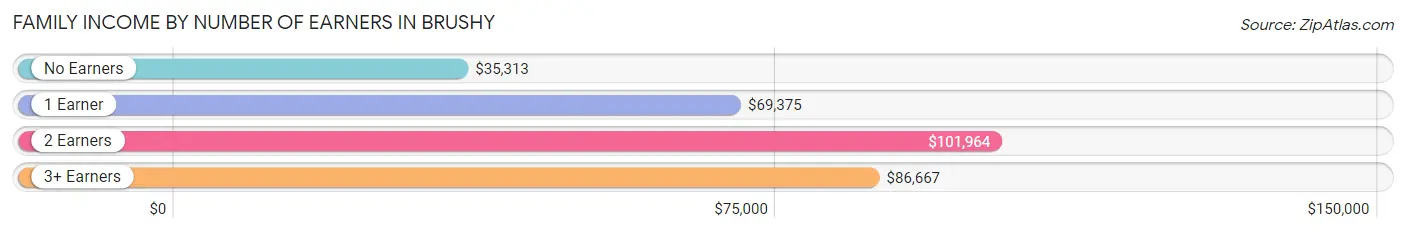
| Number of Earners | # Families | Median Income |
| No Earners | 51 (23.5%) | $35,313 |
| 1 Earner | 69 (31.8%) | $69,375 |
| 2 Earners | 81 (37.3%) | $101,964 |
| 3+ Earners | 16 (7.4%) | $86,667 |
| Total | 217 (100.0%) | $76,250 |
Household Income in Brushy
Household Income Brackets in Brushy
With 66 households falling in the category, the $100,000 to $149,999 income range is the most frequent in Brushy, accounting for 24.3% of all households.
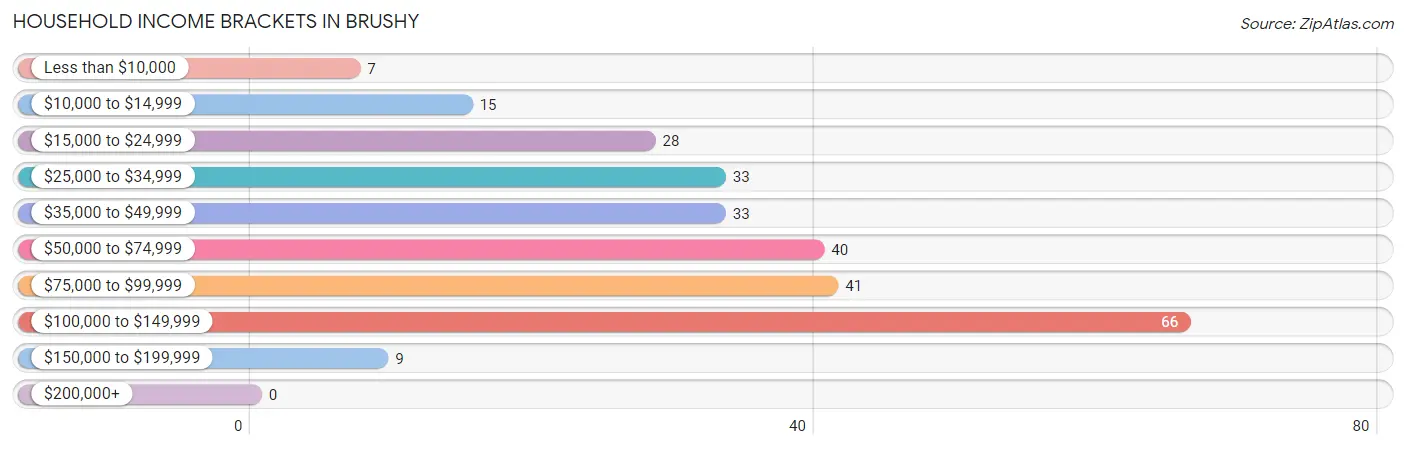
| Income Bracket | # Households | % Households |
| Less than $10,000 | 7 | 2.6% |
| $10,000 to $14,999 | 15 | 5.5% |
| $15,000 to $24,999 | 28 | 10.3% |
| $25,000 to $34,999 | 33 | 12.1% |
| $35,000 to $49,999 | 33 | 12.1% |
| $50,000 to $74,999 | 40 | 14.7% |
| $75,000 to $99,999 | 41 | 15.1% |
| $100,000 to $149,999 | 66 | 24.3% |
| $150,000 to $199,999 | 9 | 3.3% |
| $200,000+ | 0 | 0.0% |
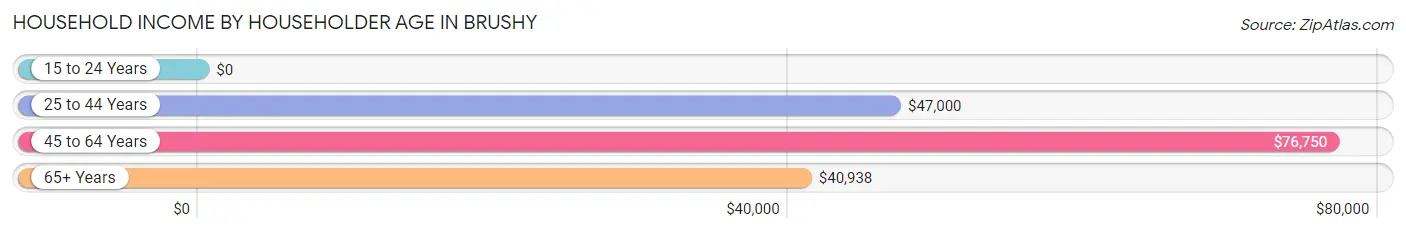
Household Income by Householder Age in Brushy
The median household income in Brushy is $67,500, with the highest median household income of $76,750 found in the 45 to 64 years age bracket for the primary householder. A total of 137 households (50.4%) fall into this category.
| Income Bracket | # Households | Median Income |
| 15 to 24 Years | 0 (0.0%) | $0 |
| 25 to 44 Years | 50 (18.4%) | $47,000 |
| 45 to 64 Years | 137 (50.4%) | $76,750 |
| 65+ Years | 85 (31.2%) | $40,938 |
| Total | 272 (100.0%) | $67,500 |
Poverty in Brushy
Income Below Poverty by Sex and Age in Brushy
With 4.9% poverty level for males and 10.2% for females among the residents of Brushy, 12 to 14 year old males and 35 to 44 year old females are the most vulnerable to poverty, with 4 males (22.2%) and 16 females (27.6%) in their respective age groups living below the poverty level.
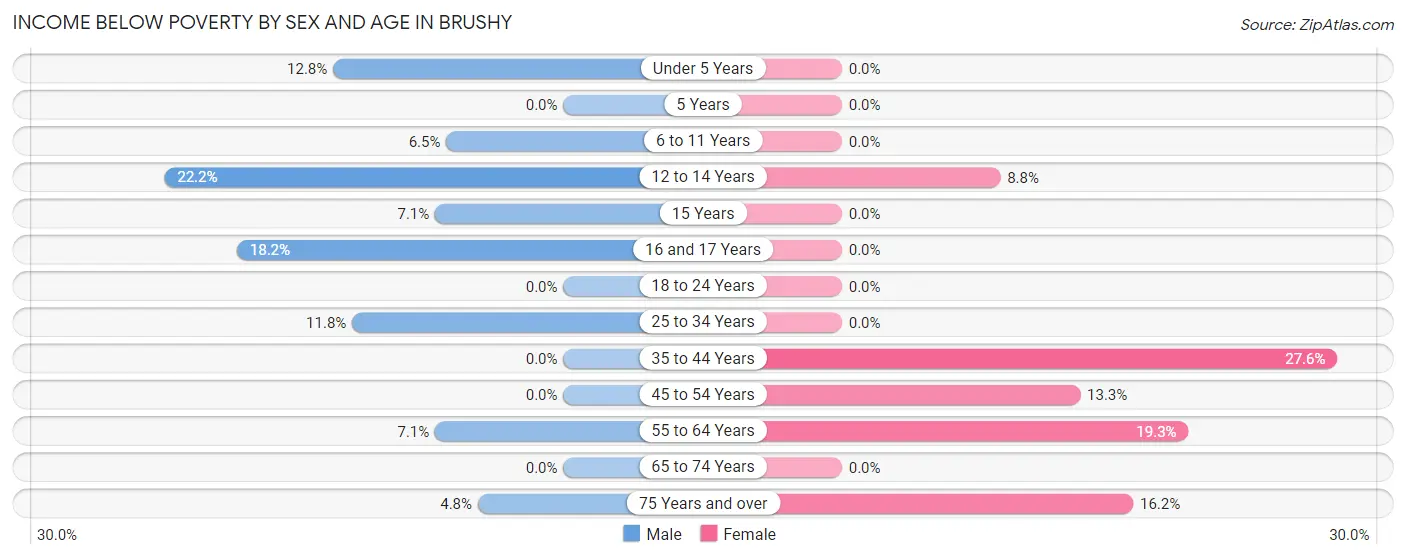
| Age Bracket | Male | Female |
| Under 5 Years | 5 (12.8%) | 0 (0.0%) |
| 5 Years | 0 (0.0%) | 0 (0.0%) |
| 6 to 11 Years | 3 (6.5%) | 0 (0.0%) |
| 12 to 14 Years | 4 (22.2%) | 3 (8.8%) |
| 15 Years | 1 (7.1%) | 0 (0.0%) |
| 16 and 17 Years | 2 (18.2%) | 0 (0.0%) |
| 18 to 24 Years | 0 (0.0%) | 0 (0.0%) |
| 25 to 34 Years | 4 (11.8%) | 0 (0.0%) |
| 35 to 44 Years | 0 (0.0%) | 16 (27.6%) |
| 45 to 54 Years | 0 (0.0%) | 13 (13.3%) |
| 55 to 64 Years | 4 (7.1%) | 11 (19.3%) |
| 65 to 74 Years | 0 (0.0%) | 0 (0.0%) |
| 75 Years and over | 1 (4.8%) | 6 (16.2%) |
| Total | 24 (4.9%) | 49 (10.2%) |
Income Above Poverty by Sex and Age in Brushy
According to the poverty statistics in Brushy, males aged 5 years and females aged under 5 years are the age groups that are most secure financially, with 100.0% of males and 100.0% of females in these age groups living above the poverty line.
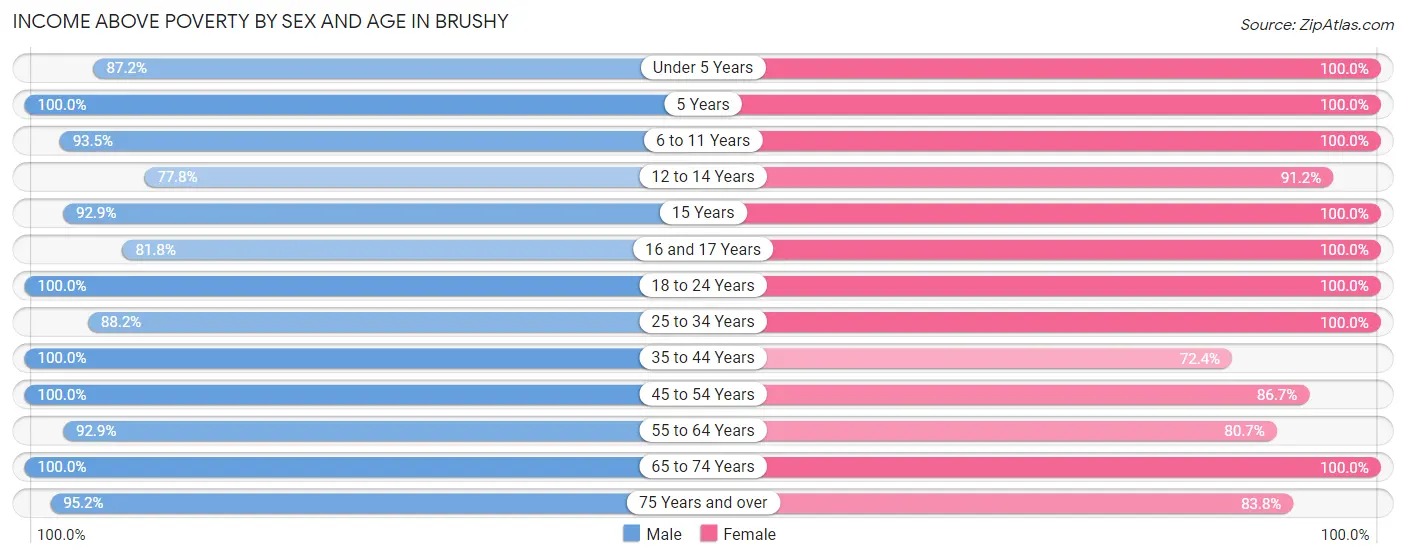
| Age Bracket | Male | Female |
| Under 5 Years | 34 (87.2%) | 13 (100.0%) |
| 5 Years | 8 (100.0%) | 3 (100.0%) |
| 6 to 11 Years | 43 (93.5%) | 40 (100.0%) |
| 12 to 14 Years | 14 (77.8%) | 31 (91.2%) |
| 15 Years | 13 (92.9%) | 5 (100.0%) |
| 16 and 17 Years | 9 (81.8%) | 34 (100.0%) |
| 18 to 24 Years | 89 (100.0%) | 37 (100.0%) |
| 25 to 34 Years | 30 (88.2%) | 33 (100.0%) |
| 35 to 44 Years | 57 (100.0%) | 42 (72.4%) |
| 45 to 54 Years | 69 (100.0%) | 85 (86.7%) |
| 55 to 64 Years | 52 (92.9%) | 46 (80.7%) |
| 65 to 74 Years | 30 (100.0%) | 32 (100.0%) |
| 75 Years and over | 20 (95.2%) | 31 (83.8%) |
| Total | 468 (95.1%) | 432 (89.8%) |
Income Below Poverty Among Married-Couple Families in Brushy
The poverty statistics for married-couple families in Brushy show that 3.8% or 6 of the total 159 families live below the poverty line. Families with 1 or 2 children have the highest poverty rate of 5.5%, comprising of 4 families. On the other hand, families with 3 or 4 children have the lowest poverty rate of 0.0%, which includes 0 families.
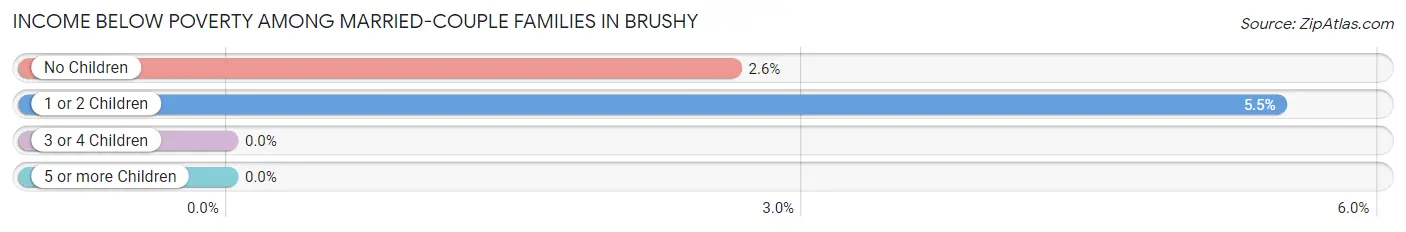
| Children | Above Poverty | Below Poverty |
| No Children | 74 (97.4%) | 2 (2.6%) |
| 1 or 2 Children | 69 (94.5%) | 4 (5.5%) |
| 3 or 4 Children | 10 (100.0%) | 0 (0.0%) |
| 5 or more Children | 0 (0.0%) | 0 (0.0%) |
| Total | 153 (96.2%) | 6 (3.8%) |
Income Below Poverty Among Single-Parent Households in Brushy
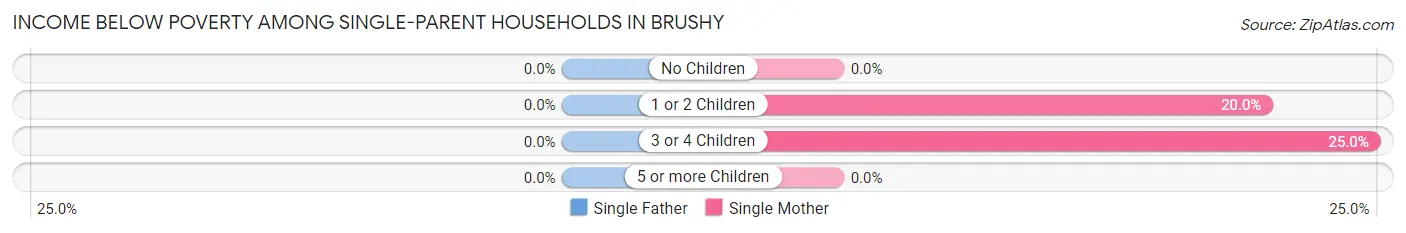
| Children | Single Father | Single Mother |
| No Children | 0 (0.0%) | 0 (0.0%) |
| 1 or 2 Children | 0 (0.0%) | 3 (20.0%) |
| 3 or 4 Children | 0 (0.0%) | 5 (25.0%) |
| 5 or more Children | 0 (0.0%) | 0 (0.0%) |
| Total | 0 (0.0%) | 8 (18.6%) |
Income Below Poverty Among Married-Couple vs Single-Parent Households in Brushy
The poverty data for Brushy shows that 6 of the married-couple family households (3.8%) and 8 of the single-parent households (13.8%) are living below the poverty level. Within the married-couple family households, those with 1 or 2 children have the highest poverty rate, with 4 households (5.5%) falling below the poverty line. Among the single-parent households, those with 3 or 4 children have the highest poverty rate, with 5 household (25.0%) living below poverty.
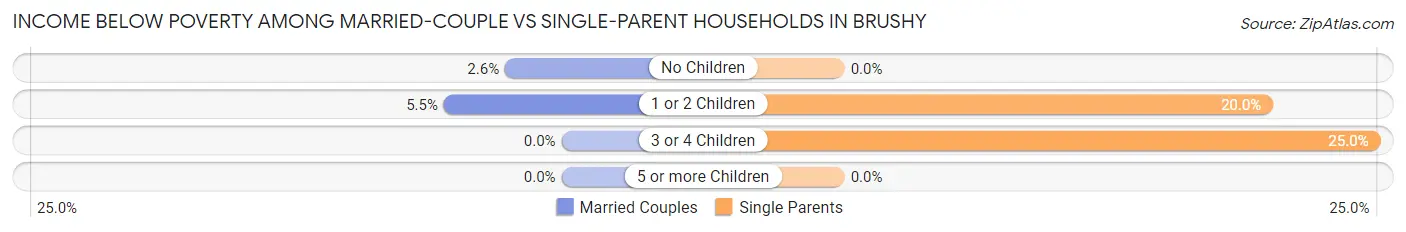
| Children | Married-Couple Families | Single-Parent Households |
| No Children | 2 (2.6%) | 0 (0.0%) |
| 1 or 2 Children | 4 (5.5%) | 3 (20.0%) |
| 3 or 4 Children | 0 (0.0%) | 5 (25.0%) |
| 5 or more Children | 0 (0.0%) | 0 (0.0%) |
| Total | 6 (3.8%) | 8 (13.8%) |
Race in Brushy
The most populous races in Brushy are White / Caucasian (507 | 52.1%), Native / Alaskan (339 | 34.8%), and Two or more Races (83 | 8.5%).
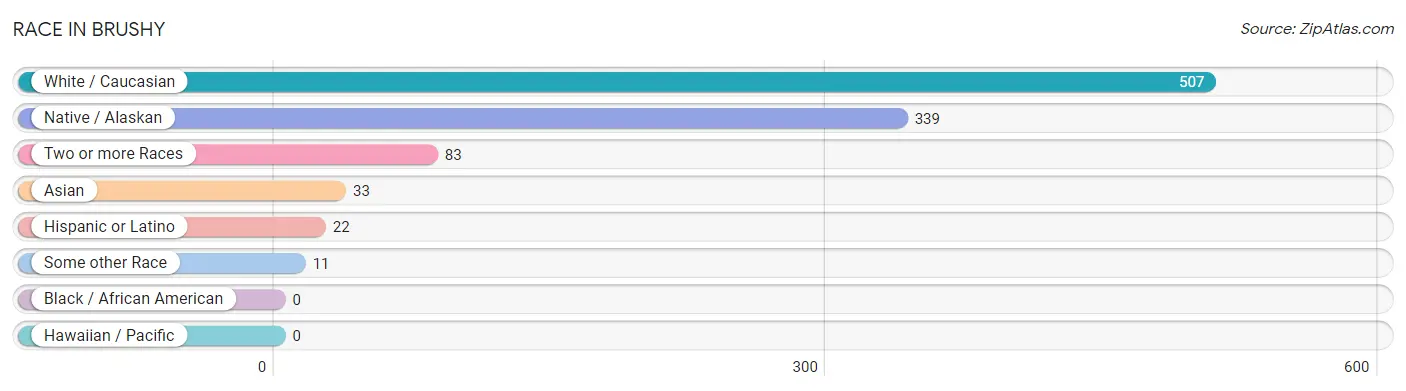
| Race | # Population | % Population |
| Asian | 33 | 3.4% |
| Black / African American | 0 | 0.0% |
| Hawaiian / Pacific | 0 | 0.0% |
| Hispanic or Latino | 22 | 2.3% |
| Native / Alaskan | 339 | 34.8% |
| White / Caucasian | 507 | 52.1% |
| Two or more Races | 83 | 8.5% |
| Some other Race | 11 | 1.1% |
| Total | 973 | 100.0% |
Ancestry in Brushy
The most populous ancestries reported in Brushy are Cherokee (390 | 40.1%), Irish (120 | 12.3%), German (64 | 6.6%), Pakistani (31 | 3.2%), and Choctaw (27 | 2.8%), together accounting for 64.9% of all Brushy residents.
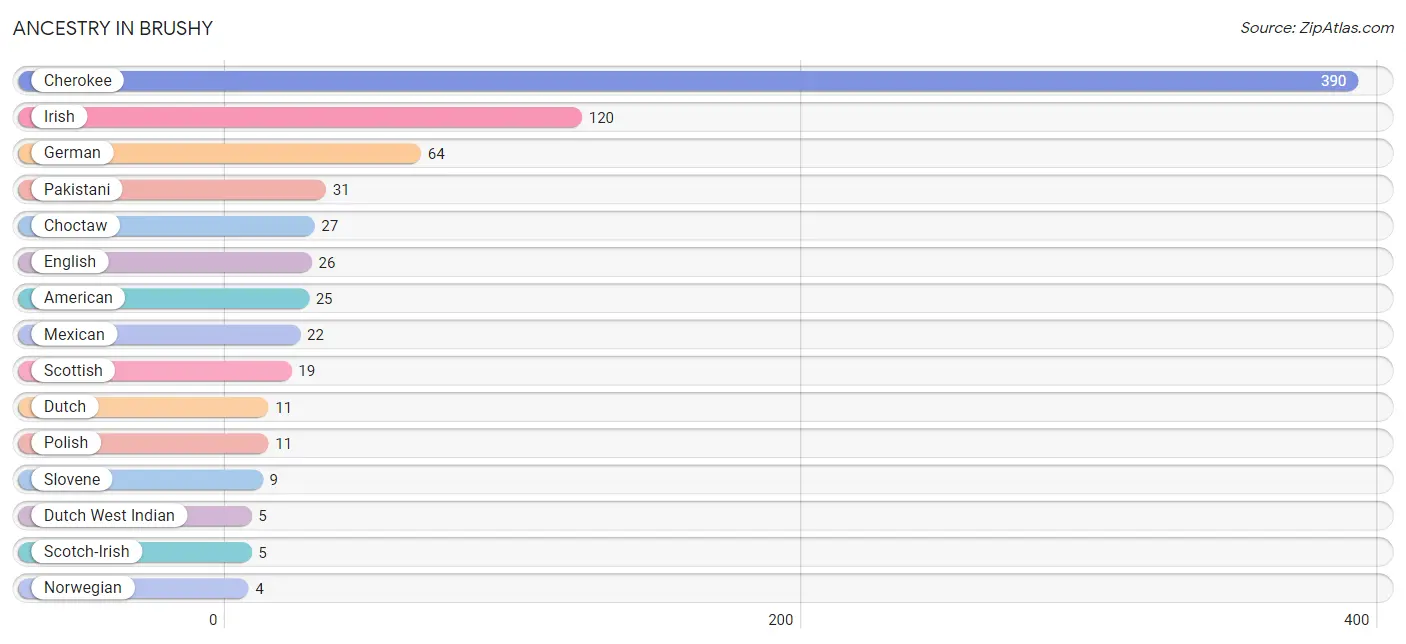
| Ancestry | # Population | % Population |
| American | 25 | 2.6% |
| Cherokee | 390 | 40.1% |
| Chippewa | 2 | 0.2% |
| Choctaw | 27 | 2.8% |
| Dutch | 11 | 1.1% |
| Dutch West Indian | 5 | 0.5% |
| English | 26 | 2.7% |
| German | 64 | 6.6% |
| Indian (Asian) | 2 | 0.2% |
| Irish | 120 | 12.3% |
| Italian | 1 | 0.1% |
| Mexican | 22 | 2.3% |
| Norwegian | 4 | 0.4% |
| Pakistani | 31 | 3.2% |
| Polish | 11 | 1.1% |
| Scotch-Irish | 5 | 0.5% |
| Scottish | 19 | 1.9% |
| Slovene | 9 | 0.9% | View All 18 Rows |
Immigrants in Brushy
The most numerous immigrant groups reported in Brushy came from Central America (7 | 0.7%), Latin America (7 | 0.7%), Mexico (7 | 0.7%), Asia (2 | 0.2%), and China (2 | 0.2%), together accounting for 2.6% of all Brushy residents.
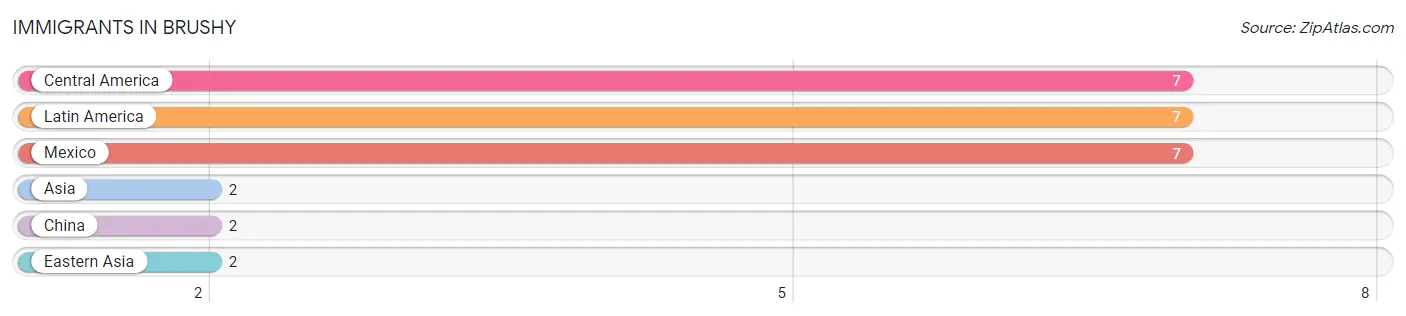
| Immigration Origin | # Population | % Population |
| Asia | 2 | 0.2% |
| Central America | 7 | 0.7% |
| China | 2 | 0.2% |
| Eastern Asia | 2 | 0.2% |
| Latin America | 7 | 0.7% |
| Mexico | 7 | 0.7% | View All 6 Rows |
Sex and Age in Brushy
Sex and Age in Brushy
The most populous age groups in Brushy are 20 to 24 Years (85 | 17.3%) for men and 45 to 49 Years (57 | 11.8%) for women.
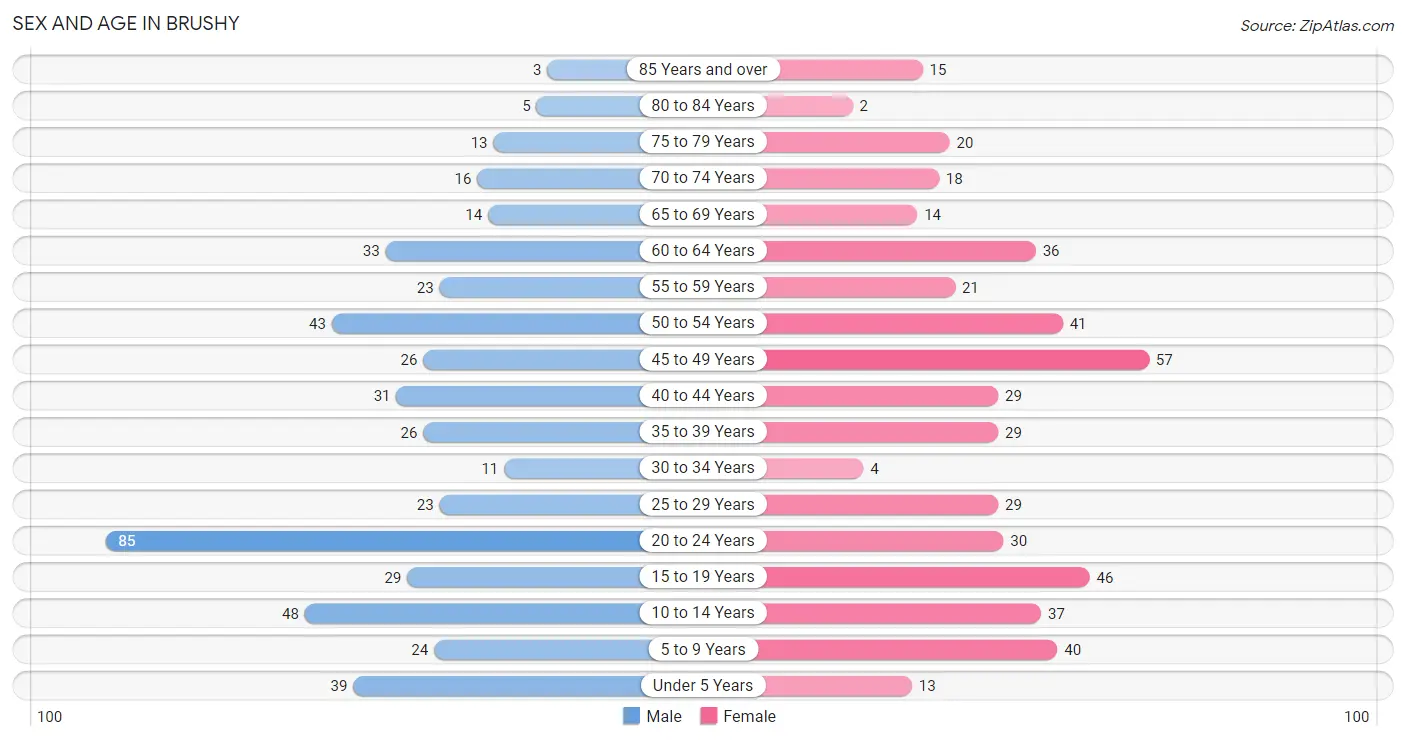
| Age Bracket | Male | Female |
| Under 5 Years | 39 (7.9%) | 13 (2.7%) |
| 5 to 9 Years | 24 (4.9%) | 40 (8.3%) |
| 10 to 14 Years | 48 (9.8%) | 37 (7.7%) |
| 15 to 19 Years | 29 (5.9%) | 46 (9.6%) |
| 20 to 24 Years | 85 (17.3%) | 30 (6.2%) |
| 25 to 29 Years | 23 (4.7%) | 29 (6.0%) |
| 30 to 34 Years | 11 (2.2%) | 4 (0.8%) |
| 35 to 39 Years | 26 (5.3%) | 29 (6.0%) |
| 40 to 44 Years | 31 (6.3%) | 29 (6.0%) |
| 45 to 49 Years | 26 (5.3%) | 57 (11.8%) |
| 50 to 54 Years | 43 (8.7%) | 41 (8.5%) |
| 55 to 59 Years | 23 (4.7%) | 21 (4.4%) |
| 60 to 64 Years | 33 (6.7%) | 36 (7.5%) |
| 65 to 69 Years | 14 (2.9%) | 14 (2.9%) |
| 70 to 74 Years | 16 (3.3%) | 18 (3.7%) |
| 75 to 79 Years | 13 (2.6%) | 20 (4.2%) |
| 80 to 84 Years | 5 (1.0%) | 2 (0.4%) |
| 85 Years and over | 3 (0.6%) | 15 (3.1%) |
| Total | 492 (100.0%) | 481 (100.0%) |
Families and Households in Brushy
Median Family Size in Brushy
The median family size in Brushy is 4.00 persons per family, with single female/mother families (43 | 19.8%) accounting for the largest median family size of 4.49 persons per family. On the other hand, single male/father families (15 | 6.9%) represent the smallest median family size with 3.27 persons per family.
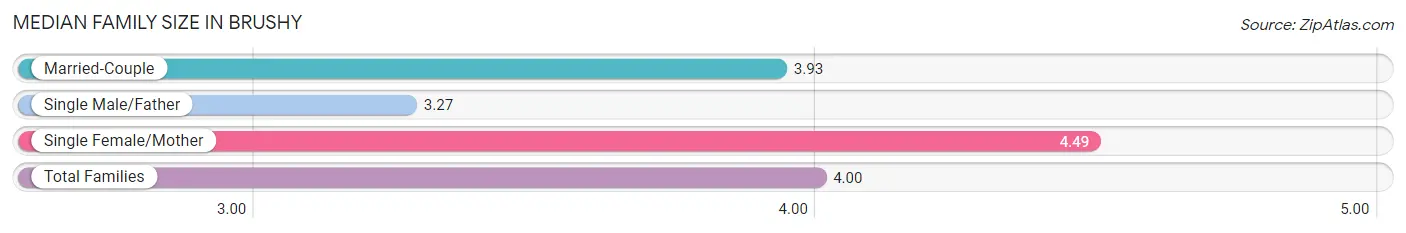
| Family Type | # Families | Family Size |
| Married-Couple | 159 (73.3%) | 3.93 |
| Single Male/Father | 15 (6.9%) | 3.27 |
| Single Female/Mother | 43 (19.8%) | 4.49 |
| Total Families | 217 (100.0%) | 4.00 |
Median Household Size in Brushy
The median household size in Brushy is 3.58 persons per household, with single female/mother households (43 | 15.8%) accounting for the largest median household size of 4.93 persons per household. non-family households (55 | 20.2%) represent the smallest median household size with 1.11 persons per household.
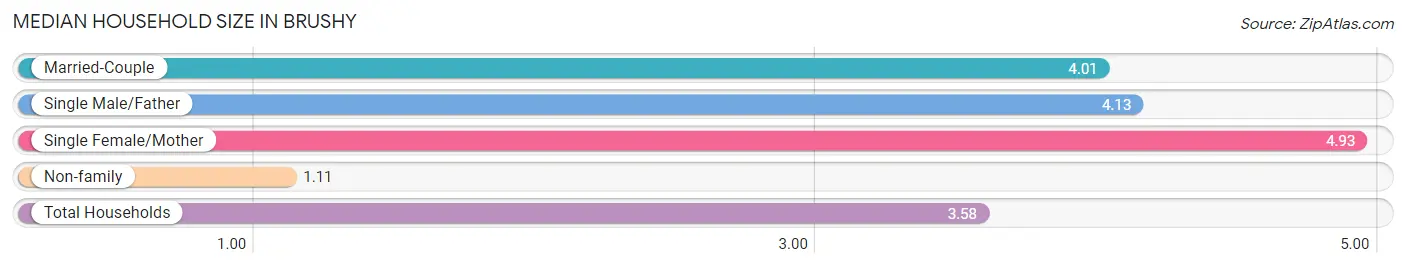
| Household Type | # Households | Household Size |
| Married-Couple | 159 (58.5%) | 4.01 |
| Single Male/Father | 15 (5.5%) | 4.13 |
| Single Female/Mother | 43 (15.8%) | 4.93 |
| Non-family | 55 (20.2%) | 1.11 |
| Total Households | 272 (100.0%) | 3.58 |
Household Size by Marriage Status in Brushy
Out of a total of 272 households in Brushy, 217 (79.8%) are family households, while 55 (20.2%) are nonfamily households. The most numerous type of family households are 2-person households, comprising 81, and the most common type of nonfamily households are 1-person households, comprising 49.
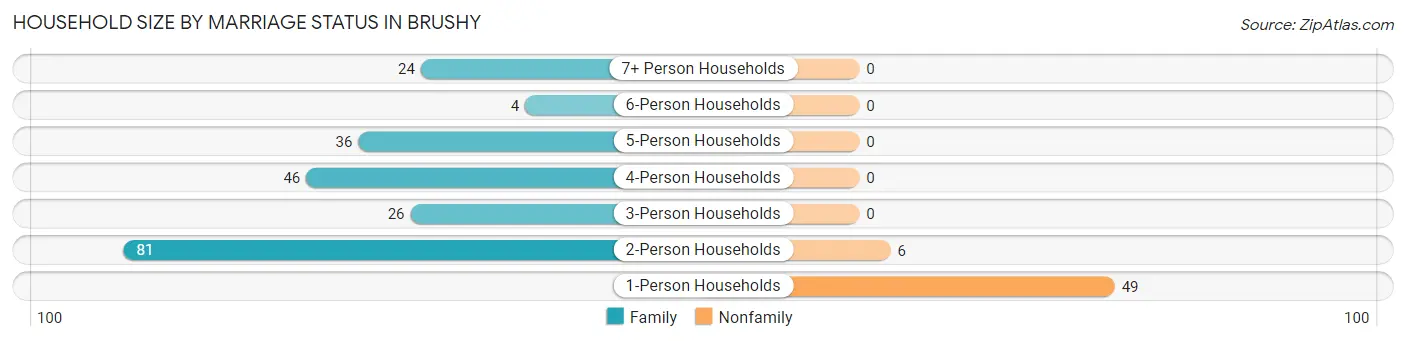
| Household Size | Family Households | Nonfamily Households |
| 1-Person Households | - | 49 (18.0%) |
| 2-Person Households | 81 (29.8%) | 6 (2.2%) |
| 3-Person Households | 26 (9.6%) | 0 (0.0%) |
| 4-Person Households | 46 (16.9%) | 0 (0.0%) |
| 5-Person Households | 36 (13.2%) | 0 (0.0%) |
| 6-Person Households | 4 (1.5%) | 0 (0.0%) |
| 7+ Person Households | 24 (8.8%) | 0 (0.0%) |
| Total | 217 (79.8%) | 55 (20.2%) |
Female Fertility in Brushy
Fertility by Age in Brushy
Average fertility rate in Brushy is 39.0 births per 1,000 women. Women in the age bracket of 20 to 34 years have the highest fertility rate with 143.0 births per 1,000 women. Women in the age bracket of 20 to 34 years acount for 100.0% of all women with births.
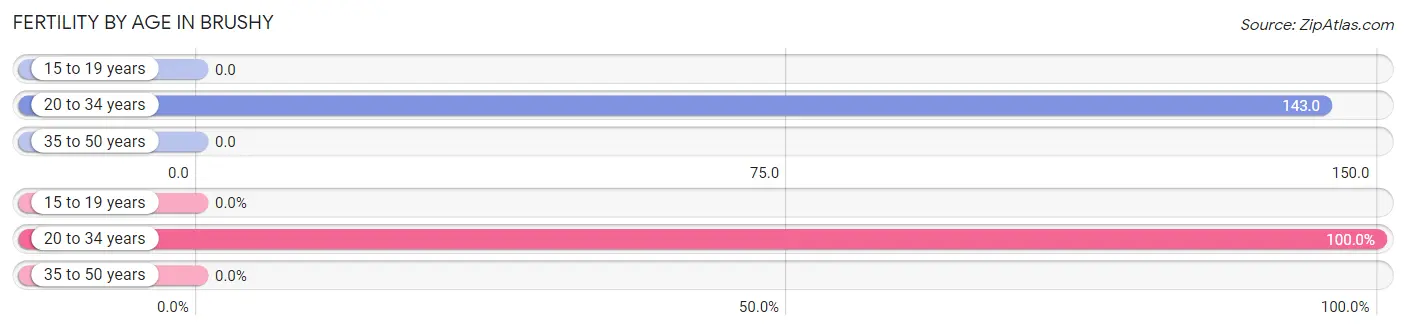
| Age Bracket | Women with Births | Births / 1,000 Women |
| 15 to 19 years | 0 (0.0%) | 0.0 |
| 20 to 34 years | 9 (100.0%) | 143.0 |
| 35 to 50 years | 0 (0.0%) | 0.0 |
| Total | 9 (100.0%) | 39.0 |
Fertility by Age by Marriage Status in Brushy
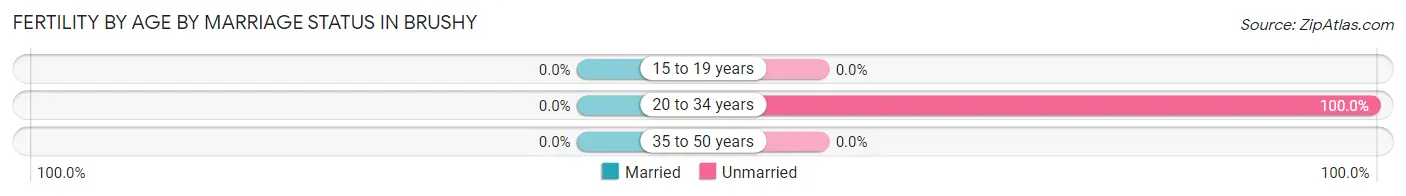
| Age Bracket | Married | Unmarried |
| 15 to 19 years | 0 (0.0%) | 0 (0.0%) |
| 20 to 34 years | 0 (0.0%) | 9 (100.0%) |
| 35 to 50 years | 0 (0.0%) | 0 (0.0%) |
| Total | 0 (0.0%) | 9 (100.0%) |
Fertility by Education in Brushy
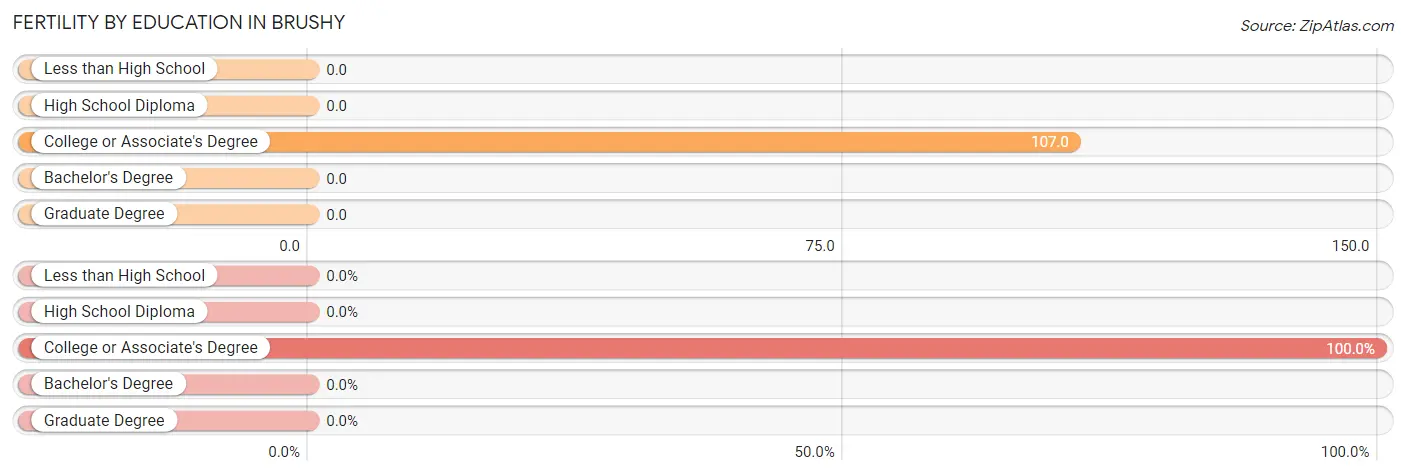
| Educational Attainment | Women with Births | Births / 1,000 Women |
| Less than High School | 0 (0.0%) | 0.0 |
| High School Diploma | 0 (0.0%) | 0.0 |
| College or Associate's Degree | 9 (100.0%) | 107.0 |
| Bachelor's Degree | 0 (0.0%) | 0.0 |
| Graduate Degree | 0 (0.0%) | 0.0 |
| Total | 9 (100.0%) | 39.0 |
Fertility by Education by Marriage Status in Brushy
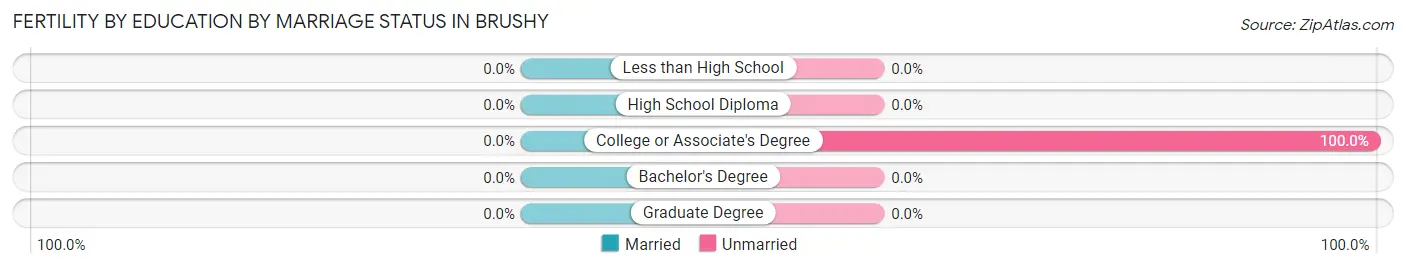
| Educational Attainment | Married | Unmarried |
| Less than High School | 0 (0.0%) | 0 (0.0%) |
| High School Diploma | 0 (0.0%) | 0 (0.0%) |
| College or Associate's Degree | 0 (0.0%) | 9 (100.0%) |
| Bachelor's Degree | 0 (0.0%) | 0 (0.0%) |
| Graduate Degree | 0 (0.0%) | 0 (0.0%) |
| Total | 0 (0.0%) | 9 (100.0%) |
Employment Characteristics in Brushy
Employment by Class of Employer in Brushy
Among the 374 employed individuals in Brushy, private company employees (264 | 70.6%), not-for-profit organizations (36 | 9.6%), and state government employees (35 | 9.4%) make up the most common classes of employment.
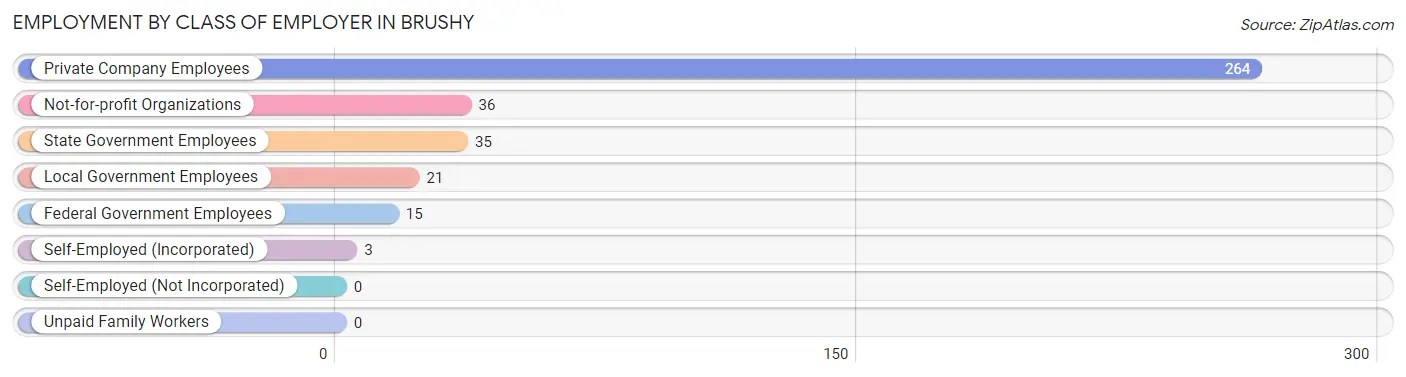
| Employer Class | # Employees | % Employees |
| Private Company Employees | 264 | 70.6% |
| Self-Employed (Incorporated) | 3 | 0.8% |
| Self-Employed (Not Incorporated) | 0 | 0.0% |
| Not-for-profit Organizations | 36 | 9.6% |
| Local Government Employees | 21 | 5.6% |
| State Government Employees | 35 | 9.4% |
| Federal Government Employees | 15 | 4.0% |
| Unpaid Family Workers | 0 | 0.0% |
| Total | 374 | 100.0% |
Employment Status by Age in Brushy
According to the labor force statistics for Brushy, out of the total population over 16 years of age (753), 55.5% or 418 individuals are in the labor force, with 9.3% or 39 of them unemployed. The age group with the highest labor force participation rate is 30 to 34 years, with 100.0% or 15 individuals in the labor force. Within the labor force, the 16 to 19 years age range has the highest percentage of unemployed individuals, with 21.4% or 3 of them being unemployed.
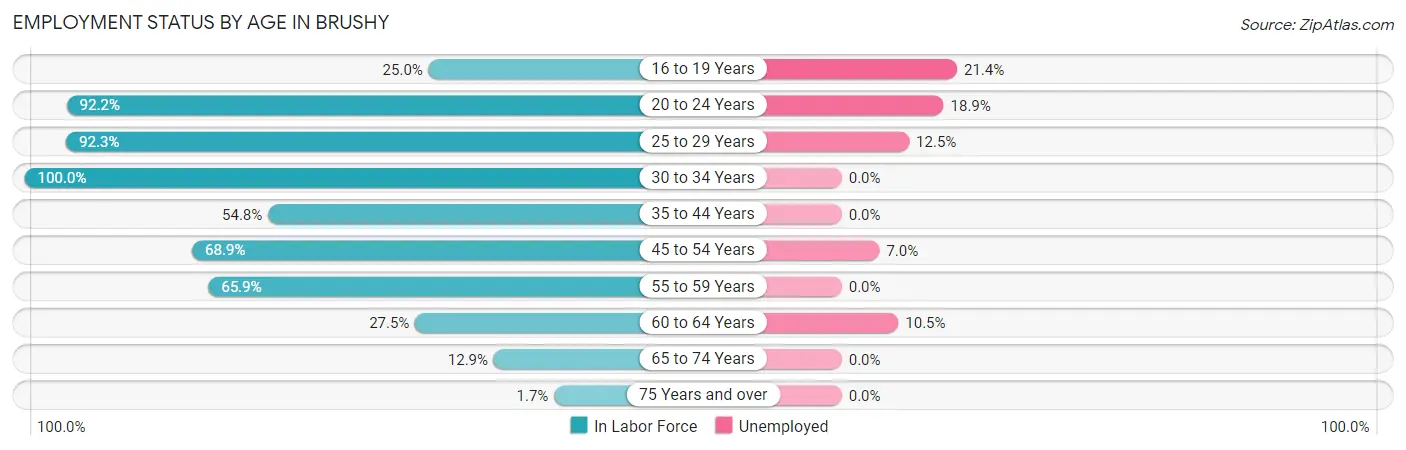
| Age Bracket | In Labor Force | Unemployed |
| 16 to 19 Years | 14 (25.0%) | 3 (21.4%) |
| 20 to 24 Years | 106 (92.2%) | 20 (18.9%) |
| 25 to 29 Years | 48 (92.3%) | 6 (12.5%) |
| 30 to 34 Years | 15 (100.0%) | 0 (0.0%) |
| 35 to 44 Years | 63 (54.8%) | 0 (0.0%) |
| 45 to 54 Years | 115 (68.9%) | 8 (7.0%) |
| 55 to 59 Years | 29 (65.9%) | 0 (0.0%) |
| 60 to 64 Years | 19 (27.5%) | 2 (10.5%) |
| 65 to 74 Years | 8 (12.9%) | 0 (0.0%) |
| 75 Years and over | 1 (1.7%) | 0 (0.0%) |
| Total | 418 (55.5%) | 39 (9.3%) |
Employment Status by Educational Attainment in Brushy
According to labor force statistics for Brushy, 62.6% of individuals (289) out of the total population between 25 and 64 years of age (462) are in the labor force, with 5.5% or 16 of them being unemployed. The group with the highest labor force participation rate are those with the educational attainment of college / associate degree, with 70.8% or 119 individuals in the labor force. Within the labor force, individuals with less than high school education have the highest percentage of unemployment, with 27.6% or 8 of them being unemployed.
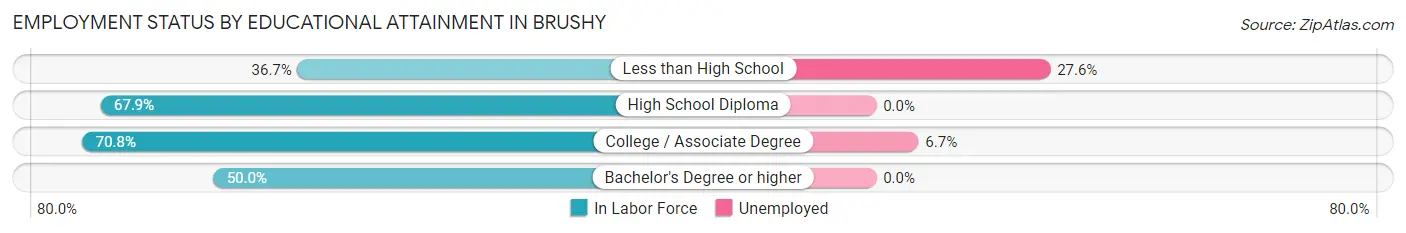
| Educational Attainment | In Labor Force | Unemployed |
| Less than High School | 29 (36.7%) | 22 (27.6%) |
| High School Diploma | 127 (67.9%) | 0 (0.0%) |
| College / Associate Degree | 119 (70.8%) | 11 (6.7%) |
| Bachelor's Degree or higher | 14 (50.0%) | 0 (0.0%) |
| Total | 289 (62.6%) | 25 (5.5%) |
Employment Occupations by Sex in Brushy
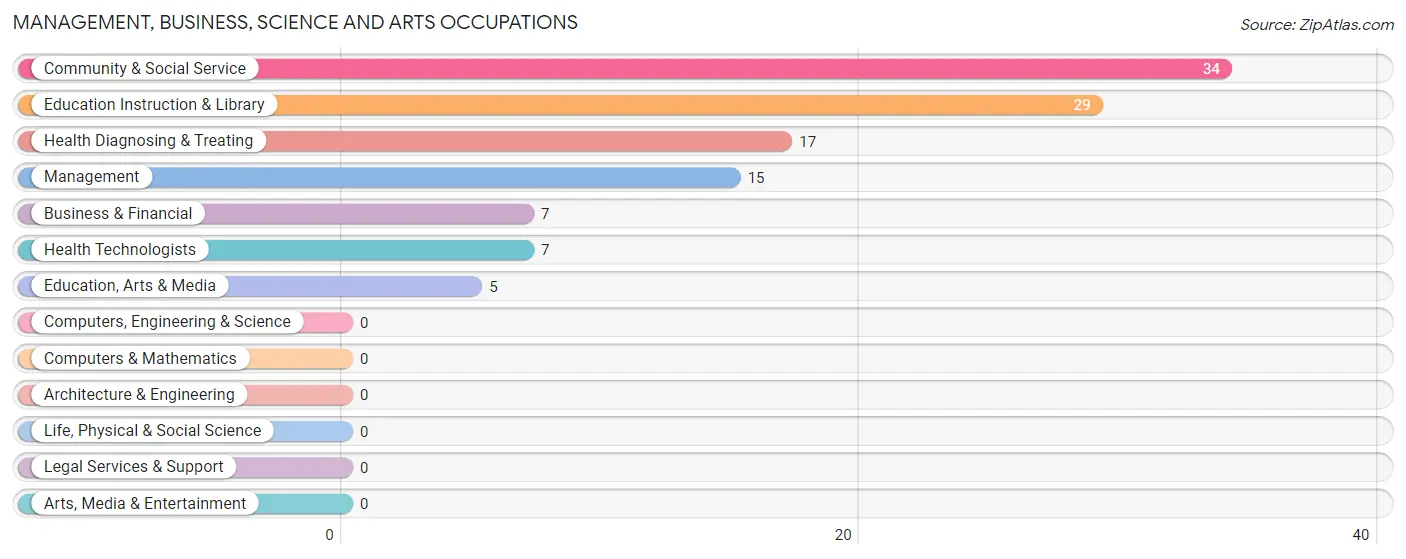
Management, Business, Science and Arts Occupations
The most common Management, Business, Science and Arts occupations in Brushy are Community & Social Service (34 | 9.0%), Education Instruction & Library (29 | 7.6%), Health Diagnosing & Treating (17 | 4.5%), Management (15 | 4.0%), and Business & Financial (7 | 1.8%).
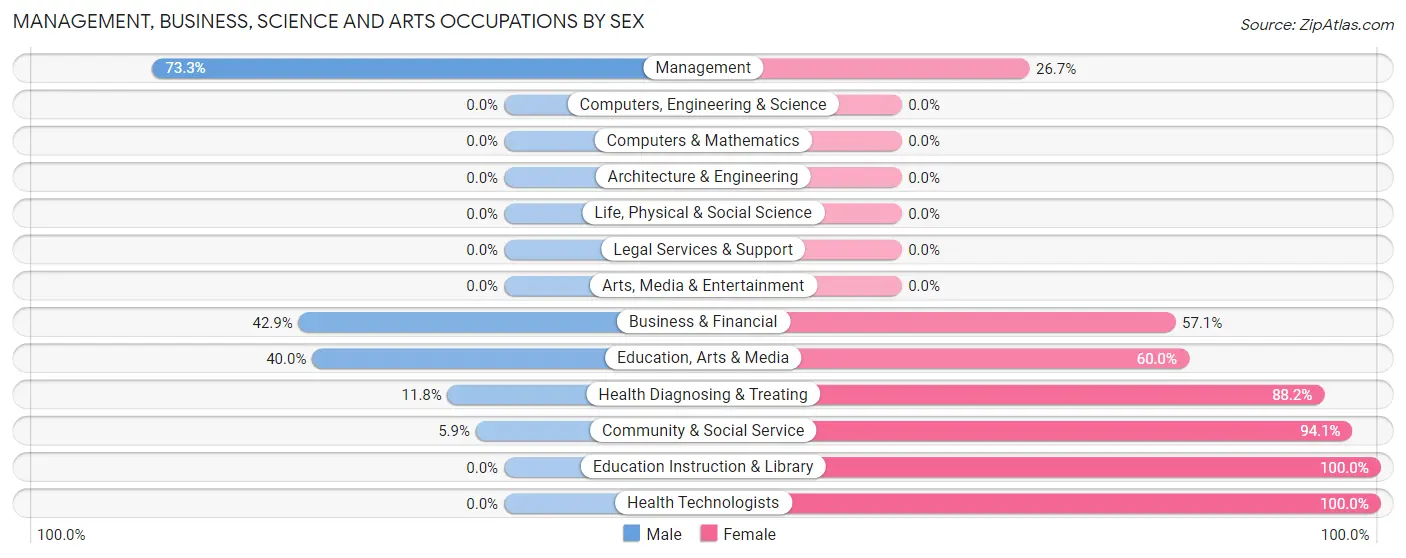
Management, Business, Science and Arts Occupations by Sex
Within the Management, Business, Science and Arts occupations in Brushy, the most male-oriented occupations are Management (73.3%), Business & Financial (42.9%), and Education, Arts & Media (40.0%), while the most female-oriented occupations are Education Instruction & Library (100.0%), Health Technologists (100.0%), and Community & Social Service (94.1%).
| Occupation | Male | Female |
| Management | 11 (73.3%) | 4 (26.7%) |
| Business & Financial | 3 (42.9%) | 4 (57.1%) |
| Computers, Engineering & Science | 0 (0.0%) | 0 (0.0%) |
| Computers & Mathematics | 0 (0.0%) | 0 (0.0%) |
| Architecture & Engineering | 0 (0.0%) | 0 (0.0%) |
| Life, Physical & Social Science | 0 (0.0%) | 0 (0.0%) |
| Community & Social Service | 2 (5.9%) | 32 (94.1%) |
| Education, Arts & Media | 2 (40.0%) | 3 (60.0%) |
| Legal Services & Support | 0 (0.0%) | 0 (0.0%) |
| Education Instruction & Library | 0 (0.0%) | 29 (100.0%) |
| Arts, Media & Entertainment | 0 (0.0%) | 0 (0.0%) |
| Health Diagnosing & Treating | 2 (11.8%) | 15 (88.2%) |
| Health Technologists | 0 (0.0%) | 7 (100.0%) |
| Total (Category) | 18 (24.7%) | 55 (75.3%) |
| Total (Overall) | 242 (63.8%) | 137 (36.1%) |
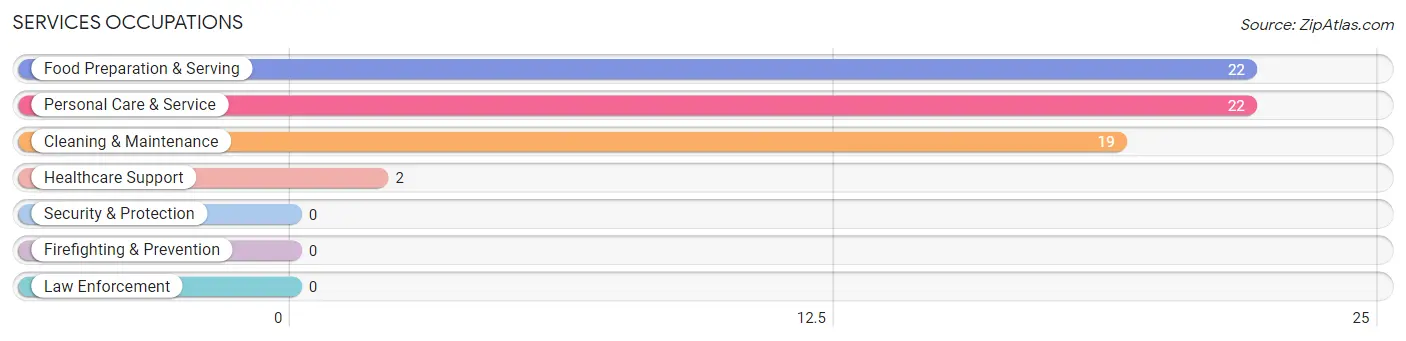
Services Occupations
The most common Services occupations in Brushy are Food Preparation & Serving (22 | 5.8%), Personal Care & Service (22 | 5.8%), Cleaning & Maintenance (19 | 5.0%), and Healthcare Support (2 | 0.5%).
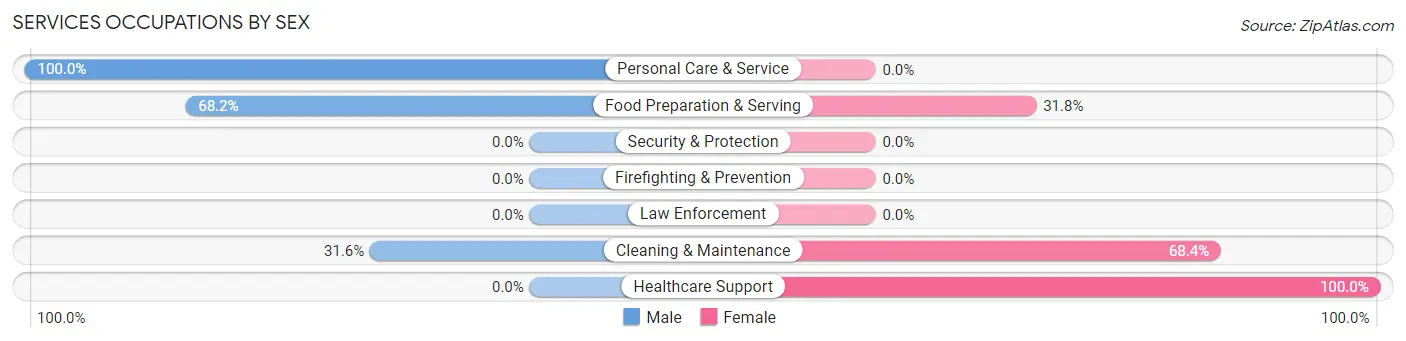
Services Occupations by Sex
Within the Services occupations in Brushy, the most male-oriented occupations are Personal Care & Service (100.0%), Food Preparation & Serving (68.2%), and Cleaning & Maintenance (31.6%), while the most female-oriented occupations are Healthcare Support (100.0%), Cleaning & Maintenance (68.4%), and Food Preparation & Serving (31.8%).
| Occupation | Male | Female |
| Healthcare Support | 0 (0.0%) | 2 (100.0%) |
| Security & Protection | 0 (0.0%) | 0 (0.0%) |
| Firefighting & Prevention | 0 (0.0%) | 0 (0.0%) |
| Law Enforcement | 0 (0.0%) | 0 (0.0%) |
| Food Preparation & Serving | 15 (68.2%) | 7 (31.8%) |
| Cleaning & Maintenance | 6 (31.6%) | 13 (68.4%) |
| Personal Care & Service | 22 (100.0%) | 0 (0.0%) |
| Total (Category) | 43 (66.1%) | 22 (33.9%) |
| Total (Overall) | 242 (63.8%) | 137 (36.1%) |
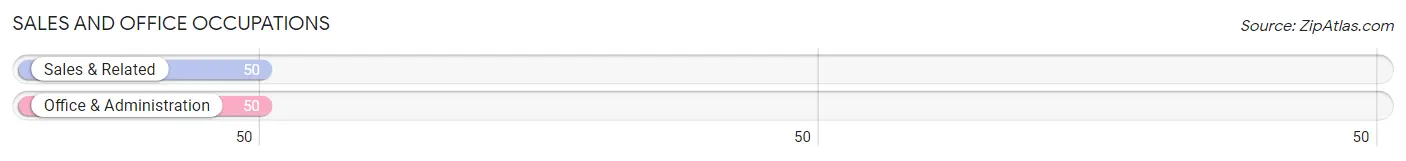
Sales and Office Occupations
The most common Sales and Office occupations in Brushy are Sales & Related (50 | 13.2%), and Office & Administration (50 | 13.2%).
Sales and Office Occupations by Sex
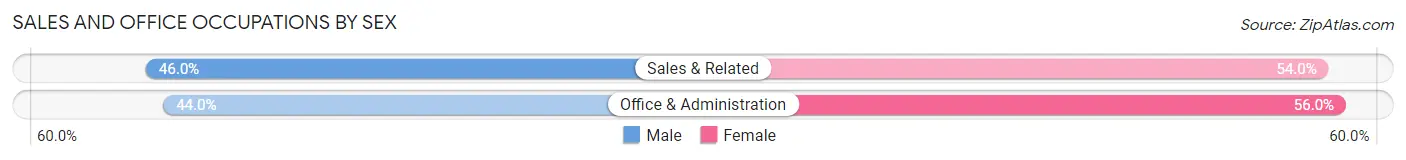
| Occupation | Male | Female |
| Sales & Related | 23 (46.0%) | 27 (54.0%) |
| Office & Administration | 22 (44.0%) | 28 (56.0%) |
| Total (Category) | 45 (45.0%) | 55 (55.0%) |
| Total (Overall) | 242 (63.8%) | 137 (36.1%) |
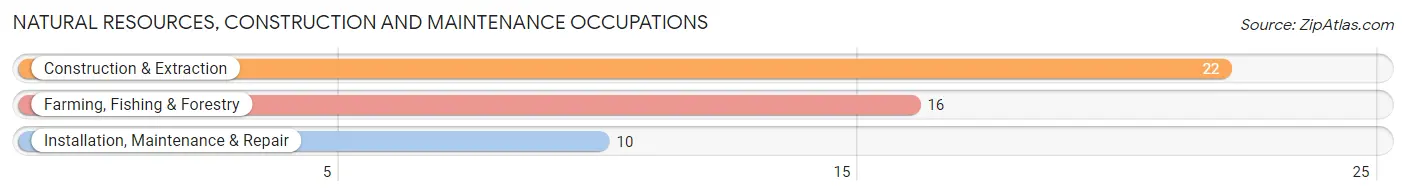
Natural Resources, Construction and Maintenance Occupations
The most common Natural Resources, Construction and Maintenance occupations in Brushy are Construction & Extraction (22 | 5.8%), Farming, Fishing & Forestry (16 | 4.2%), and Installation, Maintenance & Repair (10 | 2.6%).
Natural Resources, Construction and Maintenance Occupations by Sex
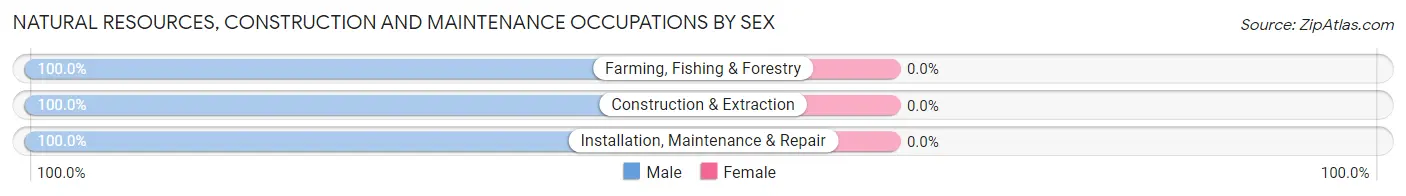
| Occupation | Male | Female |
| Farming, Fishing & Forestry | 16 (100.0%) | 0 (0.0%) |
| Construction & Extraction | 22 (100.0%) | 0 (0.0%) |
| Installation, Maintenance & Repair | 10 (100.0%) | 0 (0.0%) |
| Total (Category) | 48 (100.0%) | 0 (0.0%) |
| Total (Overall) | 242 (63.8%) | 137 (36.1%) |
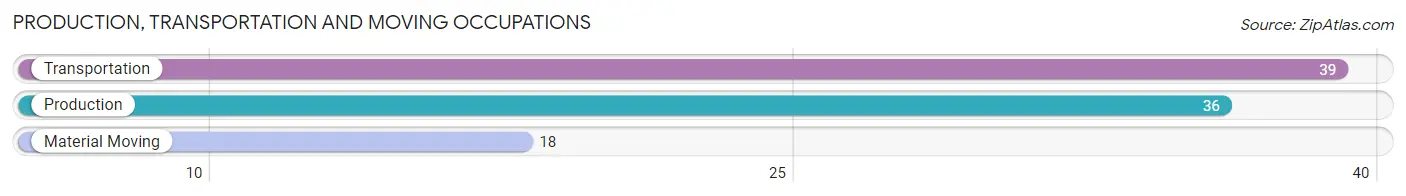
Production, Transportation and Moving Occupations
The most common Production, Transportation and Moving occupations in Brushy are Transportation (39 | 10.3%), Production (36 | 9.5%), and Material Moving (18 | 4.8%).
Production, Transportation and Moving Occupations by Sex
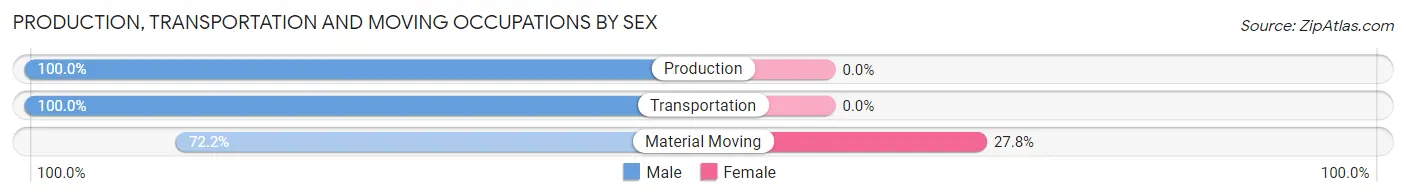
| Occupation | Male | Female |
| Production | 36 (100.0%) | 0 (0.0%) |
| Transportation | 39 (100.0%) | 0 (0.0%) |
| Material Moving | 13 (72.2%) | 5 (27.8%) |
| Total (Category) | 88 (94.6%) | 5 (5.4%) |
| Total (Overall) | 242 (63.8%) | 137 (36.1%) |
Employment Industries by Sex in Brushy
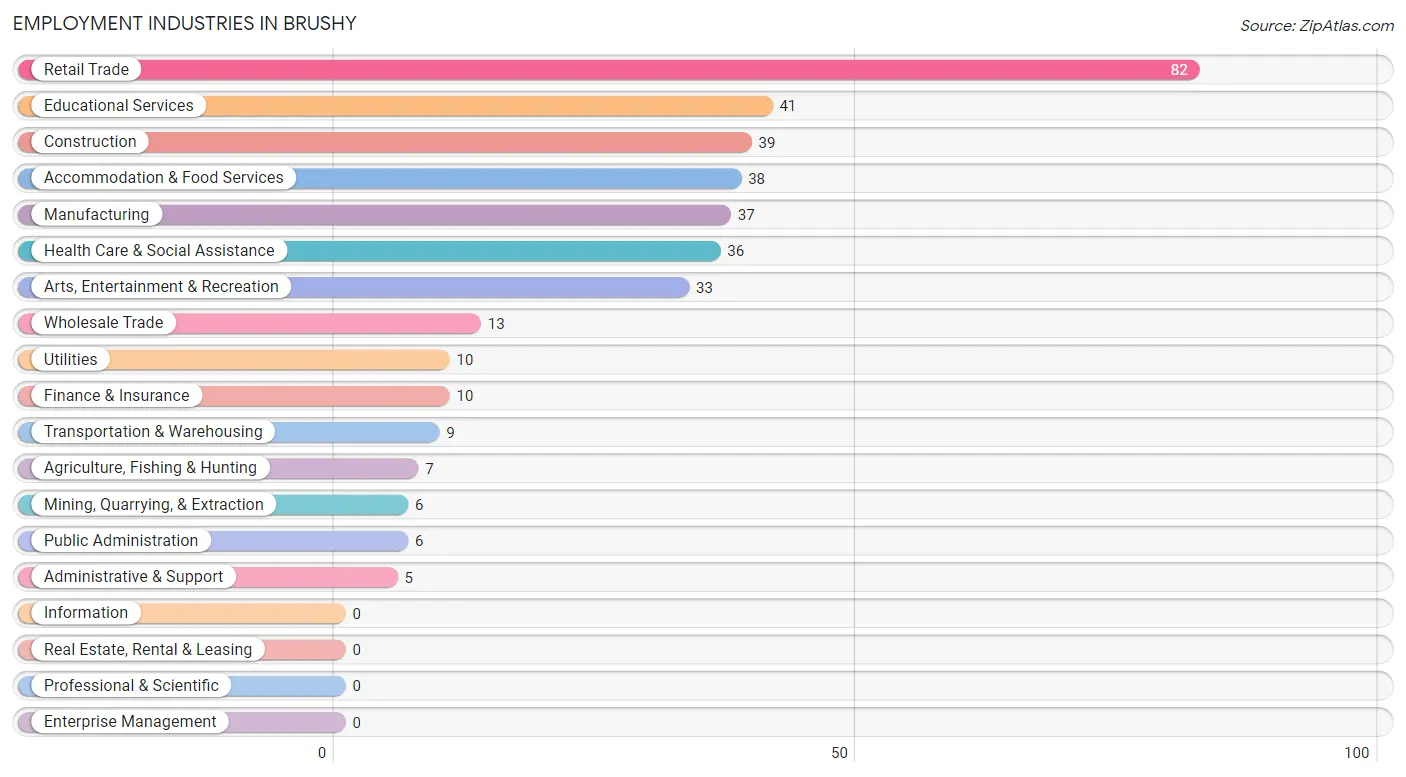
Employment Industries in Brushy
The major employment industries in Brushy include Retail Trade (82 | 21.6%), Educational Services (41 | 10.8%), Construction (39 | 10.3%), Accommodation & Food Services (38 | 10.0%), and Manufacturing (37 | 9.8%).
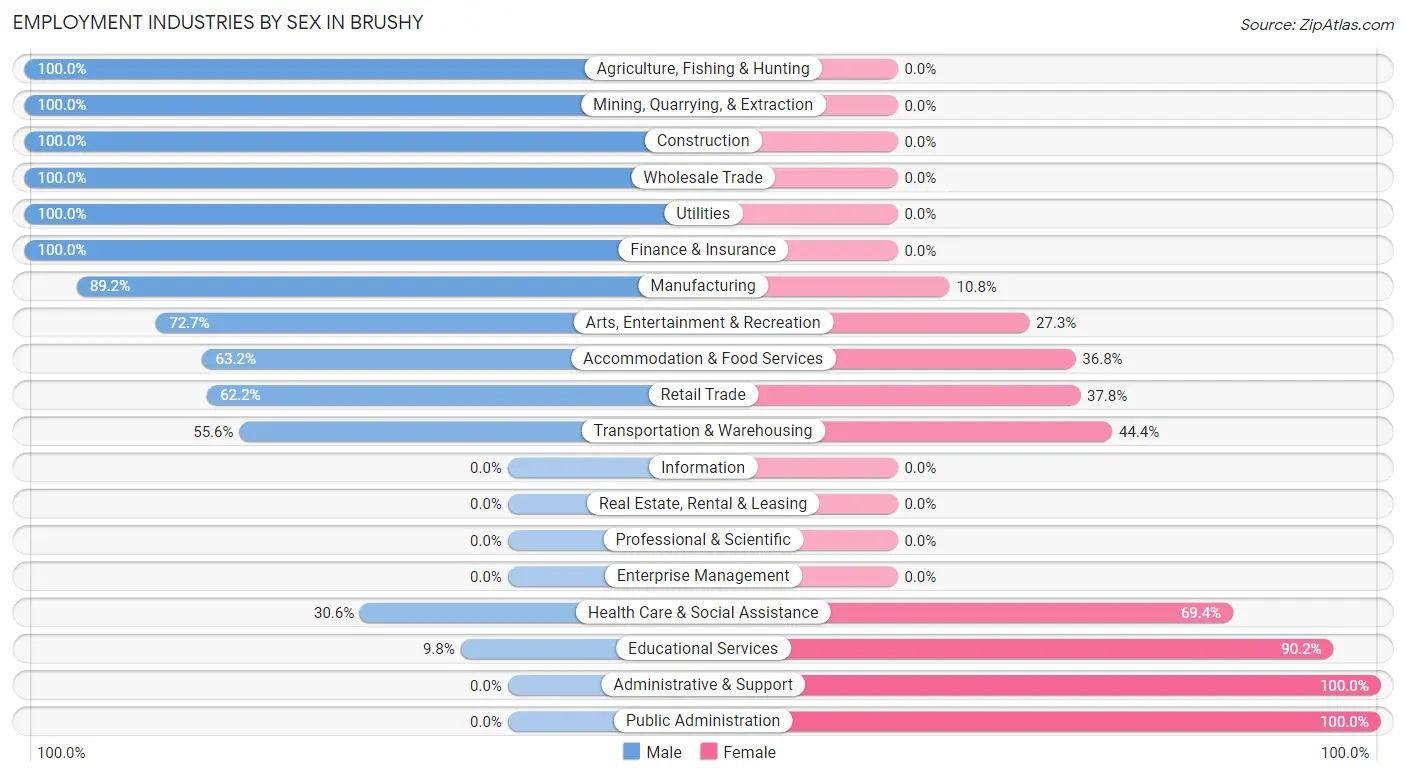
Employment Industries by Sex in Brushy
The Brushy industries that see more men than women are Agriculture, Fishing & Hunting (100.0%), Mining, Quarrying, & Extraction (100.0%), and Construction (100.0%), whereas the industries that tend to have a higher number of women are Administrative & Support (100.0%), Public Administration (100.0%), and Educational Services (90.2%).
| Industry | Male | Female |
| Agriculture, Fishing & Hunting | 7 (100.0%) | 0 (0.0%) |
| Mining, Quarrying, & Extraction | 6 (100.0%) | 0 (0.0%) |
| Construction | 39 (100.0%) | 0 (0.0%) |
| Manufacturing | 33 (89.2%) | 4 (10.8%) |
| Wholesale Trade | 13 (100.0%) | 0 (0.0%) |
| Retail Trade | 51 (62.2%) | 31 (37.8%) |
| Transportation & Warehousing | 5 (55.6%) | 4 (44.4%) |
| Utilities | 10 (100.0%) | 0 (0.0%) |
| Information | 0 (0.0%) | 0 (0.0%) |
| Finance & Insurance | 10 (100.0%) | 0 (0.0%) |
| Real Estate, Rental & Leasing | 0 (0.0%) | 0 (0.0%) |
| Professional & Scientific | 0 (0.0%) | 0 (0.0%) |
| Enterprise Management | 0 (0.0%) | 0 (0.0%) |
| Administrative & Support | 0 (0.0%) | 5 (100.0%) |
| Educational Services | 4 (9.8%) | 37 (90.2%) |
| Health Care & Social Assistance | 11 (30.6%) | 25 (69.4%) |
| Arts, Entertainment & Recreation | 24 (72.7%) | 9 (27.3%) |
| Accommodation & Food Services | 24 (63.2%) | 14 (36.8%) |
| Public Administration | 0 (0.0%) | 6 (100.0%) |
| Total | 242 (63.8%) | 137 (36.1%) |
Education in Brushy
School Enrollment in Brushy
The most common levels of schooling among the 231 students in Brushy are high school (81 | 35.1%), elementary school (65 | 28.1%), and middle school (60 | 26.0%).
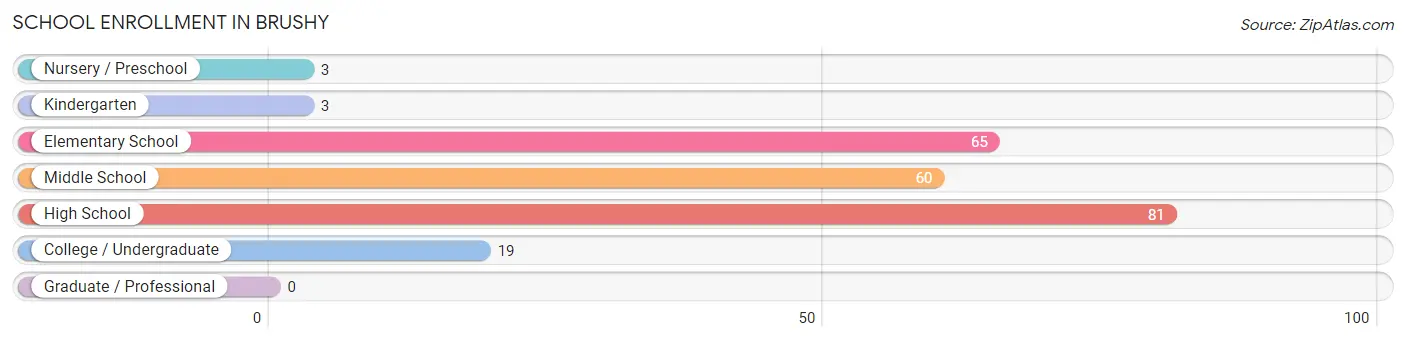
| School Level | # Students | % Students |
| Nursery / Preschool | 3 | 1.3% |
| Kindergarten | 3 | 1.3% |
| Elementary School | 65 | 28.1% |
| Middle School | 60 | 26.0% |
| High School | 81 | 35.1% |
| College / Undergraduate | 19 | 8.2% |
| Graduate / Professional | 0 | 0.0% |
| Total | 231 | 100.0% |
School Enrollment by Age by Funding Source in Brushy
Out of a total of 231 students who are enrolled in schools in Brushy, 25 (10.8%) attend a private institution, while the remaining 206 (89.2%) are enrolled in public schools. The age group of 15 to 17 year olds has the highest likelihood of being enrolled in private schools, with 13 (21.3% in the age bracket) enrolled. Conversely, the age group of 5 to 9 year old has the lowest likelihood of being enrolled in a private school, with 59 (100.0% in the age bracket) attending a public institution.
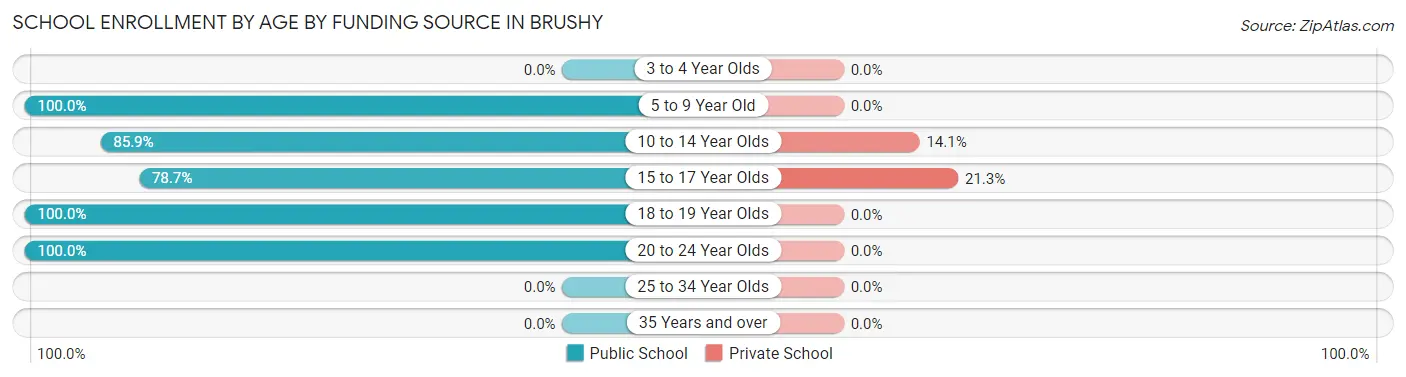
| Age Bracket | Public School | Private School |
| 3 to 4 Year Olds | 0 (0.0%) | 0 (0.0%) |
| 5 to 9 Year Old | 59 (100.0%) | 0 (0.0%) |
| 10 to 14 Year Olds | 73 (85.9%) | 12 (14.1%) |
| 15 to 17 Year Olds | 48 (78.7%) | 13 (21.3%) |
| 18 to 19 Year Olds | 7 (100.0%) | 0 (0.0%) |
| 20 to 24 Year Olds | 19 (100.0%) | 0 (0.0%) |
| 25 to 34 Year Olds | 0 (0.0%) | 0 (0.0%) |
| 35 Years and over | 0 (0.0%) | 0 (0.0%) |
| Total | 206 (89.2%) | 25 (10.8%) |
Educational Attainment by Field of Study in Brushy
Education (39 | 67.2%), liberal arts & history (7 | 12.1%), bio, nature & agricultural (4 | 6.9%), physical & health sciences (4 | 6.9%), and literature & languages (4 | 6.9%) are the most common fields of study among 58 individuals in Brushy who have obtained a bachelor's degree or higher.
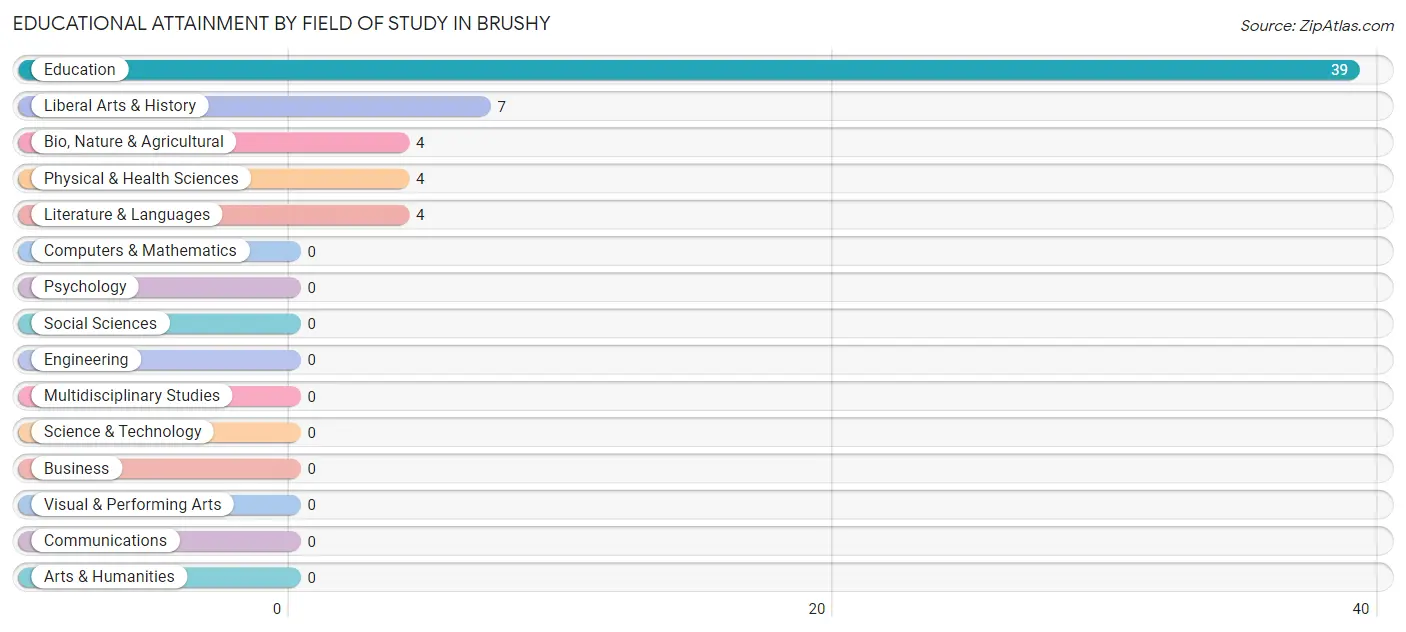
| Field of Study | # Graduates | % Graduates |
| Computers & Mathematics | 0 | 0.0% |
| Bio, Nature & Agricultural | 4 | 6.9% |
| Physical & Health Sciences | 4 | 6.9% |
| Psychology | 0 | 0.0% |
| Social Sciences | 0 | 0.0% |
| Engineering | 0 | 0.0% |
| Multidisciplinary Studies | 0 | 0.0% |
| Science & Technology | 0 | 0.0% |
| Business | 0 | 0.0% |
| Education | 39 | 67.2% |
| Literature & Languages | 4 | 6.9% |
| Liberal Arts & History | 7 | 12.1% |
| Visual & Performing Arts | 0 | 0.0% |
| Communications | 0 | 0.0% |
| Arts & Humanities | 0 | 0.0% |
| Total | 58 | 100.0% |
Transportation & Commute in Brushy
Vehicle Availability by Sex in Brushy
The most prevalent vehicle ownership categories in Brushy are males with 2 vehicles (80, accounting for 33.8%) and females with 2 vehicles (40, making up 58.4%).
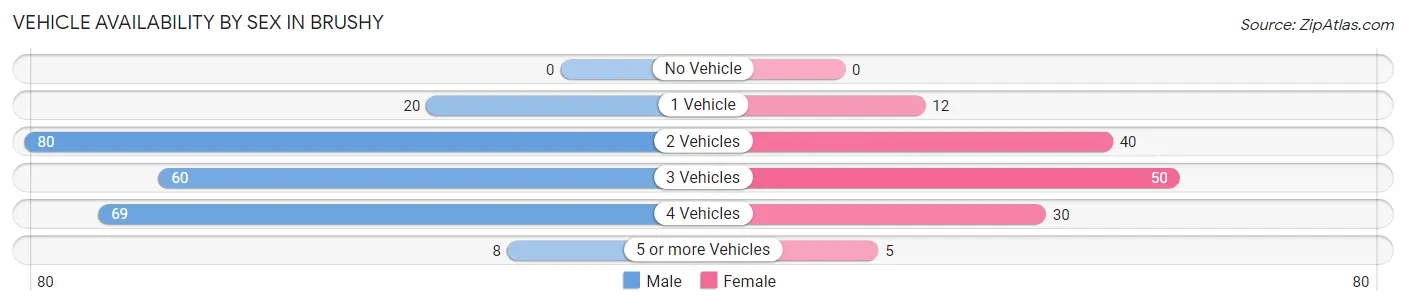
| Vehicles Available | Male | Female |
| No Vehicle | 0 (0.0%) | 0 (0.0%) |
| 1 Vehicle | 20 (8.4%) | 12 (8.8%) |
| 2 Vehicles | 80 (33.8%) | 40 (29.2%) |
| 3 Vehicles | 60 (25.3%) | 50 (36.5%) |
| 4 Vehicles | 69 (29.1%) | 30 (21.9%) |
| 5 or more Vehicles | 8 (3.4%) | 5 (3.6%) |
| Total | 237 (100.0%) | 137 (100.0%) |
Commute Time in Brushy
The most frequently occuring commute durations in Brushy are 20 to 24 minutes (68 commuters, 18.6%), 15 to 19 minutes (66 commuters, 18.0%), and 45 to 59 minutes (59 commuters, 16.1%).
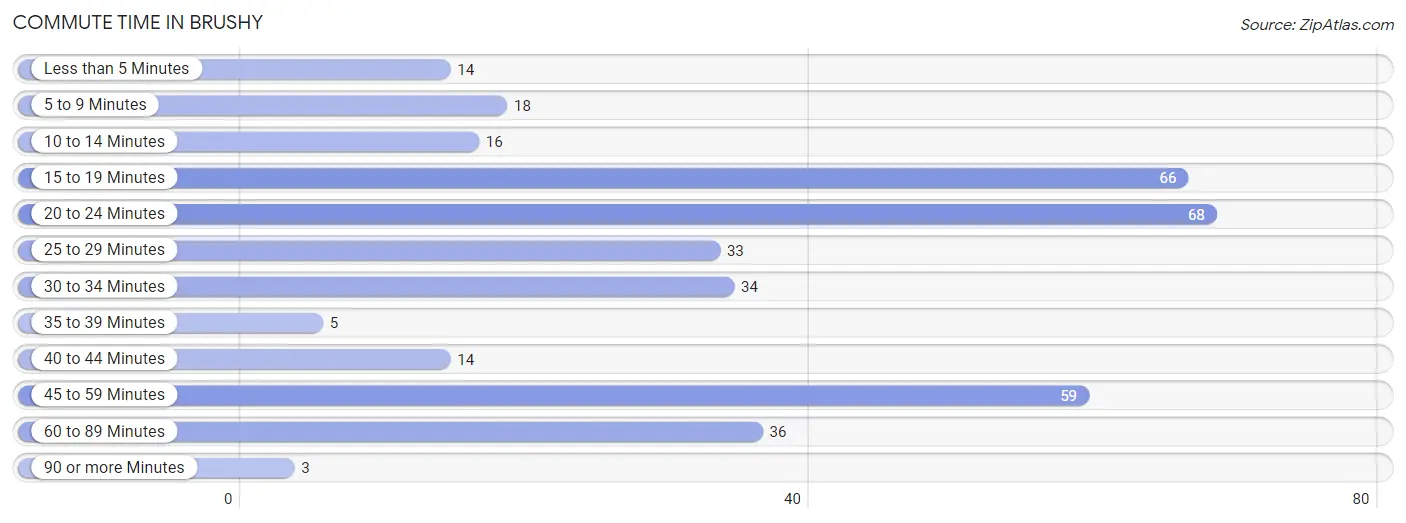
| Commute Time | # Commuters | % Commuters |
| Less than 5 Minutes | 14 | 3.8% |
| 5 to 9 Minutes | 18 | 4.9% |
| 10 to 14 Minutes | 16 | 4.4% |
| 15 to 19 Minutes | 66 | 18.0% |
| 20 to 24 Minutes | 68 | 18.6% |
| 25 to 29 Minutes | 33 | 9.0% |
| 30 to 34 Minutes | 34 | 9.3% |
| 35 to 39 Minutes | 5 | 1.4% |
| 40 to 44 Minutes | 14 | 3.8% |
| 45 to 59 Minutes | 59 | 16.1% |
| 60 to 89 Minutes | 36 | 9.8% |
| 90 or more Minutes | 3 | 0.8% |
Commute Time by Sex in Brushy
The most common commute times in Brushy are 45 to 59 minutes (55 commuters, 23.5%) for males and 15 to 19 minutes (44 commuters, 33.3%) for females.
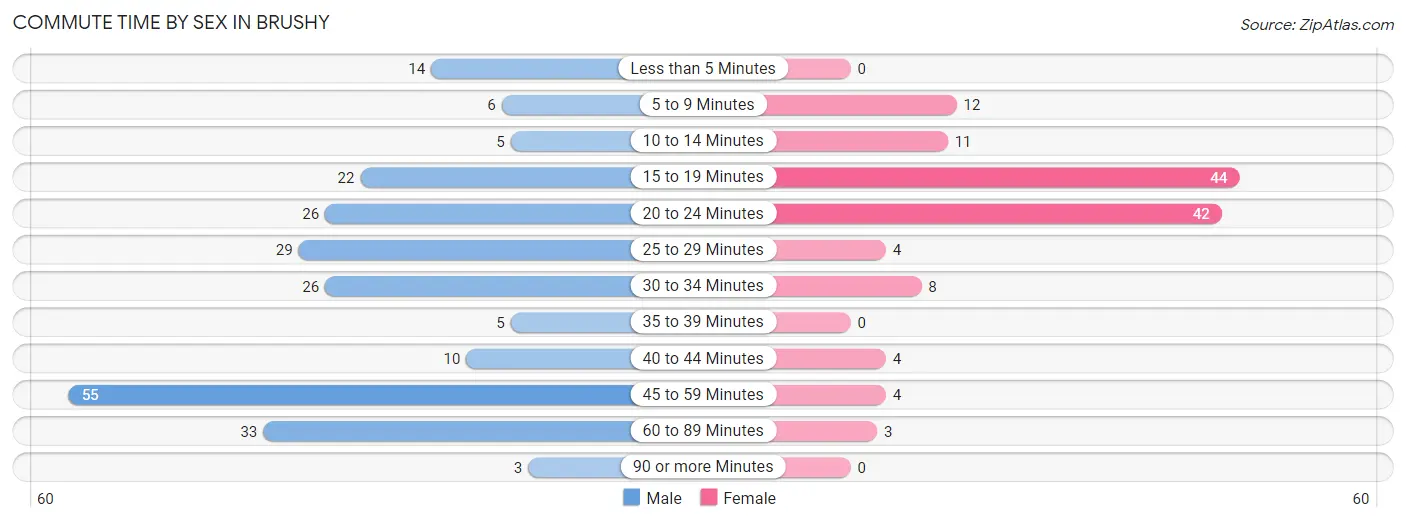
| Commute Time | Male | Female |
| Less than 5 Minutes | 14 (6.0%) | 0 (0.0%) |
| 5 to 9 Minutes | 6 (2.6%) | 12 (9.1%) |
| 10 to 14 Minutes | 5 (2.1%) | 11 (8.3%) |
| 15 to 19 Minutes | 22 (9.4%) | 44 (33.3%) |
| 20 to 24 Minutes | 26 (11.1%) | 42 (31.8%) |
| 25 to 29 Minutes | 29 (12.4%) | 4 (3.0%) |
| 30 to 34 Minutes | 26 (11.1%) | 8 (6.1%) |
| 35 to 39 Minutes | 5 (2.1%) | 0 (0.0%) |
| 40 to 44 Minutes | 10 (4.3%) | 4 (3.0%) |
| 45 to 59 Minutes | 55 (23.5%) | 4 (3.0%) |
| 60 to 89 Minutes | 33 (14.1%) | 3 (2.3%) |
| 90 or more Minutes | 3 (1.3%) | 0 (0.0%) |
Time of Departure to Work by Sex in Brushy
The most frequent times of departure to work in Brushy are 6:30 AM to 6:59 AM (62, 26.5%) for males and 7:30 AM to 7:59 AM (49, 37.1%) for females.
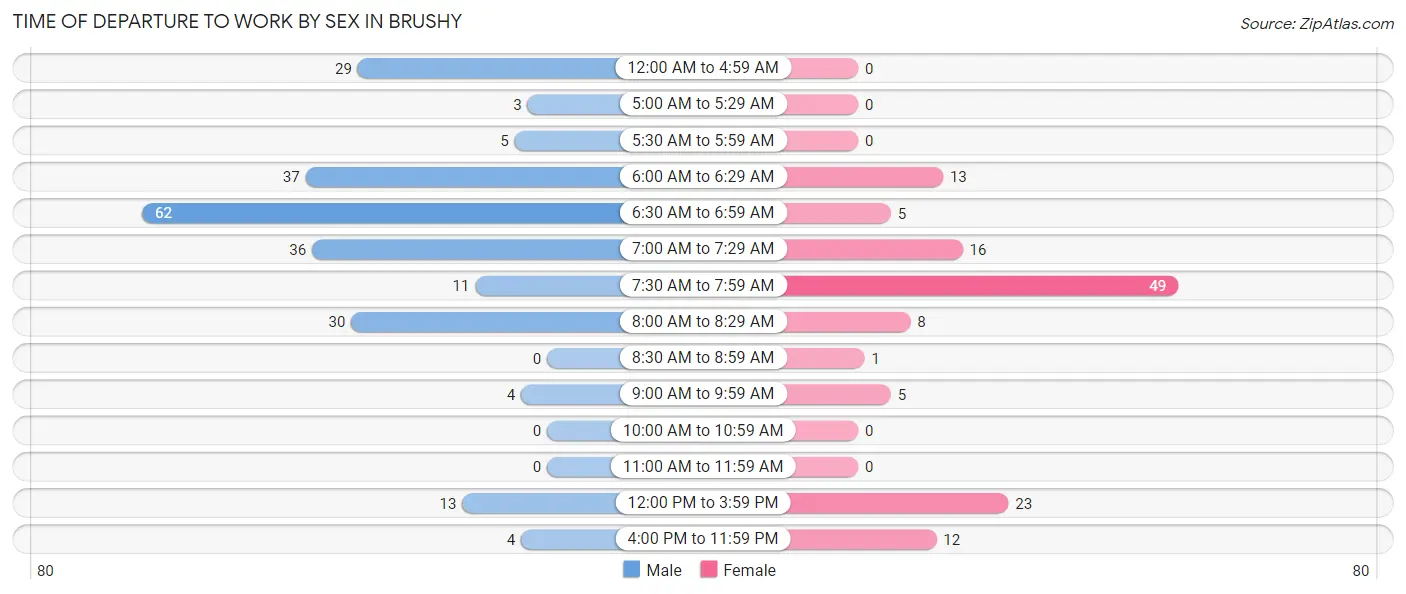
| Time of Departure | Male | Female |
| 12:00 AM to 4:59 AM | 29 (12.4%) | 0 (0.0%) |
| 5:00 AM to 5:29 AM | 3 (1.3%) | 0 (0.0%) |
| 5:30 AM to 5:59 AM | 5 (2.1%) | 0 (0.0%) |
| 6:00 AM to 6:29 AM | 37 (15.8%) | 13 (9.9%) |
| 6:30 AM to 6:59 AM | 62 (26.5%) | 5 (3.8%) |
| 7:00 AM to 7:29 AM | 36 (15.4%) | 16 (12.1%) |
| 7:30 AM to 7:59 AM | 11 (4.7%) | 49 (37.1%) |
| 8:00 AM to 8:29 AM | 30 (12.8%) | 8 (6.1%) |
| 8:30 AM to 8:59 AM | 0 (0.0%) | 1 (0.8%) |
| 9:00 AM to 9:59 AM | 4 (1.7%) | 5 (3.8%) |
| 10:00 AM to 10:59 AM | 0 (0.0%) | 0 (0.0%) |
| 11:00 AM to 11:59 AM | 0 (0.0%) | 0 (0.0%) |
| 12:00 PM to 3:59 PM | 13 (5.6%) | 23 (17.4%) |
| 4:00 PM to 11:59 PM | 4 (1.7%) | 12 (9.1%) |
| Total | 234 (100.0%) | 132 (100.0%) |
Housing Occupancy in Brushy
Occupancy by Ownership in Brushy
Of the total 272 dwellings in Brushy, owner-occupied units account for 265 (97.4%), while renter-occupied units make up 7 (2.6%).
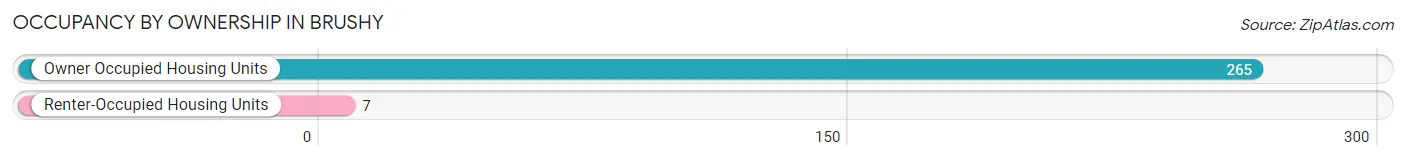
| Occupancy | # Housing Units | % Housing Units |
| Owner Occupied Housing Units | 265 | 97.4% |
| Renter-Occupied Housing Units | 7 | 2.6% |
| Total Occupied Housing Units | 272 | 100.0% |
Occupancy by Household Size in Brushy
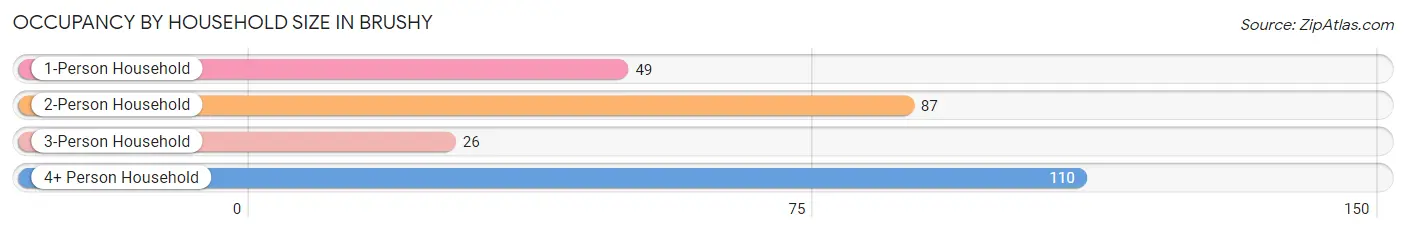
| Household Size | # Housing Units | % Housing Units |
| 1-Person Household | 49 | 18.0% |
| 2-Person Household | 87 | 32.0% |
| 3-Person Household | 26 | 9.6% |
| 4+ Person Household | 110 | 40.4% |
| Total Housing Units | 272 | 100.0% |
Occupancy by Ownership by Household Size in Brushy
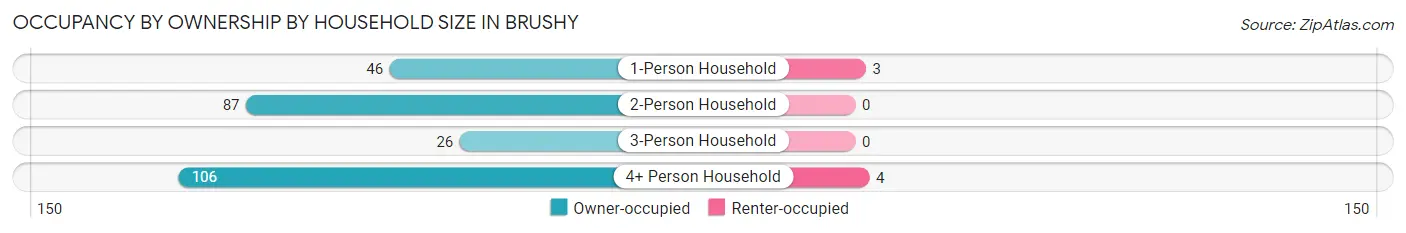
| Household Size | Owner-occupied | Renter-occupied |
| 1-Person Household | 46 (93.9%) | 3 (6.1%) |
| 2-Person Household | 87 (100.0%) | 0 (0.0%) |
| 3-Person Household | 26 (100.0%) | 0 (0.0%) |
| 4+ Person Household | 106 (96.4%) | 4 (3.6%) |
| Total Housing Units | 265 (97.4%) | 7 (2.6%) |
Occupancy by Educational Attainment in Brushy
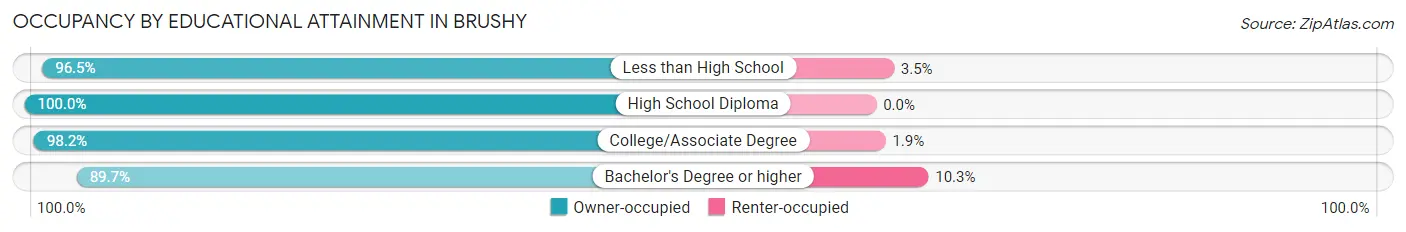
| Household Size | Owner-occupied | Renter-occupied |
| Less than High School | 55 (96.5%) | 2 (3.5%) |
| High School Diploma | 78 (100.0%) | 0 (0.0%) |
| College/Associate Degree | 106 (98.2%) | 2 (1.8%) |
| Bachelor's Degree or higher | 26 (89.7%) | 3 (10.3%) |
Occupancy by Age of Householder in Brushy
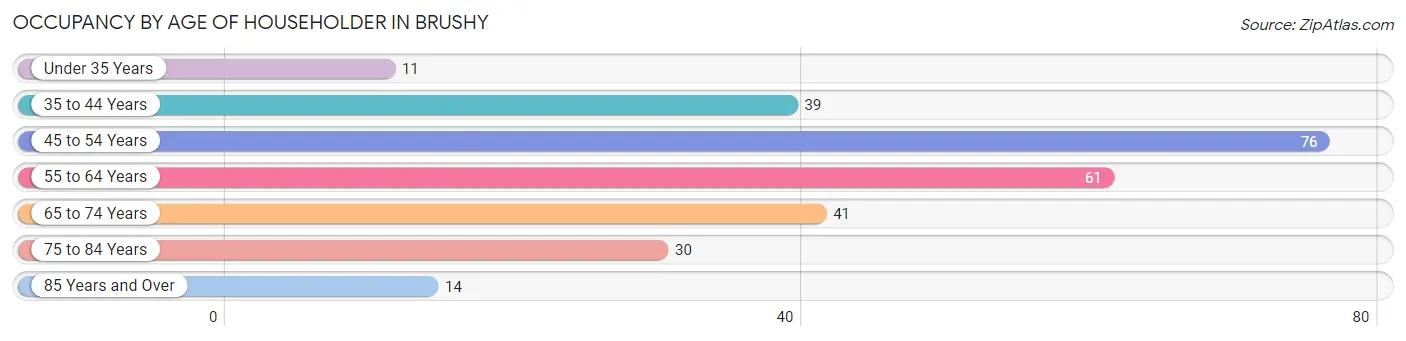
| Age Bracket | # Households | % Households |
| Under 35 Years | 11 | 4.0% |
| 35 to 44 Years | 39 | 14.3% |
| 45 to 54 Years | 76 | 27.9% |
| 55 to 64 Years | 61 | 22.4% |
| 65 to 74 Years | 41 | 15.1% |
| 75 to 84 Years | 30 | 11.0% |
| 85 Years and Over | 14 | 5.1% |
| Total | 272 | 100.0% |
Housing Finances in Brushy
Median Income by Occupancy in Brushy
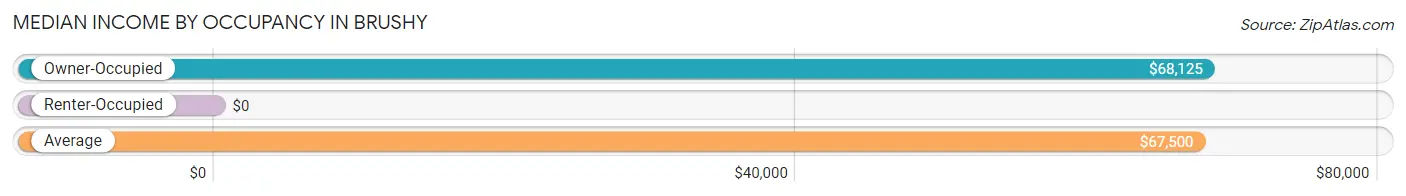
| Occupancy Type | # Households | Median Income |
| Owner-Occupied | 265 (97.4%) | $68,125 |
| Renter-Occupied | 7 (2.6%) | $0 |
| Average | 272 (100.0%) | $67,500 |
Occupancy by Householder Income Bracket in Brushy
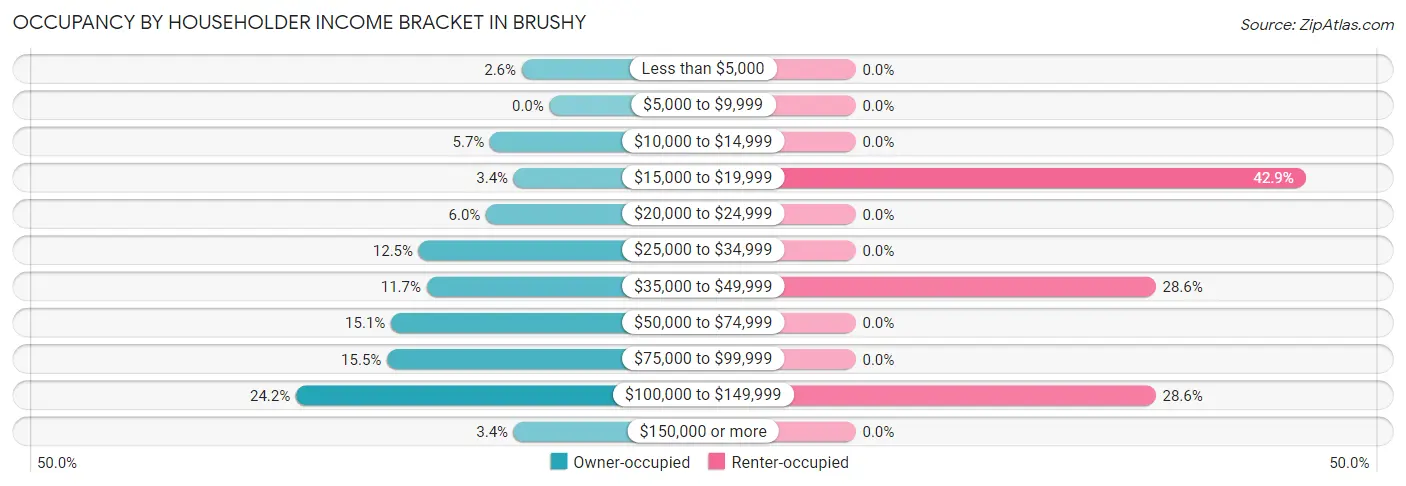
| Income Bracket | Owner-occupied | Renter-occupied |
| Less than $5,000 | 7 (2.6%) | 0 (0.0%) |
| $5,000 to $9,999 | 0 (0.0%) | 0 (0.0%) |
| $10,000 to $14,999 | 15 (5.7%) | 0 (0.0%) |
| $15,000 to $19,999 | 9 (3.4%) | 3 (42.9%) |
| $20,000 to $24,999 | 16 (6.0%) | 0 (0.0%) |
| $25,000 to $34,999 | 33 (12.4%) | 0 (0.0%) |
| $35,000 to $49,999 | 31 (11.7%) | 2 (28.6%) |
| $50,000 to $74,999 | 40 (15.1%) | 0 (0.0%) |
| $75,000 to $99,999 | 41 (15.5%) | 0 (0.0%) |
| $100,000 to $149,999 | 64 (24.1%) | 2 (28.6%) |
| $150,000 or more | 9 (3.4%) | 0 (0.0%) |
| Total | 265 (100.0%) | 7 (100.0%) |
Monthly Housing Cost Tiers in Brushy
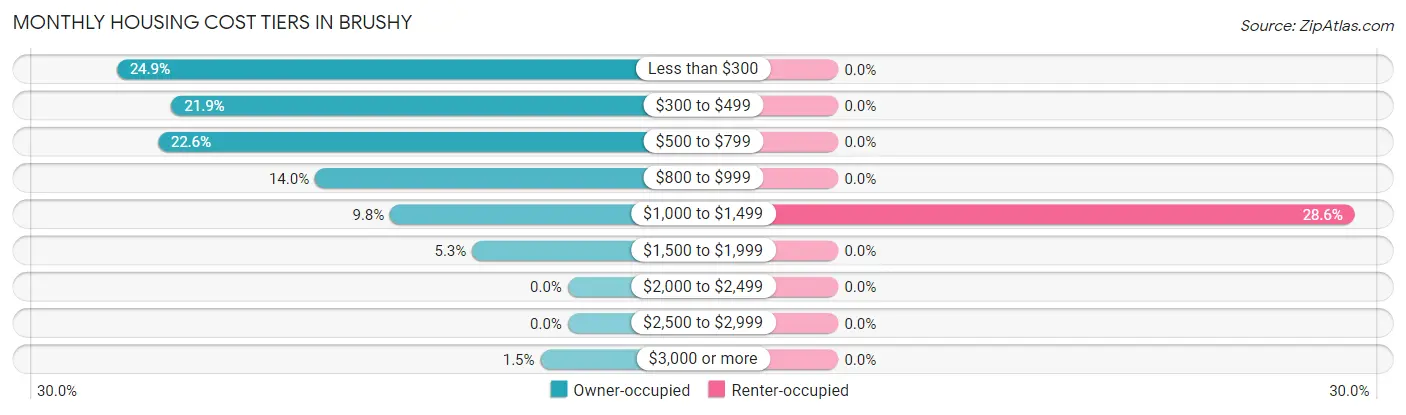
| Monthly Cost | Owner-occupied | Renter-occupied |
| Less than $300 | 66 (24.9%) | 0 (0.0%) |
| $300 to $499 | 58 (21.9%) | 0 (0.0%) |
| $500 to $799 | 60 (22.6%) | 0 (0.0%) |
| $800 to $999 | 37 (14.0%) | 0 (0.0%) |
| $1,000 to $1,499 | 26 (9.8%) | 2 (28.6%) |
| $1,500 to $1,999 | 14 (5.3%) | 0 (0.0%) |
| $2,000 to $2,499 | 0 (0.0%) | 0 (0.0%) |
| $2,500 to $2,999 | 0 (0.0%) | 0 (0.0%) |
| $3,000 or more | 4 (1.5%) | 0 (0.0%) |
| Total | 265 (100.0%) | 7 (100.0%) |
Physical Housing Characteristics in Brushy
Housing Structures in Brushy
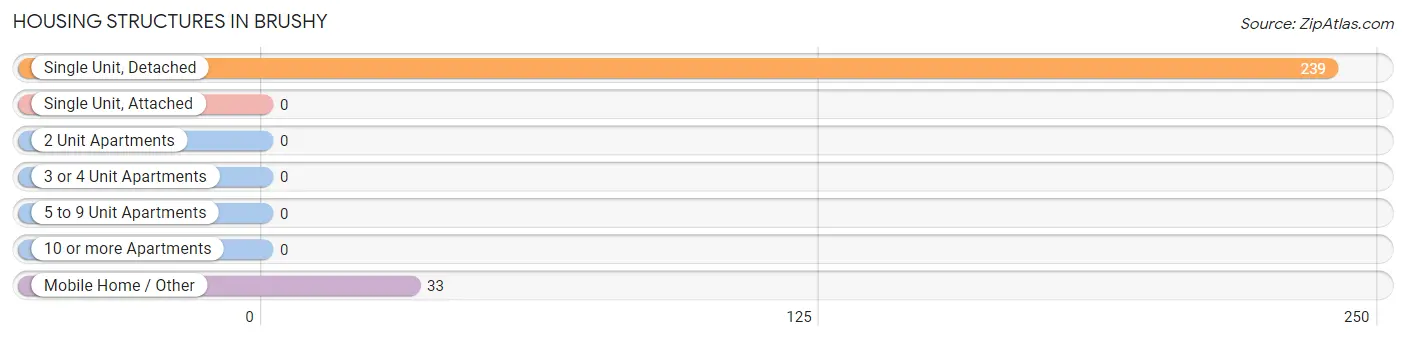
| Structure Type | # Housing Units | % Housing Units |
| Single Unit, Detached | 239 | 87.9% |
| Single Unit, Attached | 0 | 0.0% |
| 2 Unit Apartments | 0 | 0.0% |
| 3 or 4 Unit Apartments | 0 | 0.0% |
| 5 to 9 Unit Apartments | 0 | 0.0% |
| 10 or more Apartments | 0 | 0.0% |
| Mobile Home / Other | 33 | 12.1% |
| Total | 272 | 100.0% |
Housing Structures by Occupancy in Brushy
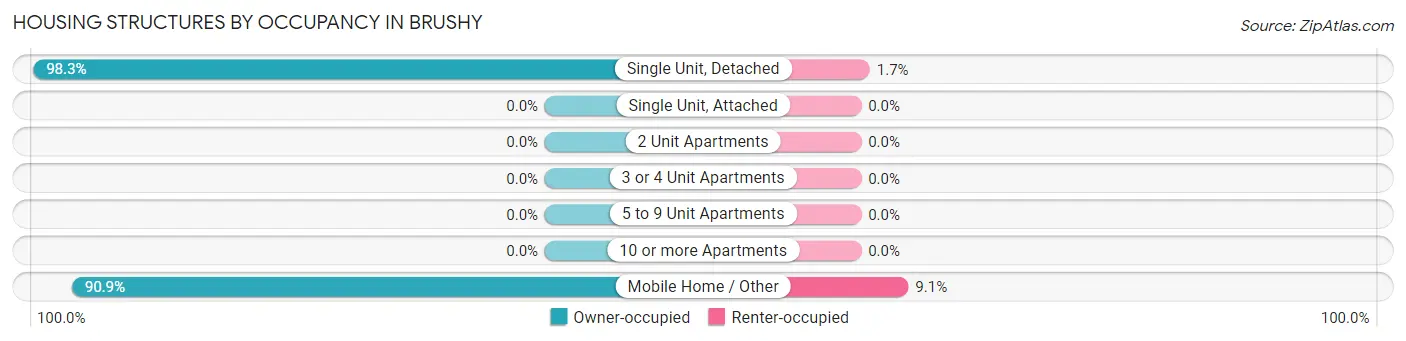
| Structure Type | Owner-occupied | Renter-occupied |
| Single Unit, Detached | 235 (98.3%) | 4 (1.7%) |
| Single Unit, Attached | 0 (0.0%) | 0 (0.0%) |
| 2 Unit Apartments | 0 (0.0%) | 0 (0.0%) |
| 3 or 4 Unit Apartments | 0 (0.0%) | 0 (0.0%) |
| 5 to 9 Unit Apartments | 0 (0.0%) | 0 (0.0%) |
| 10 or more Apartments | 0 (0.0%) | 0 (0.0%) |
| Mobile Home / Other | 30 (90.9%) | 3 (9.1%) |
| Total | 265 (97.4%) | 7 (2.6%) |
Housing Structures by Number of Rooms in Brushy
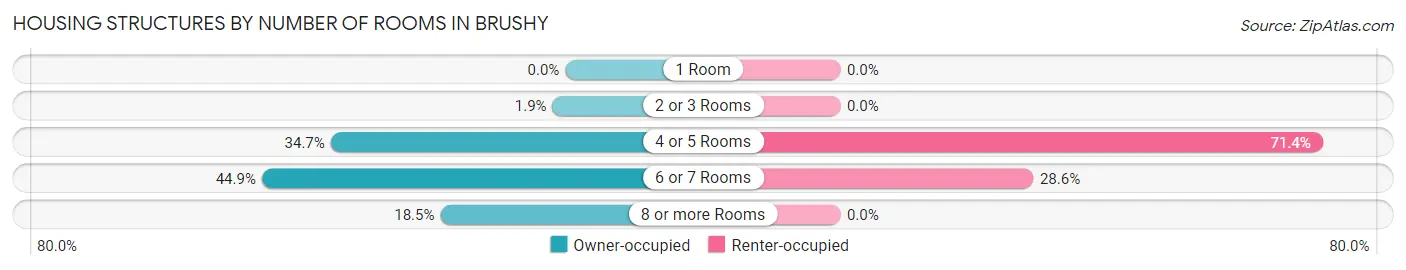
| Number of Rooms | Owner-occupied | Renter-occupied |
| 1 Room | 0 (0.0%) | 0 (0.0%) |
| 2 or 3 Rooms | 5 (1.9%) | 0 (0.0%) |
| 4 or 5 Rooms | 92 (34.7%) | 5 (71.4%) |
| 6 or 7 Rooms | 119 (44.9%) | 2 (28.6%) |
| 8 or more Rooms | 49 (18.5%) | 0 (0.0%) |
| Total | 265 (100.0%) | 7 (100.0%) |
Housing Structure by Heating Type in Brushy
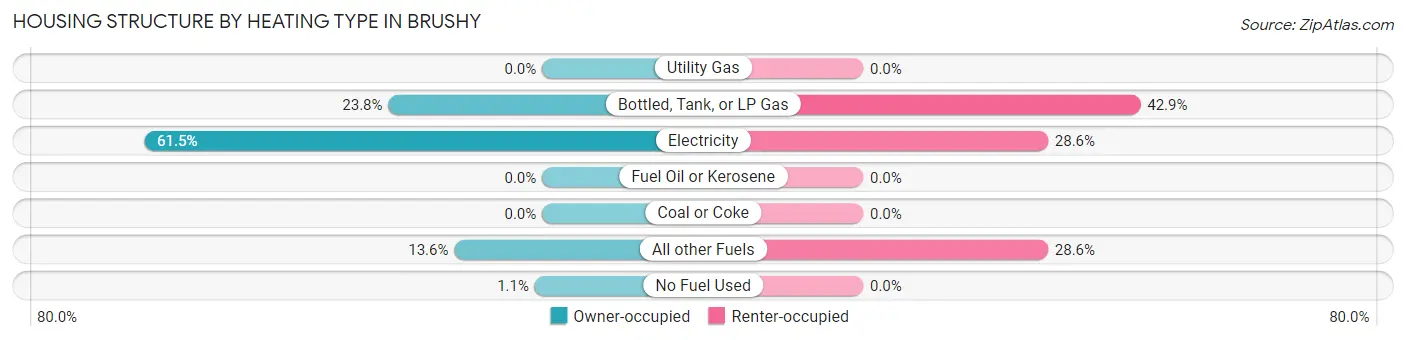
| Heating Type | Owner-occupied | Renter-occupied |
| Utility Gas | 0 (0.0%) | 0 (0.0%) |
| Bottled, Tank, or LP Gas | 63 (23.8%) | 3 (42.9%) |
| Electricity | 163 (61.5%) | 2 (28.6%) |
| Fuel Oil or Kerosene | 0 (0.0%) | 0 (0.0%) |
| Coal or Coke | 0 (0.0%) | 0 (0.0%) |
| All other Fuels | 36 (13.6%) | 2 (28.6%) |
| No Fuel Used | 3 (1.1%) | 0 (0.0%) |
| Total | 265 (100.0%) | 7 (100.0%) |
Household Vehicle Usage in Brushy
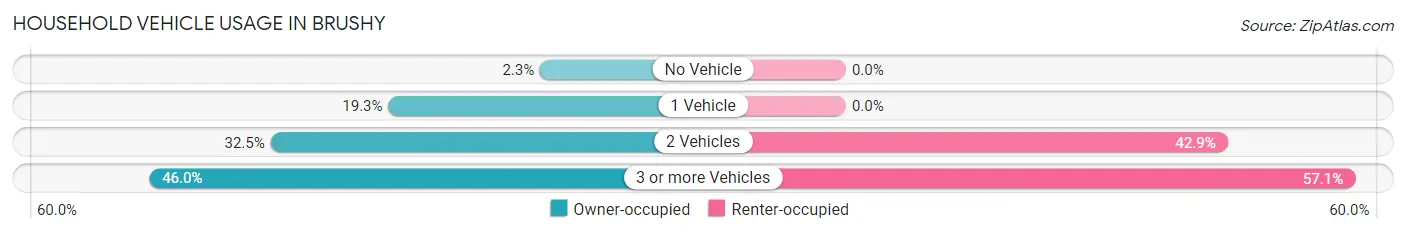
| Vehicles per Household | Owner-occupied | Renter-occupied |
| No Vehicle | 6 (2.3%) | 0 (0.0%) |
| 1 Vehicle | 51 (19.3%) | 0 (0.0%) |
| 2 Vehicles | 86 (32.5%) | 3 (42.9%) |
| 3 or more Vehicles | 122 (46.0%) | 4 (57.1%) |
| Total | 265 (100.0%) | 7 (100.0%) |
Real Estate & Mortgages in Brushy
Real Estate and Mortgage Overview in Brushy
| Characteristic | Without Mortgage | With Mortgage |
| Housing Units | 166 | 99 |
| Median Property Value | $114,500 | $153,000 |
| Median Household Income | $44,808 | $0 |
| Monthly Housing Costs | $343 | $4 |
| Real Estate Taxes | $577 | $11 |
Property Value by Mortgage Status in Brushy
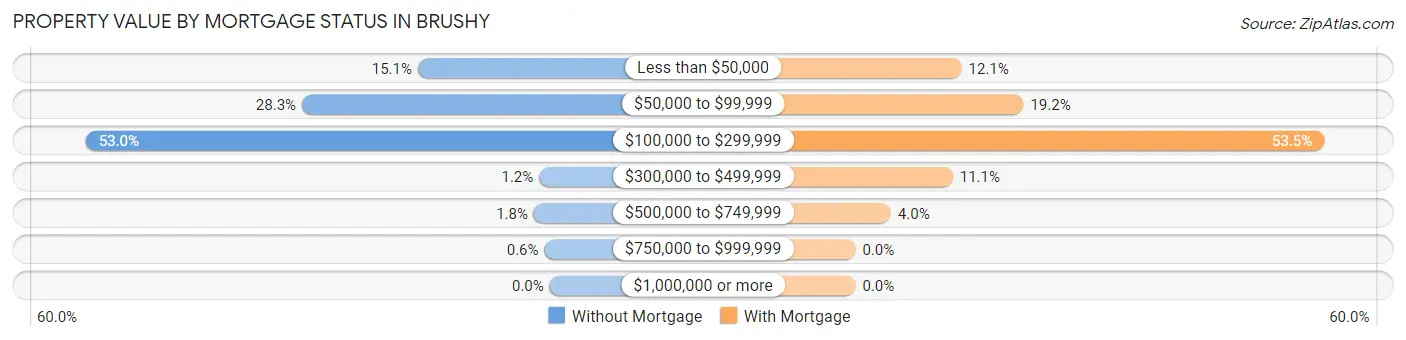
| Property Value | Without Mortgage | With Mortgage |
| Less than $50,000 | 25 (15.1%) | 12 (12.1%) |
| $50,000 to $99,999 | 47 (28.3%) | 19 (19.2%) |
| $100,000 to $299,999 | 88 (53.0%) | 53 (53.5%) |
| $300,000 to $499,999 | 2 (1.2%) | 11 (11.1%) |
| $500,000 to $749,999 | 3 (1.8%) | 4 (4.0%) |
| $750,000 to $999,999 | 1 (0.6%) | 0 (0.0%) |
| $1,000,000 or more | 0 (0.0%) | 0 (0.0%) |
| Total | 166 (100.0%) | 99 (100.0%) |
Household Income by Mortgage Status in Brushy
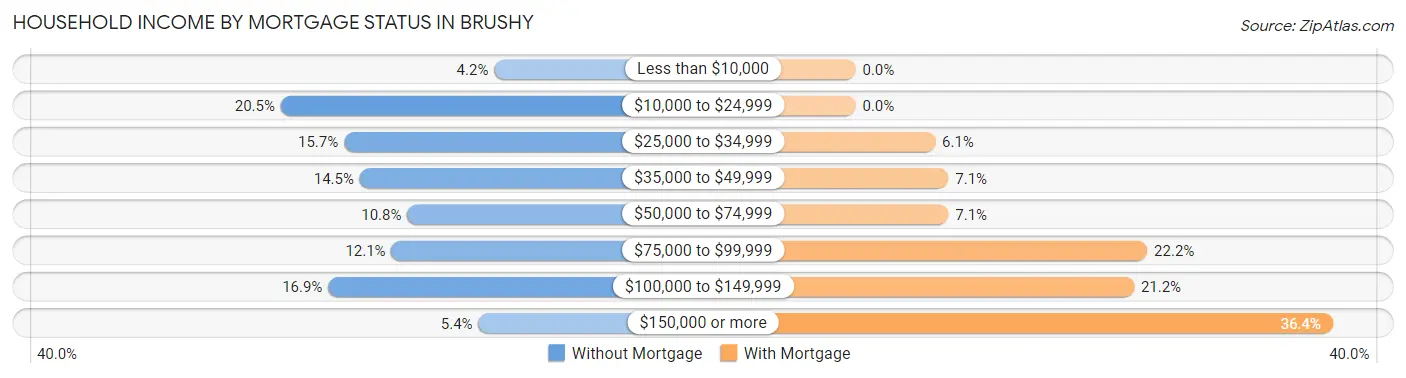
| Household Income | Without Mortgage | With Mortgage |
| Less than $10,000 | 7 (4.2%) | 0 (0.0%) |
| $10,000 to $24,999 | 34 (20.5%) | 0 (0.0%) |
| $25,000 to $34,999 | 26 (15.7%) | 6 (6.1%) |
| $35,000 to $49,999 | 24 (14.5%) | 7 (7.1%) |
| $50,000 to $74,999 | 18 (10.8%) | 7 (7.1%) |
| $75,000 to $99,999 | 20 (12.0%) | 22 (22.2%) |
| $100,000 to $149,999 | 28 (16.9%) | 21 (21.2%) |
| $150,000 or more | 9 (5.4%) | 36 (36.4%) |
| Total | 166 (100.0%) | 99 (100.0%) |
Property Value to Household Income Ratio in Brushy
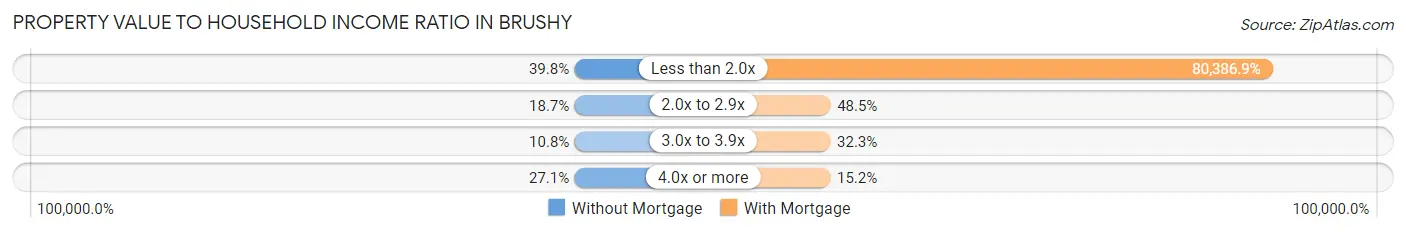
| Value-to-Income Ratio | Without Mortgage | With Mortgage |
| Less than 2.0x | 66 (39.8%) | 79,583 (80,386.9%) |
| 2.0x to 2.9x | 31 (18.7%) | 48 (48.5%) |
| 3.0x to 3.9x | 18 (10.8%) | 32 (32.3%) |
| 4.0x or more | 45 (27.1%) | 15 (15.1%) |
| Total | 166 (100.0%) | 99 (100.0%) |
Real Estate Taxes by Mortgage Status in Brushy
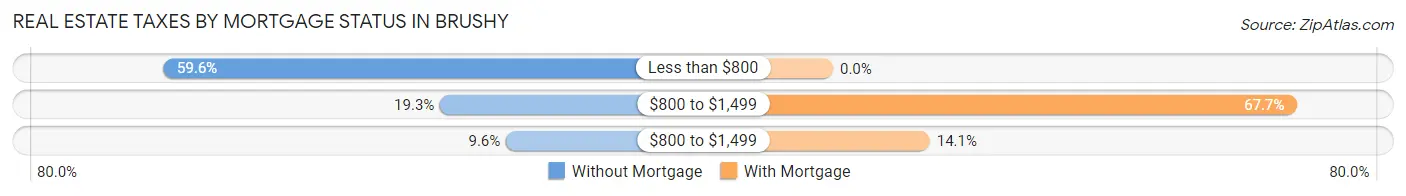
| Property Taxes | Without Mortgage | With Mortgage |
| Less than $800 | 99 (59.6%) | 0 (0.0%) |
| $800 to $1,499 | 32 (19.3%) | 67 (67.7%) |
| $800 to $1,499 | 16 (9.6%) | 14 (14.1%) |
| Total | 166 (100.0%) | 99 (100.0%) |
Health & Disability in Brushy
Health Insurance Coverage by Age in Brushy
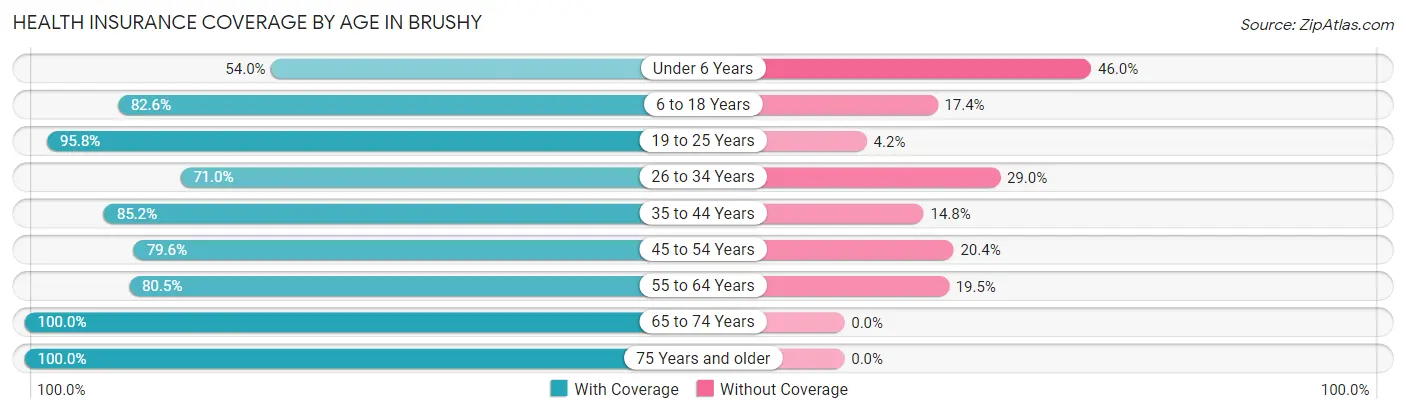
| Age Bracket | With Coverage | Without Coverage |
| Under 6 Years | 34 (54.0%) | 29 (46.0%) |
| 6 to 18 Years | 176 (82.6%) | 37 (17.4%) |
| 19 to 25 Years | 115 (95.8%) | 5 (4.2%) |
| 26 to 34 Years | 44 (71.0%) | 18 (29.0%) |
| 35 to 44 Years | 98 (85.2%) | 17 (14.8%) |
| 45 to 54 Years | 133 (79.6%) | 34 (20.4%) |
| 55 to 64 Years | 91 (80.5%) | 22 (19.5%) |
| 65 to 74 Years | 62 (100.0%) | 0 (0.0%) |
| 75 Years and older | 58 (100.0%) | 0 (0.0%) |
| Total | 811 (83.4%) | 162 (16.7%) |
Health Insurance Coverage by Citizenship Status in Brushy
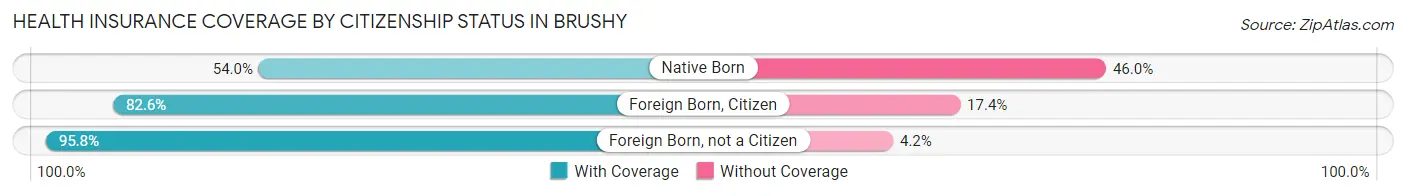
| Citizenship Status | With Coverage | Without Coverage |
| Native Born | 34 (54.0%) | 29 (46.0%) |
| Foreign Born, Citizen | 176 (82.6%) | 37 (17.4%) |
| Foreign Born, not a Citizen | 115 (95.8%) | 5 (4.2%) |
Health Insurance Coverage by Household Income in Brushy
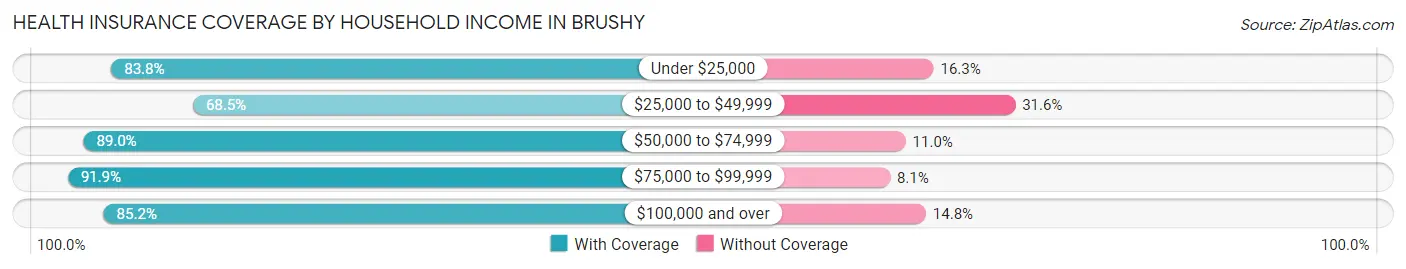
| Household Income | With Coverage | Without Coverage |
| Under $25,000 | 67 (83.8%) | 13 (16.3%) |
| $25,000 to $49,999 | 128 (68.4%) | 59 (31.6%) |
| $50,000 to $74,999 | 129 (89.0%) | 16 (11.0%) |
| $75,000 to $99,999 | 125 (91.9%) | 11 (8.1%) |
| $100,000 and over | 362 (85.2%) | 63 (14.8%) |
Public vs Private Health Insurance Coverage by Age in Brushy
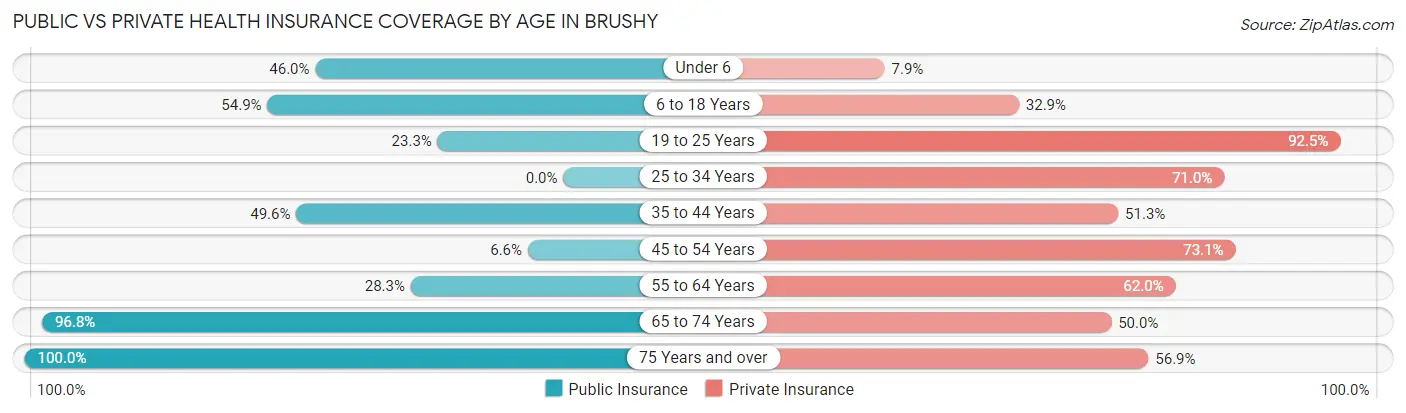
| Age Bracket | Public Insurance | Private Insurance |
| Under 6 | 29 (46.0%) | 5 (7.9%) |
| 6 to 18 Years | 117 (54.9%) | 70 (32.9%) |
| 19 to 25 Years | 28 (23.3%) | 111 (92.5%) |
| 25 to 34 Years | 0 (0.0%) | 44 (71.0%) |
| 35 to 44 Years | 57 (49.6%) | 59 (51.3%) |
| 45 to 54 Years | 11 (6.6%) | 122 (73.1%) |
| 55 to 64 Years | 32 (28.3%) | 70 (62.0%) |
| 65 to 74 Years | 60 (96.8%) | 31 (50.0%) |
| 75 Years and over | 58 (100.0%) | 33 (56.9%) |
| Total | 392 (40.3%) | 545 (56.0%) |
Disability Status by Sex by Age in Brushy
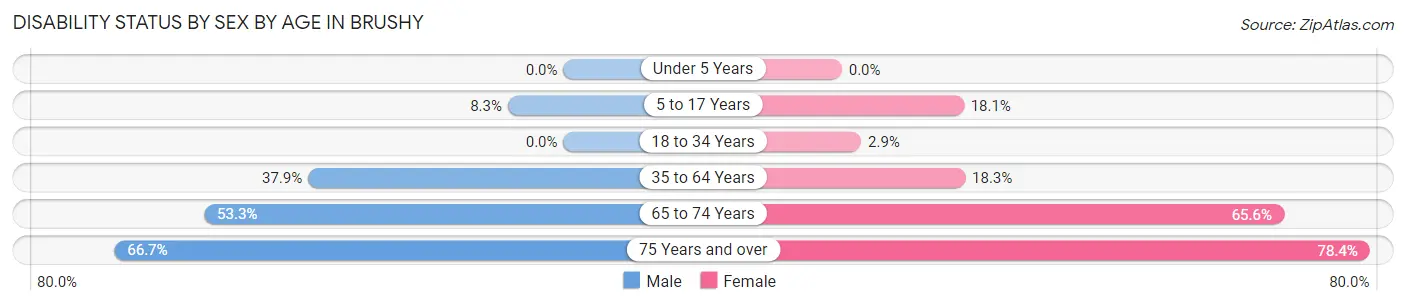
| Age Bracket | Male | Female |
| Under 5 Years | 0 (0.0%) | 0 (0.0%) |
| 5 to 17 Years | 8 (8.3%) | 21 (18.1%) |
| 18 to 34 Years | 0 (0.0%) | 2 (2.9%) |
| 35 to 64 Years | 69 (37.9%) | 39 (18.3%) |
| 65 to 74 Years | 16 (53.3%) | 21 (65.6%) |
| 75 Years and over | 14 (66.7%) | 29 (78.4%) |
Disability Class by Sex by Age in Brushy
Disability Class: Hearing Difficulty
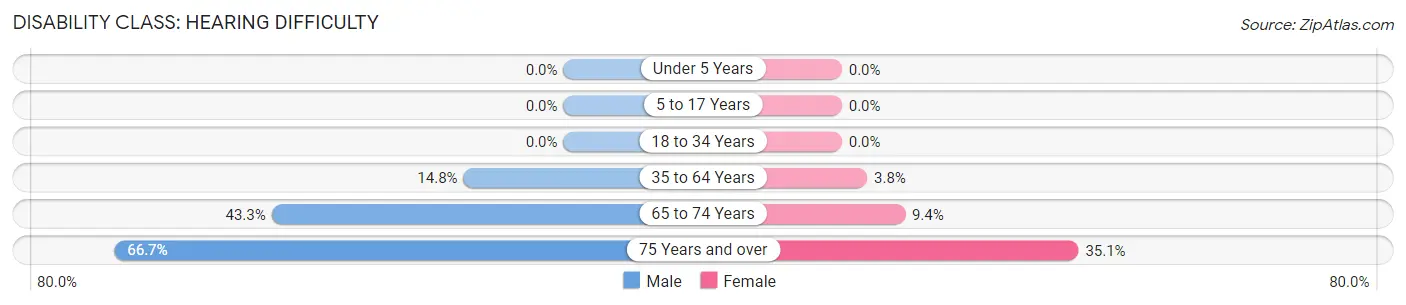
| Age Bracket | Male | Female |
| Under 5 Years | 0 (0.0%) | 0 (0.0%) |
| 5 to 17 Years | 0 (0.0%) | 0 (0.0%) |
| 18 to 34 Years | 0 (0.0%) | 0 (0.0%) |
| 35 to 64 Years | 27 (14.8%) | 8 (3.8%) |
| 65 to 74 Years | 13 (43.3%) | 3 (9.4%) |
| 75 Years and over | 14 (66.7%) | 13 (35.1%) |
Disability Class: Vision Difficulty
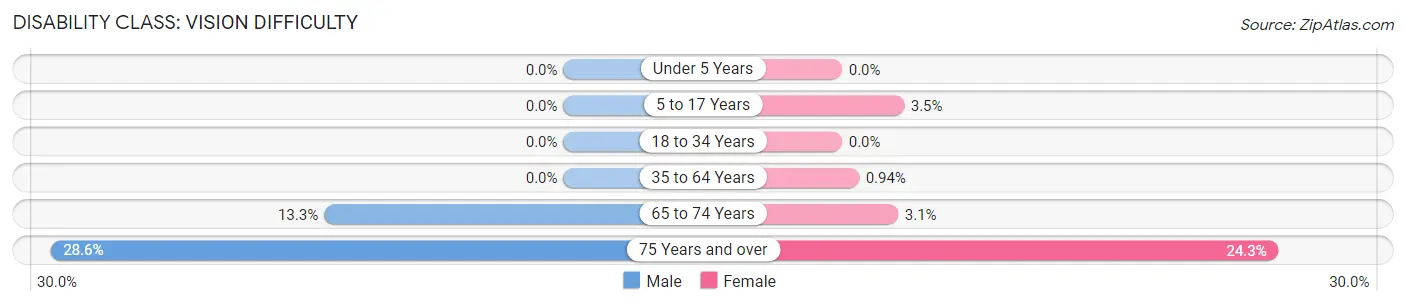
| Age Bracket | Male | Female |
| Under 5 Years | 0 (0.0%) | 0 (0.0%) |
| 5 to 17 Years | 0 (0.0%) | 4 (3.5%) |
| 18 to 34 Years | 0 (0.0%) | 0 (0.0%) |
| 35 to 64 Years | 0 (0.0%) | 2 (0.9%) |
| 65 to 74 Years | 4 (13.3%) | 1 (3.1%) |
| 75 Years and over | 6 (28.6%) | 9 (24.3%) |
Disability Class: Cognitive Difficulty
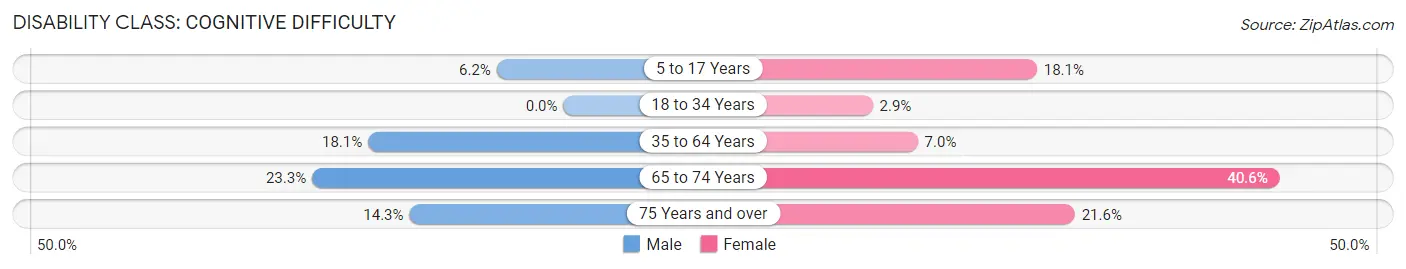
| Age Bracket | Male | Female |
| 5 to 17 Years | 6 (6.2%) | 21 (18.1%) |
| 18 to 34 Years | 0 (0.0%) | 2 (2.9%) |
| 35 to 64 Years | 33 (18.1%) | 15 (7.0%) |
| 65 to 74 Years | 7 (23.3%) | 13 (40.6%) |
| 75 Years and over | 3 (14.3%) | 8 (21.6%) |
Disability Class: Ambulatory Difficulty
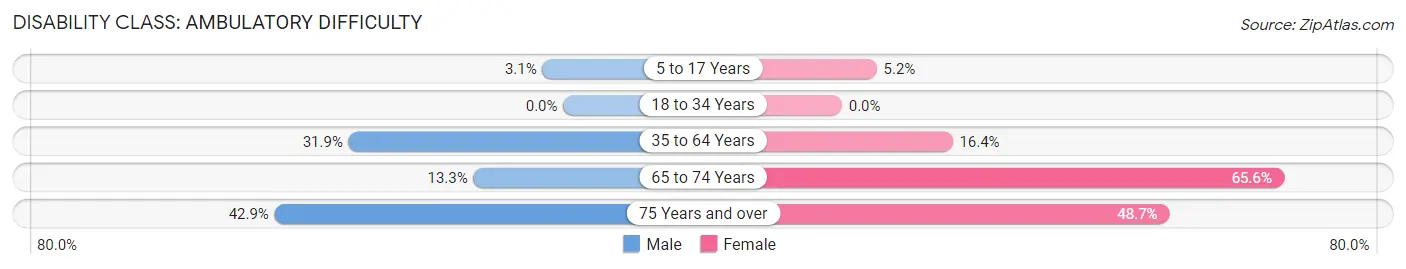
| Age Bracket | Male | Female |
| 5 to 17 Years | 3 (3.1%) | 6 (5.2%) |
| 18 to 34 Years | 0 (0.0%) | 0 (0.0%) |
| 35 to 64 Years | 58 (31.9%) | 35 (16.4%) |
| 65 to 74 Years | 4 (13.3%) | 21 (65.6%) |
| 75 Years and over | 9 (42.9%) | 18 (48.6%) |
Disability Class: Self-Care Difficulty
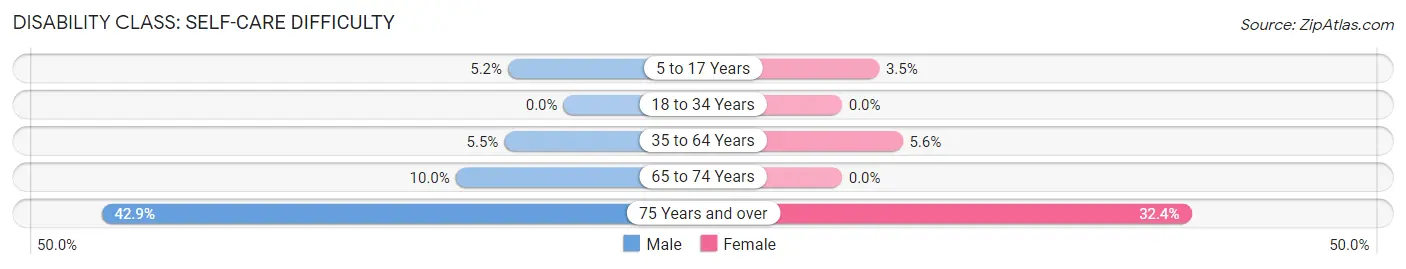
| Age Bracket | Male | Female |
| 5 to 17 Years | 5 (5.1%) | 4 (3.5%) |
| 18 to 34 Years | 0 (0.0%) | 0 (0.0%) |
| 35 to 64 Years | 10 (5.5%) | 12 (5.6%) |
| 65 to 74 Years | 3 (10.0%) | 0 (0.0%) |
| 75 Years and over | 9 (42.9%) | 12 (32.4%) |
Technology Access in Brushy
Computing Device Access in Brushy
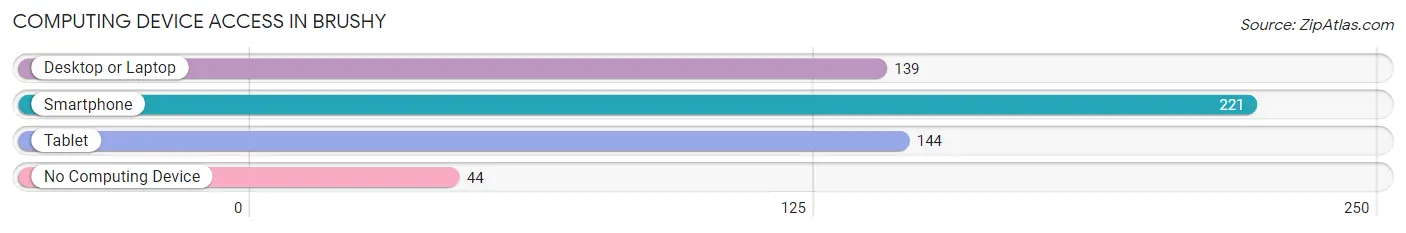
| Device Type | # Households | % Households |
| Desktop or Laptop | 139 | 51.1% |
| Smartphone | 221 | 81.2% |
| Tablet | 144 | 52.9% |
| No Computing Device | 44 | 16.2% |
| Total | 272 | 100.0% |
Internet Access in Brushy
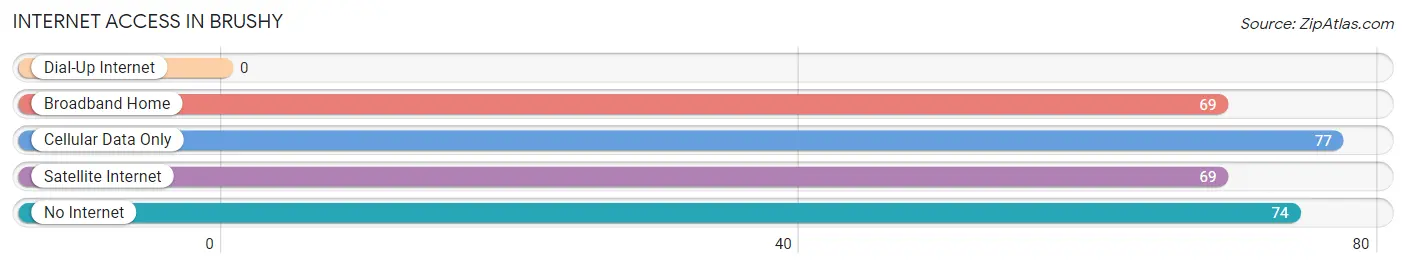
| Internet Type | # Households | % Households |
| Dial-Up Internet | 0 | 0.0% |
| Broadband Home | 69 | 25.4% |
| Cellular Data Only | 77 | 28.3% |
| Satellite Internet | 69 | 25.4% |
| No Internet | 74 | 27.2% |
| Total | 272 | 100.0% |
Brushy Summary
Brushy is a small unincorporated community located in the southeastern corner of Oklahoma, in the United States. It is situated in the foothills of the Ouachita Mountains, in the county of LeFlore. The town is located approximately 10 miles south of the Arkansas border, and is part of the Fort Smith metropolitan area.
History
The area that is now Brushy was first settled in the late 1800s by a group of settlers from Arkansas. The town was originally known as Brushy Creek, and was named after the nearby creek of the same name. The town was officially established in 1891, and was incorporated in 1895.
The town was originally a farming community, and the main crops grown were cotton, corn, and wheat. The town also had a sawmill, a gristmill, and a cotton gin. In the early 1900s, the town began to grow and prosper, and by the 1920s, it had become a thriving community.
In the 1930s, the Great Depression hit the town hard, and many of the businesses in the town closed. However, the town was able to survive, and by the 1940s, it had begun to recover. In the 1950s, the town began to experience a period of growth, and many new businesses opened in the town.
Geography
Brushy is located in the southeastern corner of Oklahoma, in the county of LeFlore. The town is situated in the foothills of the Ouachita Mountains, and is part of the Fort Smith metropolitan area. The town is located approximately 10 miles south of the Arkansas border.
The town is located at an elevation of 845 feet above sea level, and has a total area of 0.7 square miles. The town is located in a humid subtropical climate zone, and has hot, humid summers and mild winters.
Economy
The economy of Brushy is largely based on agriculture. The main crops grown in the area are cotton, corn, and wheat. The town also has a sawmill, a gristmill, and a cotton gin.
In addition to agriculture, the town also has a few small businesses, including a grocery store, a hardware store, and a few restaurants. The town also has a few small manufacturing companies, which produce a variety of products, including furniture, clothing, and electronics.
Demographics
As of the 2010 census, the population of Brushy was 1,093. The town has a total area of 0.7 square miles, and has a population density of 1,543 people per square mile. The median age of the population is 37.7 years, and the median household income is $31,250.
The town is predominantly white, with a small minority population. The town has a small Hispanic population, as well as a small African American population. The town also has a small Native American population.
Conclusion
Brushy is a small unincorporated community located in the southeastern corner of Oklahoma, in the United States. The town was originally settled in the late 1800s by a group of settlers from Arkansas, and was officially established in 1891. The town has a population of 1,093, and has a total area of 0.7 square miles. The economy of Brushy is largely based on agriculture, and the town also has a few small businesses. The town is predominantly white, with a small minority population.
Common Questions
What is Per Capita Income in Brushy?
Per Capita income in Brushy is $21,341.
What is the Median Family Income in Brushy?
Median Family Income in Brushy is $76,250.
What is the Median Household income in Brushy?
Median Household Income in Brushy is $67,500.
What is Income or Wage Gap in Brushy?
Income or Wage Gap in Brushy is 10.3%.
Women in Brushy earn 89.7 cents for every dollar earned by a man.
What is Inequality or Gini Index in Brushy?
Inequality or Gini Index in Brushy is 0.36.
What is the Total Population of Brushy?
Total Population of Brushy is 973.
What is the Total Male Population of Brushy?
Total Male Population of Brushy is 492.
What is the Total Female Population of Brushy?
Total Female Population of Brushy is 481.
What is the Ratio of Males per 100 Females in Brushy?
There are 102.29 Males per 100 Females in Brushy.
What is the Ratio of Females per 100 Males in Brushy?
There are 97.76 Females per 100 Males in Brushy.
What is the Median Population Age in Brushy?
Median Population Age in Brushy is 36.8 Years.
What is the Average Family Size in Brushy
Average Family Size in Brushy is 4.0 People.
What is the Average Household Size in Brushy
Average Household Size in Brushy is 3.6 People.
How Large is the Labor Force in Brushy?
There are 418 People in the Labor Forcein in Brushy.
What is the Percentage of People in the Labor Force in Brushy?
55.5% of People are in the Labor Force in Brushy.
What is the Unemployment Rate in Brushy?
Unemployment Rate in Brushy is 9.3%.