Boswell, OK Map & Demographics
Boswell Map
Boswell Overview
$12,997
PER CAPITA INCOME
$24,600
AVG FAMILY INCOME
$24,758
AVG HOUSEHOLD INCOME
46.0%
WAGE / INCOME GAP [ % ]
54.0¢/ $1
WAGE / INCOME GAP [ $ ]
0.42
INEQUALITY / GINI INDEX
767
TOTAL POPULATION
338
MALE POPULATION
429
FEMALE POPULATION
78.79
MALES / 100 FEMALES
126.92
FEMALES / 100 MALES
31.5
MEDIAN AGE
3.4
AVG FAMILY SIZE
2.6
AVG HOUSEHOLD SIZE
233
LABOR FORCE [ PEOPLE ]
43.5%
PERCENT IN LABOR FORCE
7.7%
UNEMPLOYMENT RATE
Boswell Zip Codes
Boswell Area Codes
Income in Boswell
Income Overview in Boswell
Per Capita Income in Boswell is $12,997, while median incomes of families and households are $24,600 and $24,758 respectively.
| Characteristic | Number | Measure |
| Per Capita Income | 767 | $12,997 |
| Median Family Income | 166 | $24,600 |
| Mean Family Income | 166 | $33,733 |
| Median Household Income | 296 | $24,758 |
| Mean Household Income | 296 | $31,087 |
| Income Deficit | 166 | $0 |
| Wage / Income Gap (%) | 767 | 46.00% |
| Wage / Income Gap ($) | 767 | 54.00¢ per $1 |
| Gini / Inequality Index | 767 | 0.42 |
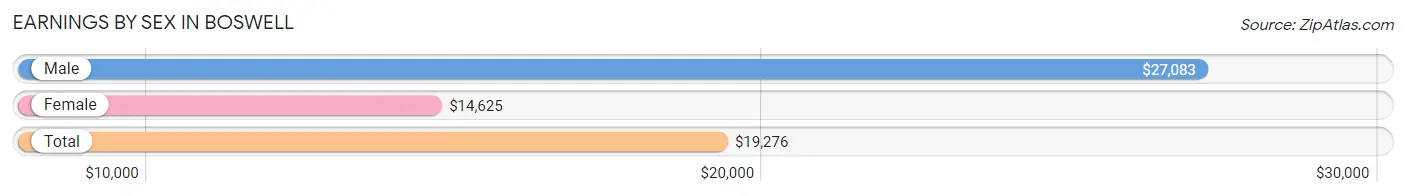
Earnings by Sex in Boswell
Average Earnings in Boswell are $19,276, $27,083 for men and $14,625 for women, a difference of 46.0%.
| Sex | Number | Average Earnings |
| Male | 98 (40.7%) | $27,083 |
| Female | 143 (59.3%) | $14,625 |
| Total | 241 (100.0%) | $19,276 |
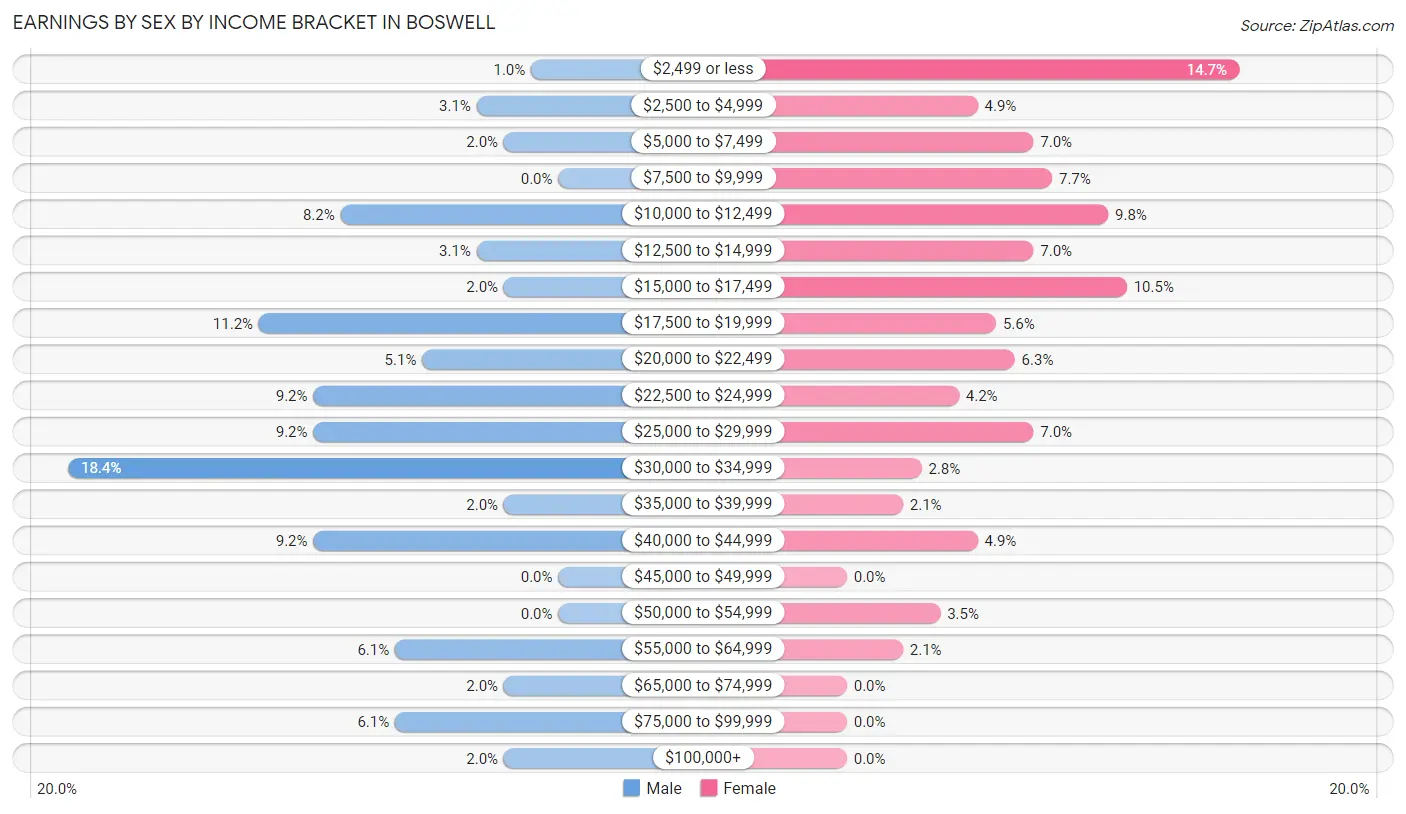
Earnings by Sex by Income Bracket in Boswell
The most common earnings brackets in Boswell are $30,000 to $34,999 for men (18 | 18.4%) and $2,499 or less for women (21 | 14.7%).
| Income | Male | Female |
| $2,499 or less | 1 (1.0%) | 21 (14.7%) |
| $2,500 to $4,999 | 3 (3.1%) | 7 (4.9%) |
| $5,000 to $7,499 | 2 (2.0%) | 10 (7.0%) |
| $7,500 to $9,999 | 0 (0.0%) | 11 (7.7%) |
| $10,000 to $12,499 | 8 (8.2%) | 14 (9.8%) |
| $12,500 to $14,999 | 3 (3.1%) | 10 (7.0%) |
| $15,000 to $17,499 | 2 (2.0%) | 15 (10.5%) |
| $17,500 to $19,999 | 11 (11.2%) | 8 (5.6%) |
| $20,000 to $22,499 | 5 (5.1%) | 9 (6.3%) |
| $22,500 to $24,999 | 9 (9.2%) | 6 (4.2%) |
| $25,000 to $29,999 | 9 (9.2%) | 10 (7.0%) |
| $30,000 to $34,999 | 18 (18.4%) | 4 (2.8%) |
| $35,000 to $39,999 | 2 (2.0%) | 3 (2.1%) |
| $40,000 to $44,999 | 9 (9.2%) | 7 (4.9%) |
| $45,000 to $49,999 | 0 (0.0%) | 0 (0.0%) |
| $50,000 to $54,999 | 0 (0.0%) | 5 (3.5%) |
| $55,000 to $64,999 | 6 (6.1%) | 3 (2.1%) |
| $65,000 to $74,999 | 2 (2.0%) | 0 (0.0%) |
| $75,000 to $99,999 | 6 (6.1%) | 0 (0.0%) |
| $100,000+ | 2 (2.0%) | 0 (0.0%) |
| Total | 98 (100.0%) | 143 (100.0%) |
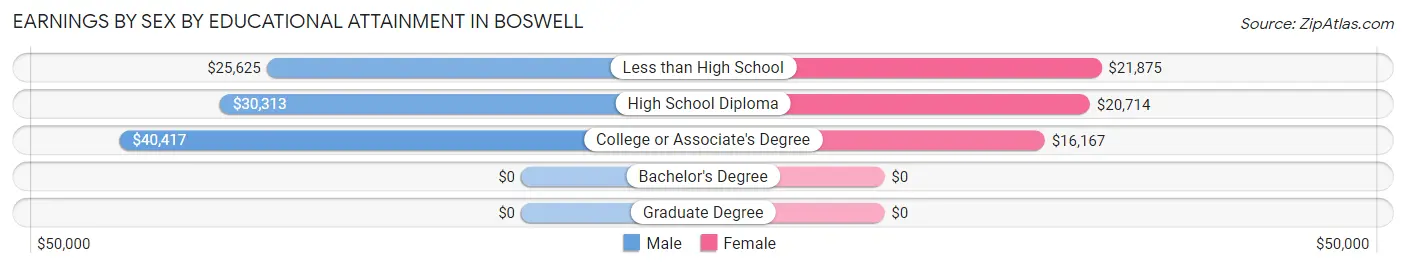
Earnings by Sex by Educational Attainment in Boswell
Average earnings in Boswell are $29,583 for men and $17,167 for women, a difference of 42.0%. Men with an educational attainment of college or associate's degree enjoy the highest average annual earnings of $40,417, while those with less than high school education earn the least with $25,625. Women with an educational attainment of less than high school earn the most with the average annual earnings of $21,875, while those with college or associate's degree education have the smallest earnings of $16,167.
| Educational Attainment | Male Income | Female Income |
| Less than High School | $25,625 | $21,875 |
| High School Diploma | $30,313 | $20,714 |
| College or Associate's Degree | $40,417 | $16,167 |
| Bachelor's Degree | - | - |
| Graduate Degree | - | - |
| Total | $29,583 | $17,167 |
Family Income in Boswell
Family Income Brackets in Boswell
According to the Boswell family income data, there are 51 families falling into the $15,000 to $24,999 income range, which is the most common income bracket and makes up 30.7% of all families.
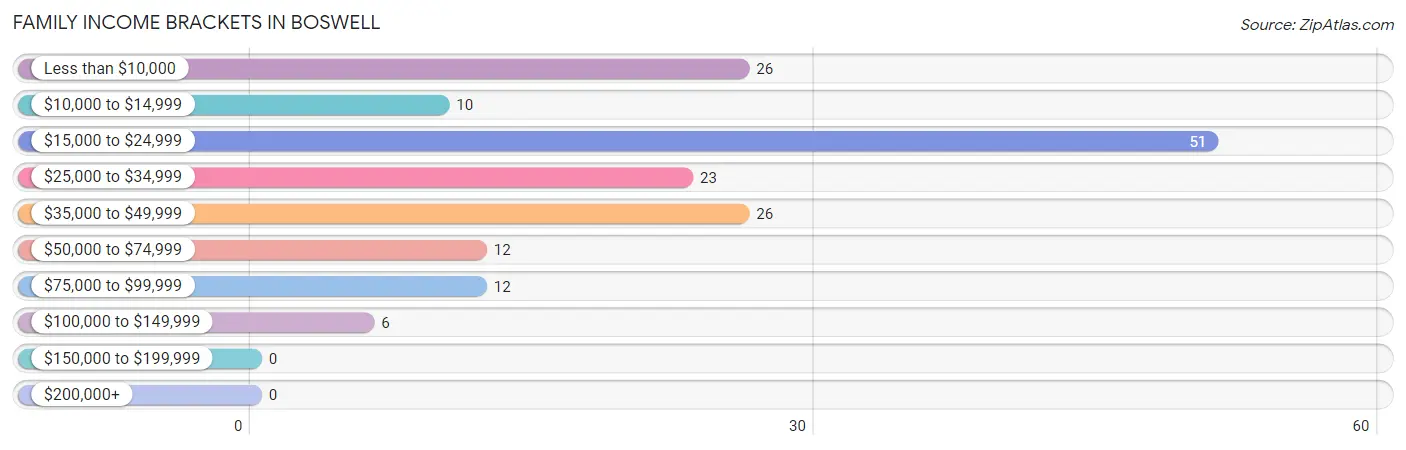
| Income Bracket | # Families | % Families |
| Less than $10,000 | 26 | 15.7% |
| $10,000 to $14,999 | 10 | 6.0% |
| $15,000 to $24,999 | 51 | 30.7% |
| $25,000 to $34,999 | 23 | 13.9% |
| $35,000 to $49,999 | 26 | 15.7% |
| $50,000 to $74,999 | 12 | 7.2% |
| $75,000 to $99,999 | 12 | 7.2% |
| $100,000 to $149,999 | 6 | 3.6% |
| $150,000 to $199,999 | 0 | 0.0% |
| $200,000+ | 0 | 0.0% |
Family Income by Famaliy Size in Boswell
5-person families (22 | 13.3%) account for the highest median family income in Boswell with $34,750 per family, while 2-person families (67 | 40.4%) have the highest median income of $11,948 per family member.
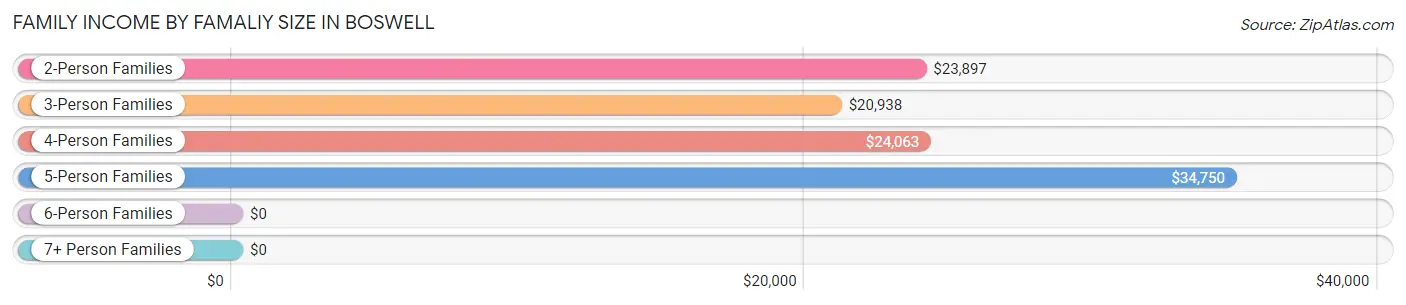
| Income Bracket | # Families | Median Income |
| 2-Person Families | 67 (40.4%) | $23,897 |
| 3-Person Families | 47 (28.3%) | $20,938 |
| 4-Person Families | 30 (18.1%) | $24,063 |
| 5-Person Families | 22 (13.3%) | $34,750 |
| 6-Person Families | 0 (0.0%) | $0 |
| 7+ Person Families | 0 (0.0%) | $0 |
| Total | 166 (100.0%) | $24,600 |
Family Income by Number of Earners in Boswell
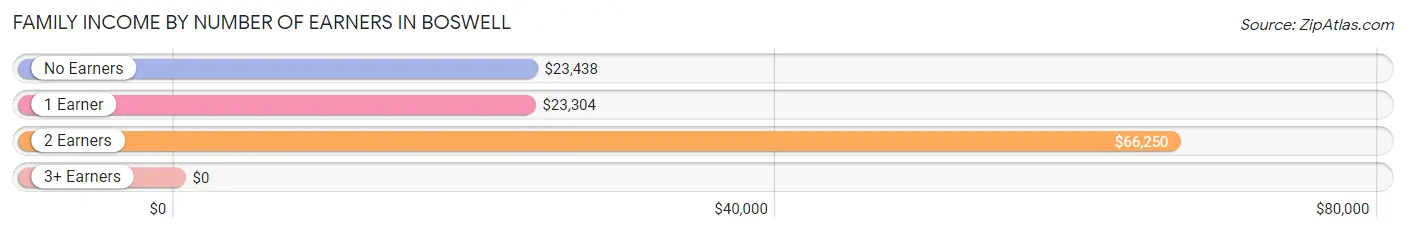
| Number of Earners | # Families | Median Income |
| No Earners | 42 (25.3%) | $23,438 |
| 1 Earner | 97 (58.4%) | $23,304 |
| 2 Earners | 22 (13.3%) | $66,250 |
| 3+ Earners | 5 (3.0%) | $0 |
| Total | 166 (100.0%) | $24,600 |
Household Income in Boswell
Household Income Brackets in Boswell
With 71 households falling in the category, the $15,000 to $24,999 income range is the most frequent in Boswell, accounting for 24.0% of all households.
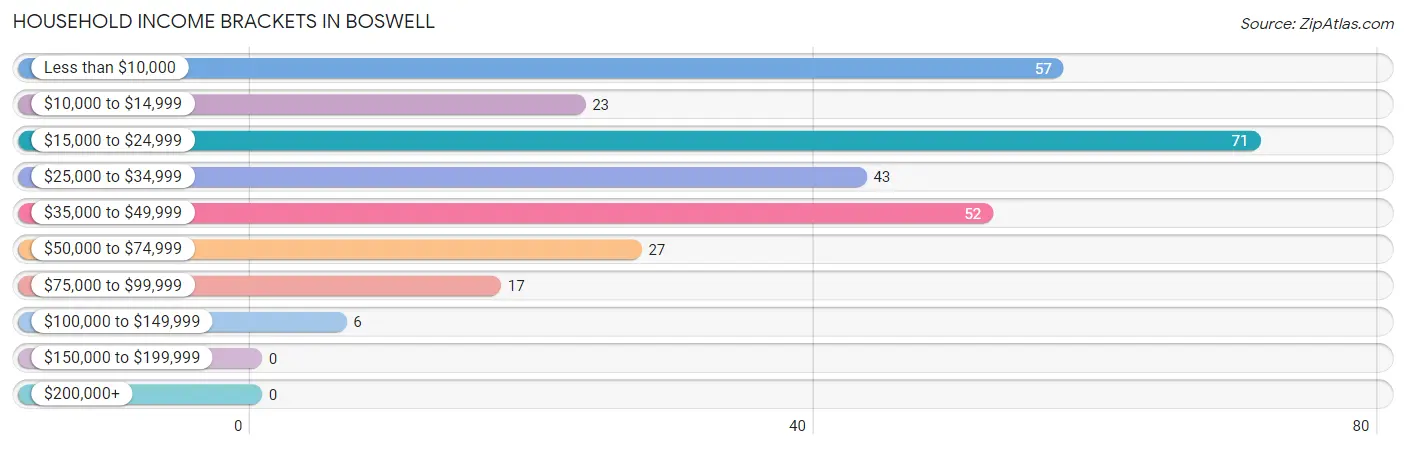
| Income Bracket | # Households | % Households |
| Less than $10,000 | 57 | 19.3% |
| $10,000 to $14,999 | 23 | 7.8% |
| $15,000 to $24,999 | 71 | 24.0% |
| $25,000 to $34,999 | 43 | 14.5% |
| $35,000 to $49,999 | 52 | 17.6% |
| $50,000 to $74,999 | 27 | 9.1% |
| $75,000 to $99,999 | 17 | 5.7% |
| $100,000 to $149,999 | 6 | 2.0% |
| $150,000 to $199,999 | 0 | 0.0% |
| $200,000+ | 0 | 0.0% |
Household Income by Householder Age in Boswell
The median household income in Boswell is $24,758, with the highest median household income of $33,542 found in the 25 to 44 years age bracket for the primary householder. A total of 102 households (34.5%) fall into this category. Meanwhile, the 65+ years age bracket for the primary householder has the lowest median household income of $17,188, with 113 households (38.2%) in this group.
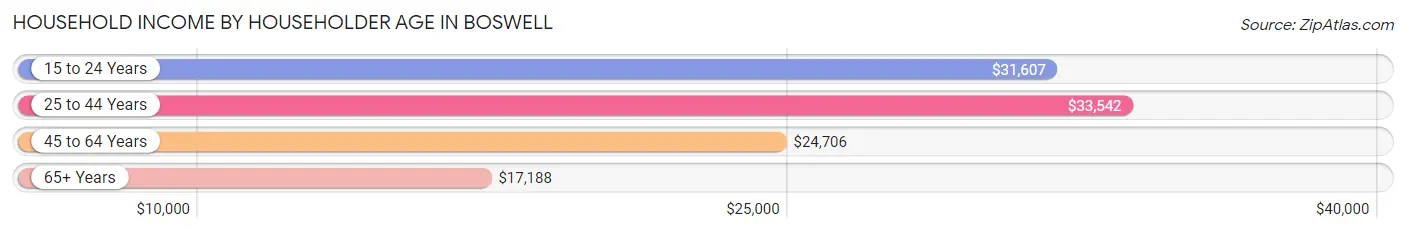
| Income Bracket | # Households | Median Income |
| 15 to 24 Years | 17 (5.7%) | $31,607 |
| 25 to 44 Years | 102 (34.5%) | $33,542 |
| 45 to 64 Years | 64 (21.6%) | $24,706 |
| 65+ Years | 113 (38.2%) | $17,188 |
| Total | 296 (100.0%) | $24,758 |
Poverty in Boswell
Income Below Poverty by Sex and Age in Boswell
With 42.3% poverty level for males and 50.6% for females among the residents of Boswell, 5 year old males and 5 year old females are the most vulnerable to poverty, with 3 males (100.0%) and 5 females (100.0%) in their respective age groups living below the poverty level.
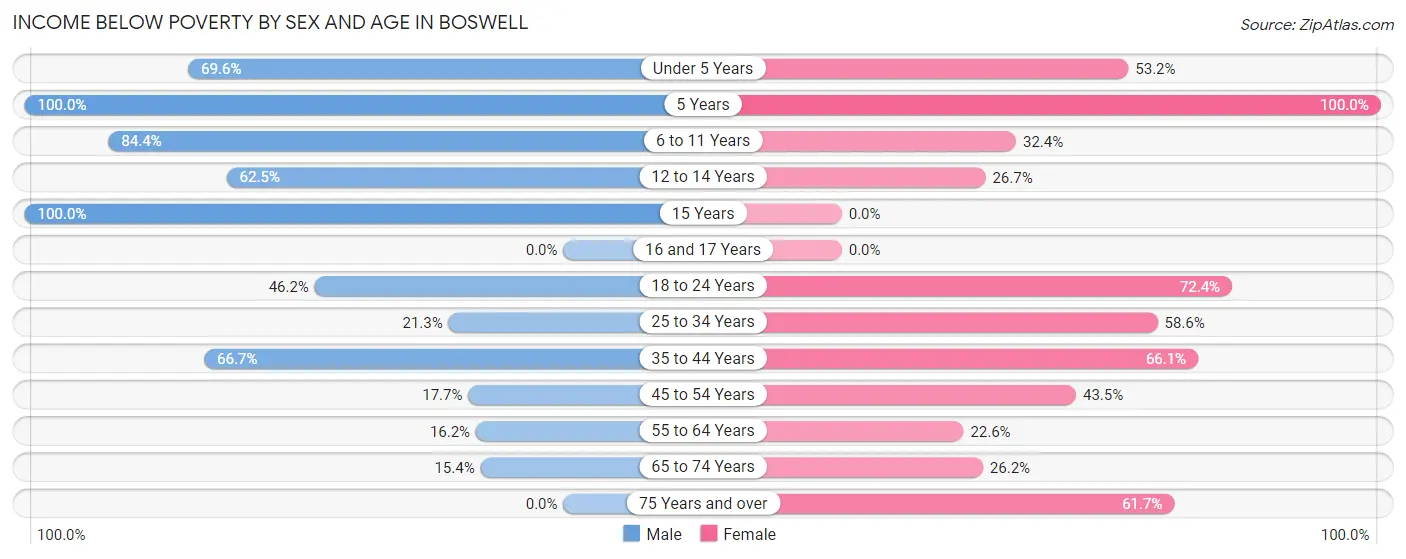
| Age Bracket | Male | Female |
| Under 5 Years | 39 (69.6%) | 25 (53.2%) |
| 5 Years | 3 (100.0%) | 5 (100.0%) |
| 6 to 11 Years | 38 (84.4%) | 11 (32.4%) |
| 12 to 14 Years | 15 (62.5%) | 4 (26.7%) |
| 15 Years | 2 (100.0%) | 0 (0.0%) |
| 16 and 17 Years | 0 (0.0%) | 0 (0.0%) |
| 18 to 24 Years | 6 (46.2%) | 42 (72.4%) |
| 25 to 34 Years | 13 (21.3%) | 34 (58.6%) |
| 35 to 44 Years | 10 (66.7%) | 39 (66.1%) |
| 45 to 54 Years | 3 (17.6%) | 10 (43.5%) |
| 55 to 64 Years | 6 (16.2%) | 7 (22.6%) |
| 65 to 74 Years | 8 (15.4%) | 11 (26.2%) |
| 75 Years and over | 0 (0.0%) | 29 (61.7%) |
| Total | 143 (42.3%) | 217 (50.6%) |
Income Above Poverty by Sex and Age in Boswell
According to the poverty statistics in Boswell, males aged 75 years and over and females aged 16 and 17 years are the age groups that are most secure financially, with 100.0% of males and 100.0% of females in these age groups living above the poverty line.
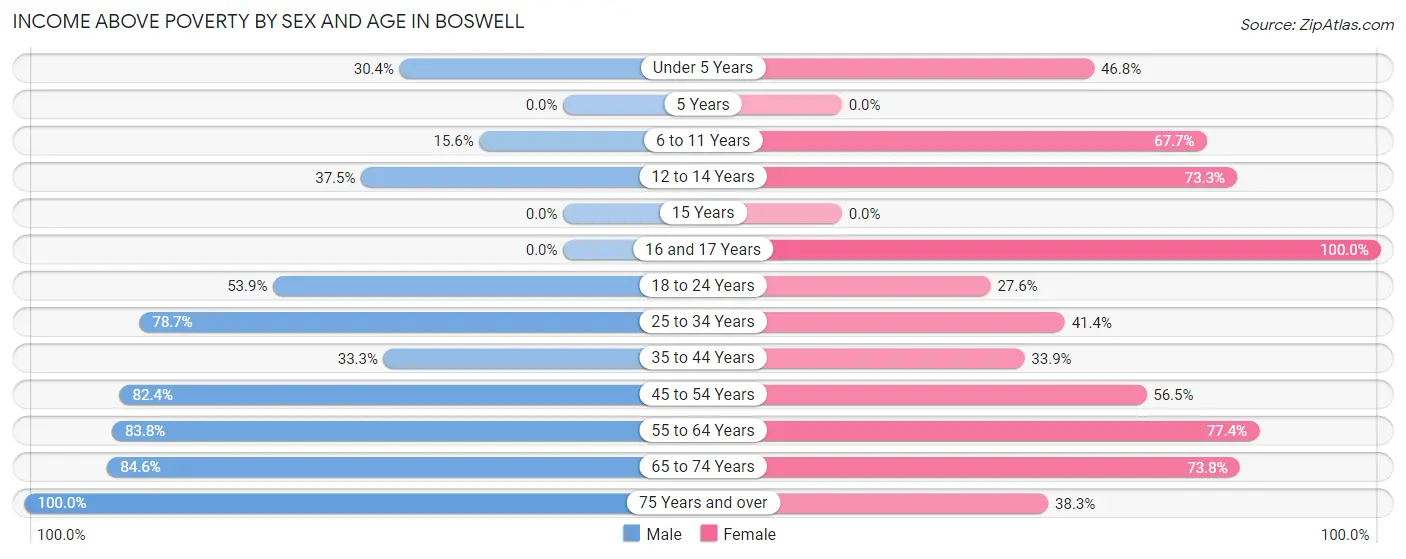
| Age Bracket | Male | Female |
| Under 5 Years | 17 (30.4%) | 22 (46.8%) |
| 5 Years | 0 (0.0%) | 0 (0.0%) |
| 6 to 11 Years | 7 (15.6%) | 23 (67.6%) |
| 12 to 14 Years | 9 (37.5%) | 11 (73.3%) |
| 15 Years | 0 (0.0%) | 0 (0.0%) |
| 16 and 17 Years | 0 (0.0%) | 10 (100.0%) |
| 18 to 24 Years | 7 (53.8%) | 16 (27.6%) |
| 25 to 34 Years | 48 (78.7%) | 24 (41.4%) |
| 35 to 44 Years | 5 (33.3%) | 20 (33.9%) |
| 45 to 54 Years | 14 (82.4%) | 13 (56.5%) |
| 55 to 64 Years | 31 (83.8%) | 24 (77.4%) |
| 65 to 74 Years | 44 (84.6%) | 31 (73.8%) |
| 75 Years and over | 13 (100.0%) | 18 (38.3%) |
| Total | 195 (57.7%) | 212 (49.4%) |
Income Below Poverty Among Married-Couple Families in Boswell
The poverty statistics for married-couple families in Boswell show that 34.6% or 28 of the total 81 families live below the poverty line. Families with 1 or 2 children have the highest poverty rate of 45.7%, comprising of 16 families. On the other hand, families with 3 or 4 children have the lowest poverty rate of 0.0%, which includes 0 families.
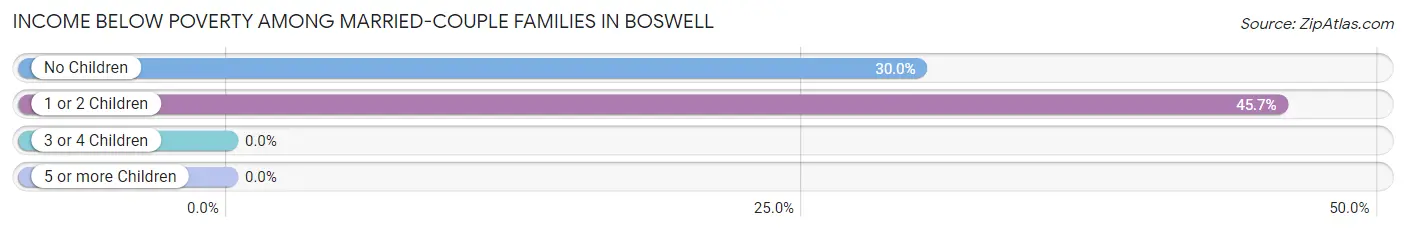
| Children | Above Poverty | Below Poverty |
| No Children | 28 (70.0%) | 12 (30.0%) |
| 1 or 2 Children | 19 (54.3%) | 16 (45.7%) |
| 3 or 4 Children | 6 (100.0%) | 0 (0.0%) |
| 5 or more Children | 0 (0.0%) | 0 (0.0%) |
| Total | 53 (65.4%) | 28 (34.6%) |
Income Below Poverty Among Single-Parent Households in Boswell
According to the poverty data in Boswell, 50.0% or 5 single-father households and 62.7% or 47 single-mother households are living below the poverty line. Among single-father households, those with no children have the highest poverty rate, with 3 households (60.0%) experiencing poverty. Likewise, among single-mother households, those with 1 or 2 children have the highest poverty rate, with 35 households (81.4%) falling below the poverty line.
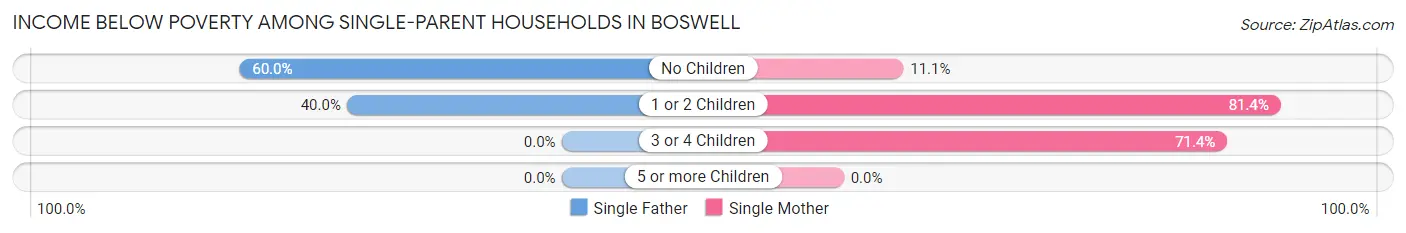
| Children | Single Father | Single Mother |
| No Children | 3 (60.0%) | 2 (11.1%) |
| 1 or 2 Children | 2 (40.0%) | 35 (81.4%) |
| 3 or 4 Children | 0 (0.0%) | 10 (71.4%) |
| 5 or more Children | 0 (0.0%) | 0 (0.0%) |
| Total | 5 (50.0%) | 47 (62.7%) |
Income Below Poverty Among Married-Couple vs Single-Parent Households in Boswell
The poverty data for Boswell shows that 28 of the married-couple family households (34.6%) and 52 of the single-parent households (61.2%) are living below the poverty level. Within the married-couple family households, those with 1 or 2 children have the highest poverty rate, with 16 households (45.7%) falling below the poverty line. Among the single-parent households, those with 1 or 2 children have the highest poverty rate, with 37 household (77.1%) living below poverty.
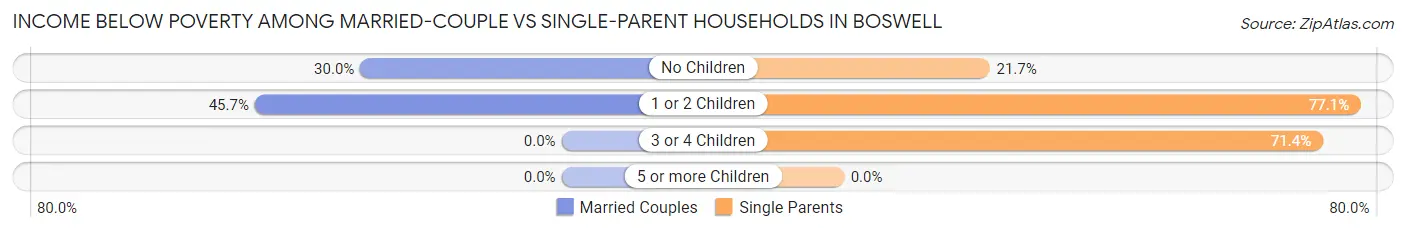
| Children | Married-Couple Families | Single-Parent Households |
| No Children | 12 (30.0%) | 5 (21.7%) |
| 1 or 2 Children | 16 (45.7%) | 37 (77.1%) |
| 3 or 4 Children | 0 (0.0%) | 10 (71.4%) |
| 5 or more Children | 0 (0.0%) | 0 (0.0%) |
| Total | 28 (34.6%) | 52 (61.2%) |
Race in Boswell
The most populous races in Boswell are White / Caucasian (422 | 55.0%), Two or more Races (166 | 21.6%), and Native / Alaskan (142 | 18.5%).
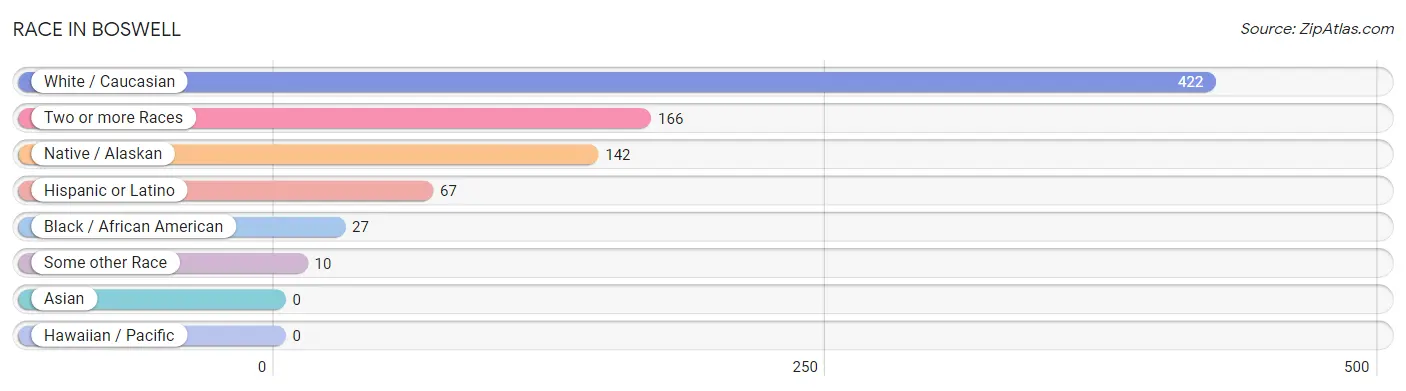
| Race | # Population | % Population |
| Asian | 0 | 0.0% |
| Black / African American | 27 | 3.5% |
| Hawaiian / Pacific | 0 | 0.0% |
| Hispanic or Latino | 67 | 8.7% |
| Native / Alaskan | 142 | 18.5% |
| White / Caucasian | 422 | 55.0% |
| Two or more Races | 166 | 21.6% |
| Some other Race | 10 | 1.3% |
| Total | 767 | 100.0% |
Ancestry in Boswell
The most populous ancestries reported in Boswell are Choctaw (164 | 21.4%), Irish (141 | 18.4%), German (76 | 9.9%), Cherokee (67 | 8.7%), and Mexican (67 | 8.7%), together accounting for 67.1% of all Boswell residents.
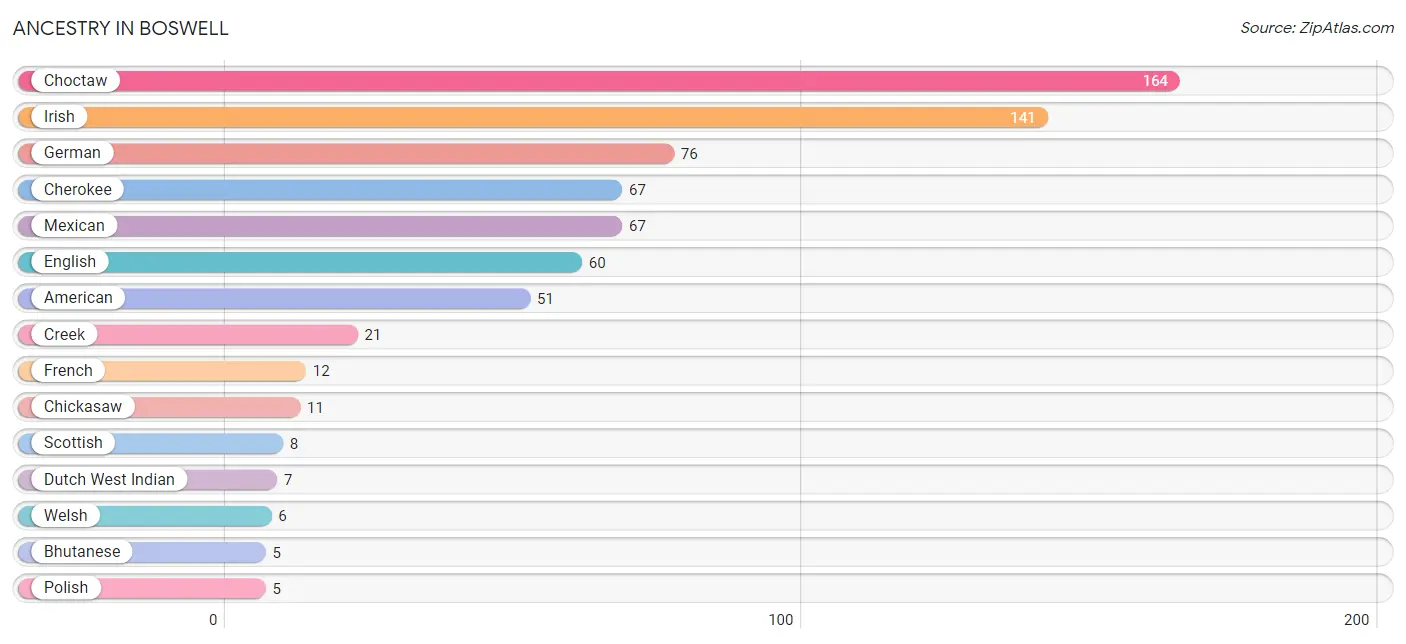
| Ancestry | # Population | % Population |
| American | 51 | 6.7% |
| Apache | 4 | 0.5% |
| Bhutanese | 5 | 0.6% |
| British | 2 | 0.3% |
| Cherokee | 67 | 8.7% |
| Chickasaw | 11 | 1.4% |
| Choctaw | 164 | 21.4% |
| Creek | 21 | 2.7% |
| Dutch | 1 | 0.1% |
| Dutch West Indian | 7 | 0.9% |
| English | 60 | 7.8% |
| French | 12 | 1.6% |
| French Canadian | 3 | 0.4% |
| German | 76 | 9.9% |
| Irish | 141 | 18.4% |
| Italian | 1 | 0.1% |
| Mexican | 67 | 8.7% |
| Polish | 5 | 0.6% |
| Scotch-Irish | 2 | 0.3% |
| Scottish | 8 | 1.0% |
| Welsh | 6 | 0.8% | View All 21 Rows |
Immigrants in Boswell
The most numerous immigrant groups reported in Boswell came from Central America (14 | 1.8%), Latin America (14 | 1.8%), Mexico (14 | 1.8%), Asia (5 | 0.6%), and Eastern Asia (5 | 0.6%), together accounting for 6.8% of all Boswell residents.
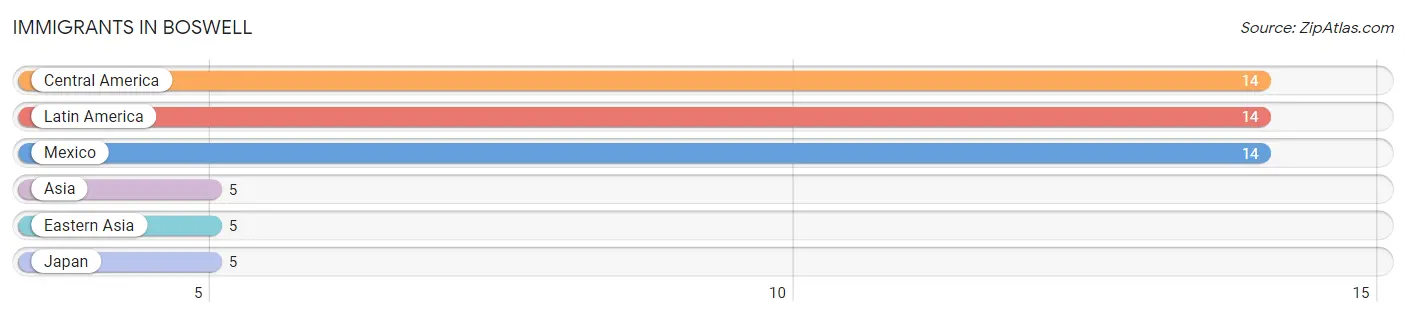
| Immigration Origin | # Population | % Population |
| Asia | 5 | 0.6% |
| Central America | 14 | 1.8% |
| Eastern Asia | 5 | 0.6% |
| Japan | 5 | 0.6% |
| Latin America | 14 | 1.8% |
| Mexico | 14 | 1.8% | View All 6 Rows |
Sex and Age in Boswell
Sex and Age in Boswell
The most populous age groups in Boswell are Under 5 Years (56 | 16.6%) for men and 15 to 19 Years (49 | 11.4%) for women.
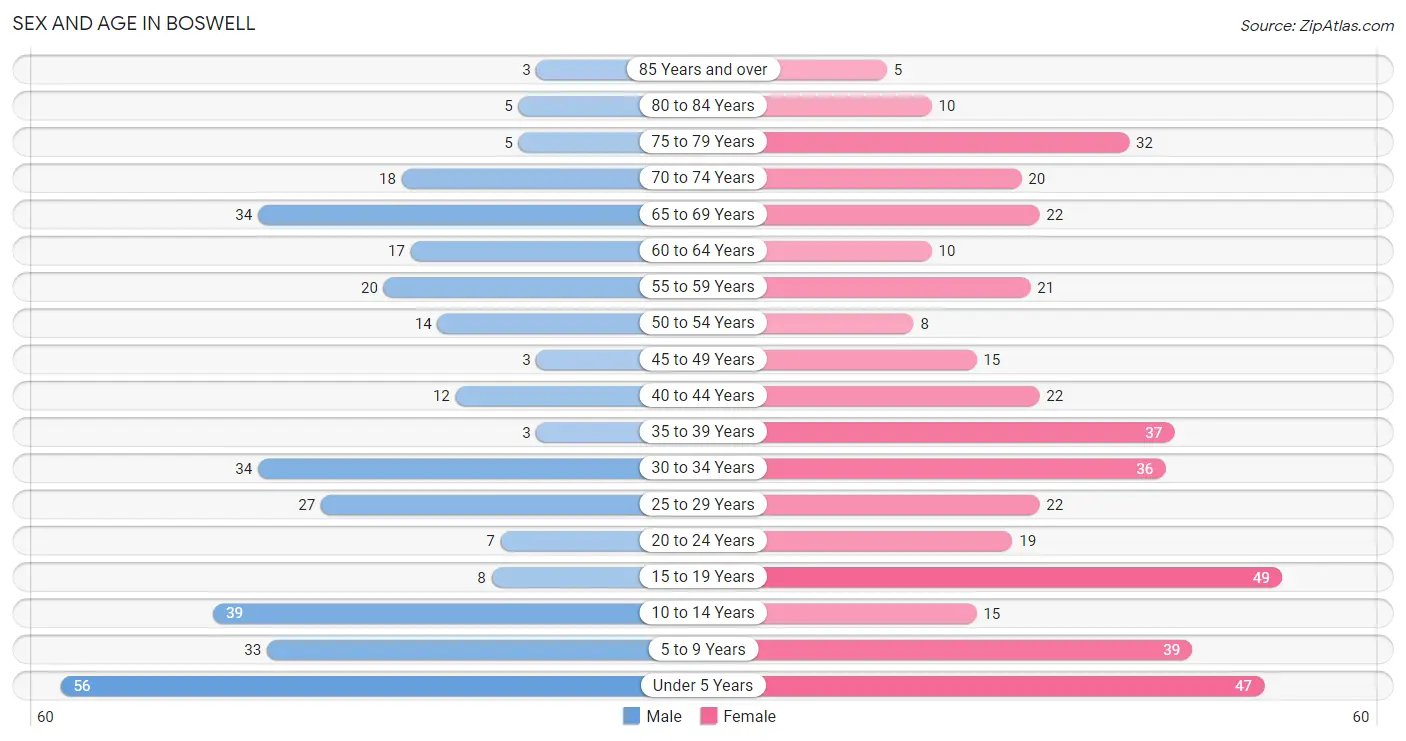
| Age Bracket | Male | Female |
| Under 5 Years | 56 (16.6%) | 47 (11.0%) |
| 5 to 9 Years | 33 (9.8%) | 39 (9.1%) |
| 10 to 14 Years | 39 (11.5%) | 15 (3.5%) |
| 15 to 19 Years | 8 (2.4%) | 49 (11.4%) |
| 20 to 24 Years | 7 (2.1%) | 19 (4.4%) |
| 25 to 29 Years | 27 (8.0%) | 22 (5.1%) |
| 30 to 34 Years | 34 (10.1%) | 36 (8.4%) |
| 35 to 39 Years | 3 (0.9%) | 37 (8.6%) |
| 40 to 44 Years | 12 (3.5%) | 22 (5.1%) |
| 45 to 49 Years | 3 (0.9%) | 15 (3.5%) |
| 50 to 54 Years | 14 (4.1%) | 8 (1.9%) |
| 55 to 59 Years | 20 (5.9%) | 21 (4.9%) |
| 60 to 64 Years | 17 (5.0%) | 10 (2.3%) |
| 65 to 69 Years | 34 (10.1%) | 22 (5.1%) |
| 70 to 74 Years | 18 (5.3%) | 20 (4.7%) |
| 75 to 79 Years | 5 (1.5%) | 32 (7.5%) |
| 80 to 84 Years | 5 (1.5%) | 10 (2.3%) |
| 85 Years and over | 3 (0.9%) | 5 (1.2%) |
| Total | 338 (100.0%) | 429 (100.0%) |
Families and Households in Boswell
Median Family Size in Boswell
The median family size in Boswell is 3.41 persons per family, with single female/mother families (75 | 45.2%) accounting for the largest median family size of 3.6 persons per family. On the other hand, single male/father families (10 | 6.0%) represent the smallest median family size with 3.00 persons per family.
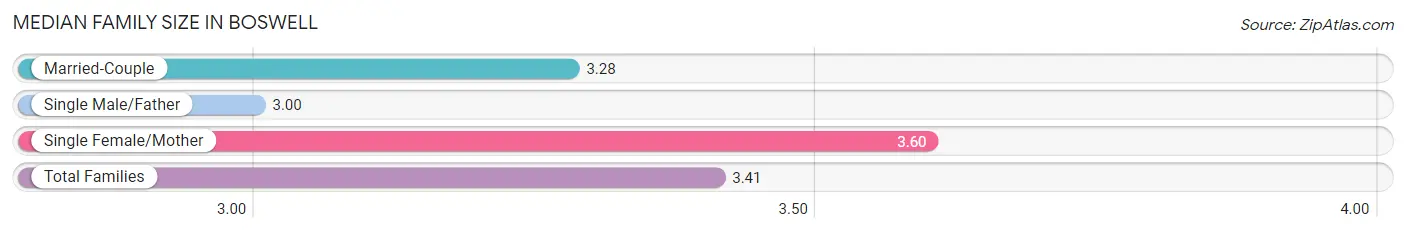
| Family Type | # Families | Family Size |
| Married-Couple | 81 (48.8%) | 3.28 |
| Single Male/Father | 10 (6.0%) | 3.00 |
| Single Female/Mother | 75 (45.2%) | 3.60 |
| Total Families | 166 (100.0%) | 3.41 |
Median Household Size in Boswell
The median household size in Boswell is 2.59 persons per household, with single female/mother households (75 | 25.3%) accounting for the largest median household size of 3.88 persons per household. non-family households (130 | 43.9%) represent the smallest median household size with 1.35 persons per household.
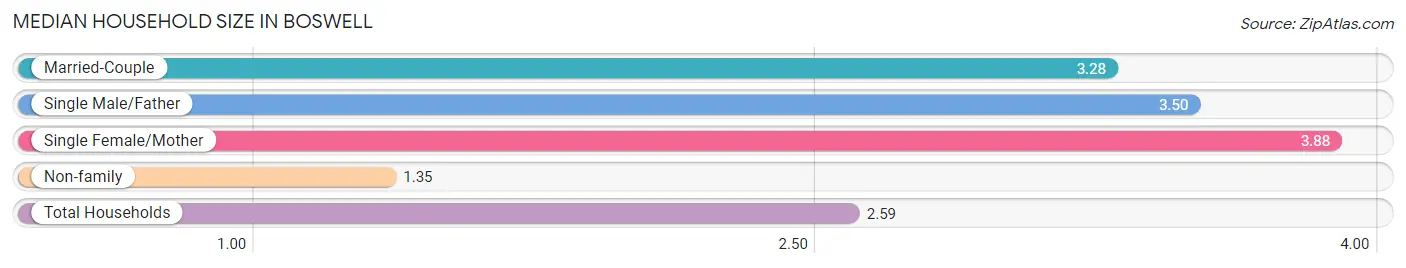
| Household Type | # Households | Household Size |
| Married-Couple | 81 (27.4%) | 3.28 |
| Single Male/Father | 10 (3.4%) | 3.50 |
| Single Female/Mother | 75 (25.3%) | 3.88 |
| Non-family | 130 (43.9%) | 1.35 |
| Total Households | 296 (100.0%) | 2.59 |
Household Size by Marriage Status in Boswell
Out of a total of 296 households in Boswell, 166 (56.1%) are family households, while 130 (43.9%) are nonfamily households. The most numerous type of family households are 2-person households, comprising 65, and the most common type of nonfamily households are 1-person households, comprising 106.
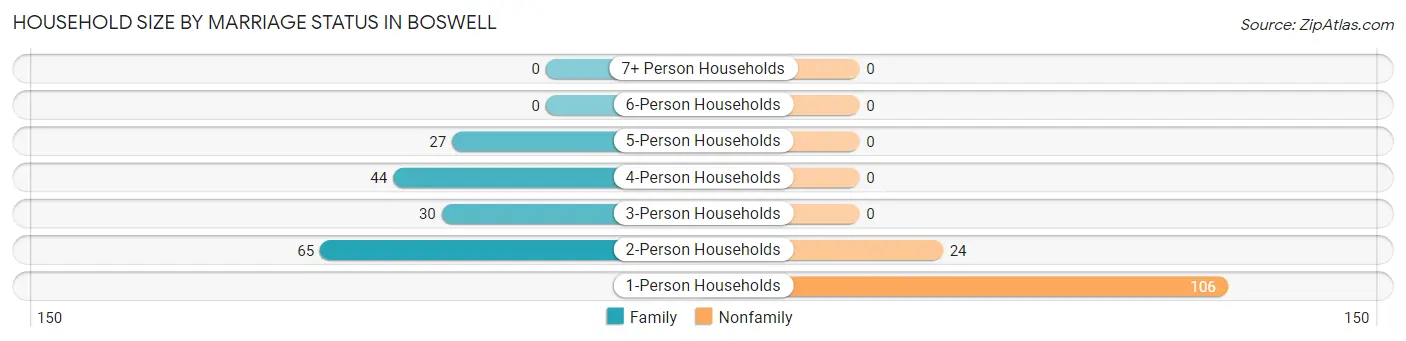
| Household Size | Family Households | Nonfamily Households |
| 1-Person Households | - | 106 (35.8%) |
| 2-Person Households | 65 (22.0%) | 24 (8.1%) |
| 3-Person Households | 30 (10.1%) | 0 (0.0%) |
| 4-Person Households | 44 (14.9%) | 0 (0.0%) |
| 5-Person Households | 27 (9.1%) | 0 (0.0%) |
| 6-Person Households | 0 (0.0%) | 0 (0.0%) |
| 7+ Person Households | 0 (0.0%) | 0 (0.0%) |
| Total | 166 (56.1%) | 130 (43.9%) |
Female Fertility in Boswell
Fertility by Age in Boswell
Average fertility rate in Boswell is 85.0 births per 1,000 women. Women in the age bracket of 20 to 34 years have the highest fertility rate with 143.0 births per 1,000 women. Women in the age bracket of 20 to 34 years acount for 64.7% of all women with births.
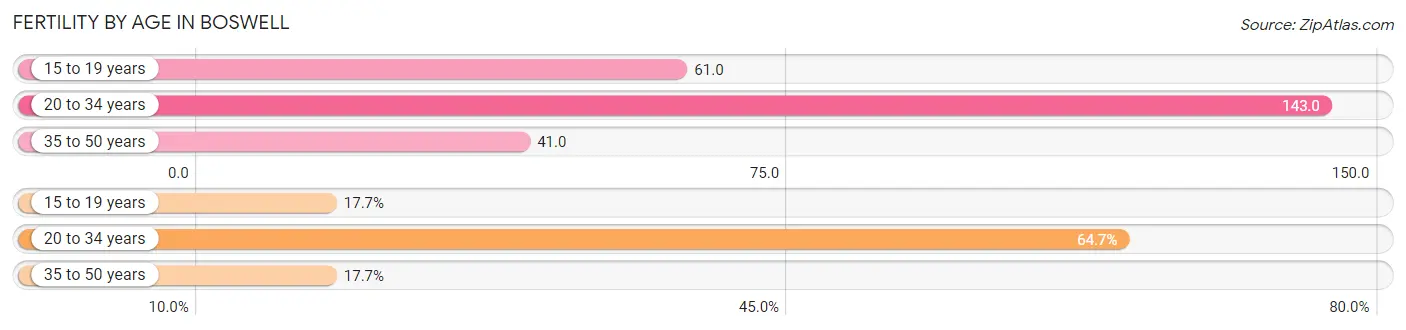
| Age Bracket | Women with Births | Births / 1,000 Women |
| 15 to 19 years | 3 (17.6%) | 61.0 |
| 20 to 34 years | 11 (64.7%) | 143.0 |
| 35 to 50 years | 3 (17.6%) | 41.0 |
| Total | 17 (100.0%) | 85.0 |
Fertility by Age by Marriage Status in Boswell
11.8% of women with births (17) in Boswell are married. The highest percentage of unmarried women with births falls into 15 to 19 years age bracket with 100.0% of them unmarried at the time of birth, while the lowest percentage of unmarried women with births belong to 20 to 34 years age bracket with 81.8% of them unmarried.
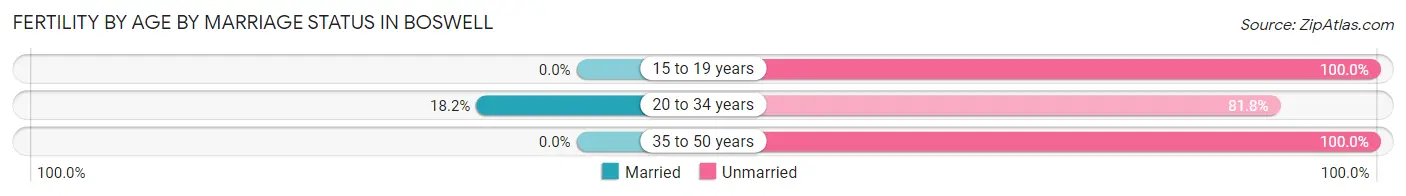
| Age Bracket | Married | Unmarried |
| 15 to 19 years | 0 (0.0%) | 3 (100.0%) |
| 20 to 34 years | 2 (18.2%) | 9 (81.8%) |
| 35 to 50 years | 0 (0.0%) | 3 (100.0%) |
| Total | 2 (11.8%) | 15 (88.2%) |
Fertility by Education in Boswell
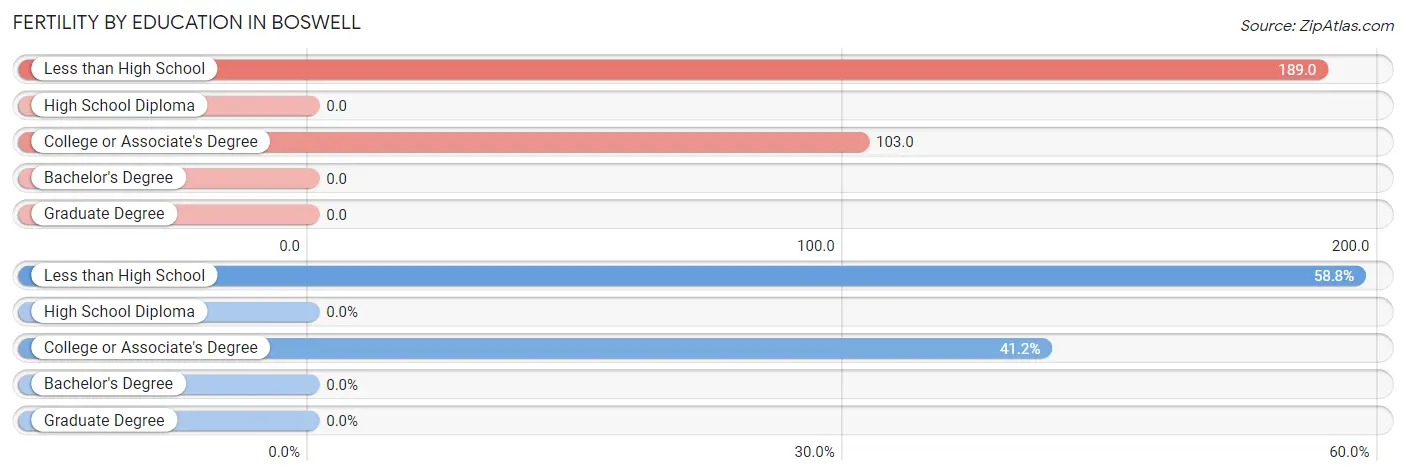
| Educational Attainment | Women with Births | Births / 1,000 Women |
| Less than High School | 10 (58.8%) | 189.0 |
| High School Diploma | 0 (0.0%) | 0.0 |
| College or Associate's Degree | 7 (41.2%) | 103.0 |
| Bachelor's Degree | 0 (0.0%) | 0.0 |
| Graduate Degree | 0 (0.0%) | 0.0 |
| Total | 17 (100.0%) | 85.0 |
Fertility by Education by Marriage Status in Boswell
88.2% of women with births in Boswell are unmarried. Women with the educational attainment of less than high school are most likely to be married with 20.0% of them married at childbirth, while women with the educational attainment of college or associate's degree are least likely to be married with 100.0% of them unmarried at childbirth.
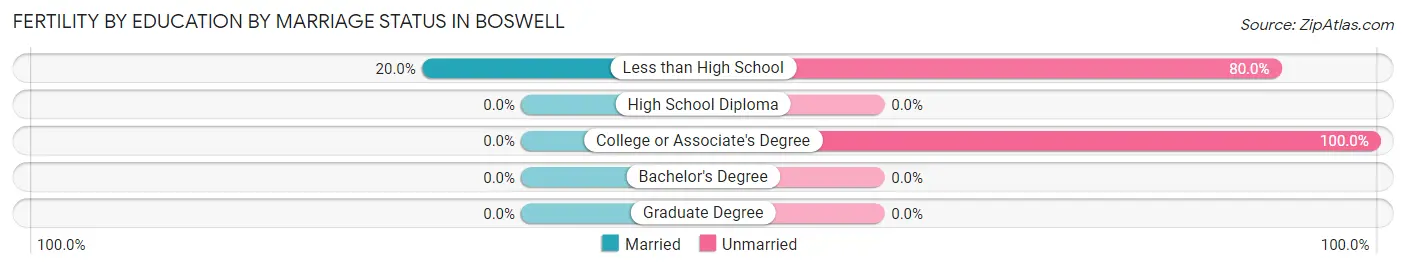
| Educational Attainment | Married | Unmarried |
| Less than High School | 2 (20.0%) | 8 (80.0%) |
| High School Diploma | 0 (0.0%) | 0 (0.0%) |
| College or Associate's Degree | 0 (0.0%) | 7 (100.0%) |
| Bachelor's Degree | 0 (0.0%) | 0 (0.0%) |
| Graduate Degree | 0 (0.0%) | 0 (0.0%) |
| Total | 2 (11.8%) | 15 (88.2%) |
Employment Characteristics in Boswell
Employment by Class of Employer in Boswell
Among the 213 employed individuals in Boswell, private company employees (142 | 66.7%), local government employees (36 | 16.9%), and self-employed (not incorporated) (13 | 6.1%) make up the most common classes of employment.
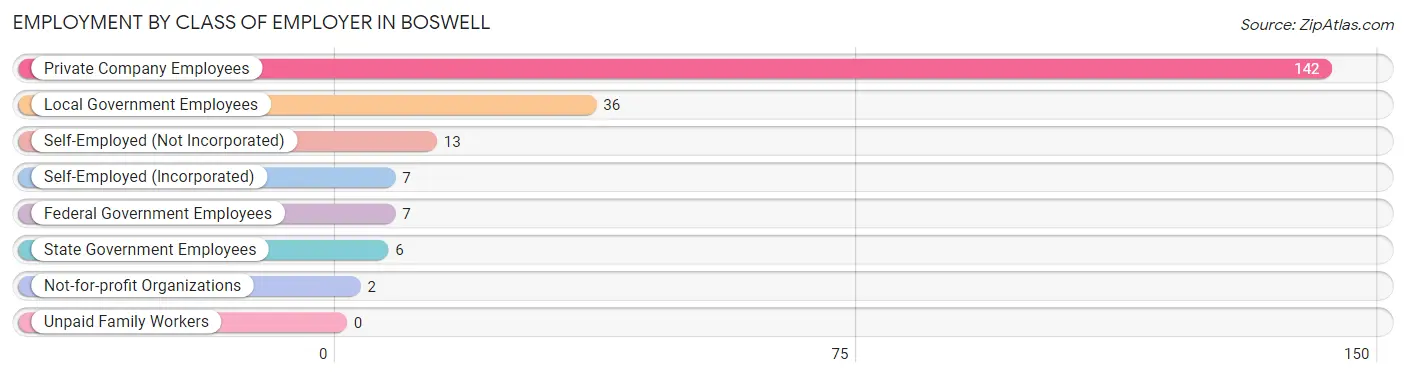
| Employer Class | # Employees | % Employees |
| Private Company Employees | 142 | 66.7% |
| Self-Employed (Incorporated) | 7 | 3.3% |
| Self-Employed (Not Incorporated) | 13 | 6.1% |
| Not-for-profit Organizations | 2 | 0.9% |
| Local Government Employees | 36 | 16.9% |
| State Government Employees | 6 | 2.8% |
| Federal Government Employees | 7 | 3.3% |
| Unpaid Family Workers | 0 | 0.0% |
| Total | 213 | 100.0% |
Employment Status by Age in Boswell
According to the labor force statistics for Boswell, out of the total population over 16 years of age (536), 43.5% or 233 individuals are in the labor force, with 7.7% or 18 of them unemployed. The age group with the highest labor force participation rate is 30 to 34 years, with 85.7% or 60 individuals in the labor force. Within the labor force, the 20 to 24 years age range has the highest percentage of unemployed individuals, with 20.0% or 3 of them being unemployed.
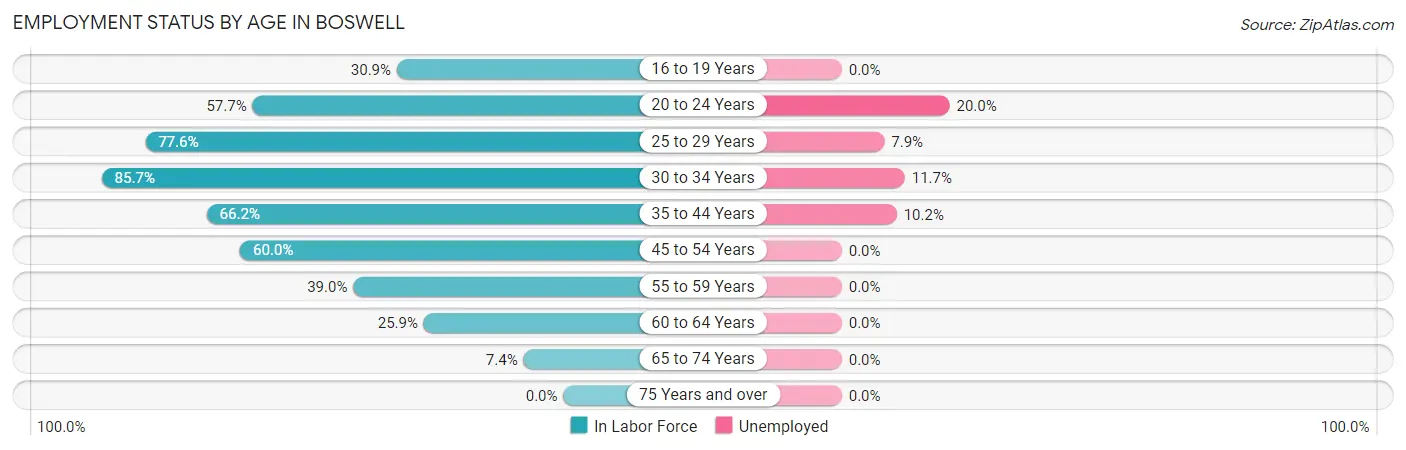
| Age Bracket | In Labor Force | Unemployed |
| 16 to 19 Years | 17 (30.9%) | 0 (0.0%) |
| 20 to 24 Years | 15 (57.7%) | 3 (20.0%) |
| 25 to 29 Years | 38 (77.6%) | 3 (7.9%) |
| 30 to 34 Years | 60 (85.7%) | 7 (11.7%) |
| 35 to 44 Years | 49 (66.2%) | 5 (10.2%) |
| 45 to 54 Years | 24 (60.0%) | 0 (0.0%) |
| 55 to 59 Years | 16 (39.0%) | 0 (0.0%) |
| 60 to 64 Years | 7 (25.9%) | 0 (0.0%) |
| 65 to 74 Years | 7 (7.4%) | 0 (0.0%) |
| 75 Years and over | 0 (0.0%) | 0 (0.0%) |
| Total | 233 (43.5%) | 18 (7.7%) |
Employment Status by Educational Attainment in Boswell
According to labor force statistics for Boswell, 64.5% of individuals (194) out of the total population between 25 and 64 years of age (301) are in the labor force, with 7.7% or 15 of them being unemployed. The group with the highest labor force participation rate are those with the educational attainment of college / associate degree, with 75.8% or 72 individuals in the labor force. Within the labor force, individuals with college / associate degree education have the highest percentage of unemployment, with 9.7% or 7 of them being unemployed.
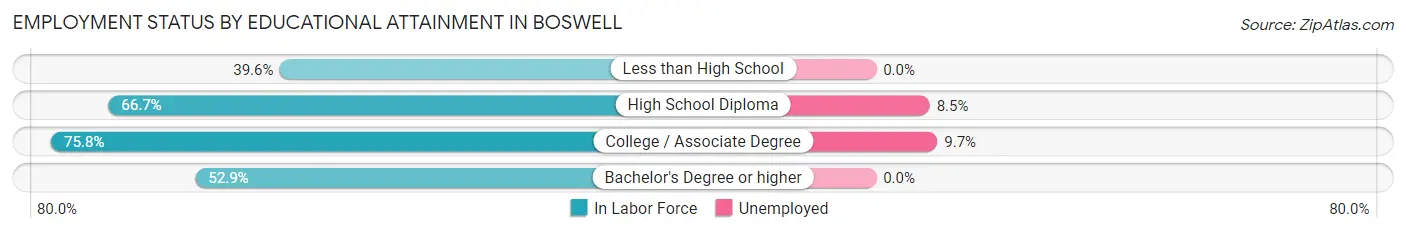
| Educational Attainment | In Labor Force | Unemployed |
| Less than High School | 19 (39.6%) | 0 (0.0%) |
| High School Diploma | 94 (66.7%) | 12 (8.5%) |
| College / Associate Degree | 72 (75.8%) | 9 (9.7%) |
| Bachelor's Degree or higher | 9 (52.9%) | 0 (0.0%) |
| Total | 194 (64.5%) | 23 (7.7%) |
Employment Occupations by Sex in Boswell
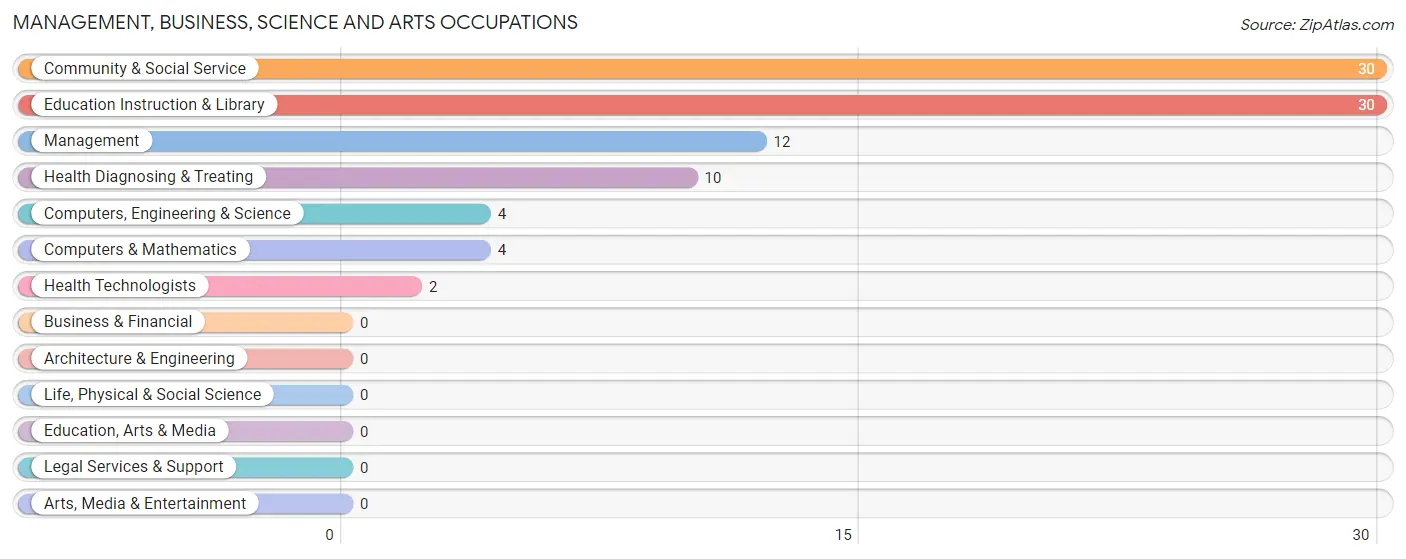
Management, Business, Science and Arts Occupations
The most common Management, Business, Science and Arts occupations in Boswell are Community & Social Service (30 | 14.0%), Education Instruction & Library (30 | 14.0%), Management (12 | 5.6%), Health Diagnosing & Treating (10 | 4.6%), and Computers, Engineering & Science (4 | 1.9%).
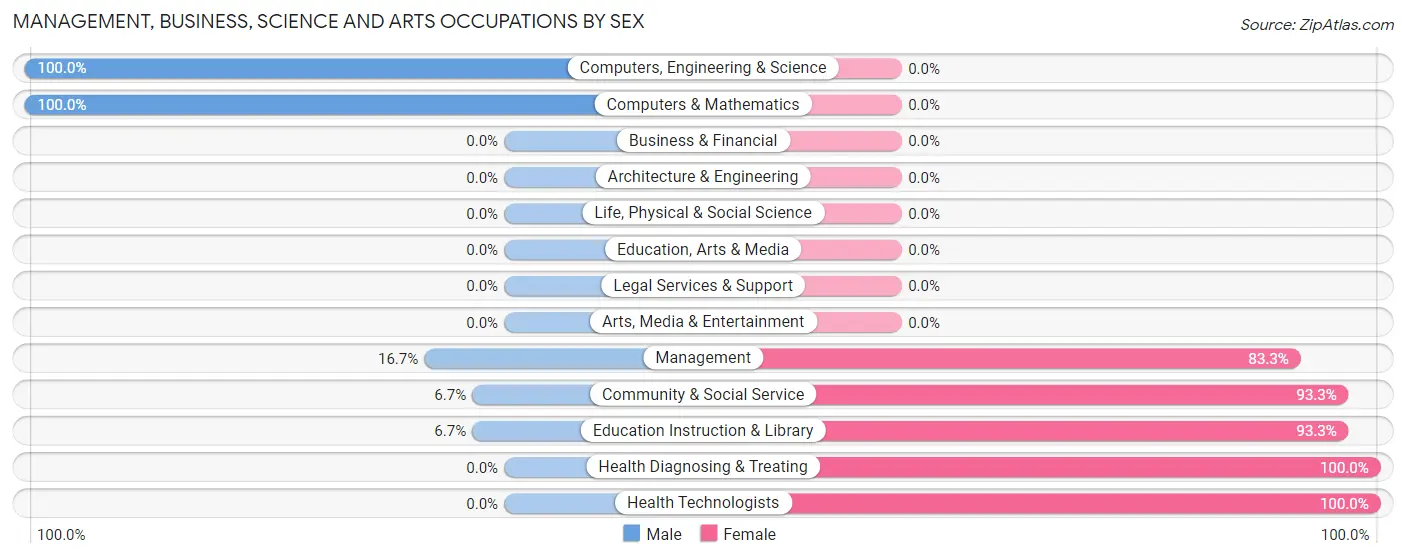
Management, Business, Science and Arts Occupations by Sex
Within the Management, Business, Science and Arts occupations in Boswell, the most male-oriented occupations are Computers, Engineering & Science (100.0%), Computers & Mathematics (100.0%), and Management (16.7%), while the most female-oriented occupations are Health Diagnosing & Treating (100.0%), Health Technologists (100.0%), and Community & Social Service (93.3%).
| Occupation | Male | Female |
| Management | 2 (16.7%) | 10 (83.3%) |
| Business & Financial | 0 (0.0%) | 0 (0.0%) |
| Computers, Engineering & Science | 4 (100.0%) | 0 (0.0%) |
| Computers & Mathematics | 4 (100.0%) | 0 (0.0%) |
| Architecture & Engineering | 0 (0.0%) | 0 (0.0%) |
| Life, Physical & Social Science | 0 (0.0%) | 0 (0.0%) |
| Community & Social Service | 2 (6.7%) | 28 (93.3%) |
| Education, Arts & Media | 0 (0.0%) | 0 (0.0%) |
| Legal Services & Support | 0 (0.0%) | 0 (0.0%) |
| Education Instruction & Library | 2 (6.7%) | 28 (93.3%) |
| Arts, Media & Entertainment | 0 (0.0%) | 0 (0.0%) |
| Health Diagnosing & Treating | 0 (0.0%) | 10 (100.0%) |
| Health Technologists | 0 (0.0%) | 2 (100.0%) |
| Total (Category) | 8 (14.3%) | 48 (85.7%) |
| Total (Overall) | 95 (44.2%) | 120 (55.8%) |
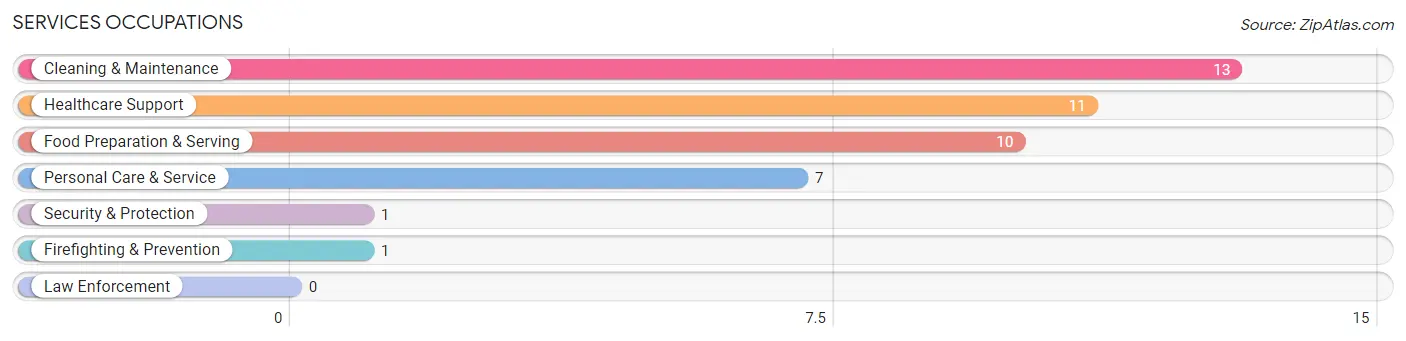
Services Occupations
The most common Services occupations in Boswell are Cleaning & Maintenance (13 | 6.0%), Healthcare Support (11 | 5.1%), Food Preparation & Serving (10 | 4.6%), Personal Care & Service (7 | 3.3%), and Security & Protection (1 | 0.5%).
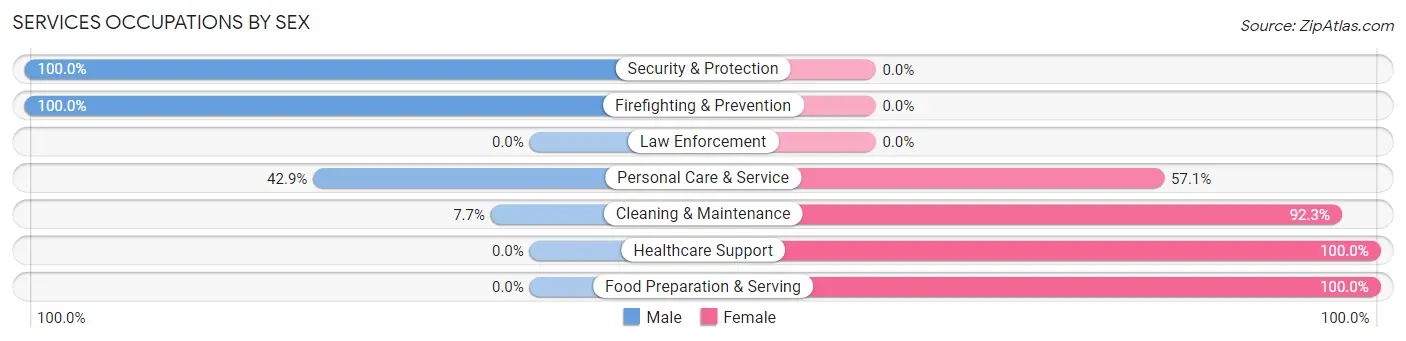
Services Occupations by Sex
Within the Services occupations in Boswell, the most male-oriented occupations are Security & Protection (100.0%), Firefighting & Prevention (100.0%), and Personal Care & Service (42.9%), while the most female-oriented occupations are Healthcare Support (100.0%), Food Preparation & Serving (100.0%), and Cleaning & Maintenance (92.3%).
| Occupation | Male | Female |
| Healthcare Support | 0 (0.0%) | 11 (100.0%) |
| Security & Protection | 1 (100.0%) | 0 (0.0%) |
| Firefighting & Prevention | 1 (100.0%) | 0 (0.0%) |
| Law Enforcement | 0 (0.0%) | 0 (0.0%) |
| Food Preparation & Serving | 0 (0.0%) | 10 (100.0%) |
| Cleaning & Maintenance | 1 (7.7%) | 12 (92.3%) |
| Personal Care & Service | 3 (42.9%) | 4 (57.1%) |
| Total (Category) | 5 (11.9%) | 37 (88.1%) |
| Total (Overall) | 95 (44.2%) | 120 (55.8%) |
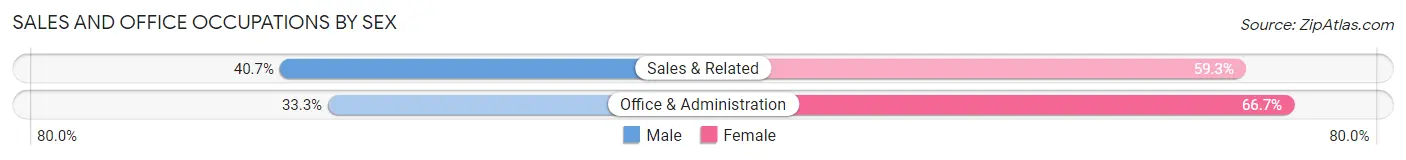
Sales and Office Occupations
The most common Sales and Office occupations in Boswell are Sales & Related (27 | 12.6%), and Office & Administration (21 | 9.8%).

Sales and Office Occupations by Sex
| Occupation | Male | Female |
| Sales & Related | 11 (40.7%) | 16 (59.3%) |
| Office & Administration | 7 (33.3%) | 14 (66.7%) |
| Total (Category) | 18 (37.5%) | 30 (62.5%) |
| Total (Overall) | 95 (44.2%) | 120 (55.8%) |
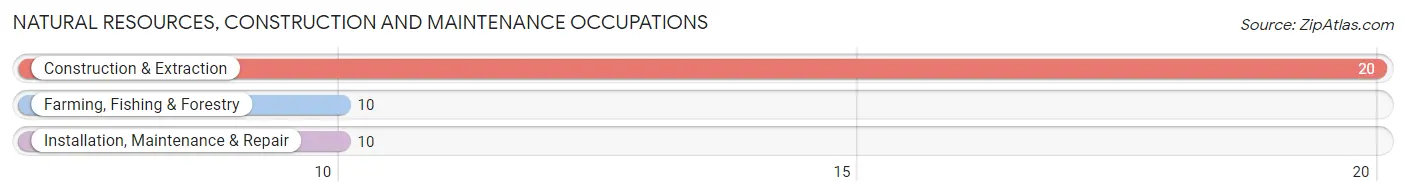
Natural Resources, Construction and Maintenance Occupations
The most common Natural Resources, Construction and Maintenance occupations in Boswell are Construction & Extraction (20 | 9.3%), Farming, Fishing & Forestry (10 | 4.6%), and Installation, Maintenance & Repair (10 | 4.6%).
Natural Resources, Construction and Maintenance Occupations by Sex
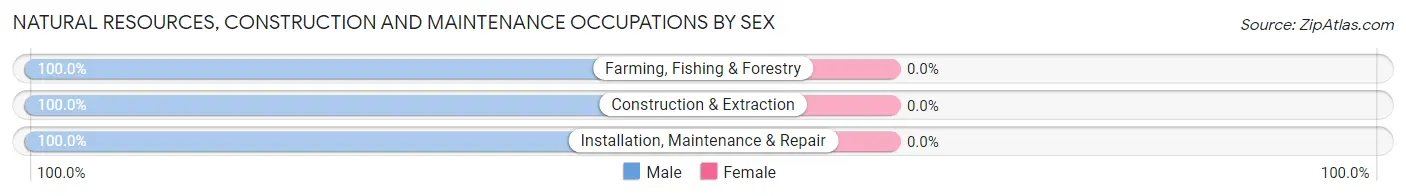
| Occupation | Male | Female |
| Farming, Fishing & Forestry | 10 (100.0%) | 0 (0.0%) |
| Construction & Extraction | 20 (100.0%) | 0 (0.0%) |
| Installation, Maintenance & Repair | 10 (100.0%) | 0 (0.0%) |
| Total (Category) | 40 (100.0%) | 0 (0.0%) |
| Total (Overall) | 95 (44.2%) | 120 (55.8%) |
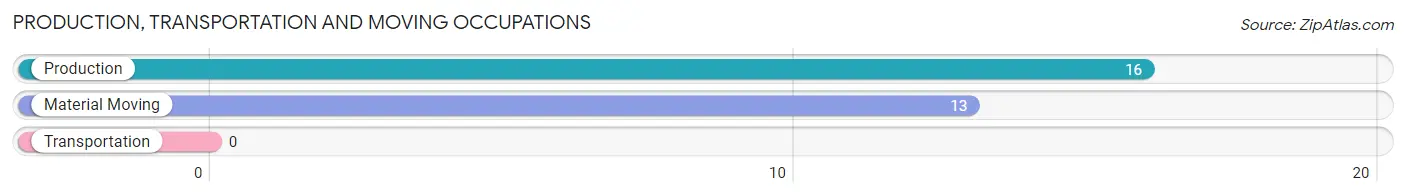
Production, Transportation and Moving Occupations
The most common Production, Transportation and Moving occupations in Boswell are Production (16 | 7.4%), and Material Moving (13 | 6.0%).
Production, Transportation and Moving Occupations by Sex
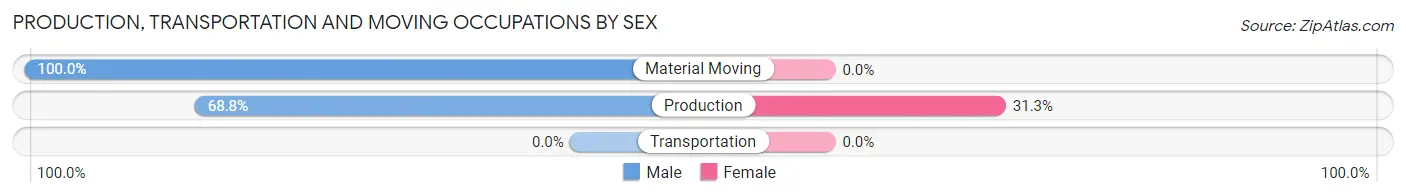
| Occupation | Male | Female |
| Production | 11 (68.8%) | 5 (31.2%) |
| Transportation | 0 (0.0%) | 0 (0.0%) |
| Material Moving | 13 (100.0%) | 0 (0.0%) |
| Total (Category) | 24 (82.8%) | 5 (17.2%) |
| Total (Overall) | 95 (44.2%) | 120 (55.8%) |
Employment Industries by Sex in Boswell
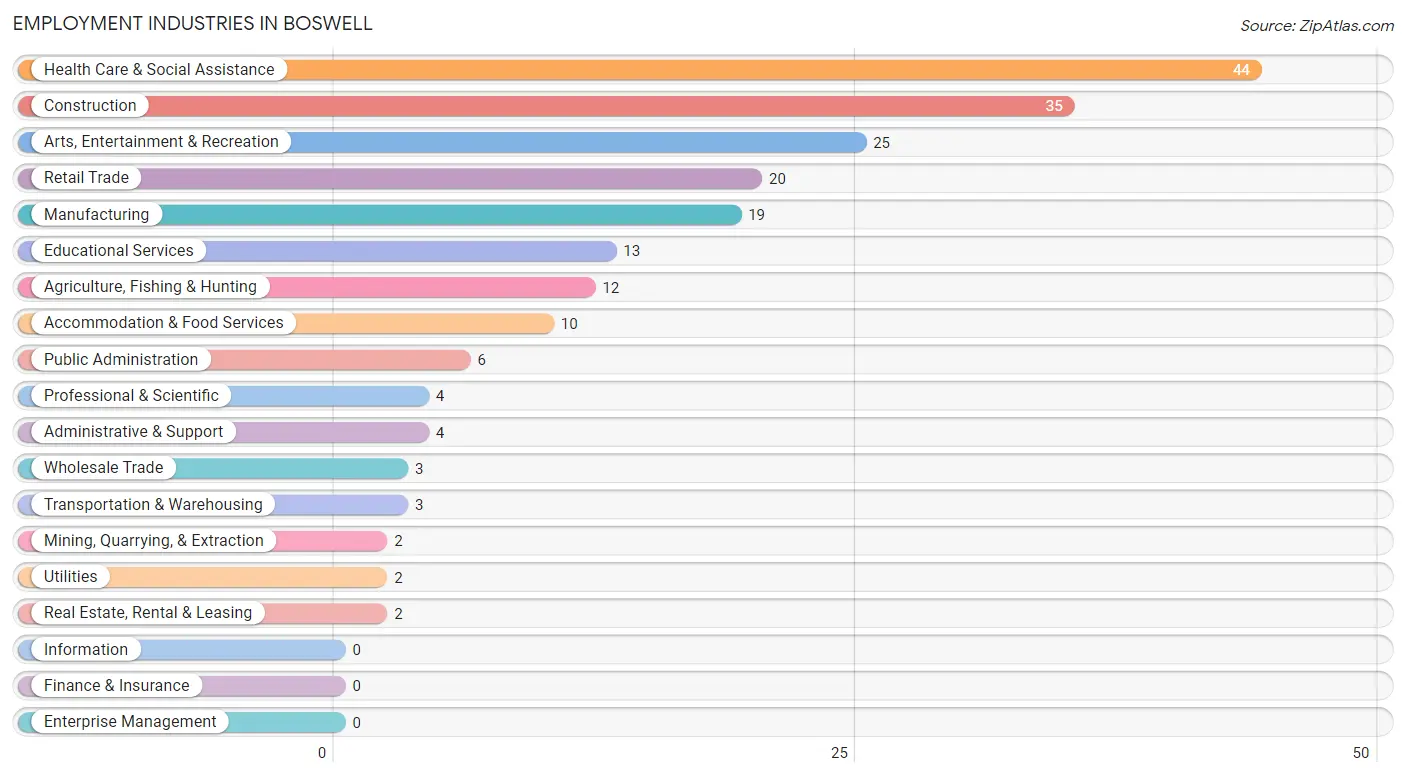
Employment Industries in Boswell
The major employment industries in Boswell include Health Care & Social Assistance (44 | 20.5%), Construction (35 | 16.3%), Arts, Entertainment & Recreation (25 | 11.6%), Retail Trade (20 | 9.3%), and Manufacturing (19 | 8.8%).
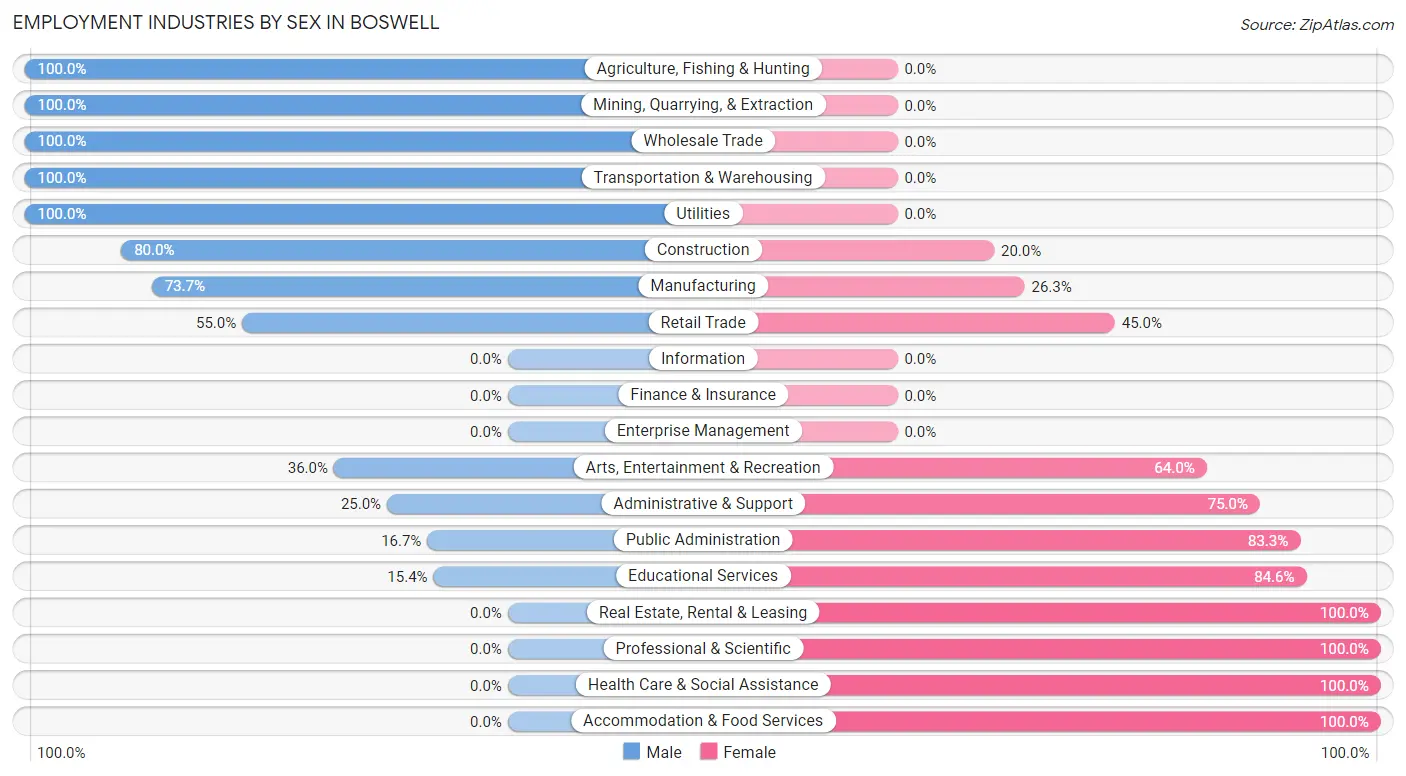
Employment Industries by Sex in Boswell
The Boswell industries that see more men than women are Agriculture, Fishing & Hunting (100.0%), Mining, Quarrying, & Extraction (100.0%), and Wholesale Trade (100.0%), whereas the industries that tend to have a higher number of women are Real Estate, Rental & Leasing (100.0%), Professional & Scientific (100.0%), and Health Care & Social Assistance (100.0%).
| Industry | Male | Female |
| Agriculture, Fishing & Hunting | 12 (100.0%) | 0 (0.0%) |
| Mining, Quarrying, & Extraction | 2 (100.0%) | 0 (0.0%) |
| Construction | 28 (80.0%) | 7 (20.0%) |
| Manufacturing | 14 (73.7%) | 5 (26.3%) |
| Wholesale Trade | 3 (100.0%) | 0 (0.0%) |
| Retail Trade | 11 (55.0%) | 9 (45.0%) |
| Transportation & Warehousing | 3 (100.0%) | 0 (0.0%) |
| Utilities | 2 (100.0%) | 0 (0.0%) |
| Information | 0 (0.0%) | 0 (0.0%) |
| Finance & Insurance | 0 (0.0%) | 0 (0.0%) |
| Real Estate, Rental & Leasing | 0 (0.0%) | 2 (100.0%) |
| Professional & Scientific | 0 (0.0%) | 4 (100.0%) |
| Enterprise Management | 0 (0.0%) | 0 (0.0%) |
| Administrative & Support | 1 (25.0%) | 3 (75.0%) |
| Educational Services | 2 (15.4%) | 11 (84.6%) |
| Health Care & Social Assistance | 0 (0.0%) | 44 (100.0%) |
| Arts, Entertainment & Recreation | 9 (36.0%) | 16 (64.0%) |
| Accommodation & Food Services | 0 (0.0%) | 10 (100.0%) |
| Public Administration | 1 (16.7%) | 5 (83.3%) |
| Total | 95 (44.2%) | 120 (55.8%) |
Education in Boswell
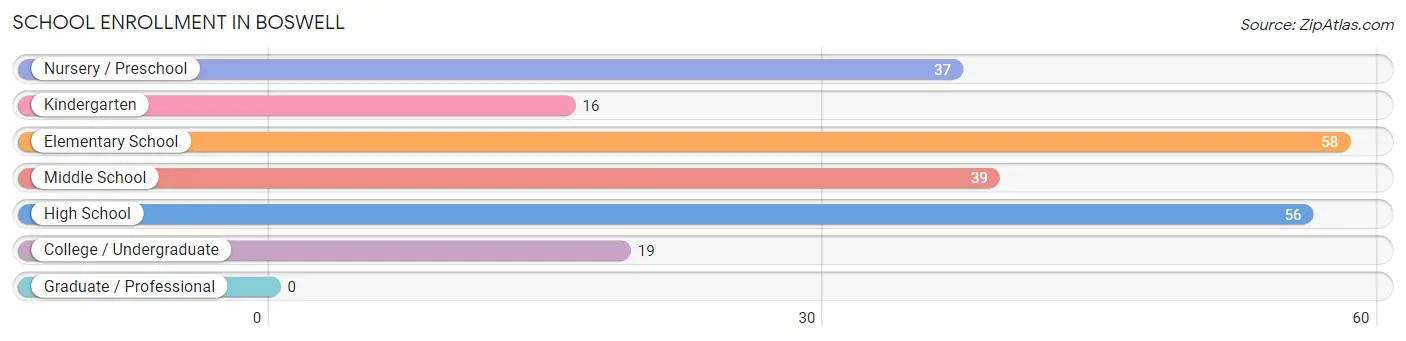
School Enrollment in Boswell
The most common levels of schooling among the 225 students in Boswell are elementary school (58 | 25.8%), high school (56 | 24.9%), and middle school (39 | 17.3%).
| School Level | # Students | % Students |
| Nursery / Preschool | 37 | 16.4% |
| Kindergarten | 16 | 7.1% |
| Elementary School | 58 | 25.8% |
| Middle School | 39 | 17.3% |
| High School | 56 | 24.9% |
| College / Undergraduate | 19 | 8.4% |
| Graduate / Professional | 0 | 0.0% |
| Total | 225 | 100.0% |
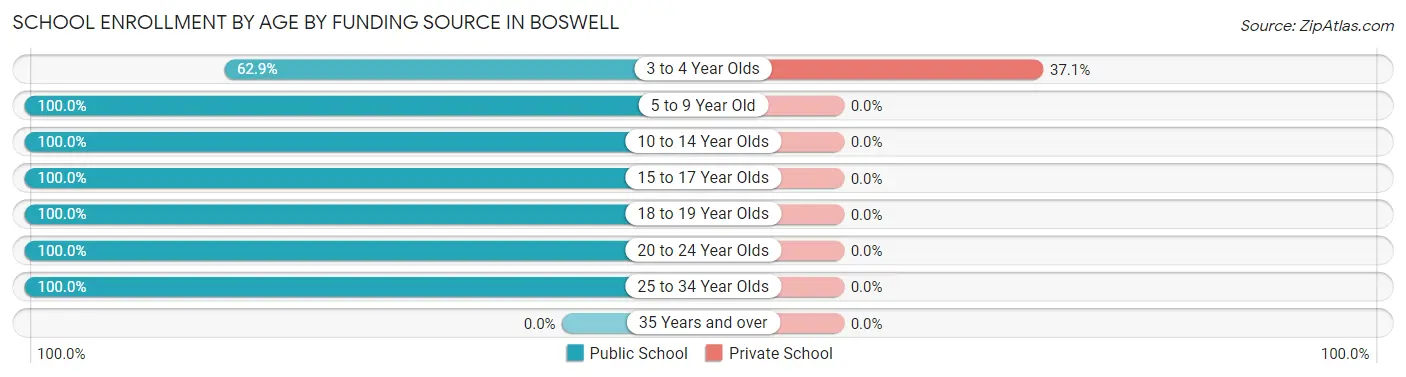
School Enrollment by Age by Funding Source in Boswell
Out of a total of 225 students who are enrolled in schools in Boswell, 13 (5.8%) attend a private institution, while the remaining 212 (94.2%) are enrolled in public schools. The age group of 3 to 4 year olds has the highest likelihood of being enrolled in private schools, with 13 (37.1% in the age bracket) enrolled. Conversely, the age group of 5 to 9 year old has the lowest likelihood of being enrolled in a private school, with 72 (100.0% in the age bracket) attending a public institution.
| Age Bracket | Public School | Private School |
| 3 to 4 Year Olds | 22 (62.9%) | 13 (37.1%) |
| 5 to 9 Year Old | 72 (100.0%) | 0 (0.0%) |
| 10 to 14 Year Olds | 54 (100.0%) | 0 (0.0%) |
| 15 to 17 Year Olds | 12 (100.0%) | 0 (0.0%) |
| 18 to 19 Year Olds | 33 (100.0%) | 0 (0.0%) |
| 20 to 24 Year Olds | 7 (100.0%) | 0 (0.0%) |
| 25 to 34 Year Olds | 12 (100.0%) | 0 (0.0%) |
| 35 Years and over | 0 (0.0%) | 0 (0.0%) |
| Total | 212 (94.2%) | 13 (5.8%) |
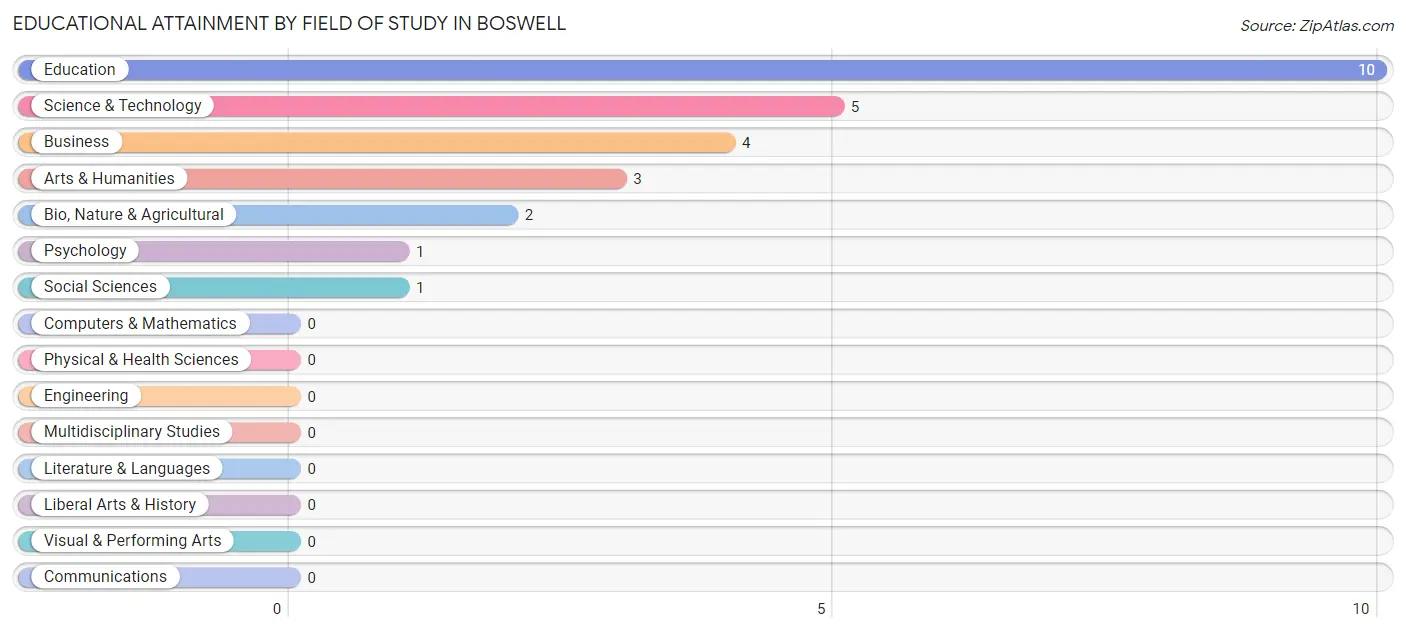
Educational Attainment by Field of Study in Boswell
Education (10 | 38.5%), science & technology (5 | 19.2%), business (4 | 15.4%), arts & humanities (3 | 11.5%), and bio, nature & agricultural (2 | 7.7%) are the most common fields of study among 26 individuals in Boswell who have obtained a bachelor's degree or higher.
| Field of Study | # Graduates | % Graduates |
| Computers & Mathematics | 0 | 0.0% |
| Bio, Nature & Agricultural | 2 | 7.7% |
| Physical & Health Sciences | 0 | 0.0% |
| Psychology | 1 | 3.8% |
| Social Sciences | 1 | 3.8% |
| Engineering | 0 | 0.0% |
| Multidisciplinary Studies | 0 | 0.0% |
| Science & Technology | 5 | 19.2% |
| Business | 4 | 15.4% |
| Education | 10 | 38.5% |
| Literature & Languages | 0 | 0.0% |
| Liberal Arts & History | 0 | 0.0% |
| Visual & Performing Arts | 0 | 0.0% |
| Communications | 0 | 0.0% |
| Arts & Humanities | 3 | 11.5% |
| Total | 26 | 100.0% |
Transportation & Commute in Boswell
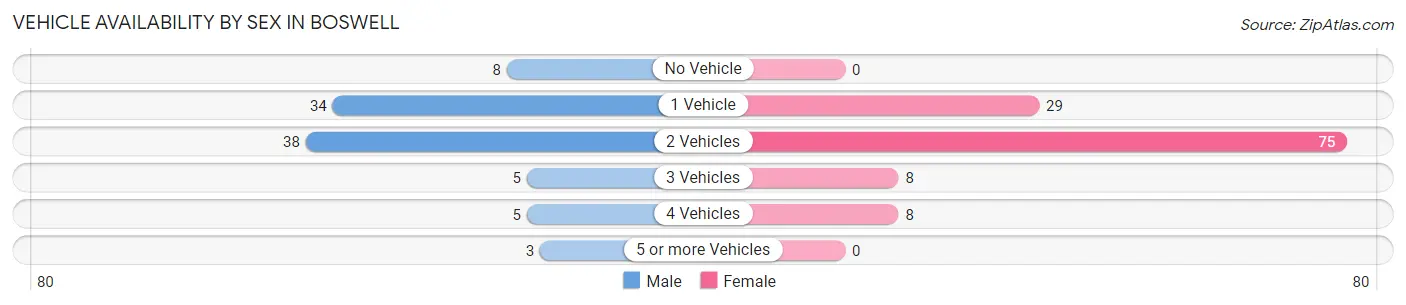
Vehicle Availability by Sex in Boswell
The most prevalent vehicle ownership categories in Boswell are males with 2 vehicles (38, accounting for 40.9%) and females with 2 vehicles (75, making up 31.7%).
| Vehicles Available | Male | Female |
| No Vehicle | 8 (8.6%) | 0 (0.0%) |
| 1 Vehicle | 34 (36.6%) | 29 (24.2%) |
| 2 Vehicles | 38 (40.9%) | 75 (62.5%) |
| 3 Vehicles | 5 (5.4%) | 8 (6.7%) |
| 4 Vehicles | 5 (5.4%) | 8 (6.7%) |
| 5 or more Vehicles | 3 (3.2%) | 0 (0.0%) |
| Total | 93 (100.0%) | 120 (100.0%) |
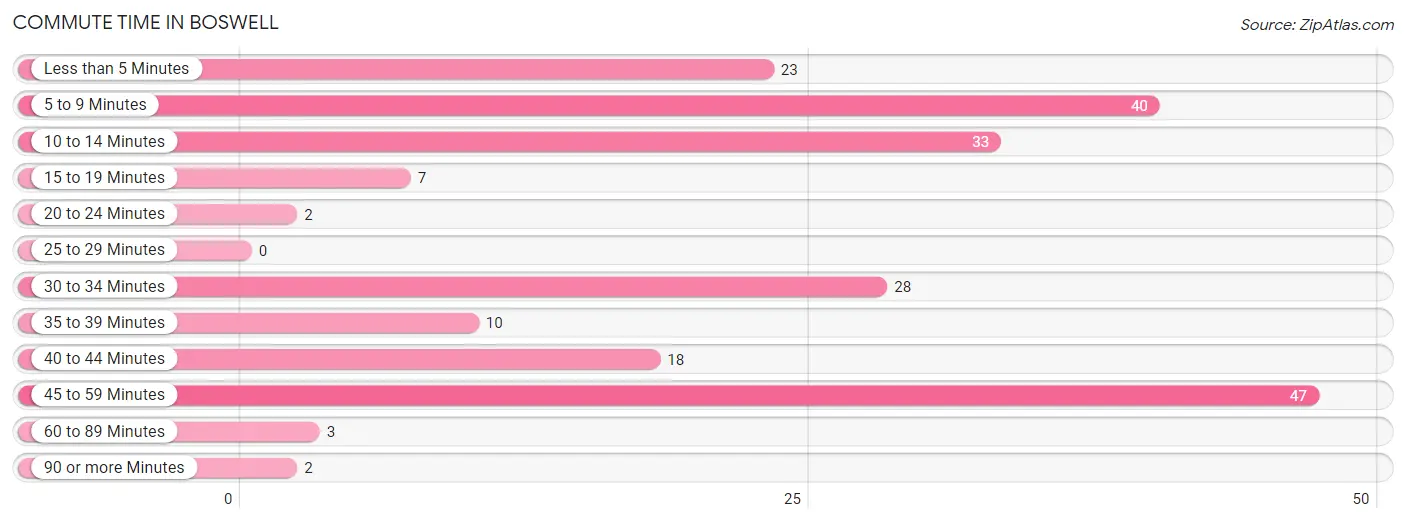
Commute Time in Boswell
The most frequently occuring commute durations in Boswell are 45 to 59 minutes (47 commuters, 22.1%), 5 to 9 minutes (40 commuters, 18.8%), and 10 to 14 minutes (33 commuters, 15.5%).
| Commute Time | # Commuters | % Commuters |
| Less than 5 Minutes | 23 | 10.8% |
| 5 to 9 Minutes | 40 | 18.8% |
| 10 to 14 Minutes | 33 | 15.5% |
| 15 to 19 Minutes | 7 | 3.3% |
| 20 to 24 Minutes | 2 | 0.9% |
| 25 to 29 Minutes | 0 | 0.0% |
| 30 to 34 Minutes | 28 | 13.2% |
| 35 to 39 Minutes | 10 | 4.7% |
| 40 to 44 Minutes | 18 | 8.5% |
| 45 to 59 Minutes | 47 | 22.1% |
| 60 to 89 Minutes | 3 | 1.4% |
| 90 or more Minutes | 2 | 0.9% |
Commute Time by Sex in Boswell
The most common commute times in Boswell are 5 to 9 minutes (21 commuters, 22.6%) for males and 45 to 59 minutes (27 commuters, 22.5%) for females.
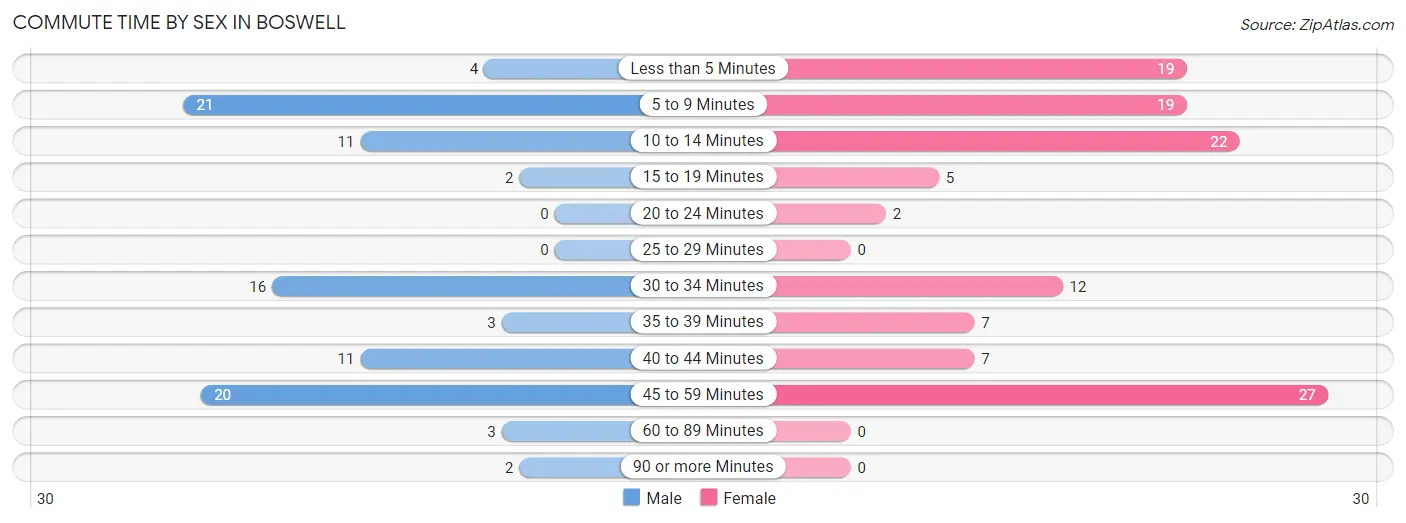
| Commute Time | Male | Female |
| Less than 5 Minutes | 4 (4.3%) | 19 (15.8%) |
| 5 to 9 Minutes | 21 (22.6%) | 19 (15.8%) |
| 10 to 14 Minutes | 11 (11.8%) | 22 (18.3%) |
| 15 to 19 Minutes | 2 (2.1%) | 5 (4.2%) |
| 20 to 24 Minutes | 0 (0.0%) | 2 (1.7%) |
| 25 to 29 Minutes | 0 (0.0%) | 0 (0.0%) |
| 30 to 34 Minutes | 16 (17.2%) | 12 (10.0%) |
| 35 to 39 Minutes | 3 (3.2%) | 7 (5.8%) |
| 40 to 44 Minutes | 11 (11.8%) | 7 (5.8%) |
| 45 to 59 Minutes | 20 (21.5%) | 27 (22.5%) |
| 60 to 89 Minutes | 3 (3.2%) | 0 (0.0%) |
| 90 or more Minutes | 2 (2.1%) | 0 (0.0%) |
Time of Departure to Work by Sex in Boswell
The most frequent times of departure to work in Boswell are 7:00 AM to 7:29 AM (26, 28.0%) for males and 7:00 AM to 7:29 AM (57, 47.5%) for females.
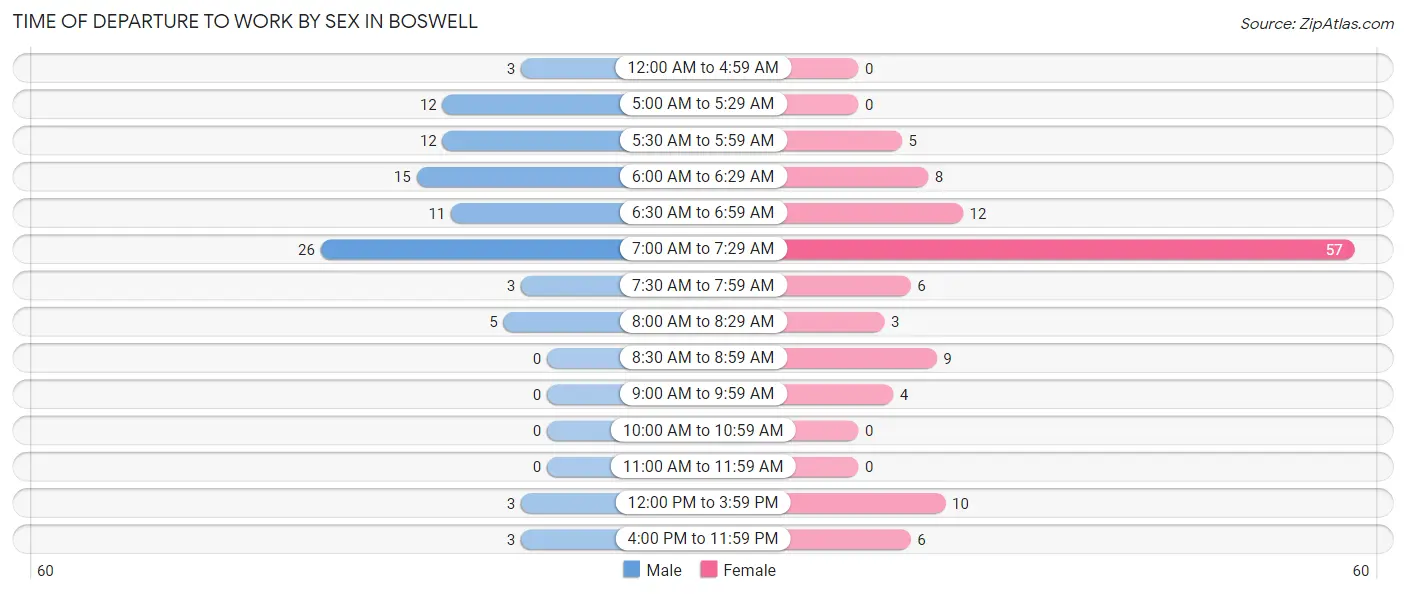
| Time of Departure | Male | Female |
| 12:00 AM to 4:59 AM | 3 (3.2%) | 0 (0.0%) |
| 5:00 AM to 5:29 AM | 12 (12.9%) | 0 (0.0%) |
| 5:30 AM to 5:59 AM | 12 (12.9%) | 5 (4.2%) |
| 6:00 AM to 6:29 AM | 15 (16.1%) | 8 (6.7%) |
| 6:30 AM to 6:59 AM | 11 (11.8%) | 12 (10.0%) |
| 7:00 AM to 7:29 AM | 26 (28.0%) | 57 (47.5%) |
| 7:30 AM to 7:59 AM | 3 (3.2%) | 6 (5.0%) |
| 8:00 AM to 8:29 AM | 5 (5.4%) | 3 (2.5%) |
| 8:30 AM to 8:59 AM | 0 (0.0%) | 9 (7.5%) |
| 9:00 AM to 9:59 AM | 0 (0.0%) | 4 (3.3%) |
| 10:00 AM to 10:59 AM | 0 (0.0%) | 0 (0.0%) |
| 11:00 AM to 11:59 AM | 0 (0.0%) | 0 (0.0%) |
| 12:00 PM to 3:59 PM | 3 (3.2%) | 10 (8.3%) |
| 4:00 PM to 11:59 PM | 3 (3.2%) | 6 (5.0%) |
| Total | 93 (100.0%) | 120 (100.0%) |
Housing Occupancy in Boswell
Occupancy by Ownership in Boswell
Of the total 296 dwellings in Boswell, owner-occupied units account for 178 (60.1%), while renter-occupied units make up 118 (39.9%).
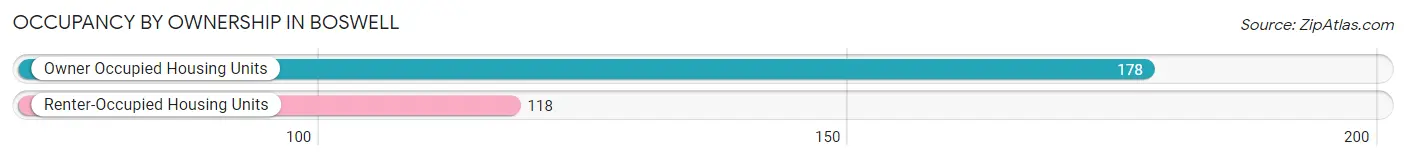
| Occupancy | # Housing Units | % Housing Units |
| Owner Occupied Housing Units | 178 | 60.1% |
| Renter-Occupied Housing Units | 118 | 39.9% |
| Total Occupied Housing Units | 296 | 100.0% |
Occupancy by Household Size in Boswell
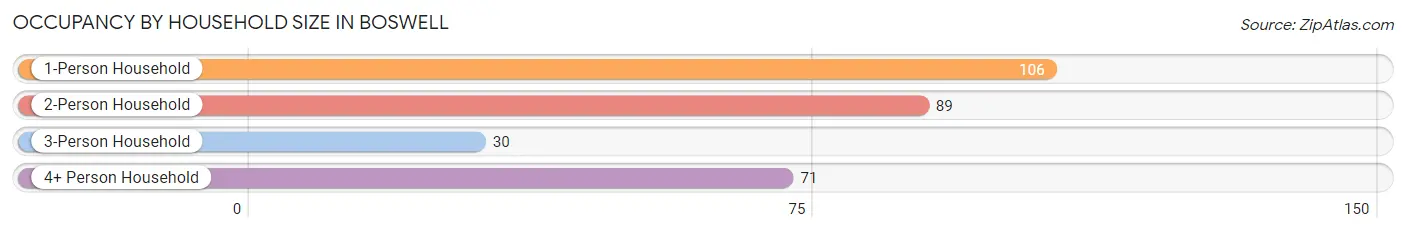
| Household Size | # Housing Units | % Housing Units |
| 1-Person Household | 106 | 35.8% |
| 2-Person Household | 89 | 30.1% |
| 3-Person Household | 30 | 10.1% |
| 4+ Person Household | 71 | 24.0% |
| Total Housing Units | 296 | 100.0% |
Occupancy by Ownership by Household Size in Boswell
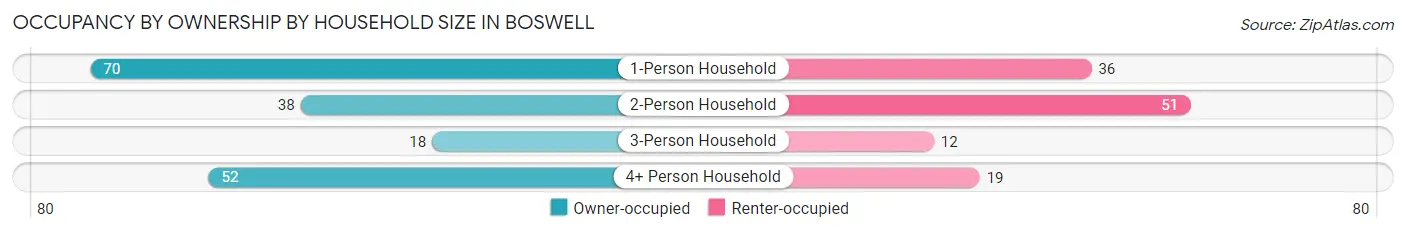
| Household Size | Owner-occupied | Renter-occupied |
| 1-Person Household | 70 (66.0%) | 36 (34.0%) |
| 2-Person Household | 38 (42.7%) | 51 (57.3%) |
| 3-Person Household | 18 (60.0%) | 12 (40.0%) |
| 4+ Person Household | 52 (73.2%) | 19 (26.8%) |
| Total Housing Units | 178 (60.1%) | 118 (39.9%) |
Occupancy by Educational Attainment in Boswell
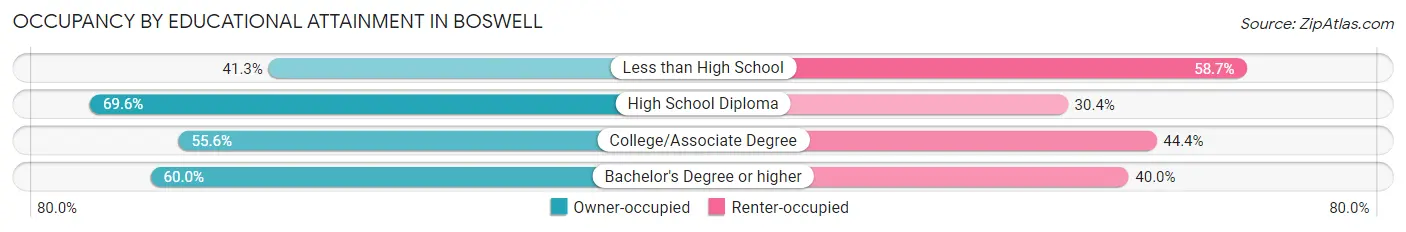
| Household Size | Owner-occupied | Renter-occupied |
| Less than High School | 19 (41.3%) | 27 (58.7%) |
| High School Diploma | 94 (69.6%) | 41 (30.4%) |
| College/Associate Degree | 50 (55.6%) | 40 (44.4%) |
| Bachelor's Degree or higher | 15 (60.0%) | 10 (40.0%) |
Occupancy by Age of Householder in Boswell
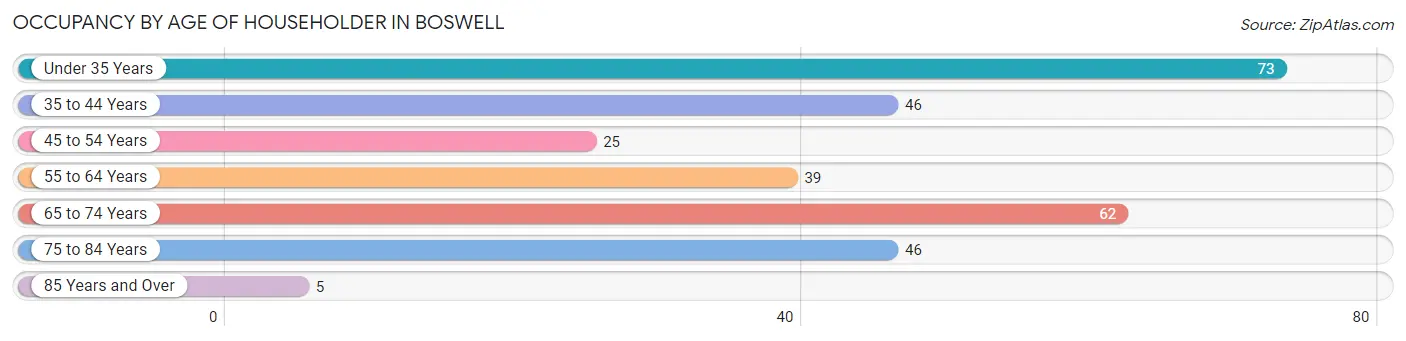
| Age Bracket | # Households | % Households |
| Under 35 Years | 73 | 24.7% |
| 35 to 44 Years | 46 | 15.5% |
| 45 to 54 Years | 25 | 8.5% |
| 55 to 64 Years | 39 | 13.2% |
| 65 to 74 Years | 62 | 20.9% |
| 75 to 84 Years | 46 | 15.5% |
| 85 Years and Over | 5 | 1.7% |
| Total | 296 | 100.0% |
Housing Finances in Boswell
Median Income by Occupancy in Boswell
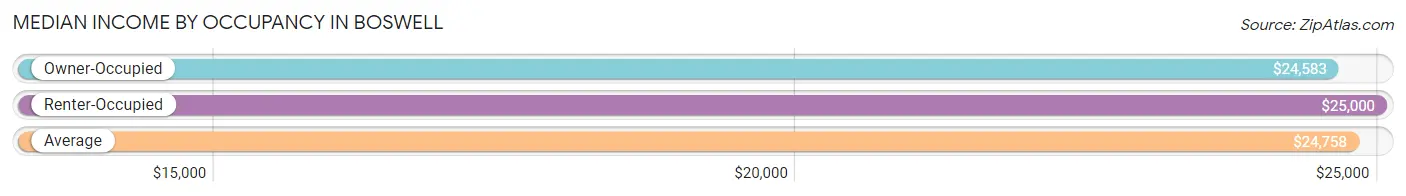
| Occupancy Type | # Households | Median Income |
| Owner-Occupied | 178 (60.1%) | $24,583 |
| Renter-Occupied | 118 (39.9%) | $25,000 |
| Average | 296 (100.0%) | $24,758 |
Occupancy by Householder Income Bracket in Boswell
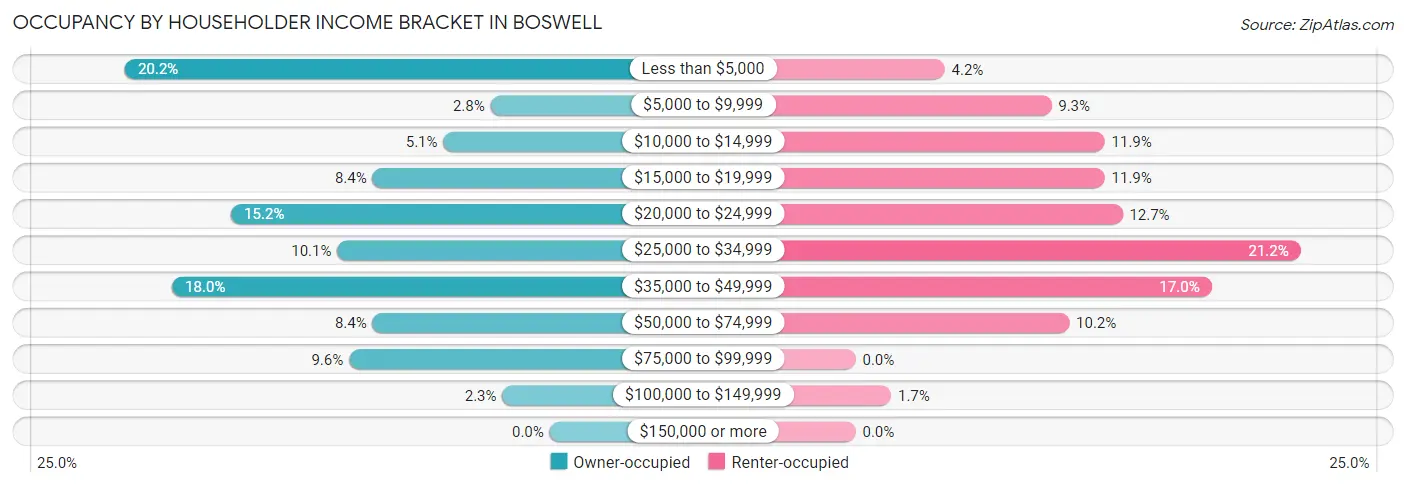
| Income Bracket | Owner-occupied | Renter-occupied |
| Less than $5,000 | 36 (20.2%) | 5 (4.2%) |
| $5,000 to $9,999 | 5 (2.8%) | 11 (9.3%) |
| $10,000 to $14,999 | 9 (5.1%) | 14 (11.9%) |
| $15,000 to $19,999 | 15 (8.4%) | 14 (11.9%) |
| $20,000 to $24,999 | 27 (15.2%) | 15 (12.7%) |
| $25,000 to $34,999 | 18 (10.1%) | 25 (21.2%) |
| $35,000 to $49,999 | 32 (18.0%) | 20 (17.0%) |
| $50,000 to $74,999 | 15 (8.4%) | 12 (10.2%) |
| $75,000 to $99,999 | 17 (9.6%) | 0 (0.0%) |
| $100,000 to $149,999 | 4 (2.2%) | 2 (1.7%) |
| $150,000 or more | 0 (0.0%) | 0 (0.0%) |
| Total | 178 (100.0%) | 118 (100.0%) |
Monthly Housing Cost Tiers in Boswell
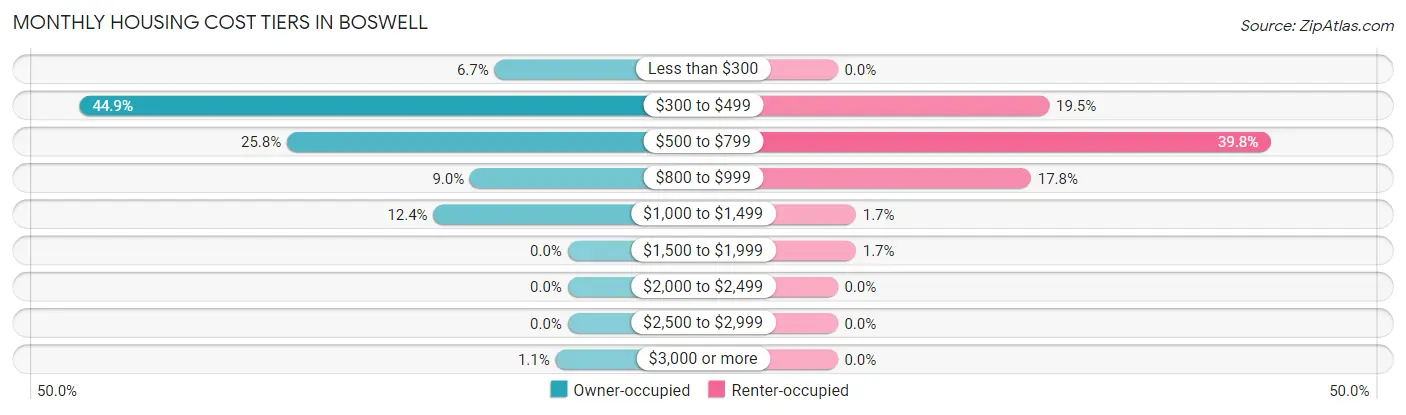
| Monthly Cost | Owner-occupied | Renter-occupied |
| Less than $300 | 12 (6.7%) | 0 (0.0%) |
| $300 to $499 | 80 (44.9%) | 23 (19.5%) |
| $500 to $799 | 46 (25.8%) | 47 (39.8%) |
| $800 to $999 | 16 (9.0%) | 21 (17.8%) |
| $1,000 to $1,499 | 22 (12.4%) | 2 (1.7%) |
| $1,500 to $1,999 | 0 (0.0%) | 2 (1.7%) |
| $2,000 to $2,499 | 0 (0.0%) | 0 (0.0%) |
| $2,500 to $2,999 | 0 (0.0%) | 0 (0.0%) |
| $3,000 or more | 2 (1.1%) | 0 (0.0%) |
| Total | 178 (100.0%) | 118 (100.0%) |
Physical Housing Characteristics in Boswell
Housing Structures in Boswell
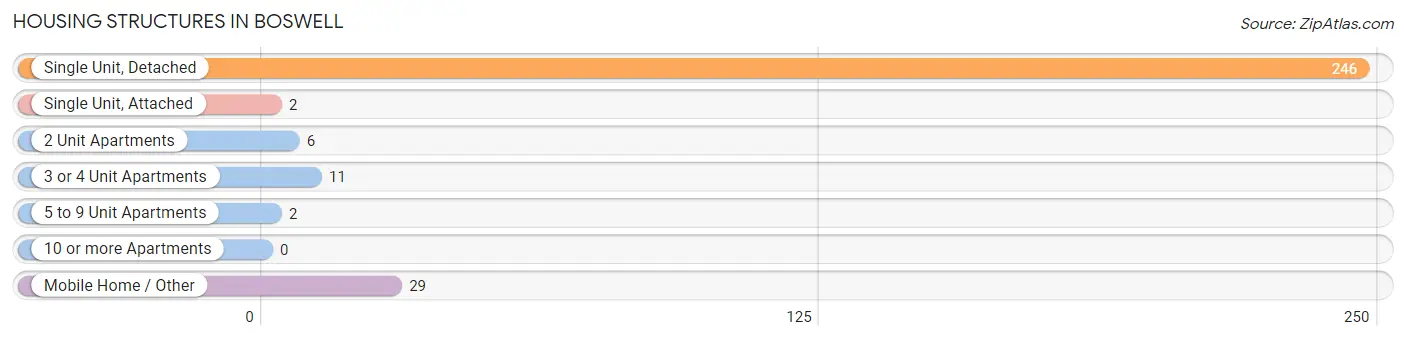
| Structure Type | # Housing Units | % Housing Units |
| Single Unit, Detached | 246 | 83.1% |
| Single Unit, Attached | 2 | 0.7% |
| 2 Unit Apartments | 6 | 2.0% |
| 3 or 4 Unit Apartments | 11 | 3.7% |
| 5 to 9 Unit Apartments | 2 | 0.7% |
| 10 or more Apartments | 0 | 0.0% |
| Mobile Home / Other | 29 | 9.8% |
| Total | 296 | 100.0% |
Housing Structures by Occupancy in Boswell
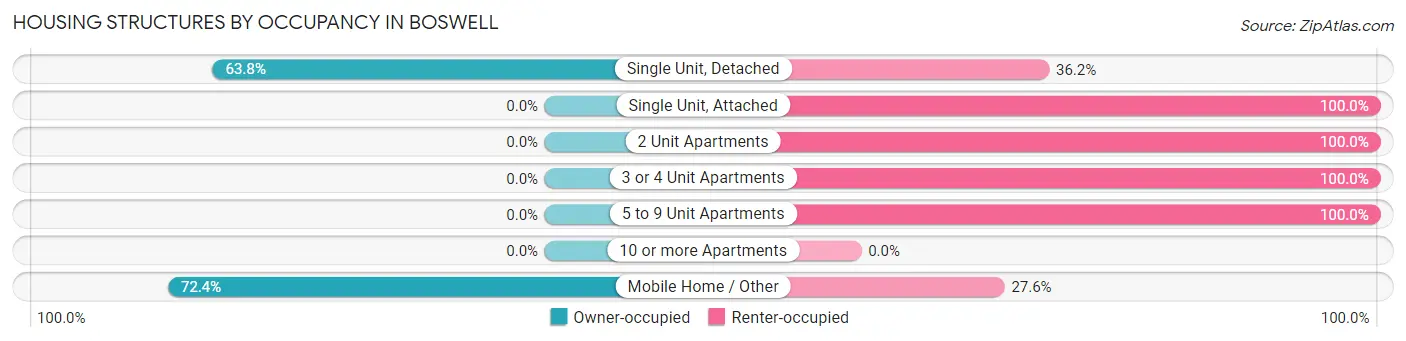
| Structure Type | Owner-occupied | Renter-occupied |
| Single Unit, Detached | 157 (63.8%) | 89 (36.2%) |
| Single Unit, Attached | 0 (0.0%) | 2 (100.0%) |
| 2 Unit Apartments | 0 (0.0%) | 6 (100.0%) |
| 3 or 4 Unit Apartments | 0 (0.0%) | 11 (100.0%) |
| 5 to 9 Unit Apartments | 0 (0.0%) | 2 (100.0%) |
| 10 or more Apartments | 0 (0.0%) | 0 (0.0%) |
| Mobile Home / Other | 21 (72.4%) | 8 (27.6%) |
| Total | 178 (60.1%) | 118 (39.9%) |
Housing Structures by Number of Rooms in Boswell
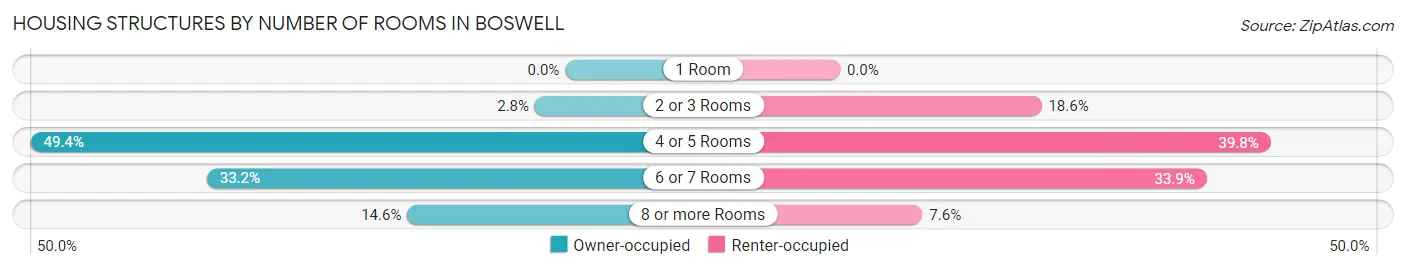
| Number of Rooms | Owner-occupied | Renter-occupied |
| 1 Room | 0 (0.0%) | 0 (0.0%) |
| 2 or 3 Rooms | 5 (2.8%) | 22 (18.6%) |
| 4 or 5 Rooms | 88 (49.4%) | 47 (39.8%) |
| 6 or 7 Rooms | 59 (33.2%) | 40 (33.9%) |
| 8 or more Rooms | 26 (14.6%) | 9 (7.6%) |
| Total | 178 (100.0%) | 118 (100.0%) |
Housing Structure by Heating Type in Boswell
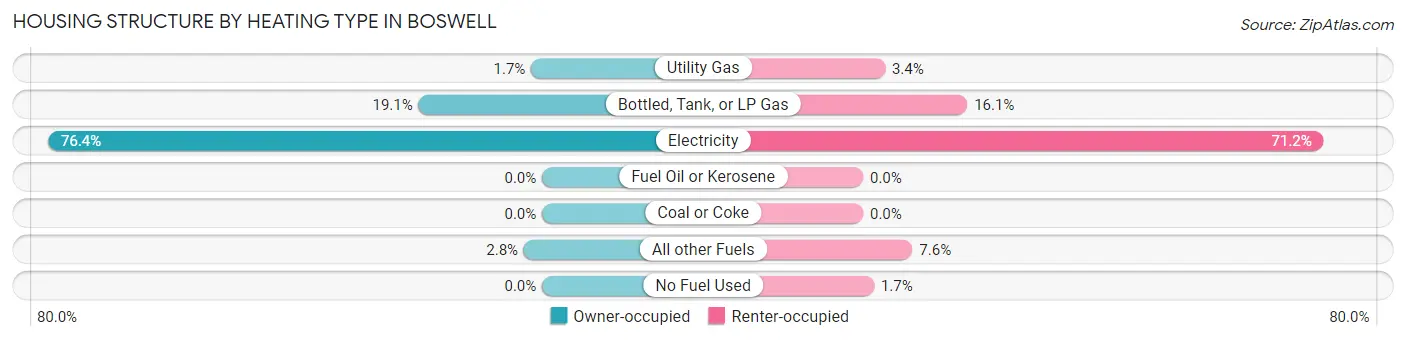
| Heating Type | Owner-occupied | Renter-occupied |
| Utility Gas | 3 (1.7%) | 4 (3.4%) |
| Bottled, Tank, or LP Gas | 34 (19.1%) | 19 (16.1%) |
| Electricity | 136 (76.4%) | 84 (71.2%) |
| Fuel Oil or Kerosene | 0 (0.0%) | 0 (0.0%) |
| Coal or Coke | 0 (0.0%) | 0 (0.0%) |
| All other Fuels | 5 (2.8%) | 9 (7.6%) |
| No Fuel Used | 0 (0.0%) | 2 (1.7%) |
| Total | 178 (100.0%) | 118 (100.0%) |
Household Vehicle Usage in Boswell
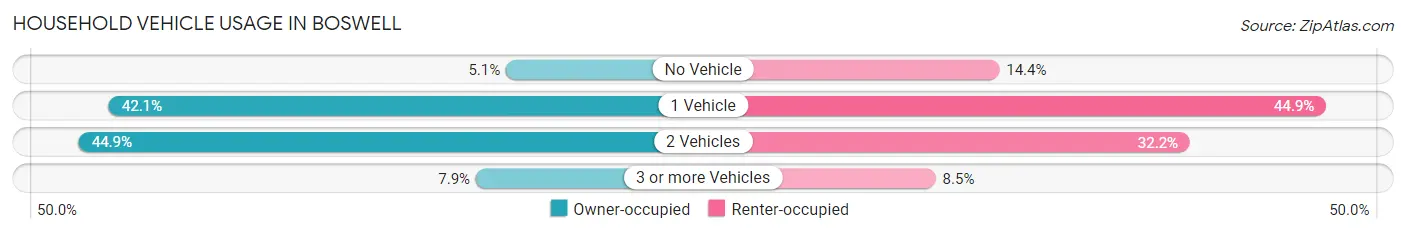
| Vehicles per Household | Owner-occupied | Renter-occupied |
| No Vehicle | 9 (5.1%) | 17 (14.4%) |
| 1 Vehicle | 75 (42.1%) | 53 (44.9%) |
| 2 Vehicles | 80 (44.9%) | 38 (32.2%) |
| 3 or more Vehicles | 14 (7.9%) | 10 (8.5%) |
| Total | 178 (100.0%) | 118 (100.0%) |
Real Estate & Mortgages in Boswell
Real Estate and Mortgage Overview in Boswell
| Characteristic | Without Mortgage | With Mortgage |
| Housing Units | 104 | 74 |
| Median Property Value | $73,100 | $68,300 |
| Median Household Income | $21,111 | $0 |
| Monthly Housing Costs | $349 | $2 |
| Real Estate Taxes | $261 | $16 |
Property Value by Mortgage Status in Boswell
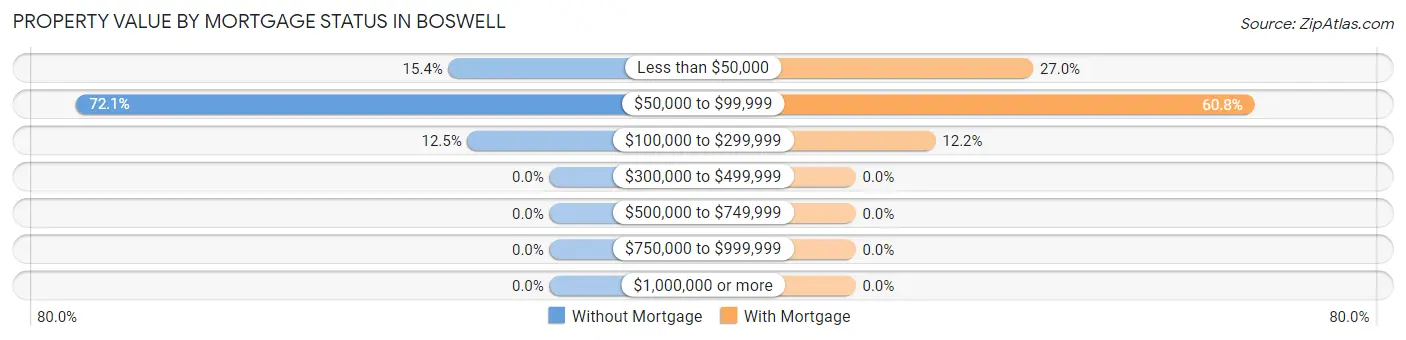
| Property Value | Without Mortgage | With Mortgage |
| Less than $50,000 | 16 (15.4%) | 20 (27.0%) |
| $50,000 to $99,999 | 75 (72.1%) | 45 (60.8%) |
| $100,000 to $299,999 | 13 (12.5%) | 9 (12.2%) |
| $300,000 to $499,999 | 0 (0.0%) | 0 (0.0%) |
| $500,000 to $749,999 | 0 (0.0%) | 0 (0.0%) |
| $750,000 to $999,999 | 0 (0.0%) | 0 (0.0%) |
| $1,000,000 or more | 0 (0.0%) | 0 (0.0%) |
| Total | 104 (100.0%) | 74 (100.0%) |
Household Income by Mortgage Status in Boswell
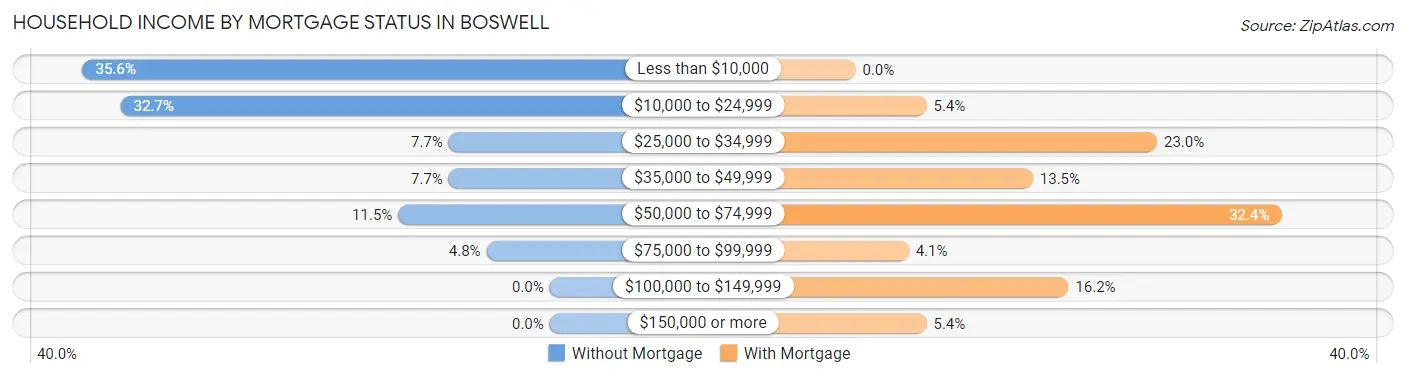
| Household Income | Without Mortgage | With Mortgage |
| Less than $10,000 | 37 (35.6%) | 0 (0.0%) |
| $10,000 to $24,999 | 34 (32.7%) | 4 (5.4%) |
| $25,000 to $34,999 | 8 (7.7%) | 17 (23.0%) |
| $35,000 to $49,999 | 8 (7.7%) | 10 (13.5%) |
| $50,000 to $74,999 | 12 (11.5%) | 24 (32.4%) |
| $75,000 to $99,999 | 5 (4.8%) | 3 (4.1%) |
| $100,000 to $149,999 | 0 (0.0%) | 12 (16.2%) |
| $150,000 or more | 0 (0.0%) | 4 (5.4%) |
| Total | 104 (100.0%) | 74 (100.0%) |
Property Value to Household Income Ratio in Boswell
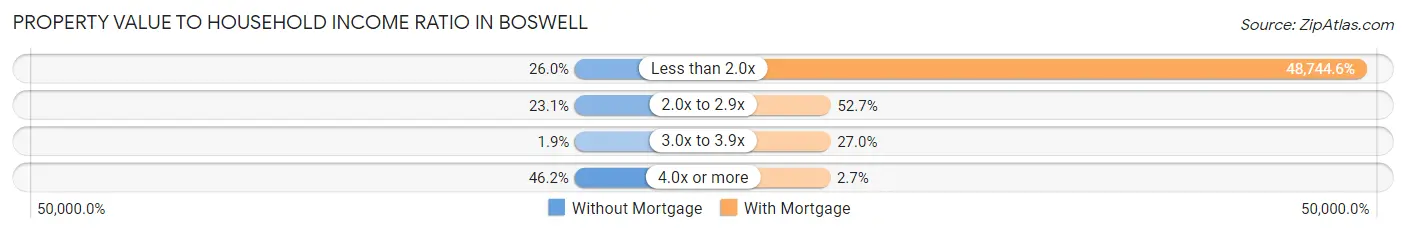
| Value-to-Income Ratio | Without Mortgage | With Mortgage |
| Less than 2.0x | 27 (26.0%) | 36,071 (48,744.6%) |
| 2.0x to 2.9x | 24 (23.1%) | 39 (52.7%) |
| 3.0x to 3.9x | 2 (1.9%) | 20 (27.0%) |
| 4.0x or more | 48 (46.2%) | 2 (2.7%) |
| Total | 104 (100.0%) | 74 (100.0%) |
Real Estate Taxes by Mortgage Status in Boswell
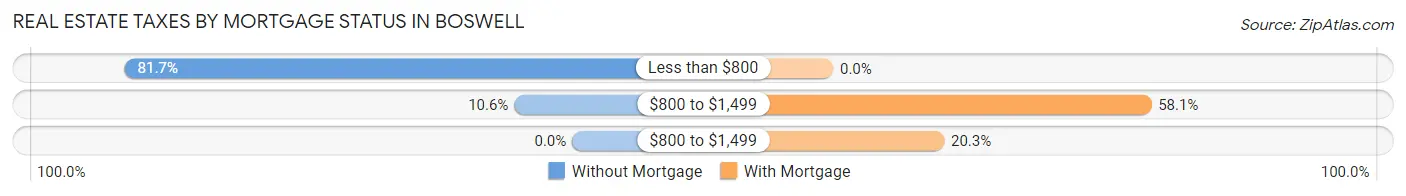
| Property Taxes | Without Mortgage | With Mortgage |
| Less than $800 | 85 (81.7%) | 0 (0.0%) |
| $800 to $1,499 | 11 (10.6%) | 43 (58.1%) |
| $800 to $1,499 | 0 (0.0%) | 15 (20.3%) |
| Total | 104 (100.0%) | 74 (100.0%) |
Health & Disability in Boswell
Health Insurance Coverage by Age in Boswell
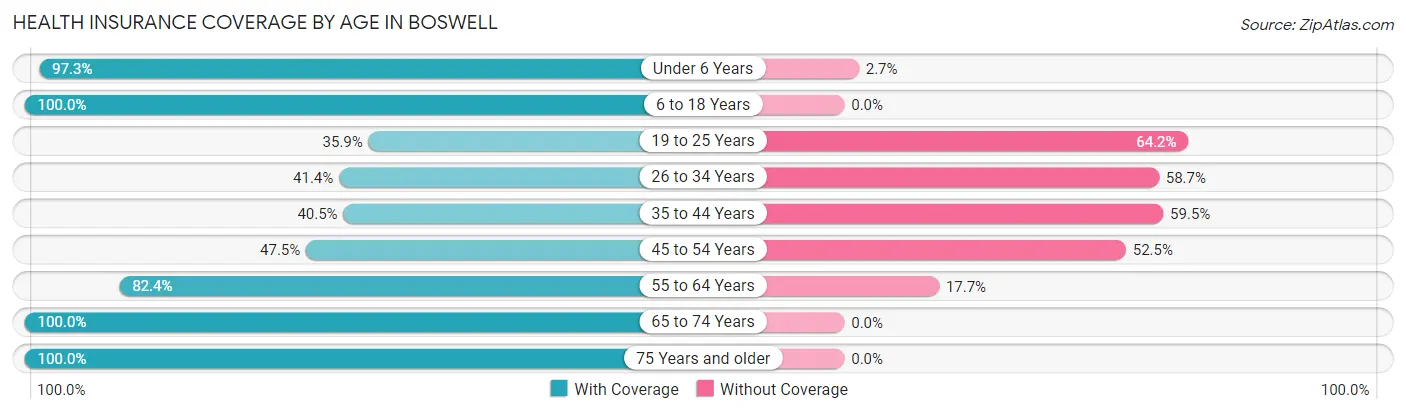
| Age Bracket | With Coverage | Without Coverage |
| Under 6 Years | 108 (97.3%) | 3 (2.7%) |
| 6 to 18 Years | 163 (100.0%) | 0 (0.0%) |
| 19 to 25 Years | 19 (35.8%) | 34 (64.1%) |
| 26 to 34 Years | 43 (41.3%) | 61 (58.7%) |
| 35 to 44 Years | 30 (40.5%) | 44 (59.5%) |
| 45 to 54 Years | 19 (47.5%) | 21 (52.5%) |
| 55 to 64 Years | 56 (82.4%) | 12 (17.6%) |
| 65 to 74 Years | 94 (100.0%) | 0 (0.0%) |
| 75 Years and older | 60 (100.0%) | 0 (0.0%) |
| Total | 592 (77.2%) | 175 (22.8%) |
Health Insurance Coverage by Citizenship Status in Boswell
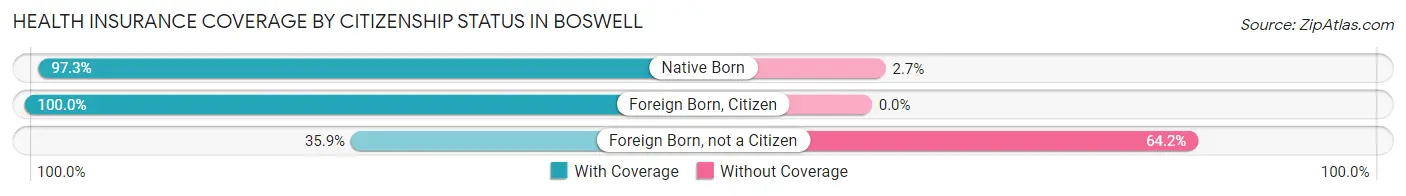
| Citizenship Status | With Coverage | Without Coverage |
| Native Born | 108 (97.3%) | 3 (2.7%) |
| Foreign Born, Citizen | 163 (100.0%) | 0 (0.0%) |
| Foreign Born, not a Citizen | 19 (35.8%) | 34 (64.1%) |
Health Insurance Coverage by Household Income in Boswell
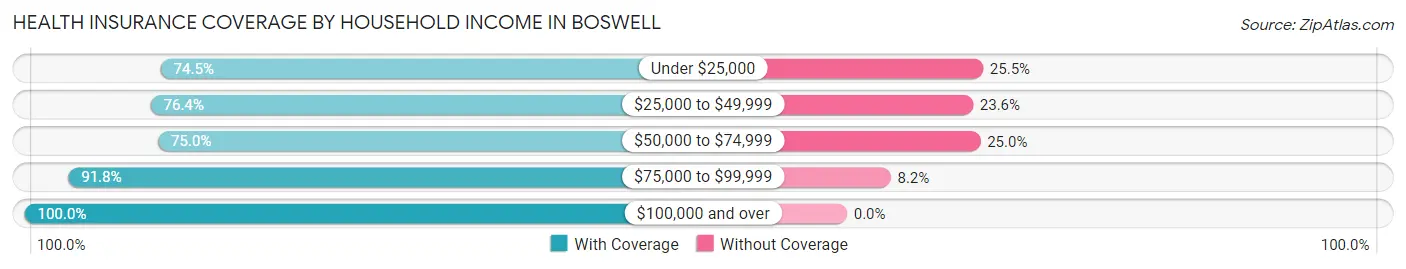
| Household Income | With Coverage | Without Coverage |
| Under $25,000 | 222 (74.5%) | 76 (25.5%) |
| $25,000 to $49,999 | 236 (76.4%) | 73 (23.6%) |
| $50,000 to $74,999 | 63 (75.0%) | 21 (25.0%) |
| $75,000 to $99,999 | 56 (91.8%) | 5 (8.2%) |
| $100,000 and over | 15 (100.0%) | 0 (0.0%) |
Public vs Private Health Insurance Coverage by Age in Boswell
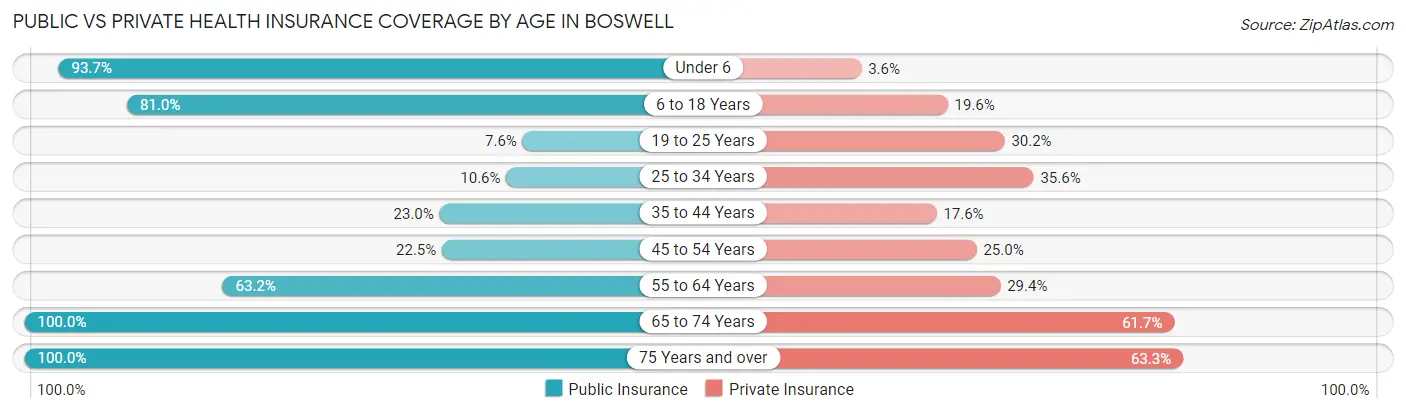
| Age Bracket | Public Insurance | Private Insurance |
| Under 6 | 104 (93.7%) | 4 (3.6%) |
| 6 to 18 Years | 132 (81.0%) | 32 (19.6%) |
| 19 to 25 Years | 4 (7.5%) | 16 (30.2%) |
| 25 to 34 Years | 11 (10.6%) | 37 (35.6%) |
| 35 to 44 Years | 17 (23.0%) | 13 (17.6%) |
| 45 to 54 Years | 9 (22.5%) | 10 (25.0%) |
| 55 to 64 Years | 43 (63.2%) | 20 (29.4%) |
| 65 to 74 Years | 94 (100.0%) | 58 (61.7%) |
| 75 Years and over | 60 (100.0%) | 38 (63.3%) |
| Total | 474 (61.8%) | 228 (29.7%) |
Disability Status by Sex by Age in Boswell
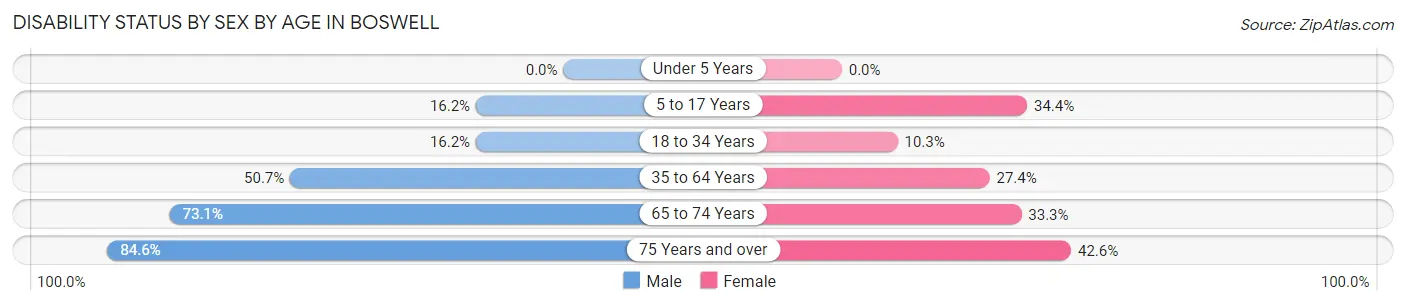
| Age Bracket | Male | Female |
| Under 5 Years | 0 (0.0%) | 0 (0.0%) |
| 5 to 17 Years | 12 (16.2%) | 22 (34.4%) |
| 18 to 34 Years | 12 (16.2%) | 12 (10.3%) |
| 35 to 64 Years | 35 (50.7%) | 31 (27.4%) |
| 65 to 74 Years | 38 (73.1%) | 14 (33.3%) |
| 75 Years and over | 11 (84.6%) | 20 (42.5%) |
Disability Class by Sex by Age in Boswell
Disability Class: Hearing Difficulty
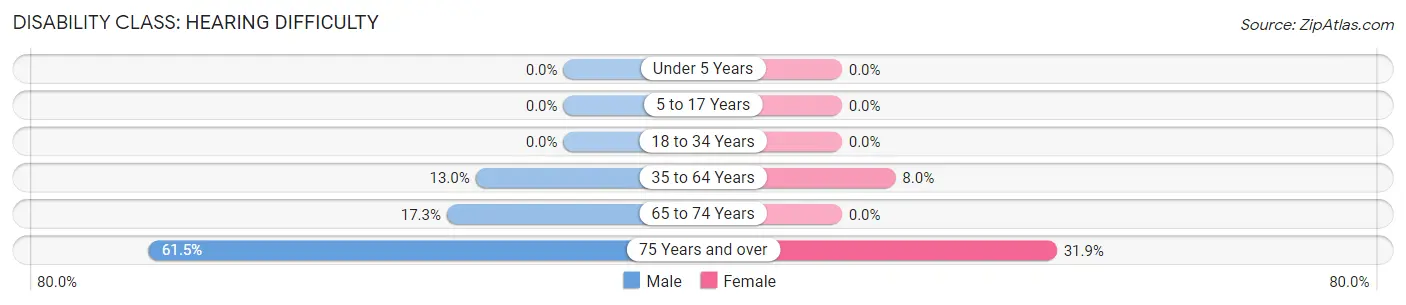
| Age Bracket | Male | Female |
| Under 5 Years | 0 (0.0%) | 0 (0.0%) |
| 5 to 17 Years | 0 (0.0%) | 0 (0.0%) |
| 18 to 34 Years | 0 (0.0%) | 0 (0.0%) |
| 35 to 64 Years | 9 (13.0%) | 9 (8.0%) |
| 65 to 74 Years | 9 (17.3%) | 0 (0.0%) |
| 75 Years and over | 8 (61.5%) | 15 (31.9%) |
Disability Class: Vision Difficulty
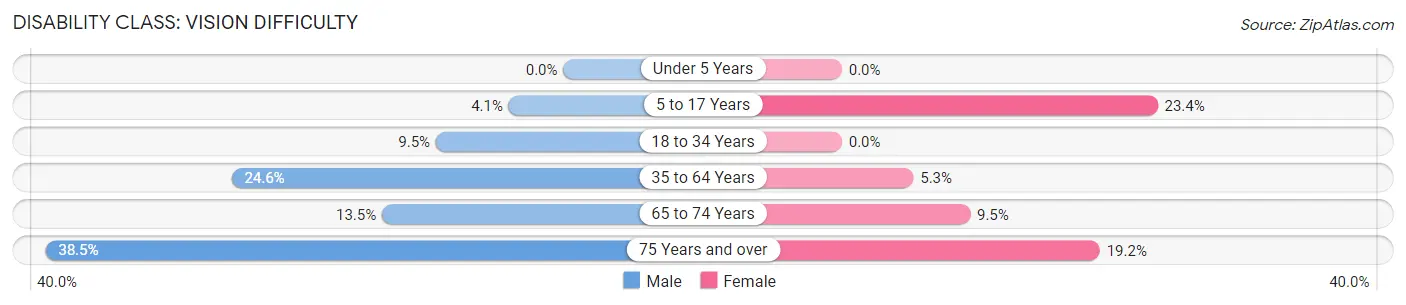
| Age Bracket | Male | Female |
| Under 5 Years | 0 (0.0%) | 0 (0.0%) |
| 5 to 17 Years | 3 (4.1%) | 15 (23.4%) |
| 18 to 34 Years | 7 (9.5%) | 0 (0.0%) |
| 35 to 64 Years | 17 (24.6%) | 6 (5.3%) |
| 65 to 74 Years | 7 (13.5%) | 4 (9.5%) |
| 75 Years and over | 5 (38.5%) | 9 (19.2%) |
Disability Class: Cognitive Difficulty
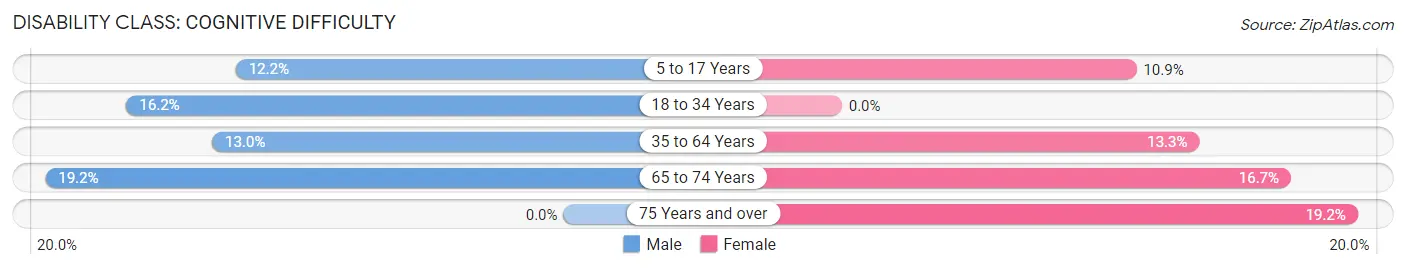
| Age Bracket | Male | Female |
| 5 to 17 Years | 9 (12.2%) | 7 (10.9%) |
| 18 to 34 Years | 12 (16.2%) | 0 (0.0%) |
| 35 to 64 Years | 9 (13.0%) | 15 (13.3%) |
| 65 to 74 Years | 10 (19.2%) | 7 (16.7%) |
| 75 Years and over | 0 (0.0%) | 9 (19.2%) |
Disability Class: Ambulatory Difficulty
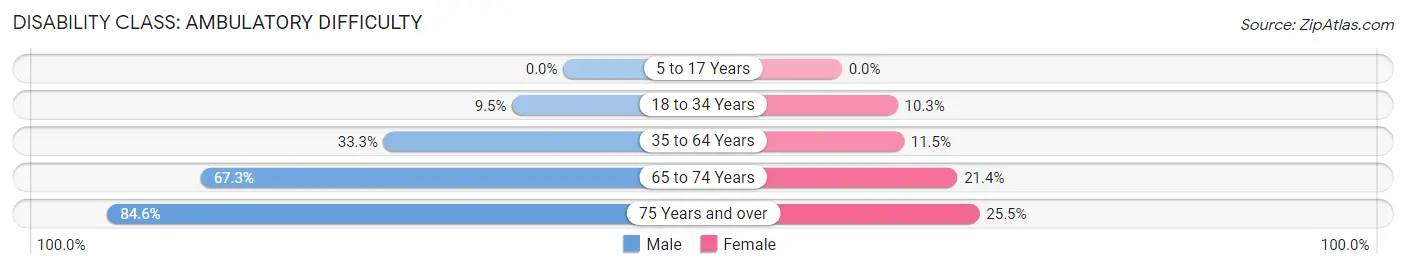
| Age Bracket | Male | Female |
| 5 to 17 Years | 0 (0.0%) | 0 (0.0%) |
| 18 to 34 Years | 7 (9.5%) | 12 (10.3%) |
| 35 to 64 Years | 23 (33.3%) | 13 (11.5%) |
| 65 to 74 Years | 35 (67.3%) | 9 (21.4%) |
| 75 Years and over | 11 (84.6%) | 12 (25.5%) |
Disability Class: Self-Care Difficulty
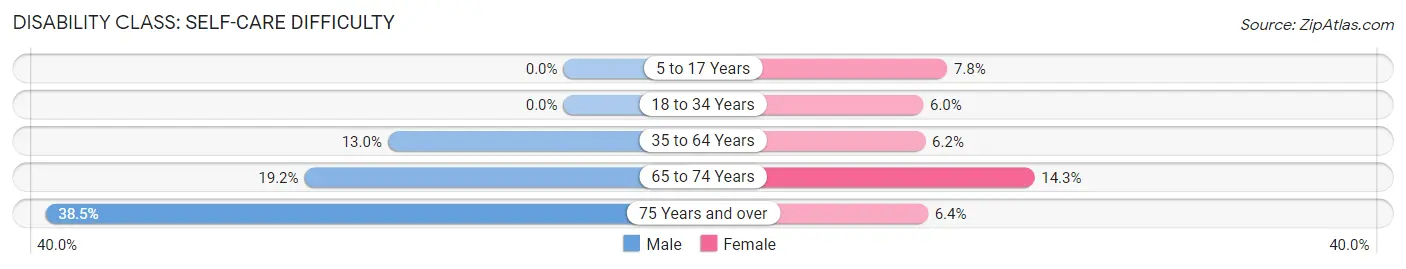
| Age Bracket | Male | Female |
| 5 to 17 Years | 0 (0.0%) | 5 (7.8%) |
| 18 to 34 Years | 0 (0.0%) | 7 (6.0%) |
| 35 to 64 Years | 9 (13.0%) | 7 (6.2%) |
| 65 to 74 Years | 10 (19.2%) | 6 (14.3%) |
| 75 Years and over | 5 (38.5%) | 3 (6.4%) |
Technology Access in Boswell
Computing Device Access in Boswell
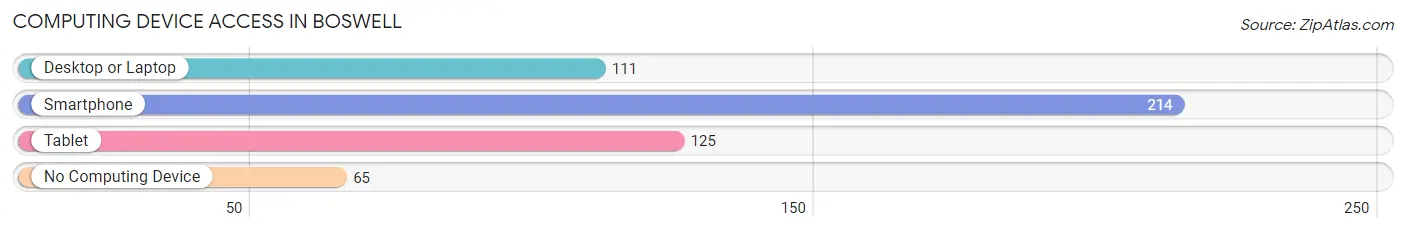
| Device Type | # Households | % Households |
| Desktop or Laptop | 111 | 37.5% |
| Smartphone | 214 | 72.3% |
| Tablet | 125 | 42.2% |
| No Computing Device | 65 | 22.0% |
| Total | 296 | 100.0% |
Internet Access in Boswell
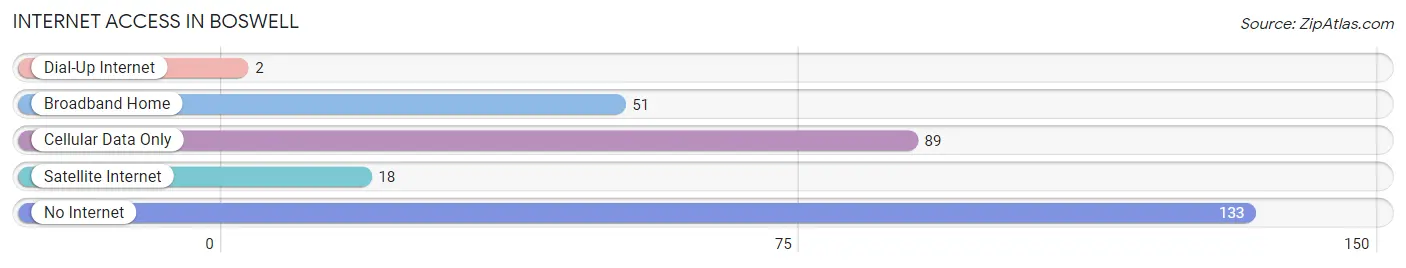
| Internet Type | # Households | % Households |
| Dial-Up Internet | 2 | 0.7% |
| Broadband Home | 51 | 17.2% |
| Cellular Data Only | 89 | 30.1% |
| Satellite Internet | 18 | 6.1% |
| No Internet | 133 | 44.9% |
| Total | 296 | 100.0% |
Boswell Summary
Boswell is a small town located in Choctaw County, Oklahoma. It is situated in the southeastern part of the state, about 20 miles east of Hugo. The town was founded in 1894 and named after a local rancher, William Boswell. The population of Boswell was estimated to be 545 in 2019.
History
Boswell was founded in 1894 by William Boswell, a local rancher. The town was originally known as Boswell's Switch, named after the railroad switch that was built nearby. The town was officially incorporated in 1901.
In the early 1900s, Boswell was a thriving agricultural community. Cotton, corn, and hay were the main crops grown in the area. The town also had a number of businesses, including a general store, a blacksmith shop, and a hotel.
In the 1920s, the town began to decline as the railroad switch was moved to nearby Hugo. The Great Depression further hurt the town's economy, and many of the businesses closed.
In the 1940s, the town began to recover as the oil industry began to boom in the area. The town was home to several oil wells, and the population began to grow.
Geography
Boswell is located in southeastern Oklahoma, about 20 miles east of Hugo. The town is situated in a rural area, surrounded by farmland and rolling hills. The nearest major city is Durant, which is about 40 miles away.
The climate in Boswell is humid subtropical, with hot summers and mild winters. The average annual temperature is around 65°F, and the average annual precipitation is around 40 inches.
Economy
The economy of Boswell is largely based on agriculture and oil production. The town is home to several oil wells, and the surrounding area is used for farming. The main crops grown in the area are cotton, corn, and hay.
The town also has a few small businesses, including a general store, a gas station, and a few restaurants.
Demographics
The population of Boswell was estimated to be 545 in 2019. The town is predominantly white, with about 90% of the population being white. The remaining 10% of the population is made up of African Americans, Native Americans, and other races.
The median household income in Boswell is around $35,000, and the median home value is around $90,000. The town has a poverty rate of about 20%, which is higher than the national average.
Conclusion
Boswell is a small town located in Choctaw County, Oklahoma. It was founded in 1894 and has a population of around 545. The town's economy is largely based on agriculture and oil production, and the main crops grown in the area are cotton, corn, and hay. The town is predominantly white, with a median household income of around $35,000 and a median home value of around $90,000. The poverty rate in Boswell is higher than the national average.
Common Questions
What is Per Capita Income in Boswell?
Per Capita income in Boswell is $12,997.
What is the Median Family Income in Boswell?
Median Family Income in Boswell is $24,600.
What is the Median Household income in Boswell?
Median Household Income in Boswell is $24,758.
What is Income or Wage Gap in Boswell?
Income or Wage Gap in Boswell is 46.0%.
Women in Boswell earn 54.0 cents for every dollar earned by a man.
What is Inequality or Gini Index in Boswell?
Inequality or Gini Index in Boswell is 0.42.
What is the Total Population of Boswell?
Total Population of Boswell is 767.
What is the Total Male Population of Boswell?
Total Male Population of Boswell is 338.
What is the Total Female Population of Boswell?
Total Female Population of Boswell is 429.
What is the Ratio of Males per 100 Females in Boswell?
There are 78.79 Males per 100 Females in Boswell.
What is the Ratio of Females per 100 Males in Boswell?
There are 126.92 Females per 100 Males in Boswell.
What is the Median Population Age in Boswell?
Median Population Age in Boswell is 31.5 Years.
What is the Average Family Size in Boswell
Average Family Size in Boswell is 3.4 People.
What is the Average Household Size in Boswell
Average Household Size in Boswell is 2.6 People.
How Large is the Labor Force in Boswell?
There are 233 People in the Labor Forcein in Boswell.
What is the Percentage of People in the Labor Force in Boswell?
43.5% of People are in the Labor Force in Boswell.
What is the Unemployment Rate in Boswell?
Unemployment Rate in Boswell is 7.7%.