Blackwell, OK Map & Demographics
Blackwell Map
Blackwell Overview
$24,163
PER CAPITA INCOME
$48,203
AVG FAMILY INCOME
$47,333
AVG HOUSEHOLD INCOME
42.9%
WAGE / INCOME GAP [ % ]
57.1¢/ $1
WAGE / INCOME GAP [ $ ]
0.42
INEQUALITY / GINI INDEX
6,132
TOTAL POPULATION
3,198
MALE POPULATION
2,934
FEMALE POPULATION
109.00
MALES / 100 FEMALES
91.74
FEMALES / 100 MALES
37.2
MEDIAN AGE
3.4
AVG FAMILY SIZE
2.6
AVG HOUSEHOLD SIZE
2,766
LABOR FORCE [ PEOPLE ]
59.4%
PERCENT IN LABOR FORCE
6.6%
UNEMPLOYMENT RATE
Blackwell Zip Codes
Blackwell Area Codes
Income in Blackwell
Income Overview in Blackwell
Per Capita Income in Blackwell is $24,163, while median incomes of families and households are $48,203 and $47,333 respectively.
| Characteristic | Number | Measure |
| Per Capita Income | 6,132 | $24,163 |
| Median Family Income | 1,412 | $48,203 |
| Mean Family Income | 1,412 | $69,555 |
| Median Household Income | 2,296 | $47,333 |
| Mean Household Income | 2,296 | $60,706 |
| Income Deficit | 1,412 | $0 |
| Wage / Income Gap (%) | 6,132 | 42.85% |
| Wage / Income Gap ($) | 6,132 | 57.15¢ per $1 |
| Gini / Inequality Index | 6,132 | 0.42 |
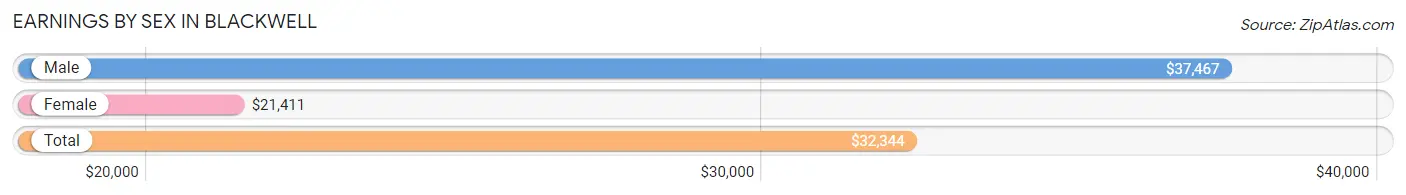
Earnings by Sex in Blackwell
Average Earnings in Blackwell are $32,344, $37,467 for men and $21,411 for women, a difference of 42.8%.
| Sex | Number | Average Earnings |
| Male | 1,571 (55.7%) | $37,467 |
| Female | 1,249 (44.3%) | $21,411 |
| Total | 2,820 (100.0%) | $32,344 |
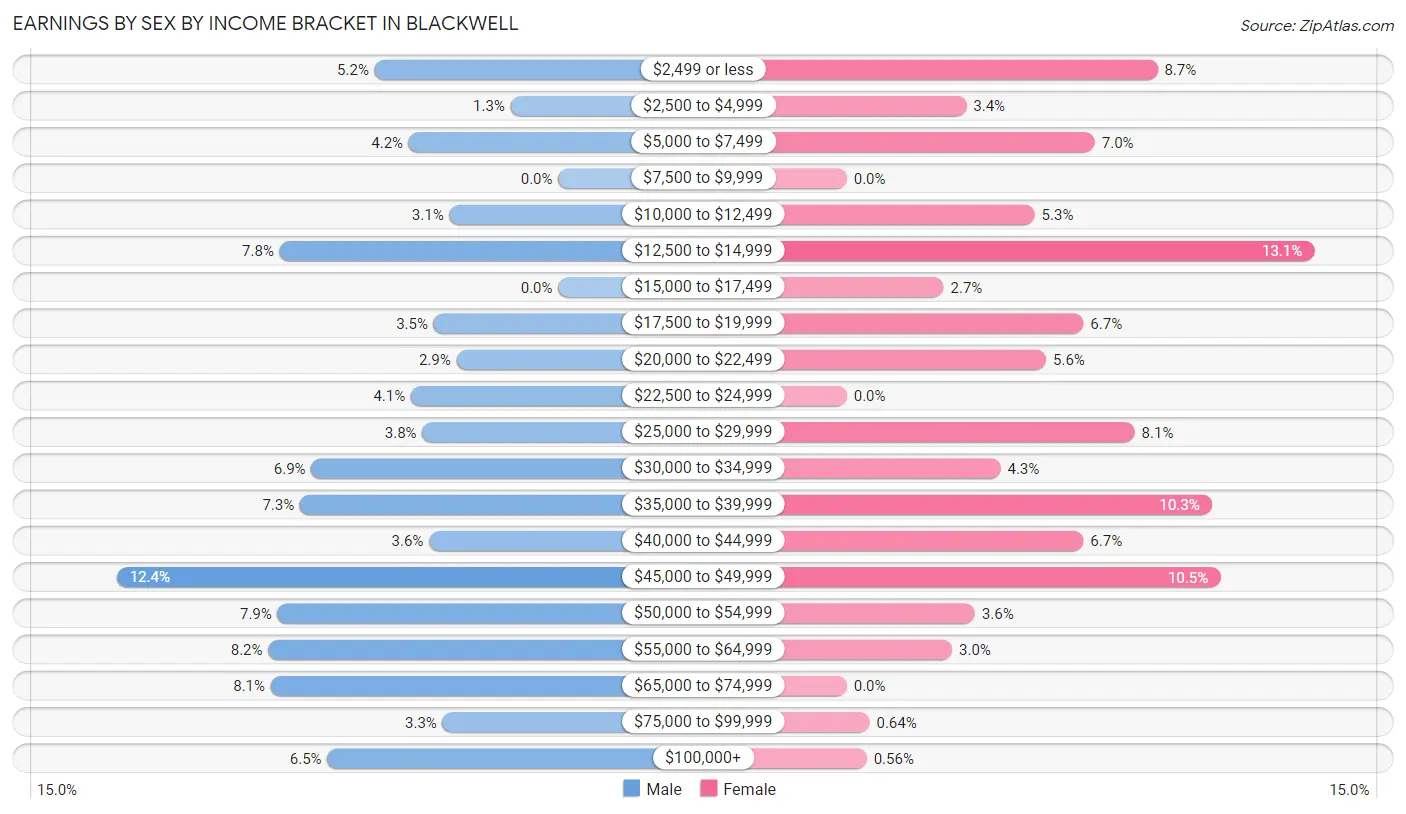
Earnings by Sex by Income Bracket in Blackwell
The most common earnings brackets in Blackwell are $45,000 to $49,999 for men (195 | 12.4%) and $12,500 to $14,999 for women (164 | 13.1%).
| Income | Male | Female |
| $2,499 or less | 81 (5.2%) | 109 (8.7%) |
| $2,500 to $4,999 | 21 (1.3%) | 42 (3.4%) |
| $5,000 to $7,499 | 66 (4.2%) | 87 (7.0%) |
| $7,500 to $9,999 | 0 (0.0%) | 0 (0.0%) |
| $10,000 to $12,499 | 48 (3.1%) | 66 (5.3%) |
| $12,500 to $14,999 | 123 (7.8%) | 164 (13.1%) |
| $15,000 to $17,499 | 0 (0.0%) | 34 (2.7%) |
| $17,500 to $19,999 | 55 (3.5%) | 83 (6.7%) |
| $20,000 to $22,499 | 45 (2.9%) | 70 (5.6%) |
| $22,500 to $24,999 | 65 (4.1%) | 0 (0.0%) |
| $25,000 to $29,999 | 60 (3.8%) | 101 (8.1%) |
| $30,000 to $34,999 | 109 (6.9%) | 54 (4.3%) |
| $35,000 to $39,999 | 114 (7.3%) | 128 (10.2%) |
| $40,000 to $44,999 | 57 (3.6%) | 83 (6.7%) |
| $45,000 to $49,999 | 195 (12.4%) | 131 (10.5%) |
| $50,000 to $54,999 | 124 (7.9%) | 45 (3.6%) |
| $55,000 to $64,999 | 128 (8.2%) | 37 (3.0%) |
| $65,000 to $74,999 | 127 (8.1%) | 0 (0.0%) |
| $75,000 to $99,999 | 51 (3.3%) | 8 (0.6%) |
| $100,000+ | 102 (6.5%) | 7 (0.6%) |
| Total | 1,571 (100.0%) | 1,249 (100.0%) |
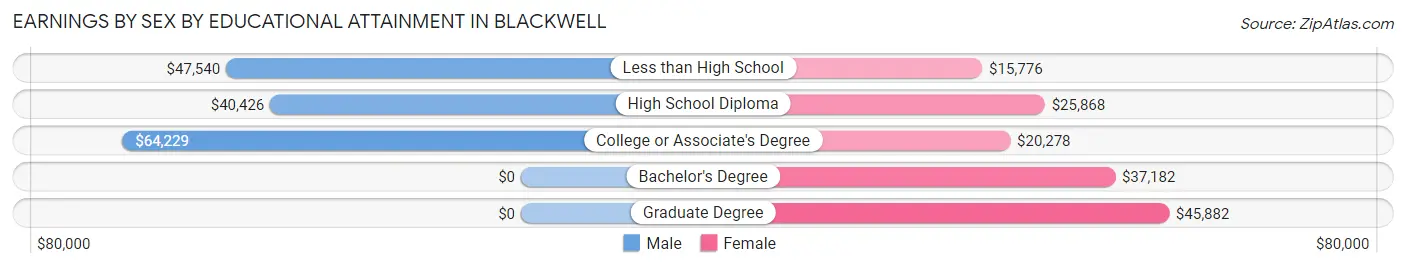
Earnings by Sex by Educational Attainment in Blackwell
Average earnings in Blackwell are $47,563 for men and $27,348 for women, a difference of 42.5%. Men with an educational attainment of college or associate's degree enjoy the highest average annual earnings of $64,229, while those with high school diploma education earn the least with $40,426. Women with an educational attainment of graduate degree earn the most with the average annual earnings of $45,882, while those with less than high school education have the smallest earnings of $15,776.
| Educational Attainment | Male Income | Female Income |
| Less than High School | $47,540 | $15,776 |
| High School Diploma | $40,426 | $25,868 |
| College or Associate's Degree | $64,229 | $20,278 |
| Bachelor's Degree | - | - |
| Graduate Degree | - | - |
| Total | $47,563 | $27,348 |
Family Income in Blackwell
Family Income Brackets in Blackwell
According to the Blackwell family income data, there are 297 families falling into the $35,000 to $49,999 income range, which is the most common income bracket and makes up 21.0% of all families. Conversely, the $150,000 to $199,999 income bracket is the least frequent group with only 35 families (2.5%) belonging to this category.
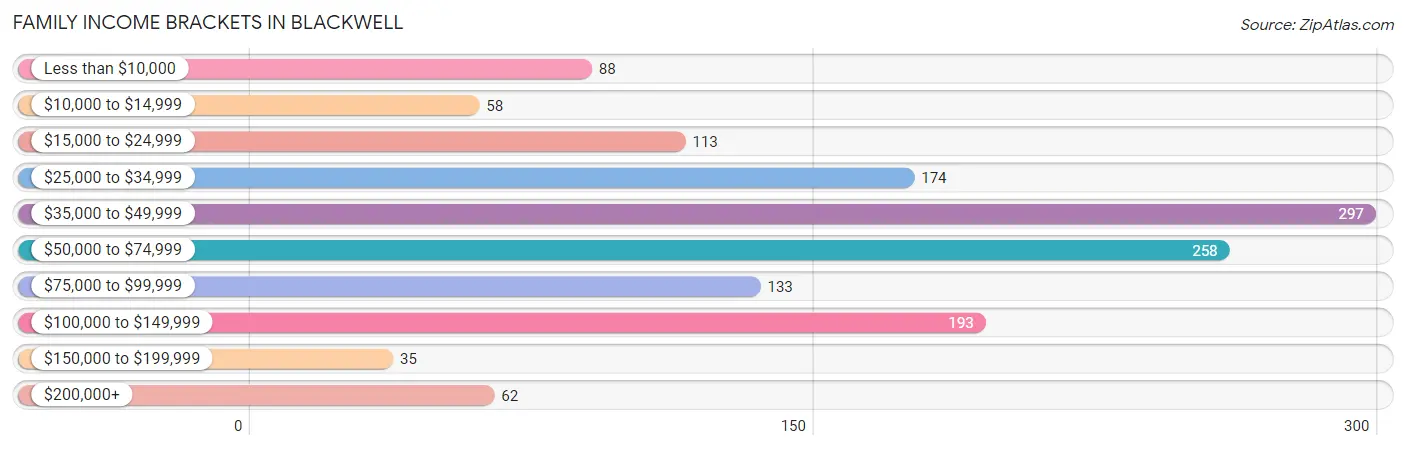
| Income Bracket | # Families | % Families |
| Less than $10,000 | 88 | 6.2% |
| $10,000 to $14,999 | 58 | 4.1% |
| $15,000 to $24,999 | 113 | 8.0% |
| $25,000 to $34,999 | 174 | 12.3% |
| $35,000 to $49,999 | 297 | 21.0% |
| $50,000 to $74,999 | 258 | 18.3% |
| $75,000 to $99,999 | 133 | 9.4% |
| $100,000 to $149,999 | 193 | 13.7% |
| $150,000 to $199,999 | 35 | 2.5% |
| $200,000+ | 62 | 4.4% |
Family Income by Famaliy Size in Blackwell
4-person families (305 | 21.6%) account for the highest median family income in Blackwell with $91,875 per family, while 4-person families (305 | 21.6%) have the highest median income of $22,969 per family member.
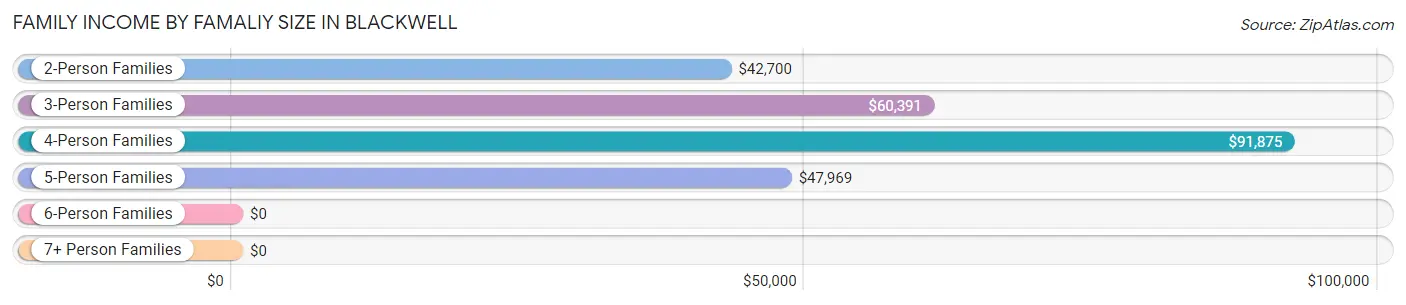
| Income Bracket | # Families | Median Income |
| 2-Person Families | 730 (51.7%) | $42,700 |
| 3-Person Families | 201 (14.2%) | $60,391 |
| 4-Person Families | 305 (21.6%) | $91,875 |
| 5-Person Families | 138 (9.8%) | $47,969 |
| 6-Person Families | 30 (2.1%) | $0 |
| 7+ Person Families | 8 (0.6%) | $0 |
| Total | 1,412 (100.0%) | $48,203 |
Family Income by Number of Earners in Blackwell
The median family income in Blackwell is $48,203, with families comprising 2 earners (312) having the highest median family income of $97,500, while families with 1 earner (715) have the lowest median family income of $39,196, accounting for 22.1% and 50.6% of families, respectively.
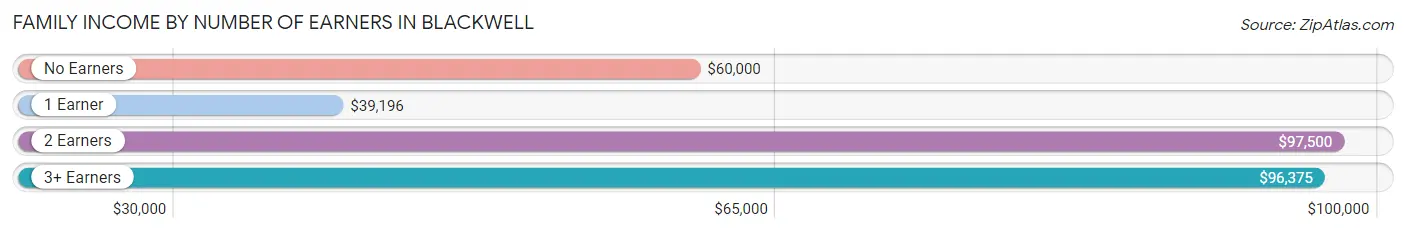
| Number of Earners | # Families | Median Income |
| No Earners | 226 (16.0%) | $60,000 |
| 1 Earner | 715 (50.6%) | $39,196 |
| 2 Earners | 312 (22.1%) | $97,500 |
| 3+ Earners | 159 (11.3%) | $96,375 |
| Total | 1,412 (100.0%) | $48,203 |
Household Income in Blackwell
Household Income Brackets in Blackwell
With 535 households falling in the category, the $50,000 to $74,999 income range is the most frequent in Blackwell, accounting for 23.3% of all households. In contrast, only 46 households (2.0%) fall into the $150,000 to $199,999 income bracket, making it the least populous group.
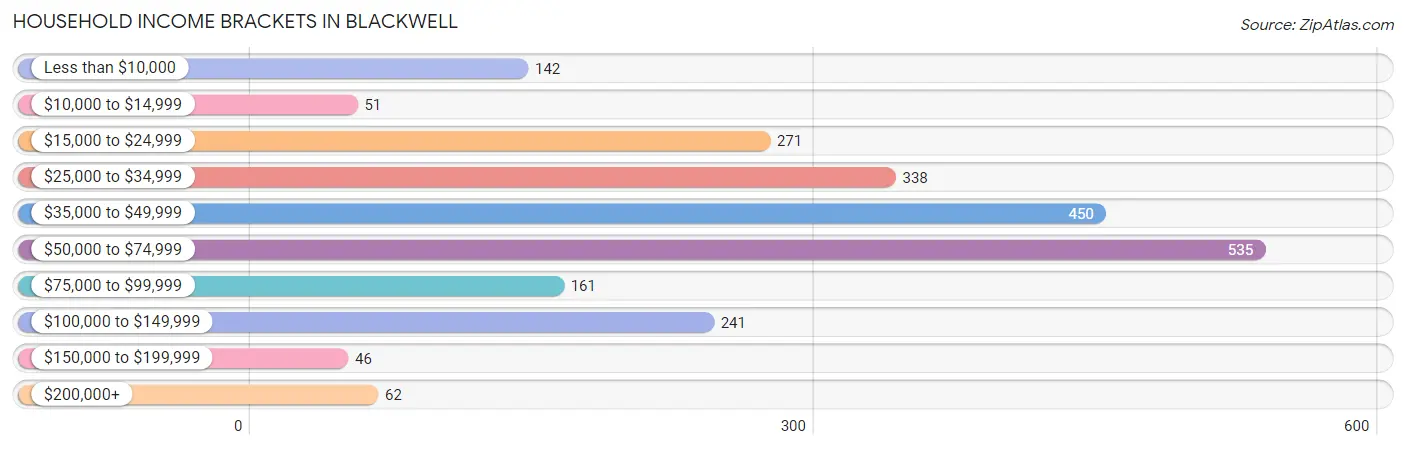
| Income Bracket | # Households | % Households |
| Less than $10,000 | 142 | 6.2% |
| $10,000 to $14,999 | 51 | 2.2% |
| $15,000 to $24,999 | 271 | 11.8% |
| $25,000 to $34,999 | 338 | 14.7% |
| $35,000 to $49,999 | 450 | 19.6% |
| $50,000 to $74,999 | 535 | 23.3% |
| $75,000 to $99,999 | 161 | 7.0% |
| $100,000 to $149,999 | 241 | 10.5% |
| $150,000 to $199,999 | 46 | 2.0% |
| $200,000+ | 62 | 2.7% |
Household Income by Householder Age in Blackwell
The median household income in Blackwell is $47,333, with the highest median household income of $49,234 found in the 45 to 64 years age bracket for the primary householder. A total of 789 households (34.4%) fall into this category. Meanwhile, the 15 to 24 years age bracket for the primary householder has the lowest median household income of $0, with 90 households (3.9%) in this group.
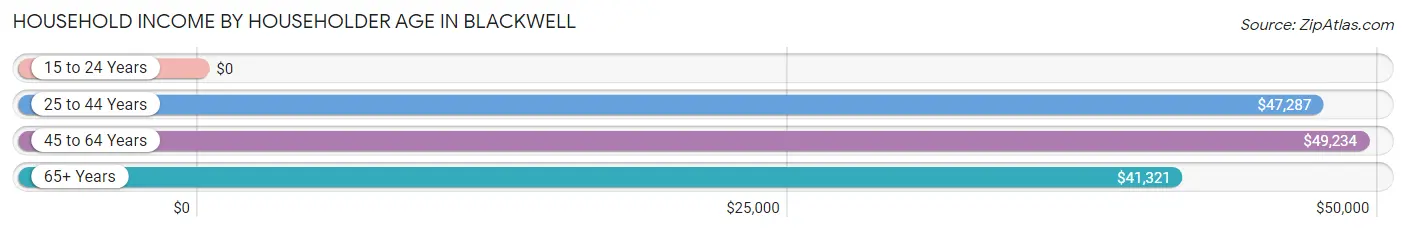
| Income Bracket | # Households | Median Income |
| 15 to 24 Years | 90 (3.9%) | $0 |
| 25 to 44 Years | 654 (28.5%) | $47,287 |
| 45 to 64 Years | 789 (34.4%) | $49,234 |
| 65+ Years | 763 (33.2%) | $41,321 |
| Total | 2,296 (100.0%) | $47,333 |
Poverty in Blackwell
Income Below Poverty by Sex and Age in Blackwell
With 17.5% poverty level for males and 19.3% for females among the residents of Blackwell, 16 and 17 year old males and 75 year old and over females are the most vulnerable to poverty, with 21 males (51.2%) and 97 females (34.4%) in their respective age groups living below the poverty level.
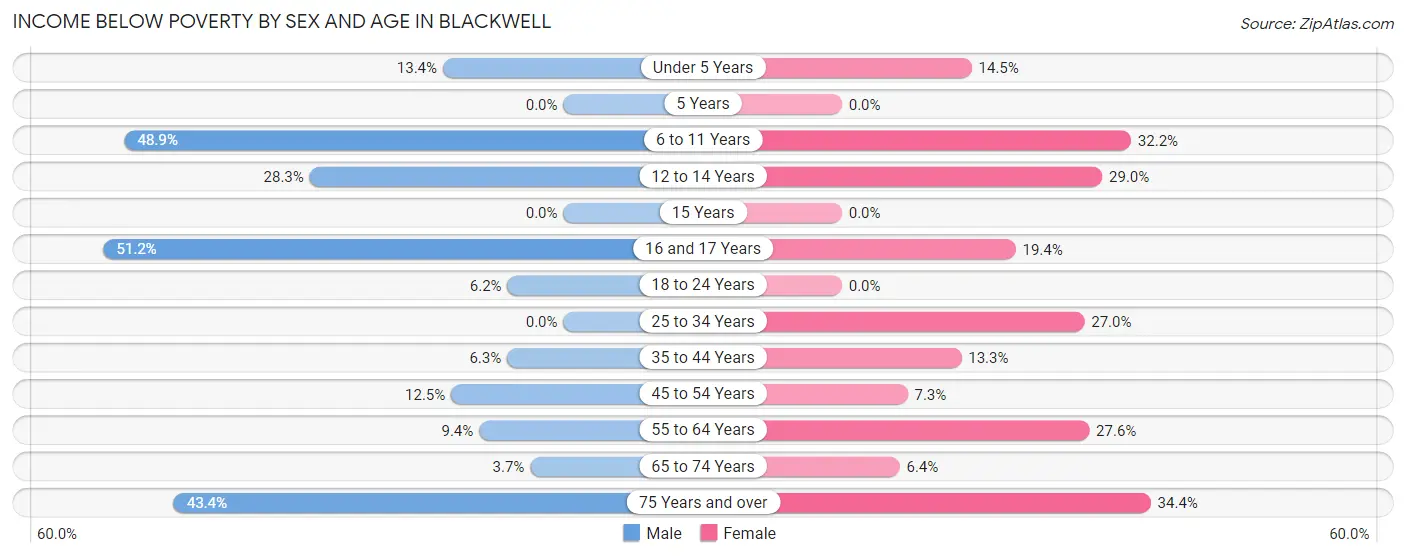
| Age Bracket | Male | Female |
| Under 5 Years | 31 (13.4%) | 35 (14.5%) |
| 5 Years | 0 (0.0%) | 0 (0.0%) |
| 6 to 11 Years | 260 (48.9%) | 76 (32.2%) |
| 12 to 14 Years | 26 (28.3%) | 20 (29.0%) |
| 15 Years | 0 (0.0%) | 0 (0.0%) |
| 16 and 17 Years | 21 (51.2%) | 18 (19.4%) |
| 18 to 24 Years | 24 (6.2%) | 0 (0.0%) |
| 25 to 34 Years | 0 (0.0%) | 114 (27.0%) |
| 35 to 44 Years | 19 (6.3%) | 35 (13.3%) |
| 45 to 54 Years | 23 (12.5%) | 26 (7.3%) |
| 55 to 64 Years | 42 (9.4%) | 108 (27.6%) |
| 65 to 74 Years | 15 (3.7%) | 22 (6.4%) |
| 75 Years and over | 95 (43.4%) | 97 (34.4%) |
| Total | 556 (17.5%) | 551 (19.3%) |
Income Above Poverty by Sex and Age in Blackwell
According to the poverty statistics in Blackwell, males aged 15 years and females aged 5 years are the age groups that are most secure financially, with 100.0% of males and 100.0% of females in these age groups living above the poverty line.
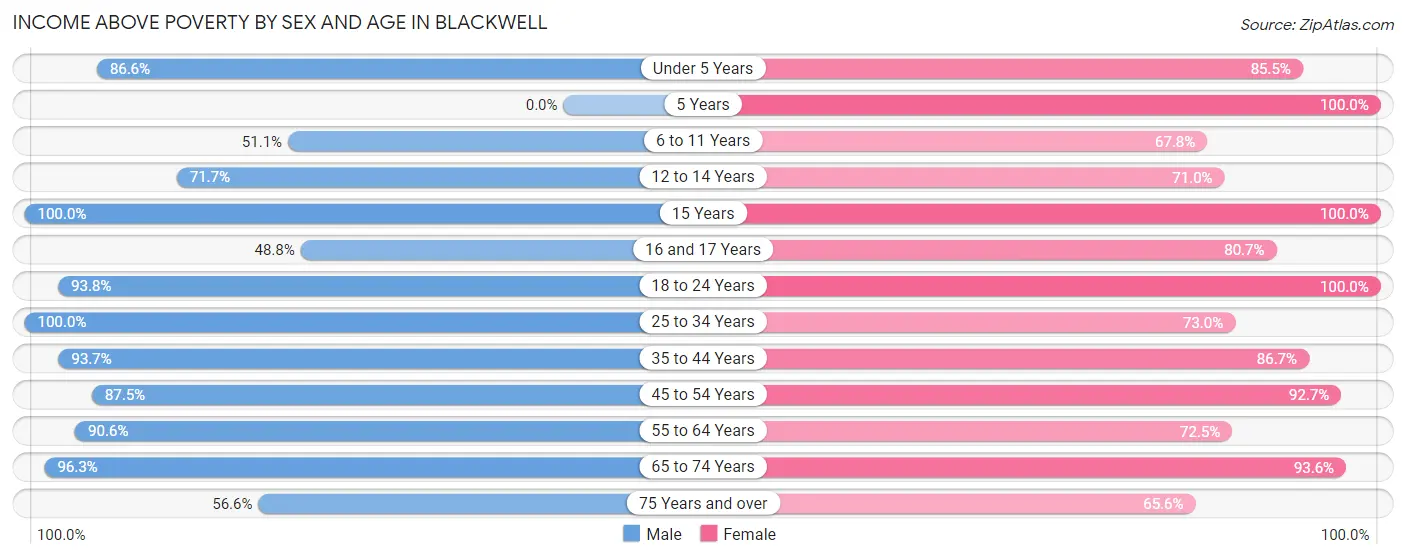
| Age Bracket | Male | Female |
| Under 5 Years | 200 (86.6%) | 207 (85.5%) |
| 5 Years | 0 (0.0%) | 23 (100.0%) |
| 6 to 11 Years | 272 (51.1%) | 160 (67.8%) |
| 12 to 14 Years | 66 (71.7%) | 49 (71.0%) |
| 15 Years | 6 (100.0%) | 15 (100.0%) |
| 16 and 17 Years | 20 (48.8%) | 75 (80.6%) |
| 18 to 24 Years | 361 (93.8%) | 126 (100.0%) |
| 25 to 34 Years | 335 (100.0%) | 308 (73.0%) |
| 35 to 44 Years | 284 (93.7%) | 228 (86.7%) |
| 45 to 54 Years | 161 (87.5%) | 329 (92.7%) |
| 55 to 64 Years | 406 (90.6%) | 284 (72.5%) |
| 65 to 74 Years | 392 (96.3%) | 320 (93.6%) |
| 75 Years and over | 124 (56.6%) | 185 (65.6%) |
| Total | 2,627 (82.5%) | 2,309 (80.7%) |
Income Below Poverty Among Married-Couple Families in Blackwell
The poverty statistics for married-couple families in Blackwell show that 6.4% or 61 of the total 956 families live below the poverty line. Families with 3 or 4 children have the highest poverty rate of 37.3%, comprising of 22 families. On the other hand, families with 1 or 2 children have the lowest poverty rate of 0.0%, which includes 0 families.
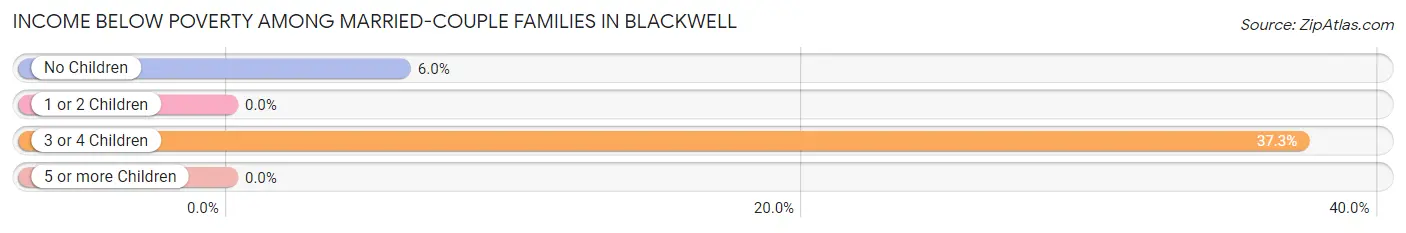
| Children | Above Poverty | Below Poverty |
| No Children | 609 (94.0%) | 39 (6.0%) |
| 1 or 2 Children | 249 (100.0%) | 0 (0.0%) |
| 3 or 4 Children | 37 (62.7%) | 22 (37.3%) |
| 5 or more Children | 0 (0.0%) | 0 (0.0%) |
| Total | 895 (93.6%) | 61 (6.4%) |
Income Below Poverty Among Single-Parent Households in Blackwell
According to the poverty data in Blackwell, 20.4% or 21 single-father households and 32.3% or 114 single-mother households are living below the poverty line. Among single-father households, those with no children have the highest poverty rate, with 21 households (43.8%) experiencing poverty. Likewise, among single-mother households, those with 3 or 4 children have the highest poverty rate, with 58 households (46.8%) falling below the poverty line.
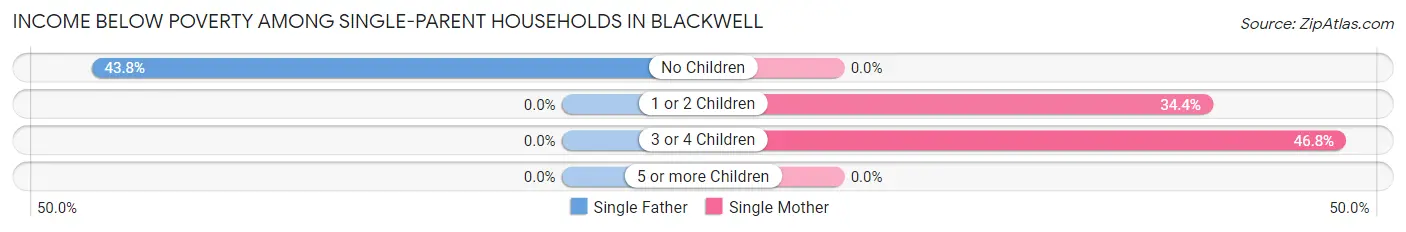
| Children | Single Father | Single Mother |
| No Children | 21 (43.8%) | 0 (0.0%) |
| 1 or 2 Children | 0 (0.0%) | 56 (34.4%) |
| 3 or 4 Children | 0 (0.0%) | 58 (46.8%) |
| 5 or more Children | 0 (0.0%) | 0 (0.0%) |
| Total | 21 (20.4%) | 114 (32.3%) |
Income Below Poverty Among Married-Couple vs Single-Parent Households in Blackwell
The poverty data for Blackwell shows that 61 of the married-couple family households (6.4%) and 135 of the single-parent households (29.6%) are living below the poverty level. Within the married-couple family households, those with 3 or 4 children have the highest poverty rate, with 22 households (37.3%) falling below the poverty line. Among the single-parent households, those with 3 or 4 children have the highest poverty rate, with 58 household (46.8%) living below poverty.
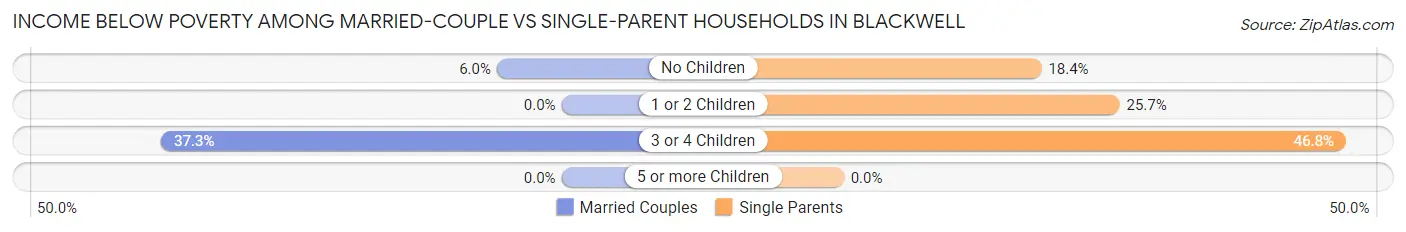
| Children | Married-Couple Families | Single-Parent Households |
| No Children | 39 (6.0%) | 21 (18.4%) |
| 1 or 2 Children | 0 (0.0%) | 56 (25.7%) |
| 3 or 4 Children | 22 (37.3%) | 58 (46.8%) |
| 5 or more Children | 0 (0.0%) | 0 (0.0%) |
| Total | 61 (6.4%) | 135 (29.6%) |
Race in Blackwell
The most populous races in Blackwell are White / Caucasian (4,913 | 80.1%), Hispanic or Latino (1,045 | 17.0%), and Two or more Races (635 | 10.4%).
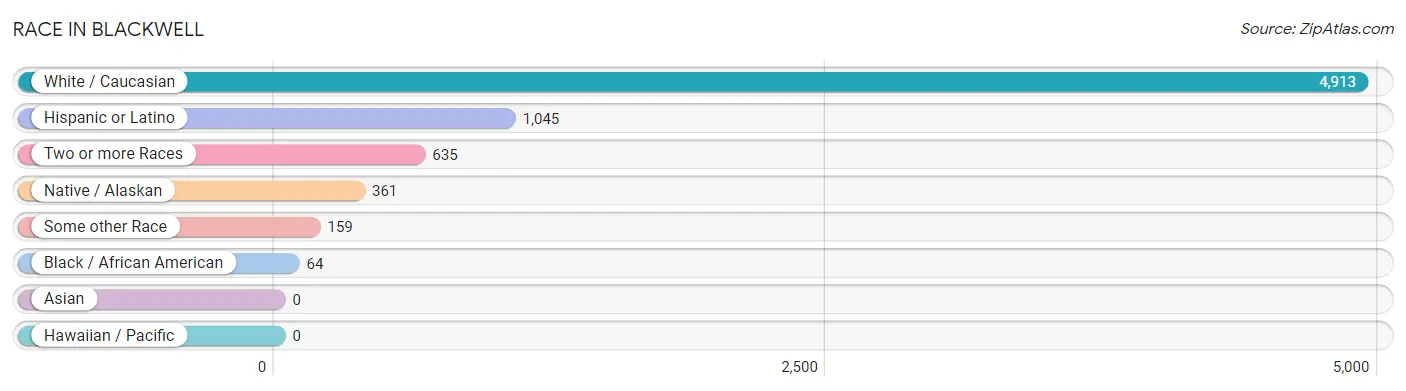
| Race | # Population | % Population |
| Asian | 0 | 0.0% |
| Black / African American | 64 | 1.0% |
| Hawaiian / Pacific | 0 | 0.0% |
| Hispanic or Latino | 1,045 | 17.0% |
| Native / Alaskan | 361 | 5.9% |
| White / Caucasian | 4,913 | 80.1% |
| Two or more Races | 635 | 10.4% |
| Some other Race | 159 | 2.6% |
| Total | 6,132 | 100.0% |
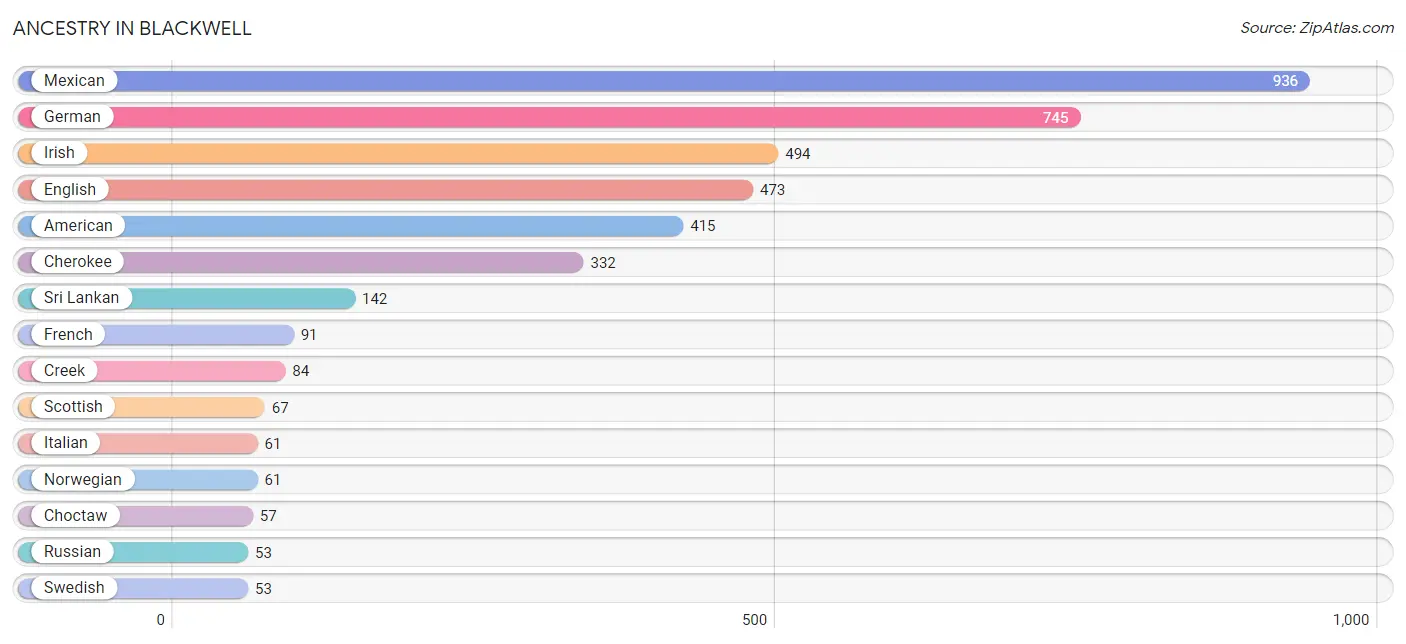
Ancestry in Blackwell
The most populous ancestries reported in Blackwell are Mexican (936 | 15.3%), German (745 | 12.1%), Irish (494 | 8.1%), English (473 | 7.7%), and American (415 | 6.8%), together accounting for 49.9% of all Blackwell residents.
| Ancestry | # Population | % Population |
| American | 415 | 6.8% |
| Apache | 51 | 0.8% |
| Bhutanese | 14 | 0.2% |
| Blackfeet | 15 | 0.2% |
| British | 24 | 0.4% |
| Cherokee | 332 | 5.4% |
| Choctaw | 57 | 0.9% |
| Comanche | 21 | 0.3% |
| Creek | 84 | 1.4% |
| Dutch | 20 | 0.3% |
| Dutch West Indian | 18 | 0.3% |
| English | 473 | 7.7% |
| European | 25 | 0.4% |
| French | 91 | 1.5% |
| German | 745 | 12.1% |
| Irish | 494 | 8.1% |
| Italian | 61 | 1.0% |
| Mexican | 936 | 15.3% |
| Northern European | 25 | 0.4% |
| Norwegian | 61 | 1.0% |
| Polish | 25 | 0.4% |
| Russian | 53 | 0.9% |
| Samoan | 12 | 0.2% |
| Scandinavian | 23 | 0.4% |
| Scotch-Irish | 27 | 0.4% |
| Scottish | 67 | 1.1% |
| Sioux | 39 | 0.6% |
| Spaniard | 8 | 0.1% |
| Sri Lankan | 142 | 2.3% |
| Swedish | 53 | 0.9% |
| Swiss | 1 | 0.0% |
| Welsh | 26 | 0.4% | View All 32 Rows |
Immigrants in Blackwell
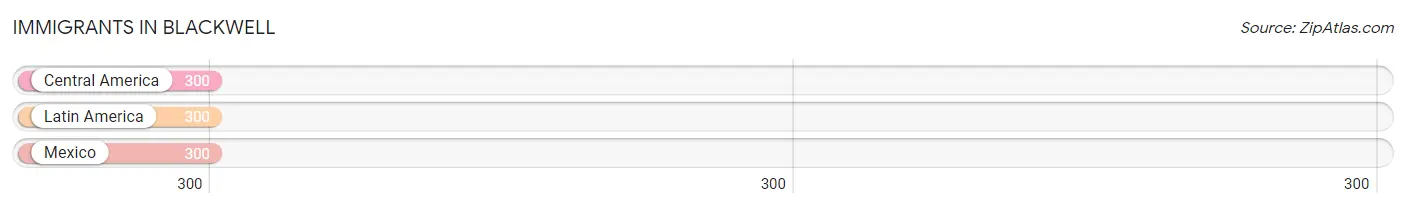
The most numerous immigrant groups reported in Blackwell came from Central America (300 | 4.9%), Latin America (300 | 4.9%), and Mexico (300 | 4.9%), together accounting for 14.7% of all Blackwell residents.
| Immigration Origin | # Population | % Population |
| Central America | 300 | 4.9% |
| Latin America | 300 | 4.9% |
| Mexico | 300 | 4.9% | View All 3 Rows |
Sex and Age in Blackwell
Sex and Age in Blackwell
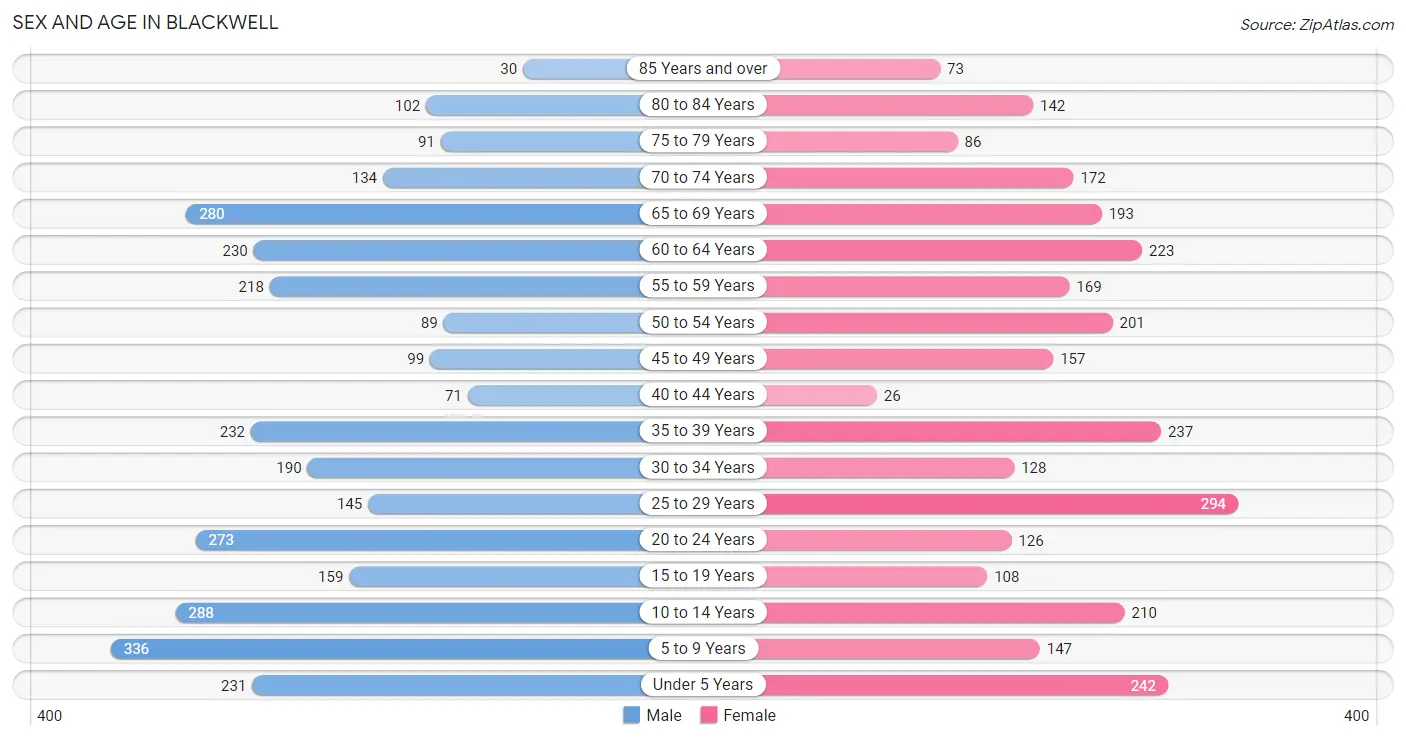
The most populous age groups in Blackwell are 5 to 9 Years (336 | 10.5%) for men and 25 to 29 Years (294 | 10.0%) for women.
| Age Bracket | Male | Female |
| Under 5 Years | 231 (7.2%) | 242 (8.3%) |
| 5 to 9 Years | 336 (10.5%) | 147 (5.0%) |
| 10 to 14 Years | 288 (9.0%) | 210 (7.2%) |
| 15 to 19 Years | 159 (5.0%) | 108 (3.7%) |
| 20 to 24 Years | 273 (8.5%) | 126 (4.3%) |
| 25 to 29 Years | 145 (4.5%) | 294 (10.0%) |
| 30 to 34 Years | 190 (5.9%) | 128 (4.4%) |
| 35 to 39 Years | 232 (7.2%) | 237 (8.1%) |
| 40 to 44 Years | 71 (2.2%) | 26 (0.9%) |
| 45 to 49 Years | 99 (3.1%) | 157 (5.3%) |
| 50 to 54 Years | 89 (2.8%) | 201 (6.9%) |
| 55 to 59 Years | 218 (6.8%) | 169 (5.8%) |
| 60 to 64 Years | 230 (7.2%) | 223 (7.6%) |
| 65 to 69 Years | 280 (8.8%) | 193 (6.6%) |
| 70 to 74 Years | 134 (4.2%) | 172 (5.9%) |
| 75 to 79 Years | 91 (2.9%) | 86 (2.9%) |
| 80 to 84 Years | 102 (3.2%) | 142 (4.8%) |
| 85 Years and over | 30 (0.9%) | 73 (2.5%) |
| Total | 3,198 (100.0%) | 2,934 (100.0%) |
Families and Households in Blackwell
Median Family Size in Blackwell
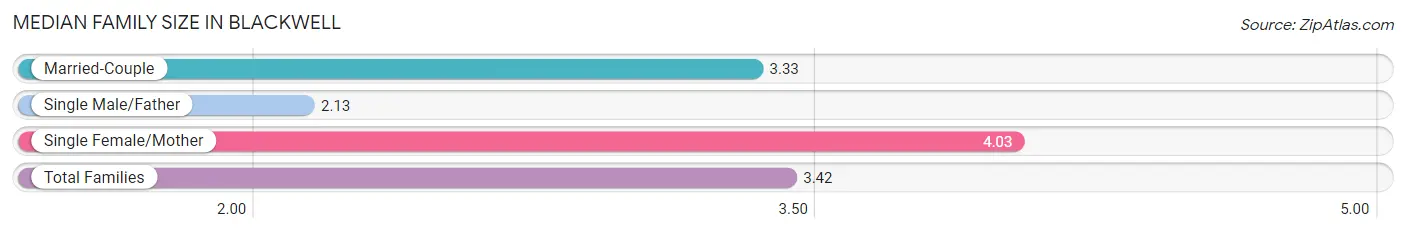
The median family size in Blackwell is 3.42 persons per family, with single female/mother families (353 | 25.0%) accounting for the largest median family size of 4.03 persons per family. On the other hand, single male/father families (103 | 7.3%) represent the smallest median family size with 2.13 persons per family.
| Family Type | # Families | Family Size |
| Married-Couple | 956 (67.7%) | 3.33 |
| Single Male/Father | 103 (7.3%) | 2.13 |
| Single Female/Mother | 353 (25.0%) | 4.03 |
| Total Families | 1,412 (100.0%) | 3.42 |
Median Household Size in Blackwell
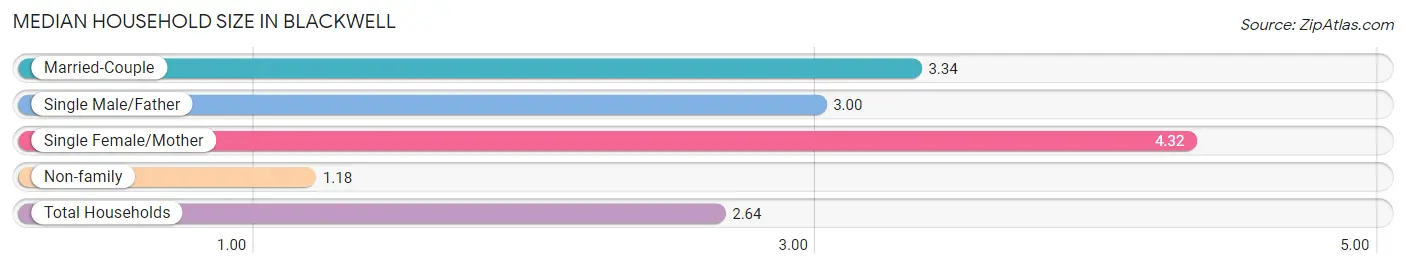
The median household size in Blackwell is 2.64 persons per household, with single female/mother households (353 | 15.4%) accounting for the largest median household size of 4.32 persons per household. non-family households (884 | 38.5%) represent the smallest median household size with 1.18 persons per household.
| Household Type | # Households | Household Size |
| Married-Couple | 956 (41.6%) | 3.34 |
| Single Male/Father | 103 (4.5%) | 3.00 |
| Single Female/Mother | 353 (15.4%) | 4.32 |
| Non-family | 884 (38.5%) | 1.18 |
| Total Households | 2,296 (100.0%) | 2.64 |
Household Size by Marriage Status in Blackwell
Out of a total of 2,296 households in Blackwell, 1,412 (61.5%) are family households, while 884 (38.5%) are nonfamily households. The most numerous type of family households are 2-person households, comprising 671, and the most common type of nonfamily households are 1-person households, comprising 765.
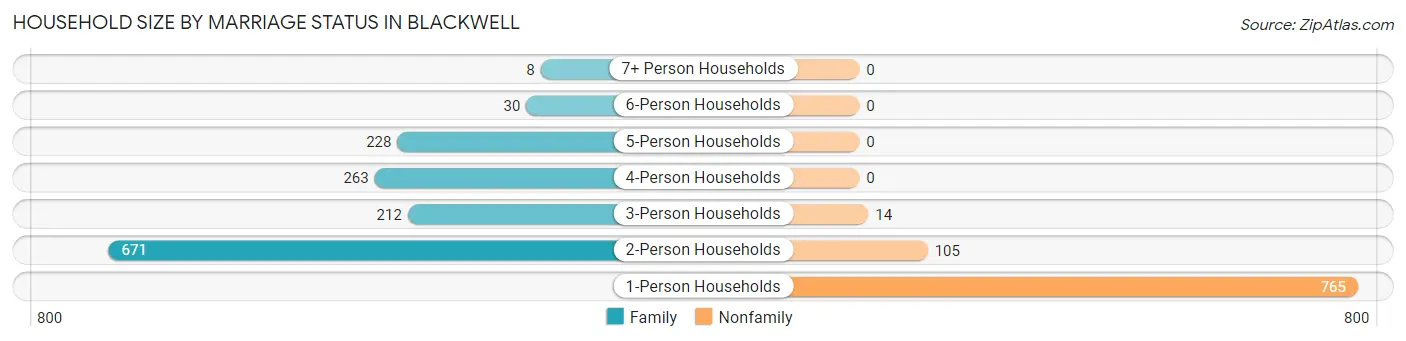
| Household Size | Family Households | Nonfamily Households |
| 1-Person Households | - | 765 (33.3%) |
| 2-Person Households | 671 (29.2%) | 105 (4.6%) |
| 3-Person Households | 212 (9.2%) | 14 (0.6%) |
| 4-Person Households | 263 (11.5%) | 0 (0.0%) |
| 5-Person Households | 228 (9.9%) | 0 (0.0%) |
| 6-Person Households | 30 (1.3%) | 0 (0.0%) |
| 7+ Person Households | 8 (0.4%) | 0 (0.0%) |
| Total | 1,412 (61.5%) | 884 (38.5%) |
Female Fertility in Blackwell
Fertility by Age in Blackwell
Average fertility rate in Blackwell is 74.0 births per 1,000 women. Women in the age bracket of 20 to 34 years have the highest fertility rate with 148.0 births per 1,000 women. Women in the age bracket of 20 to 34 years acount for 100.0% of all women with births.
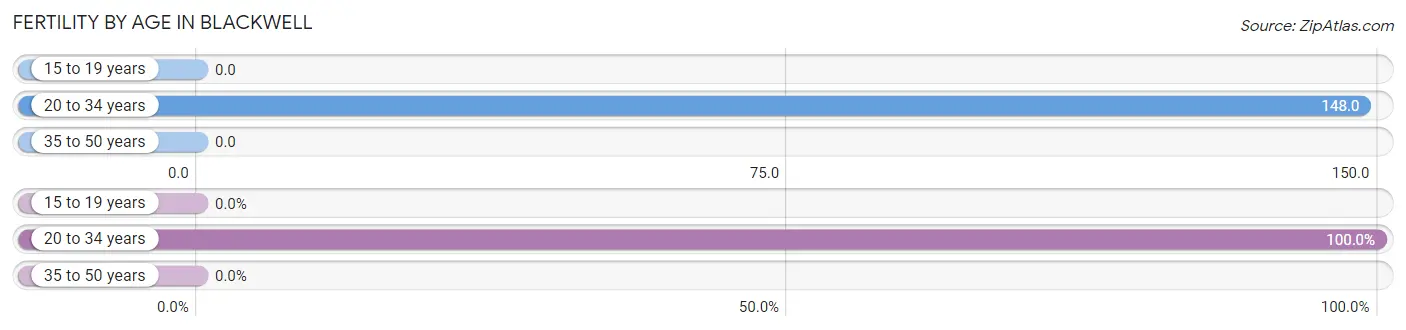
| Age Bracket | Women with Births | Births / 1,000 Women |
| 15 to 19 years | 0 (0.0%) | 0.0 |
| 20 to 34 years | 81 (100.0%) | 148.0 |
| 35 to 50 years | 0 (0.0%) | 0.0 |
| Total | 81 (100.0%) | 74.0 |
Fertility by Age by Marriage Status in Blackwell
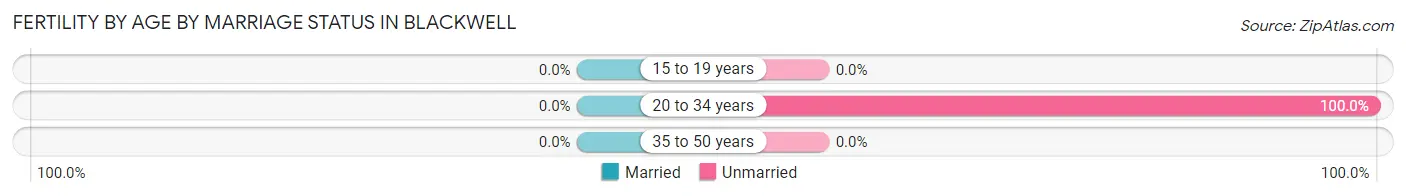
| Age Bracket | Married | Unmarried |
| 15 to 19 years | 0 (0.0%) | 0 (0.0%) |
| 20 to 34 years | 0 (0.0%) | 81 (100.0%) |
| 35 to 50 years | 0 (0.0%) | 0 (0.0%) |
| Total | 0 (0.0%) | 81 (100.0%) |
Fertility by Education in Blackwell
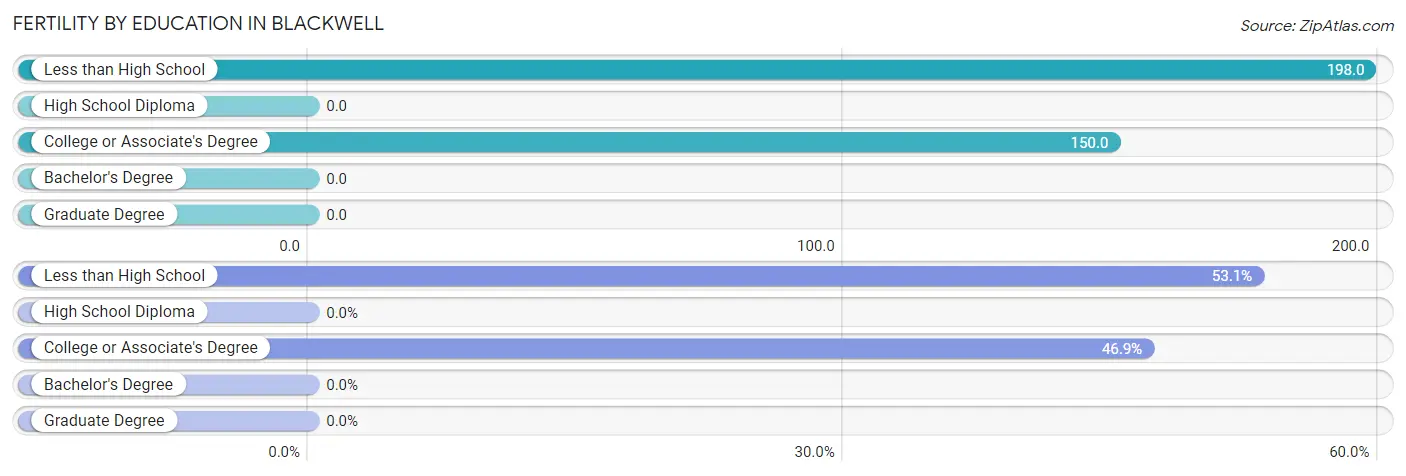
| Educational Attainment | Women with Births | Births / 1,000 Women |
| Less than High School | 43 (53.1%) | 198.0 |
| High School Diploma | 0 (0.0%) | 0.0 |
| College or Associate's Degree | 38 (46.9%) | 150.0 |
| Bachelor's Degree | 0 (0.0%) | 0.0 |
| Graduate Degree | 0 (0.0%) | 0.0 |
| Total | 81 (100.0%) | 74.0 |
Fertility by Education by Marriage Status in Blackwell
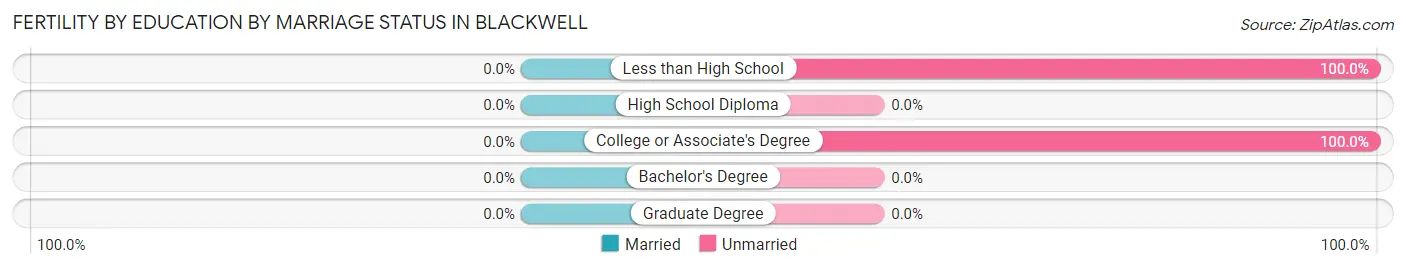
| Educational Attainment | Married | Unmarried |
| Less than High School | 0 (0.0%) | 43 (100.0%) |
| High School Diploma | 0 (0.0%) | 0 (0.0%) |
| College or Associate's Degree | 0 (0.0%) | 38 (100.0%) |
| Bachelor's Degree | 0 (0.0%) | 0 (0.0%) |
| Graduate Degree | 0 (0.0%) | 0 (0.0%) |
| Total | 0 (0.0%) | 81 (100.0%) |
Employment Characteristics in Blackwell
Employment by Class of Employer in Blackwell
Among the 2,530 employed individuals in Blackwell, private company employees (1,741 | 68.8%), local government employees (236 | 9.3%), and state government employees (160 | 6.3%) make up the most common classes of employment.
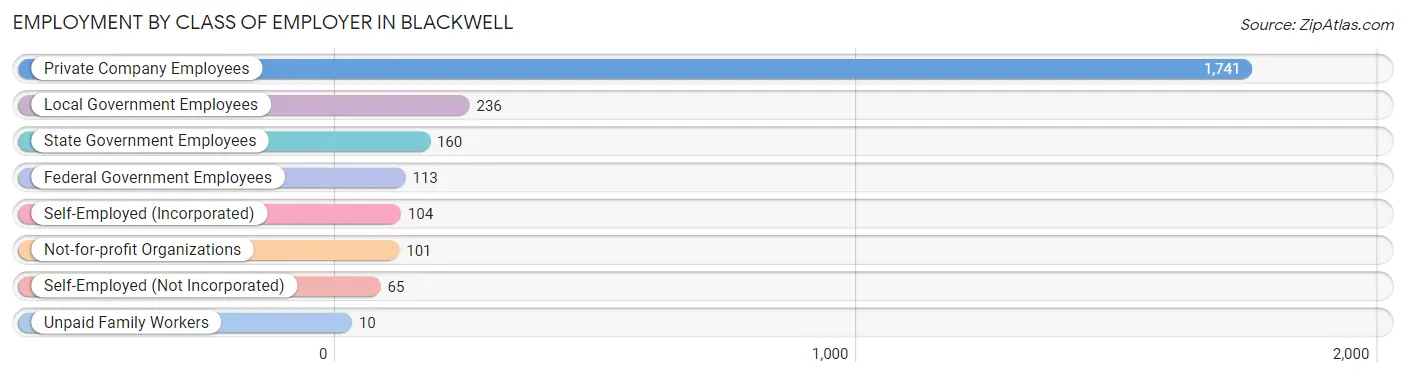
| Employer Class | # Employees | % Employees |
| Private Company Employees | 1,741 | 68.8% |
| Self-Employed (Incorporated) | 104 | 4.1% |
| Self-Employed (Not Incorporated) | 65 | 2.6% |
| Not-for-profit Organizations | 101 | 4.0% |
| Local Government Employees | 236 | 9.3% |
| State Government Employees | 160 | 6.3% |
| Federal Government Employees | 113 | 4.5% |
| Unpaid Family Workers | 10 | 0.4% |
| Total | 2,530 | 100.0% |
Employment Status by Age in Blackwell
According to the labor force statistics for Blackwell, out of the total population over 16 years of age (4,657), 59.4% or 2,766 individuals are in the labor force, with 6.6% or 183 of them unemployed. The age group with the highest labor force participation rate is 30 to 34 years, with 95.0% or 302 individuals in the labor force. Within the labor force, the 16 to 19 years age range has the highest percentage of unemployed individuals, with 23.0% or 34 of them being unemployed.
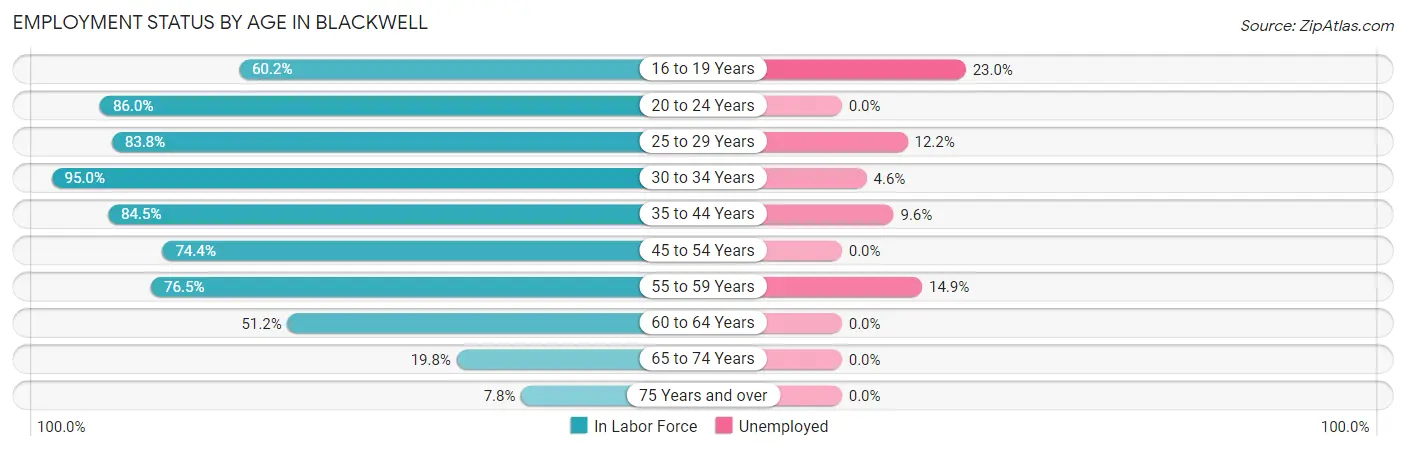
| Age Bracket | In Labor Force | Unemployed |
| 16 to 19 Years | 148 (60.2%) | 34 (23.0%) |
| 20 to 24 Years | 343 (86.0%) | 0 (0.0%) |
| 25 to 29 Years | 368 (83.8%) | 45 (12.2%) |
| 30 to 34 Years | 302 (95.0%) | 14 (4.6%) |
| 35 to 44 Years | 478 (84.5%) | 46 (9.6%) |
| 45 to 54 Years | 406 (74.4%) | 0 (0.0%) |
| 55 to 59 Years | 296 (76.5%) | 44 (14.9%) |
| 60 to 64 Years | 232 (51.2%) | 0 (0.0%) |
| 65 to 74 Years | 154 (19.8%) | 0 (0.0%) |
| 75 Years and over | 41 (7.8%) | 0 (0.0%) |
| Total | 2,766 (59.4%) | 183 (6.6%) |
Employment Status by Educational Attainment in Blackwell
According to labor force statistics for Blackwell, 76.9% of individuals (2,083) out of the total population between 25 and 64 years of age (2,709) are in the labor force, with 7.1% or 148 of them being unemployed. The group with the highest labor force participation rate are those with the educational attainment of bachelor's degree or higher, with 100.0% or 315 individuals in the labor force. Within the labor force, individuals with college / associate degree education have the highest percentage of unemployment, with 12.6% or 79 of them being unemployed.
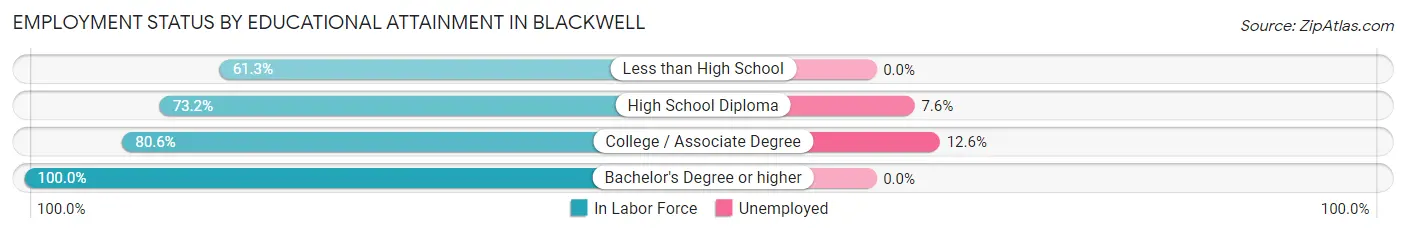
| Educational Attainment | In Labor Force | Unemployed |
| Less than High School | 222 (61.3%) | 0 (0.0%) |
| High School Diploma | 918 (73.2%) | 95 (7.6%) |
| College / Associate Degree | 627 (80.6%) | 98 (12.6%) |
| Bachelor's Degree or higher | 315 (100.0%) | 0 (0.0%) |
| Total | 2,083 (76.9%) | 192 (7.1%) |
Employment Occupations by Sex in Blackwell
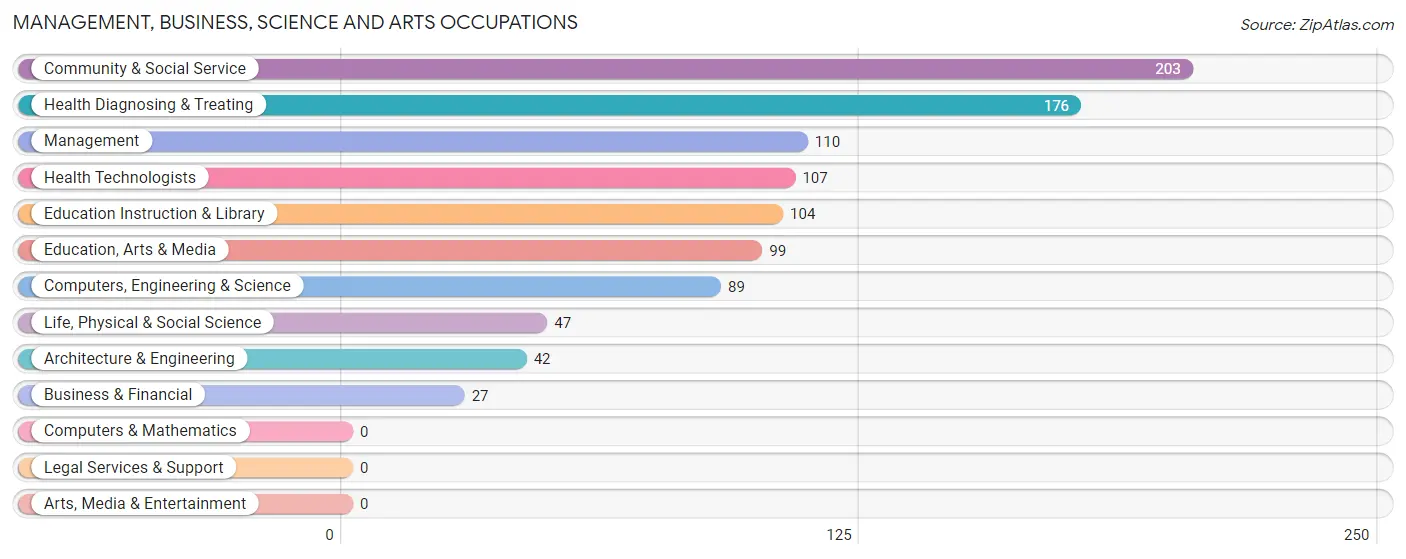
Management, Business, Science and Arts Occupations
The most common Management, Business, Science and Arts occupations in Blackwell are Community & Social Service (203 | 7.9%), Health Diagnosing & Treating (176 | 6.8%), Management (110 | 4.3%), Health Technologists (107 | 4.2%), and Education Instruction & Library (104 | 4.0%).
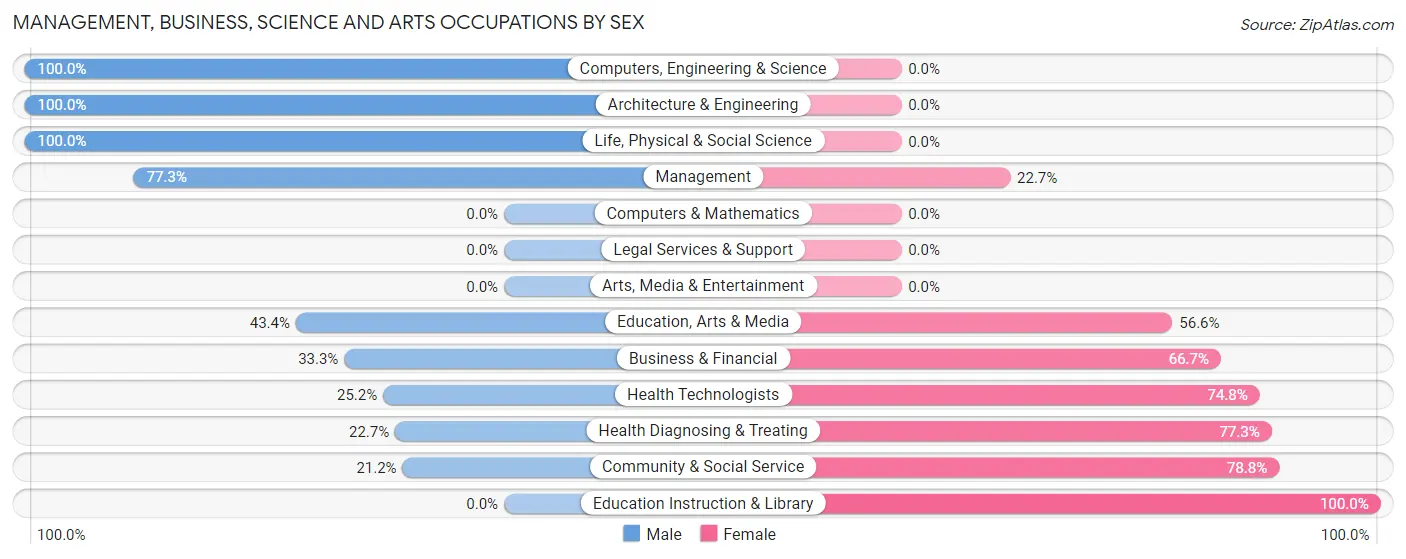
Management, Business, Science and Arts Occupations by Sex
Within the Management, Business, Science and Arts occupations in Blackwell, the most male-oriented occupations are Computers, Engineering & Science (100.0%), Architecture & Engineering (100.0%), and Life, Physical & Social Science (100.0%), while the most female-oriented occupations are Education Instruction & Library (100.0%), Community & Social Service (78.8%), and Health Diagnosing & Treating (77.3%).
| Occupation | Male | Female |
| Management | 85 (77.3%) | 25 (22.7%) |
| Business & Financial | 9 (33.3%) | 18 (66.7%) |
| Computers, Engineering & Science | 89 (100.0%) | 0 (0.0%) |
| Computers & Mathematics | 0 (0.0%) | 0 (0.0%) |
| Architecture & Engineering | 42 (100.0%) | 0 (0.0%) |
| Life, Physical & Social Science | 47 (100.0%) | 0 (0.0%) |
| Community & Social Service | 43 (21.2%) | 160 (78.8%) |
| Education, Arts & Media | 43 (43.4%) | 56 (56.6%) |
| Legal Services & Support | 0 (0.0%) | 0 (0.0%) |
| Education Instruction & Library | 0 (0.0%) | 104 (100.0%) |
| Arts, Media & Entertainment | 0 (0.0%) | 0 (0.0%) |
| Health Diagnosing & Treating | 40 (22.7%) | 136 (77.3%) |
| Health Technologists | 27 (25.2%) | 80 (74.8%) |
| Total (Category) | 266 (44.0%) | 339 (56.0%) |
| Total (Overall) | 1,466 (56.8%) | 1,113 (43.2%) |
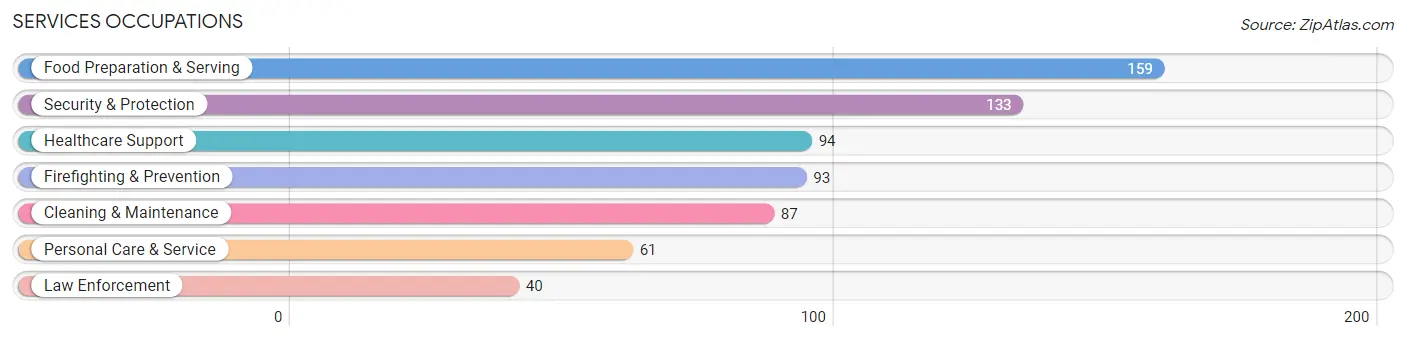
Services Occupations
The most common Services occupations in Blackwell are Food Preparation & Serving (159 | 6.2%), Security & Protection (133 | 5.2%), Healthcare Support (94 | 3.6%), Firefighting & Prevention (93 | 3.6%), and Cleaning & Maintenance (87 | 3.4%).
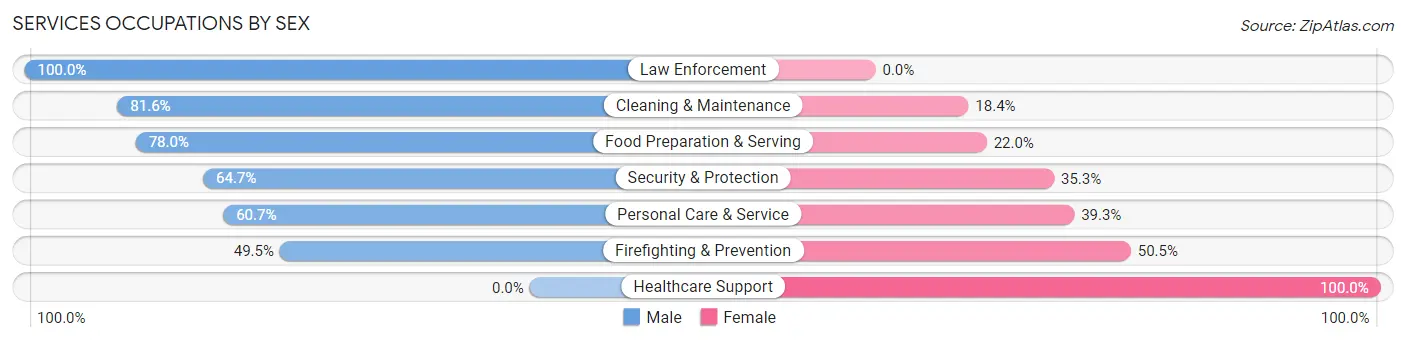
Services Occupations by Sex
Within the Services occupations in Blackwell, the most male-oriented occupations are Law Enforcement (100.0%), Cleaning & Maintenance (81.6%), and Food Preparation & Serving (78.0%), while the most female-oriented occupations are Healthcare Support (100.0%), Firefighting & Prevention (50.5%), and Personal Care & Service (39.3%).
| Occupation | Male | Female |
| Healthcare Support | 0 (0.0%) | 94 (100.0%) |
| Security & Protection | 86 (64.7%) | 47 (35.3%) |
| Firefighting & Prevention | 46 (49.5%) | 47 (50.5%) |
| Law Enforcement | 40 (100.0%) | 0 (0.0%) |
| Food Preparation & Serving | 124 (78.0%) | 35 (22.0%) |
| Cleaning & Maintenance | 71 (81.6%) | 16 (18.4%) |
| Personal Care & Service | 37 (60.7%) | 24 (39.3%) |
| Total (Category) | 318 (59.6%) | 216 (40.5%) |
| Total (Overall) | 1,466 (56.8%) | 1,113 (43.2%) |
Sales and Office Occupations
The most common Sales and Office occupations in Blackwell are Office & Administration (272 | 10.5%), and Sales & Related (242 | 9.4%).

Sales and Office Occupations by Sex
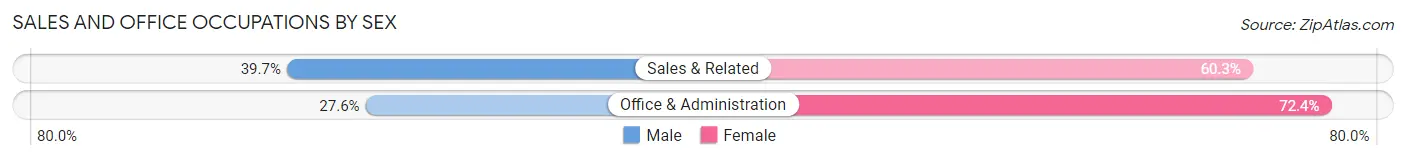
| Occupation | Male | Female |
| Sales & Related | 96 (39.7%) | 146 (60.3%) |
| Office & Administration | 75 (27.6%) | 197 (72.4%) |
| Total (Category) | 171 (33.3%) | 343 (66.7%) |
| Total (Overall) | 1,466 (56.8%) | 1,113 (43.2%) |
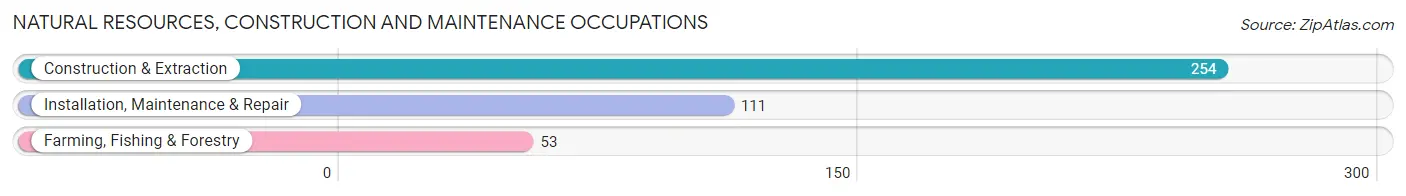
Natural Resources, Construction and Maintenance Occupations
The most common Natural Resources, Construction and Maintenance occupations in Blackwell are Construction & Extraction (254 | 9.9%), Installation, Maintenance & Repair (111 | 4.3%), and Farming, Fishing & Forestry (53 | 2.1%).
Natural Resources, Construction and Maintenance Occupations by Sex
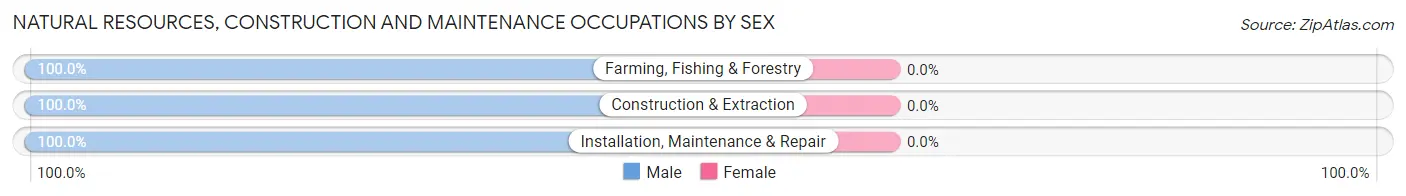
| Occupation | Male | Female |
| Farming, Fishing & Forestry | 53 (100.0%) | 0 (0.0%) |
| Construction & Extraction | 254 (100.0%) | 0 (0.0%) |
| Installation, Maintenance & Repair | 111 (100.0%) | 0 (0.0%) |
| Total (Category) | 418 (100.0%) | 0 (0.0%) |
| Total (Overall) | 1,466 (56.8%) | 1,113 (43.2%) |
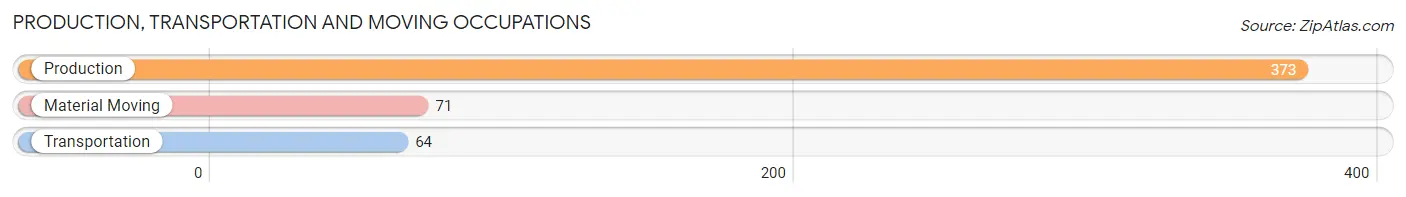
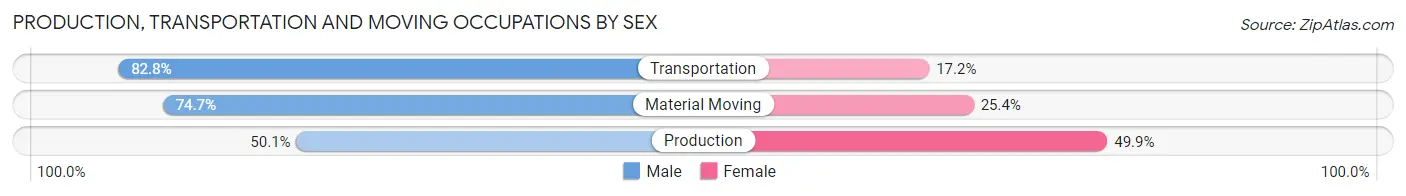
Production, Transportation and Moving Occupations
The most common Production, Transportation and Moving occupations in Blackwell are Production (373 | 14.5%), Material Moving (71 | 2.8%), and Transportation (64 | 2.5%).
Production, Transportation and Moving Occupations by Sex
| Occupation | Male | Female |
| Production | 187 (50.1%) | 186 (49.9%) |
| Transportation | 53 (82.8%) | 11 (17.2%) |
| Material Moving | 53 (74.7%) | 18 (25.4%) |
| Total (Category) | 293 (57.7%) | 215 (42.3%) |
| Total (Overall) | 1,466 (56.8%) | 1,113 (43.2%) |
Employment Industries by Sex in Blackwell
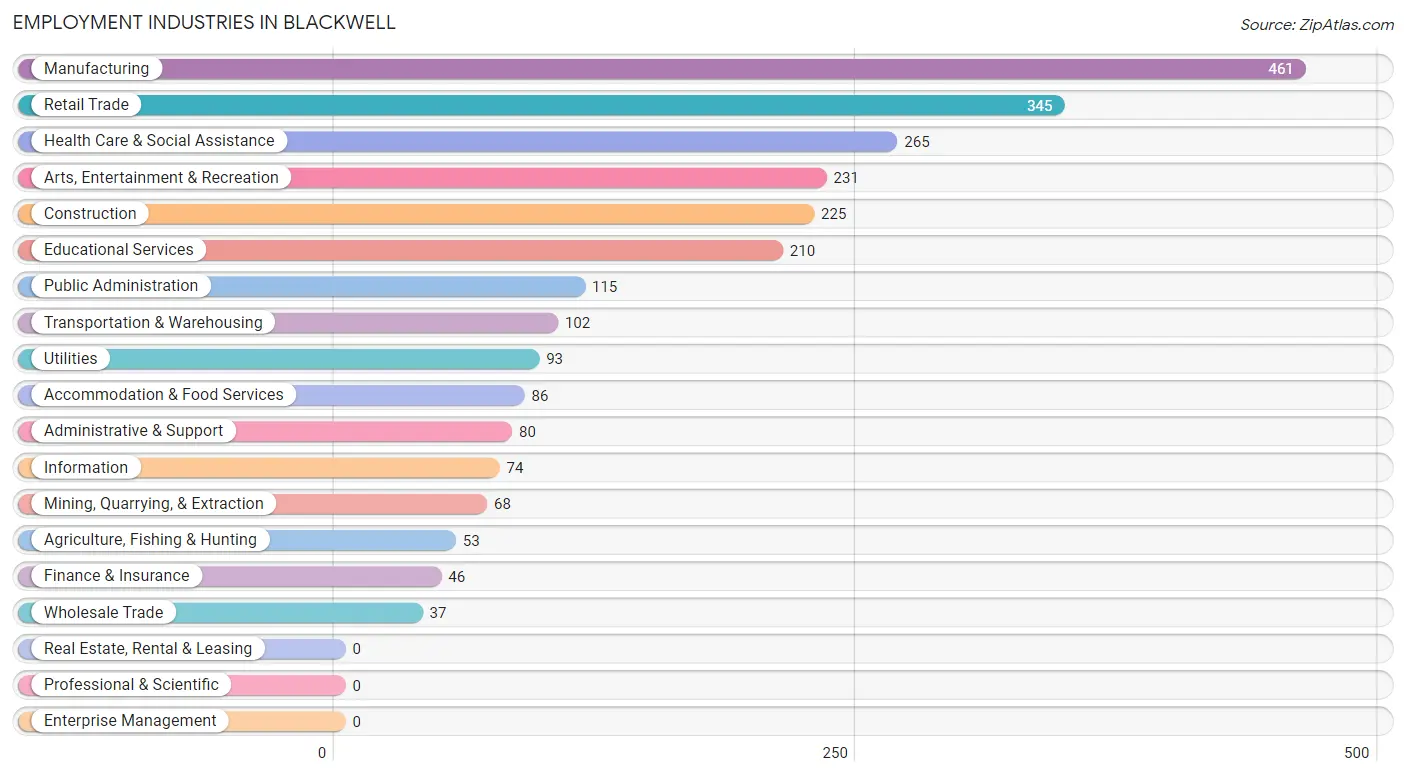
Employment Industries in Blackwell
The major employment industries in Blackwell include Manufacturing (461 | 17.9%), Retail Trade (345 | 13.4%), Health Care & Social Assistance (265 | 10.3%), Arts, Entertainment & Recreation (231 | 9.0%), and Construction (225 | 8.7%).
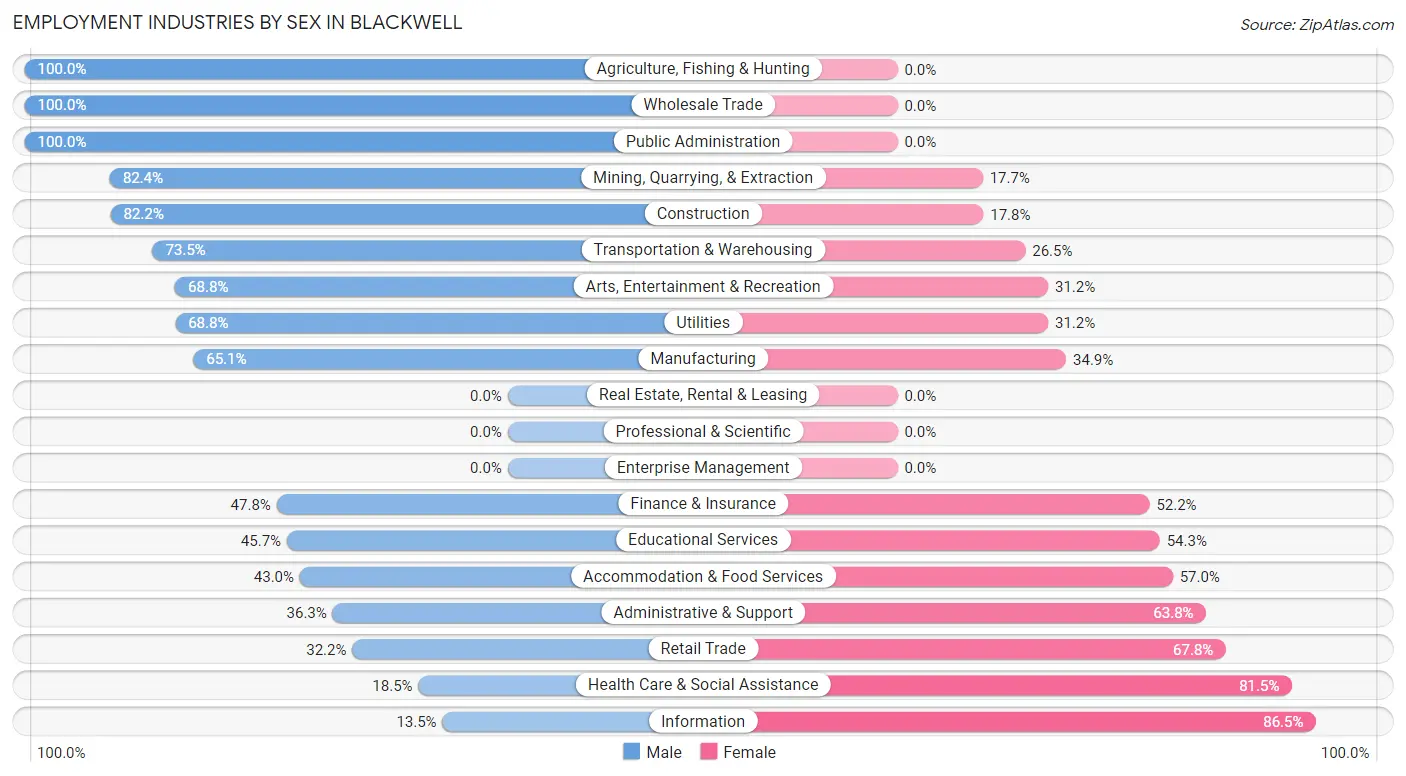
Employment Industries by Sex in Blackwell
The Blackwell industries that see more men than women are Agriculture, Fishing & Hunting (100.0%), Wholesale Trade (100.0%), and Public Administration (100.0%), whereas the industries that tend to have a higher number of women are Information (86.5%), Health Care & Social Assistance (81.5%), and Retail Trade (67.8%).
| Industry | Male | Female |
| Agriculture, Fishing & Hunting | 53 (100.0%) | 0 (0.0%) |
| Mining, Quarrying, & Extraction | 56 (82.4%) | 12 (17.6%) |
| Construction | 185 (82.2%) | 40 (17.8%) |
| Manufacturing | 300 (65.1%) | 161 (34.9%) |
| Wholesale Trade | 37 (100.0%) | 0 (0.0%) |
| Retail Trade | 111 (32.2%) | 234 (67.8%) |
| Transportation & Warehousing | 75 (73.5%) | 27 (26.5%) |
| Utilities | 64 (68.8%) | 29 (31.2%) |
| Information | 10 (13.5%) | 64 (86.5%) |
| Finance & Insurance | 22 (47.8%) | 24 (52.2%) |
| Real Estate, Rental & Leasing | 0 (0.0%) | 0 (0.0%) |
| Professional & Scientific | 0 (0.0%) | 0 (0.0%) |
| Enterprise Management | 0 (0.0%) | 0 (0.0%) |
| Administrative & Support | 29 (36.2%) | 51 (63.7%) |
| Educational Services | 96 (45.7%) | 114 (54.3%) |
| Health Care & Social Assistance | 49 (18.5%) | 216 (81.5%) |
| Arts, Entertainment & Recreation | 159 (68.8%) | 72 (31.2%) |
| Accommodation & Food Services | 37 (43.0%) | 49 (57.0%) |
| Public Administration | 115 (100.0%) | 0 (0.0%) |
| Total | 1,466 (56.8%) | 1,113 (43.2%) |
Education in Blackwell
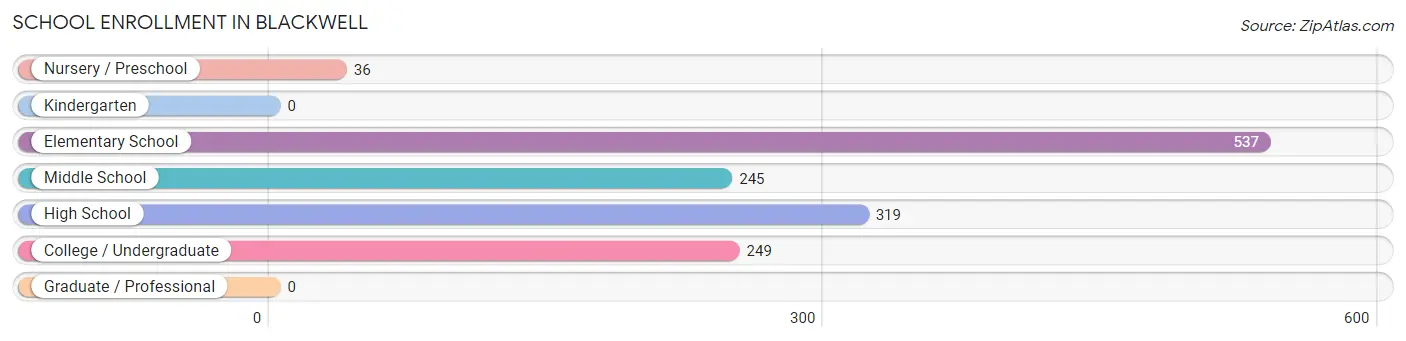
School Enrollment in Blackwell
The most common levels of schooling among the 1,386 students in Blackwell are elementary school (537 | 38.7%), high school (319 | 23.0%), and college / undergraduate (249 | 18.0%).
| School Level | # Students | % Students |
| Nursery / Preschool | 36 | 2.6% |
| Kindergarten | 0 | 0.0% |
| Elementary School | 537 | 38.7% |
| Middle School | 245 | 17.7% |
| High School | 319 | 23.0% |
| College / Undergraduate | 249 | 18.0% |
| Graduate / Professional | 0 | 0.0% |
| Total | 1,386 | 100.0% |
School Enrollment by Age by Funding Source in Blackwell
Out of a total of 1,386 students who are enrolled in schools in Blackwell, 67 (4.8%) attend a private institution, while the remaining 1,319 (95.2%) are enrolled in public schools. The age group of 18 to 19 year olds has the highest likelihood of being enrolled in private schools, with 17 (15.2% in the age bracket) enrolled. Conversely, the age group of 3 to 4 year olds has the lowest likelihood of being enrolled in a private school, with 25 (100.0% in the age bracket) attending a public institution.
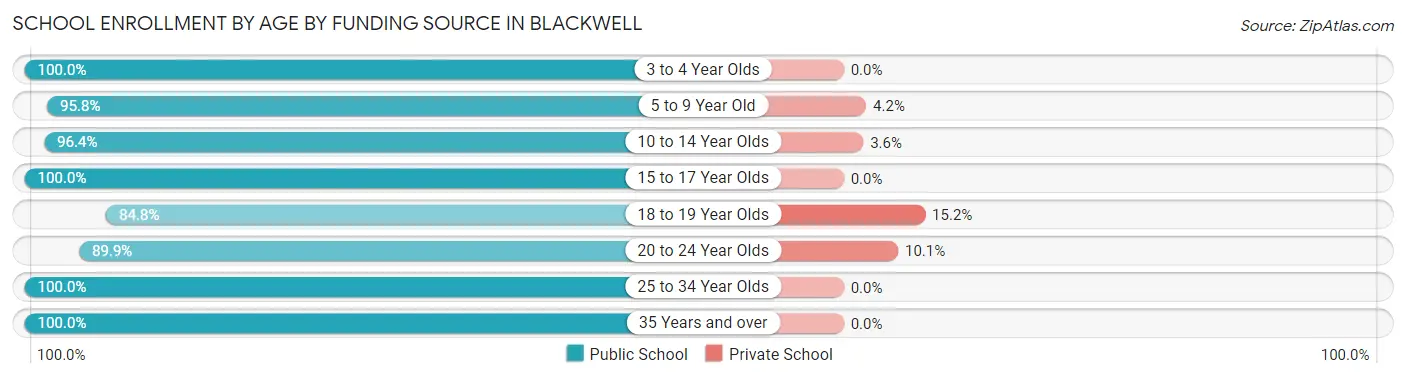
| Age Bracket | Public School | Private School |
| 3 to 4 Year Olds | 25 (100.0%) | 0 (0.0%) |
| 5 to 9 Year Old | 412 (95.8%) | 18 (4.2%) |
| 10 to 14 Year Olds | 423 (96.4%) | 16 (3.6%) |
| 15 to 17 Year Olds | 155 (100.0%) | 0 (0.0%) |
| 18 to 19 Year Olds | 95 (84.8%) | 17 (15.2%) |
| 20 to 24 Year Olds | 142 (89.9%) | 16 (10.1%) |
| 25 to 34 Year Olds | 31 (100.0%) | 0 (0.0%) |
| 35 Years and over | 36 (100.0%) | 0 (0.0%) |
| Total | 1,319 (95.2%) | 67 (4.8%) |
Educational Attainment by Field of Study in Blackwell
Education (120 | 25.2%), psychology (106 | 22.2%), business (54 | 11.3%), science & technology (40 | 8.4%), and literature & languages (40 | 8.4%) are the most common fields of study among 477 individuals in Blackwell who have obtained a bachelor's degree or higher.
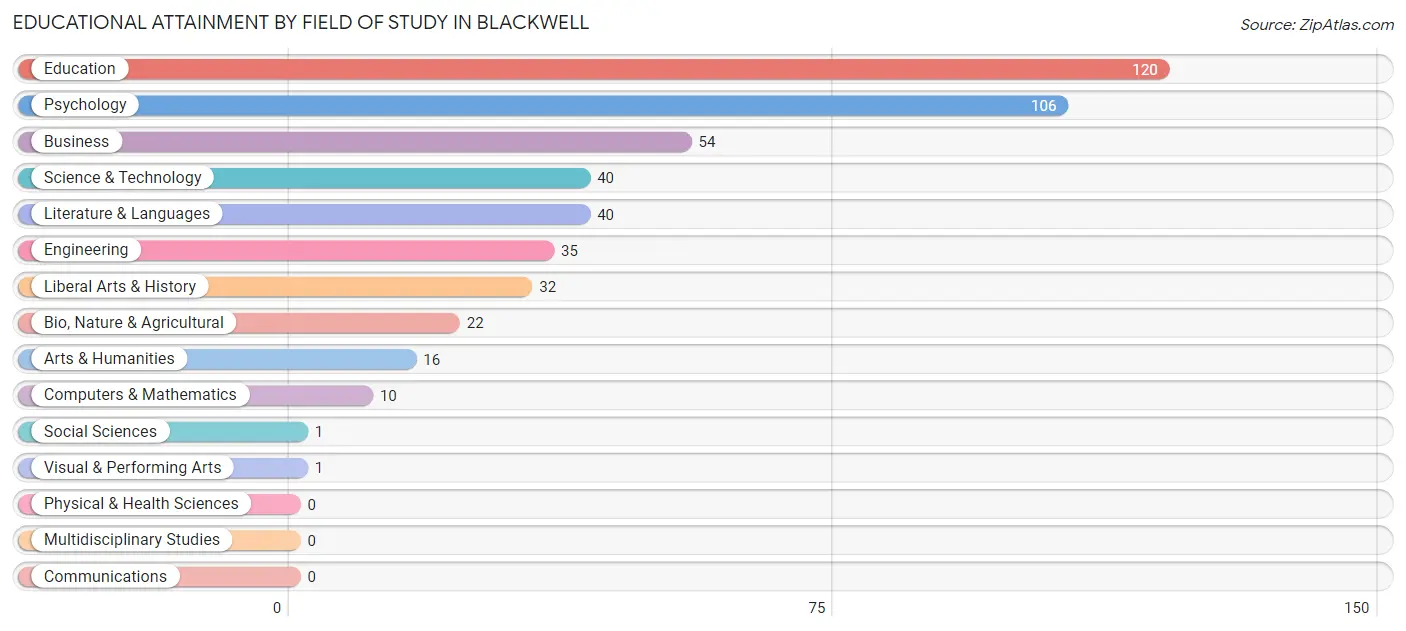
| Field of Study | # Graduates | % Graduates |
| Computers & Mathematics | 10 | 2.1% |
| Bio, Nature & Agricultural | 22 | 4.6% |
| Physical & Health Sciences | 0 | 0.0% |
| Psychology | 106 | 22.2% |
| Social Sciences | 1 | 0.2% |
| Engineering | 35 | 7.3% |
| Multidisciplinary Studies | 0 | 0.0% |
| Science & Technology | 40 | 8.4% |
| Business | 54 | 11.3% |
| Education | 120 | 25.2% |
| Literature & Languages | 40 | 8.4% |
| Liberal Arts & History | 32 | 6.7% |
| Visual & Performing Arts | 1 | 0.2% |
| Communications | 0 | 0.0% |
| Arts & Humanities | 16 | 3.4% |
| Total | 477 | 100.0% |
Transportation & Commute in Blackwell
Vehicle Availability by Sex in Blackwell
The most prevalent vehicle ownership categories in Blackwell are males with 2 vehicles (638, accounting for 43.8%) and females with 2 vehicles (419, making up 59.4%).
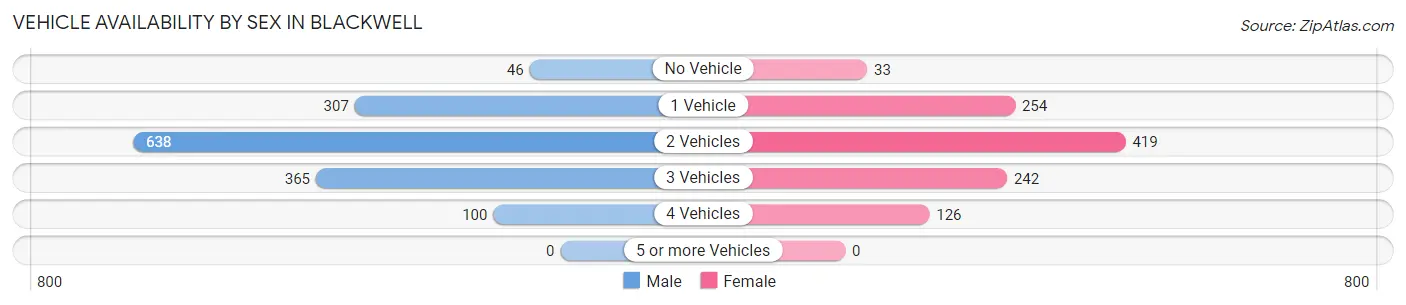
| Vehicles Available | Male | Female |
| No Vehicle | 46 (3.2%) | 33 (3.1%) |
| 1 Vehicle | 307 (21.1%) | 254 (23.6%) |
| 2 Vehicles | 638 (43.8%) | 419 (39.0%) |
| 3 Vehicles | 365 (25.1%) | 242 (22.5%) |
| 4 Vehicles | 100 (6.9%) | 126 (11.7%) |
| 5 or more Vehicles | 0 (0.0%) | 0 (0.0%) |
| Total | 1,456 (100.0%) | 1,074 (100.0%) |
Commute Time in Blackwell
The most frequently occuring commute durations in Blackwell are 5 to 9 minutes (702 commuters, 28.6%), 10 to 14 minutes (477 commuters, 19.5%), and 30 to 34 minutes (222 commuters, 9.0%).
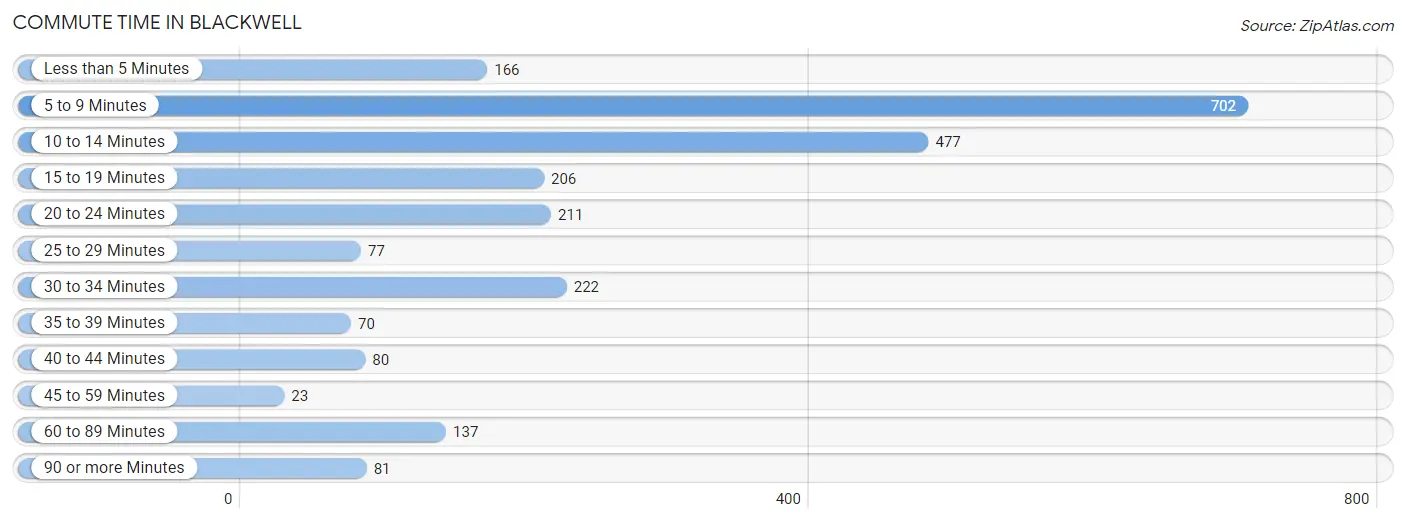
| Commute Time | # Commuters | % Commuters |
| Less than 5 Minutes | 166 | 6.8% |
| 5 to 9 Minutes | 702 | 28.6% |
| 10 to 14 Minutes | 477 | 19.5% |
| 15 to 19 Minutes | 206 | 8.4% |
| 20 to 24 Minutes | 211 | 8.6% |
| 25 to 29 Minutes | 77 | 3.1% |
| 30 to 34 Minutes | 222 | 9.0% |
| 35 to 39 Minutes | 70 | 2.9% |
| 40 to 44 Minutes | 80 | 3.3% |
| 45 to 59 Minutes | 23 | 0.9% |
| 60 to 89 Minutes | 137 | 5.6% |
| 90 or more Minutes | 81 | 3.3% |
Commute Time by Sex in Blackwell
The most common commute times in Blackwell are 5 to 9 minutes (417 commuters, 29.6%) for males and 10 to 14 minutes (331 commuters, 31.8%) for females.
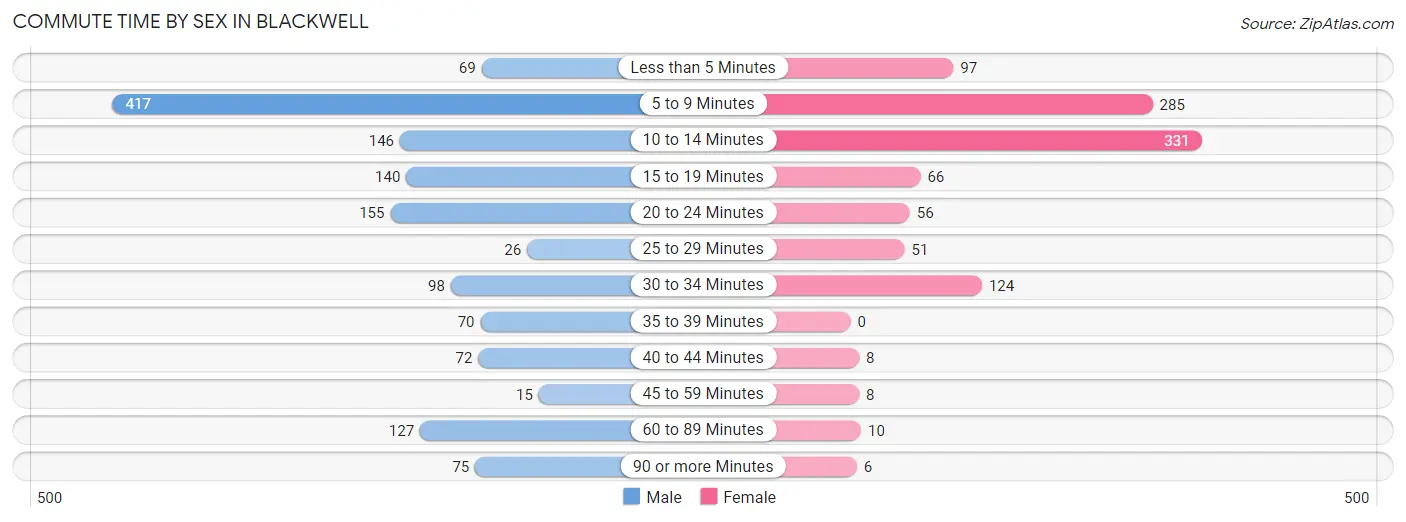
| Commute Time | Male | Female |
| Less than 5 Minutes | 69 (4.9%) | 97 (9.3%) |
| 5 to 9 Minutes | 417 (29.6%) | 285 (27.4%) |
| 10 to 14 Minutes | 146 (10.3%) | 331 (31.8%) |
| 15 to 19 Minutes | 140 (9.9%) | 66 (6.3%) |
| 20 to 24 Minutes | 155 (11.0%) | 56 (5.4%) |
| 25 to 29 Minutes | 26 (1.8%) | 51 (4.9%) |
| 30 to 34 Minutes | 98 (7.0%) | 124 (11.9%) |
| 35 to 39 Minutes | 70 (5.0%) | 0 (0.0%) |
| 40 to 44 Minutes | 72 (5.1%) | 8 (0.8%) |
| 45 to 59 Minutes | 15 (1.1%) | 8 (0.8%) |
| 60 to 89 Minutes | 127 (9.0%) | 10 (1.0%) |
| 90 or more Minutes | 75 (5.3%) | 6 (0.6%) |
Time of Departure to Work by Sex in Blackwell
The most frequent times of departure to work in Blackwell are 7:00 AM to 7:29 AM (249, 17.7%) for males and 7:30 AM to 7:59 AM (214, 20.5%) for females.
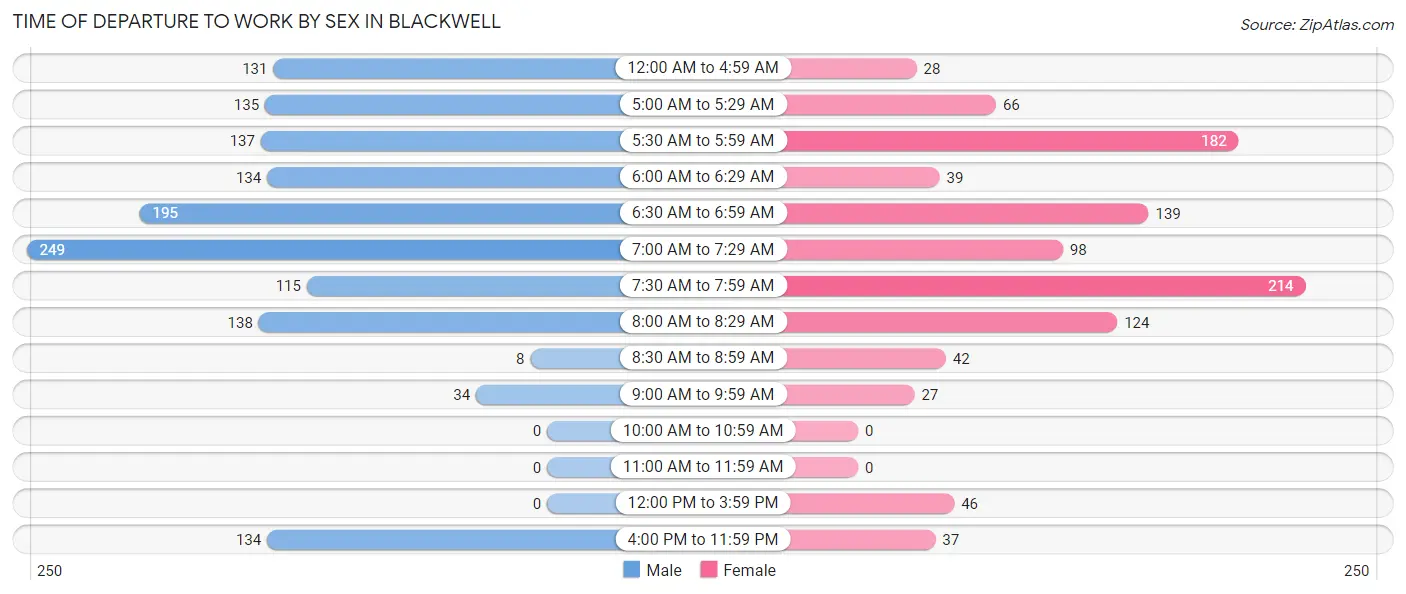
| Time of Departure | Male | Female |
| 12:00 AM to 4:59 AM | 131 (9.3%) | 28 (2.7%) |
| 5:00 AM to 5:29 AM | 135 (9.6%) | 66 (6.3%) |
| 5:30 AM to 5:59 AM | 137 (9.7%) | 182 (17.5%) |
| 6:00 AM to 6:29 AM | 134 (9.5%) | 39 (3.7%) |
| 6:30 AM to 6:59 AM | 195 (13.8%) | 139 (13.3%) |
| 7:00 AM to 7:29 AM | 249 (17.7%) | 98 (9.4%) |
| 7:30 AM to 7:59 AM | 115 (8.2%) | 214 (20.5%) |
| 8:00 AM to 8:29 AM | 138 (9.8%) | 124 (11.9%) |
| 8:30 AM to 8:59 AM | 8 (0.6%) | 42 (4.0%) |
| 9:00 AM to 9:59 AM | 34 (2.4%) | 27 (2.6%) |
| 10:00 AM to 10:59 AM | 0 (0.0%) | 0 (0.0%) |
| 11:00 AM to 11:59 AM | 0 (0.0%) | 0 (0.0%) |
| 12:00 PM to 3:59 PM | 0 (0.0%) | 46 (4.4%) |
| 4:00 PM to 11:59 PM | 134 (9.5%) | 37 (3.5%) |
| Total | 1,410 (100.0%) | 1,042 (100.0%) |
Housing Occupancy in Blackwell
Occupancy by Ownership in Blackwell
Of the total 2,296 dwellings in Blackwell, owner-occupied units account for 1,548 (67.4%), while renter-occupied units make up 748 (32.6%).
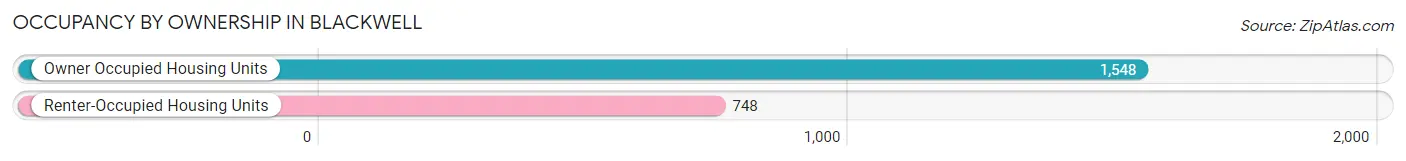
| Occupancy | # Housing Units | % Housing Units |
| Owner Occupied Housing Units | 1,548 | 67.4% |
| Renter-Occupied Housing Units | 748 | 32.6% |
| Total Occupied Housing Units | 2,296 | 100.0% |
Occupancy by Household Size in Blackwell
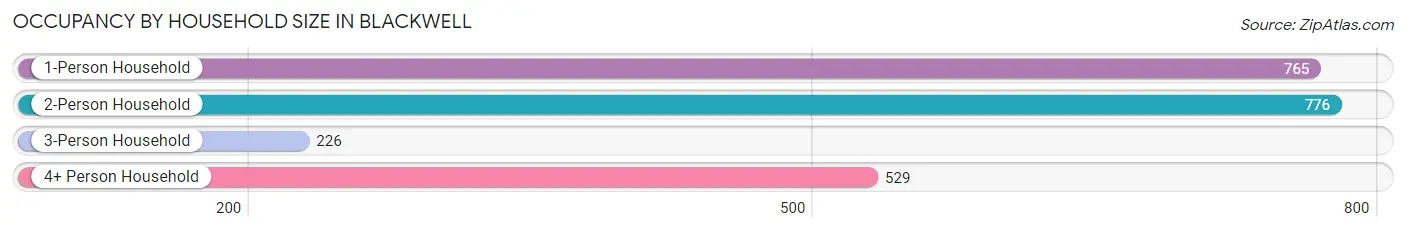
| Household Size | # Housing Units | % Housing Units |
| 1-Person Household | 765 | 33.3% |
| 2-Person Household | 776 | 33.8% |
| 3-Person Household | 226 | 9.8% |
| 4+ Person Household | 529 | 23.0% |
| Total Housing Units | 2,296 | 100.0% |
Occupancy by Ownership by Household Size in Blackwell
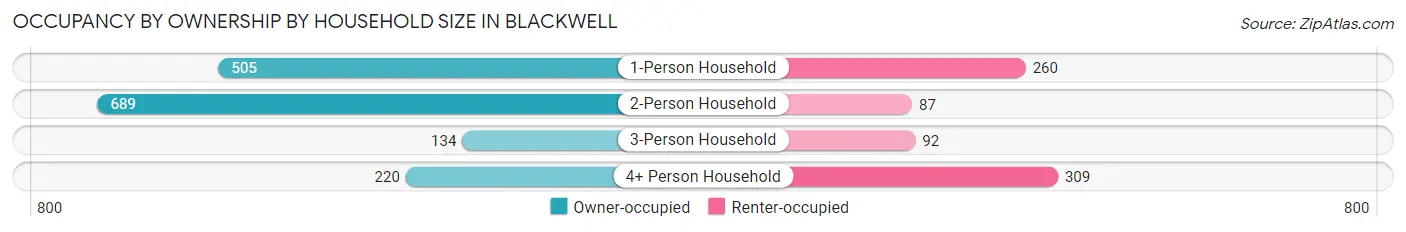
| Household Size | Owner-occupied | Renter-occupied |
| 1-Person Household | 505 (66.0%) | 260 (34.0%) |
| 2-Person Household | 689 (88.8%) | 87 (11.2%) |
| 3-Person Household | 134 (59.3%) | 92 (40.7%) |
| 4+ Person Household | 220 (41.6%) | 309 (58.4%) |
| Total Housing Units | 1,548 (67.4%) | 748 (32.6%) |
Occupancy by Educational Attainment in Blackwell
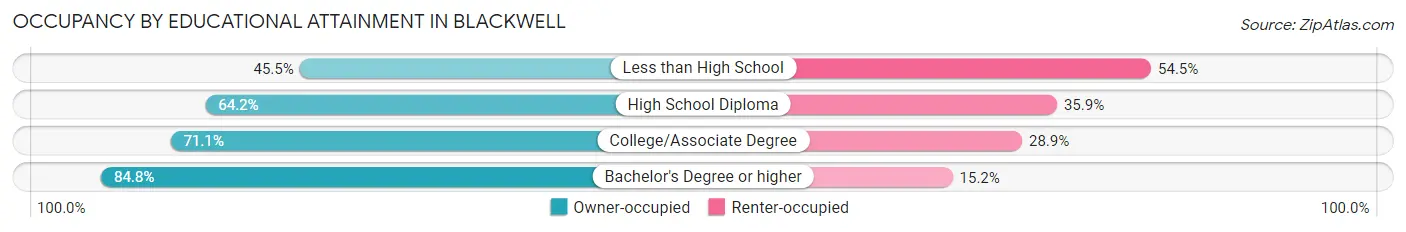
| Household Size | Owner-occupied | Renter-occupied |
| Less than High School | 106 (45.5%) | 127 (54.5%) |
| High School Diploma | 619 (64.1%) | 346 (35.8%) |
| College/Associate Degree | 560 (71.1%) | 228 (28.9%) |
| Bachelor's Degree or higher | 263 (84.8%) | 47 (15.2%) |
Occupancy by Age of Householder in Blackwell
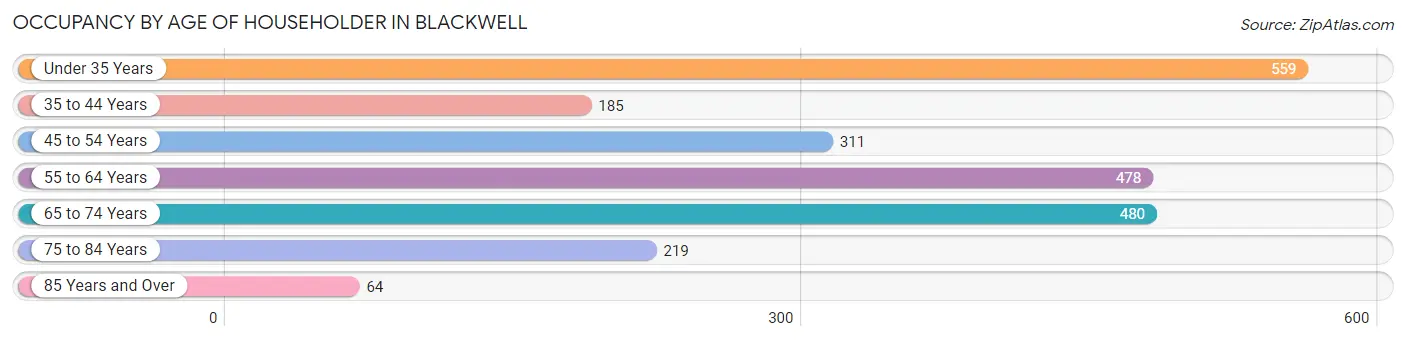
| Age Bracket | # Households | % Households |
| Under 35 Years | 559 | 24.3% |
| 35 to 44 Years | 185 | 8.1% |
| 45 to 54 Years | 311 | 13.6% |
| 55 to 64 Years | 478 | 20.8% |
| 65 to 74 Years | 480 | 20.9% |
| 75 to 84 Years | 219 | 9.5% |
| 85 Years and Over | 64 | 2.8% |
| Total | 2,296 | 100.0% |
Housing Finances in Blackwell
Median Income by Occupancy in Blackwell
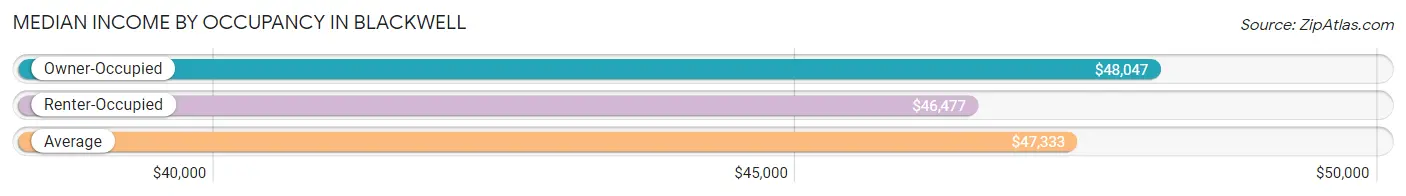
| Occupancy Type | # Households | Median Income |
| Owner-Occupied | 1,548 (67.4%) | $48,047 |
| Renter-Occupied | 748 (32.6%) | $46,477 |
| Average | 2,296 (100.0%) | $47,333 |
Occupancy by Householder Income Bracket in Blackwell
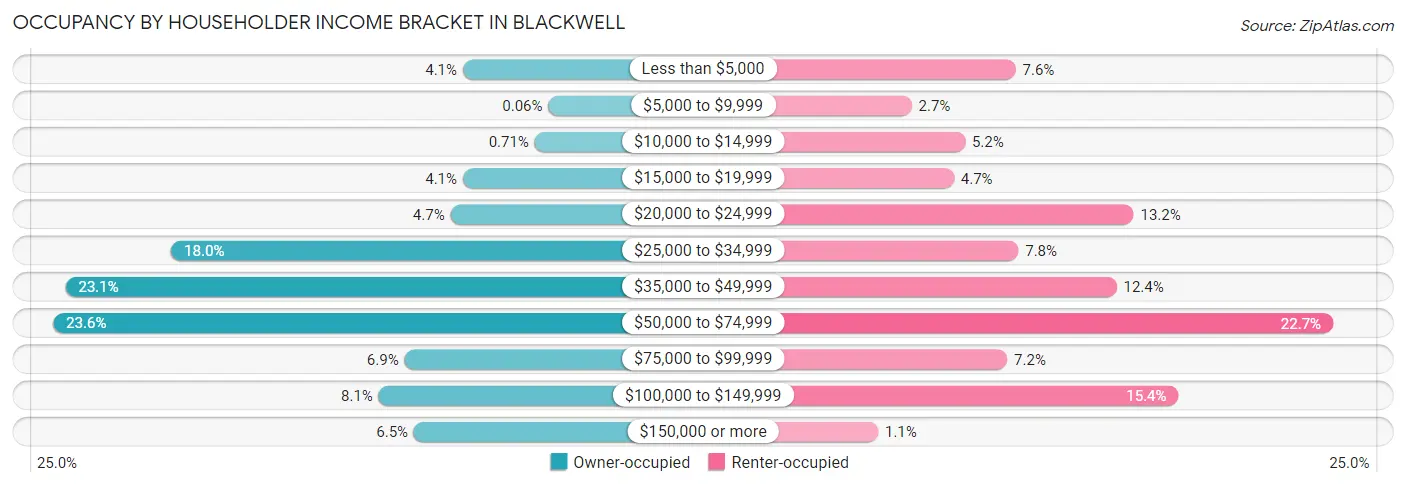
| Income Bracket | Owner-occupied | Renter-occupied |
| Less than $5,000 | 64 (4.1%) | 57 (7.6%) |
| $5,000 to $9,999 | 1 (0.1%) | 20 (2.7%) |
| $10,000 to $14,999 | 11 (0.7%) | 39 (5.2%) |
| $15,000 to $19,999 | 64 (4.1%) | 35 (4.7%) |
| $20,000 to $24,999 | 73 (4.7%) | 99 (13.2%) |
| $25,000 to $34,999 | 279 (18.0%) | 58 (7.7%) |
| $35,000 to $49,999 | 357 (23.1%) | 93 (12.4%) |
| $50,000 to $74,999 | 366 (23.6%) | 170 (22.7%) |
| $75,000 to $99,999 | 107 (6.9%) | 54 (7.2%) |
| $100,000 to $149,999 | 126 (8.1%) | 115 (15.4%) |
| $150,000 or more | 100 (6.5%) | 8 (1.1%) |
| Total | 1,548 (100.0%) | 748 (100.0%) |
Monthly Housing Cost Tiers in Blackwell
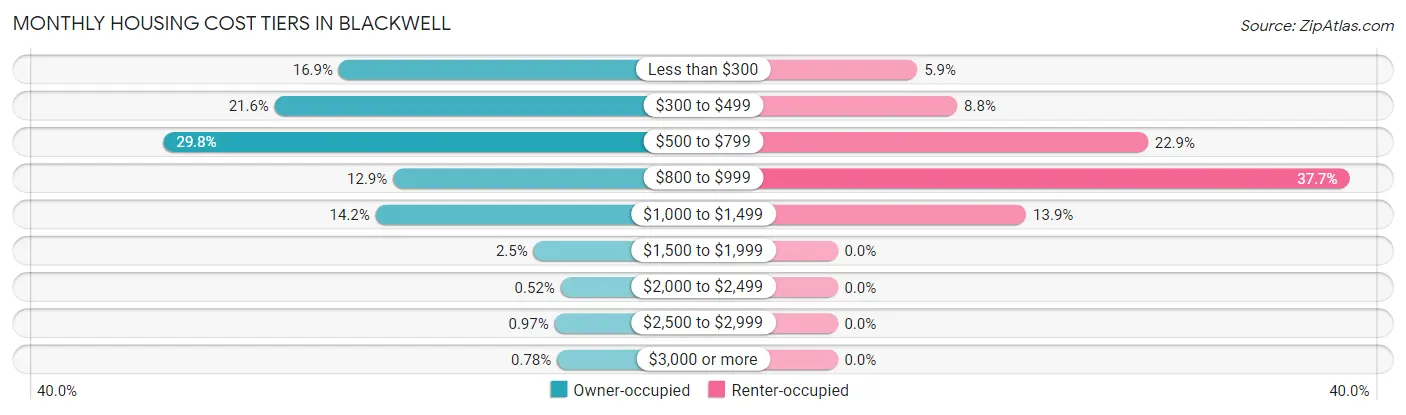
| Monthly Cost | Owner-occupied | Renter-occupied |
| Less than $300 | 261 (16.9%) | 44 (5.9%) |
| $300 to $499 | 334 (21.6%) | 66 (8.8%) |
| $500 to $799 | 461 (29.8%) | 171 (22.9%) |
| $800 to $999 | 199 (12.9%) | 282 (37.7%) |
| $1,000 to $1,499 | 219 (14.1%) | 104 (13.9%) |
| $1,500 to $1,999 | 39 (2.5%) | 0 (0.0%) |
| $2,000 to $2,499 | 8 (0.5%) | 0 (0.0%) |
| $2,500 to $2,999 | 15 (1.0%) | 0 (0.0%) |
| $3,000 or more | 12 (0.8%) | 0 (0.0%) |
| Total | 1,548 (100.0%) | 748 (100.0%) |
Physical Housing Characteristics in Blackwell
Housing Structures in Blackwell
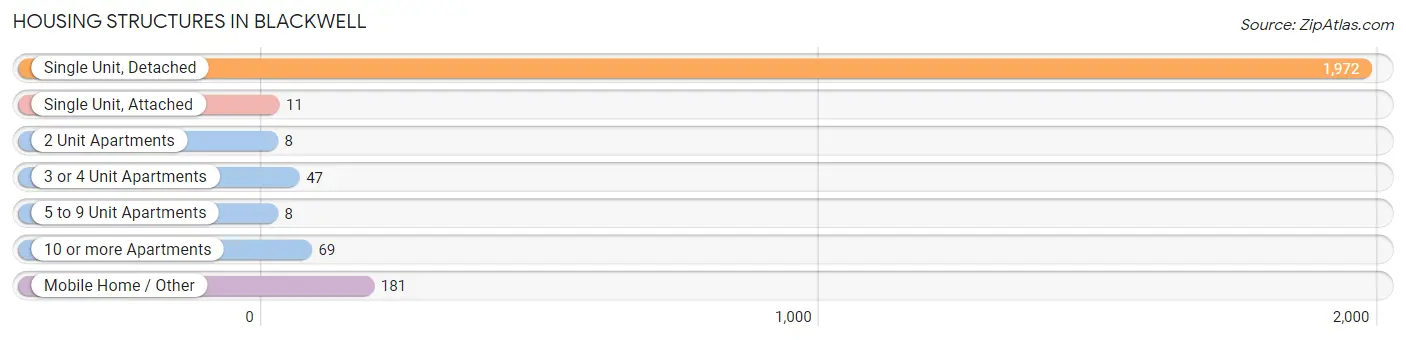
| Structure Type | # Housing Units | % Housing Units |
| Single Unit, Detached | 1,972 | 85.9% |
| Single Unit, Attached | 11 | 0.5% |
| 2 Unit Apartments | 8 | 0.4% |
| 3 or 4 Unit Apartments | 47 | 2.1% |
| 5 to 9 Unit Apartments | 8 | 0.4% |
| 10 or more Apartments | 69 | 3.0% |
| Mobile Home / Other | 181 | 7.9% |
| Total | 2,296 | 100.0% |
Housing Structures by Occupancy in Blackwell
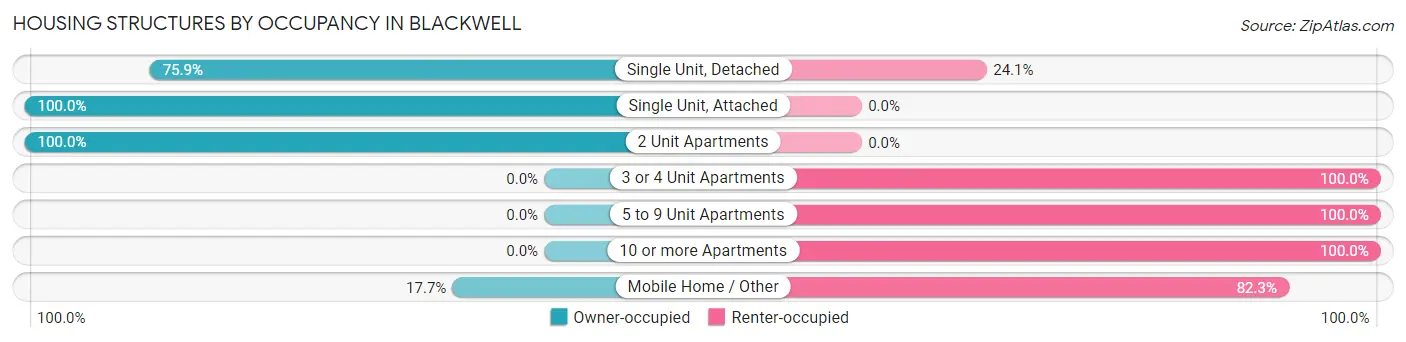
| Structure Type | Owner-occupied | Renter-occupied |
| Single Unit, Detached | 1,497 (75.9%) | 475 (24.1%) |
| Single Unit, Attached | 11 (100.0%) | 0 (0.0%) |
| 2 Unit Apartments | 8 (100.0%) | 0 (0.0%) |
| 3 or 4 Unit Apartments | 0 (0.0%) | 47 (100.0%) |
| 5 to 9 Unit Apartments | 0 (0.0%) | 8 (100.0%) |
| 10 or more Apartments | 0 (0.0%) | 69 (100.0%) |
| Mobile Home / Other | 32 (17.7%) | 149 (82.3%) |
| Total | 1,548 (67.4%) | 748 (32.6%) |
Housing Structures by Number of Rooms in Blackwell
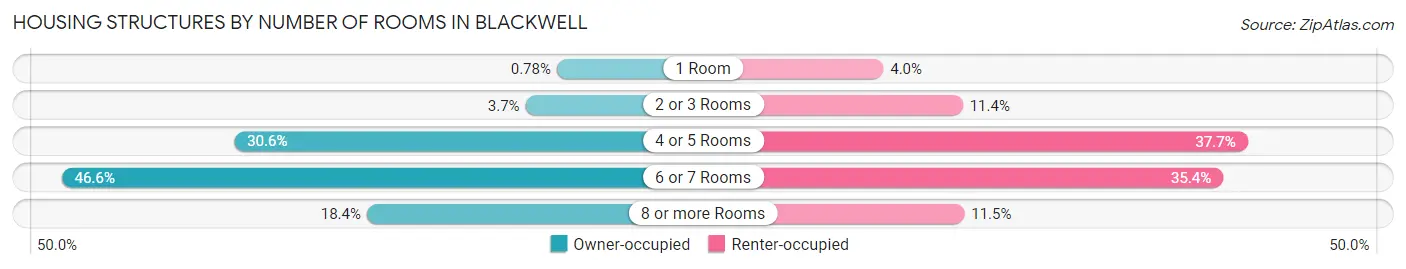
| Number of Rooms | Owner-occupied | Renter-occupied |
| 1 Room | 12 (0.8%) | 30 (4.0%) |
| 2 or 3 Rooms | 57 (3.7%) | 85 (11.4%) |
| 4 or 5 Rooms | 474 (30.6%) | 282 (37.7%) |
| 6 or 7 Rooms | 721 (46.6%) | 265 (35.4%) |
| 8 or more Rooms | 284 (18.3%) | 86 (11.5%) |
| Total | 1,548 (100.0%) | 748 (100.0%) |
Housing Structure by Heating Type in Blackwell
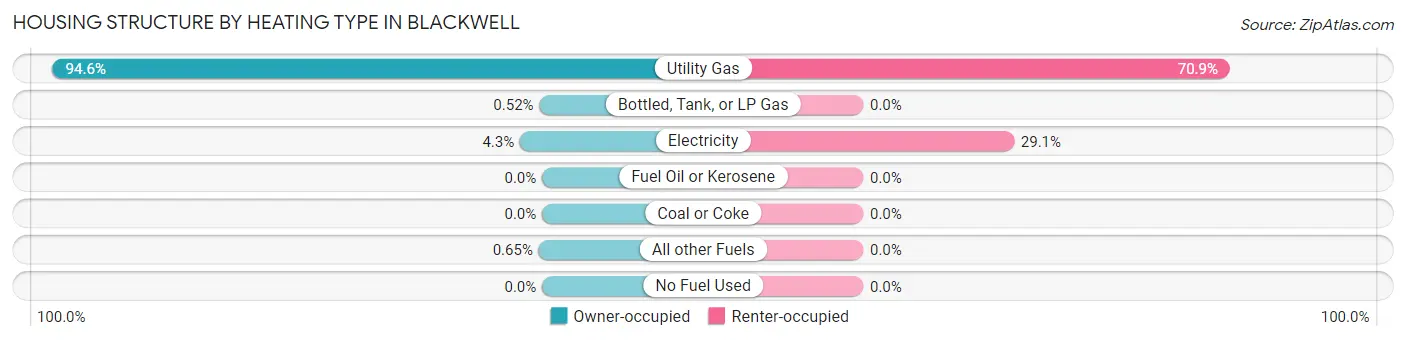
| Heating Type | Owner-occupied | Renter-occupied |
| Utility Gas | 1,464 (94.6%) | 530 (70.9%) |
| Bottled, Tank, or LP Gas | 8 (0.5%) | 0 (0.0%) |
| Electricity | 66 (4.3%) | 218 (29.1%) |
| Fuel Oil or Kerosene | 0 (0.0%) | 0 (0.0%) |
| Coal or Coke | 0 (0.0%) | 0 (0.0%) |
| All other Fuels | 10 (0.6%) | 0 (0.0%) |
| No Fuel Used | 0 (0.0%) | 0 (0.0%) |
| Total | 1,548 (100.0%) | 748 (100.0%) |
Household Vehicle Usage in Blackwell
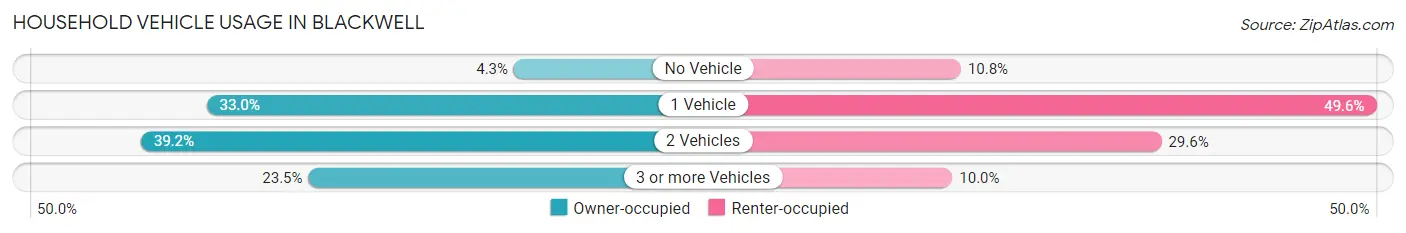
| Vehicles per Household | Owner-occupied | Renter-occupied |
| No Vehicle | 67 (4.3%) | 81 (10.8%) |
| 1 Vehicle | 511 (33.0%) | 371 (49.6%) |
| 2 Vehicles | 606 (39.2%) | 221 (29.5%) |
| 3 or more Vehicles | 364 (23.5%) | 75 (10.0%) |
| Total | 1,548 (100.0%) | 748 (100.0%) |
Real Estate & Mortgages in Blackwell
Real Estate and Mortgage Overview in Blackwell
| Characteristic | Without Mortgage | With Mortgage |
| Housing Units | 1,048 | 500 |
| Median Property Value | $78,800 | $85,000 |
| Median Household Income | $44,628 | $41 |
| Monthly Housing Costs | $464 | $12 |
| Real Estate Taxes | $460 | $0 |
Property Value by Mortgage Status in Blackwell
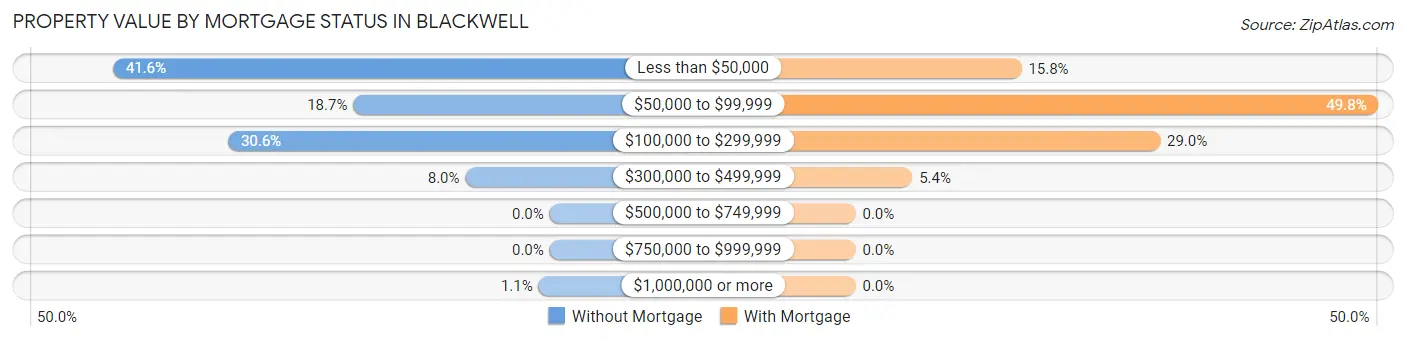
| Property Value | Without Mortgage | With Mortgage |
| Less than $50,000 | 436 (41.6%) | 79 (15.8%) |
| $50,000 to $99,999 | 196 (18.7%) | 249 (49.8%) |
| $100,000 to $299,999 | 321 (30.6%) | 145 (29.0%) |
| $300,000 to $499,999 | 84 (8.0%) | 27 (5.4%) |
| $500,000 to $749,999 | 0 (0.0%) | 0 (0.0%) |
| $750,000 to $999,999 | 0 (0.0%) | 0 (0.0%) |
| $1,000,000 or more | 11 (1.1%) | 0 (0.0%) |
| Total | 1,048 (100.0%) | 500 (100.0%) |
Household Income by Mortgage Status in Blackwell
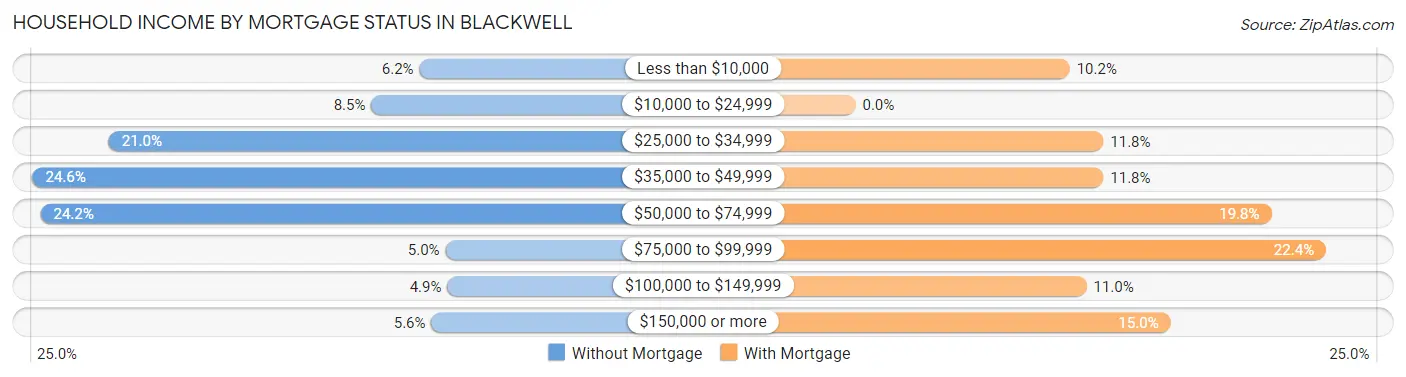
| Household Income | Without Mortgage | With Mortgage |
| Less than $10,000 | 65 (6.2%) | 51 (10.2%) |
| $10,000 to $24,999 | 89 (8.5%) | 0 (0.0%) |
| $25,000 to $34,999 | 220 (21.0%) | 59 (11.8%) |
| $35,000 to $49,999 | 258 (24.6%) | 59 (11.8%) |
| $50,000 to $74,999 | 254 (24.2%) | 99 (19.8%) |
| $75,000 to $99,999 | 52 (5.0%) | 112 (22.4%) |
| $100,000 to $149,999 | 51 (4.9%) | 55 (11.0%) |
| $150,000 or more | 59 (5.6%) | 75 (15.0%) |
| Total | 1,048 (100.0%) | 500 (100.0%) |
Property Value to Household Income Ratio in Blackwell
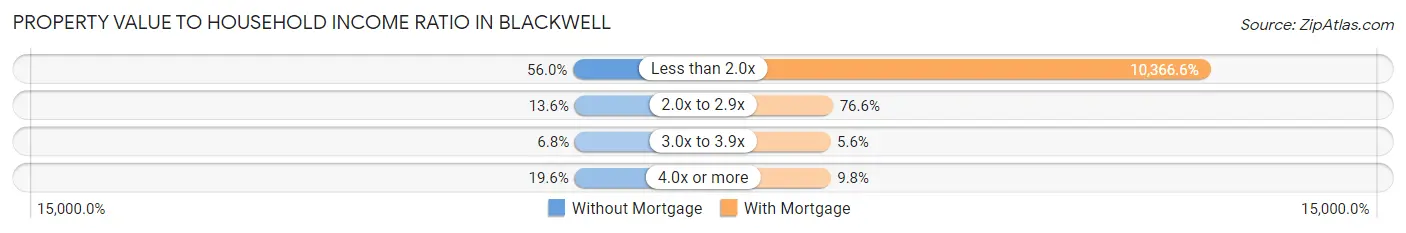
| Value-to-Income Ratio | Without Mortgage | With Mortgage |
| Less than 2.0x | 587 (56.0%) | 51,833 (10,366.6%) |
| 2.0x to 2.9x | 142 (13.6%) | 383 (76.6%) |
| 3.0x to 3.9x | 71 (6.8%) | 28 (5.6%) |
| 4.0x or more | 205 (19.6%) | 49 (9.8%) |
| Total | 1,048 (100.0%) | 500 (100.0%) |
Real Estate Taxes by Mortgage Status in Blackwell
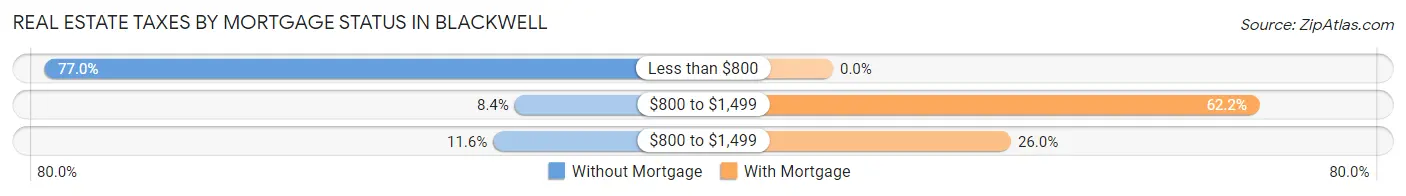
| Property Taxes | Without Mortgage | With Mortgage |
| Less than $800 | 807 (77.0%) | 0 (0.0%) |
| $800 to $1,499 | 88 (8.4%) | 311 (62.2%) |
| $800 to $1,499 | 121 (11.6%) | 130 (26.0%) |
| Total | 1,048 (100.0%) | 500 (100.0%) |
Health & Disability in Blackwell
Health Insurance Coverage by Age in Blackwell
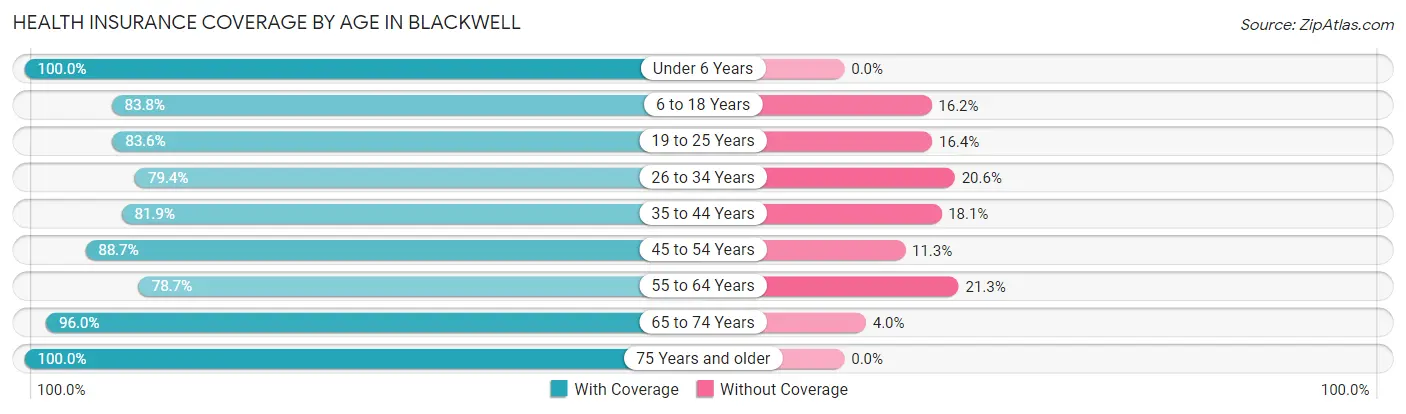
| Age Bracket | With Coverage | Without Coverage |
| Under 6 Years | 496 (100.0%) | 0 (0.0%) |
| 6 to 18 Years | 1,012 (83.8%) | 196 (16.2%) |
| 19 to 25 Years | 368 (83.6%) | 72 (16.4%) |
| 26 to 34 Years | 582 (79.4%) | 151 (20.6%) |
| 35 to 44 Years | 458 (81.9%) | 101 (18.1%) |
| 45 to 54 Years | 478 (88.7%) | 61 (11.3%) |
| 55 to 64 Years | 661 (78.7%) | 179 (21.3%) |
| 65 to 74 Years | 719 (96.0%) | 30 (4.0%) |
| 75 Years and older | 501 (100.0%) | 0 (0.0%) |
| Total | 5,275 (87.0%) | 790 (13.0%) |
Health Insurance Coverage by Citizenship Status in Blackwell
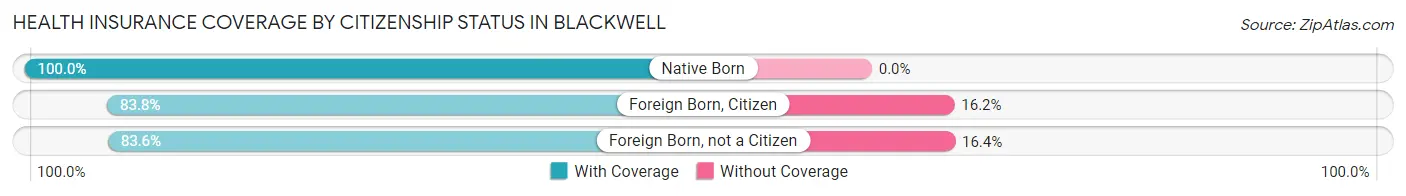
| Citizenship Status | With Coverage | Without Coverage |
| Native Born | 496 (100.0%) | 0 (0.0%) |
| Foreign Born, Citizen | 1,012 (83.8%) | 196 (16.2%) |
| Foreign Born, not a Citizen | 368 (83.6%) | 72 (16.4%) |
Health Insurance Coverage by Household Income in Blackwell
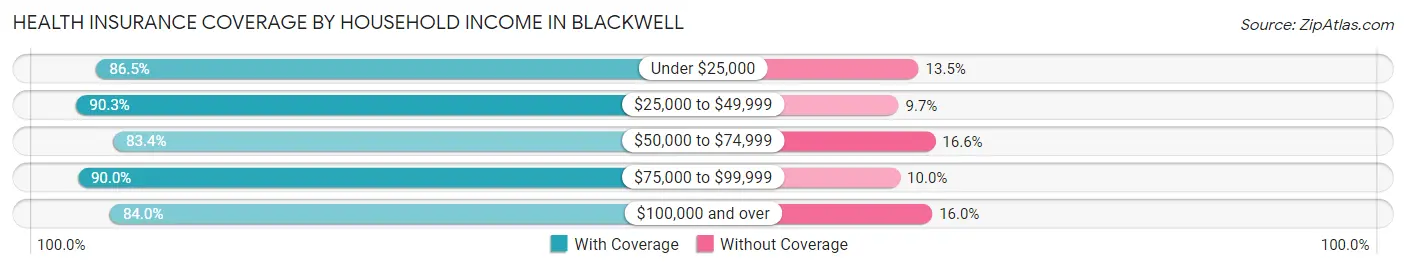
| Household Income | With Coverage | Without Coverage |
| Under $25,000 | 585 (86.5%) | 91 (13.5%) |
| $25,000 to $49,999 | 1,962 (90.3%) | 211 (9.7%) |
| $50,000 to $74,999 | 985 (83.4%) | 196 (16.6%) |
| $75,000 to $99,999 | 504 (90.0%) | 56 (10.0%) |
| $100,000 and over | 1,239 (84.0%) | 236 (16.0%) |
Public vs Private Health Insurance Coverage by Age in Blackwell
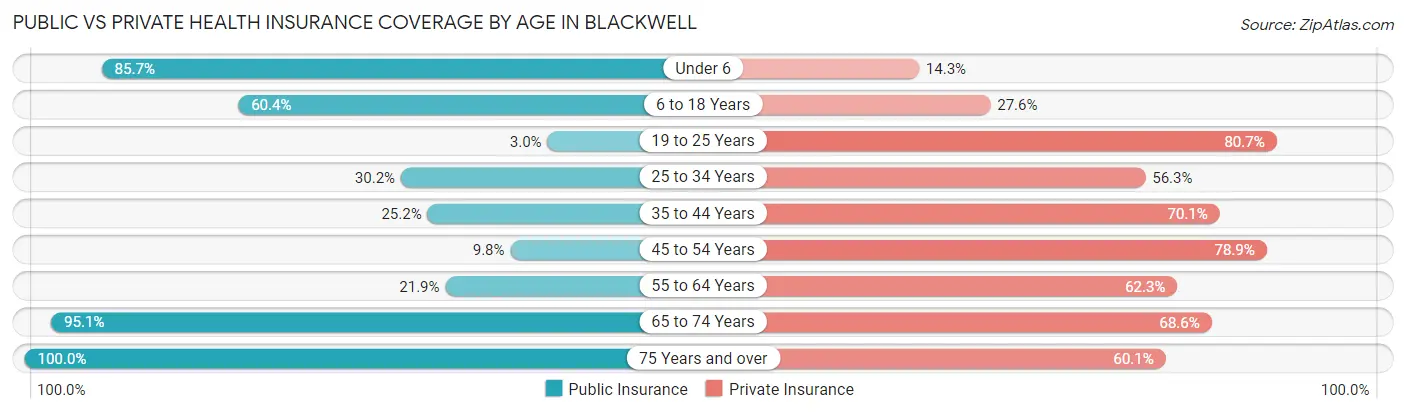
| Age Bracket | Public Insurance | Private Insurance |
| Under 6 | 425 (85.7%) | 71 (14.3%) |
| 6 to 18 Years | 729 (60.4%) | 333 (27.6%) |
| 19 to 25 Years | 13 (2.9%) | 355 (80.7%) |
| 25 to 34 Years | 221 (30.1%) | 413 (56.3%) |
| 35 to 44 Years | 141 (25.2%) | 392 (70.1%) |
| 45 to 54 Years | 53 (9.8%) | 425 (78.8%) |
| 55 to 64 Years | 184 (21.9%) | 523 (62.3%) |
| 65 to 74 Years | 712 (95.1%) | 514 (68.6%) |
| 75 Years and over | 501 (100.0%) | 301 (60.1%) |
| Total | 2,979 (49.1%) | 3,327 (54.9%) |
Disability Status by Sex by Age in Blackwell
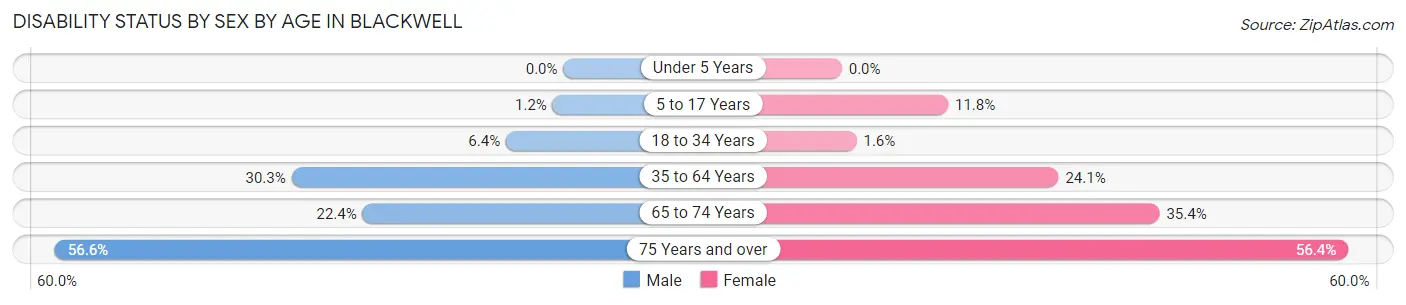
| Age Bracket | Male | Female |
| Under 5 Years | 0 (0.0%) | 0 (0.0%) |
| 5 to 17 Years | 8 (1.2%) | 55 (11.8%) |
| 18 to 34 Years | 46 (6.4%) | 9 (1.6%) |
| 35 to 64 Years | 283 (30.3%) | 242 (24.1%) |
| 65 to 74 Years | 91 (22.4%) | 121 (35.4%) |
| 75 Years and over | 124 (56.6%) | 159 (56.4%) |
Disability Class by Sex by Age in Blackwell
Disability Class: Hearing Difficulty
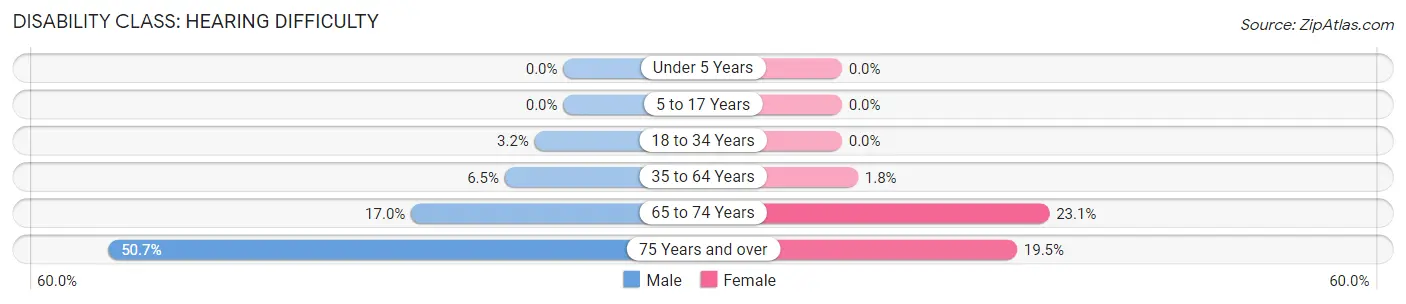
| Age Bracket | Male | Female |
| Under 5 Years | 0 (0.0%) | 0 (0.0%) |
| 5 to 17 Years | 0 (0.0%) | 0 (0.0%) |
| 18 to 34 Years | 23 (3.2%) | 0 (0.0%) |
| 35 to 64 Years | 61 (6.5%) | 18 (1.8%) |
| 65 to 74 Years | 69 (17.0%) | 79 (23.1%) |
| 75 Years and over | 111 (50.7%) | 55 (19.5%) |
Disability Class: Vision Difficulty
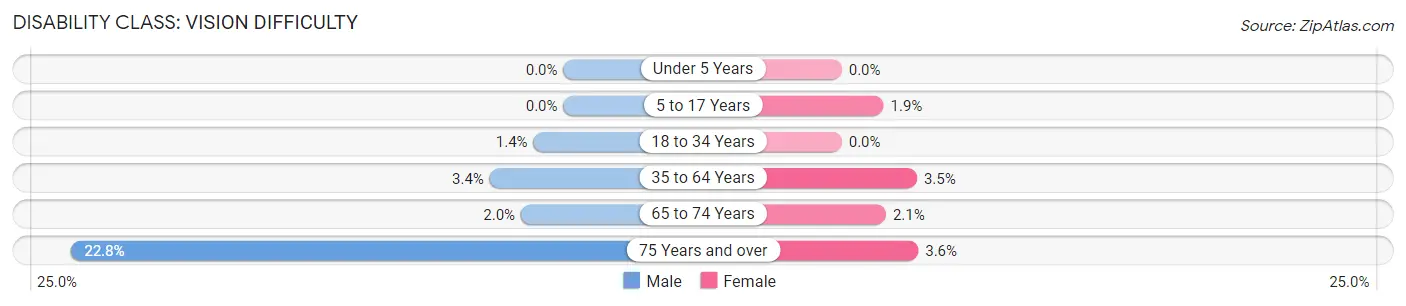
| Age Bracket | Male | Female |
| Under 5 Years | 0 (0.0%) | 0 (0.0%) |
| 5 to 17 Years | 0 (0.0%) | 9 (1.9%) |
| 18 to 34 Years | 10 (1.4%) | 0 (0.0%) |
| 35 to 64 Years | 32 (3.4%) | 35 (3.5%) |
| 65 to 74 Years | 8 (2.0%) | 7 (2.1%) |
| 75 Years and over | 50 (22.8%) | 10 (3.5%) |
Disability Class: Cognitive Difficulty
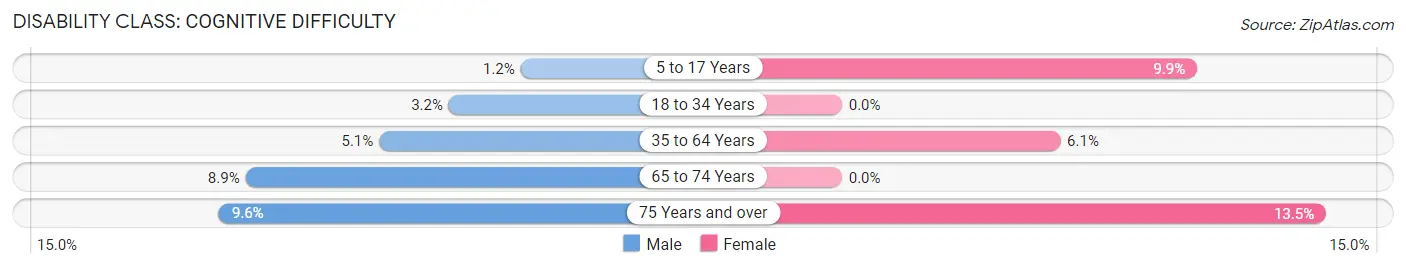
| Age Bracket | Male | Female |
| 5 to 17 Years | 8 (1.2%) | 46 (9.9%) |
| 18 to 34 Years | 23 (3.2%) | 0 (0.0%) |
| 35 to 64 Years | 48 (5.1%) | 61 (6.1%) |
| 65 to 74 Years | 36 (8.8%) | 0 (0.0%) |
| 75 Years and over | 21 (9.6%) | 38 (13.5%) |
Disability Class: Ambulatory Difficulty
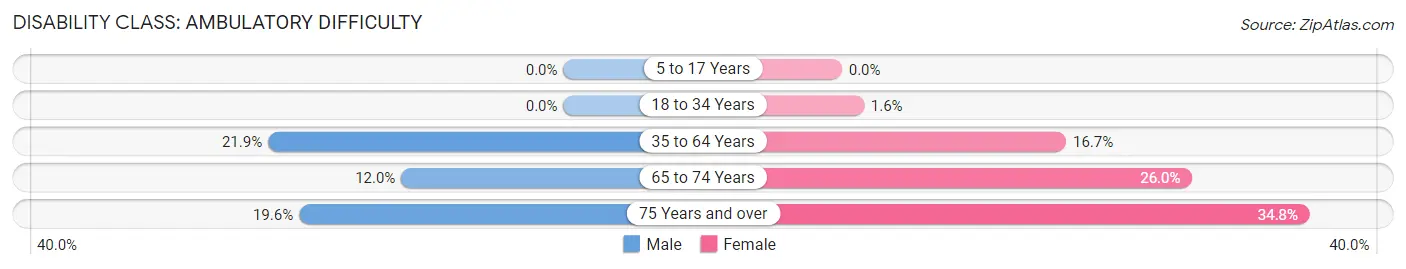
| Age Bracket | Male | Female |
| 5 to 17 Years | 0 (0.0%) | 0 (0.0%) |
| 18 to 34 Years | 0 (0.0%) | 9 (1.6%) |
| 35 to 64 Years | 205 (21.9%) | 167 (16.7%) |
| 65 to 74 Years | 49 (12.0%) | 89 (26.0%) |
| 75 Years and over | 43 (19.6%) | 98 (34.7%) |
Disability Class: Self-Care Difficulty
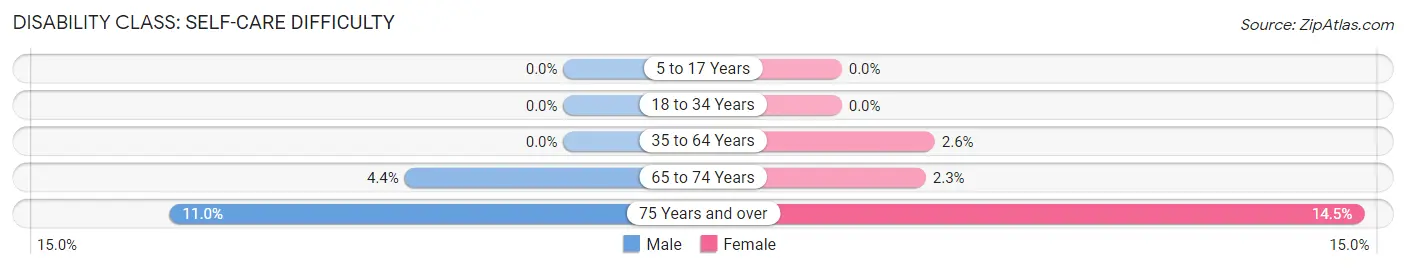
| Age Bracket | Male | Female |
| 5 to 17 Years | 0 (0.0%) | 0 (0.0%) |
| 18 to 34 Years | 0 (0.0%) | 0 (0.0%) |
| 35 to 64 Years | 0 (0.0%) | 26 (2.6%) |
| 65 to 74 Years | 18 (4.4%) | 8 (2.3%) |
| 75 Years and over | 24 (11.0%) | 41 (14.5%) |
Technology Access in Blackwell
Computing Device Access in Blackwell
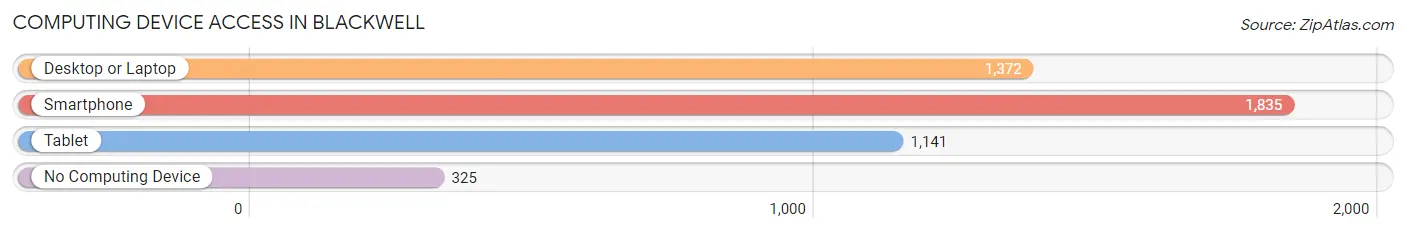
| Device Type | # Households | % Households |
| Desktop or Laptop | 1,372 | 59.8% |
| Smartphone | 1,835 | 79.9% |
| Tablet | 1,141 | 49.7% |
| No Computing Device | 325 | 14.2% |
| Total | 2,296 | 100.0% |
Internet Access in Blackwell
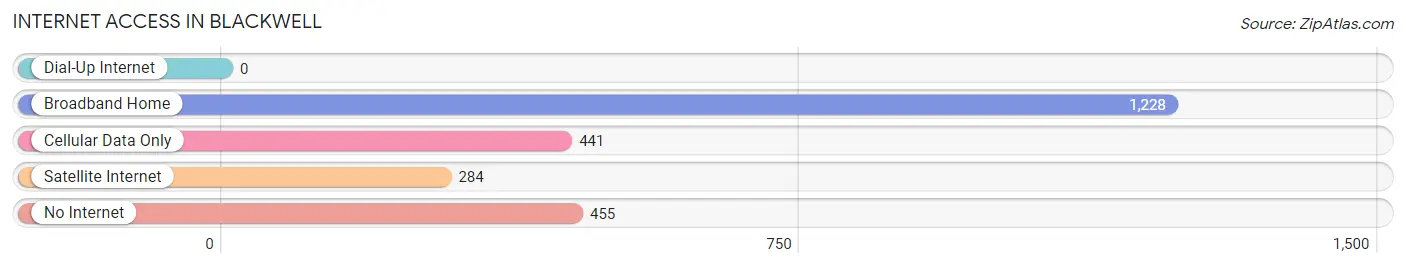
| Internet Type | # Households | % Households |
| Dial-Up Internet | 0 | 0.0% |
| Broadband Home | 1,228 | 53.5% |
| Cellular Data Only | 441 | 19.2% |
| Satellite Internet | 284 | 12.4% |
| No Internet | 455 | 19.8% |
| Total | 2,296 | 100.0% |
Blackwell Summary
Blackwell is a city located in Kay County, Oklahoma, United States. It is situated along the Arkansas River, approximately 50 miles north of Oklahoma City. The population was 7,092 at the 2010 census, an increase of 8.2 percent from 6,541 at the 2000 census.
History
The area that is now Blackwell was first settled in the late 1800s by ranchers and farmers. The town was founded in 1901 when the Blackwell, Enid and Southwestern Railway was built through the area. The town was named after J.D. Blackwell, a railroad official. The town was incorporated in 1904.
In the early 1900s, Blackwell was a major agricultural center, with cotton, corn, and wheat being the main crops. The town also had a large livestock industry. In the 1920s, oil was discovered in the area, and Blackwell became a major oil-producing center. The oil industry has continued to be a major part of the local economy.
Geography
Blackwell is located at 36°45'25" North, 97°25'45" West (36.756944, -97.429167). According to the United States Census Bureau, the city has a total area of 5.2 square miles (13.4 km2), all land.
Economy
The economy of Blackwell is largely based on agriculture and oil production. The town is home to several large agricultural businesses, including a cotton gin, a grain elevator, and a feed mill. The oil industry is also a major part of the local economy, with several oil and gas companies operating in the area.
The town is also home to several manufacturing companies, including a plastics plant, a metal fabrication plant, and a food processing plant. The town also has a large retail sector, with several stores and restaurants.
Demographics
As of the census of 2000, there were 6,541 people, 2,541 households, and 1,717 families residing in the city. The population density was 1,250.3 people per square mile (482.3/km2). There were 2,845 housing units at an average density of 545.3 per square mile (210.7/km2). The racial makeup of the city was 81.2% White, 0.7% African American, 11.2% Native American, 0.3% Asian, 0.1% Pacific Islander, 4.2% from other races, and 2.3% from two or more races. Hispanic or Latino of any race were 7.2% of the population.
There were 2,541 households, out of which 32.2% had children under the age of 18 living with them, 51.2% were married couples living together, 12.2% had a female householder with no husband present, and 32.2% were non-families. 28.2% of all households were made up of individuals, and 14.2% had someone living alone who was 65 years of age or older. The average household size was 2.50 and the average family size was 3.05.
In the city, the population was spread out, with 27.2% under the age of 18, 8.2% from 18 to 24, 25.2% from 25 to 44, 22.2% from 45 to 64, and 17.2% who were 65 years of age or older. The median age was 37 years. For every 100 females, there were 91.2 males. For every 100 females age 18 and over, there were 86.2 males.
The median income for a household in the city was $30,938, and the median income for a family was $37,813. Males had a median income of $30,938 versus $20,938 for females. The per capita income for the city was $15,938. About 11.2% of families and 14.2% of the population were below the poverty line, including 19.2% of those under age 18 and 11.2% of those age 65 or over.
Common Questions
What is Per Capita Income in Blackwell?
Per Capita income in Blackwell is $24,163.
What is the Median Family Income in Blackwell?
Median Family Income in Blackwell is $48,203.
What is the Median Household income in Blackwell?
Median Household Income in Blackwell is $47,333.
What is Income or Wage Gap in Blackwell?
Income or Wage Gap in Blackwell is 42.9%.
Women in Blackwell earn 57.1 cents for every dollar earned by a man.
What is Inequality or Gini Index in Blackwell?
Inequality or Gini Index in Blackwell is 0.42.
What is the Total Population of Blackwell?
Total Population of Blackwell is 6,132.
What is the Total Male Population of Blackwell?
Total Male Population of Blackwell is 3,198.
What is the Total Female Population of Blackwell?
Total Female Population of Blackwell is 2,934.
What is the Ratio of Males per 100 Females in Blackwell?
There are 109.00 Males per 100 Females in Blackwell.
What is the Ratio of Females per 100 Males in Blackwell?
There are 91.74 Females per 100 Males in Blackwell.
What is the Median Population Age in Blackwell?
Median Population Age in Blackwell is 37.2 Years.
What is the Average Family Size in Blackwell
Average Family Size in Blackwell is 3.4 People.
What is the Average Household Size in Blackwell
Average Household Size in Blackwell is 2.6 People.
How Large is the Labor Force in Blackwell?
There are 2,766 People in the Labor Forcein in Blackwell.
What is the Percentage of People in the Labor Force in Blackwell?
59.4% of People are in the Labor Force in Blackwell.
What is the Unemployment Rate in Blackwell?
Unemployment Rate in Blackwell is 6.6%.