Binger, OK Map & Demographics
Binger Map
Binger Overview
$33,508
PER CAPITA INCOME
$64,531
AVG FAMILY INCOME
$42,000
AVG HOUSEHOLD INCOME
54.7%
WAGE / INCOME GAP [ % ]
45.3¢/ $1
WAGE / INCOME GAP [ $ ]
0.54
INEQUALITY / GINI INDEX
478
TOTAL POPULATION
228
MALE POPULATION
250
FEMALE POPULATION
91.20
MALES / 100 FEMALES
109.65
FEMALES / 100 MALES
54.5
MEDIAN AGE
2.6
AVG FAMILY SIZE
2.1
AVG HOUSEHOLD SIZE
188
LABOR FORCE [ PEOPLE ]
44.9%
PERCENT IN LABOR FORCE
6.9%
UNEMPLOYMENT RATE
Binger Zip Codes
Binger Area Codes
Income in Binger
Income Overview in Binger
Per Capita Income in Binger is $33,508, while median incomes of families and households are $64,531 and $42,000 respectively.
| Characteristic | Number | Measure |
| Per Capita Income | 478 | $33,508 |
| Median Family Income | 137 | $64,531 |
| Mean Family Income | 137 | $97,119 |
| Median Household Income | 208 | $42,000 |
| Mean Household Income | 208 | $77,579 |
| Income Deficit | 137 | $0 |
| Wage / Income Gap (%) | 478 | 54.74% |
| Wage / Income Gap ($) | 478 | 45.26¢ per $1 |
| Gini / Inequality Index | 478 | 0.54 |
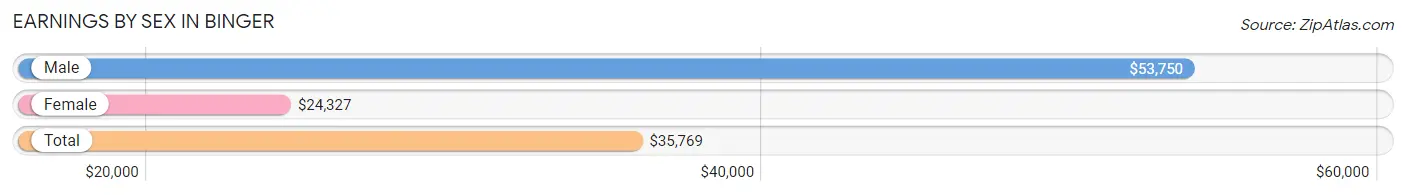
Earnings by Sex in Binger
Average Earnings in Binger are $35,769, $53,750 for men and $24,327 for women, a difference of 54.7%.
| Sex | Number | Average Earnings |
| Male | 103 (52.5%) | $53,750 |
| Female | 93 (47.4%) | $24,327 |
| Total | 196 (100.0%) | $35,769 |
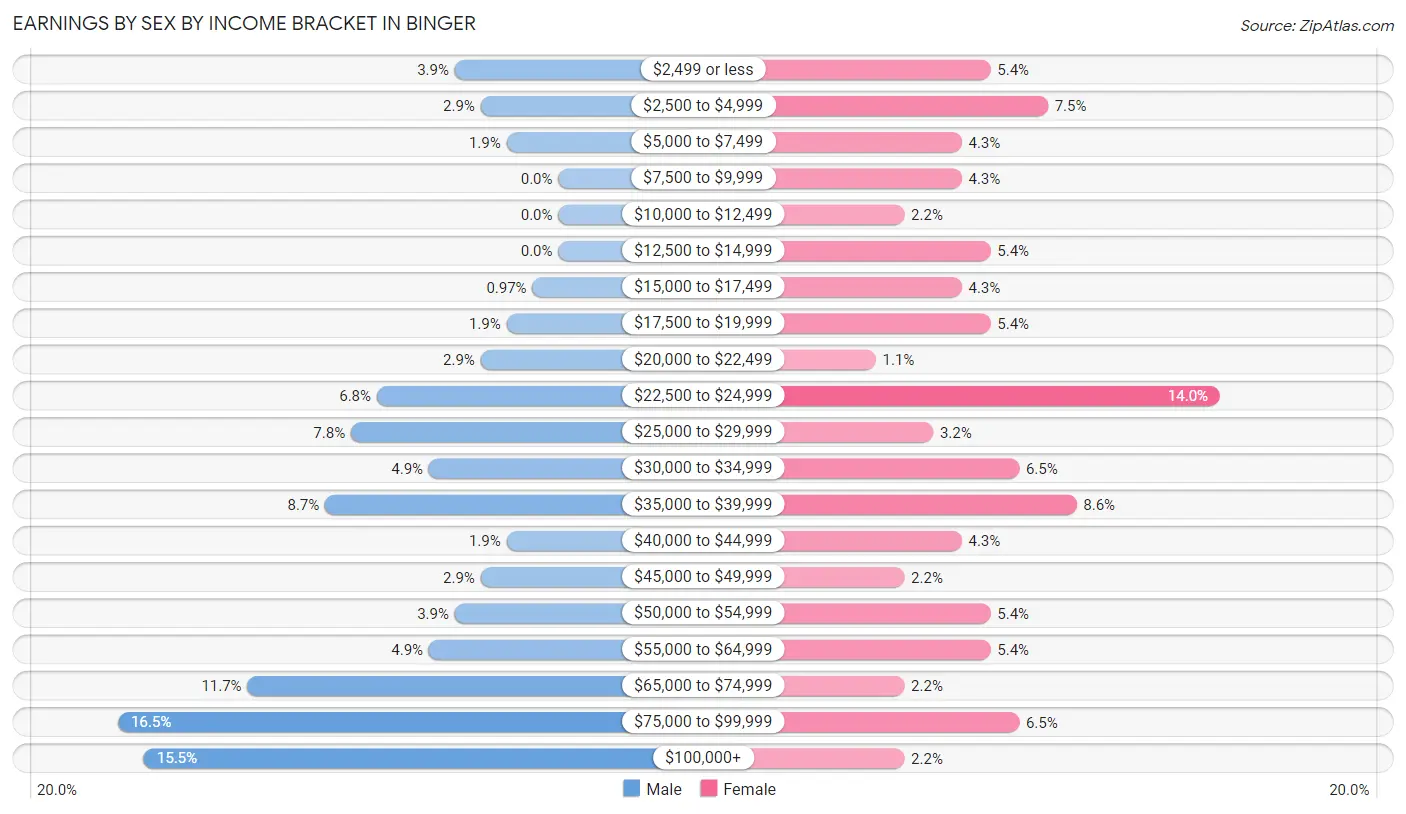
Earnings by Sex by Income Bracket in Binger
The most common earnings brackets in Binger are $75,000 to $99,999 for men (17 | 16.5%) and $22,500 to $24,999 for women (13 | 14.0%).
| Income | Male | Female |
| $2,499 or less | 4 (3.9%) | 5 (5.4%) |
| $2,500 to $4,999 | 3 (2.9%) | 7 (7.5%) |
| $5,000 to $7,499 | 2 (1.9%) | 4 (4.3%) |
| $7,500 to $9,999 | 0 (0.0%) | 4 (4.3%) |
| $10,000 to $12,499 | 0 (0.0%) | 2 (2.1%) |
| $12,500 to $14,999 | 0 (0.0%) | 5 (5.4%) |
| $15,000 to $17,499 | 1 (1.0%) | 4 (4.3%) |
| $17,500 to $19,999 | 2 (1.9%) | 5 (5.4%) |
| $20,000 to $22,499 | 3 (2.9%) | 1 (1.1%) |
| $22,500 to $24,999 | 7 (6.8%) | 13 (14.0%) |
| $25,000 to $29,999 | 8 (7.8%) | 3 (3.2%) |
| $30,000 to $34,999 | 5 (4.9%) | 6 (6.5%) |
| $35,000 to $39,999 | 9 (8.7%) | 8 (8.6%) |
| $40,000 to $44,999 | 2 (1.9%) | 4 (4.3%) |
| $45,000 to $49,999 | 3 (2.9%) | 2 (2.1%) |
| $50,000 to $54,999 | 4 (3.9%) | 5 (5.4%) |
| $55,000 to $64,999 | 5 (4.9%) | 5 (5.4%) |
| $65,000 to $74,999 | 12 (11.7%) | 2 (2.1%) |
| $75,000 to $99,999 | 17 (16.5%) | 6 (6.5%) |
| $100,000+ | 16 (15.5%) | 2 (2.1%) |
| Total | 103 (100.0%) | 93 (100.0%) |
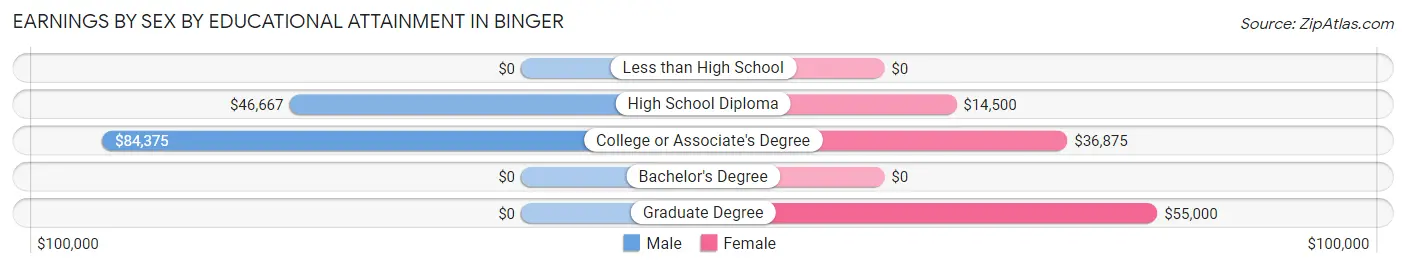
Earnings by Sex by Educational Attainment in Binger
Average earnings in Binger are $69,375 for men and $24,808 for women, a difference of 64.2%. Men with an educational attainment of college or associate's degree enjoy the highest average annual earnings of $84,375, while those with high school diploma education earn the least with $46,667. Women with an educational attainment of graduate degree earn the most with the average annual earnings of $55,000, while those with high school diploma education have the smallest earnings of $14,500.
| Educational Attainment | Male Income | Female Income |
| Less than High School | - | - |
| High School Diploma | $46,667 | $14,500 |
| College or Associate's Degree | $84,375 | $36,875 |
| Bachelor's Degree | - | - |
| Graduate Degree | - | - |
| Total | $69,375 | $24,808 |
Family Income in Binger
Family Income Brackets in Binger
According to the Binger family income data, there are 27 families falling into the $50,000 to $74,999 income range, which is the most common income bracket and makes up 19.7% of all families. Conversely, the $10,000 to $14,999 income bracket is the least frequent group with only 3 families (2.2%) belonging to this category.
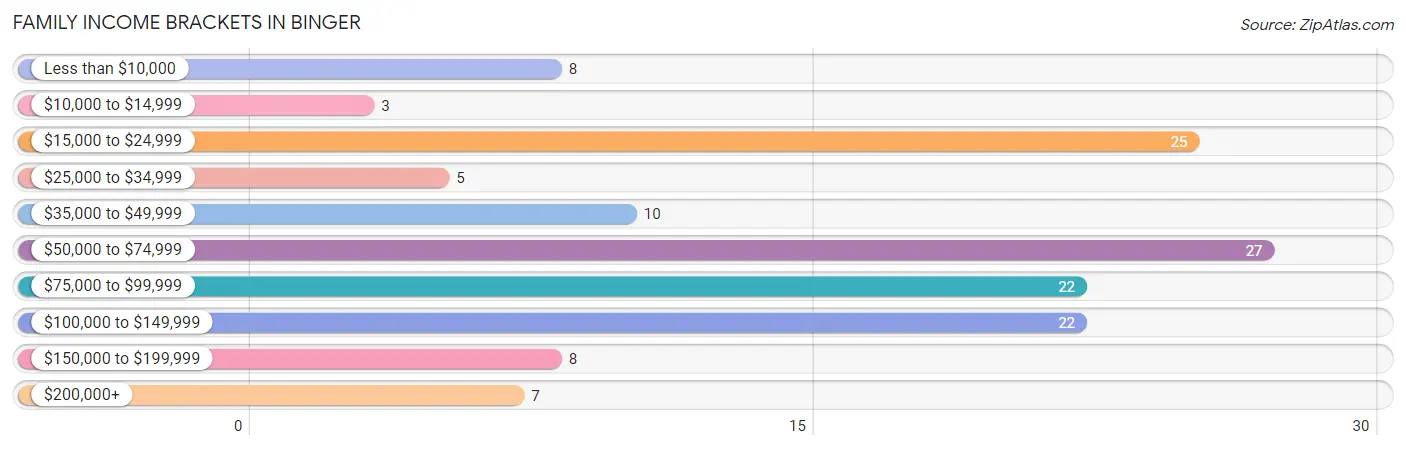
| Income Bracket | # Families | % Families |
| Less than $10,000 | 8 | 5.8% |
| $10,000 to $14,999 | 3 | 2.2% |
| $15,000 to $24,999 | 25 | 18.2% |
| $25,000 to $34,999 | 5 | 3.6% |
| $35,000 to $49,999 | 10 | 7.3% |
| $50,000 to $74,999 | 27 | 19.7% |
| $75,000 to $99,999 | 22 | 16.1% |
| $100,000 to $149,999 | 22 | 16.1% |
| $150,000 to $199,999 | 8 | 5.8% |
| $200,000+ | 7 | 5.1% |
Family Income by Famaliy Size in Binger
3-person families (39 | 28.5%) account for the highest median family income in Binger with $87,813 per family, while 2-person families (69 | 50.4%) have the highest median income of $31,797 per family member.
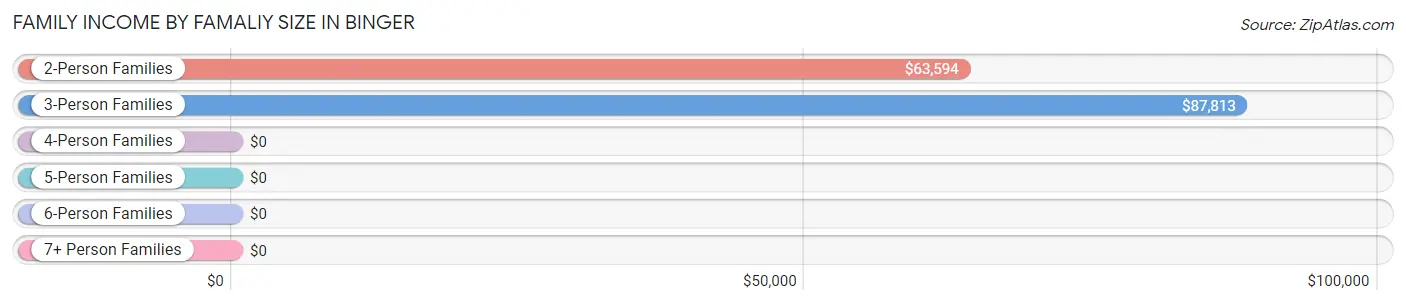
| Income Bracket | # Families | Median Income |
| 2-Person Families | 69 (50.4%) | $63,594 |
| 3-Person Families | 39 (28.5%) | $87,813 |
| 4-Person Families | 24 (17.5%) | $0 |
| 5-Person Families | 5 (3.6%) | $0 |
| 6-Person Families | 0 (0.0%) | $0 |
| 7+ Person Families | 0 (0.0%) | $0 |
| Total | 137 (100.0%) | $64,531 |
Family Income by Number of Earners in Binger
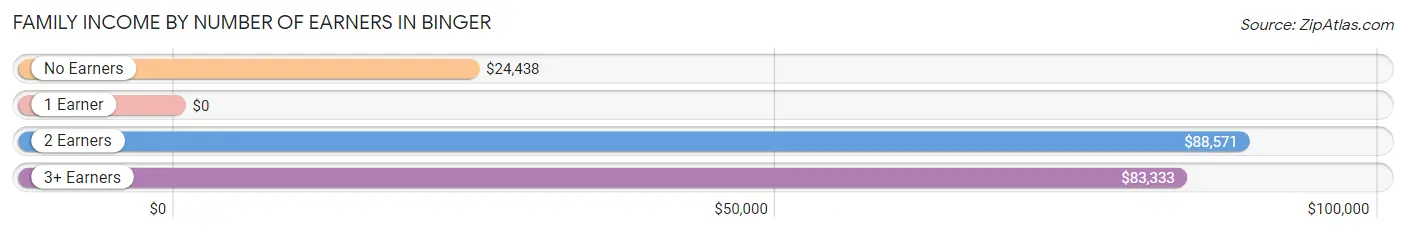
| Number of Earners | # Families | Median Income |
| No Earners | 41 (29.9%) | $24,438 |
| 1 Earner | 38 (27.7%) | $0 |
| 2 Earners | 50 (36.5%) | $88,571 |
| 3+ Earners | 8 (5.8%) | $83,333 |
| Total | 137 (100.0%) | $64,531 |
Household Income in Binger
Household Income Brackets in Binger
With 56 households falling in the category, the $15,000 to $24,999 income range is the most frequent in Binger, accounting for 26.9% of all households. In contrast, only 7 households (3.4%) fall into the $200,000+ income bracket, making it the least populous group.
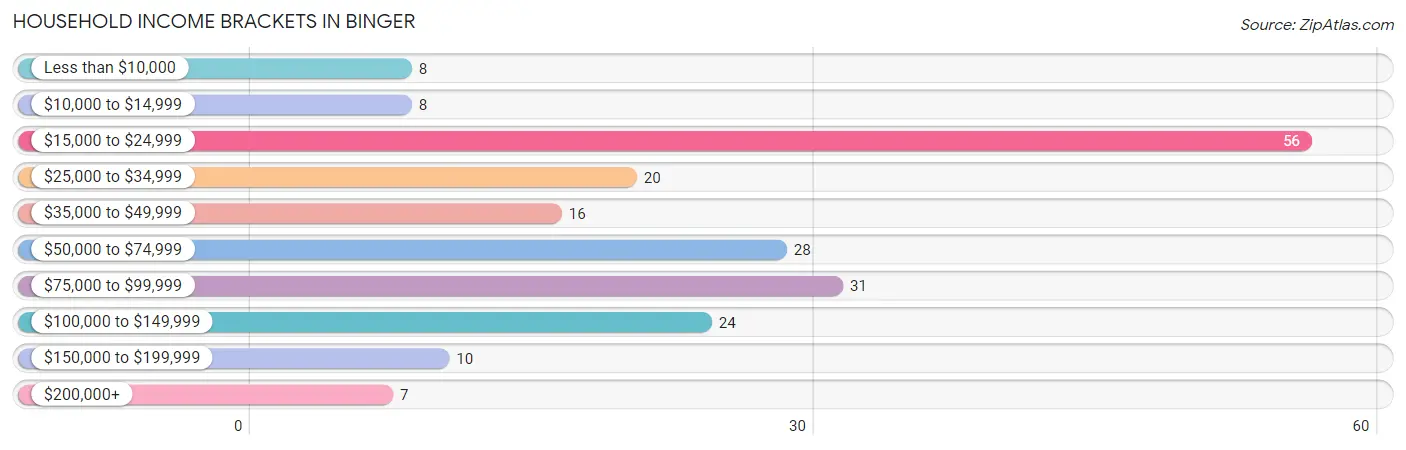
| Income Bracket | # Households | % Households |
| Less than $10,000 | 8 | 3.8% |
| $10,000 to $14,999 | 8 | 3.8% |
| $15,000 to $24,999 | 56 | 26.9% |
| $25,000 to $34,999 | 20 | 9.6% |
| $35,000 to $49,999 | 16 | 7.7% |
| $50,000 to $74,999 | 28 | 13.5% |
| $75,000 to $99,999 | 31 | 14.9% |
| $100,000 to $149,999 | 24 | 11.5% |
| $150,000 to $199,999 | 10 | 4.8% |
| $200,000+ | 7 | 3.4% |
Household Income by Householder Age in Binger
The median household income in Binger is $42,000, with the highest median household income of $77,000 found in the 25 to 44 years age bracket for the primary householder. A total of 46 households (22.1%) fall into this category. Meanwhile, the 15 to 24 years age bracket for the primary householder has the lowest median household income of $0, with 8 households (3.8%) in this group.
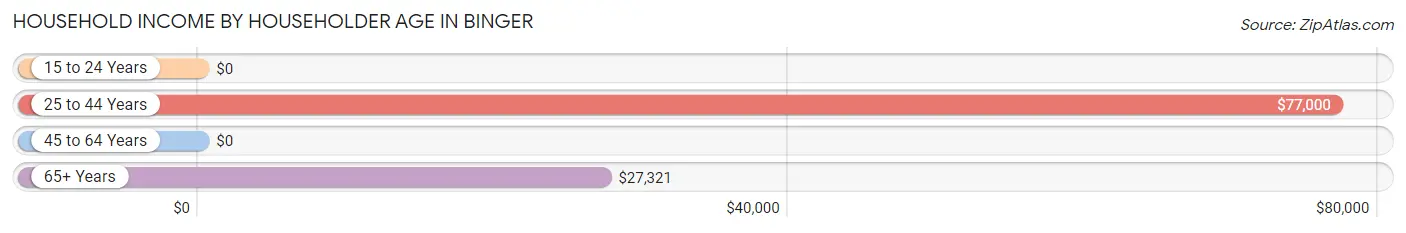
| Income Bracket | # Households | Median Income |
| 15 to 24 Years | 8 (3.8%) | $0 |
| 25 to 44 Years | 46 (22.1%) | $77,000 |
| 45 to 64 Years | 91 (43.8%) | $0 |
| 65+ Years | 63 (30.3%) | $27,321 |
| Total | 208 (100.0%) | $42,000 |
Poverty in Binger
Income Below Poverty by Sex and Age in Binger
With 7.8% poverty level for males and 11.1% for females among the residents of Binger, 5 year old males and 15 year old females are the most vulnerable to poverty, with 2 males (50.0%) and 3 females (100.0%) in their respective age groups living below the poverty level.
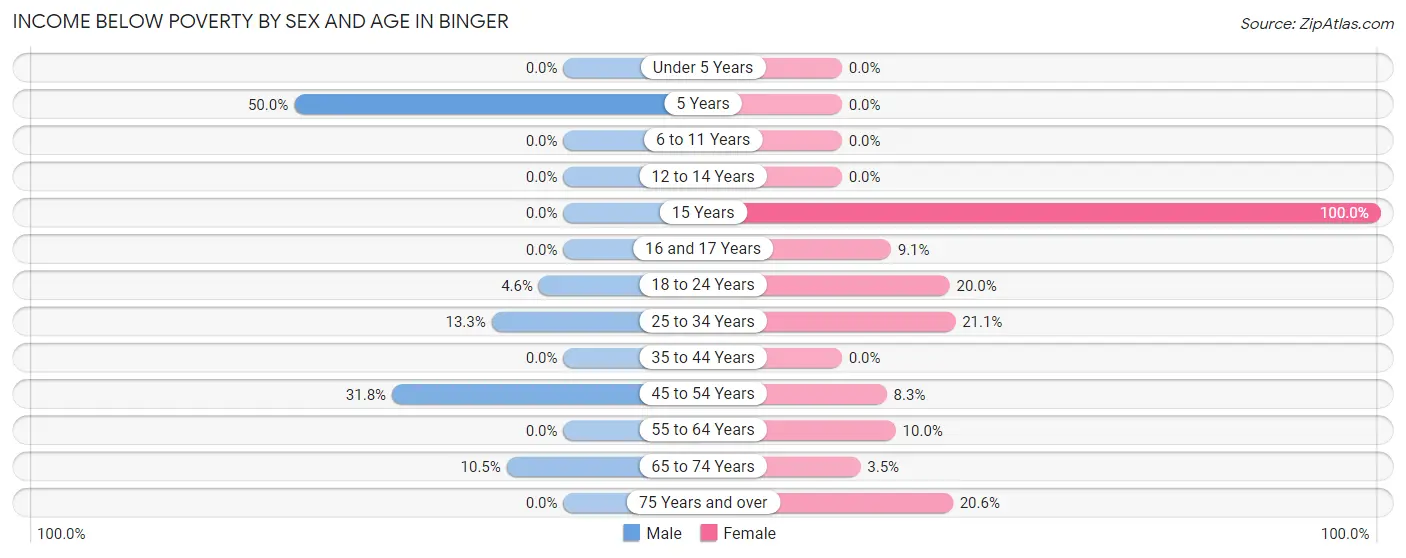
| Age Bracket | Male | Female |
| Under 5 Years | 0 (0.0%) | 0 (0.0%) |
| 5 Years | 2 (50.0%) | 0 (0.0%) |
| 6 to 11 Years | 0 (0.0%) | 0 (0.0%) |
| 12 to 14 Years | 0 (0.0%) | 0 (0.0%) |
| 15 Years | 0 (0.0%) | 3 (100.0%) |
| 16 and 17 Years | 0 (0.0%) | 1 (9.1%) |
| 18 to 24 Years | 1 (4.5%) | 2 (20.0%) |
| 25 to 34 Years | 4 (13.3%) | 4 (21.0%) |
| 35 to 44 Years | 0 (0.0%) | 0 (0.0%) |
| 45 to 54 Years | 7 (31.8%) | 2 (8.3%) |
| 55 to 64 Years | 0 (0.0%) | 5 (10.0%) |
| 65 to 74 Years | 2 (10.5%) | 1 (3.5%) |
| 75 Years and over | 0 (0.0%) | 7 (20.6%) |
| Total | 16 (7.8%) | 25 (11.1%) |
Income Above Poverty by Sex and Age in Binger
According to the poverty statistics in Binger, males aged under 5 years and females aged under 5 years are the age groups that are most secure financially, with 100.0% of males and 100.0% of females in these age groups living above the poverty line.
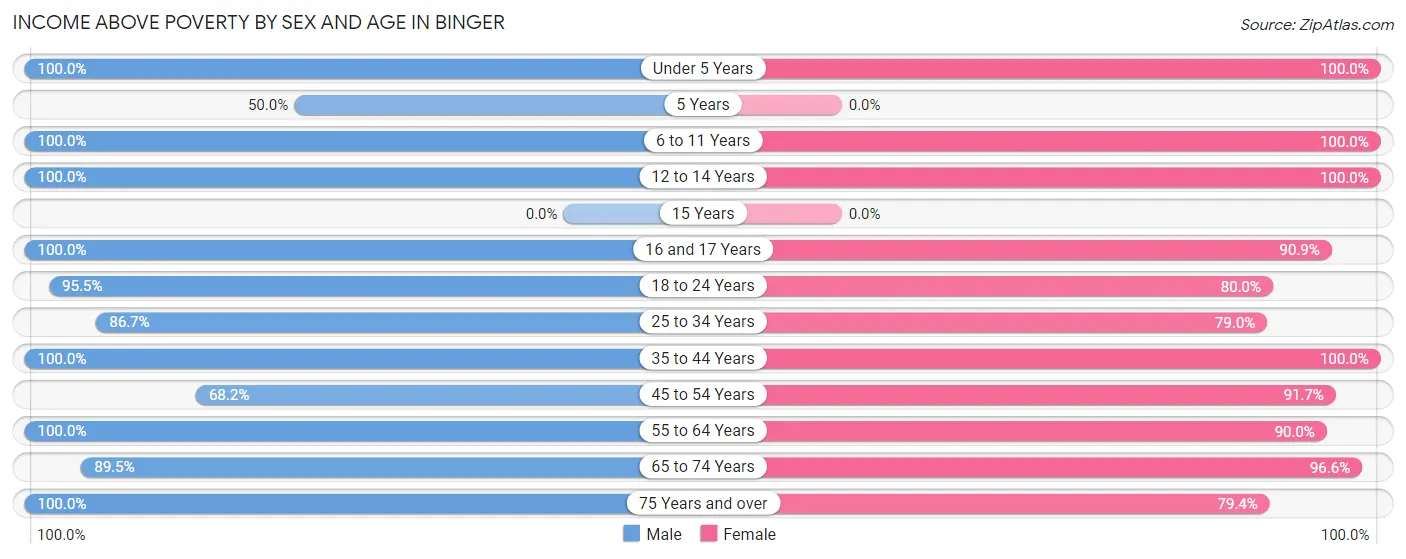
| Age Bracket | Male | Female |
| Under 5 Years | 8 (100.0%) | 4 (100.0%) |
| 5 Years | 2 (50.0%) | 0 (0.0%) |
| 6 to 11 Years | 11 (100.0%) | 17 (100.0%) |
| 12 to 14 Years | 2 (100.0%) | 8 (100.0%) |
| 15 Years | 0 (0.0%) | 0 (0.0%) |
| 16 and 17 Years | 9 (100.0%) | 10 (90.9%) |
| 18 to 24 Years | 21 (95.5%) | 8 (80.0%) |
| 25 to 34 Years | 26 (86.7%) | 15 (78.9%) |
| 35 to 44 Years | 23 (100.0%) | 17 (100.0%) |
| 45 to 54 Years | 15 (68.2%) | 22 (91.7%) |
| 55 to 64 Years | 36 (100.0%) | 45 (90.0%) |
| 65 to 74 Years | 17 (89.5%) | 28 (96.6%) |
| 75 Years and over | 19 (100.0%) | 27 (79.4%) |
| Total | 189 (92.2%) | 201 (88.9%) |
Income Below Poverty Among Married-Couple Families in Binger
The poverty statistics for married-couple families in Binger show that 7.3% or 8 of the total 110 families live below the poverty line. Families with 1 or 2 children have the highest poverty rate of 14.6%, comprising of 6 families. On the other hand, families with 3 or 4 children have the lowest poverty rate of 0.0%, which includes 0 families.
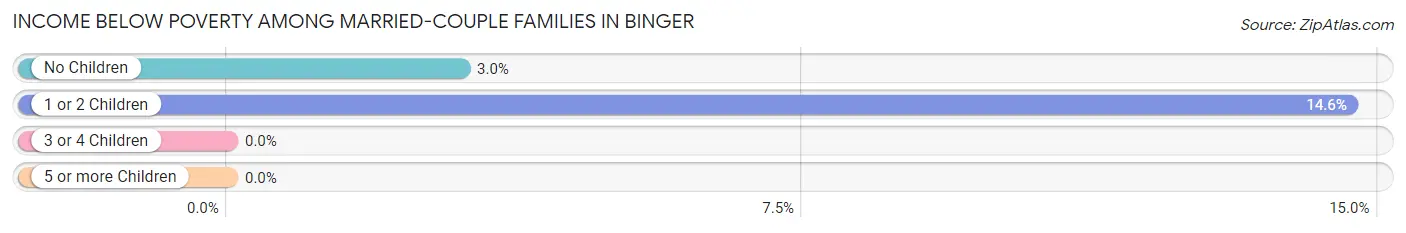
| Children | Above Poverty | Below Poverty |
| No Children | 64 (97.0%) | 2 (3.0%) |
| 1 or 2 Children | 35 (85.4%) | 6 (14.6%) |
| 3 or 4 Children | 3 (100.0%) | 0 (0.0%) |
| 5 or more Children | 0 (0.0%) | 0 (0.0%) |
| Total | 102 (92.7%) | 8 (7.3%) |
Income Below Poverty Among Single-Parent Households in Binger
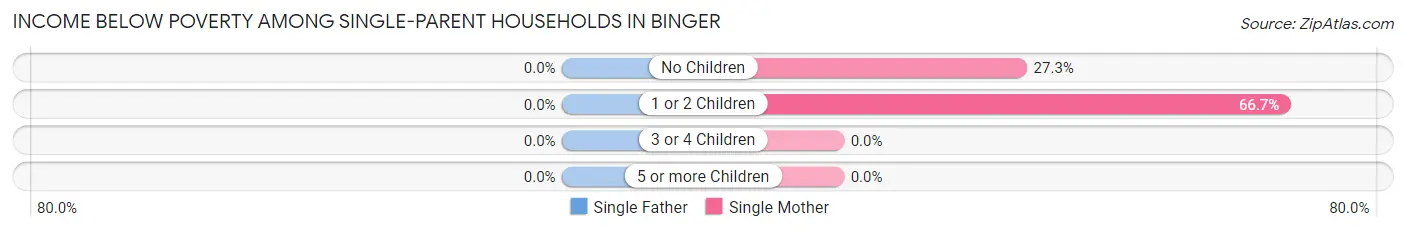
| Children | Single Father | Single Mother |
| No Children | 0 (0.0%) | 3 (27.3%) |
| 1 or 2 Children | 0 (0.0%) | 4 (66.7%) |
| 3 or 4 Children | 0 (0.0%) | 0 (0.0%) |
| 5 or more Children | 0 (0.0%) | 0 (0.0%) |
| Total | 0 (0.0%) | 7 (36.8%) |
Income Below Poverty Among Married-Couple vs Single-Parent Households in Binger
The poverty data for Binger shows that 8 of the married-couple family households (7.3%) and 7 of the single-parent households (25.9%) are living below the poverty level. Within the married-couple family households, those with 1 or 2 children have the highest poverty rate, with 6 households (14.6%) falling below the poverty line. Among the single-parent households, those with 1 or 2 children have the highest poverty rate, with 4 household (50.0%) living below poverty.
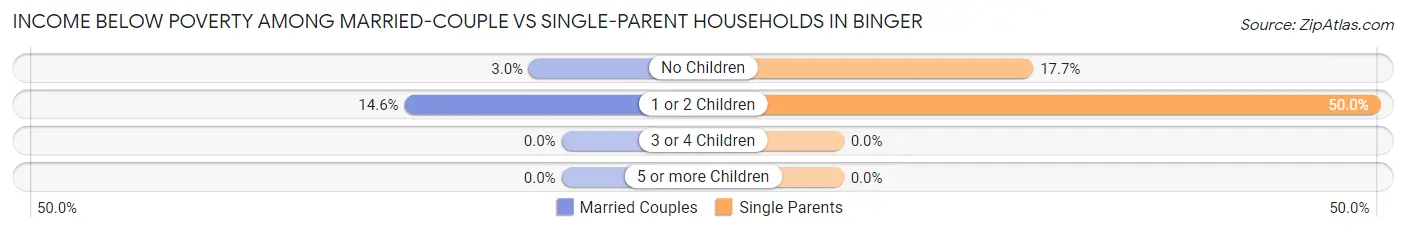
| Children | Married-Couple Families | Single-Parent Households |
| No Children | 2 (3.0%) | 3 (17.6%) |
| 1 or 2 Children | 6 (14.6%) | 4 (50.0%) |
| 3 or 4 Children | 0 (0.0%) | 0 (0.0%) |
| 5 or more Children | 0 (0.0%) | 0 (0.0%) |
| Total | 8 (7.3%) | 7 (25.9%) |
Race in Binger
The most populous races in Binger are White / Caucasian (316 | 66.1%), Native / Alaskan (95 | 19.9%), and Hispanic or Latino (48 | 10.0%).
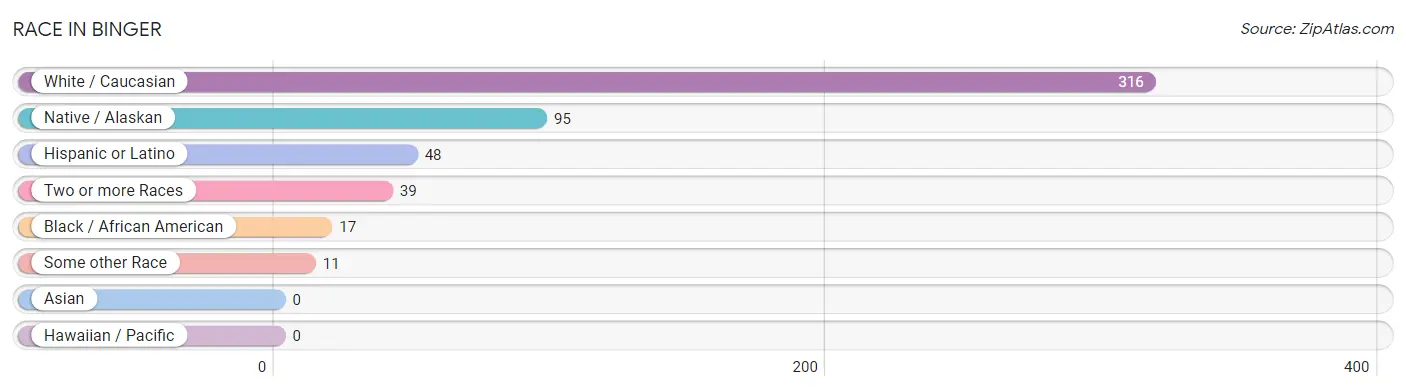
| Race | # Population | % Population |
| Asian | 0 | 0.0% |
| Black / African American | 17 | 3.6% |
| Hawaiian / Pacific | 0 | 0.0% |
| Hispanic or Latino | 48 | 10.0% |
| Native / Alaskan | 95 | 19.9% |
| White / Caucasian | 316 | 66.1% |
| Two or more Races | 39 | 8.2% |
| Some other Race | 11 | 2.3% |
| Total | 478 | 100.0% |
Ancestry in Binger
The most populous ancestries reported in Binger are German (66 | 13.8%), Mexican (48 | 10.0%), Irish (39 | 8.2%), English (28 | 5.9%), and Apache (21 | 4.4%), together accounting for 42.3% of all Binger residents.
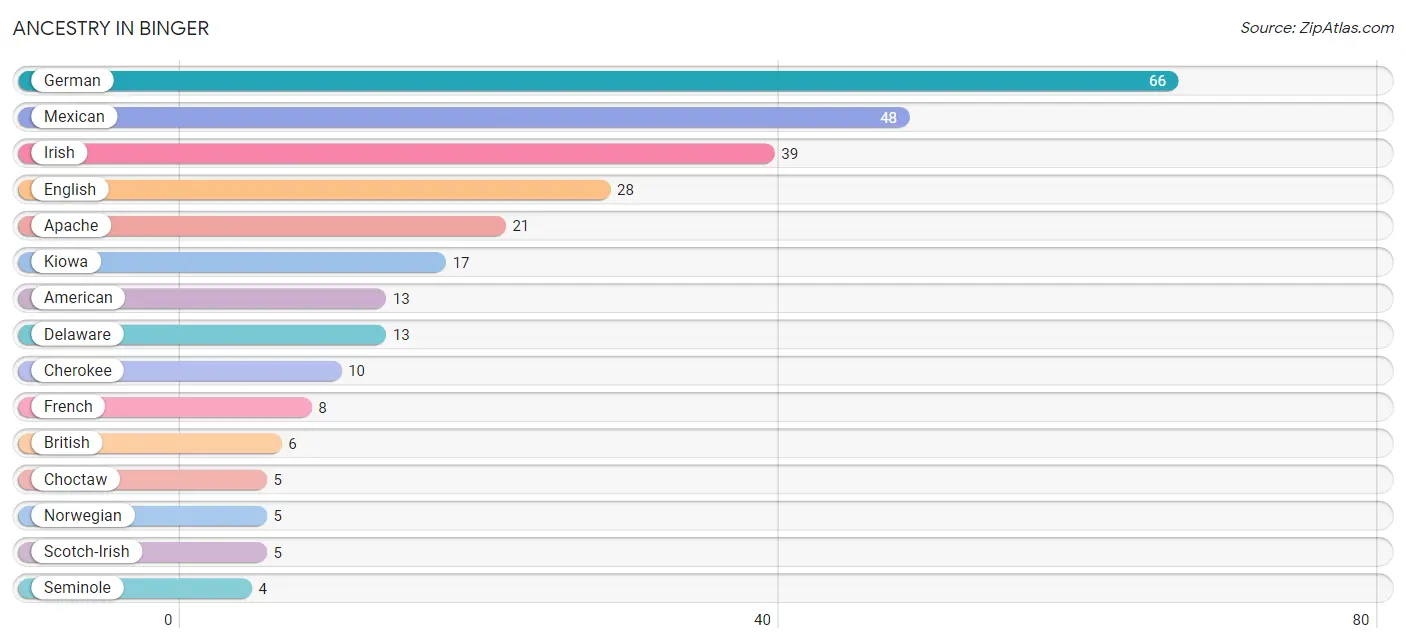
| Ancestry | # Population | % Population |
| American | 13 | 2.7% |
| Apache | 21 | 4.4% |
| British | 6 | 1.3% |
| Cherokee | 10 | 2.1% |
| Chickasaw | 2 | 0.4% |
| Choctaw | 5 | 1.1% |
| Comanche | 1 | 0.2% |
| Creek | 2 | 0.4% |
| Delaware | 13 | 2.7% |
| Dutch | 3 | 0.6% |
| Eastern European | 2 | 0.4% |
| English | 28 | 5.9% |
| French | 8 | 1.7% |
| German | 66 | 13.8% |
| German Russian | 2 | 0.4% |
| Greek | 2 | 0.4% |
| Irish | 39 | 8.2% |
| Kiowa | 17 | 3.6% |
| Mexican | 48 | 10.0% |
| Norwegian | 5 | 1.1% |
| Polish | 2 | 0.4% |
| Russian | 2 | 0.4% |
| Scandinavian | 2 | 0.4% |
| Scotch-Irish | 5 | 1.1% |
| Scottish | 1 | 0.2% |
| Seminole | 4 | 0.8% |
| Swedish | 3 | 0.6% |
| Welsh | 2 | 0.4% | View All 28 Rows |
Immigrants in Binger
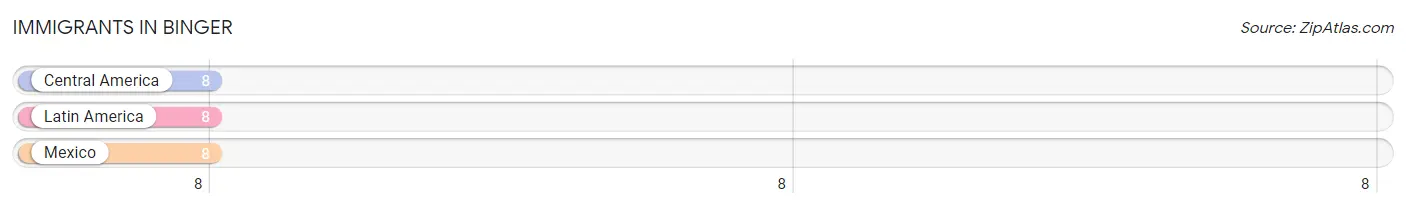
The most numerous immigrant groups reported in Binger came from Central America (8 | 1.7%), Latin America (8 | 1.7%), and Mexico (8 | 1.7%), together accounting for 5.0% of all Binger residents.
| Immigration Origin | # Population | % Population |
| Central America | 8 | 1.7% |
| Latin America | 8 | 1.7% |
| Mexico | 8 | 1.7% | View All 3 Rows |
Sex and Age in Binger
Sex and Age in Binger
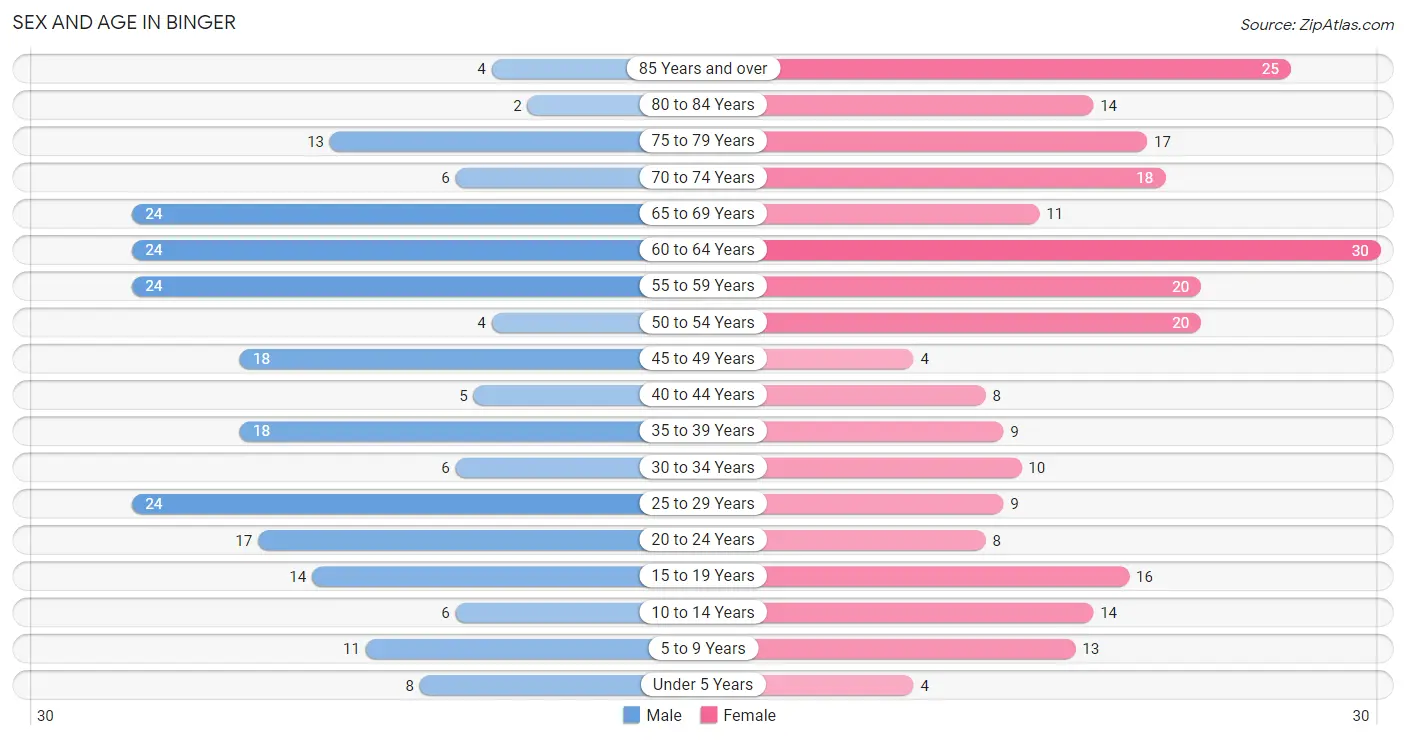
The most populous age groups in Binger are 25 to 29 Years (24 | 10.5%) for men and 60 to 64 Years (30 | 12.0%) for women.
| Age Bracket | Male | Female |
| Under 5 Years | 8 (3.5%) | 4 (1.6%) |
| 5 to 9 Years | 11 (4.8%) | 13 (5.2%) |
| 10 to 14 Years | 6 (2.6%) | 14 (5.6%) |
| 15 to 19 Years | 14 (6.1%) | 16 (6.4%) |
| 20 to 24 Years | 17 (7.5%) | 8 (3.2%) |
| 25 to 29 Years | 24 (10.5%) | 9 (3.6%) |
| 30 to 34 Years | 6 (2.6%) | 10 (4.0%) |
| 35 to 39 Years | 18 (7.9%) | 9 (3.6%) |
| 40 to 44 Years | 5 (2.2%) | 8 (3.2%) |
| 45 to 49 Years | 18 (7.9%) | 4 (1.6%) |
| 50 to 54 Years | 4 (1.8%) | 20 (8.0%) |
| 55 to 59 Years | 24 (10.5%) | 20 (8.0%) |
| 60 to 64 Years | 24 (10.5%) | 30 (12.0%) |
| 65 to 69 Years | 24 (10.5%) | 11 (4.4%) |
| 70 to 74 Years | 6 (2.6%) | 18 (7.2%) |
| 75 to 79 Years | 13 (5.7%) | 17 (6.8%) |
| 80 to 84 Years | 2 (0.9%) | 14 (5.6%) |
| 85 Years and over | 4 (1.8%) | 25 (10.0%) |
| Total | 228 (100.0%) | 250 (100.0%) |
Families and Households in Binger
Median Family Size in Binger
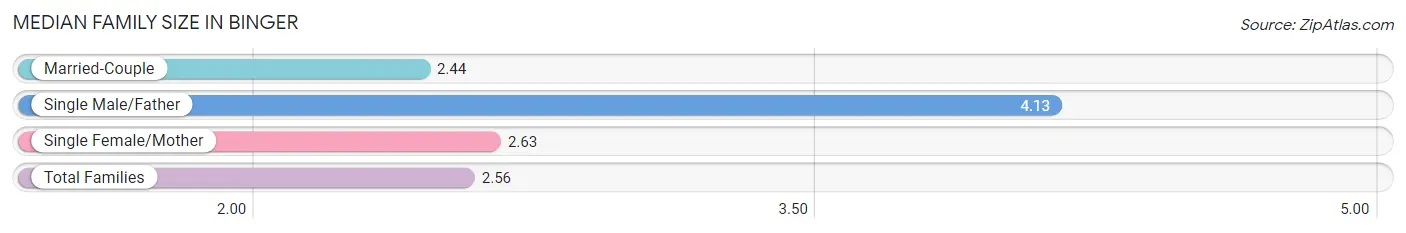
The median family size in Binger is 2.56 persons per family, with single male/father families (8 | 5.8%) accounting for the largest median family size of 4.13 persons per family. On the other hand, married-couple families (110 | 80.3%) represent the smallest median family size with 2.44 persons per family.
| Family Type | # Families | Family Size |
| Married-Couple | 110 (80.3%) | 2.44 |
| Single Male/Father | 8 (5.8%) | 4.13 |
| Single Female/Mother | 19 (13.9%) | 2.63 |
| Total Families | 137 (100.0%) | 2.56 |
Median Household Size in Binger
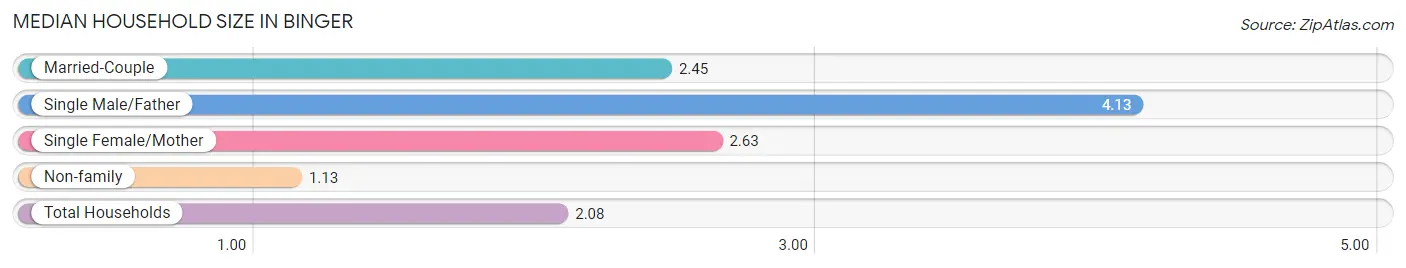
The median household size in Binger is 2.08 persons per household, with single male/father households (8 | 3.8%) accounting for the largest median household size of 4.13 persons per household. non-family households (71 | 34.1%) represent the smallest median household size with 1.13 persons per household.
| Household Type | # Households | Household Size |
| Married-Couple | 110 (52.9%) | 2.45 |
| Single Male/Father | 8 (3.8%) | 4.13 |
| Single Female/Mother | 19 (9.1%) | 2.63 |
| Non-family | 71 (34.1%) | 1.13 |
| Total Households | 208 (100.0%) | 2.08 |
Household Size by Marriage Status in Binger
Out of a total of 208 households in Binger, 137 (65.9%) are family households, while 71 (34.1%) are nonfamily households. The most numerous type of family households are 2-person households, comprising 69, and the most common type of nonfamily households are 1-person households, comprising 60.
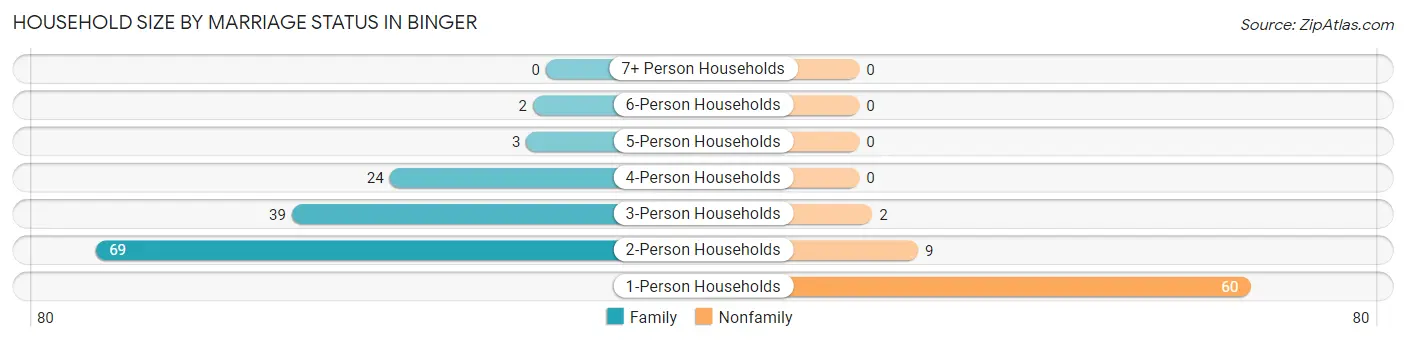
| Household Size | Family Households | Nonfamily Households |
| 1-Person Households | - | 60 (28.8%) |
| 2-Person Households | 69 (33.2%) | 9 (4.3%) |
| 3-Person Households | 39 (18.8%) | 2 (1.0%) |
| 4-Person Households | 24 (11.5%) | 0 (0.0%) |
| 5-Person Households | 3 (1.4%) | 0 (0.0%) |
| 6-Person Households | 2 (1.0%) | 0 (0.0%) |
| 7+ Person Households | 0 (0.0%) | 0 (0.0%) |
| Total | 137 (65.9%) | 71 (34.1%) |
Female Fertility in Binger
Fertility by Age in Binger
Average fertility rate in Binger is 31.0 births per 1,000 women. Women in the age bracket of 35 to 50 years have the highest fertility rate with 95.0 births per 1,000 women. Women in the age bracket of 35 to 50 years acount for 100.0% of all women with births.
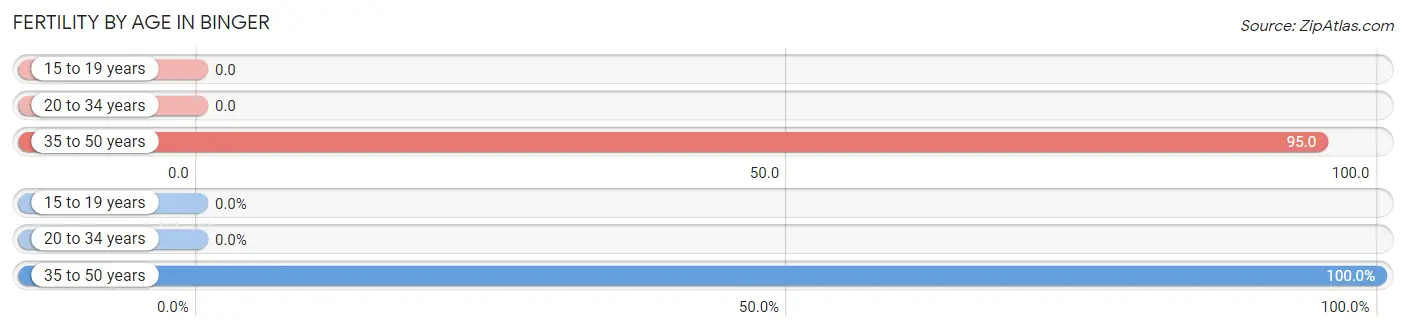
| Age Bracket | Women with Births | Births / 1,000 Women |
| 15 to 19 years | 0 (0.0%) | 0.0 |
| 20 to 34 years | 0 (0.0%) | 0.0 |
| 35 to 50 years | 2 (100.0%) | 95.0 |
| Total | 2 (100.0%) | 31.0 |
Fertility by Age by Marriage Status in Binger
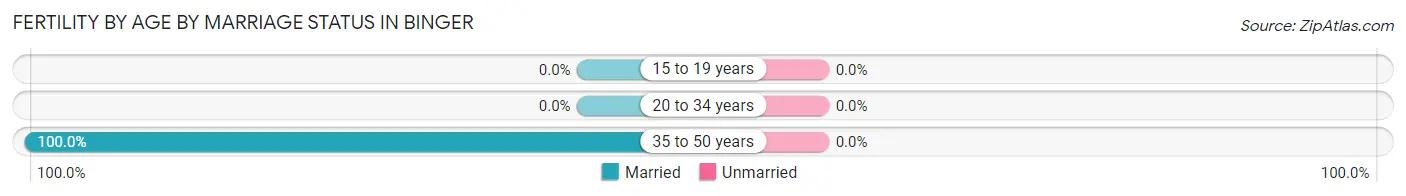
| Age Bracket | Married | Unmarried |
| 15 to 19 years | 0 (0.0%) | 0 (0.0%) |
| 20 to 34 years | 0 (0.0%) | 0 (0.0%) |
| 35 to 50 years | 2 (100.0%) | 0 (0.0%) |
| Total | 2 (100.0%) | 0 (0.0%) |
Fertility by Education in Binger
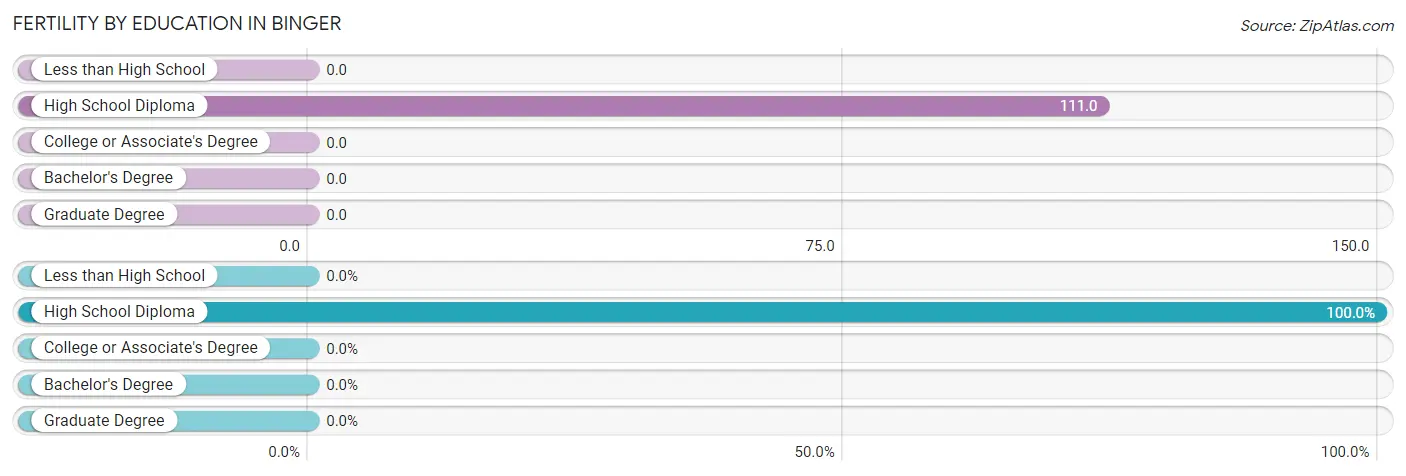
| Educational Attainment | Women with Births | Births / 1,000 Women |
| Less than High School | 0 (0.0%) | 0.0 |
| High School Diploma | 2 (100.0%) | 111.0 |
| College or Associate's Degree | 0 (0.0%) | 0.0 |
| Bachelor's Degree | 0 (0.0%) | 0.0 |
| Graduate Degree | 0 (0.0%) | 0.0 |
| Total | 2 (100.0%) | 31.0 |
Fertility by Education by Marriage Status in Binger
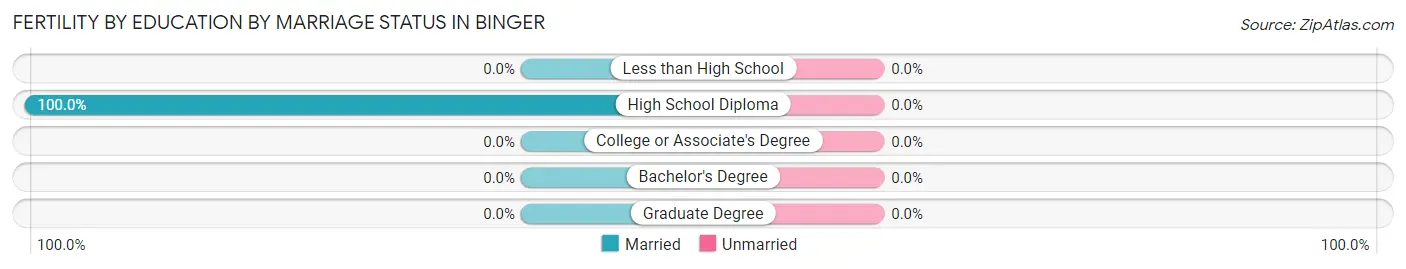
| Educational Attainment | Married | Unmarried |
| Less than High School | 0 (0.0%) | 0 (0.0%) |
| High School Diploma | 2 (100.0%) | 0 (0.0%) |
| College or Associate's Degree | 0 (0.0%) | 0 (0.0%) |
| Bachelor's Degree | 0 (0.0%) | 0 (0.0%) |
| Graduate Degree | 0 (0.0%) | 0 (0.0%) |
| Total | 2 (100.0%) | 0 (0.0%) |
Employment Characteristics in Binger
Employment by Class of Employer in Binger
Among the 157 employed individuals in Binger, private company employees (90 | 57.3%), federal government employees (18 | 11.5%), and state government employees (15 | 9.6%) make up the most common classes of employment.
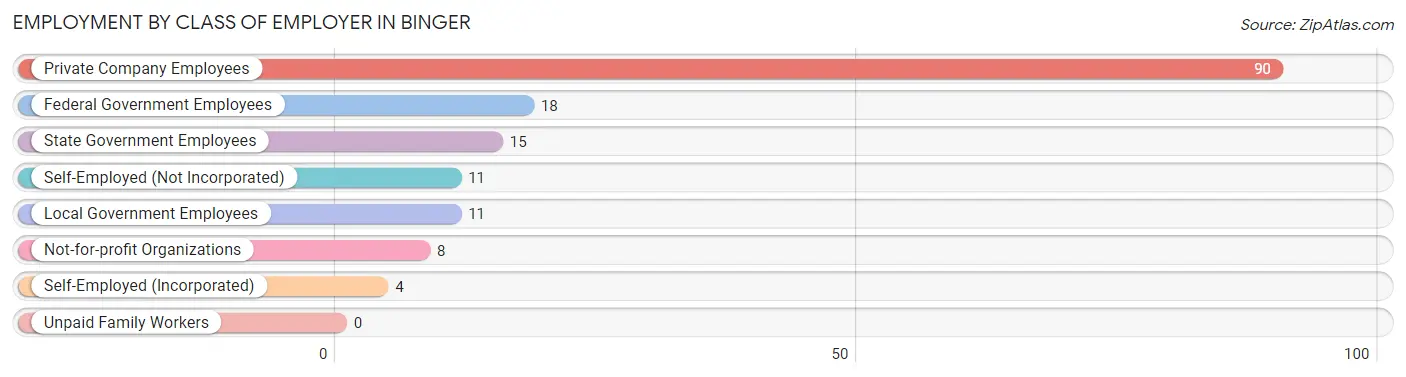
| Employer Class | # Employees | % Employees |
| Private Company Employees | 90 | 57.3% |
| Self-Employed (Incorporated) | 4 | 2.5% |
| Self-Employed (Not Incorporated) | 11 | 7.0% |
| Not-for-profit Organizations | 8 | 5.1% |
| Local Government Employees | 11 | 7.0% |
| State Government Employees | 15 | 9.6% |
| Federal Government Employees | 18 | 11.5% |
| Unpaid Family Workers | 0 | 0.0% |
| Total | 157 | 100.0% |
Employment Status by Age in Binger
According to the labor force statistics for Binger, out of the total population over 16 years of age (419), 44.9% or 188 individuals are in the labor force, with 6.9% or 13 of them unemployed. The age group with the highest labor force participation rate is 20 to 24 years, with 88.0% or 22 individuals in the labor force. Within the labor force, the 65 to 74 years age range has the highest percentage of unemployed individuals, with 25.0% or 2 of them being unemployed.
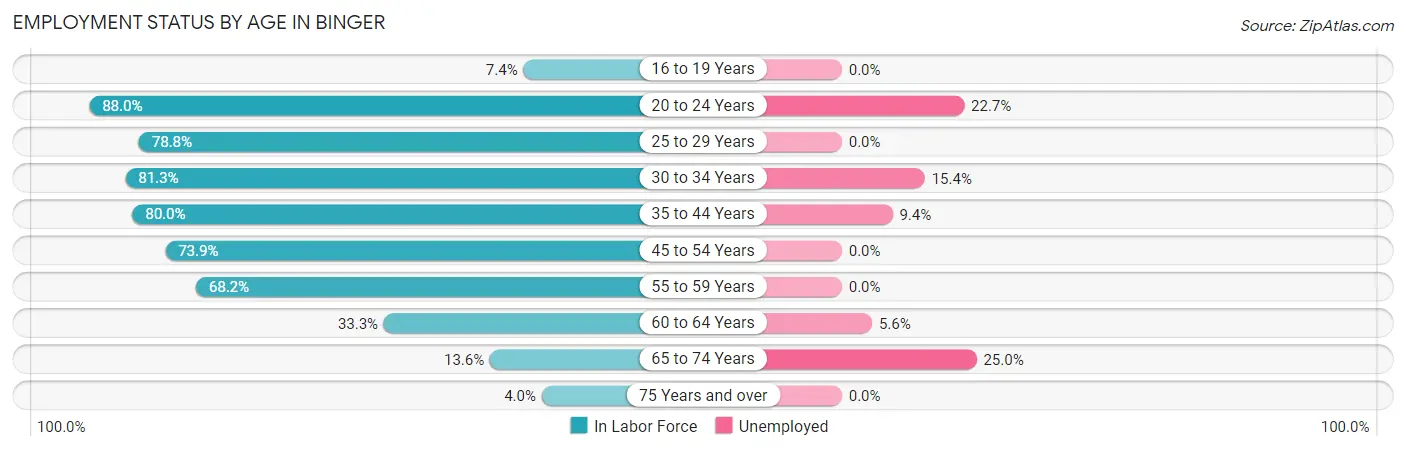
| Age Bracket | In Labor Force | Unemployed |
| 16 to 19 Years | 2 (7.4%) | 0 (0.0%) |
| 20 to 24 Years | 22 (88.0%) | 5 (22.7%) |
| 25 to 29 Years | 26 (78.8%) | 0 (0.0%) |
| 30 to 34 Years | 13 (81.3%) | 2 (15.4%) |
| 35 to 44 Years | 32 (80.0%) | 3 (9.4%) |
| 45 to 54 Years | 34 (73.9%) | 0 (0.0%) |
| 55 to 59 Years | 30 (68.2%) | 0 (0.0%) |
| 60 to 64 Years | 18 (33.3%) | 1 (5.6%) |
| 65 to 74 Years | 8 (13.6%) | 2 (25.0%) |
| 75 Years and over | 3 (4.0%) | 0 (0.0%) |
| Total | 188 (44.9%) | 13 (6.9%) |
Employment Status by Educational Attainment in Binger
According to labor force statistics for Binger, 65.7% of individuals (153) out of the total population between 25 and 64 years of age (233) are in the labor force, with 3.9% or 6 of them being unemployed. The group with the highest labor force participation rate are those with the educational attainment of bachelor's degree or higher, with 82.5% or 33 individuals in the labor force. Within the labor force, individuals with less than high school education have the highest percentage of unemployment, with 50.0% or 2 of them being unemployed.
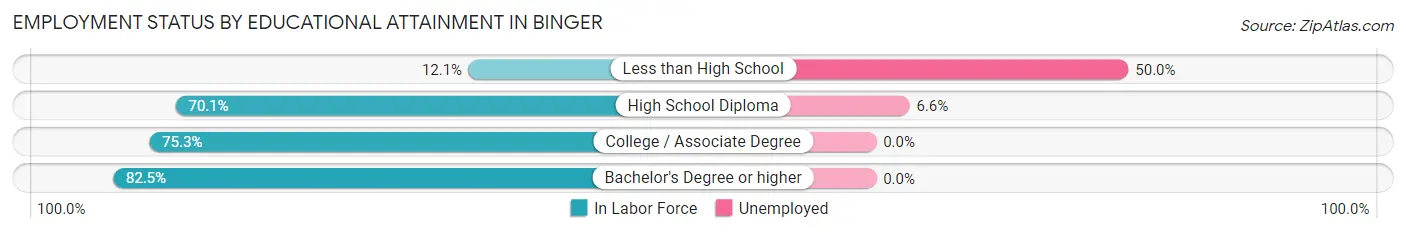
| Educational Attainment | In Labor Force | Unemployed |
| Less than High School | 4 (12.1%) | 16 (50.0%) |
| High School Diploma | 61 (70.1%) | 6 (6.6%) |
| College / Associate Degree | 55 (75.3%) | 0 (0.0%) |
| Bachelor's Degree or higher | 33 (82.5%) | 0 (0.0%) |
| Total | 153 (65.7%) | 9 (3.9%) |
Employment Occupations by Sex in Binger
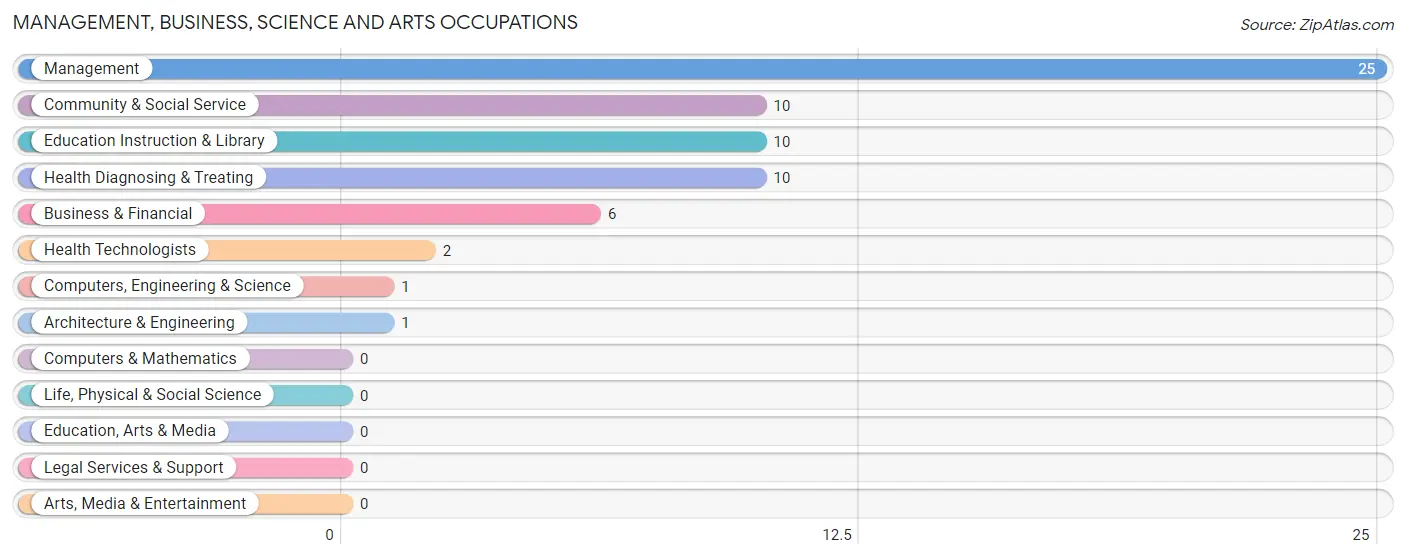
Management, Business, Science and Arts Occupations
The most common Management, Business, Science and Arts occupations in Binger are Management (25 | 14.3%), Community & Social Service (10 | 5.7%), Education Instruction & Library (10 | 5.7%), Health Diagnosing & Treating (10 | 5.7%), and Business & Financial (6 | 3.4%).
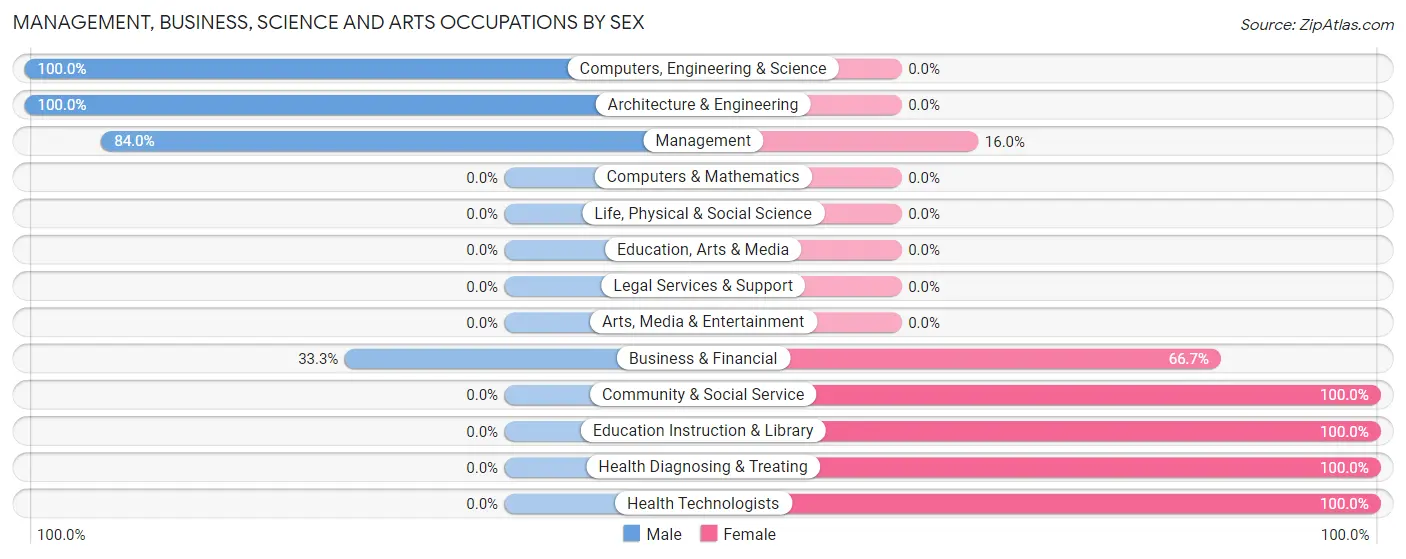
Management, Business, Science and Arts Occupations by Sex
Within the Management, Business, Science and Arts occupations in Binger, the most male-oriented occupations are Computers, Engineering & Science (100.0%), Architecture & Engineering (100.0%), and Management (84.0%), while the most female-oriented occupations are Community & Social Service (100.0%), Education Instruction & Library (100.0%), and Health Diagnosing & Treating (100.0%).
| Occupation | Male | Female |
| Management | 21 (84.0%) | 4 (16.0%) |
| Business & Financial | 2 (33.3%) | 4 (66.7%) |
| Computers, Engineering & Science | 1 (100.0%) | 0 (0.0%) |
| Computers & Mathematics | 0 (0.0%) | 0 (0.0%) |
| Architecture & Engineering | 1 (100.0%) | 0 (0.0%) |
| Life, Physical & Social Science | 0 (0.0%) | 0 (0.0%) |
| Community & Social Service | 0 (0.0%) | 10 (100.0%) |
| Education, Arts & Media | 0 (0.0%) | 0 (0.0%) |
| Legal Services & Support | 0 (0.0%) | 0 (0.0%) |
| Education Instruction & Library | 0 (0.0%) | 10 (100.0%) |
| Arts, Media & Entertainment | 0 (0.0%) | 0 (0.0%) |
| Health Diagnosing & Treating | 0 (0.0%) | 10 (100.0%) |
| Health Technologists | 0 (0.0%) | 2 (100.0%) |
| Total (Category) | 24 (46.2%) | 28 (53.8%) |
| Total (Overall) | 95 (54.3%) | 80 (45.7%) |
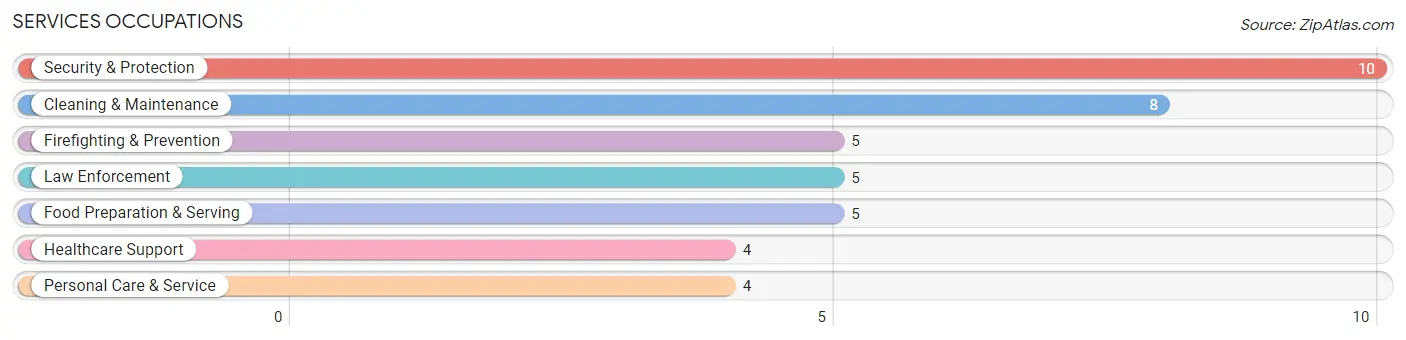
Services Occupations
The most common Services occupations in Binger are Security & Protection (10 | 5.7%), Cleaning & Maintenance (8 | 4.6%), Firefighting & Prevention (5 | 2.9%), Law Enforcement (5 | 2.9%), and Food Preparation & Serving (5 | 2.9%).
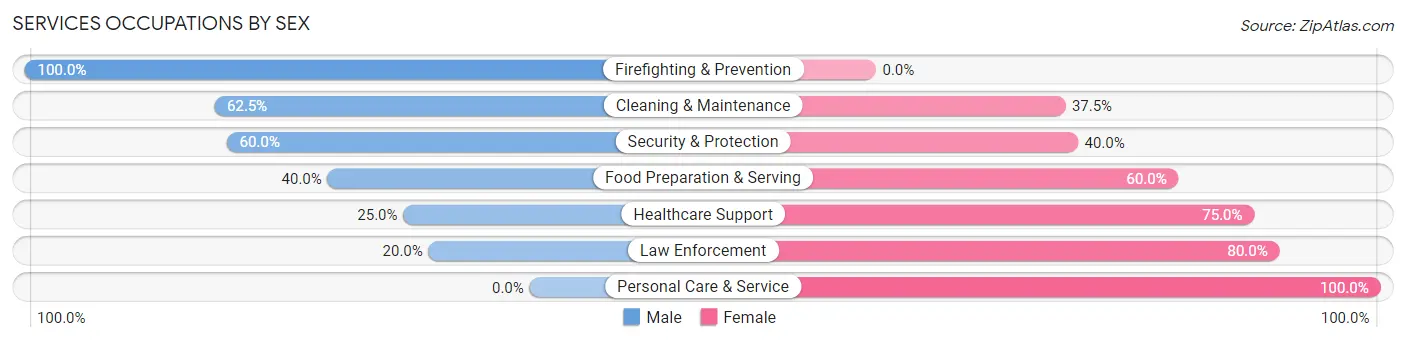
Services Occupations by Sex
Within the Services occupations in Binger, the most male-oriented occupations are Firefighting & Prevention (100.0%), Cleaning & Maintenance (62.5%), and Security & Protection (60.0%), while the most female-oriented occupations are Personal Care & Service (100.0%), Law Enforcement (80.0%), and Healthcare Support (75.0%).
| Occupation | Male | Female |
| Healthcare Support | 1 (25.0%) | 3 (75.0%) |
| Security & Protection | 6 (60.0%) | 4 (40.0%) |
| Firefighting & Prevention | 5 (100.0%) | 0 (0.0%) |
| Law Enforcement | 1 (20.0%) | 4 (80.0%) |
| Food Preparation & Serving | 2 (40.0%) | 3 (60.0%) |
| Cleaning & Maintenance | 5 (62.5%) | 3 (37.5%) |
| Personal Care & Service | 0 (0.0%) | 4 (100.0%) |
| Total (Category) | 14 (45.2%) | 17 (54.8%) |
| Total (Overall) | 95 (54.3%) | 80 (45.7%) |
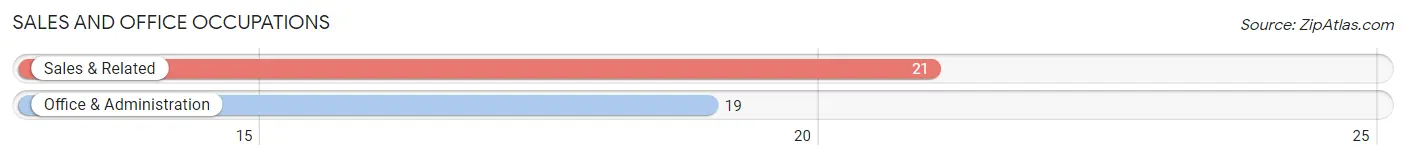
Sales and Office Occupations
The most common Sales and Office occupations in Binger are Sales & Related (21 | 12.0%), and Office & Administration (19 | 10.9%).
Sales and Office Occupations by Sex
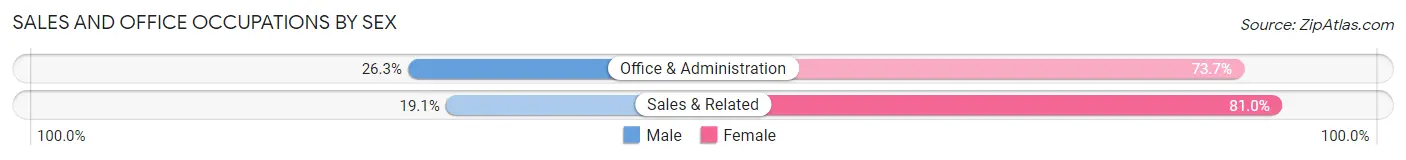
| Occupation | Male | Female |
| Sales & Related | 4 (19.1%) | 17 (80.9%) |
| Office & Administration | 5 (26.3%) | 14 (73.7%) |
| Total (Category) | 9 (22.5%) | 31 (77.5%) |
| Total (Overall) | 95 (54.3%) | 80 (45.7%) |
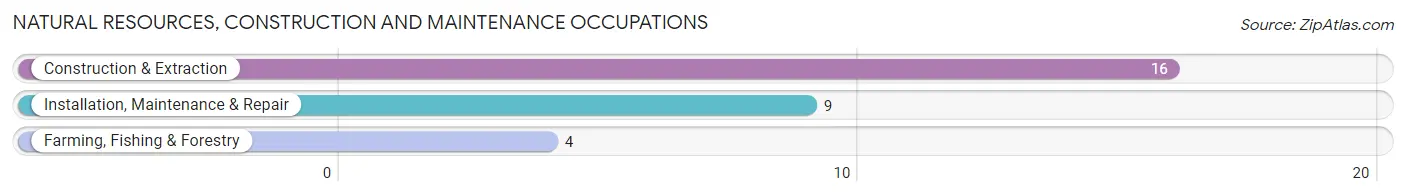
Natural Resources, Construction and Maintenance Occupations
The most common Natural Resources, Construction and Maintenance occupations in Binger are Construction & Extraction (16 | 9.1%), Installation, Maintenance & Repair (9 | 5.1%), and Farming, Fishing & Forestry (4 | 2.3%).
Natural Resources, Construction and Maintenance Occupations by Sex
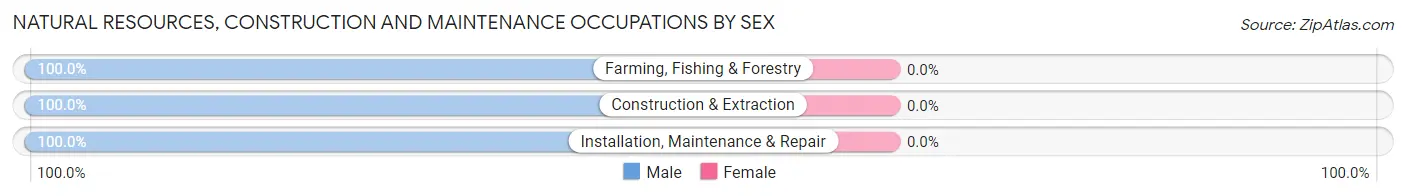
| Occupation | Male | Female |
| Farming, Fishing & Forestry | 4 (100.0%) | 0 (0.0%) |
| Construction & Extraction | 16 (100.0%) | 0 (0.0%) |
| Installation, Maintenance & Repair | 9 (100.0%) | 0 (0.0%) |
| Total (Category) | 29 (100.0%) | 0 (0.0%) |
| Total (Overall) | 95 (54.3%) | 80 (45.7%) |
Production, Transportation and Moving Occupations
The most common Production, Transportation and Moving occupations in Binger are Production (10 | 5.7%), Transportation (8 | 4.6%), and Material Moving (5 | 2.9%).
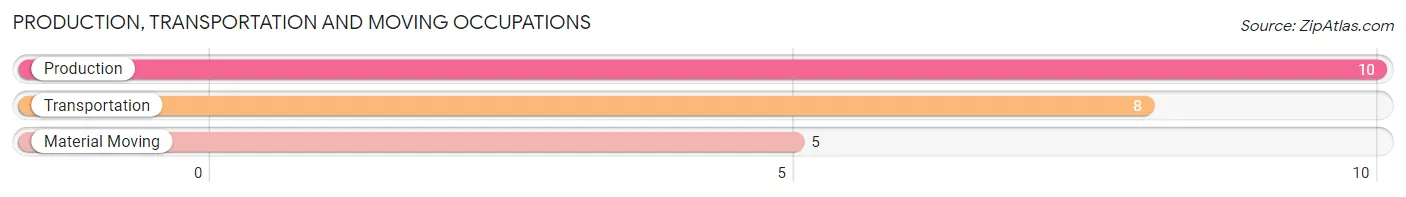
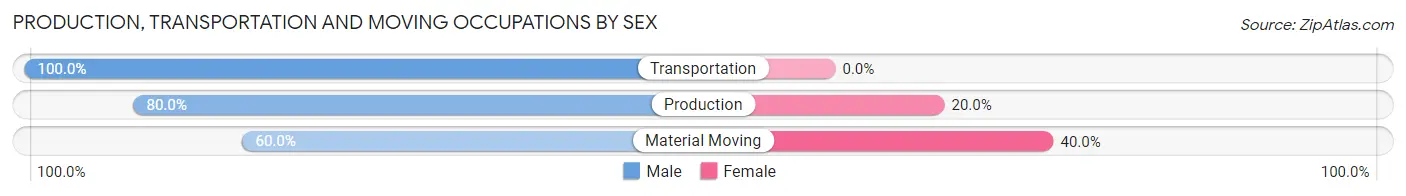
Production, Transportation and Moving Occupations by Sex
| Occupation | Male | Female |
| Production | 8 (80.0%) | 2 (20.0%) |
| Transportation | 8 (100.0%) | 0 (0.0%) |
| Material Moving | 3 (60.0%) | 2 (40.0%) |
| Total (Category) | 19 (82.6%) | 4 (17.4%) |
| Total (Overall) | 95 (54.3%) | 80 (45.7%) |
Employment Industries by Sex in Binger
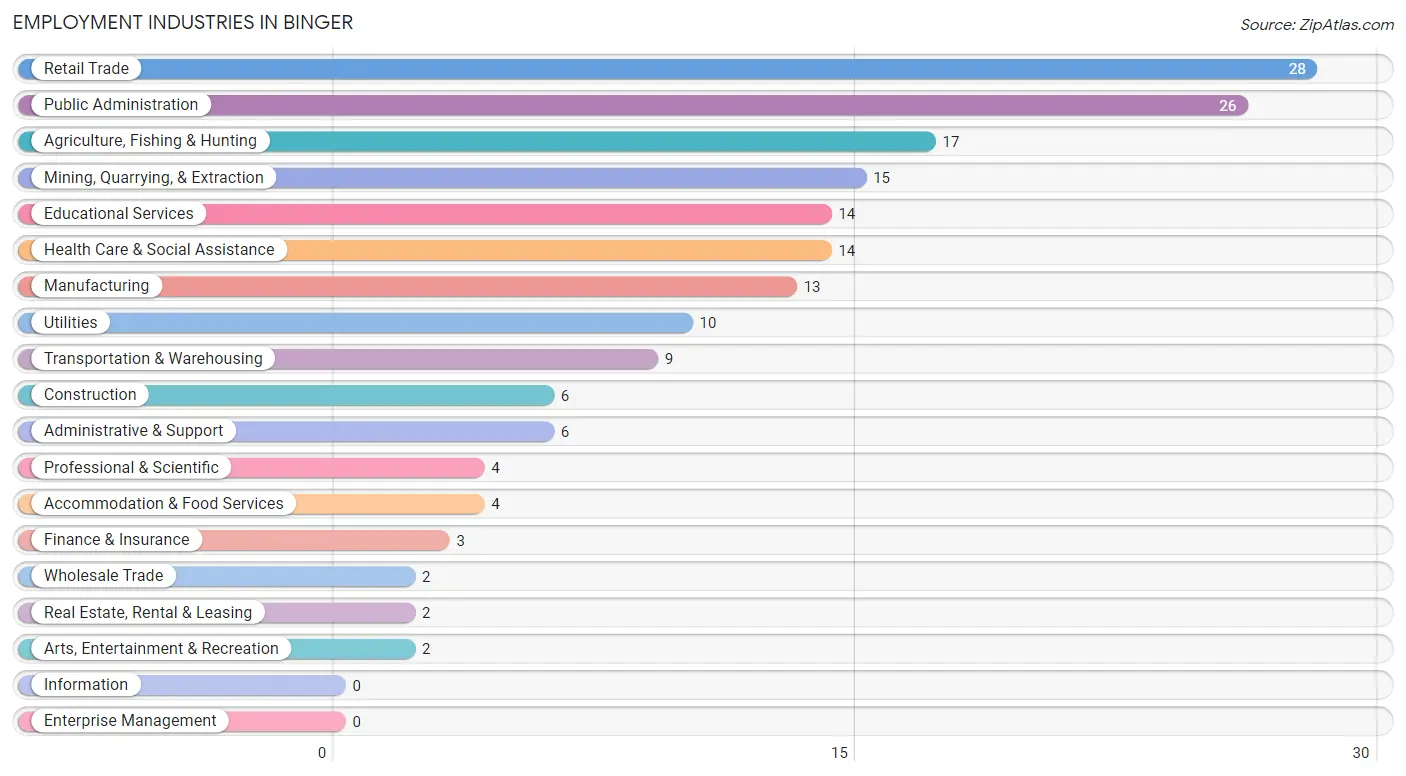
Employment Industries in Binger
The major employment industries in Binger include Retail Trade (28 | 16.0%), Public Administration (26 | 14.9%), Agriculture, Fishing & Hunting (17 | 9.7%), Mining, Quarrying, & Extraction (15 | 8.6%), and Educational Services (14 | 8.0%).
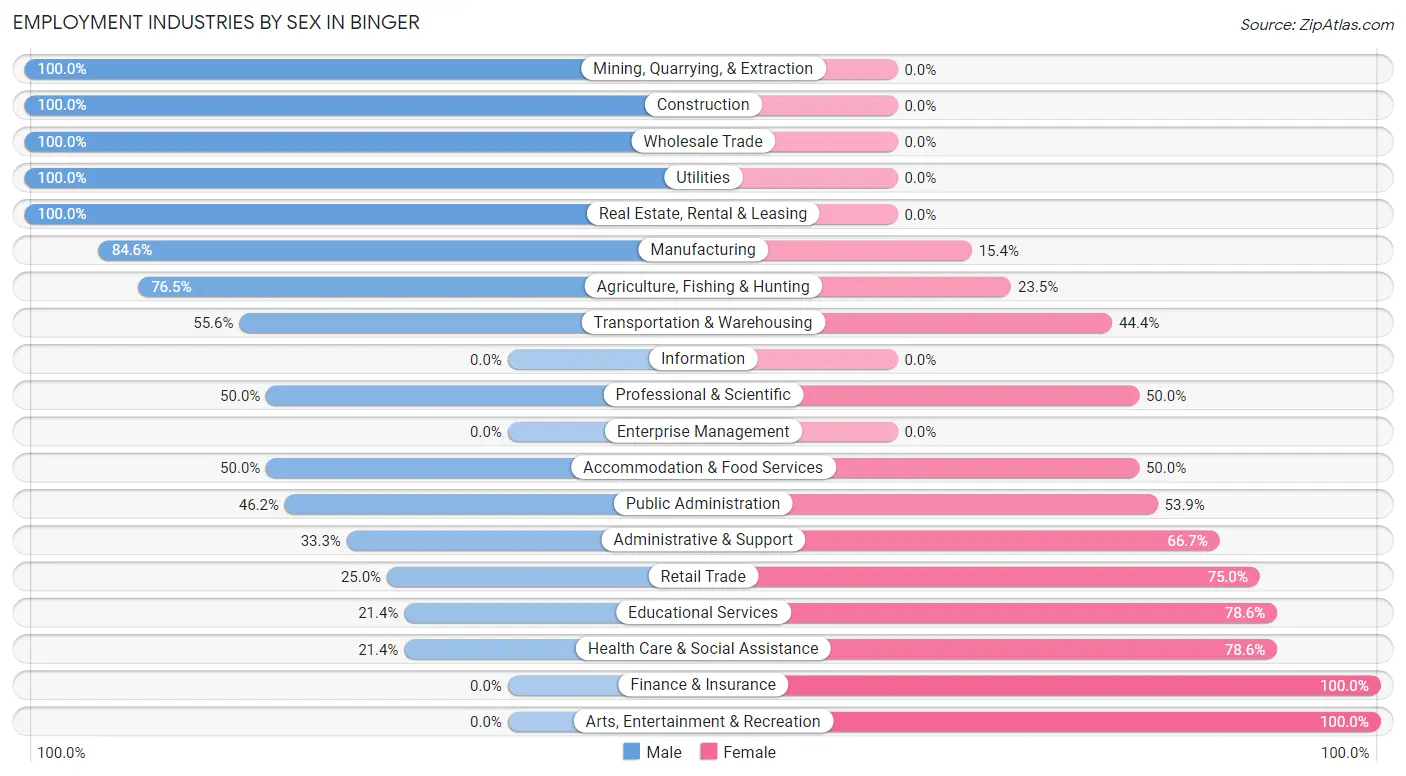
Employment Industries by Sex in Binger
The Binger industries that see more men than women are Mining, Quarrying, & Extraction (100.0%), Construction (100.0%), and Wholesale Trade (100.0%), whereas the industries that tend to have a higher number of women are Finance & Insurance (100.0%), Arts, Entertainment & Recreation (100.0%), and Educational Services (78.6%).
| Industry | Male | Female |
| Agriculture, Fishing & Hunting | 13 (76.5%) | 4 (23.5%) |
| Mining, Quarrying, & Extraction | 15 (100.0%) | 0 (0.0%) |
| Construction | 6 (100.0%) | 0 (0.0%) |
| Manufacturing | 11 (84.6%) | 2 (15.4%) |
| Wholesale Trade | 2 (100.0%) | 0 (0.0%) |
| Retail Trade | 7 (25.0%) | 21 (75.0%) |
| Transportation & Warehousing | 5 (55.6%) | 4 (44.4%) |
| Utilities | 10 (100.0%) | 0 (0.0%) |
| Information | 0 (0.0%) | 0 (0.0%) |
| Finance & Insurance | 0 (0.0%) | 3 (100.0%) |
| Real Estate, Rental & Leasing | 2 (100.0%) | 0 (0.0%) |
| Professional & Scientific | 2 (50.0%) | 2 (50.0%) |
| Enterprise Management | 0 (0.0%) | 0 (0.0%) |
| Administrative & Support | 2 (33.3%) | 4 (66.7%) |
| Educational Services | 3 (21.4%) | 11 (78.6%) |
| Health Care & Social Assistance | 3 (21.4%) | 11 (78.6%) |
| Arts, Entertainment & Recreation | 0 (0.0%) | 2 (100.0%) |
| Accommodation & Food Services | 2 (50.0%) | 2 (50.0%) |
| Public Administration | 12 (46.2%) | 14 (53.8%) |
| Total | 95 (54.3%) | 80 (45.7%) |
Education in Binger
School Enrollment in Binger
The most common levels of schooling among the 76 students in Binger are high school (28 | 36.8%), middle school (23 | 30.3%), and elementary school (16 | 21.0%).
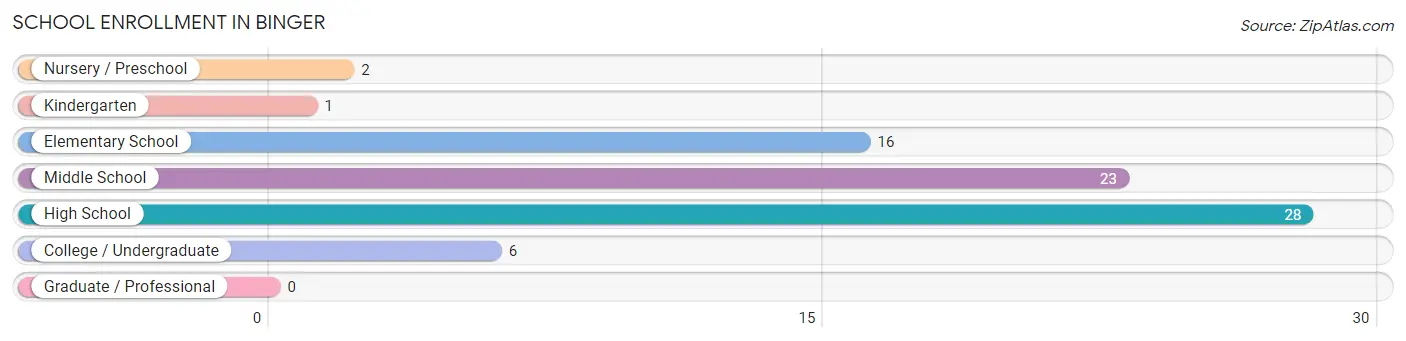
| School Level | # Students | % Students |
| Nursery / Preschool | 2 | 2.6% |
| Kindergarten | 1 | 1.3% |
| Elementary School | 16 | 21.0% |
| Middle School | 23 | 30.3% |
| High School | 28 | 36.8% |
| College / Undergraduate | 6 | 7.9% |
| Graduate / Professional | 0 | 0.0% |
| Total | 76 | 100.0% |
School Enrollment by Age by Funding Source in Binger
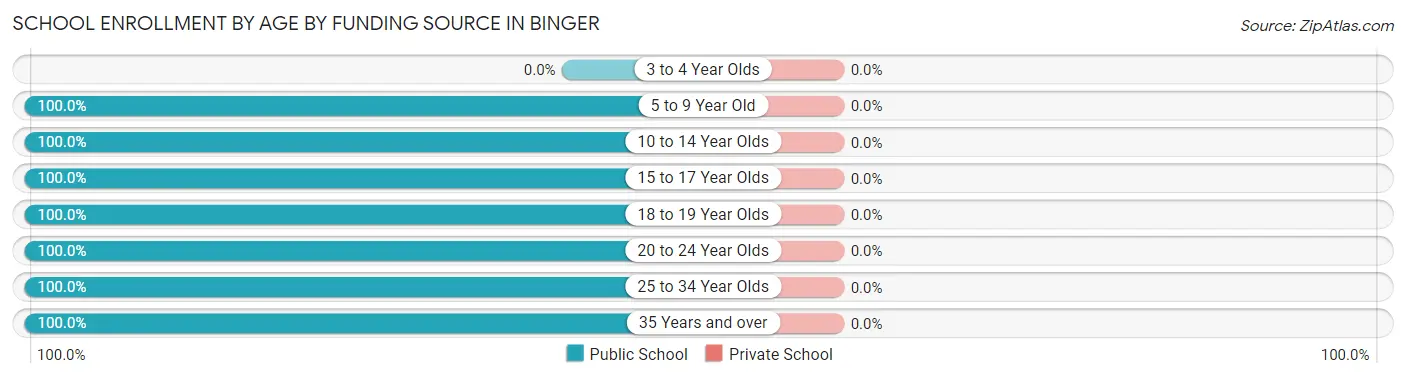
| Age Bracket | Public School | Private School |
| 3 to 4 Year Olds | 0 (0.0%) | 0 (0.0%) |
| 5 to 9 Year Old | 22 (100.0%) | 0 (0.0%) |
| 10 to 14 Year Olds | 20 (100.0%) | 0 (0.0%) |
| 15 to 17 Year Olds | 23 (100.0%) | 0 (0.0%) |
| 18 to 19 Year Olds | 5 (100.0%) | 0 (0.0%) |
| 20 to 24 Year Olds | 1 (100.0%) | 0 (0.0%) |
| 25 to 34 Year Olds | 4 (100.0%) | 0 (0.0%) |
| 35 Years and over | 1 (100.0%) | 0 (0.0%) |
| Total | 76 (100.0%) | 0 (0.0%) |
Educational Attainment by Field of Study in Binger
Business (20 | 38.5%), education (13 | 25.0%), engineering (7 | 13.5%), science & technology (5 | 9.6%), and social sciences (2 | 3.8%) are the most common fields of study among 52 individuals in Binger who have obtained a bachelor's degree or higher.
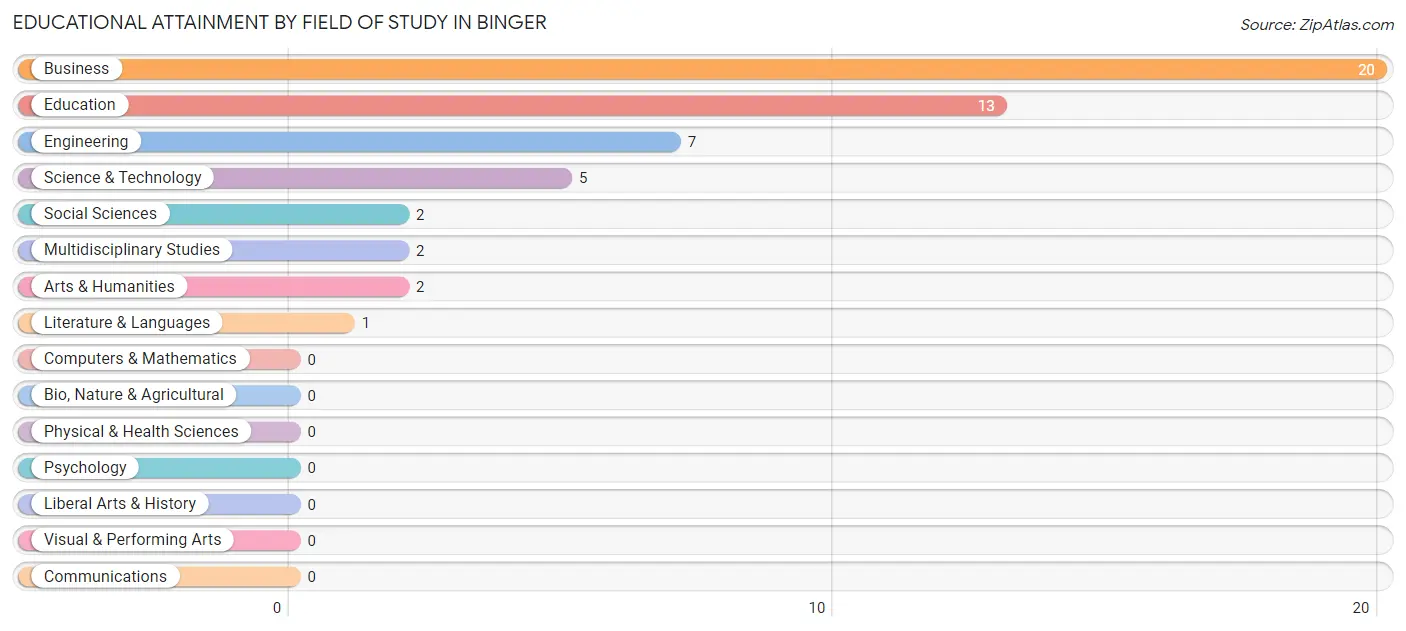
| Field of Study | # Graduates | % Graduates |
| Computers & Mathematics | 0 | 0.0% |
| Bio, Nature & Agricultural | 0 | 0.0% |
| Physical & Health Sciences | 0 | 0.0% |
| Psychology | 0 | 0.0% |
| Social Sciences | 2 | 3.8% |
| Engineering | 7 | 13.5% |
| Multidisciplinary Studies | 2 | 3.8% |
| Science & Technology | 5 | 9.6% |
| Business | 20 | 38.5% |
| Education | 13 | 25.0% |
| Literature & Languages | 1 | 1.9% |
| Liberal Arts & History | 0 | 0.0% |
| Visual & Performing Arts | 0 | 0.0% |
| Communications | 0 | 0.0% |
| Arts & Humanities | 2 | 3.8% |
| Total | 52 | 100.0% |
Transportation & Commute in Binger
Vehicle Availability by Sex in Binger
The most prevalent vehicle ownership categories in Binger are males with 2 vehicles (38, accounting for 40.9%) and females with 2 vehicles (23, making up 59.4%).
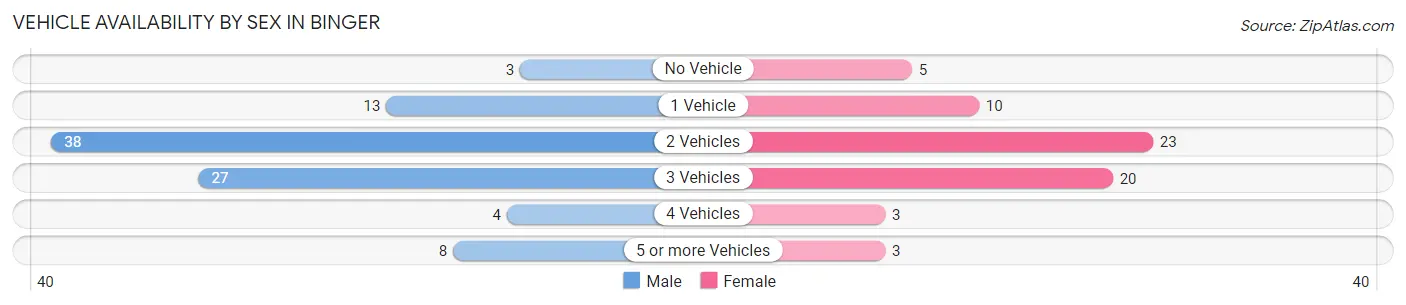
| Vehicles Available | Male | Female |
| No Vehicle | 3 (3.2%) | 5 (7.8%) |
| 1 Vehicle | 13 (14.0%) | 10 (15.6%) |
| 2 Vehicles | 38 (40.9%) | 23 (35.9%) |
| 3 Vehicles | 27 (29.0%) | 20 (31.2%) |
| 4 Vehicles | 4 (4.3%) | 3 (4.7%) |
| 5 or more Vehicles | 8 (8.6%) | 3 (4.7%) |
| Total | 93 (100.0%) | 64 (100.0%) |
Commute Time in Binger
The most frequently occuring commute durations in Binger are 60 to 89 minutes (25 commuters, 16.3%), less than 5 minutes (23 commuters, 15.0%), and 15 to 19 minutes (21 commuters, 13.7%).
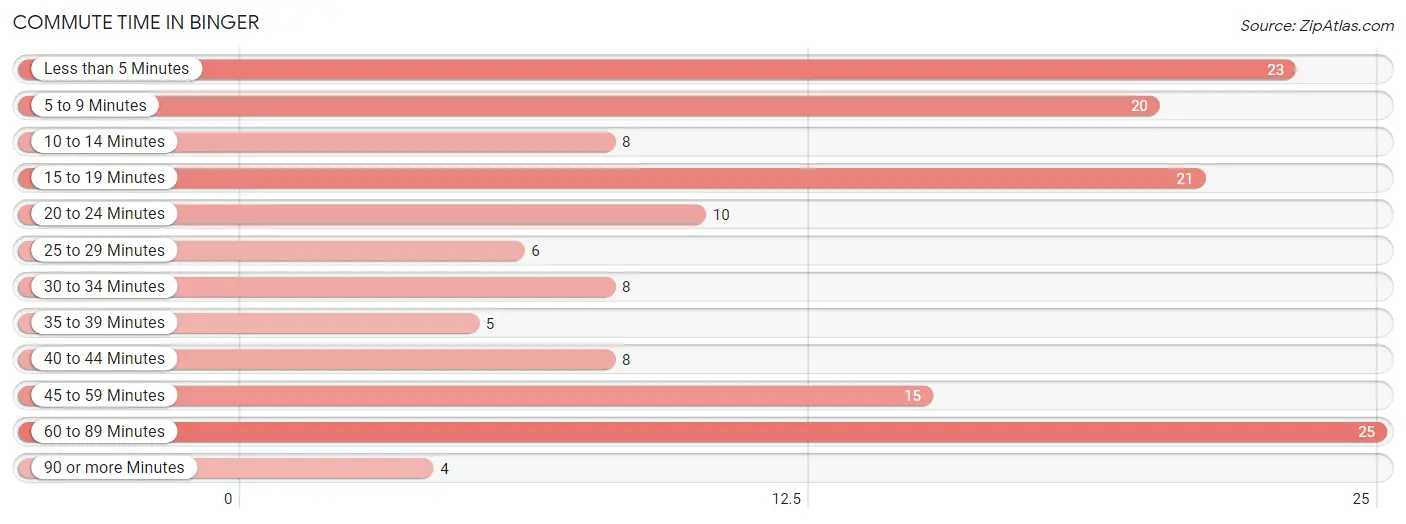
| Commute Time | # Commuters | % Commuters |
| Less than 5 Minutes | 23 | 15.0% |
| 5 to 9 Minutes | 20 | 13.1% |
| 10 to 14 Minutes | 8 | 5.2% |
| 15 to 19 Minutes | 21 | 13.7% |
| 20 to 24 Minutes | 10 | 6.5% |
| 25 to 29 Minutes | 6 | 3.9% |
| 30 to 34 Minutes | 8 | 5.2% |
| 35 to 39 Minutes | 5 | 3.3% |
| 40 to 44 Minutes | 8 | 5.2% |
| 45 to 59 Minutes | 15 | 9.8% |
| 60 to 89 Minutes | 25 | 16.3% |
| 90 or more Minutes | 4 | 2.6% |
Commute Time by Sex in Binger
The most common commute times in Binger are 5 to 9 minutes (15 commuters, 16.5%) for males and less than 5 minutes (17 commuters, 27.4%) for females.
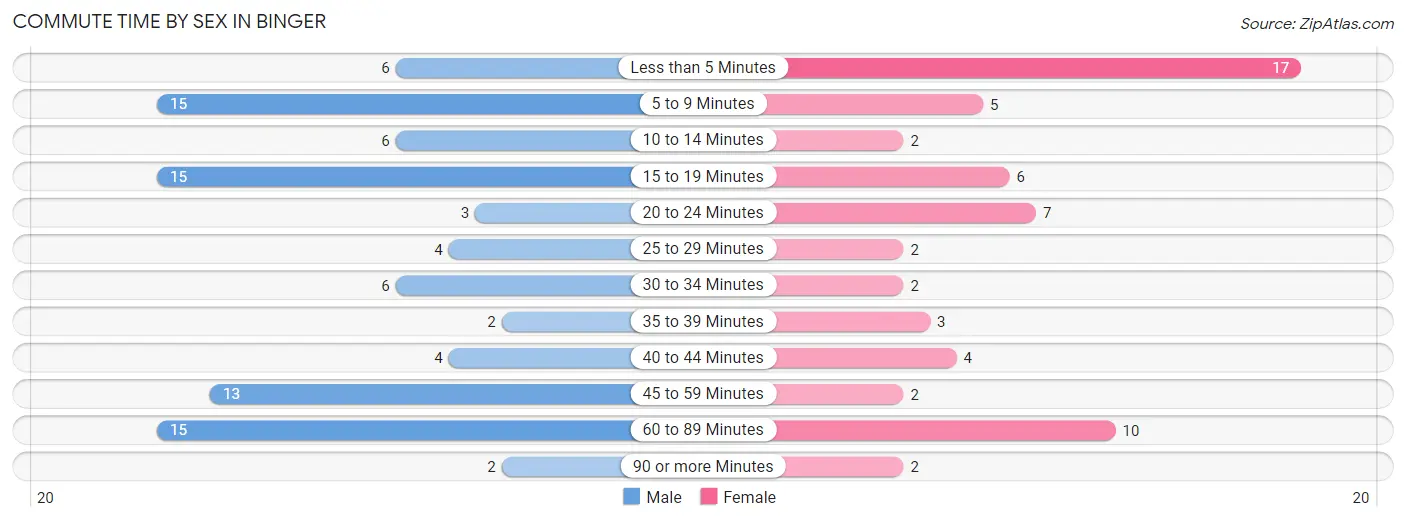
| Commute Time | Male | Female |
| Less than 5 Minutes | 6 (6.6%) | 17 (27.4%) |
| 5 to 9 Minutes | 15 (16.5%) | 5 (8.1%) |
| 10 to 14 Minutes | 6 (6.6%) | 2 (3.2%) |
| 15 to 19 Minutes | 15 (16.5%) | 6 (9.7%) |
| 20 to 24 Minutes | 3 (3.3%) | 7 (11.3%) |
| 25 to 29 Minutes | 4 (4.4%) | 2 (3.2%) |
| 30 to 34 Minutes | 6 (6.6%) | 2 (3.2%) |
| 35 to 39 Minutes | 2 (2.2%) | 3 (4.8%) |
| 40 to 44 Minutes | 4 (4.4%) | 4 (6.5%) |
| 45 to 59 Minutes | 13 (14.3%) | 2 (3.2%) |
| 60 to 89 Minutes | 15 (16.5%) | 10 (16.1%) |
| 90 or more Minutes | 2 (2.2%) | 2 (3.2%) |
Time of Departure to Work by Sex in Binger
The most frequent times of departure to work in Binger are 6:00 AM to 6:29 AM (32, 35.2%) for males and 7:00 AM to 7:29 AM (13, 21.0%) for females.
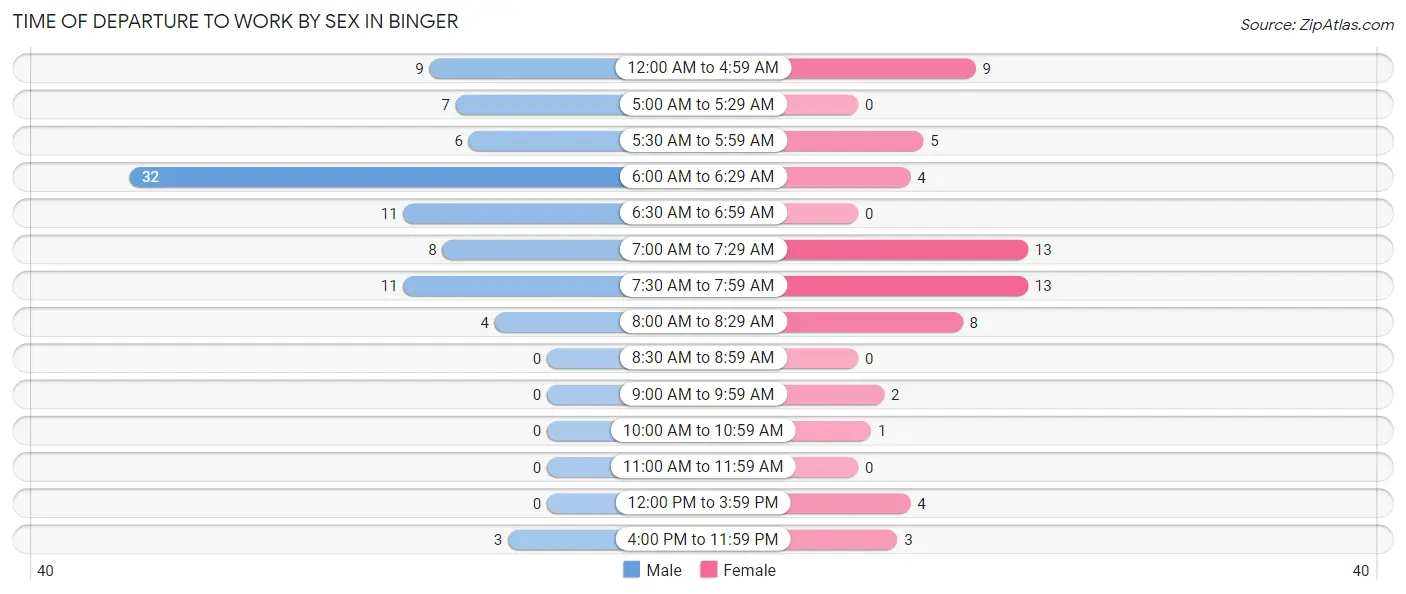
| Time of Departure | Male | Female |
| 12:00 AM to 4:59 AM | 9 (9.9%) | 9 (14.5%) |
| 5:00 AM to 5:29 AM | 7 (7.7%) | 0 (0.0%) |
| 5:30 AM to 5:59 AM | 6 (6.6%) | 5 (8.1%) |
| 6:00 AM to 6:29 AM | 32 (35.2%) | 4 (6.5%) |
| 6:30 AM to 6:59 AM | 11 (12.1%) | 0 (0.0%) |
| 7:00 AM to 7:29 AM | 8 (8.8%) | 13 (21.0%) |
| 7:30 AM to 7:59 AM | 11 (12.1%) | 13 (21.0%) |
| 8:00 AM to 8:29 AM | 4 (4.4%) | 8 (12.9%) |
| 8:30 AM to 8:59 AM | 0 (0.0%) | 0 (0.0%) |
| 9:00 AM to 9:59 AM | 0 (0.0%) | 2 (3.2%) |
| 10:00 AM to 10:59 AM | 0 (0.0%) | 1 (1.6%) |
| 11:00 AM to 11:59 AM | 0 (0.0%) | 0 (0.0%) |
| 12:00 PM to 3:59 PM | 0 (0.0%) | 4 (6.5%) |
| 4:00 PM to 11:59 PM | 3 (3.3%) | 3 (4.8%) |
| Total | 91 (100.0%) | 62 (100.0%) |
Housing Occupancy in Binger
Occupancy by Ownership in Binger
Of the total 208 dwellings in Binger, owner-occupied units account for 139 (66.8%), while renter-occupied units make up 69 (33.2%).
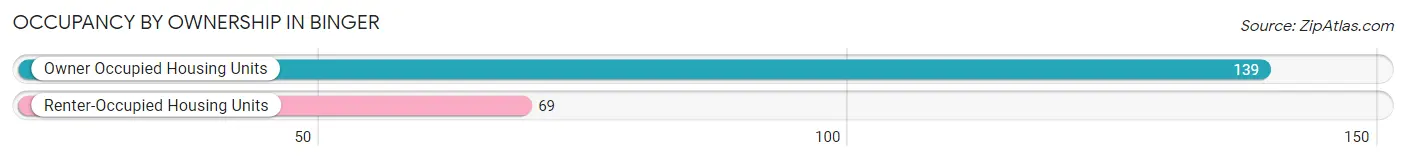
| Occupancy | # Housing Units | % Housing Units |
| Owner Occupied Housing Units | 139 | 66.8% |
| Renter-Occupied Housing Units | 69 | 33.2% |
| Total Occupied Housing Units | 208 | 100.0% |
Occupancy by Household Size in Binger
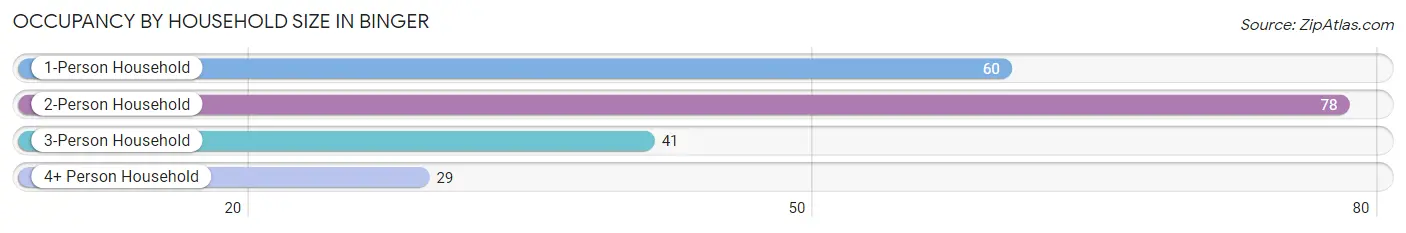
| Household Size | # Housing Units | % Housing Units |
| 1-Person Household | 60 | 28.8% |
| 2-Person Household | 78 | 37.5% |
| 3-Person Household | 41 | 19.7% |
| 4+ Person Household | 29 | 13.9% |
| Total Housing Units | 208 | 100.0% |
Occupancy by Ownership by Household Size in Binger
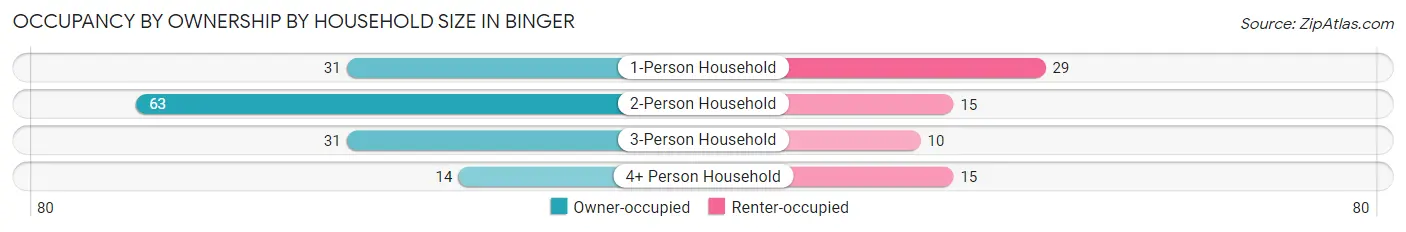
| Household Size | Owner-occupied | Renter-occupied |
| 1-Person Household | 31 (51.7%) | 29 (48.3%) |
| 2-Person Household | 63 (80.8%) | 15 (19.2%) |
| 3-Person Household | 31 (75.6%) | 10 (24.4%) |
| 4+ Person Household | 14 (48.3%) | 15 (51.7%) |
| Total Housing Units | 139 (66.8%) | 69 (33.2%) |
Occupancy by Educational Attainment in Binger
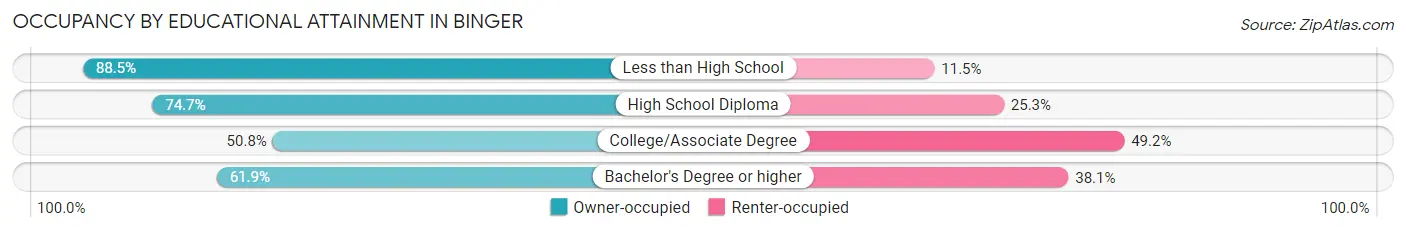
| Household Size | Owner-occupied | Renter-occupied |
| Less than High School | 23 (88.5%) | 3 (11.5%) |
| High School Diploma | 59 (74.7%) | 20 (25.3%) |
| College/Associate Degree | 31 (50.8%) | 30 (49.2%) |
| Bachelor's Degree or higher | 26 (61.9%) | 16 (38.1%) |
Occupancy by Age of Householder in Binger
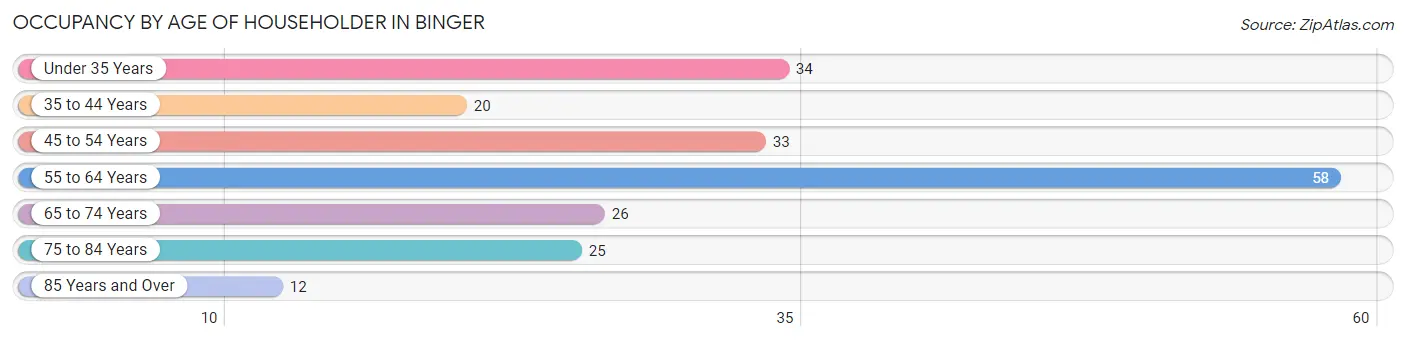
| Age Bracket | # Households | % Households |
| Under 35 Years | 34 | 16.4% |
| 35 to 44 Years | 20 | 9.6% |
| 45 to 54 Years | 33 | 15.9% |
| 55 to 64 Years | 58 | 27.9% |
| 65 to 74 Years | 26 | 12.5% |
| 75 to 84 Years | 25 | 12.0% |
| 85 Years and Over | 12 | 5.8% |
| Total | 208 | 100.0% |
Housing Finances in Binger
Median Income by Occupancy in Binger
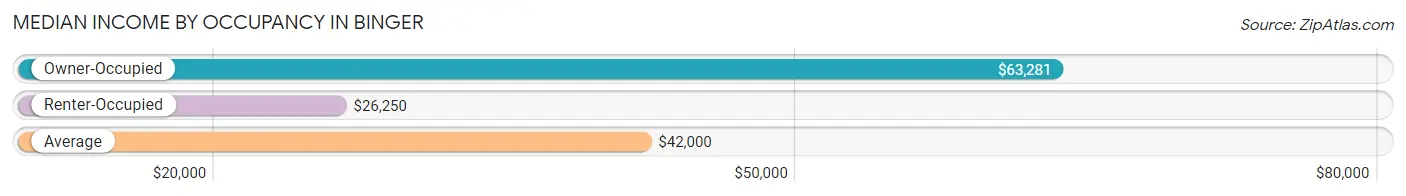
| Occupancy Type | # Households | Median Income |
| Owner-Occupied | 139 (66.8%) | $63,281 |
| Renter-Occupied | 69 (33.2%) | $26,250 |
| Average | 208 (100.0%) | $42,000 |
Occupancy by Householder Income Bracket in Binger
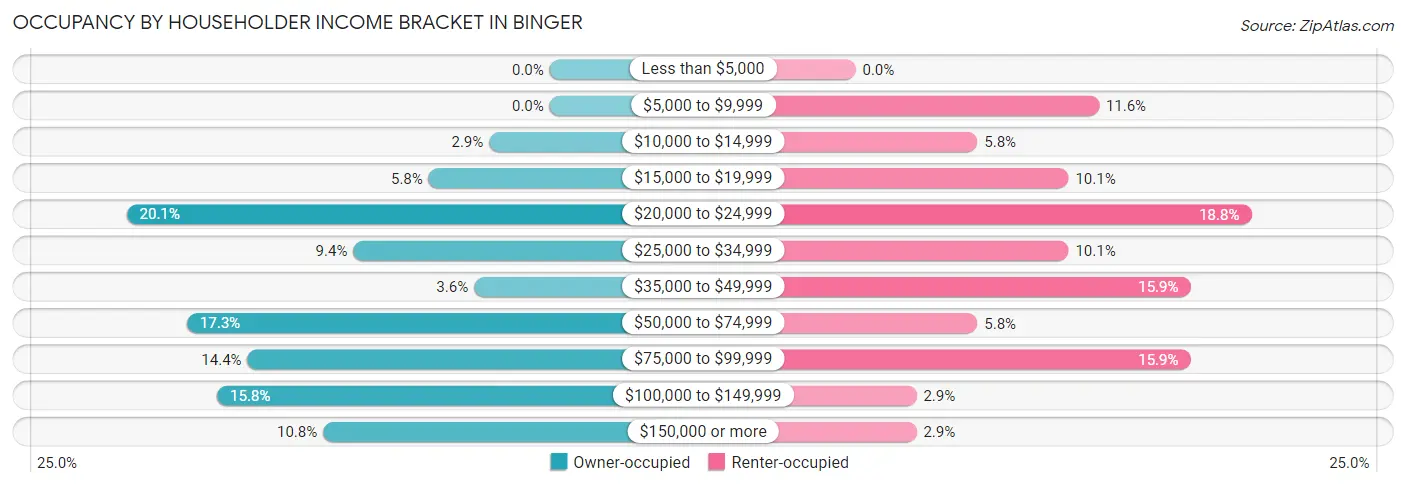
| Income Bracket | Owner-occupied | Renter-occupied |
| Less than $5,000 | 0 (0.0%) | 0 (0.0%) |
| $5,000 to $9,999 | 0 (0.0%) | 8 (11.6%) |
| $10,000 to $14,999 | 4 (2.9%) | 4 (5.8%) |
| $15,000 to $19,999 | 8 (5.8%) | 7 (10.1%) |
| $20,000 to $24,999 | 28 (20.1%) | 13 (18.8%) |
| $25,000 to $34,999 | 13 (9.3%) | 7 (10.1%) |
| $35,000 to $49,999 | 5 (3.6%) | 11 (15.9%) |
| $50,000 to $74,999 | 24 (17.3%) | 4 (5.8%) |
| $75,000 to $99,999 | 20 (14.4%) | 11 (15.9%) |
| $100,000 to $149,999 | 22 (15.8%) | 2 (2.9%) |
| $150,000 or more | 15 (10.8%) | 2 (2.9%) |
| Total | 139 (100.0%) | 69 (100.0%) |
Monthly Housing Cost Tiers in Binger
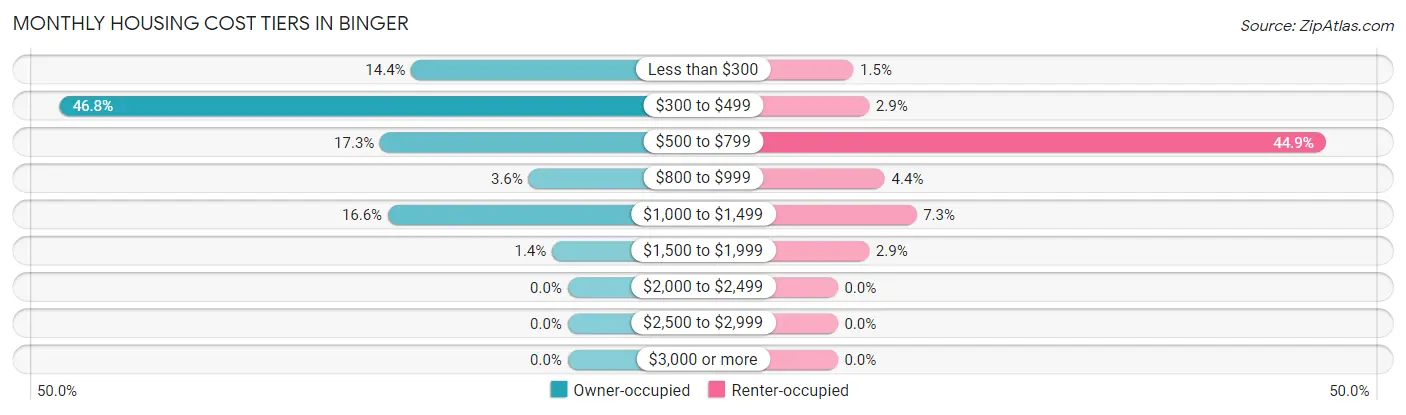
| Monthly Cost | Owner-occupied | Renter-occupied |
| Less than $300 | 20 (14.4%) | 1 (1.5%) |
| $300 to $499 | 65 (46.8%) | 2 (2.9%) |
| $500 to $799 | 24 (17.3%) | 31 (44.9%) |
| $800 to $999 | 5 (3.6%) | 3 (4.3%) |
| $1,000 to $1,499 | 23 (16.6%) | 5 (7.2%) |
| $1,500 to $1,999 | 2 (1.4%) | 2 (2.9%) |
| $2,000 to $2,499 | 0 (0.0%) | 0 (0.0%) |
| $2,500 to $2,999 | 0 (0.0%) | 0 (0.0%) |
| $3,000 or more | 0 (0.0%) | 0 (0.0%) |
| Total | 139 (100.0%) | 69 (100.0%) |
Physical Housing Characteristics in Binger
Housing Structures in Binger
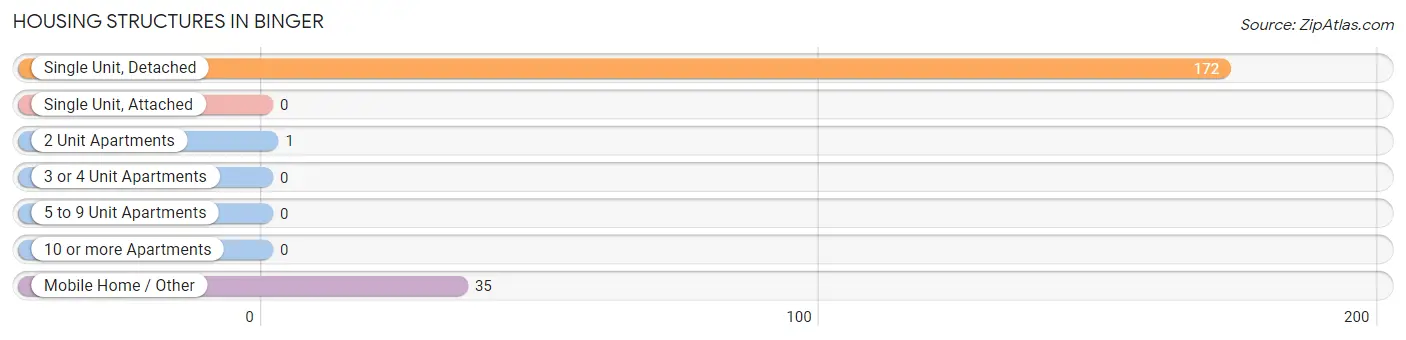
| Structure Type | # Housing Units | % Housing Units |
| Single Unit, Detached | 172 | 82.7% |
| Single Unit, Attached | 0 | 0.0% |
| 2 Unit Apartments | 1 | 0.5% |
| 3 or 4 Unit Apartments | 0 | 0.0% |
| 5 to 9 Unit Apartments | 0 | 0.0% |
| 10 or more Apartments | 0 | 0.0% |
| Mobile Home / Other | 35 | 16.8% |
| Total | 208 | 100.0% |
Housing Structures by Occupancy in Binger
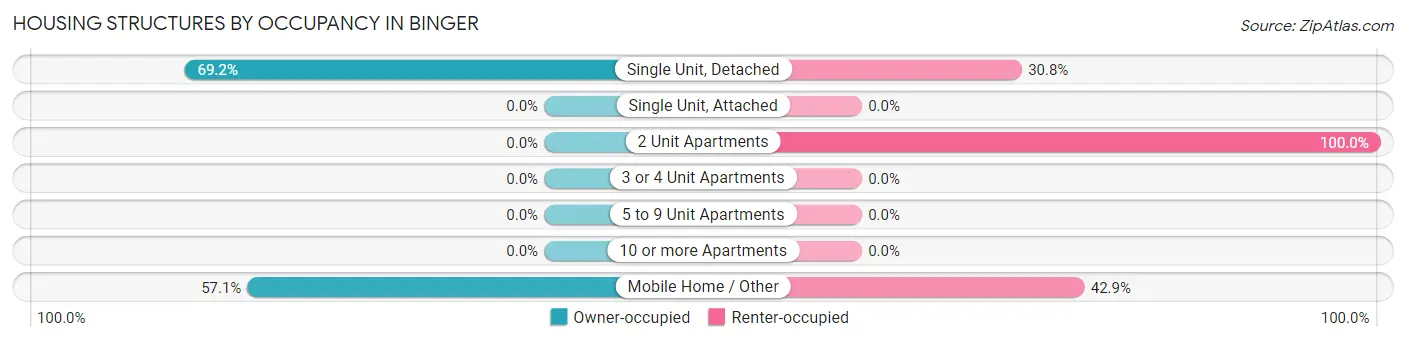
| Structure Type | Owner-occupied | Renter-occupied |
| Single Unit, Detached | 119 (69.2%) | 53 (30.8%) |
| Single Unit, Attached | 0 (0.0%) | 0 (0.0%) |
| 2 Unit Apartments | 0 (0.0%) | 1 (100.0%) |
| 3 or 4 Unit Apartments | 0 (0.0%) | 0 (0.0%) |
| 5 to 9 Unit Apartments | 0 (0.0%) | 0 (0.0%) |
| 10 or more Apartments | 0 (0.0%) | 0 (0.0%) |
| Mobile Home / Other | 20 (57.1%) | 15 (42.9%) |
| Total | 139 (66.8%) | 69 (33.2%) |
Housing Structures by Number of Rooms in Binger
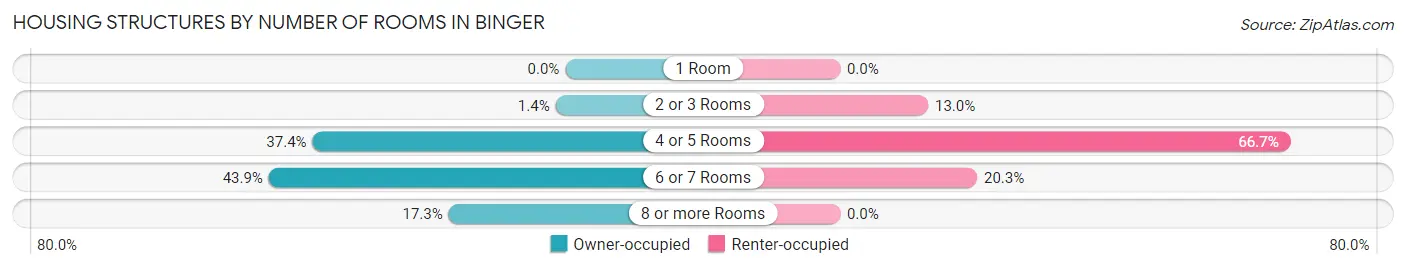
| Number of Rooms | Owner-occupied | Renter-occupied |
| 1 Room | 0 (0.0%) | 0 (0.0%) |
| 2 or 3 Rooms | 2 (1.4%) | 9 (13.0%) |
| 4 or 5 Rooms | 52 (37.4%) | 46 (66.7%) |
| 6 or 7 Rooms | 61 (43.9%) | 14 (20.3%) |
| 8 or more Rooms | 24 (17.3%) | 0 (0.0%) |
| Total | 139 (100.0%) | 69 (100.0%) |
Housing Structure by Heating Type in Binger
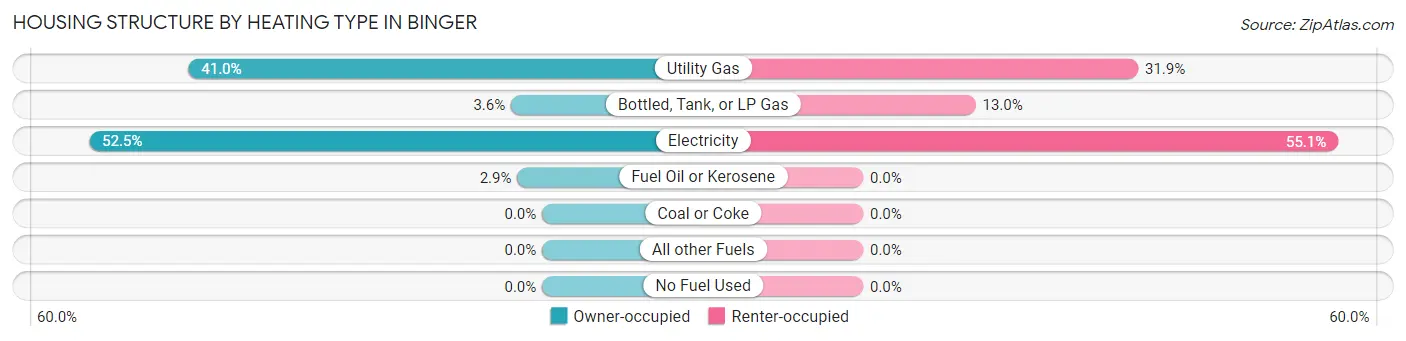
| Heating Type | Owner-occupied | Renter-occupied |
| Utility Gas | 57 (41.0%) | 22 (31.9%) |
| Bottled, Tank, or LP Gas | 5 (3.6%) | 9 (13.0%) |
| Electricity | 73 (52.5%) | 38 (55.1%) |
| Fuel Oil or Kerosene | 4 (2.9%) | 0 (0.0%) |
| Coal or Coke | 0 (0.0%) | 0 (0.0%) |
| All other Fuels | 0 (0.0%) | 0 (0.0%) |
| No Fuel Used | 0 (0.0%) | 0 (0.0%) |
| Total | 139 (100.0%) | 69 (100.0%) |
Household Vehicle Usage in Binger
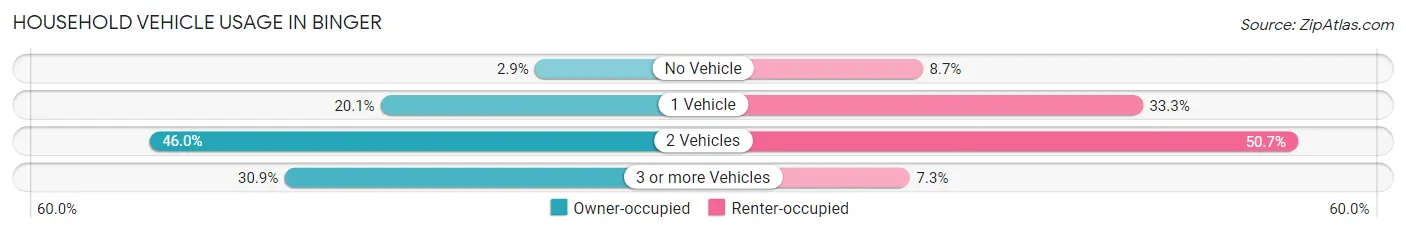
| Vehicles per Household | Owner-occupied | Renter-occupied |
| No Vehicle | 4 (2.9%) | 6 (8.7%) |
| 1 Vehicle | 28 (20.1%) | 23 (33.3%) |
| 2 Vehicles | 64 (46.0%) | 35 (50.7%) |
| 3 or more Vehicles | 43 (30.9%) | 5 (7.2%) |
| Total | 139 (100.0%) | 69 (100.0%) |
Real Estate & Mortgages in Binger
Real Estate and Mortgage Overview in Binger
| Characteristic | Without Mortgage | With Mortgage |
| Housing Units | 107 | 32 |
| Median Property Value | $101,300 | $137,500 |
| Median Household Income | $54,375 | $8 |
| Monthly Housing Costs | $418 | $0 |
| Real Estate Taxes | $256 | $0 |
Property Value by Mortgage Status in Binger
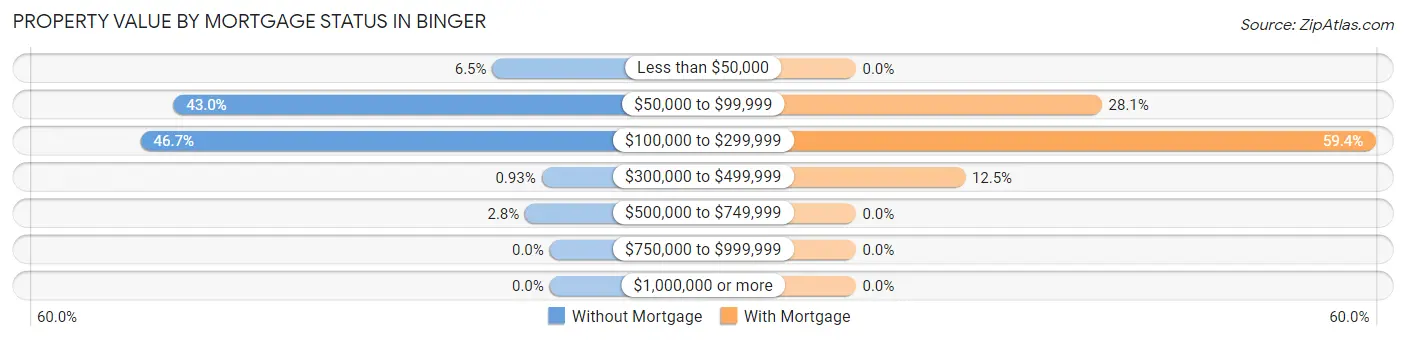
| Property Value | Without Mortgage | With Mortgage |
| Less than $50,000 | 7 (6.5%) | 0 (0.0%) |
| $50,000 to $99,999 | 46 (43.0%) | 9 (28.1%) |
| $100,000 to $299,999 | 50 (46.7%) | 19 (59.4%) |
| $300,000 to $499,999 | 1 (0.9%) | 4 (12.5%) |
| $500,000 to $749,999 | 3 (2.8%) | 0 (0.0%) |
| $750,000 to $999,999 | 0 (0.0%) | 0 (0.0%) |
| $1,000,000 or more | 0 (0.0%) | 0 (0.0%) |
| Total | 107 (100.0%) | 32 (100.0%) |
Household Income by Mortgage Status in Binger
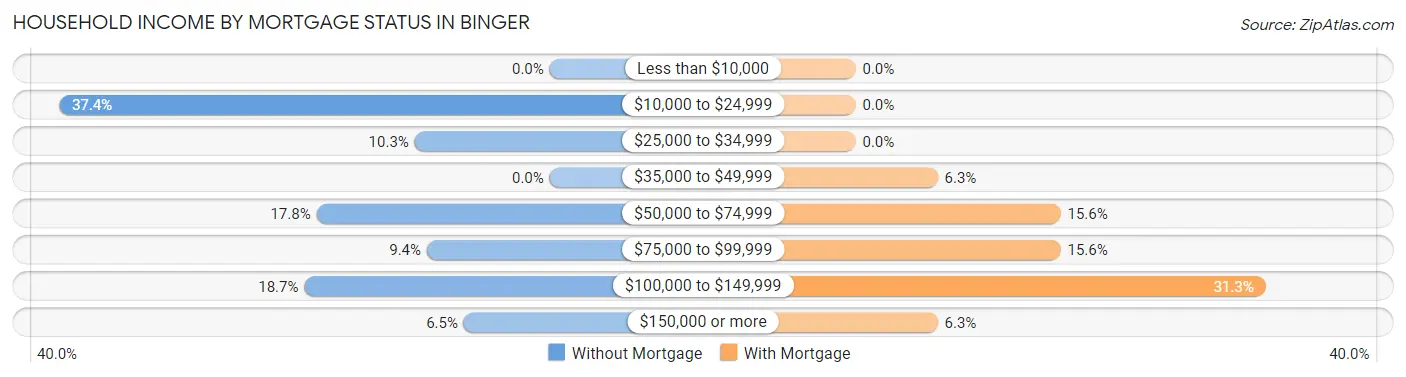
| Household Income | Without Mortgage | With Mortgage |
| Less than $10,000 | 0 (0.0%) | 0 (0.0%) |
| $10,000 to $24,999 | 40 (37.4%) | 0 (0.0%) |
| $25,000 to $34,999 | 11 (10.3%) | 0 (0.0%) |
| $35,000 to $49,999 | 0 (0.0%) | 2 (6.2%) |
| $50,000 to $74,999 | 19 (17.8%) | 5 (15.6%) |
| $75,000 to $99,999 | 10 (9.3%) | 5 (15.6%) |
| $100,000 to $149,999 | 20 (18.7%) | 10 (31.2%) |
| $150,000 or more | 7 (6.5%) | 2 (6.2%) |
| Total | 107 (100.0%) | 32 (100.0%) |
Property Value to Household Income Ratio in Binger
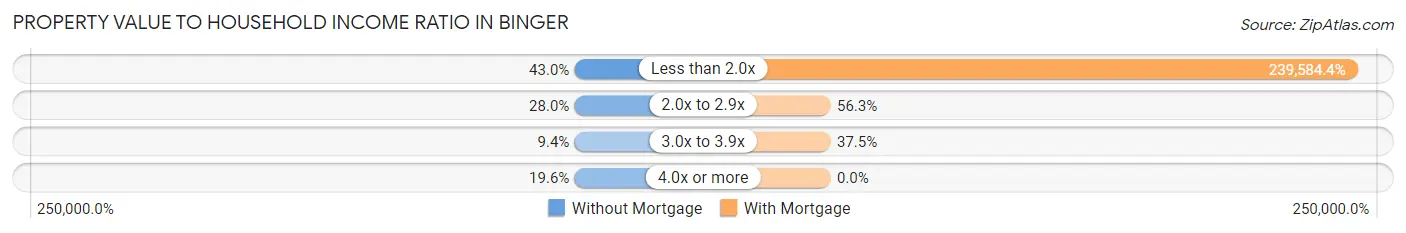
| Value-to-Income Ratio | Without Mortgage | With Mortgage |
| Less than 2.0x | 46 (43.0%) | 76,667 (239,584.4%) |
| 2.0x to 2.9x | 30 (28.0%) | 18 (56.2%) |
| 3.0x to 3.9x | 10 (9.3%) | 12 (37.5%) |
| 4.0x or more | 21 (19.6%) | 0 (0.0%) |
| Total | 107 (100.0%) | 32 (100.0%) |
Real Estate Taxes by Mortgage Status in Binger
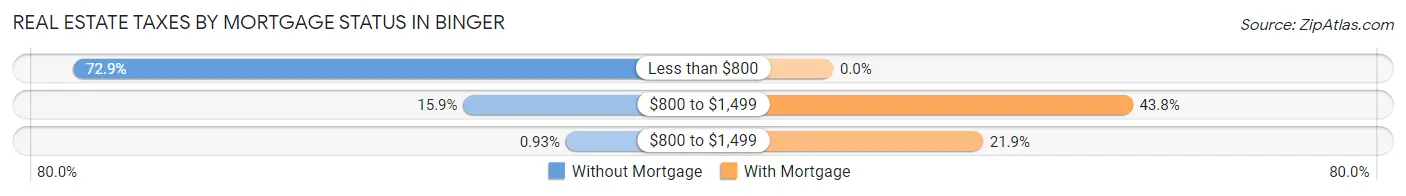
| Property Taxes | Without Mortgage | With Mortgage |
| Less than $800 | 78 (72.9%) | 0 (0.0%) |
| $800 to $1,499 | 17 (15.9%) | 14 (43.8%) |
| $800 to $1,499 | 1 (0.9%) | 7 (21.9%) |
| Total | 107 (100.0%) | 32 (100.0%) |
Health & Disability in Binger
Health Insurance Coverage by Age in Binger
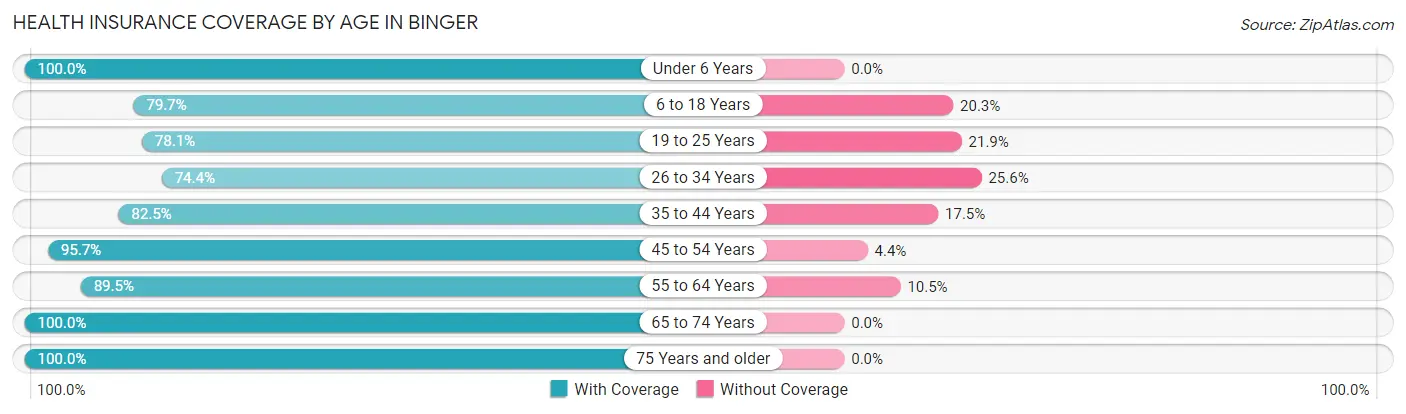
| Age Bracket | With Coverage | Without Coverage |
| Under 6 Years | 16 (100.0%) | 0 (0.0%) |
| 6 to 18 Years | 55 (79.7%) | 14 (20.3%) |
| 19 to 25 Years | 25 (78.1%) | 7 (21.9%) |
| 26 to 34 Years | 32 (74.4%) | 11 (25.6%) |
| 35 to 44 Years | 33 (82.5%) | 7 (17.5%) |
| 45 to 54 Years | 44 (95.7%) | 2 (4.3%) |
| 55 to 64 Years | 77 (89.5%) | 9 (10.5%) |
| 65 to 74 Years | 48 (100.0%) | 0 (0.0%) |
| 75 Years and older | 53 (100.0%) | 0 (0.0%) |
| Total | 383 (88.4%) | 50 (11.6%) |
Health Insurance Coverage by Citizenship Status in Binger
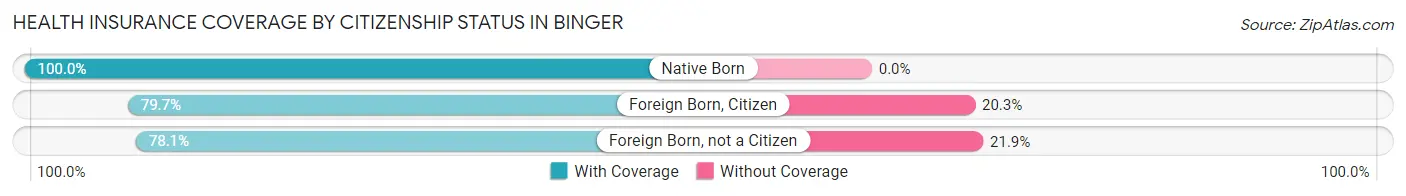
| Citizenship Status | With Coverage | Without Coverage |
| Native Born | 16 (100.0%) | 0 (0.0%) |
| Foreign Born, Citizen | 55 (79.7%) | 14 (20.3%) |
| Foreign Born, not a Citizen | 25 (78.1%) | 7 (21.9%) |
Health Insurance Coverage by Household Income in Binger
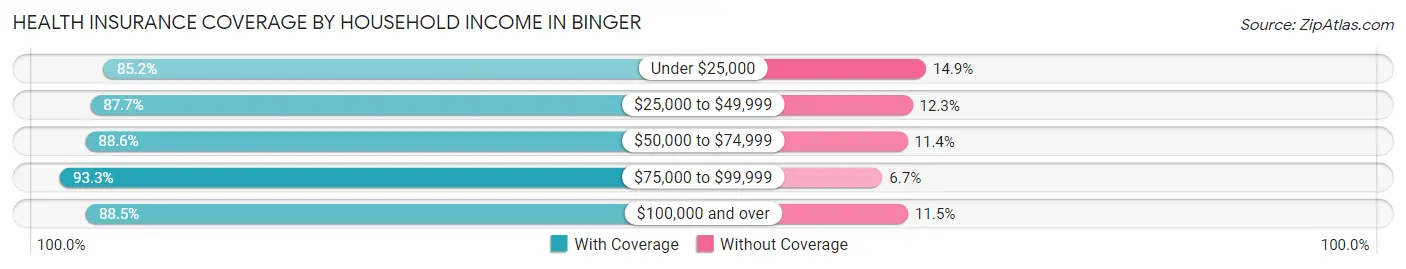
| Household Income | With Coverage | Without Coverage |
| Under $25,000 | 86 (85.2%) | 15 (14.8%) |
| $25,000 to $49,999 | 57 (87.7%) | 8 (12.3%) |
| $50,000 to $74,999 | 70 (88.6%) | 9 (11.4%) |
| $75,000 to $99,999 | 70 (93.3%) | 5 (6.7%) |
| $100,000 and over | 100 (88.5%) | 13 (11.5%) |
Public vs Private Health Insurance Coverage by Age in Binger
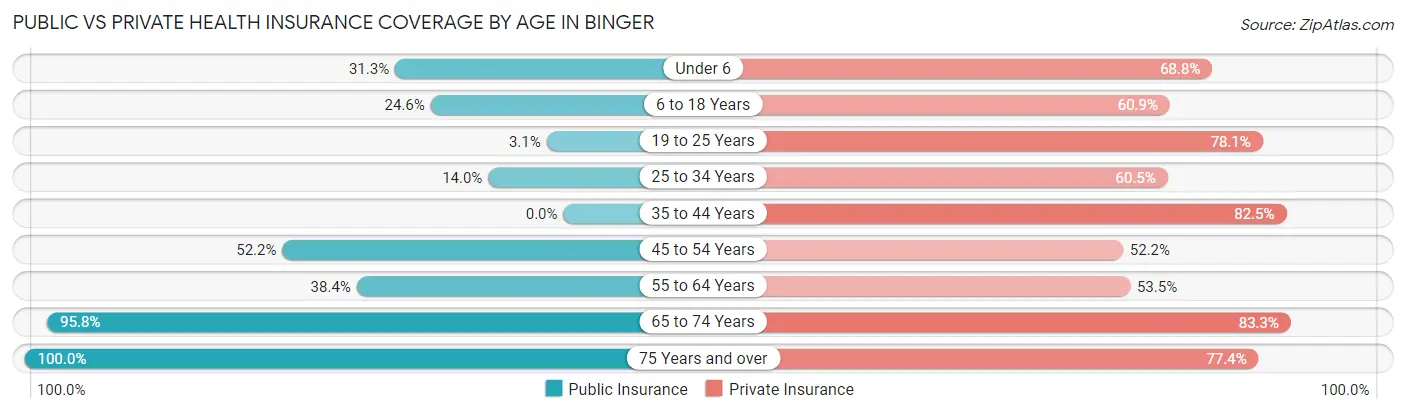
| Age Bracket | Public Insurance | Private Insurance |
| Under 6 | 5 (31.2%) | 11 (68.8%) |
| 6 to 18 Years | 17 (24.6%) | 42 (60.9%) |
| 19 to 25 Years | 1 (3.1%) | 25 (78.1%) |
| 25 to 34 Years | 6 (14.0%) | 26 (60.5%) |
| 35 to 44 Years | 0 (0.0%) | 33 (82.5%) |
| 45 to 54 Years | 24 (52.2%) | 24 (52.2%) |
| 55 to 64 Years | 33 (38.4%) | 46 (53.5%) |
| 65 to 74 Years | 46 (95.8%) | 40 (83.3%) |
| 75 Years and over | 53 (100.0%) | 41 (77.4%) |
| Total | 185 (42.7%) | 288 (66.5%) |
Disability Status by Sex by Age in Binger
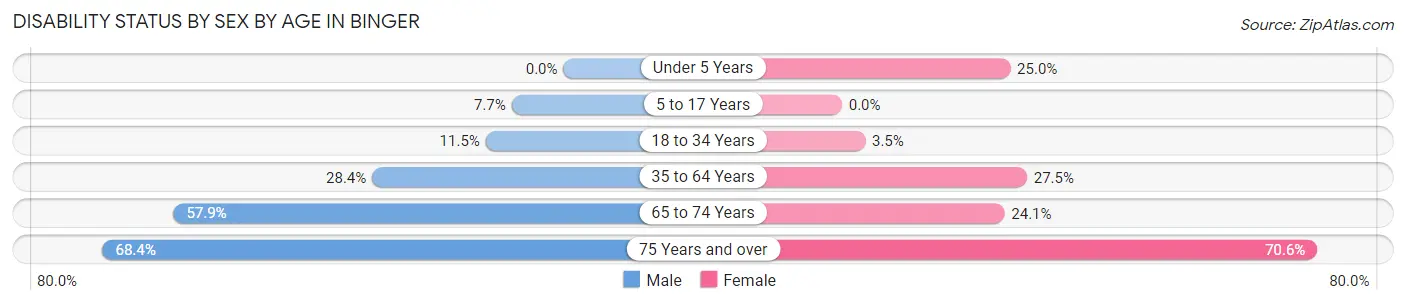
| Age Bracket | Male | Female |
| Under 5 Years | 0 (0.0%) | 1 (25.0%) |
| 5 to 17 Years | 2 (7.7%) | 0 (0.0%) |
| 18 to 34 Years | 6 (11.5%) | 1 (3.5%) |
| 35 to 64 Years | 23 (28.4%) | 25 (27.5%) |
| 65 to 74 Years | 11 (57.9%) | 7 (24.1%) |
| 75 Years and over | 13 (68.4%) | 24 (70.6%) |
Disability Class by Sex by Age in Binger
Disability Class: Hearing Difficulty
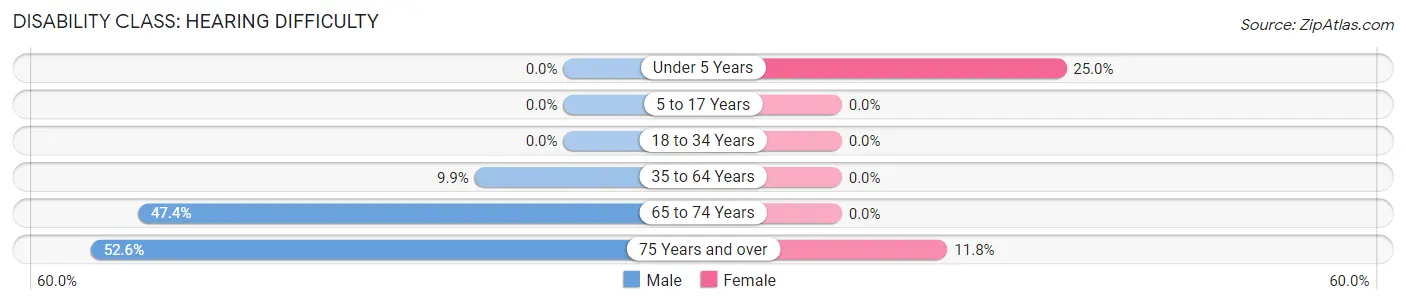
| Age Bracket | Male | Female |
| Under 5 Years | 0 (0.0%) | 1 (25.0%) |
| 5 to 17 Years | 0 (0.0%) | 0 (0.0%) |
| 18 to 34 Years | 0 (0.0%) | 0 (0.0%) |
| 35 to 64 Years | 8 (9.9%) | 0 (0.0%) |
| 65 to 74 Years | 9 (47.4%) | 0 (0.0%) |
| 75 Years and over | 10 (52.6%) | 4 (11.8%) |
Disability Class: Vision Difficulty
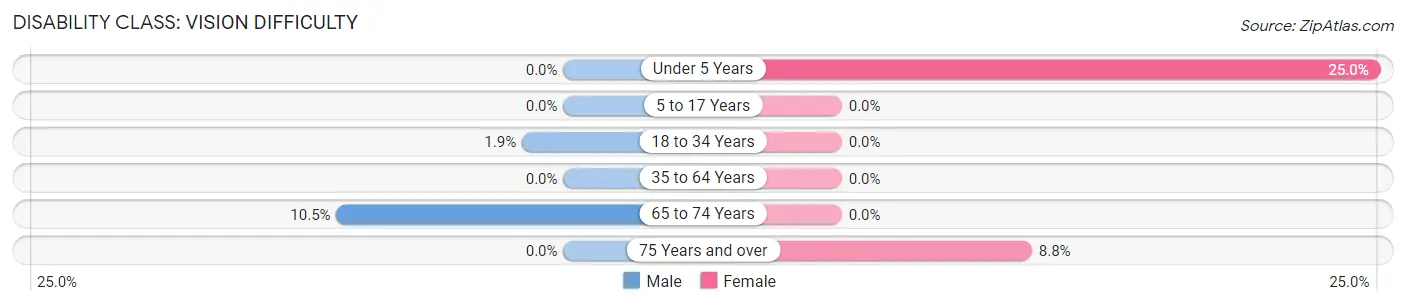
| Age Bracket | Male | Female |
| Under 5 Years | 0 (0.0%) | 1 (25.0%) |
| 5 to 17 Years | 0 (0.0%) | 0 (0.0%) |
| 18 to 34 Years | 1 (1.9%) | 0 (0.0%) |
| 35 to 64 Years | 0 (0.0%) | 0 (0.0%) |
| 65 to 74 Years | 2 (10.5%) | 0 (0.0%) |
| 75 Years and over | 0 (0.0%) | 3 (8.8%) |
Disability Class: Cognitive Difficulty
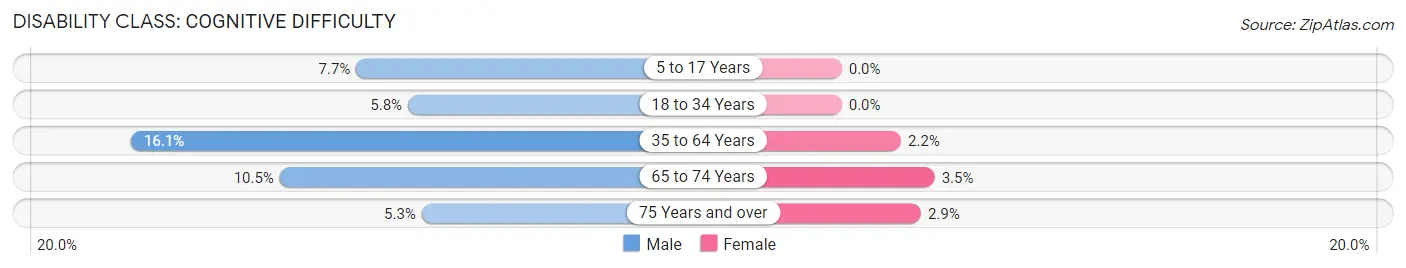
| Age Bracket | Male | Female |
| 5 to 17 Years | 2 (7.7%) | 0 (0.0%) |
| 18 to 34 Years | 3 (5.8%) | 0 (0.0%) |
| 35 to 64 Years | 13 (16.1%) | 2 (2.2%) |
| 65 to 74 Years | 2 (10.5%) | 1 (3.5%) |
| 75 Years and over | 1 (5.3%) | 1 (2.9%) |
Disability Class: Ambulatory Difficulty
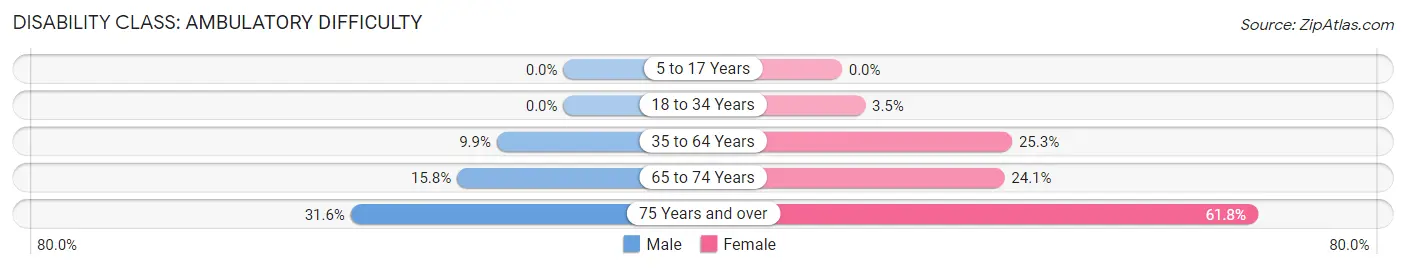
| Age Bracket | Male | Female |
| 5 to 17 Years | 0 (0.0%) | 0 (0.0%) |
| 18 to 34 Years | 0 (0.0%) | 1 (3.5%) |
| 35 to 64 Years | 8 (9.9%) | 23 (25.3%) |
| 65 to 74 Years | 3 (15.8%) | 7 (24.1%) |
| 75 Years and over | 6 (31.6%) | 21 (61.8%) |
Disability Class: Self-Care Difficulty
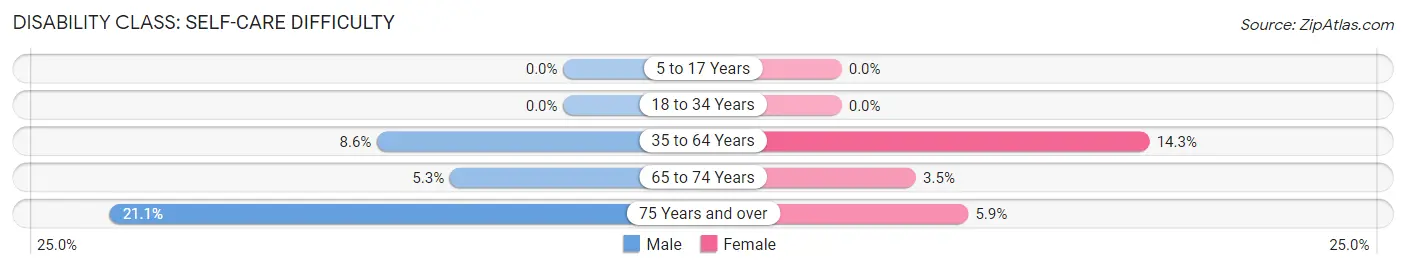
| Age Bracket | Male | Female |
| 5 to 17 Years | 0 (0.0%) | 0 (0.0%) |
| 18 to 34 Years | 0 (0.0%) | 0 (0.0%) |
| 35 to 64 Years | 7 (8.6%) | 13 (14.3%) |
| 65 to 74 Years | 1 (5.3%) | 1 (3.5%) |
| 75 Years and over | 4 (21.0%) | 2 (5.9%) |
Technology Access in Binger
Computing Device Access in Binger
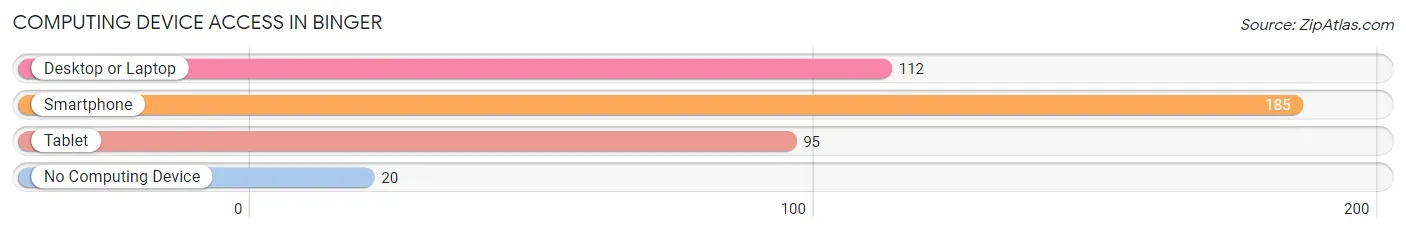
| Device Type | # Households | % Households |
| Desktop or Laptop | 112 | 53.8% |
| Smartphone | 185 | 88.9% |
| Tablet | 95 | 45.7% |
| No Computing Device | 20 | 9.6% |
| Total | 208 | 100.0% |
Internet Access in Binger
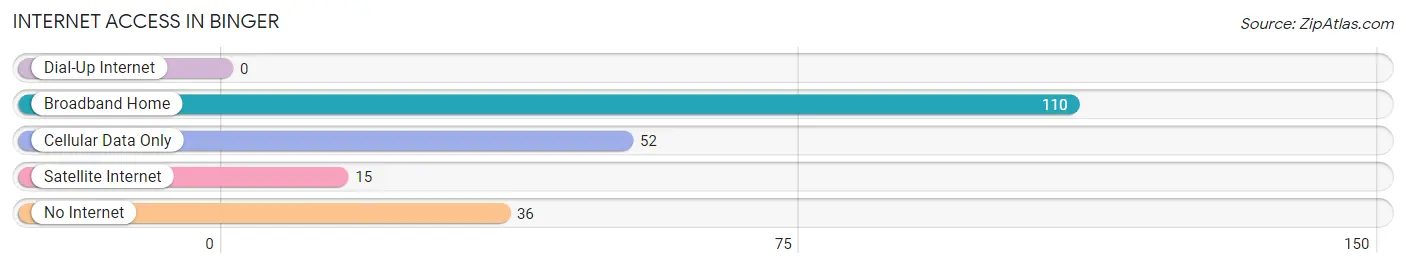
| Internet Type | # Households | % Households |
| Dial-Up Internet | 0 | 0.0% |
| Broadband Home | 110 | 52.9% |
| Cellular Data Only | 52 | 25.0% |
| Satellite Internet | 15 | 7.2% |
| No Internet | 36 | 17.3% |
| Total | 208 | 100.0% |
Binger Summary
Binger is a small town located in Caddo County, Oklahoma. It is situated in the southwestern part of the state, about 25 miles west of Oklahoma City. The town was founded in 1901 and has a population of approximately 1,000 people.
Geography
Binger is located in the Red Bed Plains region of Oklahoma, which is characterized by flat terrain and red-colored soil. The town is situated on the Washita River, which flows through the area. The town is surrounded by rolling hills and is located in a rural area. The nearest major city is Oklahoma City, which is about 25 miles to the east.
Economy
The economy of Binger is largely based on agriculture. The town is home to several farms, which produce a variety of crops, including wheat, corn, soybeans, and cotton. The town also has a few small businesses, including a grocery store, a hardware store, and a few restaurants.
Demographics
As of the 2010 census, the population of Binger was 1,000 people. The racial makeup of the town was 95.2% White, 0.7% African American, 0.7% Native American, 0.3% Asian, and 2.9% from other races. The median household income was $31,250, and the median family income was $37,500.
History
Binger was founded in 1901 by a group of settlers from Kansas. The town was named after a local rancher, John Binger. The town grew slowly over the years, and by the 1920s, it had a population of about 500 people.
In the 1930s, the town was hit hard by the Great Depression, and many of its residents left in search of work. However, the town was able to survive, and by the 1950s, it had a population of about 800 people.
In the 1960s, the town began to experience a period of growth, as new businesses opened and the population increased. The town was also home to a number of oil wells, which provided jobs and income for many of its residents.
Today, Binger is a small, rural town with a population of about 1,000 people. The town is home to several small businesses, and its economy is largely based on agriculture. The town is also home to a number of historic sites, including the Binger Museum, which houses artifacts from the town’s history.
Common Questions
What is Per Capita Income in Binger?
Per Capita income in Binger is $33,508.
What is the Median Family Income in Binger?
Median Family Income in Binger is $64,531.
What is the Median Household income in Binger?
Median Household Income in Binger is $42,000.
What is Income or Wage Gap in Binger?
Income or Wage Gap in Binger is 54.7%.
Women in Binger earn 45.3 cents for every dollar earned by a man.
What is Inequality or Gini Index in Binger?
Inequality or Gini Index in Binger is 0.54.
What is the Total Population of Binger?
Total Population of Binger is 478.
What is the Total Male Population of Binger?
Total Male Population of Binger is 228.
What is the Total Female Population of Binger?
Total Female Population of Binger is 250.
What is the Ratio of Males per 100 Females in Binger?
There are 91.20 Males per 100 Females in Binger.
What is the Ratio of Females per 100 Males in Binger?
There are 109.65 Females per 100 Males in Binger.
What is the Median Population Age in Binger?
Median Population Age in Binger is 54.5 Years.
What is the Average Family Size in Binger
Average Family Size in Binger is 2.6 People.
What is the Average Household Size in Binger
Average Household Size in Binger is 2.1 People.
How Large is the Labor Force in Binger?
There are 188 People in the Labor Forcein in Binger.
What is the Percentage of People in the Labor Force in Binger?
44.9% of People are in the Labor Force in Binger.
What is the Unemployment Rate in Binger?
Unemployment Rate in Binger is 6.9%.