Beaver, OK Map & Demographics
Beaver Map
Beaver Overview
$25,628
PER CAPITA INCOME
$59,821
AVG FAMILY INCOME
$53,600
AVG HOUSEHOLD INCOME
46.0%
WAGE / INCOME GAP [ % ]
54.0¢/ $1
WAGE / INCOME GAP [ $ ]
0.37
INEQUALITY / GINI INDEX
1,524
TOTAL POPULATION
770
MALE POPULATION
754
FEMALE POPULATION
102.12
MALES / 100 FEMALES
97.92
FEMALES / 100 MALES
33.9
MEDIAN AGE
3.3
AVG FAMILY SIZE
2.7
AVG HOUSEHOLD SIZE
716
LABOR FORCE [ PEOPLE ]
61.9%
PERCENT IN LABOR FORCE
2.9%
UNEMPLOYMENT RATE
Beaver Zip Codes
Beaver Area Codes
Income in Beaver
Income Overview in Beaver
Per Capita Income in Beaver is $25,628, while median incomes of families and households are $59,821 and $53,600 respectively.
| Characteristic | Number | Measure |
| Per Capita Income | 1,524 | $25,628 |
| Median Family Income | 347 | $59,821 |
| Mean Family Income | 347 | $77,406 |
| Median Household Income | 526 | $53,600 |
| Mean Household Income | 526 | $68,414 |
| Income Deficit | 347 | $0 |
| Wage / Income Gap (%) | 1,524 | 45.96% |
| Wage / Income Gap ($) | 1,524 | 54.04¢ per $1 |
| Gini / Inequality Index | 1,524 | 0.37 |
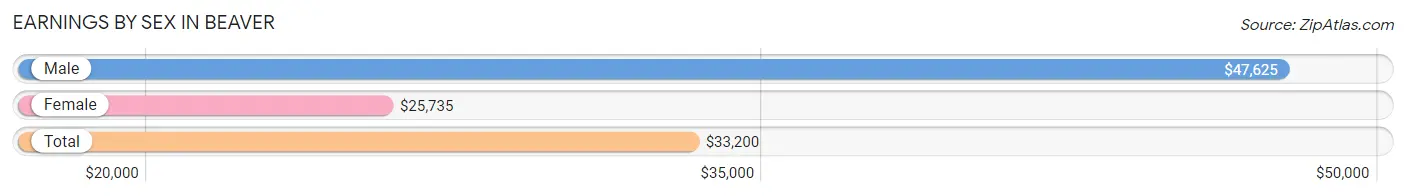
Earnings by Sex in Beaver
Average Earnings in Beaver are $33,200, $47,625 for men and $25,735 for women, a difference of 46.0%.
| Sex | Number | Average Earnings |
| Male | 414 (54.6%) | $47,625 |
| Female | 344 (45.4%) | $25,735 |
| Total | 758 (100.0%) | $33,200 |
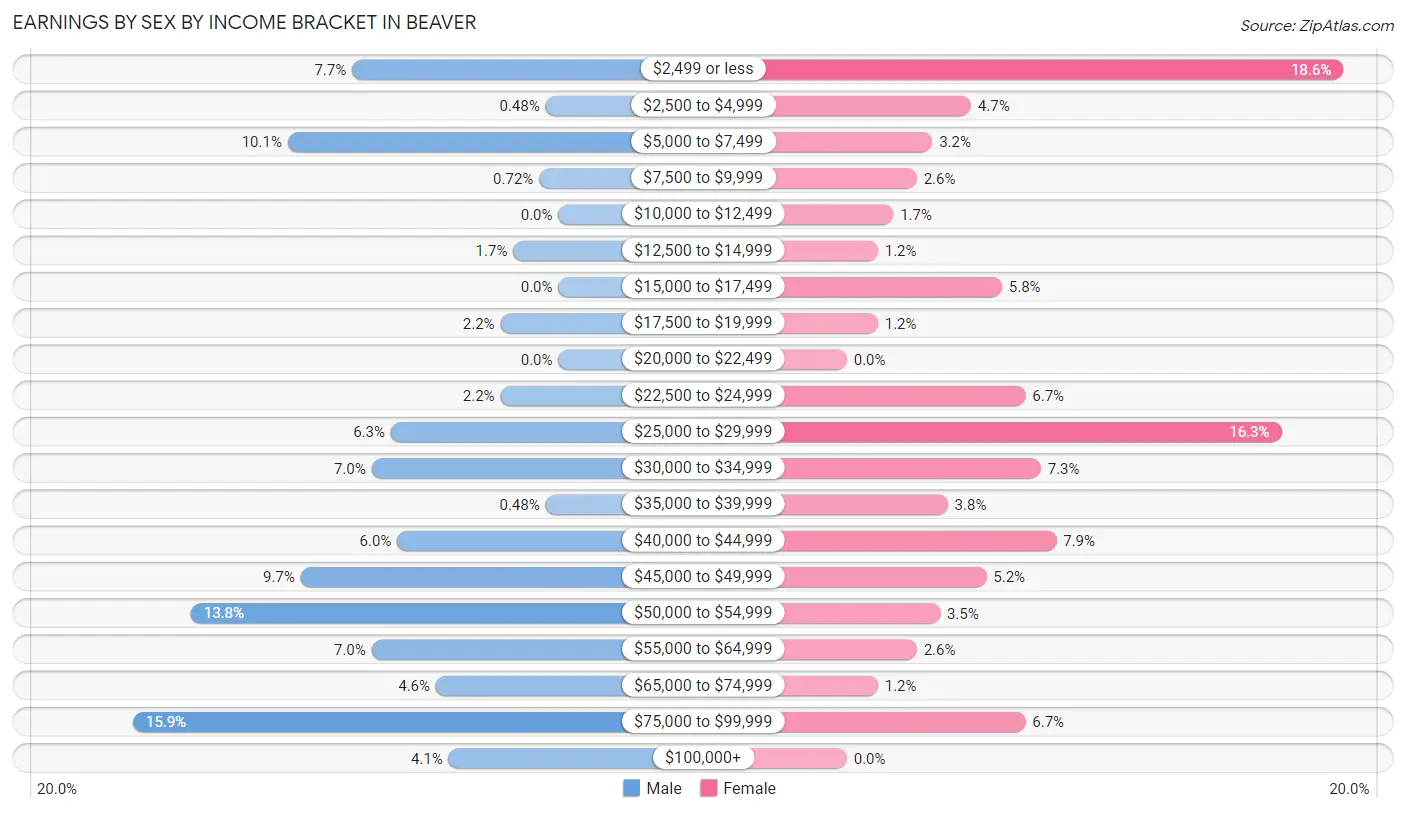
Earnings by Sex by Income Bracket in Beaver
The most common earnings brackets in Beaver are $75,000 to $99,999 for men (66 | 15.9%) and $2,499 or less for women (64 | 18.6%).
| Income | Male | Female |
| $2,499 or less | 32 (7.7%) | 64 (18.6%) |
| $2,500 to $4,999 | 2 (0.5%) | 16 (4.6%) |
| $5,000 to $7,499 | 42 (10.1%) | 11 (3.2%) |
| $7,500 to $9,999 | 3 (0.7%) | 9 (2.6%) |
| $10,000 to $12,499 | 0 (0.0%) | 6 (1.7%) |
| $12,500 to $14,999 | 7 (1.7%) | 4 (1.2%) |
| $15,000 to $17,499 | 0 (0.0%) | 20 (5.8%) |
| $17,500 to $19,999 | 9 (2.2%) | 4 (1.2%) |
| $20,000 to $22,499 | 0 (0.0%) | 0 (0.0%) |
| $22,500 to $24,999 | 9 (2.2%) | 23 (6.7%) |
| $25,000 to $29,999 | 26 (6.3%) | 56 (16.3%) |
| $30,000 to $34,999 | 29 (7.0%) | 25 (7.3%) |
| $35,000 to $39,999 | 2 (0.5%) | 13 (3.8%) |
| $40,000 to $44,999 | 25 (6.0%) | 27 (7.9%) |
| $45,000 to $49,999 | 40 (9.7%) | 18 (5.2%) |
| $50,000 to $54,999 | 57 (13.8%) | 12 (3.5%) |
| $55,000 to $64,999 | 29 (7.0%) | 9 (2.6%) |
| $65,000 to $74,999 | 19 (4.6%) | 4 (1.2%) |
| $75,000 to $99,999 | 66 (15.9%) | 23 (6.7%) |
| $100,000+ | 17 (4.1%) | 0 (0.0%) |
| Total | 414 (100.0%) | 344 (100.0%) |
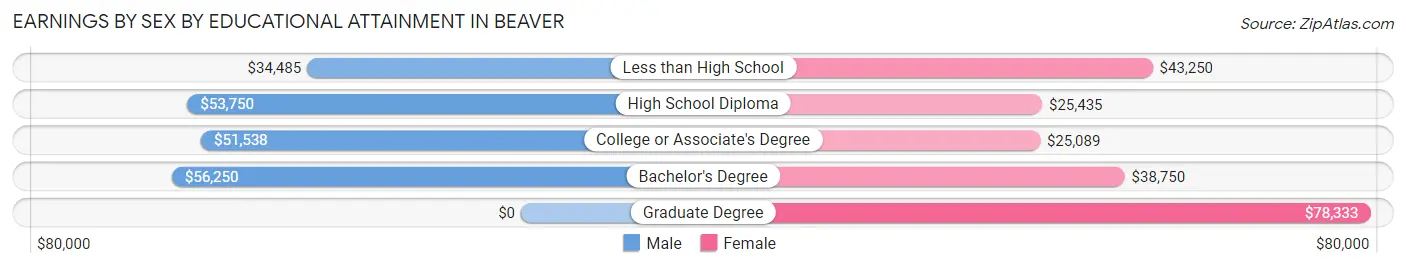
Earnings by Sex by Educational Attainment in Beaver
Average earnings in Beaver are $52,500 for men and $26,569 for women, a difference of 49.4%. Men with an educational attainment of bachelor's degree enjoy the highest average annual earnings of $56,250, while those with less than high school education earn the least with $34,485. Women with an educational attainment of graduate degree earn the most with the average annual earnings of $78,333, while those with college or associate's degree education have the smallest earnings of $25,089.
| Educational Attainment | Male Income | Female Income |
| Less than High School | $34,485 | $43,250 |
| High School Diploma | $53,750 | $25,435 |
| College or Associate's Degree | $51,538 | $25,089 |
| Bachelor's Degree | $56,250 | $38,750 |
| Graduate Degree | - | - |
| Total | $52,500 | $26,569 |
Family Income in Beaver
Family Income Brackets in Beaver
According to the Beaver family income data, there are 92 families falling into the $100,000 to $149,999 income range, which is the most common income bracket and makes up 26.5% of all families.
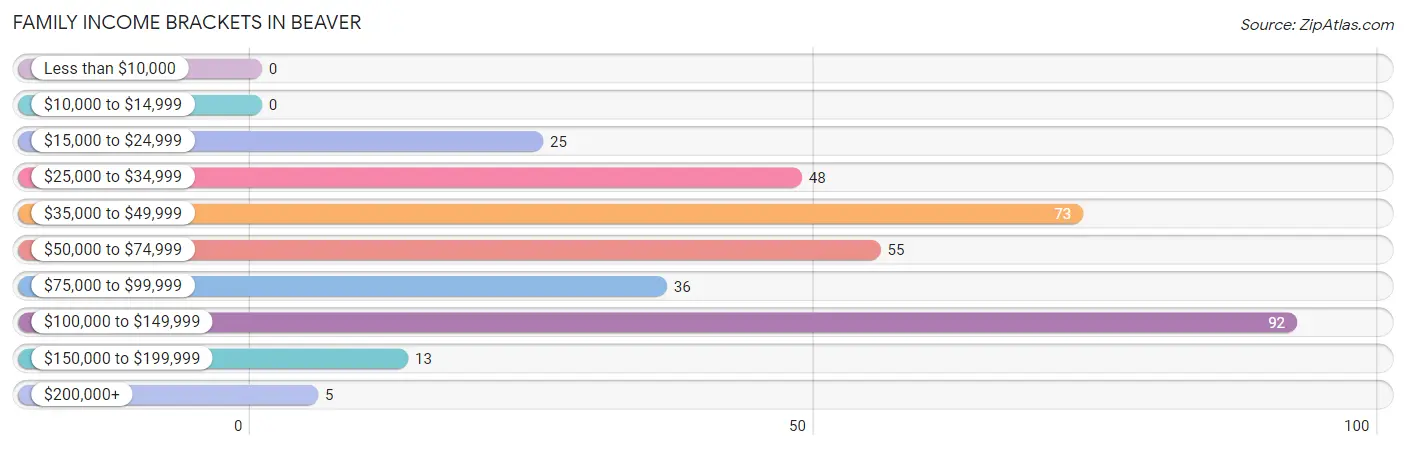
| Income Bracket | # Families | % Families |
| Less than $10,000 | 0 | 0.0% |
| $10,000 to $14,999 | 0 | 0.0% |
| $15,000 to $24,999 | 25 | 7.2% |
| $25,000 to $34,999 | 48 | 13.8% |
| $35,000 to $49,999 | 73 | 21.0% |
| $50,000 to $74,999 | 55 | 15.9% |
| $75,000 to $99,999 | 36 | 10.4% |
| $100,000 to $149,999 | 92 | 26.5% |
| $150,000 to $199,999 | 13 | 3.7% |
| $200,000+ | 5 | 1.4% |
Family Income by Famaliy Size in Beaver
3-person families (55 | 15.9%) account for the highest median family income in Beaver with $71,161 per family, while 2-person families (218 | 62.8%) have the highest median income of $33,750 per family member.
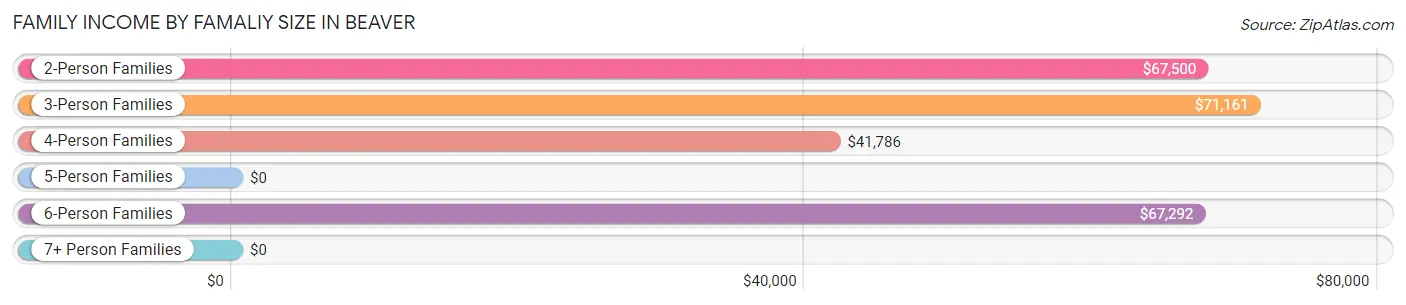
| Income Bracket | # Families | Median Income |
| 2-Person Families | 218 (62.8%) | $67,500 |
| 3-Person Families | 55 (15.9%) | $71,161 |
| 4-Person Families | 52 (15.0%) | $41,786 |
| 5-Person Families | 11 (3.2%) | $0 |
| 6-Person Families | 11 (3.2%) | $67,292 |
| 7+ Person Families | 0 (0.0%) | $0 |
| Total | 347 (100.0%) | $59,821 |
Family Income by Number of Earners in Beaver
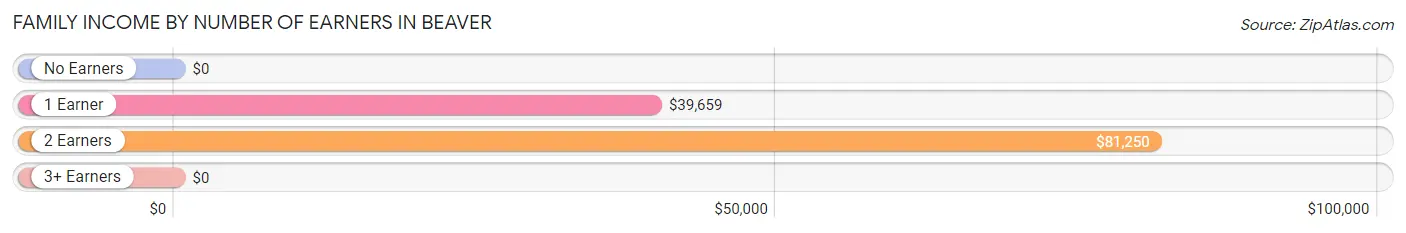
| Number of Earners | # Families | Median Income |
| No Earners | 71 (20.5%) | $0 |
| 1 Earner | 113 (32.6%) | $39,659 |
| 2 Earners | 142 (40.9%) | $81,250 |
| 3+ Earners | 21 (6.0%) | $0 |
| Total | 347 (100.0%) | $59,821 |
Household Income in Beaver
Household Income Brackets in Beaver
With 118 households falling in the category, the $100,000 to $149,999 income range is the most frequent in Beaver, accounting for 22.4% of all households. In contrast, only 5 households (0.9%) fall into the $200,000+ income bracket, making it the least populous group.
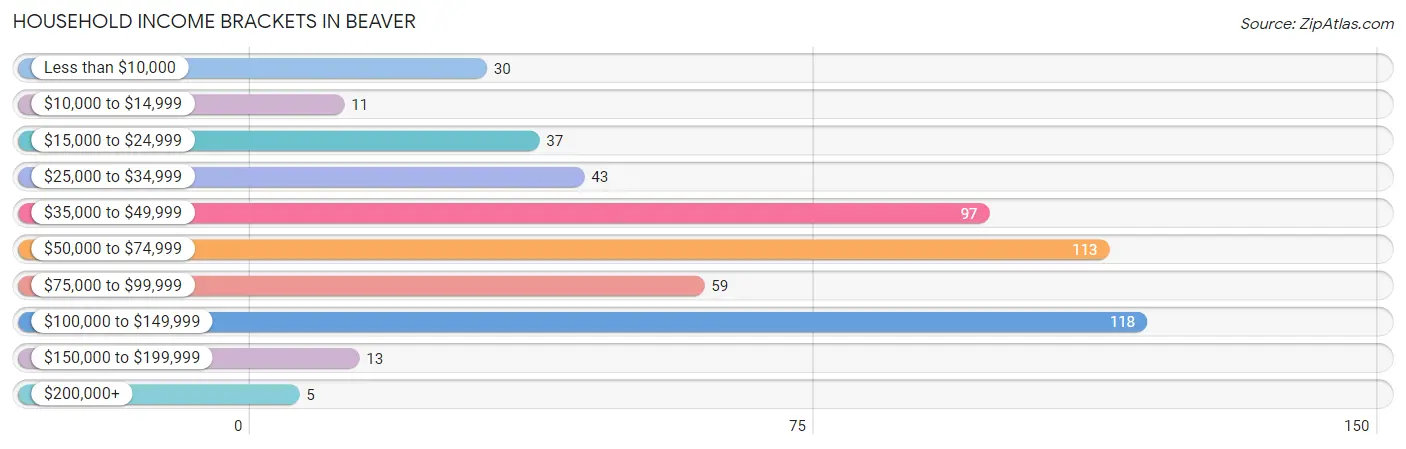
| Income Bracket | # Households | % Households |
| Less than $10,000 | 30 | 5.7% |
| $10,000 to $14,999 | 11 | 2.1% |
| $15,000 to $24,999 | 37 | 7.0% |
| $25,000 to $34,999 | 43 | 8.2% |
| $35,000 to $49,999 | 97 | 18.4% |
| $50,000 to $74,999 | 113 | 21.5% |
| $75,000 to $99,999 | 59 | 11.2% |
| $100,000 to $149,999 | 118 | 22.4% |
| $150,000 to $199,999 | 13 | 2.5% |
| $200,000+ | 5 | 1.0% |
Household Income by Householder Age in Beaver
The median household income in Beaver is $53,600, with the highest median household income of $67,273 found in the 25 to 44 years age bracket for the primary householder. A total of 200 households (38.0%) fall into this category. Meanwhile, the 65+ years age bracket for the primary householder has the lowest median household income of $0, with 90 households (17.1%) in this group.
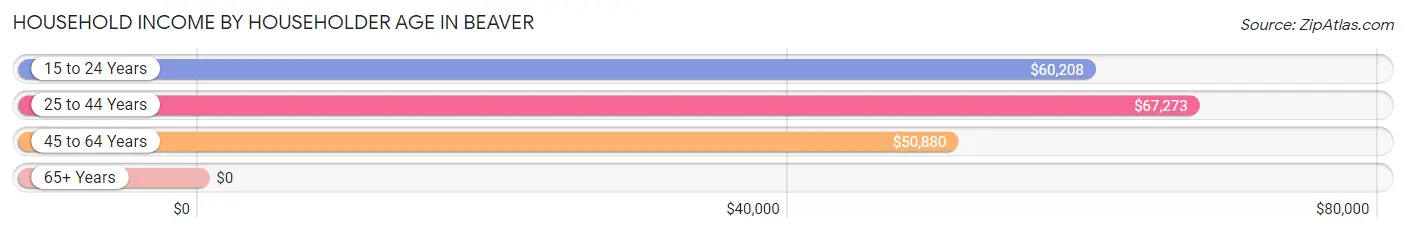
| Income Bracket | # Households | Median Income |
| 15 to 24 Years | 29 (5.5%) | $60,208 |
| 25 to 44 Years | 200 (38.0%) | $67,273 |
| 45 to 64 Years | 207 (39.4%) | $50,880 |
| 65+ Years | 90 (17.1%) | $0 |
| Total | 526 (100.0%) | $53,600 |
Poverty in Beaver
Income Below Poverty by Sex and Age in Beaver
With 6.0% poverty level for males and 14.4% for females among the residents of Beaver, 6 to 11 year old males and 5 year old females are the most vulnerable to poverty, with 19 males (17.6%) and 6 females (54.5%) in their respective age groups living below the poverty level.
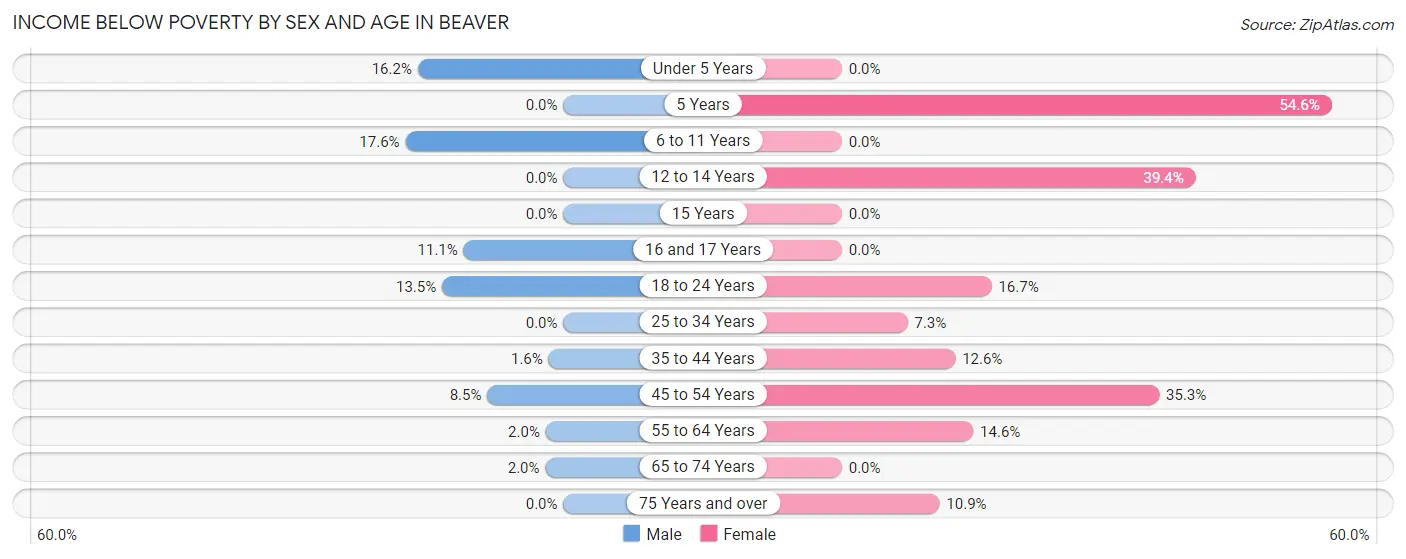
| Age Bracket | Male | Female |
| Under 5 Years | 6 (16.2%) | 0 (0.0%) |
| 5 Years | 0 (0.0%) | 6 (54.5%) |
| 6 to 11 Years | 19 (17.6%) | 0 (0.0%) |
| 12 to 14 Years | 0 (0.0%) | 13 (39.4%) |
| 15 Years | 0 (0.0%) | 0 (0.0%) |
| 16 and 17 Years | 3 (11.1%) | 0 (0.0%) |
| 18 to 24 Years | 5 (13.5%) | 9 (16.7%) |
| 25 to 34 Years | 0 (0.0%) | 6 (7.3%) |
| 35 to 44 Years | 1 (1.6%) | 12 (12.6%) |
| 45 to 54 Years | 5 (8.5%) | 41 (35.3%) |
| 55 to 64 Years | 2 (2.0%) | 12 (14.6%) |
| 65 to 74 Years | 1 (2.0%) | 0 (0.0%) |
| 75 Years and over | 0 (0.0%) | 5 (10.9%) |
| Total | 42 (6.0%) | 104 (14.4%) |
Income Above Poverty by Sex and Age in Beaver
According to the poverty statistics in Beaver, males aged 5 years and females aged under 5 years are the age groups that are most secure financially, with 100.0% of males and 100.0% of females in these age groups living above the poverty line.
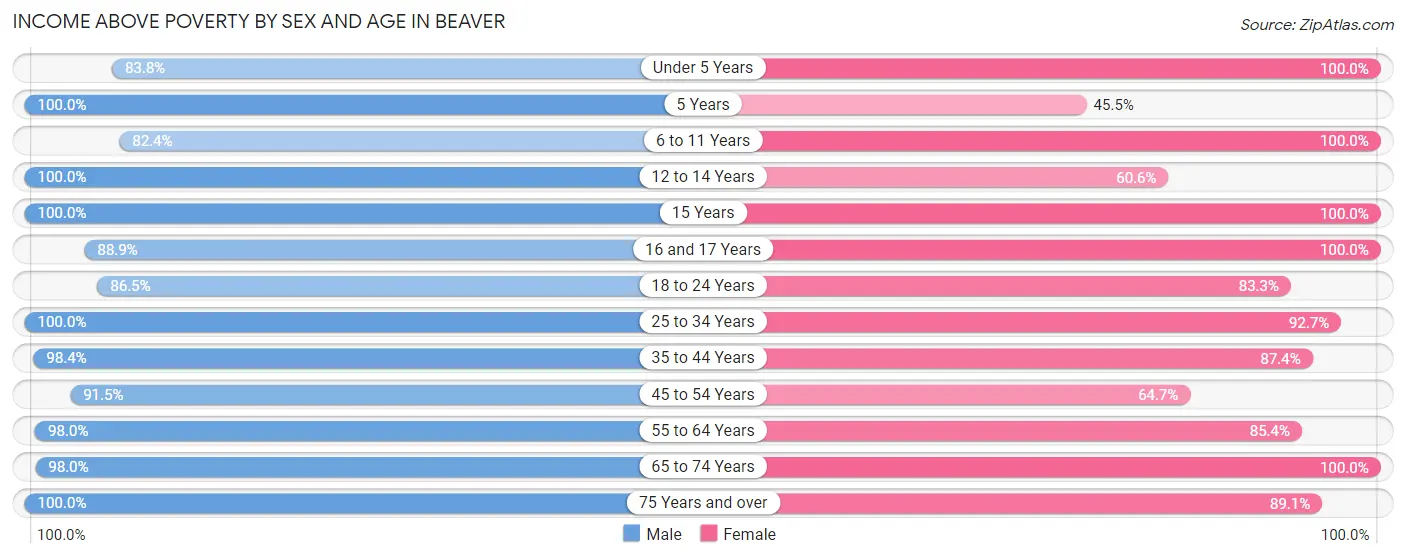
| Age Bracket | Male | Female |
| Under 5 Years | 31 (83.8%) | 43 (100.0%) |
| 5 Years | 21 (100.0%) | 5 (45.5%) |
| 6 to 11 Years | 89 (82.4%) | 58 (100.0%) |
| 12 to 14 Years | 31 (100.0%) | 20 (60.6%) |
| 15 Years | 9 (100.0%) | 4 (100.0%) |
| 16 and 17 Years | 24 (88.9%) | 23 (100.0%) |
| 18 to 24 Years | 32 (86.5%) | 45 (83.3%) |
| 25 to 34 Years | 139 (100.0%) | 76 (92.7%) |
| 35 to 44 Years | 60 (98.4%) | 83 (87.4%) |
| 45 to 54 Years | 54 (91.5%) | 75 (64.7%) |
| 55 to 64 Years | 100 (98.0%) | 70 (85.4%) |
| 65 to 74 Years | 49 (98.0%) | 74 (100.0%) |
| 75 Years and over | 16 (100.0%) | 41 (89.1%) |
| Total | 655 (94.0%) | 617 (85.6%) |
Income Below Poverty Among Married-Couple Families in Beaver
The poverty statistics for married-couple families in Beaver show that 1.5% or 4 of the total 266 families live below the poverty line. Families with no children have the highest poverty rate of 2.2%, comprising of 4 families. On the other hand, families with 1 or 2 children have the lowest poverty rate of 0.0%, which includes 0 families.
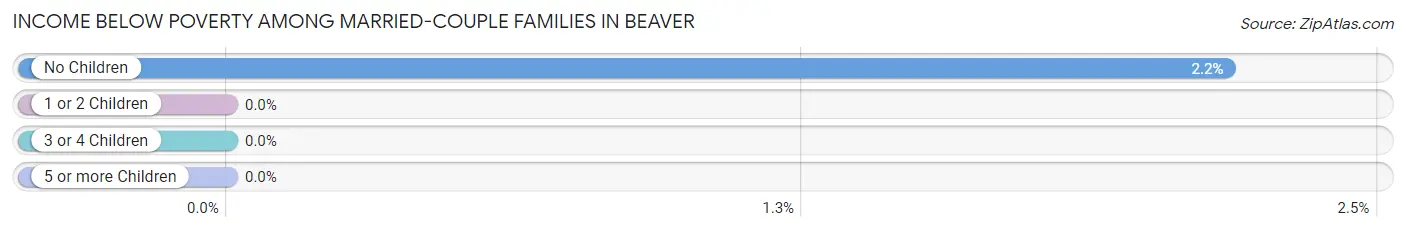
| Children | Above Poverty | Below Poverty |
| No Children | 180 (97.8%) | 4 (2.2%) |
| 1 or 2 Children | 69 (100.0%) | 0 (0.0%) |
| 3 or 4 Children | 13 (100.0%) | 0 (0.0%) |
| 5 or more Children | 0 (0.0%) | 0 (0.0%) |
| Total | 262 (98.5%) | 4 (1.5%) |
Income Below Poverty Among Single-Parent Households in Beaver
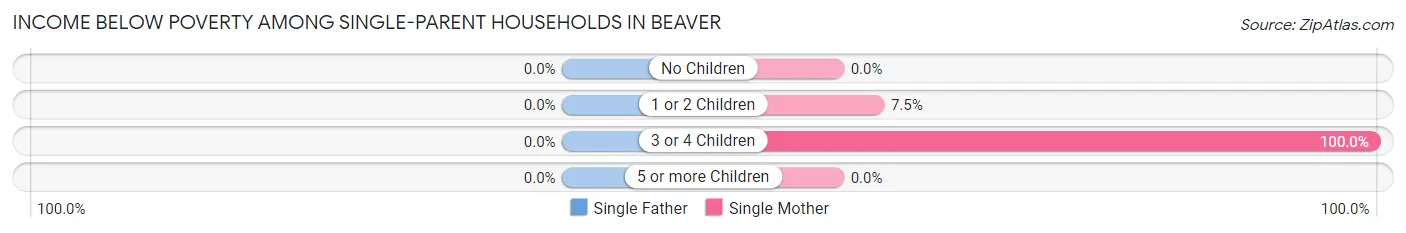
| Children | Single Father | Single Mother |
| No Children | 0 (0.0%) | 0 (0.0%) |
| 1 or 2 Children | 0 (0.0%) | 3 (7.5%) |
| 3 or 4 Children | 0 (0.0%) | 8 (100.0%) |
| 5 or more Children | 0 (0.0%) | 0 (0.0%) |
| Total | 0 (0.0%) | 11 (16.4%) |
Income Below Poverty Among Married-Couple vs Single-Parent Households in Beaver
The poverty data for Beaver shows that 4 of the married-couple family households (1.5%) and 11 of the single-parent households (13.6%) are living below the poverty level. Within the married-couple family households, those with no children have the highest poverty rate, with 4 households (2.2%) falling below the poverty line. Among the single-parent households, those with 3 or 4 children have the highest poverty rate, with 8 household (72.7%) living below poverty.
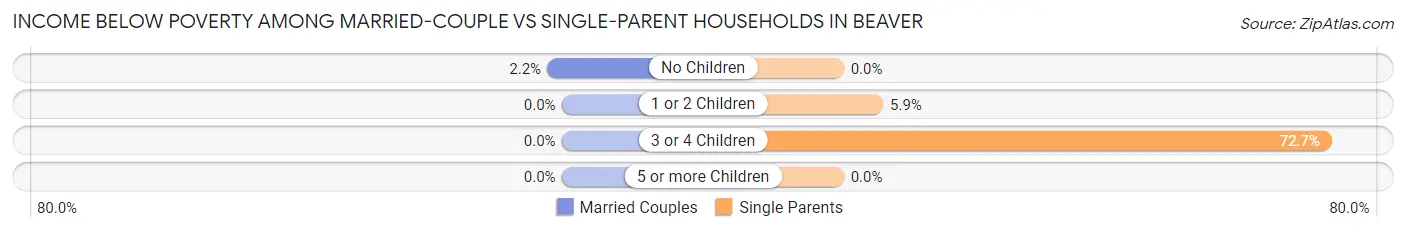
| Children | Married-Couple Families | Single-Parent Households |
| No Children | 4 (2.2%) | 0 (0.0%) |
| 1 or 2 Children | 0 (0.0%) | 3 (5.9%) |
| 3 or 4 Children | 0 (0.0%) | 8 (72.7%) |
| 5 or more Children | 0 (0.0%) | 0 (0.0%) |
| Total | 4 (1.5%) | 11 (13.6%) |
Race in Beaver
The most populous races in Beaver are White / Caucasian (1,090 | 71.5%), Hispanic or Latino (467 | 30.6%), and Some other Race (210 | 13.8%).
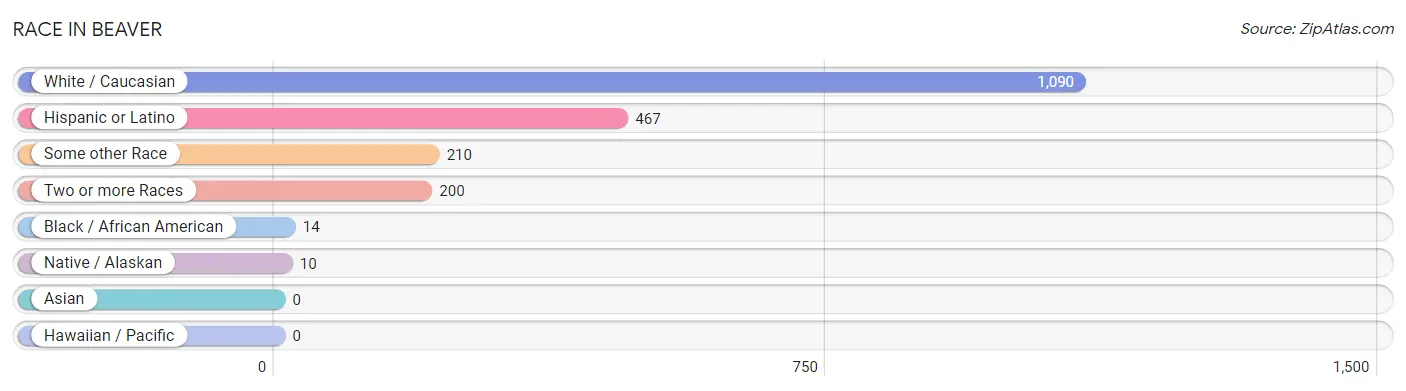
| Race | # Population | % Population |
| Asian | 0 | 0.0% |
| Black / African American | 14 | 0.9% |
| Hawaiian / Pacific | 0 | 0.0% |
| Hispanic or Latino | 467 | 30.6% |
| Native / Alaskan | 10 | 0.7% |
| White / Caucasian | 1,090 | 71.5% |
| Two or more Races | 200 | 13.1% |
| Some other Race | 210 | 13.8% |
| Total | 1,524 | 100.0% |
Ancestry in Beaver
The most populous ancestries reported in Beaver are Mexican (460 | 30.2%), German (244 | 16.0%), Irish (109 | 7.1%), English (95 | 6.2%), and American (65 | 4.3%), together accounting for 63.8% of all Beaver residents.
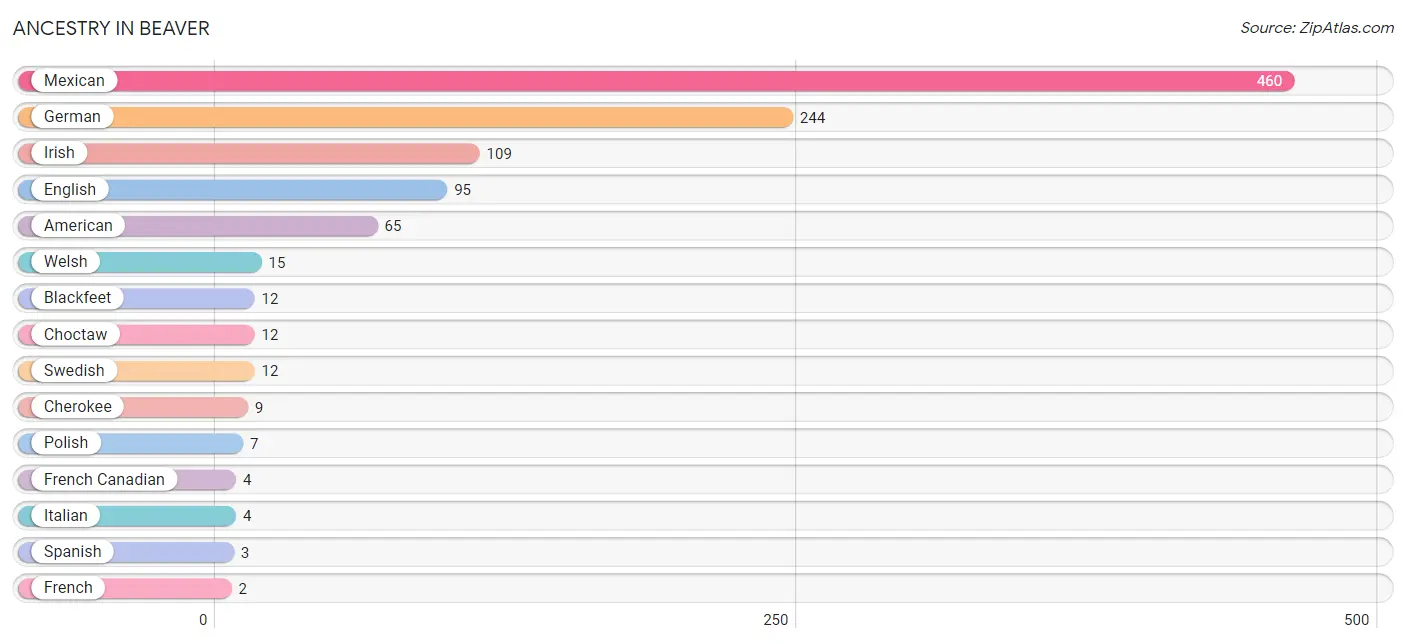
| Ancestry | # Population | % Population |
| American | 65 | 4.3% |
| Blackfeet | 12 | 0.8% |
| Cherokee | 9 | 0.6% |
| Choctaw | 12 | 0.8% |
| Dutch West Indian | 1 | 0.1% |
| English | 95 | 6.2% |
| French | 2 | 0.1% |
| French Canadian | 4 | 0.3% |
| German | 244 | 16.0% |
| Irish | 109 | 7.1% |
| Italian | 4 | 0.3% |
| Mexican | 460 | 30.2% |
| Polish | 7 | 0.5% |
| Scotch-Irish | 2 | 0.1% |
| Spanish | 3 | 0.2% |
| Swedish | 12 | 0.8% |
| Welsh | 15 | 1.0% | View All 17 Rows |
Immigrants in Beaver
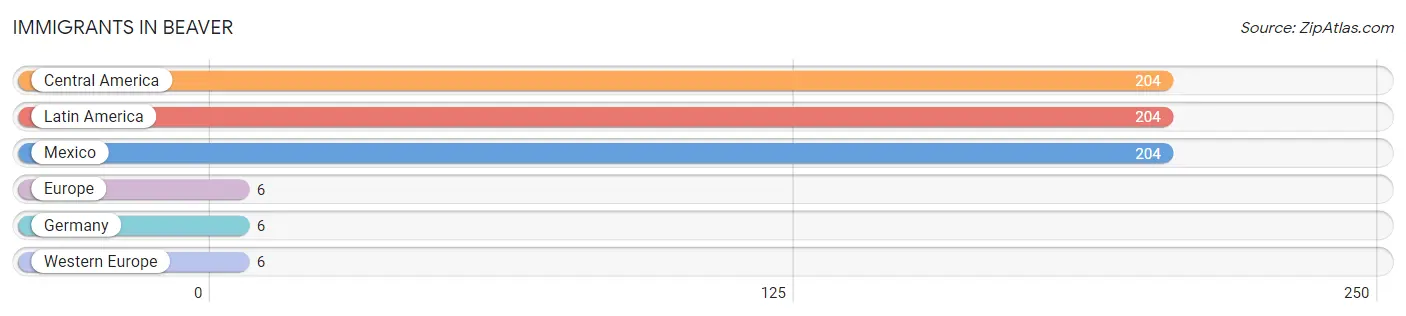
The most numerous immigrant groups reported in Beaver came from Central America (204 | 13.4%), Latin America (204 | 13.4%), Mexico (204 | 13.4%), Europe (6 | 0.4%), and Germany (6 | 0.4%), together accounting for 40.9% of all Beaver residents.
| Immigration Origin | # Population | % Population |
| Central America | 204 | 13.4% |
| Europe | 6 | 0.4% |
| Germany | 6 | 0.4% |
| Latin America | 204 | 13.4% |
| Mexico | 204 | 13.4% |
| Western Europe | 6 | 0.4% | View All 6 Rows |
Sex and Age in Beaver
Sex and Age in Beaver
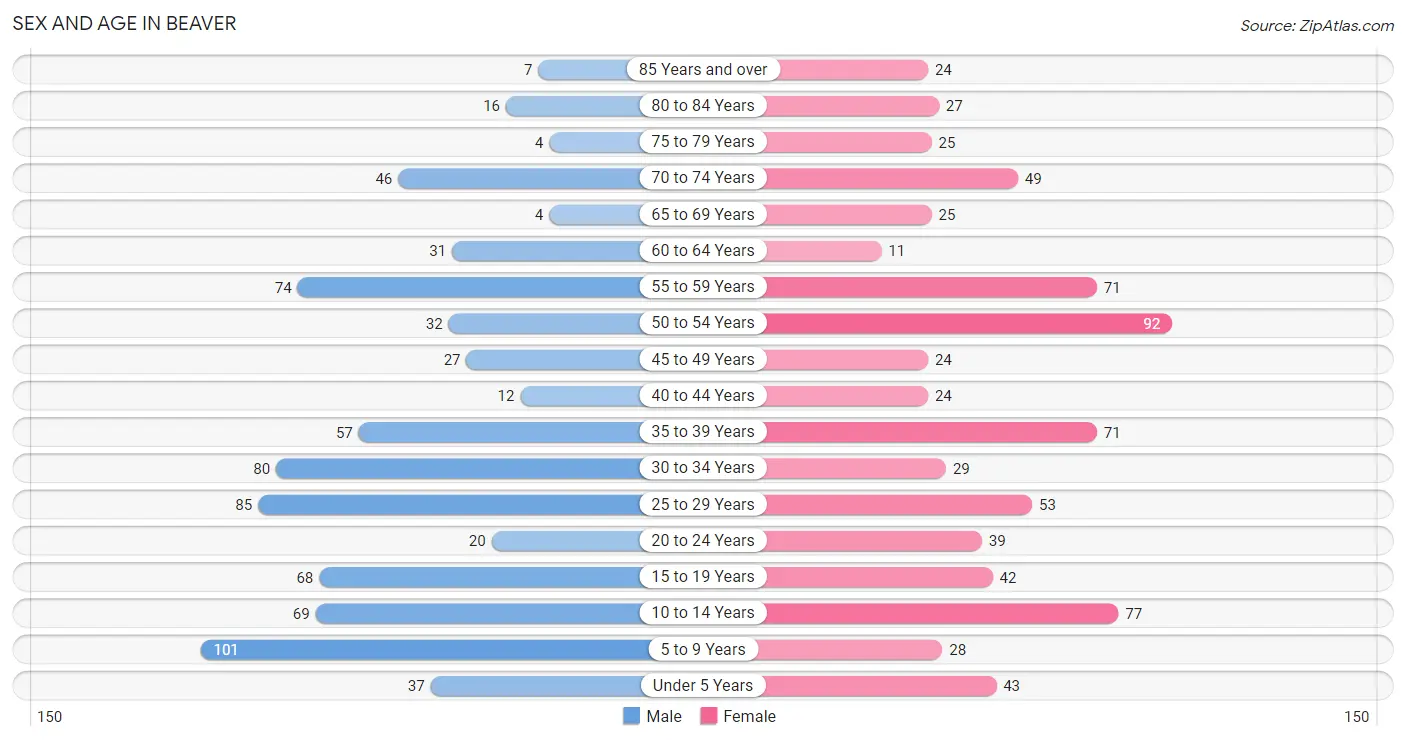
The most populous age groups in Beaver are 5 to 9 Years (101 | 13.1%) for men and 50 to 54 Years (92 | 12.2%) for women.
| Age Bracket | Male | Female |
| Under 5 Years | 37 (4.8%) | 43 (5.7%) |
| 5 to 9 Years | 101 (13.1%) | 28 (3.7%) |
| 10 to 14 Years | 69 (9.0%) | 77 (10.2%) |
| 15 to 19 Years | 68 (8.8%) | 42 (5.6%) |
| 20 to 24 Years | 20 (2.6%) | 39 (5.2%) |
| 25 to 29 Years | 85 (11.0%) | 53 (7.0%) |
| 30 to 34 Years | 80 (10.4%) | 29 (3.8%) |
| 35 to 39 Years | 57 (7.4%) | 71 (9.4%) |
| 40 to 44 Years | 12 (1.6%) | 24 (3.2%) |
| 45 to 49 Years | 27 (3.5%) | 24 (3.2%) |
| 50 to 54 Years | 32 (4.2%) | 92 (12.2%) |
| 55 to 59 Years | 74 (9.6%) | 71 (9.4%) |
| 60 to 64 Years | 31 (4.0%) | 11 (1.5%) |
| 65 to 69 Years | 4 (0.5%) | 25 (3.3%) |
| 70 to 74 Years | 46 (6.0%) | 49 (6.5%) |
| 75 to 79 Years | 4 (0.5%) | 25 (3.3%) |
| 80 to 84 Years | 16 (2.1%) | 27 (3.6%) |
| 85 Years and over | 7 (0.9%) | 24 (3.2%) |
| Total | 770 (100.0%) | 754 (100.0%) |
Families and Households in Beaver
Median Family Size in Beaver
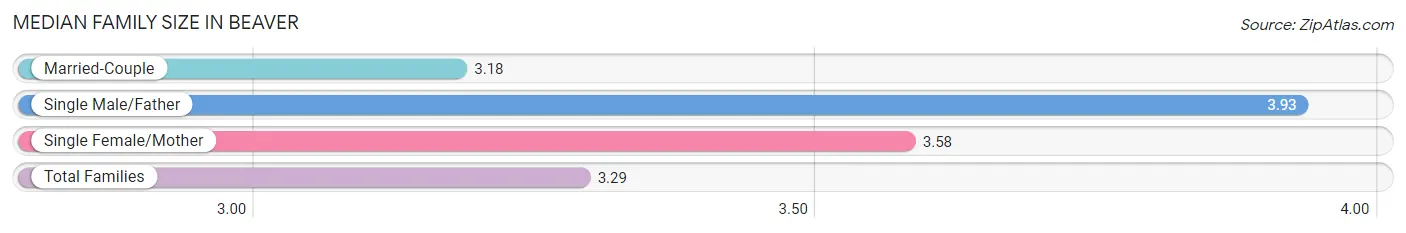
The median family size in Beaver is 3.29 persons per family, with single male/father families (14 | 4.0%) accounting for the largest median family size of 3.93 persons per family. On the other hand, married-couple families (266 | 76.7%) represent the smallest median family size with 3.18 persons per family.
| Family Type | # Families | Family Size |
| Married-Couple | 266 (76.7%) | 3.18 |
| Single Male/Father | 14 (4.0%) | 3.93 |
| Single Female/Mother | 67 (19.3%) | 3.58 |
| Total Families | 347 (100.0%) | 3.29 |
Median Household Size in Beaver
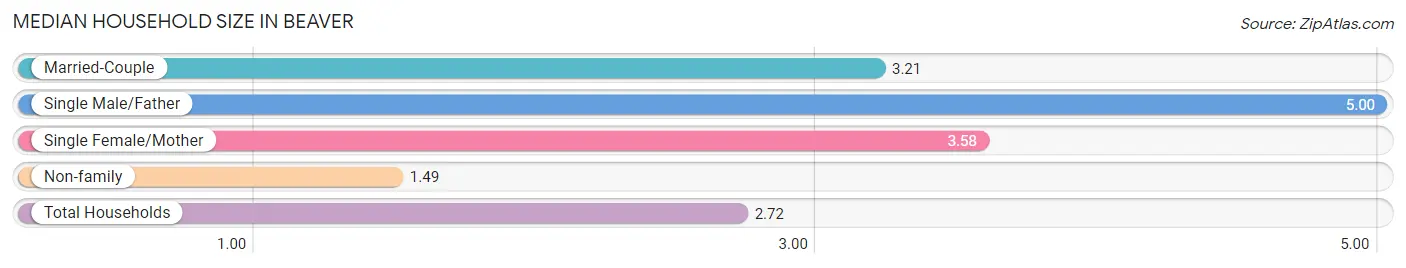
The median household size in Beaver is 2.72 persons per household, with single male/father households (14 | 2.7%) accounting for the largest median household size of 5 persons per household. non-family households (179 | 34.0%) represent the smallest median household size with 1.49 persons per household.
| Household Type | # Households | Household Size |
| Married-Couple | 266 (50.6%) | 3.21 |
| Single Male/Father | 14 (2.7%) | 5.00 |
| Single Female/Mother | 67 (12.7%) | 3.58 |
| Non-family | 179 (34.0%) | 1.49 |
| Total Households | 526 (100.0%) | 2.72 |
Household Size by Marriage Status in Beaver
Out of a total of 526 households in Beaver, 347 (66.0%) are family households, while 179 (34.0%) are nonfamily households. The most numerous type of family households are 2-person households, comprising 218, and the most common type of nonfamily households are 1-person households, comprising 124.
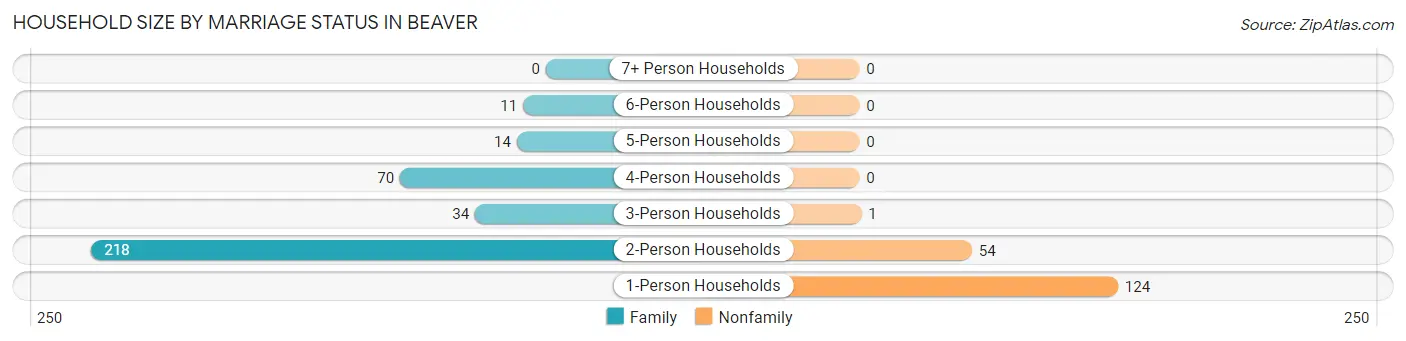
| Household Size | Family Households | Nonfamily Households |
| 1-Person Households | - | 124 (23.6%) |
| 2-Person Households | 218 (41.4%) | 54 (10.3%) |
| 3-Person Households | 34 (6.5%) | 1 (0.2%) |
| 4-Person Households | 70 (13.3%) | 0 (0.0%) |
| 5-Person Households | 14 (2.7%) | 0 (0.0%) |
| 6-Person Households | 11 (2.1%) | 0 (0.0%) |
| 7+ Person Households | 0 (0.0%) | 0 (0.0%) |
| Total | 347 (66.0%) | 179 (34.0%) |
Female Fertility in Beaver
Fertility by Age in Beaver
Average fertility rate in Beaver is 131.0 births per 1,000 women. Women in the age bracket of 20 to 34 years have the highest fertility rate with 215.0 births per 1,000 women. Women in the age bracket of 20 to 34 years acount for 70.3% of all women with births.
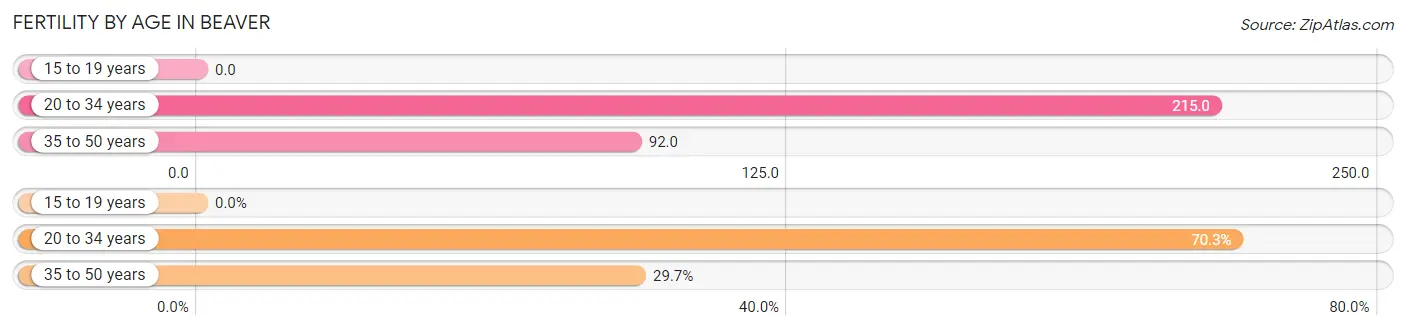
| Age Bracket | Women with Births | Births / 1,000 Women |
| 15 to 19 years | 0 (0.0%) | 0.0 |
| 20 to 34 years | 26 (70.3%) | 215.0 |
| 35 to 50 years | 11 (29.7%) | 92.0 |
| Total | 37 (100.0%) | 131.0 |
Fertility by Age by Marriage Status in Beaver
59.5% of women with births (37) in Beaver are married. The highest percentage of unmarried women with births falls into 20 to 34 years age bracket with 57.7% of them unmarried at the time of birth, while the lowest percentage of unmarried women with births belong to 35 to 50 years age bracket with 0.0% of them unmarried.
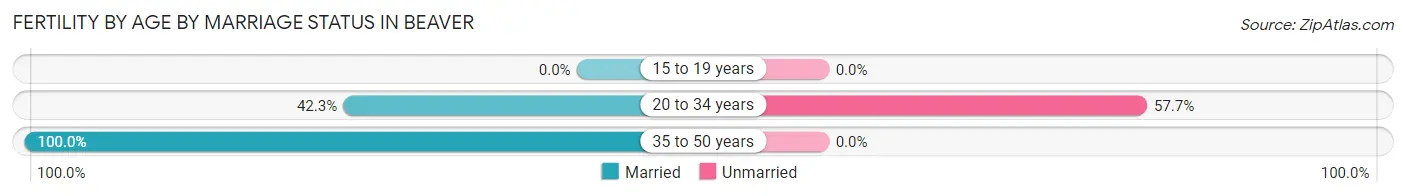
| Age Bracket | Married | Unmarried |
| 15 to 19 years | 0 (0.0%) | 0 (0.0%) |
| 20 to 34 years | 11 (42.3%) | 15 (57.7%) |
| 35 to 50 years | 11 (100.0%) | 0 (0.0%) |
| Total | 22 (59.5%) | 15 (40.5%) |
Fertility by Education in Beaver
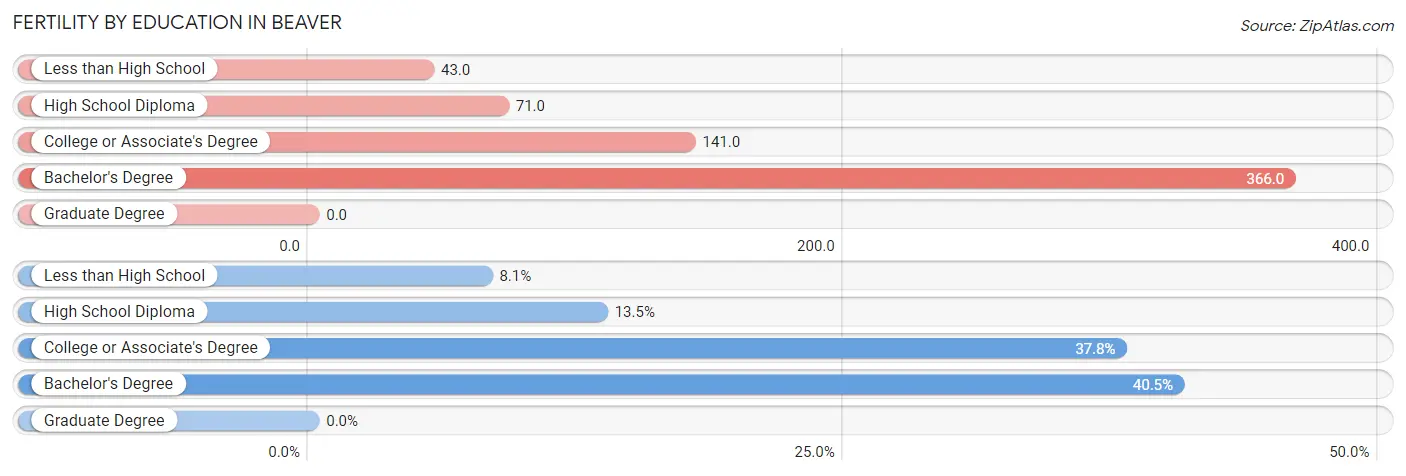
| Educational Attainment | Women with Births | Births / 1,000 Women |
| Less than High School | 3 (8.1%) | 43.0 |
| High School Diploma | 5 (13.5%) | 71.0 |
| College or Associate's Degree | 14 (37.8%) | 141.0 |
| Bachelor's Degree | 15 (40.5%) | 366.0 |
| Graduate Degree | 0 (0.0%) | 0.0 |
| Total | 37 (100.0%) | 131.0 |
Fertility by Education by Marriage Status in Beaver
40.5% of women with births in Beaver are unmarried. Women with the educational attainment of high school diploma are most likely to be married with 100.0% of them married at childbirth, while women with the educational attainment of less than high school are least likely to be married with 100.0% of them unmarried at childbirth.
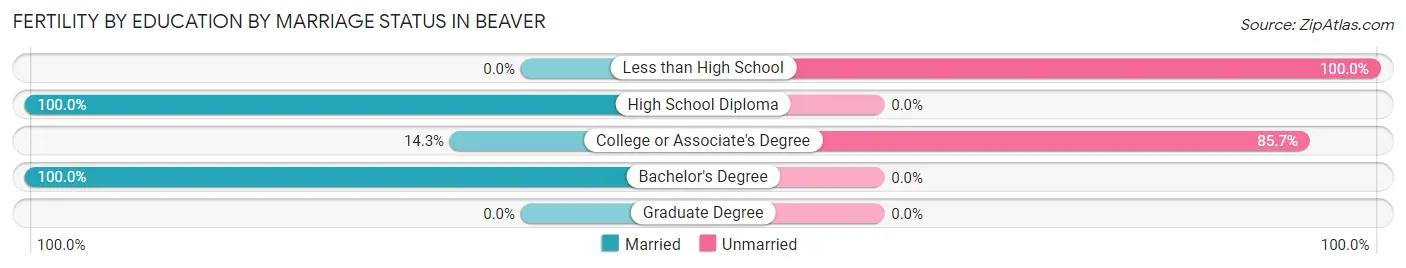
| Educational Attainment | Married | Unmarried |
| Less than High School | 0 (0.0%) | 3 (100.0%) |
| High School Diploma | 5 (100.0%) | 0 (0.0%) |
| College or Associate's Degree | 2 (14.3%) | 12 (85.7%) |
| Bachelor's Degree | 15 (100.0%) | 0 (0.0%) |
| Graduate Degree | 0 (0.0%) | 0 (0.0%) |
| Total | 22 (59.5%) | 15 (40.5%) |
Employment Characteristics in Beaver
Employment by Class of Employer in Beaver
Among the 694 employed individuals in Beaver, private company employees (416 | 59.9%), local government employees (134 | 19.3%), and state government employees (55 | 7.9%) make up the most common classes of employment.
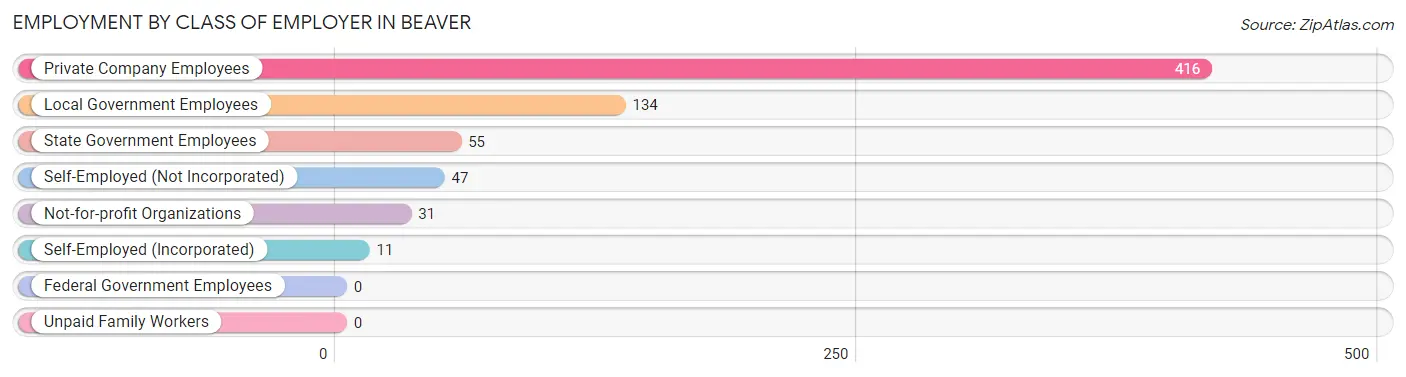
| Employer Class | # Employees | % Employees |
| Private Company Employees | 416 | 59.9% |
| Self-Employed (Incorporated) | 11 | 1.6% |
| Self-Employed (Not Incorporated) | 47 | 6.8% |
| Not-for-profit Organizations | 31 | 4.5% |
| Local Government Employees | 134 | 19.3% |
| State Government Employees | 55 | 7.9% |
| Federal Government Employees | 0 | 0.0% |
| Unpaid Family Workers | 0 | 0.0% |
| Total | 694 | 100.0% |
Employment Status by Age in Beaver
According to the labor force statistics for Beaver, out of the total population over 16 years of age (1,156), 61.9% or 716 individuals are in the labor force, with 2.9% or 21 of them unemployed. The age group with the highest labor force participation rate is 25 to 29 years, with 98.6% or 136 individuals in the labor force. Within the labor force, the 55 to 59 years age range has the highest percentage of unemployed individuals, with 11.7% or 12 of them being unemployed.
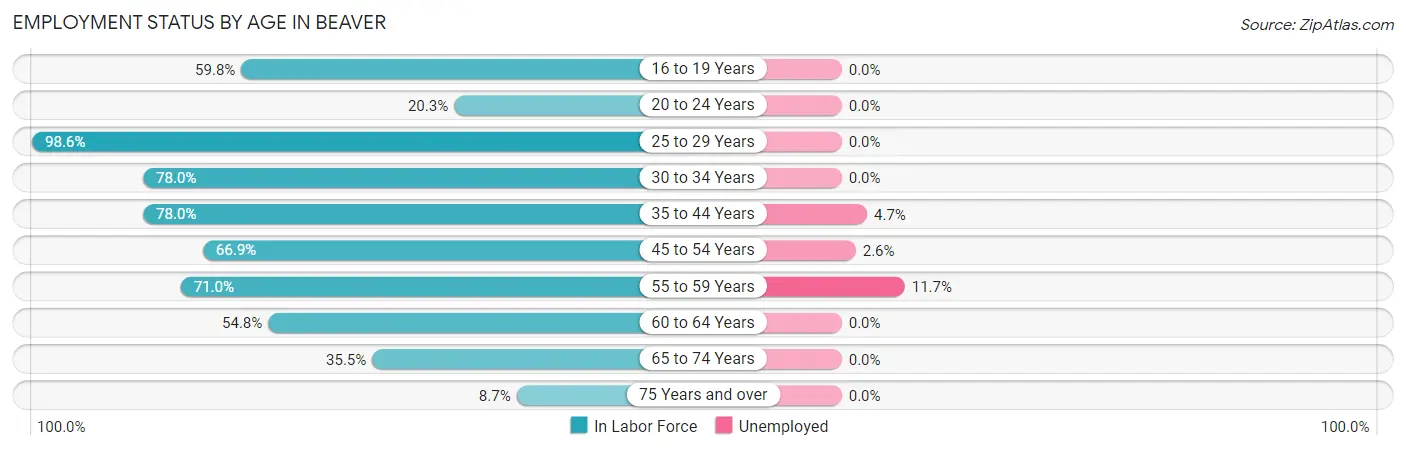
| Age Bracket | In Labor Force | Unemployed |
| 16 to 19 Years | 58 (59.8%) | 0 (0.0%) |
| 20 to 24 Years | 12 (20.3%) | 0 (0.0%) |
| 25 to 29 Years | 136 (98.6%) | 0 (0.0%) |
| 30 to 34 Years | 85 (78.0%) | 0 (0.0%) |
| 35 to 44 Years | 128 (78.0%) | 6 (4.7%) |
| 45 to 54 Years | 117 (66.9%) | 3 (2.6%) |
| 55 to 59 Years | 103 (71.0%) | 12 (11.7%) |
| 60 to 64 Years | 23 (54.8%) | 0 (0.0%) |
| 65 to 74 Years | 44 (35.5%) | 0 (0.0%) |
| 75 Years and over | 9 (8.7%) | 0 (0.0%) |
| Total | 716 (61.9%) | 21 (2.9%) |
Employment Status by Educational Attainment in Beaver
According to labor force statistics for Beaver, 76.6% of individuals (592) out of the total population between 25 and 64 years of age (773) are in the labor force, with 3.5% or 21 of them being unemployed. The group with the highest labor force participation rate are those with the educational attainment of bachelor's degree or higher, with 100.0% or 128 individuals in the labor force. Within the labor force, individuals with high school diploma education have the highest percentage of unemployment, with 9.2% or 21 of them being unemployed.
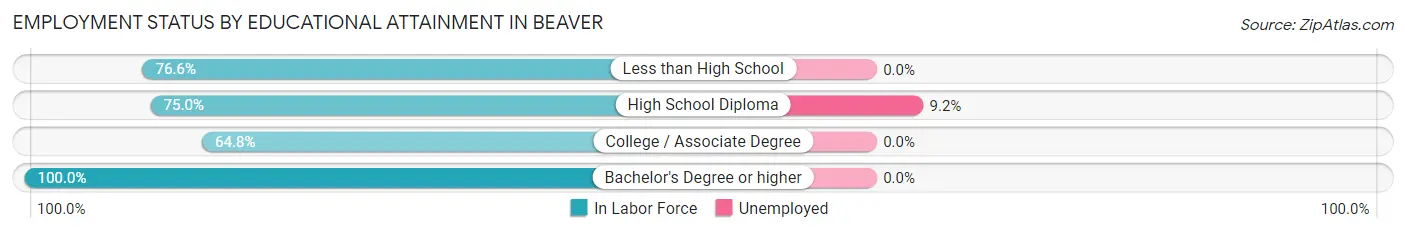
| Educational Attainment | In Labor Force | Unemployed |
| Less than High School | 98 (76.6%) | 0 (0.0%) |
| High School Diploma | 228 (75.0%) | 28 (9.2%) |
| College / Associate Degree | 138 (64.8%) | 0 (0.0%) |
| Bachelor's Degree or higher | 128 (100.0%) | 0 (0.0%) |
| Total | 592 (76.6%) | 27 (3.5%) |
Employment Occupations by Sex in Beaver
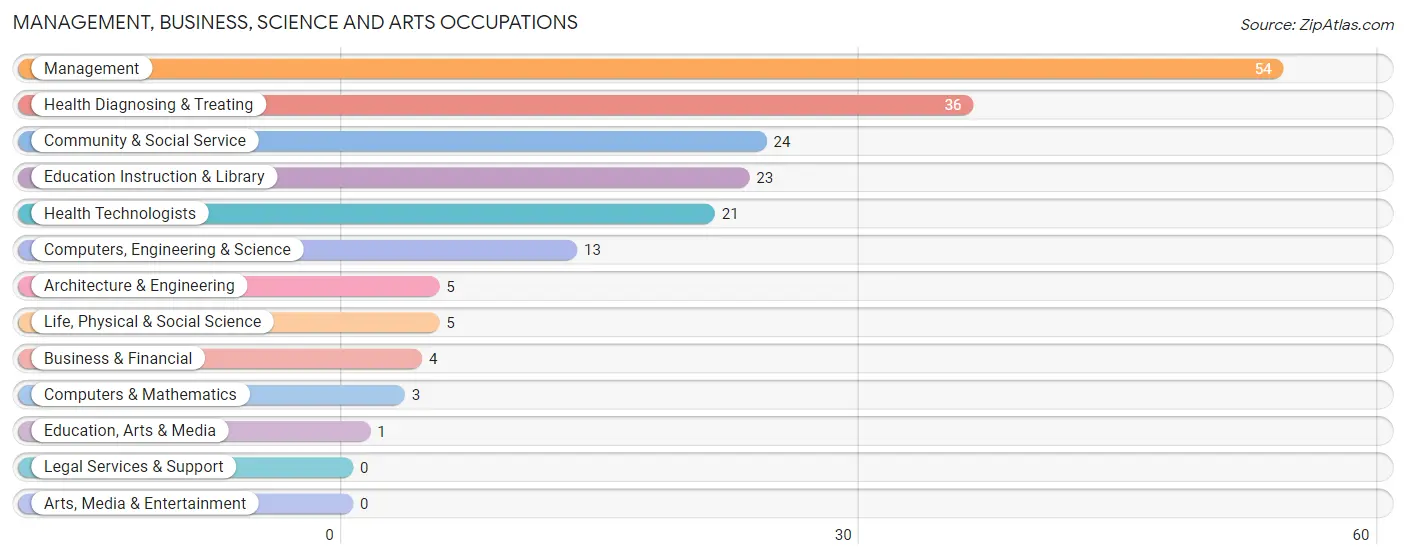
Management, Business, Science and Arts Occupations
The most common Management, Business, Science and Arts occupations in Beaver are Management (54 | 7.8%), Health Diagnosing & Treating (36 | 5.2%), Community & Social Service (24 | 3.5%), Education Instruction & Library (23 | 3.3%), and Health Technologists (21 | 3.0%).
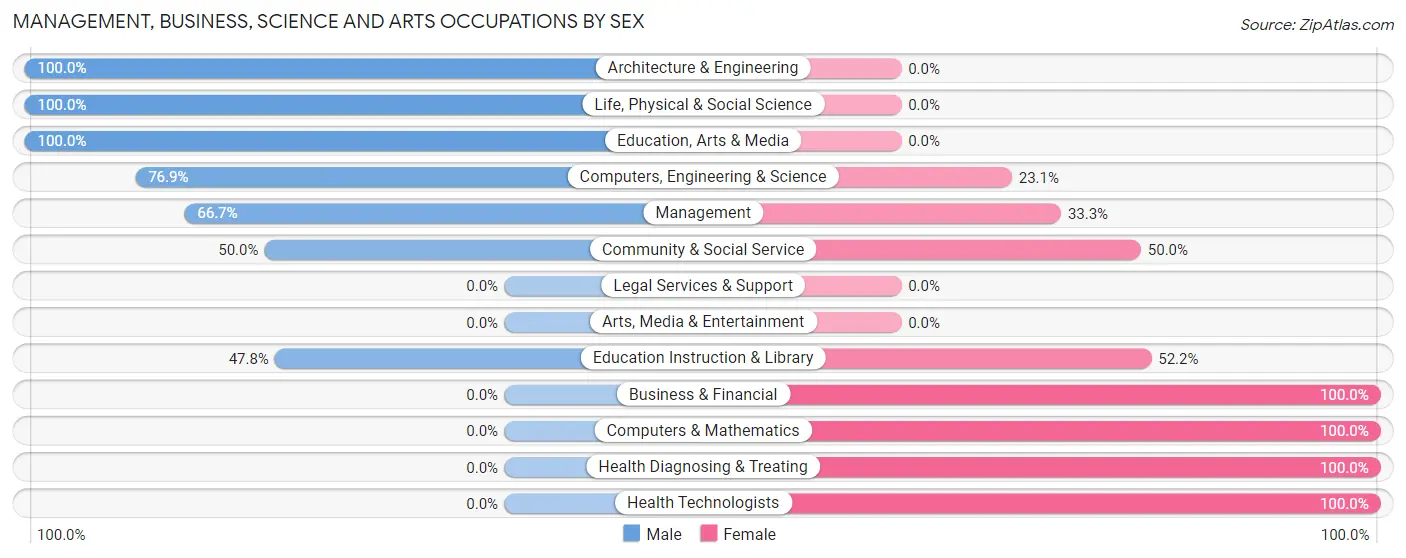
Management, Business, Science and Arts Occupations by Sex
Within the Management, Business, Science and Arts occupations in Beaver, the most male-oriented occupations are Architecture & Engineering (100.0%), Life, Physical & Social Science (100.0%), and Education, Arts & Media (100.0%), while the most female-oriented occupations are Business & Financial (100.0%), Computers & Mathematics (100.0%), and Health Diagnosing & Treating (100.0%).
| Occupation | Male | Female |
| Management | 36 (66.7%) | 18 (33.3%) |
| Business & Financial | 0 (0.0%) | 4 (100.0%) |
| Computers, Engineering & Science | 10 (76.9%) | 3 (23.1%) |
| Computers & Mathematics | 0 (0.0%) | 3 (100.0%) |
| Architecture & Engineering | 5 (100.0%) | 0 (0.0%) |
| Life, Physical & Social Science | 5 (100.0%) | 0 (0.0%) |
| Community & Social Service | 12 (50.0%) | 12 (50.0%) |
| Education, Arts & Media | 1 (100.0%) | 0 (0.0%) |
| Legal Services & Support | 0 (0.0%) | 0 (0.0%) |
| Education Instruction & Library | 11 (47.8%) | 12 (52.2%) |
| Arts, Media & Entertainment | 0 (0.0%) | 0 (0.0%) |
| Health Diagnosing & Treating | 0 (0.0%) | 36 (100.0%) |
| Health Technologists | 0 (0.0%) | 21 (100.0%) |
| Total (Category) | 58 (44.3%) | 73 (55.7%) |
| Total (Overall) | 366 (52.7%) | 328 (47.3%) |
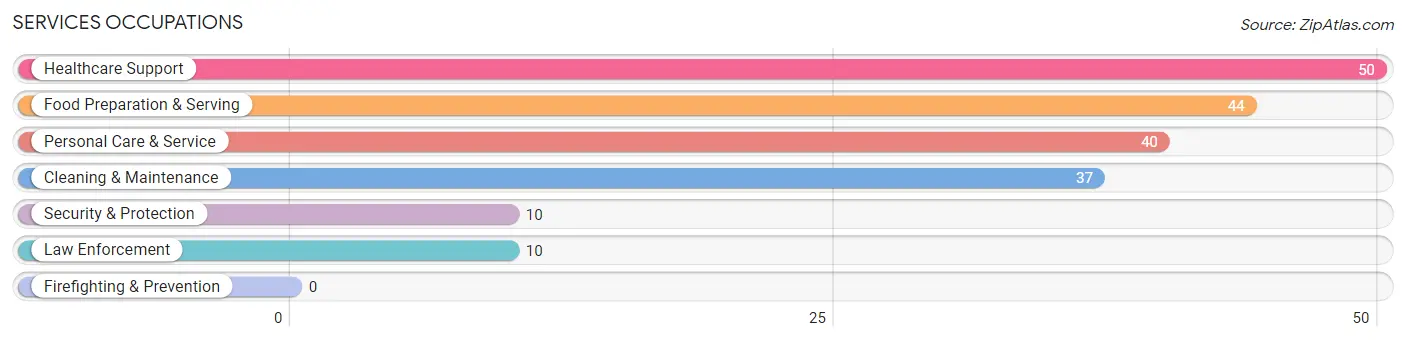
Services Occupations
The most common Services occupations in Beaver are Healthcare Support (50 | 7.2%), Food Preparation & Serving (44 | 6.3%), Personal Care & Service (40 | 5.8%), Cleaning & Maintenance (37 | 5.3%), and Security & Protection (10 | 1.4%).
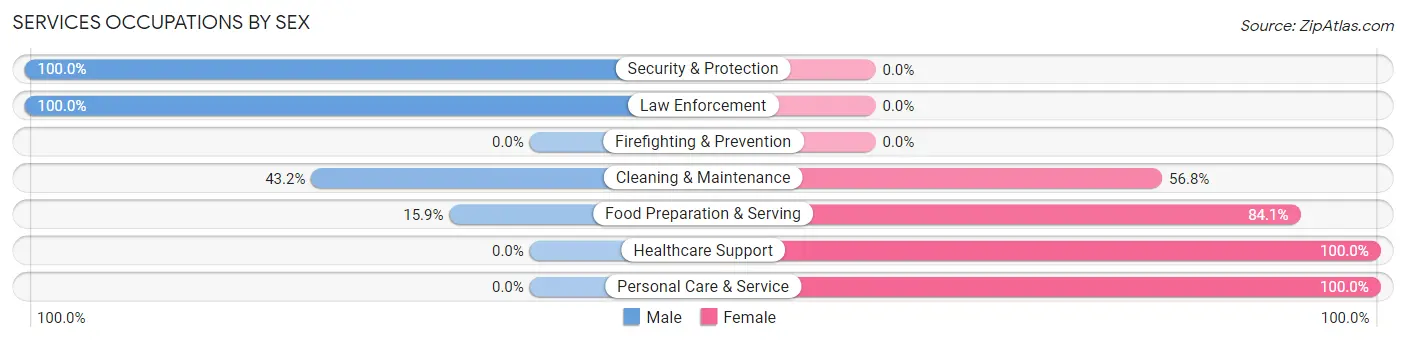
Services Occupations by Sex
Within the Services occupations in Beaver, the most male-oriented occupations are Security & Protection (100.0%), Law Enforcement (100.0%), and Cleaning & Maintenance (43.2%), while the most female-oriented occupations are Healthcare Support (100.0%), Personal Care & Service (100.0%), and Food Preparation & Serving (84.1%).
| Occupation | Male | Female |
| Healthcare Support | 0 (0.0%) | 50 (100.0%) |
| Security & Protection | 10 (100.0%) | 0 (0.0%) |
| Firefighting & Prevention | 0 (0.0%) | 0 (0.0%) |
| Law Enforcement | 10 (100.0%) | 0 (0.0%) |
| Food Preparation & Serving | 7 (15.9%) | 37 (84.1%) |
| Cleaning & Maintenance | 16 (43.2%) | 21 (56.8%) |
| Personal Care & Service | 0 (0.0%) | 40 (100.0%) |
| Total (Category) | 33 (18.2%) | 148 (81.8%) |
| Total (Overall) | 366 (52.7%) | 328 (47.3%) |
Sales and Office Occupations
The most common Sales and Office occupations in Beaver are Office & Administration (83 | 12.0%), and Sales & Related (40 | 5.8%).
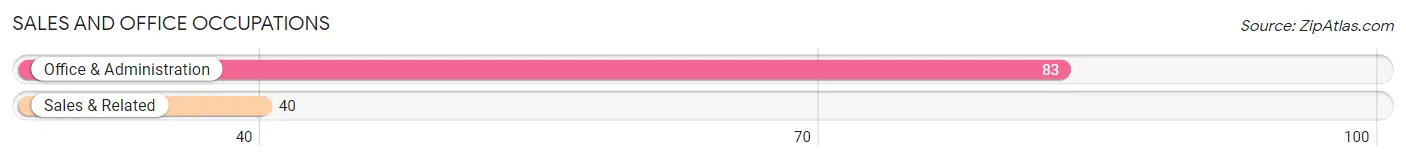
Sales and Office Occupations by Sex
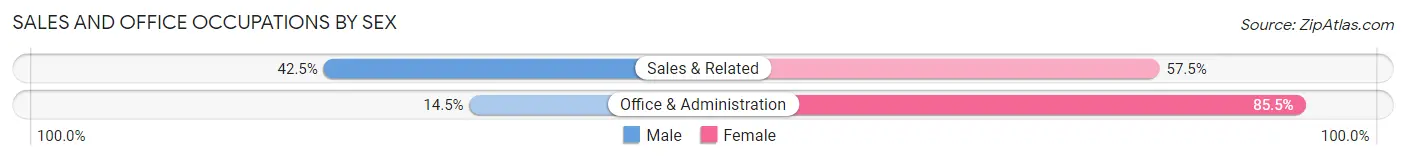
| Occupation | Male | Female |
| Sales & Related | 17 (42.5%) | 23 (57.5%) |
| Office & Administration | 12 (14.5%) | 71 (85.5%) |
| Total (Category) | 29 (23.6%) | 94 (76.4%) |
| Total (Overall) | 366 (52.7%) | 328 (47.3%) |
Natural Resources, Construction and Maintenance Occupations
The most common Natural Resources, Construction and Maintenance occupations in Beaver are Construction & Extraction (130 | 18.7%), Installation, Maintenance & Repair (40 | 5.8%), and Farming, Fishing & Forestry (13 | 1.9%).
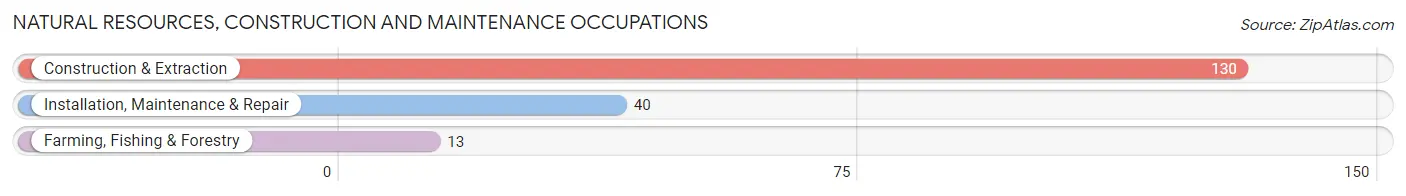
Natural Resources, Construction and Maintenance Occupations by Sex
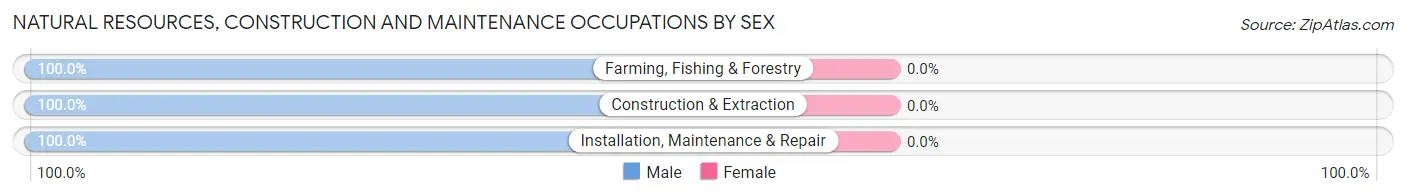
| Occupation | Male | Female |
| Farming, Fishing & Forestry | 13 (100.0%) | 0 (0.0%) |
| Construction & Extraction | 130 (100.0%) | 0 (0.0%) |
| Installation, Maintenance & Repair | 40 (100.0%) | 0 (0.0%) |
| Total (Category) | 183 (100.0%) | 0 (0.0%) |
| Total (Overall) | 366 (52.7%) | 328 (47.3%) |
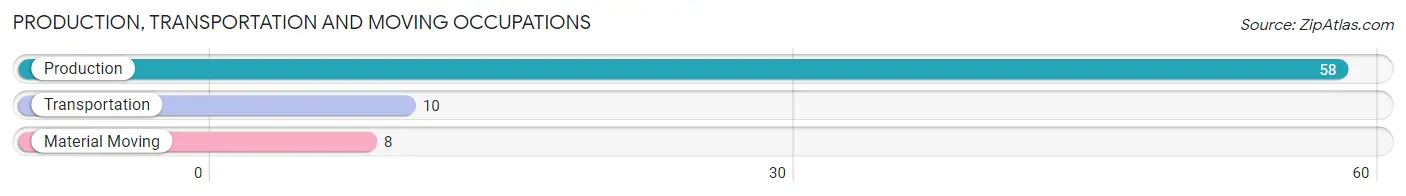
Production, Transportation and Moving Occupations
The most common Production, Transportation and Moving occupations in Beaver are Production (58 | 8.4%), Transportation (10 | 1.4%), and Material Moving (8 | 1.1%).
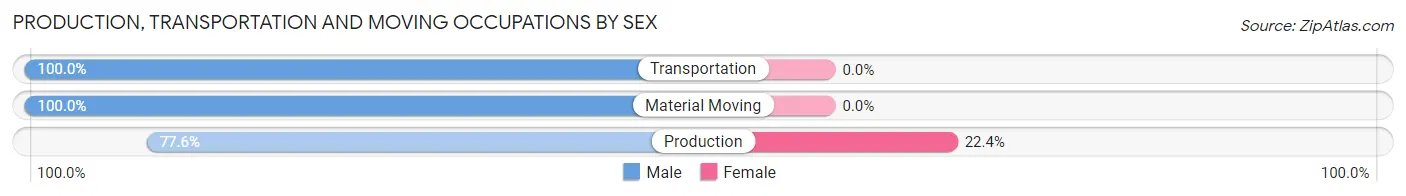
Production, Transportation and Moving Occupations by Sex
| Occupation | Male | Female |
| Production | 45 (77.6%) | 13 (22.4%) |
| Transportation | 10 (100.0%) | 0 (0.0%) |
| Material Moving | 8 (100.0%) | 0 (0.0%) |
| Total (Category) | 63 (82.9%) | 13 (17.1%) |
| Total (Overall) | 366 (52.7%) | 328 (47.3%) |
Employment Industries by Sex in Beaver
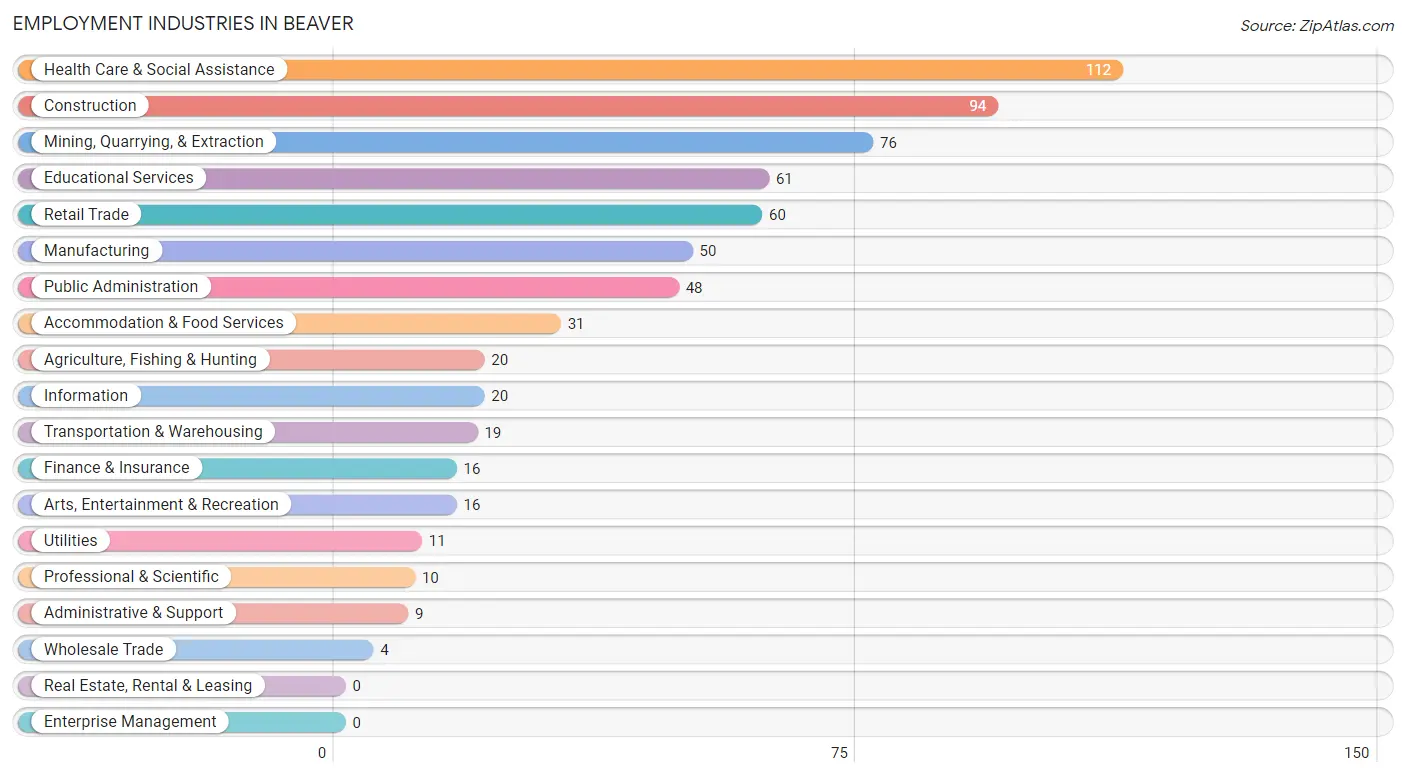
Employment Industries in Beaver
The major employment industries in Beaver include Health Care & Social Assistance (112 | 16.1%), Construction (94 | 13.5%), Mining, Quarrying, & Extraction (76 | 11.0%), Educational Services (61 | 8.8%), and Retail Trade (60 | 8.6%).
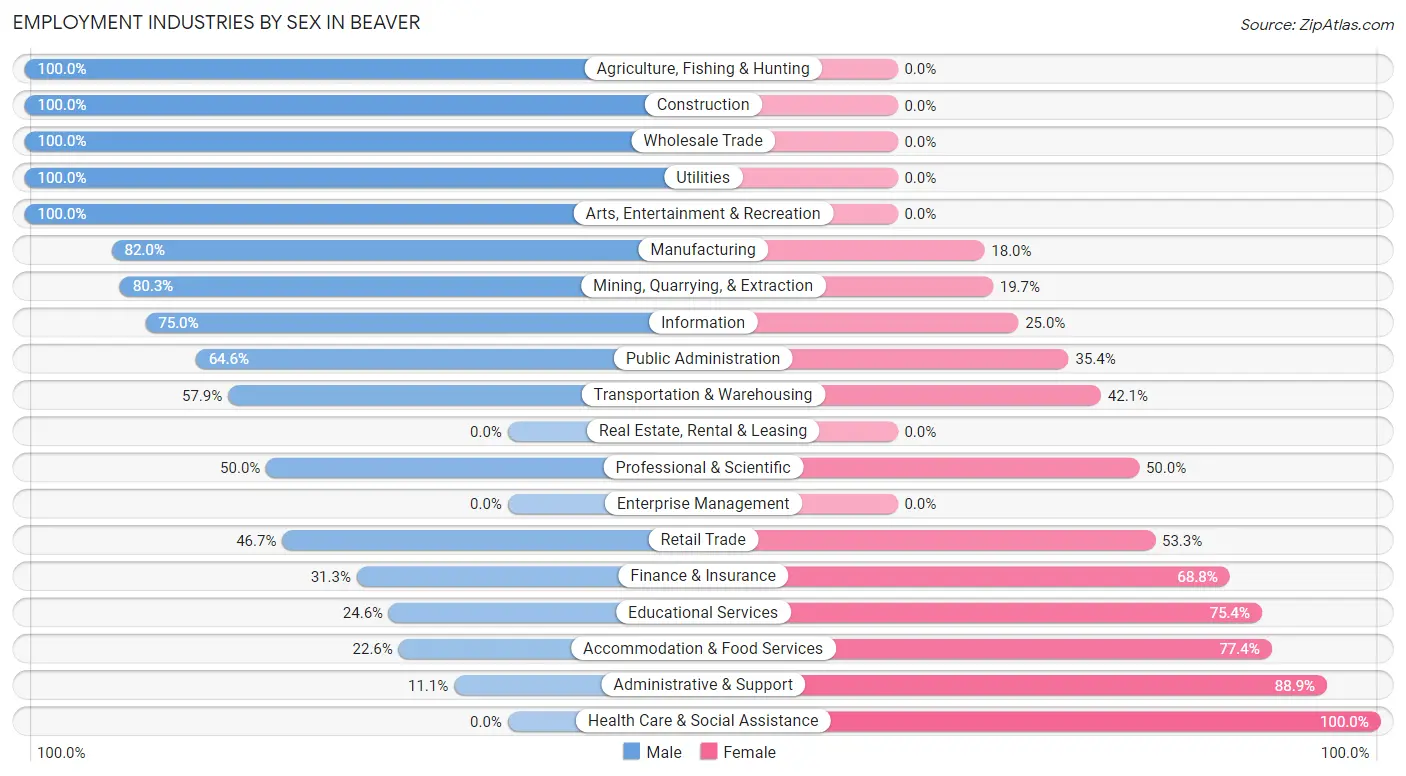
Employment Industries by Sex in Beaver
The Beaver industries that see more men than women are Agriculture, Fishing & Hunting (100.0%), Construction (100.0%), and Wholesale Trade (100.0%), whereas the industries that tend to have a higher number of women are Health Care & Social Assistance (100.0%), Administrative & Support (88.9%), and Accommodation & Food Services (77.4%).
| Industry | Male | Female |
| Agriculture, Fishing & Hunting | 20 (100.0%) | 0 (0.0%) |
| Mining, Quarrying, & Extraction | 61 (80.3%) | 15 (19.7%) |
| Construction | 94 (100.0%) | 0 (0.0%) |
| Manufacturing | 41 (82.0%) | 9 (18.0%) |
| Wholesale Trade | 4 (100.0%) | 0 (0.0%) |
| Retail Trade | 28 (46.7%) | 32 (53.3%) |
| Transportation & Warehousing | 11 (57.9%) | 8 (42.1%) |
| Utilities | 11 (100.0%) | 0 (0.0%) |
| Information | 15 (75.0%) | 5 (25.0%) |
| Finance & Insurance | 5 (31.2%) | 11 (68.8%) |
| Real Estate, Rental & Leasing | 0 (0.0%) | 0 (0.0%) |
| Professional & Scientific | 5 (50.0%) | 5 (50.0%) |
| Enterprise Management | 0 (0.0%) | 0 (0.0%) |
| Administrative & Support | 1 (11.1%) | 8 (88.9%) |
| Educational Services | 15 (24.6%) | 46 (75.4%) |
| Health Care & Social Assistance | 0 (0.0%) | 112 (100.0%) |
| Arts, Entertainment & Recreation | 16 (100.0%) | 0 (0.0%) |
| Accommodation & Food Services | 7 (22.6%) | 24 (77.4%) |
| Public Administration | 31 (64.6%) | 17 (35.4%) |
| Total | 366 (52.7%) | 328 (47.3%) |
Education in Beaver
School Enrollment in Beaver
The most common levels of schooling among the 391 students in Beaver are high school (131 | 33.5%), elementary school (111 | 28.4%), and middle school (81 | 20.7%).
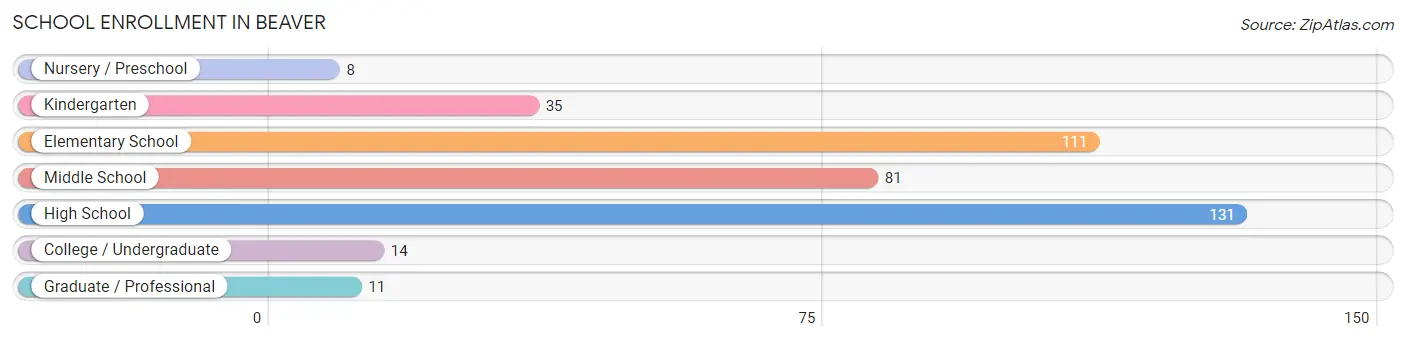
| School Level | # Students | % Students |
| Nursery / Preschool | 8 | 2.1% |
| Kindergarten | 35 | 8.9% |
| Elementary School | 111 | 28.4% |
| Middle School | 81 | 20.7% |
| High School | 131 | 33.5% |
| College / Undergraduate | 14 | 3.6% |
| Graduate / Professional | 11 | 2.8% |
| Total | 391 | 100.0% |
School Enrollment by Age by Funding Source in Beaver
Out of a total of 391 students who are enrolled in schools in Beaver, 11 (2.8%) attend a private institution, while the remaining 380 (97.2%) are enrolled in public schools. The age group of 35 years and over has the highest likelihood of being enrolled in private schools, with 11 (100.0% in the age bracket) enrolled. Conversely, the age group of 3 to 4 year olds has the lowest likelihood of being enrolled in a private school, with 3 (100.0% in the age bracket) attending a public institution.
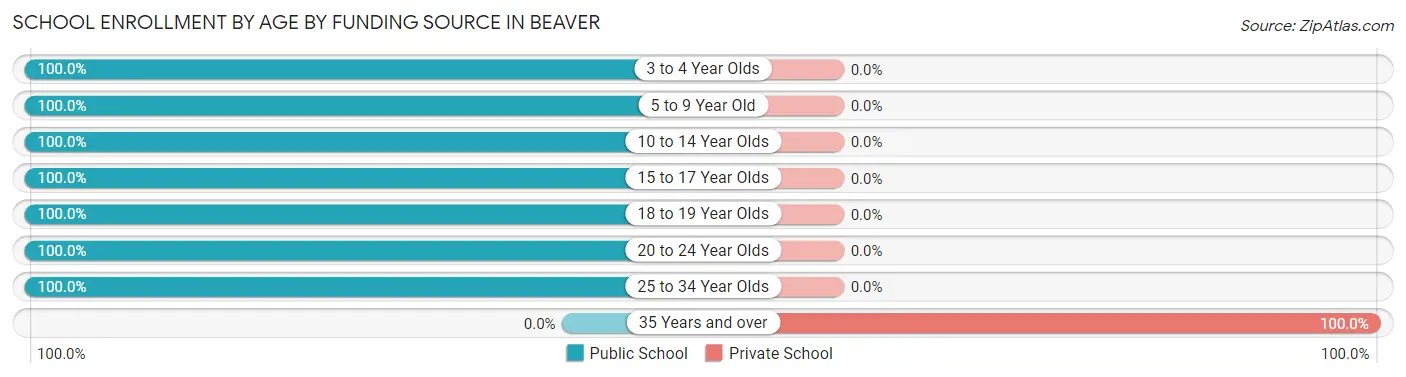
| Age Bracket | Public School | Private School |
| 3 to 4 Year Olds | 3 (100.0%) | 0 (0.0%) |
| 5 to 9 Year Old | 129 (100.0%) | 0 (0.0%) |
| 10 to 14 Year Olds | 146 (100.0%) | 0 (0.0%) |
| 15 to 17 Year Olds | 61 (100.0%) | 0 (0.0%) |
| 18 to 19 Year Olds | 21 (100.0%) | 0 (0.0%) |
| 20 to 24 Year Olds | 3 (100.0%) | 0 (0.0%) |
| 25 to 34 Year Olds | 17 (100.0%) | 0 (0.0%) |
| 35 Years and over | 0 (0.0%) | 11 (100.0%) |
| Total | 380 (97.2%) | 11 (2.8%) |
Educational Attainment by Field of Study in Beaver
Education (49 | 31.2%), science & technology (19 | 12.1%), physical & health sciences (17 | 10.8%), psychology (16 | 10.2%), and business (16 | 10.2%) are the most common fields of study among 157 individuals in Beaver who have obtained a bachelor's degree or higher.
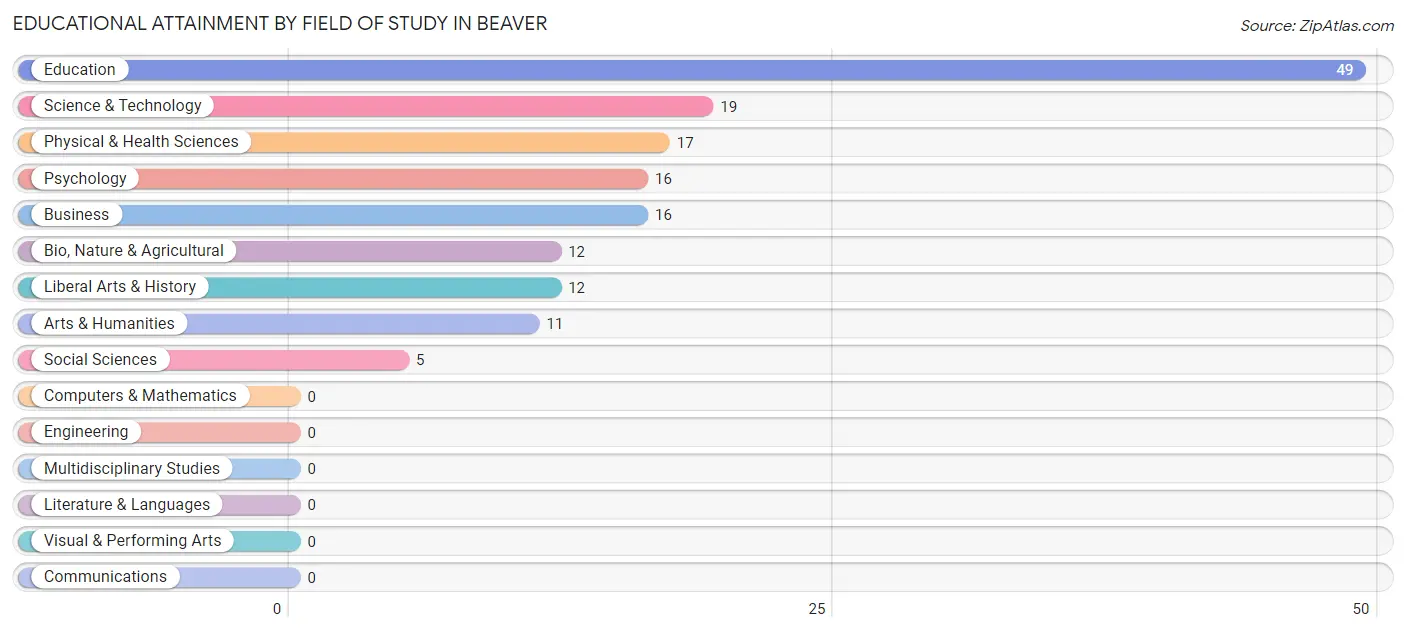
| Field of Study | # Graduates | % Graduates |
| Computers & Mathematics | 0 | 0.0% |
| Bio, Nature & Agricultural | 12 | 7.6% |
| Physical & Health Sciences | 17 | 10.8% |
| Psychology | 16 | 10.2% |
| Social Sciences | 5 | 3.2% |
| Engineering | 0 | 0.0% |
| Multidisciplinary Studies | 0 | 0.0% |
| Science & Technology | 19 | 12.1% |
| Business | 16 | 10.2% |
| Education | 49 | 31.2% |
| Literature & Languages | 0 | 0.0% |
| Liberal Arts & History | 12 | 7.6% |
| Visual & Performing Arts | 0 | 0.0% |
| Communications | 0 | 0.0% |
| Arts & Humanities | 11 | 7.0% |
| Total | 157 | 100.0% |
Transportation & Commute in Beaver
Vehicle Availability by Sex in Beaver
The most prevalent vehicle ownership categories in Beaver are males with 2 vehicles (141, accounting for 38.5%) and females with 2 vehicles (118, making up 43.0%).
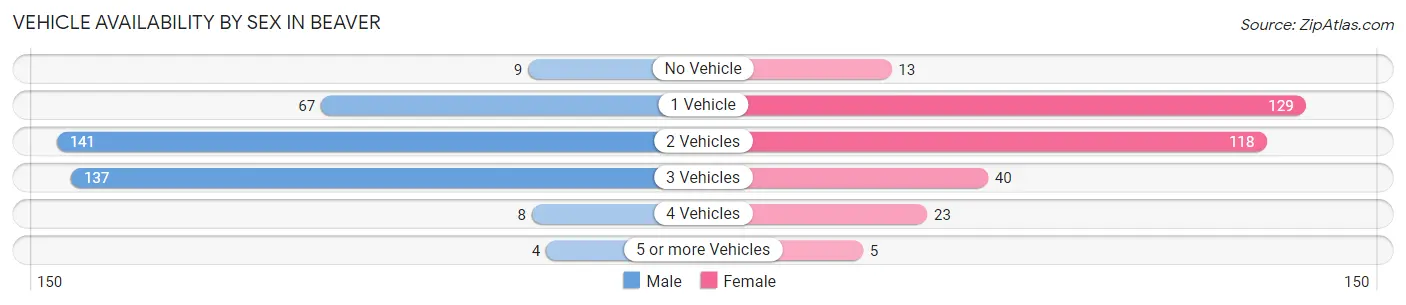
| Vehicles Available | Male | Female |
| No Vehicle | 9 (2.5%) | 13 (4.0%) |
| 1 Vehicle | 67 (18.3%) | 129 (39.3%) |
| 2 Vehicles | 141 (38.5%) | 118 (36.0%) |
| 3 Vehicles | 137 (37.4%) | 40 (12.2%) |
| 4 Vehicles | 8 (2.2%) | 23 (7.0%) |
| 5 or more Vehicles | 4 (1.1%) | 5 (1.5%) |
| Total | 366 (100.0%) | 328 (100.0%) |
Commute Time in Beaver
The most frequently occuring commute durations in Beaver are less than 5 minutes (255 commuters, 37.3%), 5 to 9 minutes (236 commuters, 34.5%), and 10 to 14 minutes (52 commuters, 7.6%).
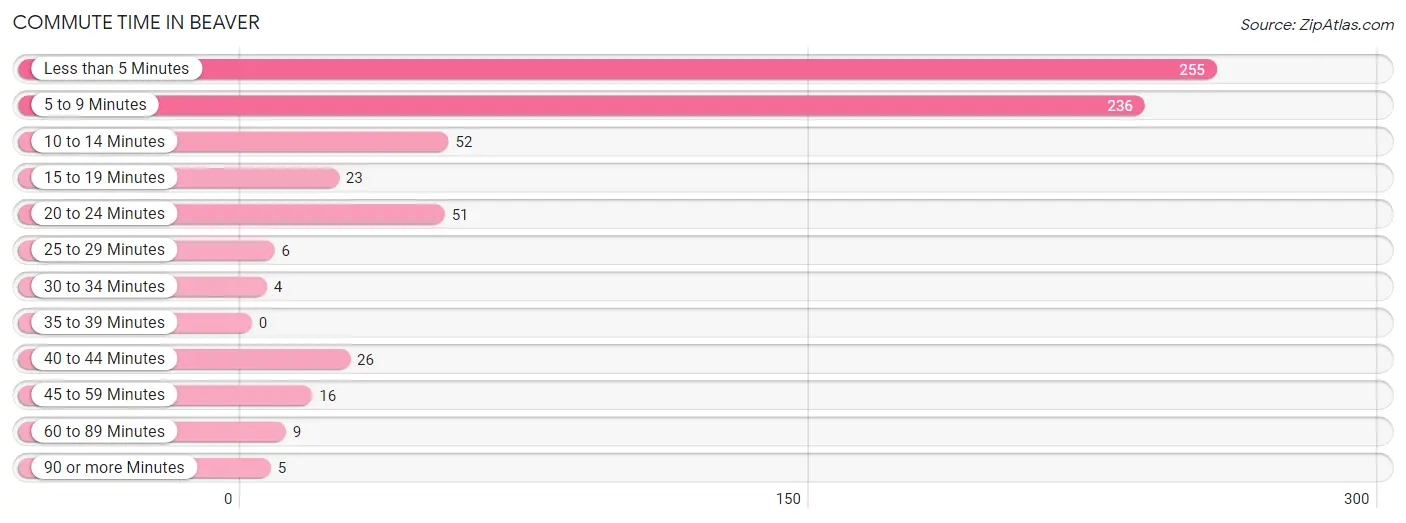
| Commute Time | # Commuters | % Commuters |
| Less than 5 Minutes | 255 | 37.3% |
| 5 to 9 Minutes | 236 | 34.5% |
| 10 to 14 Minutes | 52 | 7.6% |
| 15 to 19 Minutes | 23 | 3.4% |
| 20 to 24 Minutes | 51 | 7.5% |
| 25 to 29 Minutes | 6 | 0.9% |
| 30 to 34 Minutes | 4 | 0.6% |
| 35 to 39 Minutes | 0 | 0.0% |
| 40 to 44 Minutes | 26 | 3.8% |
| 45 to 59 Minutes | 16 | 2.3% |
| 60 to 89 Minutes | 9 | 1.3% |
| 90 or more Minutes | 5 | 0.7% |
Commute Time by Sex in Beaver
The most common commute times in Beaver are 5 to 9 minutes (155 commuters, 43.7%) for males and less than 5 minutes (181 commuters, 55.2%) for females.
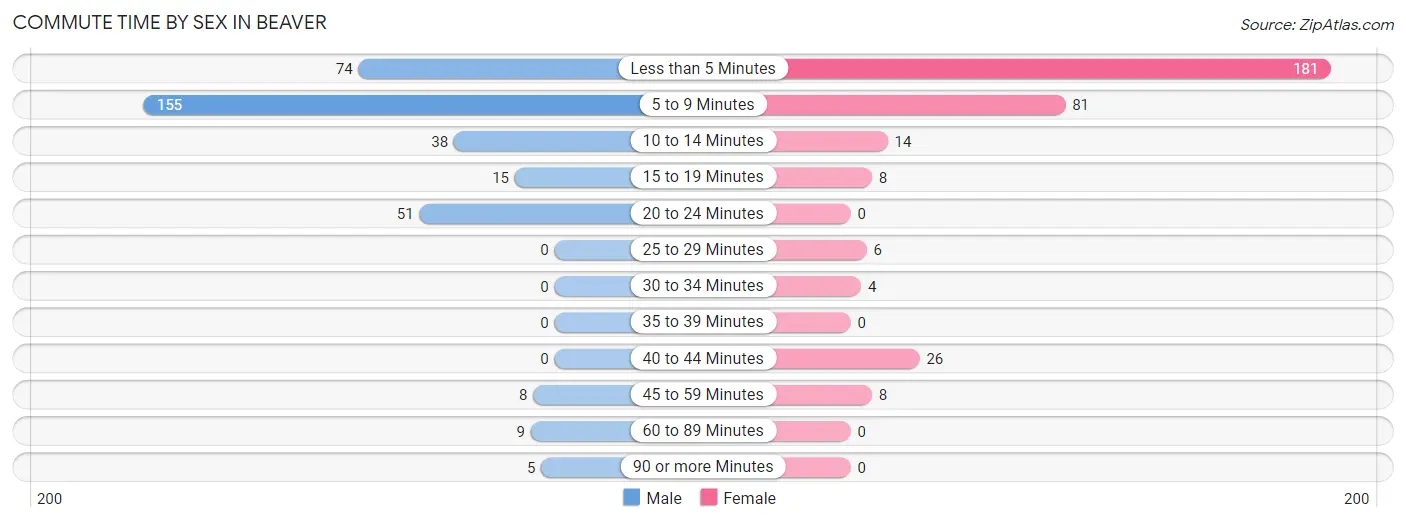
| Commute Time | Male | Female |
| Less than 5 Minutes | 74 (20.8%) | 181 (55.2%) |
| 5 to 9 Minutes | 155 (43.7%) | 81 (24.7%) |
| 10 to 14 Minutes | 38 (10.7%) | 14 (4.3%) |
| 15 to 19 Minutes | 15 (4.2%) | 8 (2.4%) |
| 20 to 24 Minutes | 51 (14.4%) | 0 (0.0%) |
| 25 to 29 Minutes | 0 (0.0%) | 6 (1.8%) |
| 30 to 34 Minutes | 0 (0.0%) | 4 (1.2%) |
| 35 to 39 Minutes | 0 (0.0%) | 0 (0.0%) |
| 40 to 44 Minutes | 0 (0.0%) | 26 (7.9%) |
| 45 to 59 Minutes | 8 (2.2%) | 8 (2.4%) |
| 60 to 89 Minutes | 9 (2.5%) | 0 (0.0%) |
| 90 or more Minutes | 5 (1.4%) | 0 (0.0%) |
Time of Departure to Work by Sex in Beaver
The most frequent times of departure to work in Beaver are 7:00 AM to 7:29 AM (72, 20.3%) for males and 7:30 AM to 7:59 AM (74, 22.6%) for females.
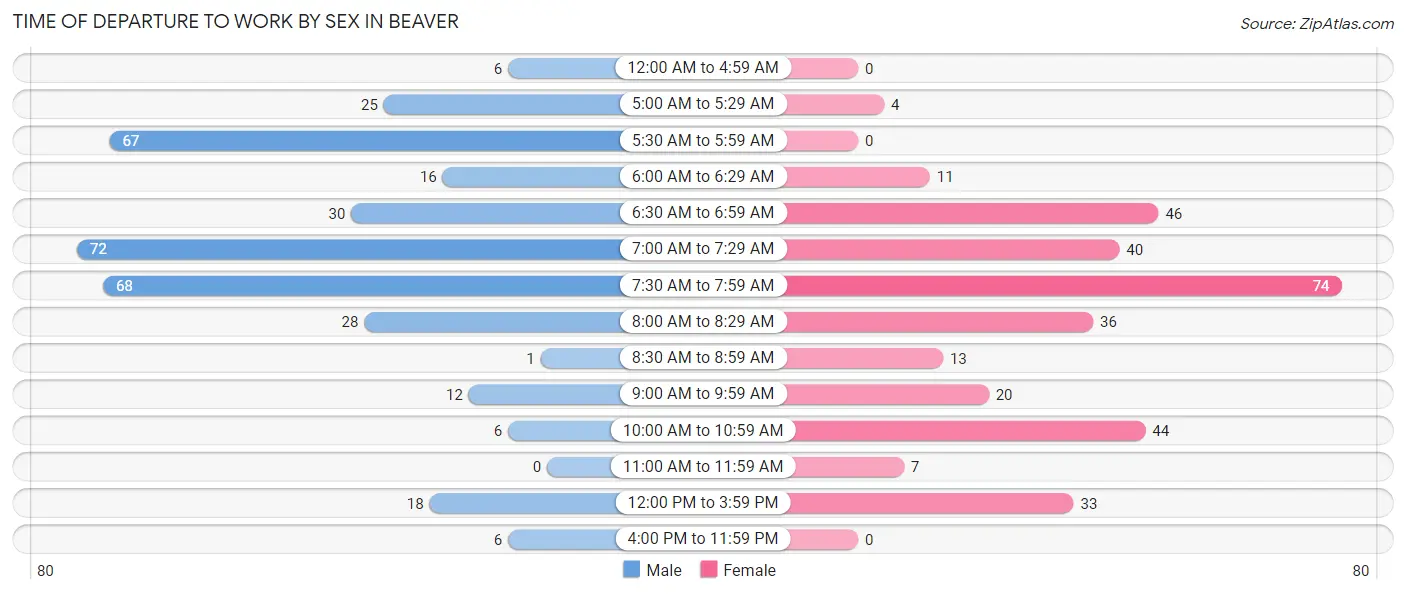
| Time of Departure | Male | Female |
| 12:00 AM to 4:59 AM | 6 (1.7%) | 0 (0.0%) |
| 5:00 AM to 5:29 AM | 25 (7.0%) | 4 (1.2%) |
| 5:30 AM to 5:59 AM | 67 (18.9%) | 0 (0.0%) |
| 6:00 AM to 6:29 AM | 16 (4.5%) | 11 (3.4%) |
| 6:30 AM to 6:59 AM | 30 (8.5%) | 46 (14.0%) |
| 7:00 AM to 7:29 AM | 72 (20.3%) | 40 (12.2%) |
| 7:30 AM to 7:59 AM | 68 (19.2%) | 74 (22.6%) |
| 8:00 AM to 8:29 AM | 28 (7.9%) | 36 (11.0%) |
| 8:30 AM to 8:59 AM | 1 (0.3%) | 13 (4.0%) |
| 9:00 AM to 9:59 AM | 12 (3.4%) | 20 (6.1%) |
| 10:00 AM to 10:59 AM | 6 (1.7%) | 44 (13.4%) |
| 11:00 AM to 11:59 AM | 0 (0.0%) | 7 (2.1%) |
| 12:00 PM to 3:59 PM | 18 (5.1%) | 33 (10.1%) |
| 4:00 PM to 11:59 PM | 6 (1.7%) | 0 (0.0%) |
| Total | 355 (100.0%) | 328 (100.0%) |
Housing Occupancy in Beaver
Occupancy by Ownership in Beaver
Of the total 526 dwellings in Beaver, owner-occupied units account for 389 (74.0%), while renter-occupied units make up 137 (26.1%).
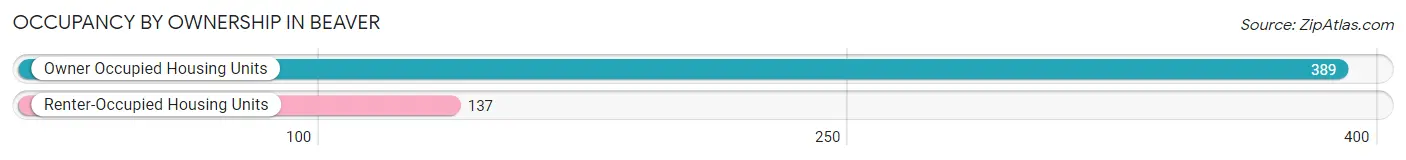
| Occupancy | # Housing Units | % Housing Units |
| Owner Occupied Housing Units | 389 | 74.0% |
| Renter-Occupied Housing Units | 137 | 26.1% |
| Total Occupied Housing Units | 526 | 100.0% |
Occupancy by Household Size in Beaver
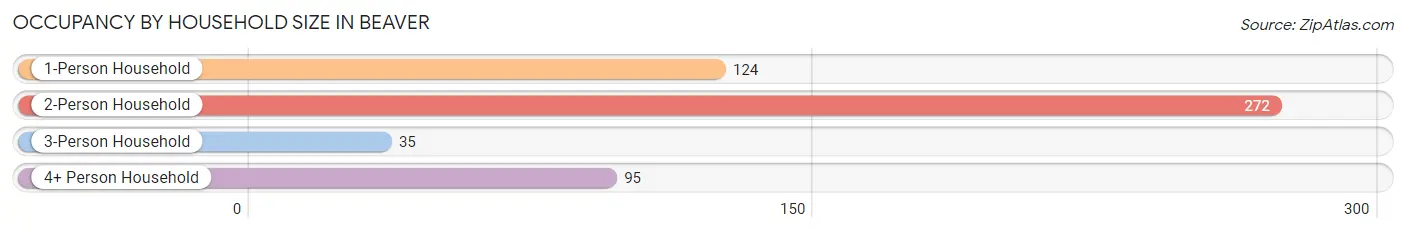
| Household Size | # Housing Units | % Housing Units |
| 1-Person Household | 124 | 23.6% |
| 2-Person Household | 272 | 51.7% |
| 3-Person Household | 35 | 6.7% |
| 4+ Person Household | 95 | 18.1% |
| Total Housing Units | 526 | 100.0% |
Occupancy by Ownership by Household Size in Beaver
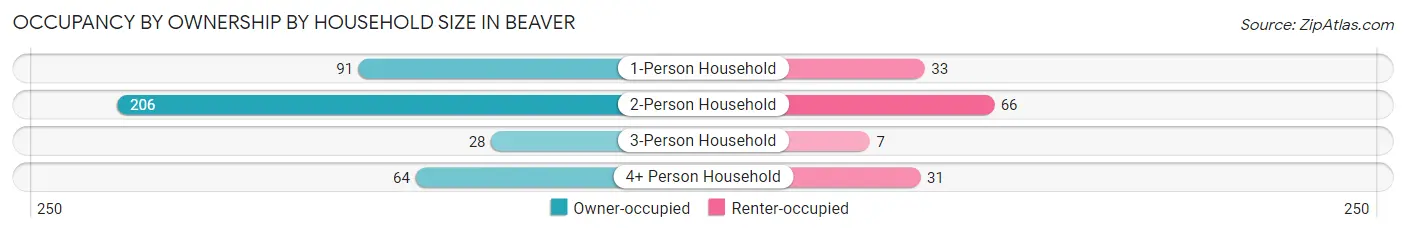
| Household Size | Owner-occupied | Renter-occupied |
| 1-Person Household | 91 (73.4%) | 33 (26.6%) |
| 2-Person Household | 206 (75.7%) | 66 (24.3%) |
| 3-Person Household | 28 (80.0%) | 7 (20.0%) |
| 4+ Person Household | 64 (67.4%) | 31 (32.6%) |
| Total Housing Units | 389 (74.0%) | 137 (26.1%) |
Occupancy by Educational Attainment in Beaver
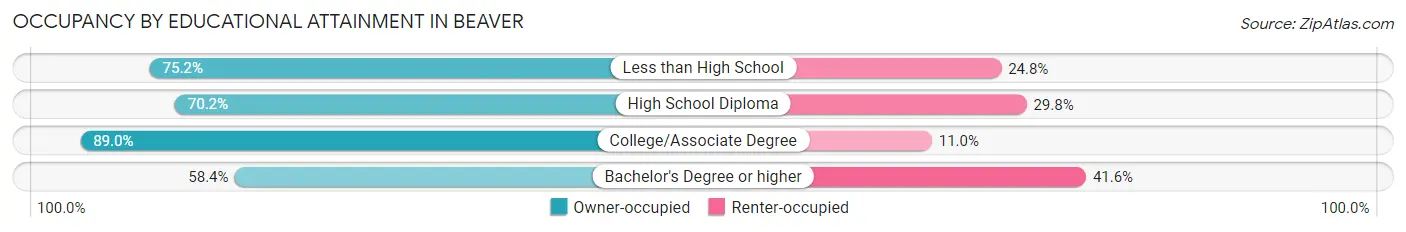
| Household Size | Owner-occupied | Renter-occupied |
| Less than High School | 88 (75.2%) | 29 (24.8%) |
| High School Diploma | 106 (70.2%) | 45 (29.8%) |
| College/Associate Degree | 129 (89.0%) | 16 (11.0%) |
| Bachelor's Degree or higher | 66 (58.4%) | 47 (41.6%) |
Occupancy by Age of Householder in Beaver
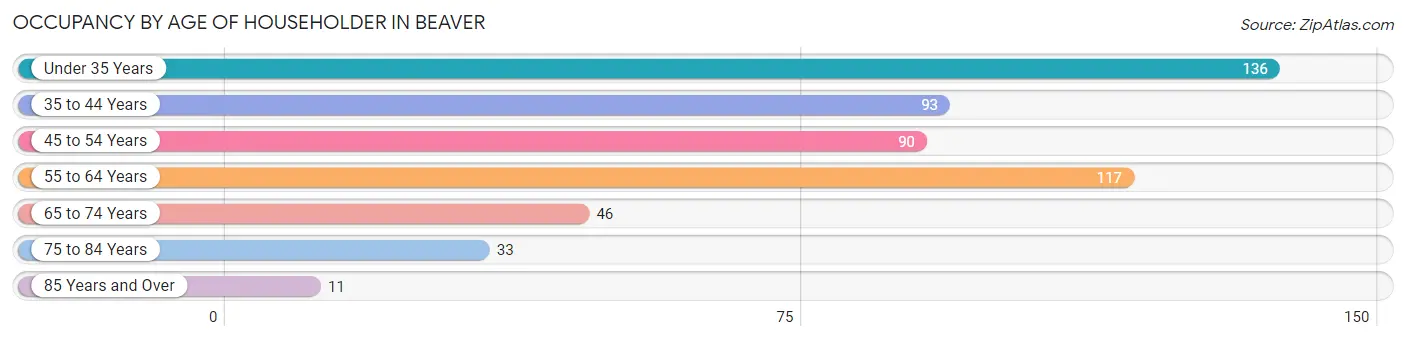
| Age Bracket | # Households | % Households |
| Under 35 Years | 136 | 25.9% |
| 35 to 44 Years | 93 | 17.7% |
| 45 to 54 Years | 90 | 17.1% |
| 55 to 64 Years | 117 | 22.2% |
| 65 to 74 Years | 46 | 8.7% |
| 75 to 84 Years | 33 | 6.3% |
| 85 Years and Over | 11 | 2.1% |
| Total | 526 | 100.0% |
Housing Finances in Beaver
Median Income by Occupancy in Beaver
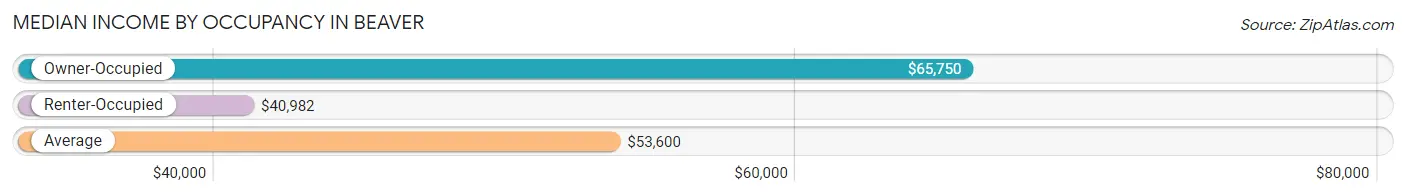
| Occupancy Type | # Households | Median Income |
| Owner-Occupied | 389 (74.0%) | $65,750 |
| Renter-Occupied | 137 (26.1%) | $40,982 |
| Average | 526 (100.0%) | $53,600 |
Occupancy by Householder Income Bracket in Beaver
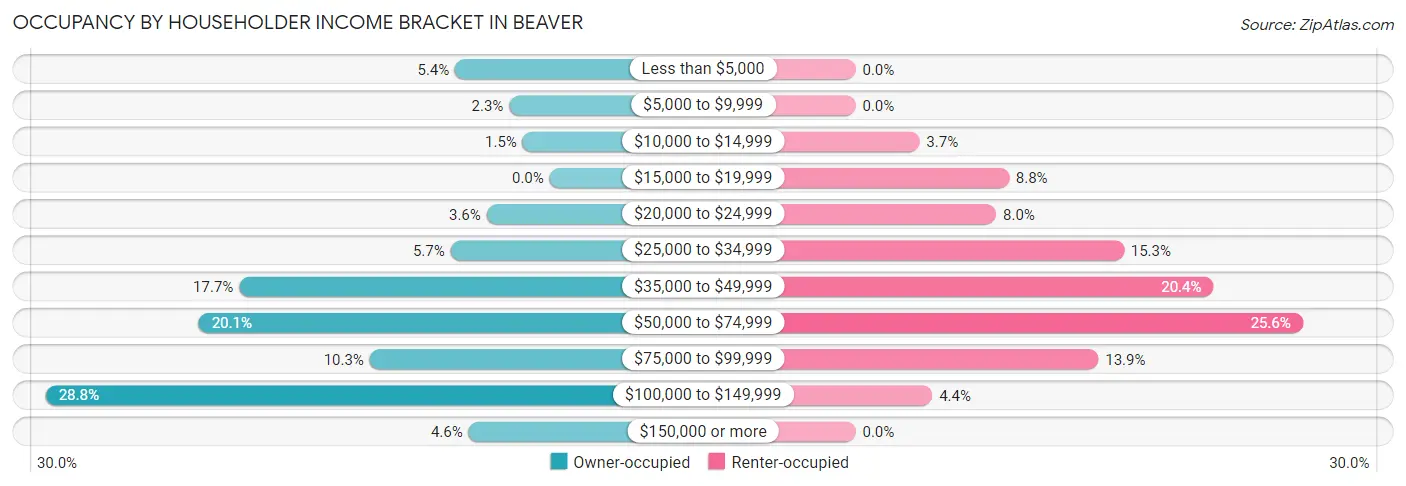
| Income Bracket | Owner-occupied | Renter-occupied |
| Less than $5,000 | 21 (5.4%) | 0 (0.0%) |
| $5,000 to $9,999 | 9 (2.3%) | 0 (0.0%) |
| $10,000 to $14,999 | 6 (1.5%) | 5 (3.6%) |
| $15,000 to $19,999 | 0 (0.0%) | 12 (8.8%) |
| $20,000 to $24,999 | 14 (3.6%) | 11 (8.0%) |
| $25,000 to $34,999 | 22 (5.7%) | 21 (15.3%) |
| $35,000 to $49,999 | 69 (17.7%) | 28 (20.4%) |
| $50,000 to $74,999 | 78 (20.1%) | 35 (25.6%) |
| $75,000 to $99,999 | 40 (10.3%) | 19 (13.9%) |
| $100,000 to $149,999 | 112 (28.8%) | 6 (4.4%) |
| $150,000 or more | 18 (4.6%) | 0 (0.0%) |
| Total | 389 (100.0%) | 137 (100.0%) |
Monthly Housing Cost Tiers in Beaver
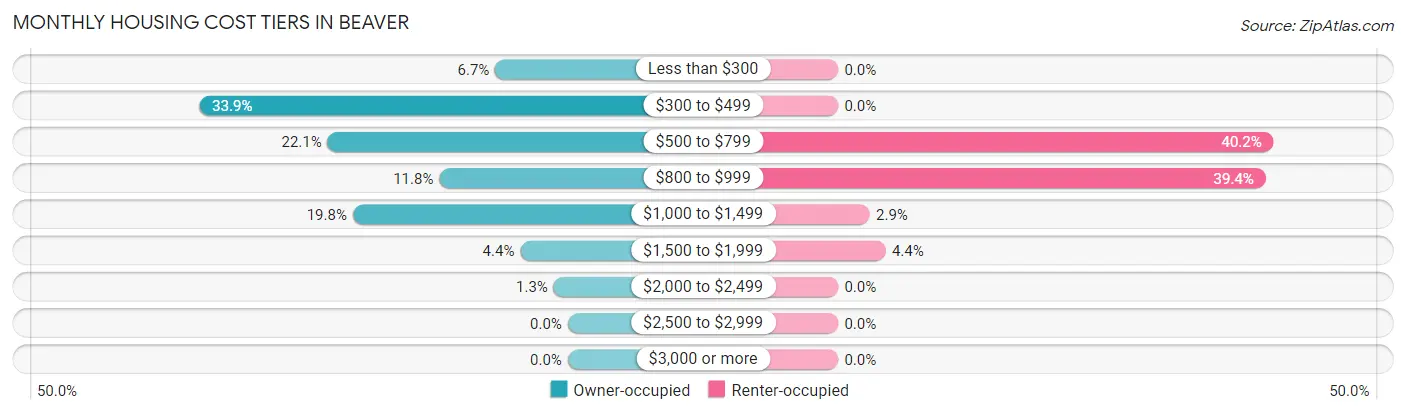
| Monthly Cost | Owner-occupied | Renter-occupied |
| Less than $300 | 26 (6.7%) | 0 (0.0%) |
| $300 to $499 | 132 (33.9%) | 0 (0.0%) |
| $500 to $799 | 86 (22.1%) | 55 (40.2%) |
| $800 to $999 | 46 (11.8%) | 54 (39.4%) |
| $1,000 to $1,499 | 77 (19.8%) | 4 (2.9%) |
| $1,500 to $1,999 | 17 (4.4%) | 6 (4.4%) |
| $2,000 to $2,499 | 5 (1.3%) | 0 (0.0%) |
| $2,500 to $2,999 | 0 (0.0%) | 0 (0.0%) |
| $3,000 or more | 0 (0.0%) | 0 (0.0%) |
| Total | 389 (100.0%) | 137 (100.0%) |
Physical Housing Characteristics in Beaver
Housing Structures in Beaver
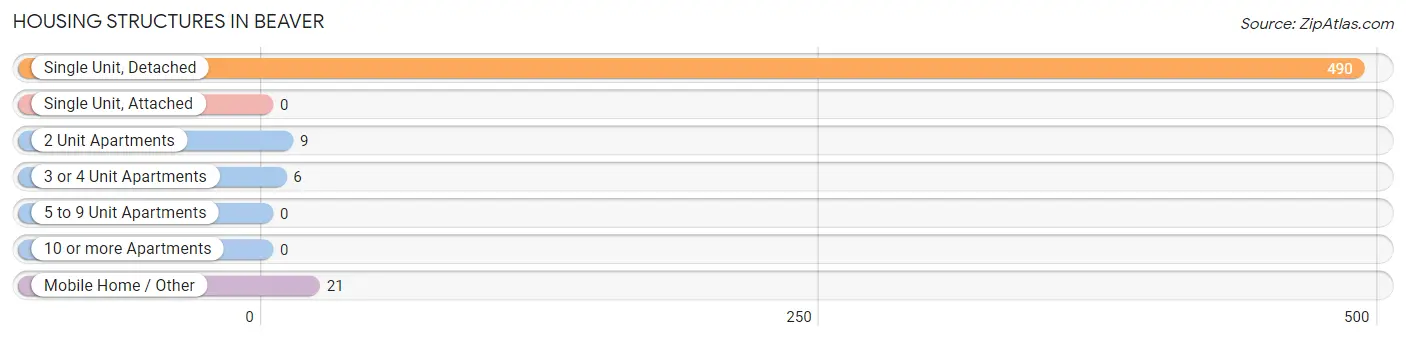
| Structure Type | # Housing Units | % Housing Units |
| Single Unit, Detached | 490 | 93.2% |
| Single Unit, Attached | 0 | 0.0% |
| 2 Unit Apartments | 9 | 1.7% |
| 3 or 4 Unit Apartments | 6 | 1.1% |
| 5 to 9 Unit Apartments | 0 | 0.0% |
| 10 or more Apartments | 0 | 0.0% |
| Mobile Home / Other | 21 | 4.0% |
| Total | 526 | 100.0% |
Housing Structures by Occupancy in Beaver
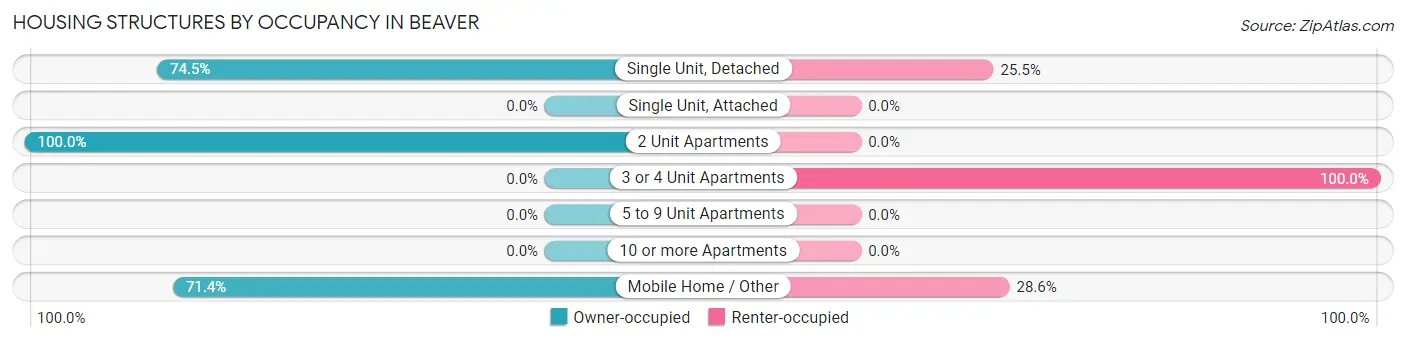
| Structure Type | Owner-occupied | Renter-occupied |
| Single Unit, Detached | 365 (74.5%) | 125 (25.5%) |
| Single Unit, Attached | 0 (0.0%) | 0 (0.0%) |
| 2 Unit Apartments | 9 (100.0%) | 0 (0.0%) |
| 3 or 4 Unit Apartments | 0 (0.0%) | 6 (100.0%) |
| 5 to 9 Unit Apartments | 0 (0.0%) | 0 (0.0%) |
| 10 or more Apartments | 0 (0.0%) | 0 (0.0%) |
| Mobile Home / Other | 15 (71.4%) | 6 (28.6%) |
| Total | 389 (74.0%) | 137 (26.1%) |
Housing Structures by Number of Rooms in Beaver
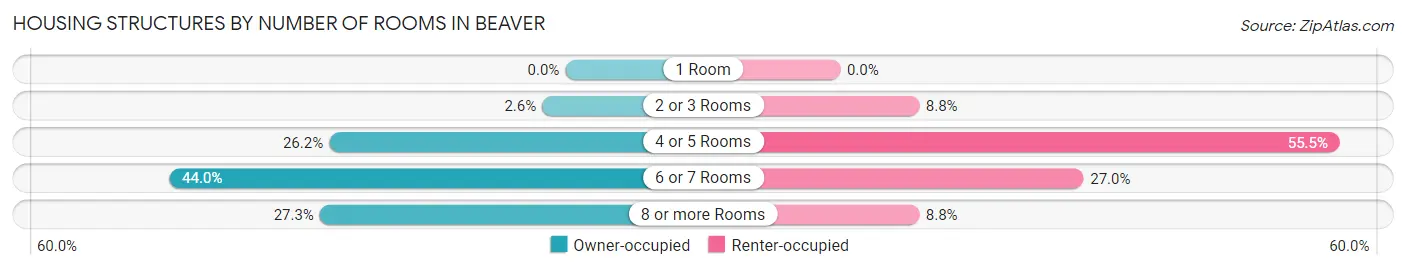
| Number of Rooms | Owner-occupied | Renter-occupied |
| 1 Room | 0 (0.0%) | 0 (0.0%) |
| 2 or 3 Rooms | 10 (2.6%) | 12 (8.8%) |
| 4 or 5 Rooms | 102 (26.2%) | 76 (55.5%) |
| 6 or 7 Rooms | 171 (44.0%) | 37 (27.0%) |
| 8 or more Rooms | 106 (27.3%) | 12 (8.8%) |
| Total | 389 (100.0%) | 137 (100.0%) |
Housing Structure by Heating Type in Beaver
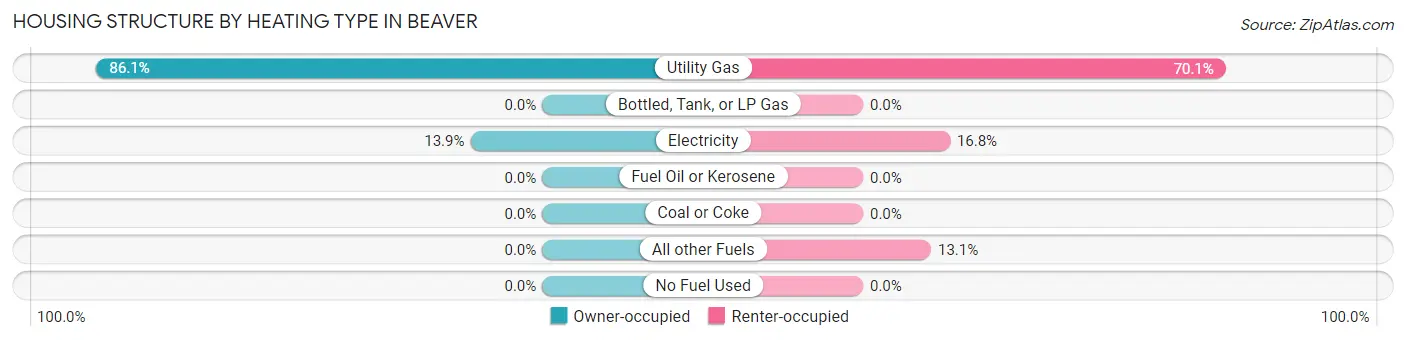
| Heating Type | Owner-occupied | Renter-occupied |
| Utility Gas | 335 (86.1%) | 96 (70.1%) |
| Bottled, Tank, or LP Gas | 0 (0.0%) | 0 (0.0%) |
| Electricity | 54 (13.9%) | 23 (16.8%) |
| Fuel Oil or Kerosene | 0 (0.0%) | 0 (0.0%) |
| Coal or Coke | 0 (0.0%) | 0 (0.0%) |
| All other Fuels | 0 (0.0%) | 18 (13.1%) |
| No Fuel Used | 0 (0.0%) | 0 (0.0%) |
| Total | 389 (100.0%) | 137 (100.0%) |
Household Vehicle Usage in Beaver
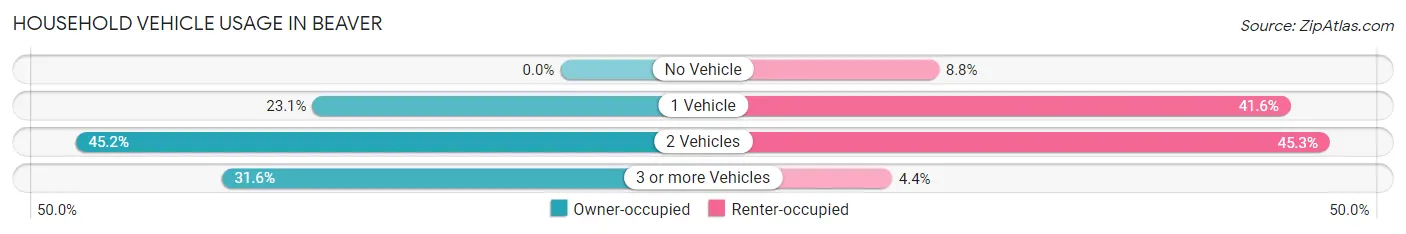
| Vehicles per Household | Owner-occupied | Renter-occupied |
| No Vehicle | 0 (0.0%) | 12 (8.8%) |
| 1 Vehicle | 90 (23.1%) | 57 (41.6%) |
| 2 Vehicles | 176 (45.2%) | 62 (45.3%) |
| 3 or more Vehicles | 123 (31.6%) | 6 (4.4%) |
| Total | 389 (100.0%) | 137 (100.0%) |
Real Estate & Mortgages in Beaver
Real Estate and Mortgage Overview in Beaver
| Characteristic | Without Mortgage | With Mortgage |
| Housing Units | 251 | 138 |
| Median Property Value | $95,300 | $122,400 |
| Median Household Income | $51,369 | $18 |
| Monthly Housing Costs | $474 | $0 |
| Real Estate Taxes | $599 | $4 |
Property Value by Mortgage Status in Beaver
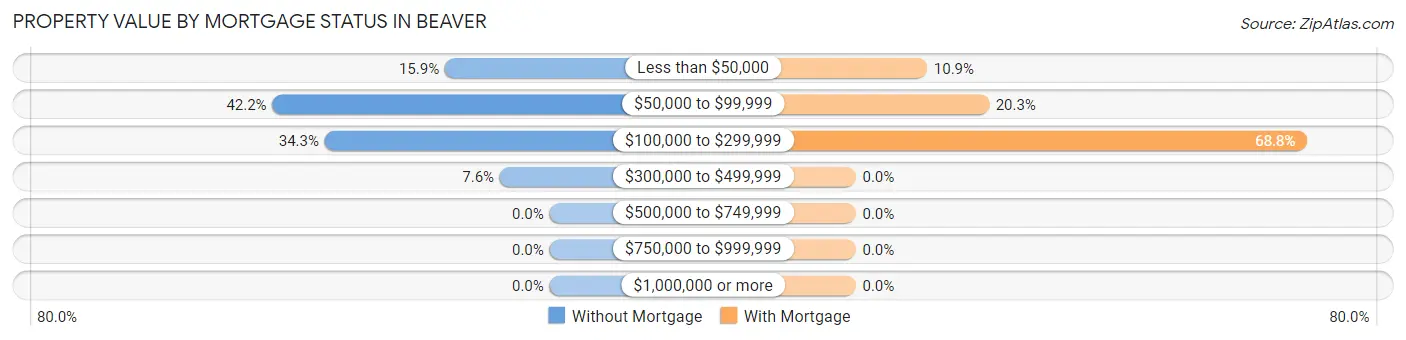
| Property Value | Without Mortgage | With Mortgage |
| Less than $50,000 | 40 (15.9%) | 15 (10.9%) |
| $50,000 to $99,999 | 106 (42.2%) | 28 (20.3%) |
| $100,000 to $299,999 | 86 (34.3%) | 95 (68.8%) |
| $300,000 to $499,999 | 19 (7.6%) | 0 (0.0%) |
| $500,000 to $749,999 | 0 (0.0%) | 0 (0.0%) |
| $750,000 to $999,999 | 0 (0.0%) | 0 (0.0%) |
| $1,000,000 or more | 0 (0.0%) | 0 (0.0%) |
| Total | 251 (100.0%) | 138 (100.0%) |
Household Income by Mortgage Status in Beaver
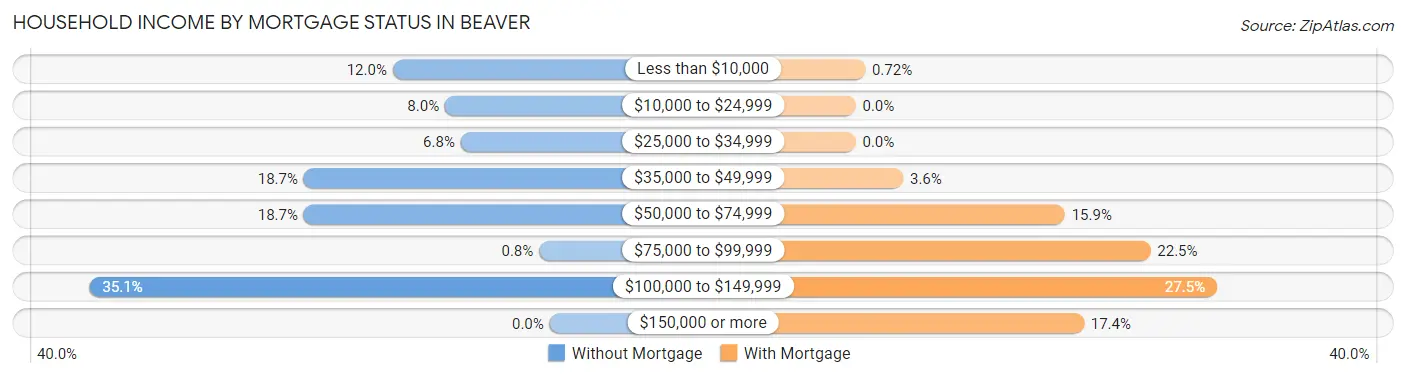
| Household Income | Without Mortgage | With Mortgage |
| Less than $10,000 | 30 (11.9%) | 1 (0.7%) |
| $10,000 to $24,999 | 20 (8.0%) | 0 (0.0%) |
| $25,000 to $34,999 | 17 (6.8%) | 0 (0.0%) |
| $35,000 to $49,999 | 47 (18.7%) | 5 (3.6%) |
| $50,000 to $74,999 | 47 (18.7%) | 22 (15.9%) |
| $75,000 to $99,999 | 2 (0.8%) | 31 (22.5%) |
| $100,000 to $149,999 | 88 (35.1%) | 38 (27.5%) |
| $150,000 or more | 0 (0.0%) | 24 (17.4%) |
| Total | 251 (100.0%) | 138 (100.0%) |
Property Value to Household Income Ratio in Beaver
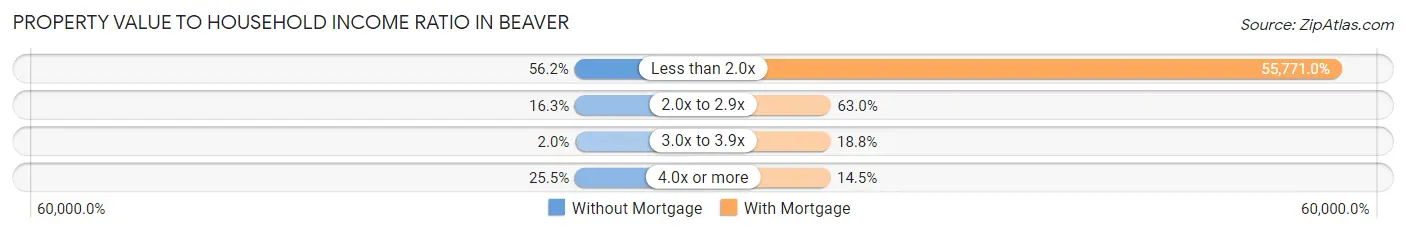
| Value-to-Income Ratio | Without Mortgage | With Mortgage |
| Less than 2.0x | 141 (56.2%) | 76,964 (55,771.0%) |
| 2.0x to 2.9x | 41 (16.3%) | 87 (63.0%) |
| 3.0x to 3.9x | 5 (2.0%) | 26 (18.8%) |
| 4.0x or more | 64 (25.5%) | 20 (14.5%) |
| Total | 251 (100.0%) | 138 (100.0%) |
Real Estate Taxes by Mortgage Status in Beaver
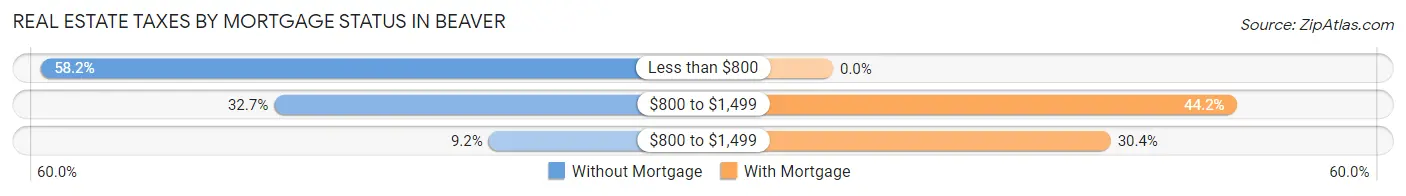
| Property Taxes | Without Mortgage | With Mortgage |
| Less than $800 | 146 (58.2%) | 0 (0.0%) |
| $800 to $1,499 | 82 (32.7%) | 61 (44.2%) |
| $800 to $1,499 | 23 (9.2%) | 42 (30.4%) |
| Total | 251 (100.0%) | 138 (100.0%) |
Health & Disability in Beaver
Health Insurance Coverage by Age in Beaver
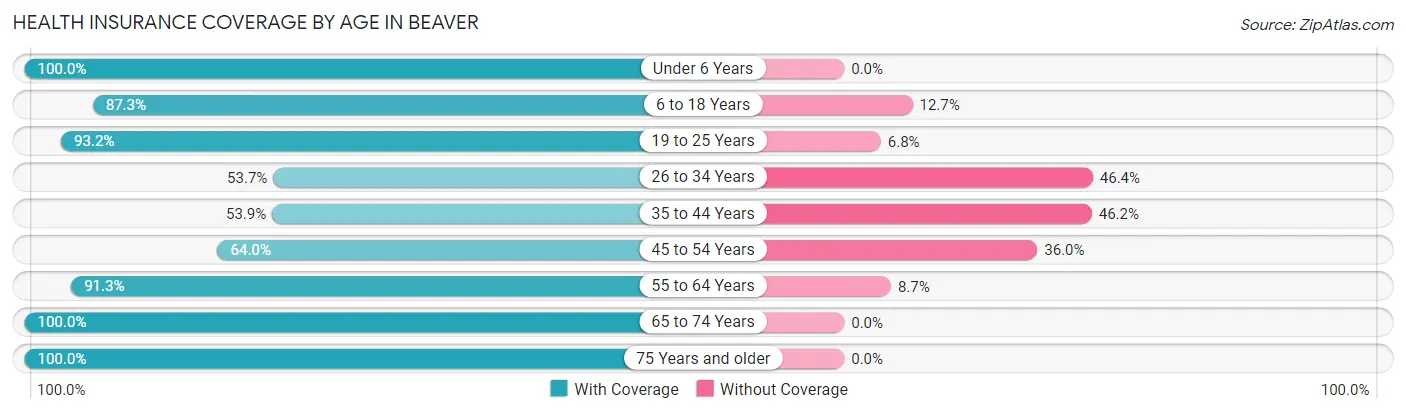
| Age Bracket | With Coverage | Without Coverage |
| Under 6 Years | 112 (100.0%) | 0 (0.0%) |
| 6 to 18 Years | 295 (87.3%) | 43 (12.7%) |
| 19 to 25 Years | 82 (93.2%) | 6 (6.8%) |
| 26 to 34 Years | 103 (53.6%) | 89 (46.4%) |
| 35 to 44 Years | 84 (53.8%) | 72 (46.2%) |
| 45 to 54 Years | 112 (64.0%) | 63 (36.0%) |
| 55 to 64 Years | 168 (91.3%) | 16 (8.7%) |
| 65 to 74 Years | 124 (100.0%) | 0 (0.0%) |
| 75 Years and older | 62 (100.0%) | 0 (0.0%) |
| Total | 1,142 (79.8%) | 289 (20.2%) |
Health Insurance Coverage by Citizenship Status in Beaver
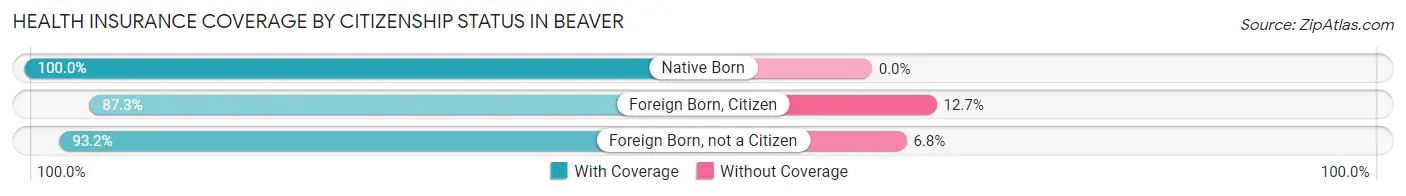
| Citizenship Status | With Coverage | Without Coverage |
| Native Born | 112 (100.0%) | 0 (0.0%) |
| Foreign Born, Citizen | 295 (87.3%) | 43 (12.7%) |
| Foreign Born, not a Citizen | 82 (93.2%) | 6 (6.8%) |
Health Insurance Coverage by Household Income in Beaver
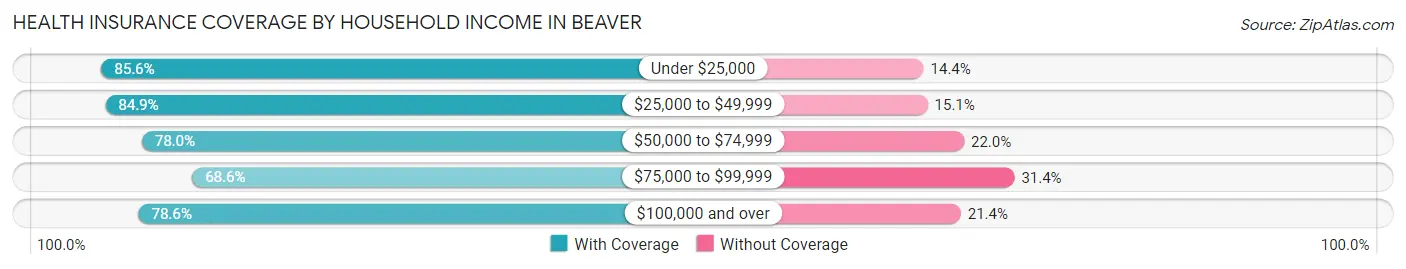
| Household Income | With Coverage | Without Coverage |
| Under $25,000 | 119 (85.6%) | 20 (14.4%) |
| $25,000 to $49,999 | 342 (84.9%) | 61 (15.1%) |
| $50,000 to $74,999 | 309 (78.0%) | 87 (22.0%) |
| $75,000 to $99,999 | 107 (68.6%) | 49 (31.4%) |
| $100,000 and over | 265 (78.6%) | 72 (21.4%) |
Public vs Private Health Insurance Coverage by Age in Beaver
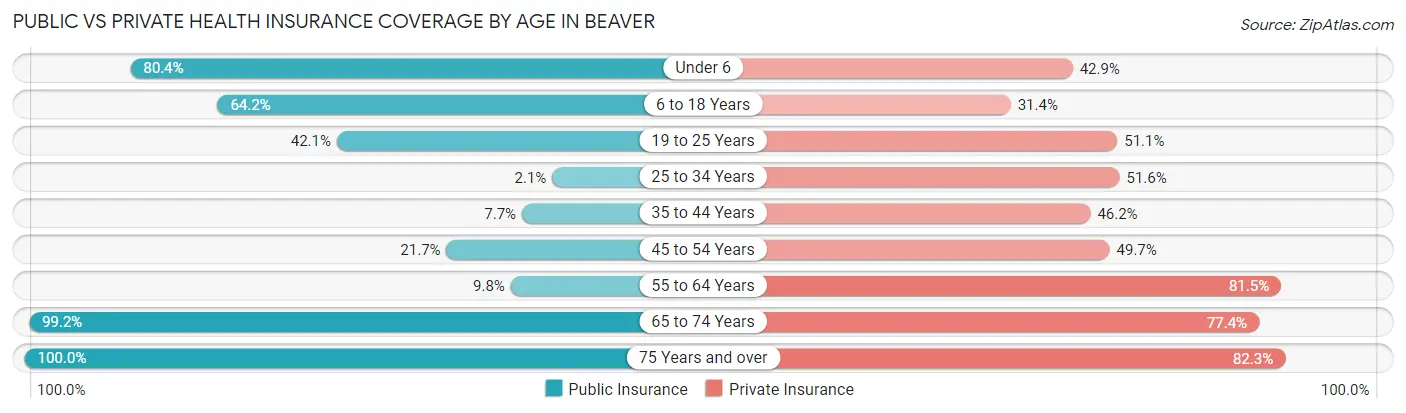
| Age Bracket | Public Insurance | Private Insurance |
| Under 6 | 90 (80.4%) | 48 (42.9%) |
| 6 to 18 Years | 217 (64.2%) | 106 (31.4%) |
| 19 to 25 Years | 37 (42.0%) | 45 (51.1%) |
| 25 to 34 Years | 4 (2.1%) | 99 (51.6%) |
| 35 to 44 Years | 12 (7.7%) | 72 (46.2%) |
| 45 to 54 Years | 38 (21.7%) | 87 (49.7%) |
| 55 to 64 Years | 18 (9.8%) | 150 (81.5%) |
| 65 to 74 Years | 123 (99.2%) | 96 (77.4%) |
| 75 Years and over | 62 (100.0%) | 51 (82.3%) |
| Total | 601 (42.0%) | 754 (52.7%) |
Disability Status by Sex by Age in Beaver
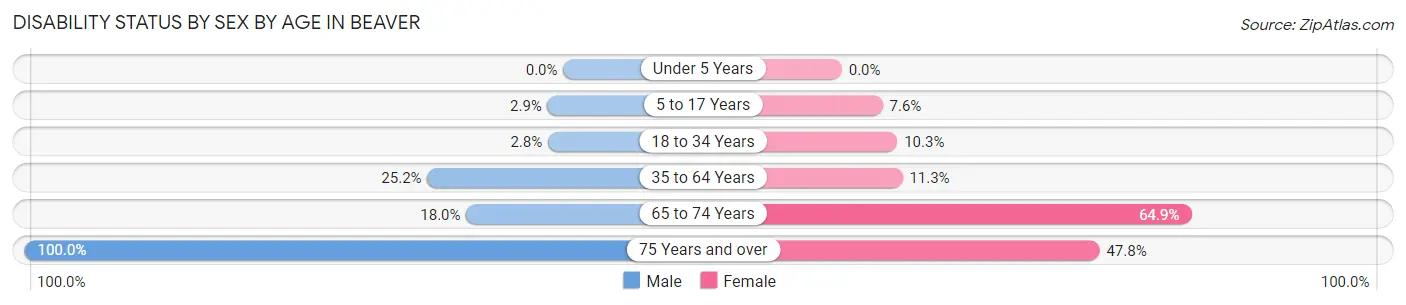
| Age Bracket | Male | Female |
| Under 5 Years | 0 (0.0%) | 0 (0.0%) |
| 5 to 17 Years | 6 (2.9%) | 10 (7.6%) |
| 18 to 34 Years | 5 (2.8%) | 14 (10.3%) |
| 35 to 64 Years | 56 (25.2%) | 33 (11.3%) |
| 65 to 74 Years | 9 (18.0%) | 48 (64.9%) |
| 75 Years and over | 16 (100.0%) | 22 (47.8%) |
Disability Class by Sex by Age in Beaver
Disability Class: Hearing Difficulty
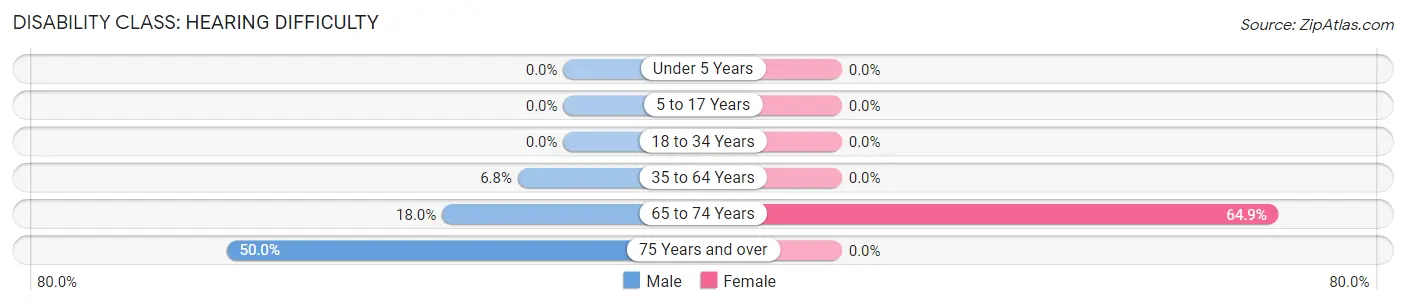
| Age Bracket | Male | Female |
| Under 5 Years | 0 (0.0%) | 0 (0.0%) |
| 5 to 17 Years | 0 (0.0%) | 0 (0.0%) |
| 18 to 34 Years | 0 (0.0%) | 0 (0.0%) |
| 35 to 64 Years | 15 (6.8%) | 0 (0.0%) |
| 65 to 74 Years | 9 (18.0%) | 48 (64.9%) |
| 75 Years and over | 8 (50.0%) | 0 (0.0%) |
Disability Class: Vision Difficulty
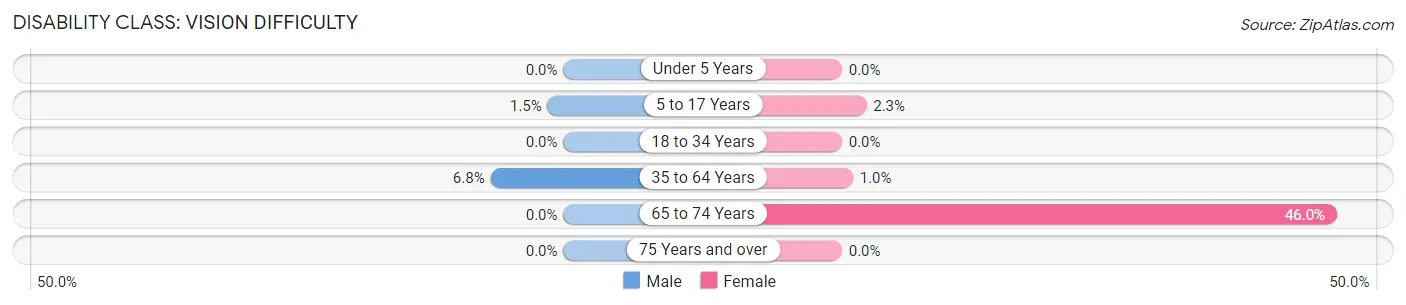
| Age Bracket | Male | Female |
| Under 5 Years | 0 (0.0%) | 0 (0.0%) |
| 5 to 17 Years | 3 (1.5%) | 3 (2.3%) |
| 18 to 34 Years | 0 (0.0%) | 0 (0.0%) |
| 35 to 64 Years | 15 (6.8%) | 3 (1.0%) |
| 65 to 74 Years | 0 (0.0%) | 34 (46.0%) |
| 75 Years and over | 0 (0.0%) | 0 (0.0%) |
Disability Class: Cognitive Difficulty
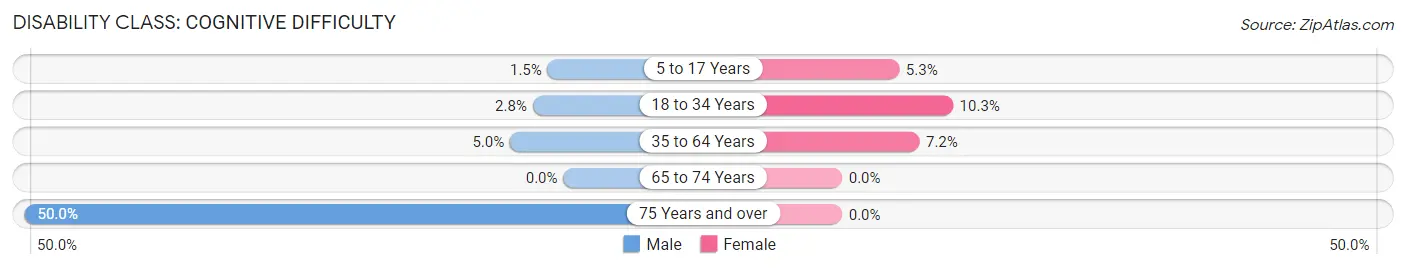
| Age Bracket | Male | Female |
| 5 to 17 Years | 3 (1.5%) | 7 (5.3%) |
| 18 to 34 Years | 5 (2.8%) | 14 (10.3%) |
| 35 to 64 Years | 11 (5.0%) | 21 (7.2%) |
| 65 to 74 Years | 0 (0.0%) | 0 (0.0%) |
| 75 Years and over | 8 (50.0%) | 0 (0.0%) |
Disability Class: Ambulatory Difficulty
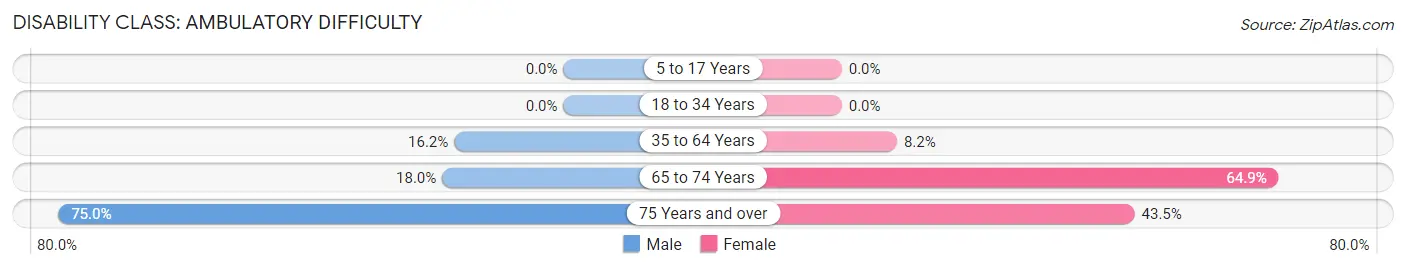
| Age Bracket | Male | Female |
| 5 to 17 Years | 0 (0.0%) | 0 (0.0%) |
| 18 to 34 Years | 0 (0.0%) | 0 (0.0%) |
| 35 to 64 Years | 36 (16.2%) | 24 (8.2%) |
| 65 to 74 Years | 9 (18.0%) | 48 (64.9%) |
| 75 Years and over | 12 (75.0%) | 20 (43.5%) |
Disability Class: Self-Care Difficulty
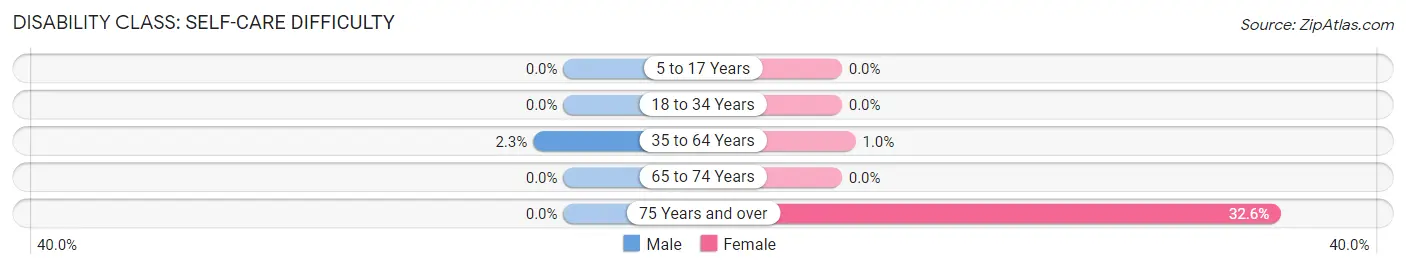
| Age Bracket | Male | Female |
| 5 to 17 Years | 0 (0.0%) | 0 (0.0%) |
| 18 to 34 Years | 0 (0.0%) | 0 (0.0%) |
| 35 to 64 Years | 5 (2.2%) | 3 (1.0%) |
| 65 to 74 Years | 0 (0.0%) | 0 (0.0%) |
| 75 Years and over | 0 (0.0%) | 15 (32.6%) |
Technology Access in Beaver
Computing Device Access in Beaver
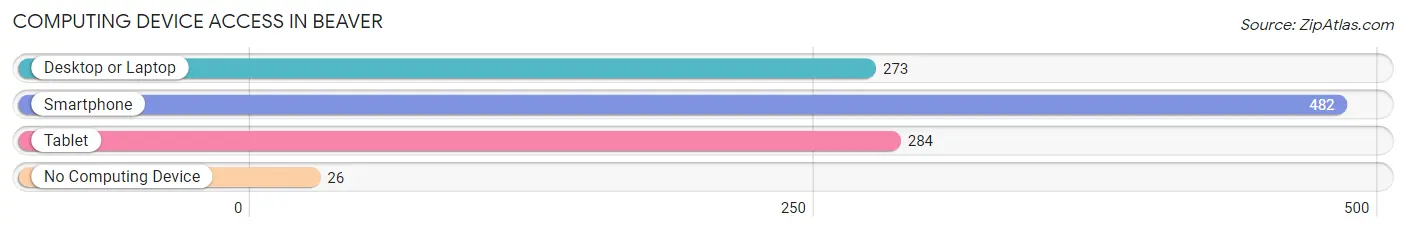
| Device Type | # Households | % Households |
| Desktop or Laptop | 273 | 51.9% |
| Smartphone | 482 | 91.6% |
| Tablet | 284 | 54.0% |
| No Computing Device | 26 | 4.9% |
| Total | 526 | 100.0% |
Internet Access in Beaver
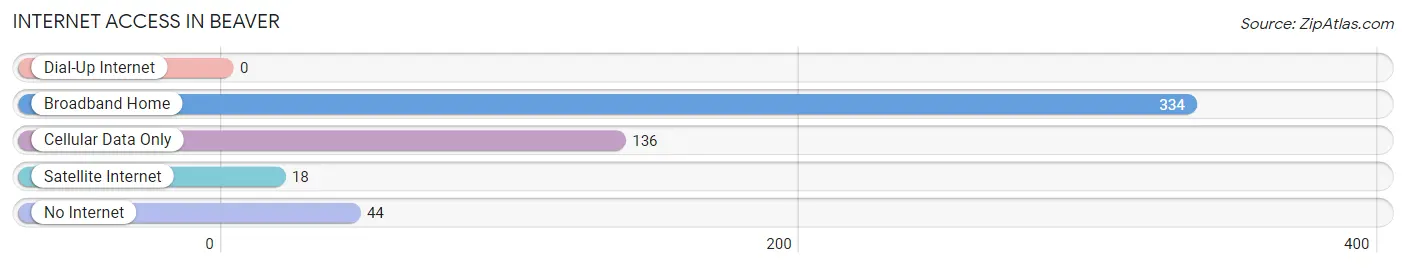
| Internet Type | # Households | % Households |
| Dial-Up Internet | 0 | 0.0% |
| Broadband Home | 334 | 63.5% |
| Cellular Data Only | 136 | 25.9% |
| Satellite Internet | 18 | 3.4% |
| No Internet | 44 | 8.4% |
| Total | 526 | 100.0% |
Beaver Summary
Beaver, Oklahoma is a small town located in the Oklahoma Panhandle, in the northwest corner of the state. It is the county seat of Beaver County, and is situated along the Beaver River. The town has a population of approximately 2,000 people, and is the largest town in the county.
Geography
Beaver is located in the Oklahoma Panhandle, in the northwest corner of the state. It is situated along the Beaver River, and is surrounded by rolling hills and prairies. The town is located at an elevation of 2,845 feet, and has a total area of 1.3 square miles. The climate is semi-arid, with hot summers and cold winters.
Economy
Beaver’s economy is largely based on agriculture and ranching. The town is home to several large farms and ranches, and is a major producer of wheat, corn, and other grains. The town also has a small manufacturing sector, with several small businesses producing a variety of products.
Demographics
As of the 2010 census, Beaver had a population of 2,000 people. The racial makeup of the town was 95.2% White, 0.7% African American, 0.7% Native American, 0.3% Asian, 0.1% Pacific Islander, and 2.1% from two or more races. The median household income was $30,000, and the median family income was $35,000.
History
Beaver was founded in 1887, when the town was established as the county seat of Beaver County. The town was named after the nearby Beaver River, and was originally a small farming and ranching community. In the early 1900s, the town began to grow, and by the 1920s it had become a major center for agriculture and ranching in the region.
In the 1950s, Beaver began to experience a period of growth and development. The town was connected to the rest of the state by the construction of a highway, and several new businesses were established. The town also saw the construction of a new school, and the opening of a hospital.
In the late 20th century, Beaver continued to grow and develop. The town was connected to the rest of the state by the construction of a new highway, and several new businesses were established. The town also saw the construction of a new school, and the opening of a hospital.
Today, Beaver is a small town with a population of approximately 2,000 people. The town is still largely based on agriculture and ranching, and is a major producer of wheat, corn, and other grains. The town also has a small manufacturing sector, with several small businesses producing a variety of products.
Common Questions
What is Per Capita Income in Beaver?
Per Capita income in Beaver is $25,628.
What is the Median Family Income in Beaver?
Median Family Income in Beaver is $59,821.
What is the Median Household income in Beaver?
Median Household Income in Beaver is $53,600.
What is Income or Wage Gap in Beaver?
Income or Wage Gap in Beaver is 46.0%.
Women in Beaver earn 54.0 cents for every dollar earned by a man.
What is Inequality or Gini Index in Beaver?
Inequality or Gini Index in Beaver is 0.37.
What is the Total Population of Beaver?
Total Population of Beaver is 1,524.
What is the Total Male Population of Beaver?
Total Male Population of Beaver is 770.
What is the Total Female Population of Beaver?
Total Female Population of Beaver is 754.
What is the Ratio of Males per 100 Females in Beaver?
There are 102.12 Males per 100 Females in Beaver.
What is the Ratio of Females per 100 Males in Beaver?
There are 97.92 Females per 100 Males in Beaver.
What is the Median Population Age in Beaver?
Median Population Age in Beaver is 33.9 Years.
What is the Average Family Size in Beaver
Average Family Size in Beaver is 3.3 People.
What is the Average Household Size in Beaver
Average Household Size in Beaver is 2.7 People.
How Large is the Labor Force in Beaver?
There are 716 People in the Labor Forcein in Beaver.
What is the Percentage of People in the Labor Force in Beaver?
61.9% of People are in the Labor Force in Beaver.
What is the Unemployment Rate in Beaver?
Unemployment Rate in Beaver is 2.9%.