Arkoma, OK Map & Demographics
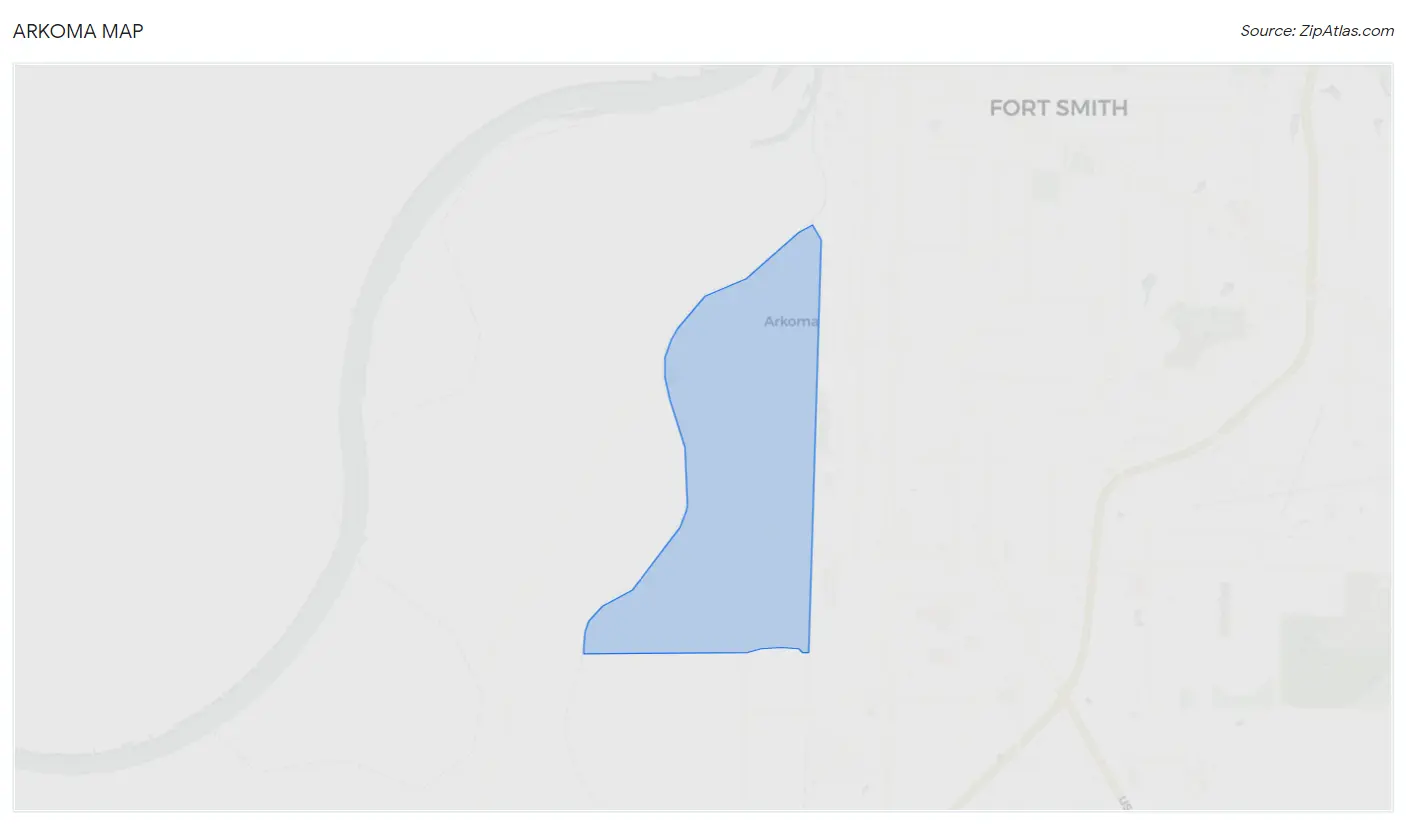
Arkoma Map
Arkoma Overview
$20,024
PER CAPITA INCOME
$43,500
AVG FAMILY INCOME
$33,500
AVG HOUSEHOLD INCOME
39.7%
WAGE / INCOME GAP [ % ]
60.3¢/ $1
WAGE / INCOME GAP [ $ ]
0.47
INEQUALITY / GINI INDEX
1,866
TOTAL POPULATION
901
MALE POPULATION
965
FEMALE POPULATION
93.37
MALES / 100 FEMALES
107.10
FEMALES / 100 MALES
35.3
MEDIAN AGE
3.4
AVG FAMILY SIZE
2.6
AVG HOUSEHOLD SIZE
751
LABOR FORCE [ PEOPLE ]
52.3%
PERCENT IN LABOR FORCE
10.5%
UNEMPLOYMENT RATE
Arkoma Zip Codes
Arkoma Area Codes
Income in Arkoma
Income Overview in Arkoma
Per Capita Income in Arkoma is $20,024, while median incomes of families and households are $43,500 and $33,500 respectively.
| Characteristic | Number | Measure |
| Per Capita Income | 1,866 | $20,024 |
| Median Family Income | 428 | $43,500 |
| Mean Family Income | 428 | $53,964 |
| Median Household Income | 714 | $33,500 |
| Mean Household Income | 714 | $48,997 |
| Income Deficit | 428 | $0 |
| Wage / Income Gap (%) | 1,866 | 39.67% |
| Wage / Income Gap ($) | 1,866 | 60.33¢ per $1 |
| Gini / Inequality Index | 1,866 | 0.47 |
Earnings by Sex in Arkoma
Average Earnings in Arkoma are $25,676, $29,155 for men and $17,589 for women, a difference of 39.7%.
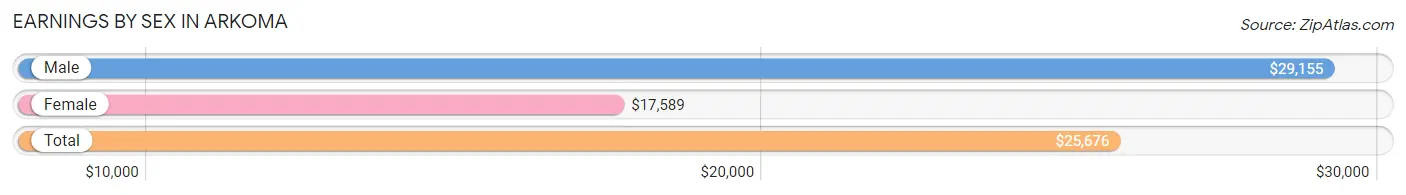
| Sex | Number | Average Earnings |
| Male | 381 (50.4%) | $29,155 |
| Female | 375 (49.6%) | $17,589 |
| Total | 756 (100.0%) | $25,676 |
Earnings by Sex by Income Bracket in Arkoma
The most common earnings brackets in Arkoma are $25,000 to $29,999 for men (54 | 14.2%) and $5,000 to $7,499 for women (70 | 18.7%).
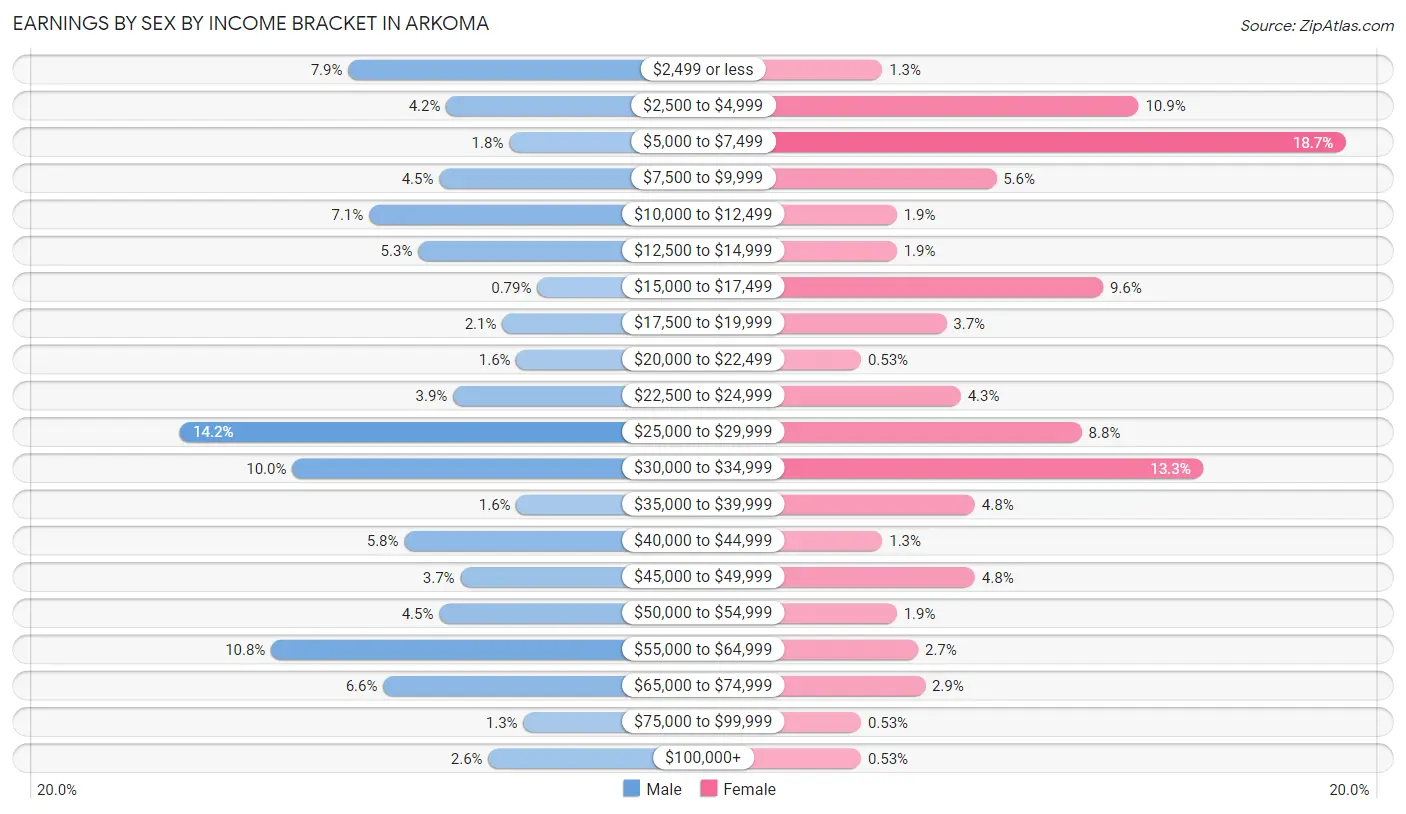
| Income | Male | Female |
| $2,499 or less | 30 (7.9%) | 5 (1.3%) |
| $2,500 to $4,999 | 16 (4.2%) | 41 (10.9%) |
| $5,000 to $7,499 | 7 (1.8%) | 70 (18.7%) |
| $7,500 to $9,999 | 17 (4.5%) | 21 (5.6%) |
| $10,000 to $12,499 | 27 (7.1%) | 7 (1.9%) |
| $12,500 to $14,999 | 20 (5.2%) | 7 (1.9%) |
| $15,000 to $17,499 | 3 (0.8%) | 36 (9.6%) |
| $17,500 to $19,999 | 8 (2.1%) | 14 (3.7%) |
| $20,000 to $22,499 | 6 (1.6%) | 2 (0.5%) |
| $22,500 to $24,999 | 15 (3.9%) | 16 (4.3%) |
| $25,000 to $29,999 | 54 (14.2%) | 33 (8.8%) |
| $30,000 to $34,999 | 38 (10.0%) | 50 (13.3%) |
| $35,000 to $39,999 | 6 (1.6%) | 18 (4.8%) |
| $40,000 to $44,999 | 22 (5.8%) | 5 (1.3%) |
| $45,000 to $49,999 | 14 (3.7%) | 18 (4.8%) |
| $50,000 to $54,999 | 17 (4.5%) | 7 (1.9%) |
| $55,000 to $64,999 | 41 (10.8%) | 10 (2.7%) |
| $65,000 to $74,999 | 25 (6.6%) | 11 (2.9%) |
| $75,000 to $99,999 | 5 (1.3%) | 2 (0.5%) |
| $100,000+ | 10 (2.6%) | 2 (0.5%) |
| Total | 381 (100.0%) | 375 (100.0%) |
Earnings by Sex by Educational Attainment in Arkoma
Average earnings in Arkoma are $32,727 for men and $19,107 for women, a difference of 41.6%. Men with an educational attainment of graduate degree enjoy the highest average annual earnings of $65,833, while those with high school diploma education earn the least with $28,007. Women with an educational attainment of graduate degree earn the most with the average annual earnings of $62,500, while those with less than high school education have the smallest earnings of $11,250.
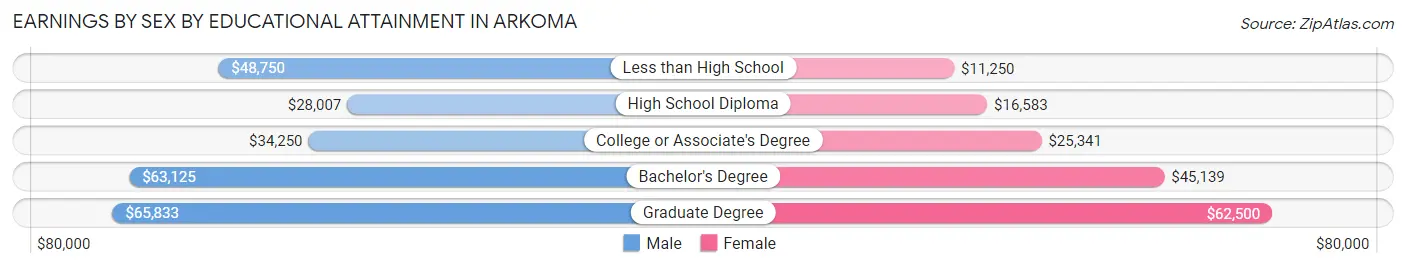
| Educational Attainment | Male Income | Female Income |
| Less than High School | $48,750 | $11,250 |
| High School Diploma | $28,007 | $16,583 |
| College or Associate's Degree | $34,250 | $25,341 |
| Bachelor's Degree | $63,125 | $45,139 |
| Graduate Degree | $65,833 | $62,500 |
| Total | $32,727 | $19,107 |
Family Income in Arkoma
Family Income Brackets in Arkoma
According to the Arkoma family income data, there are 73 families falling into the $35,000 to $49,999 income range, which is the most common income bracket and makes up 17.1% of all families. Conversely, the $150,000 to $199,999 income bracket is the least frequent group with only 3 families (0.7%) belonging to this category.
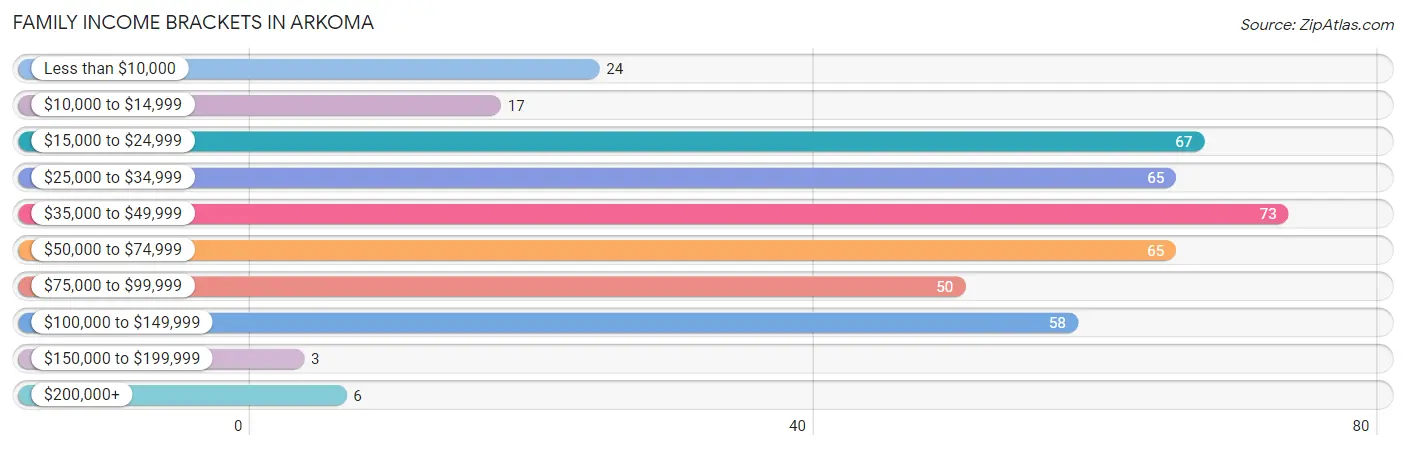
| Income Bracket | # Families | % Families |
| Less than $10,000 | 24 | 5.6% |
| $10,000 to $14,999 | 17 | 4.0% |
| $15,000 to $24,999 | 67 | 15.7% |
| $25,000 to $34,999 | 65 | 15.2% |
| $35,000 to $49,999 | 73 | 17.1% |
| $50,000 to $74,999 | 65 | 15.2% |
| $75,000 to $99,999 | 50 | 11.7% |
| $100,000 to $149,999 | 58 | 13.6% |
| $150,000 to $199,999 | 3 | 0.7% |
| $200,000+ | 6 | 1.4% |
Family Income by Famaliy Size in Arkoma
6-person families (14 | 3.3%) account for the highest median family income in Arkoma with $46,250 per family, while 2-person families (231 | 54.0%) have the highest median income of $21,958 per family member.
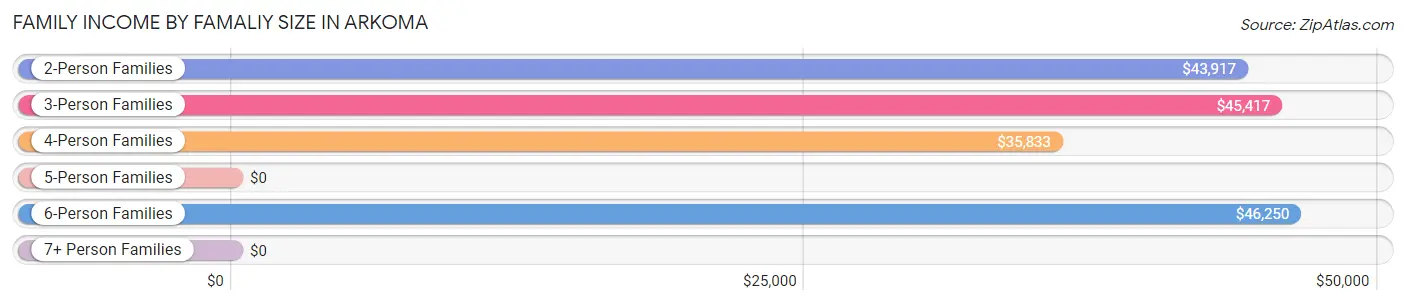
| Income Bracket | # Families | Median Income |
| 2-Person Families | 231 (54.0%) | $43,917 |
| 3-Person Families | 68 (15.9%) | $45,417 |
| 4-Person Families | 78 (18.2%) | $35,833 |
| 5-Person Families | 30 (7.0%) | $0 |
| 6-Person Families | 14 (3.3%) | $46,250 |
| 7+ Person Families | 7 (1.6%) | $0 |
| Total | 428 (100.0%) | $43,500 |
Family Income by Number of Earners in Arkoma
The median family income in Arkoma is $43,500, with families comprising 3+ earners (33) having the highest median family income of $92,750, while families with no earners (129) have the lowest median family income of $30,781, accounting for 7.7% and 30.1% of families, respectively.
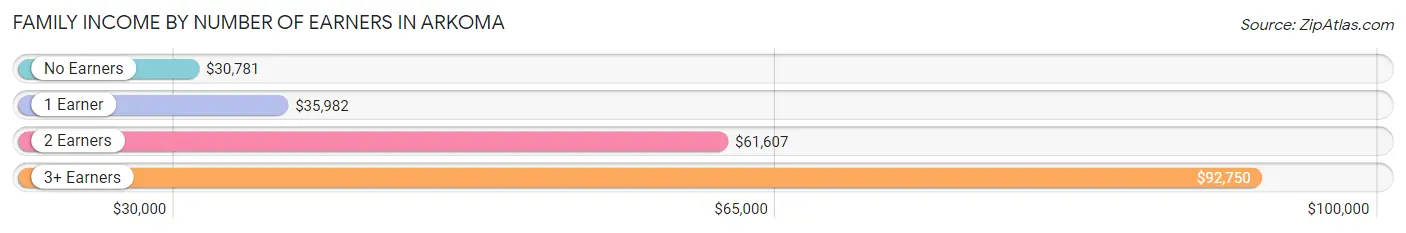
| Number of Earners | # Families | Median Income |
| No Earners | 129 (30.1%) | $30,781 |
| 1 Earner | 187 (43.7%) | $35,982 |
| 2 Earners | 79 (18.5%) | $61,607 |
| 3+ Earners | 33 (7.7%) | $92,750 |
| Total | 428 (100.0%) | $43,500 |
Household Income in Arkoma
Household Income Brackets in Arkoma
With 132 households falling in the category, the $50,000 to $74,999 income range is the most frequent in Arkoma, accounting for 18.5% of all households. In contrast, only 3 households (0.4%) fall into the $150,000 to $199,999 income bracket, making it the least populous group.
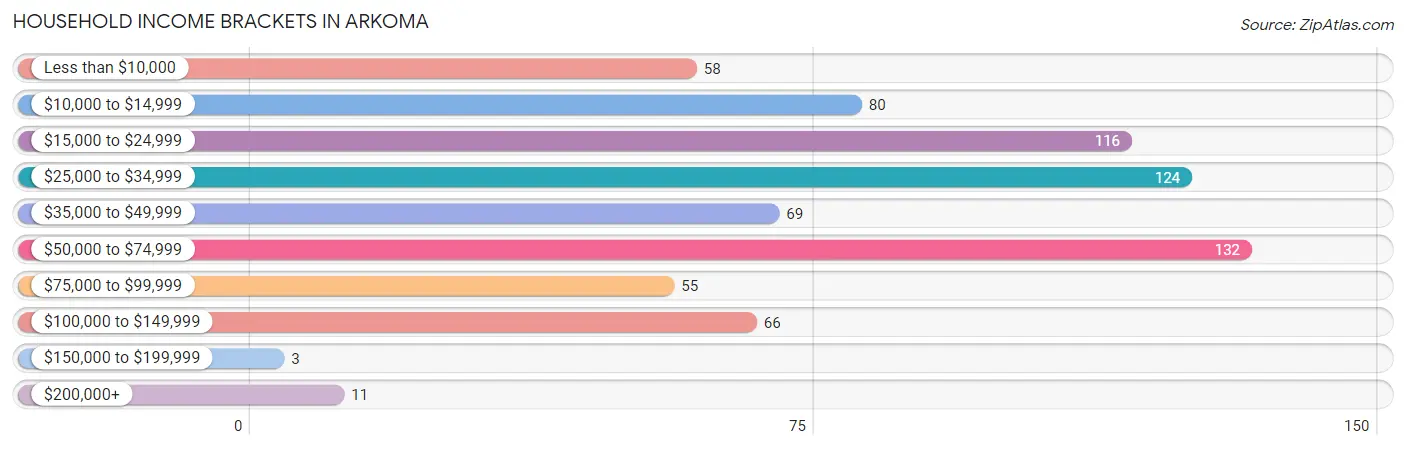
| Income Bracket | # Households | % Households |
| Less than $10,000 | 58 | 8.1% |
| $10,000 to $14,999 | 80 | 11.2% |
| $15,000 to $24,999 | 116 | 16.2% |
| $25,000 to $34,999 | 124 | 17.4% |
| $35,000 to $49,999 | 69 | 9.7% |
| $50,000 to $74,999 | 132 | 18.5% |
| $75,000 to $99,999 | 55 | 7.7% |
| $100,000 to $149,999 | 66 | 9.2% |
| $150,000 to $199,999 | 3 | 0.4% |
| $200,000+ | 11 | 1.5% |
Household Income by Householder Age in Arkoma
The median household income in Arkoma is $33,500, with the highest median household income of $37,188 found in the 65+ years age bracket for the primary householder. A total of 218 households (30.5%) fall into this category. Meanwhile, the 15 to 24 years age bracket for the primary householder has the lowest median household income of $10,781, with 35 households (4.9%) in this group.
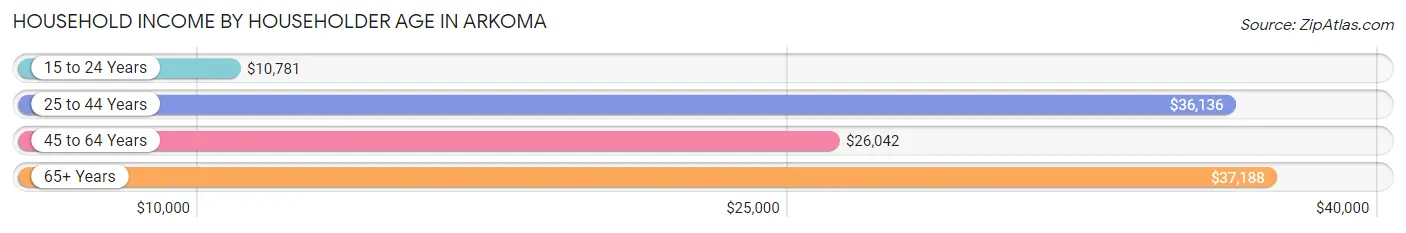
| Income Bracket | # Households | Median Income |
| 15 to 24 Years | 35 (4.9%) | $10,781 |
| 25 to 44 Years | 206 (28.8%) | $36,136 |
| 45 to 64 Years | 255 (35.7%) | $26,042 |
| 65+ Years | 218 (30.5%) | $37,188 |
| Total | 714 (100.0%) | $33,500 |
Poverty in Arkoma
Income Below Poverty by Sex and Age in Arkoma
With 26.8% poverty level for males and 27.7% for females among the residents of Arkoma, 16 and 17 year old males and 18 to 24 year old females are the most vulnerable to poverty, with 9 males (75.0%) and 26 females (63.4%) in their respective age groups living below the poverty level.
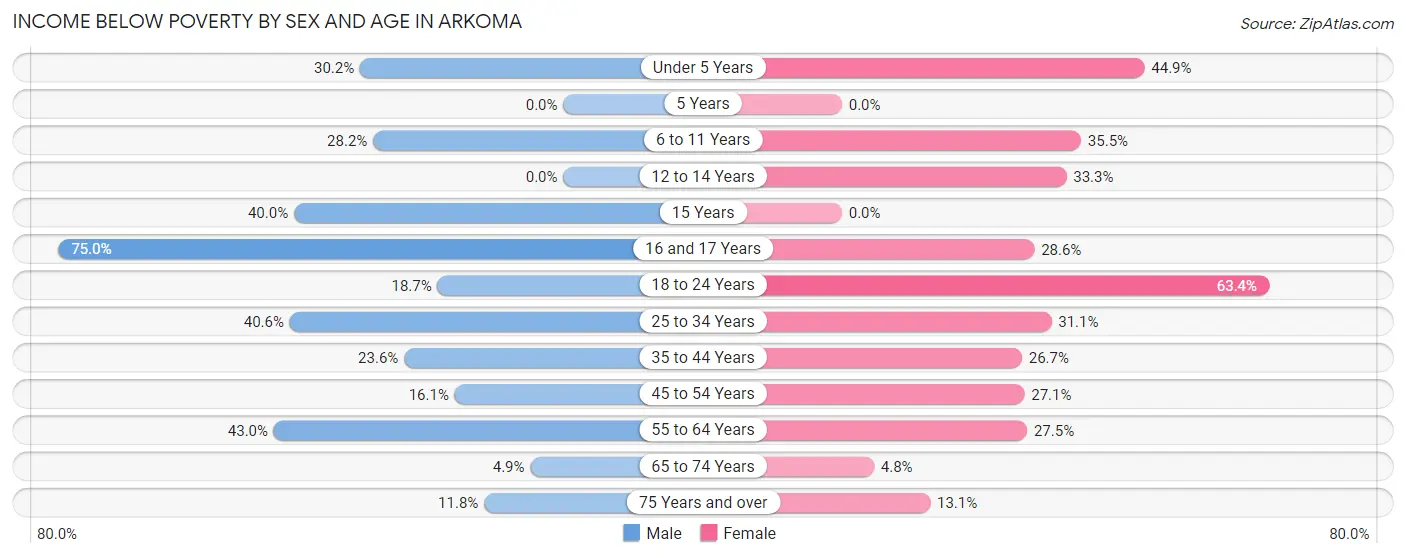
| Age Bracket | Male | Female |
| Under 5 Years | 16 (30.2%) | 31 (44.9%) |
| 5 Years | 0 (0.0%) | 0 (0.0%) |
| 6 to 11 Years | 24 (28.2%) | 38 (35.5%) |
| 12 to 14 Years | 0 (0.0%) | 14 (33.3%) |
| 15 Years | 4 (40.0%) | 0 (0.0%) |
| 16 and 17 Years | 9 (75.0%) | 4 (28.6%) |
| 18 to 24 Years | 17 (18.7%) | 26 (63.4%) |
| 25 to 34 Years | 78 (40.6%) | 42 (31.1%) |
| 35 to 44 Years | 26 (23.6%) | 27 (26.7%) |
| 45 to 54 Years | 10 (16.1%) | 29 (27.1%) |
| 55 to 64 Years | 46 (43.0%) | 33 (27.5%) |
| 65 to 74 Years | 5 (4.9%) | 4 (4.8%) |
| 75 Years and over | 4 (11.8%) | 11 (13.1%) |
| Total | 239 (26.8%) | 259 (27.7%) |
Income Above Poverty by Sex and Age in Arkoma
According to the poverty statistics in Arkoma, males aged 5 years and females aged 15 years are the age groups that are most secure financially, with 100.0% of males and 100.0% of females in these age groups living above the poverty line.
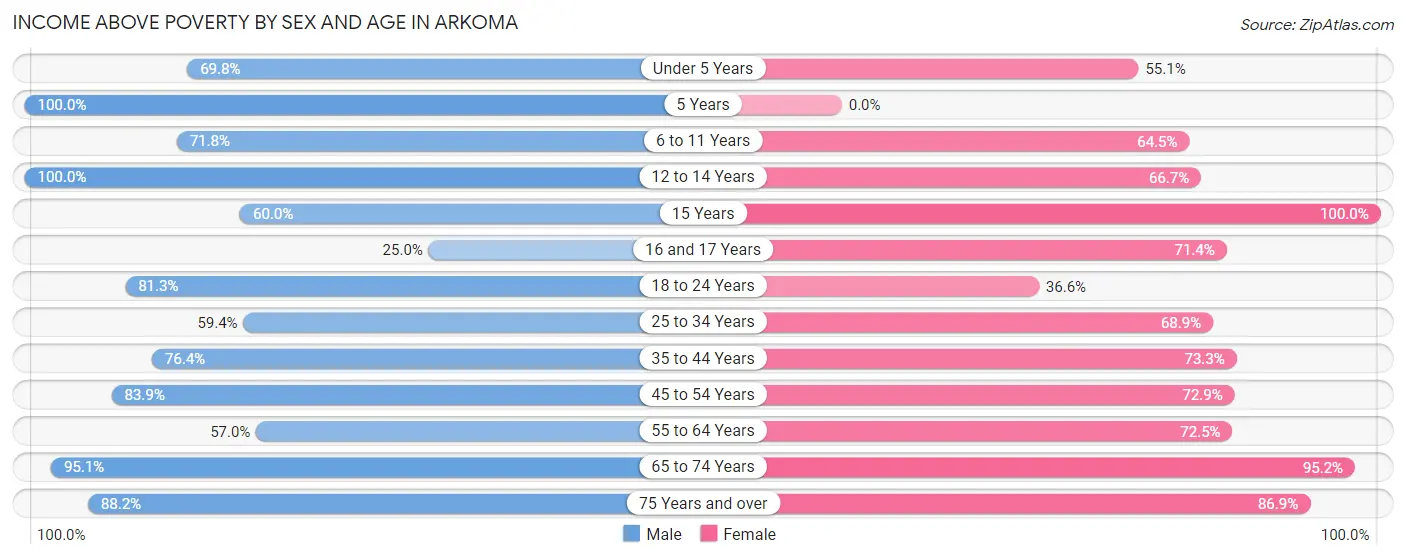
| Age Bracket | Male | Female |
| Under 5 Years | 37 (69.8%) | 38 (55.1%) |
| 5 Years | 5 (100.0%) | 0 (0.0%) |
| 6 to 11 Years | 61 (71.8%) | 69 (64.5%) |
| 12 to 14 Years | 29 (100.0%) | 28 (66.7%) |
| 15 Years | 6 (60.0%) | 31 (100.0%) |
| 16 and 17 Years | 3 (25.0%) | 10 (71.4%) |
| 18 to 24 Years | 74 (81.3%) | 15 (36.6%) |
| 25 to 34 Years | 114 (59.4%) | 93 (68.9%) |
| 35 to 44 Years | 84 (76.4%) | 74 (73.3%) |
| 45 to 54 Years | 52 (83.9%) | 78 (72.9%) |
| 55 to 64 Years | 61 (57.0%) | 87 (72.5%) |
| 65 to 74 Years | 97 (95.1%) | 80 (95.2%) |
| 75 Years and over | 30 (88.2%) | 73 (86.9%) |
| Total | 653 (73.2%) | 676 (72.3%) |
Income Below Poverty Among Married-Couple Families in Arkoma
The poverty statistics for married-couple families in Arkoma show that 12.9% or 29 of the total 225 families live below the poverty line. Families with 1 or 2 children have the highest poverty rate of 27.9%, comprising of 17 families. On the other hand, families with no children have the lowest poverty rate of 4.3%, which includes 6 families.
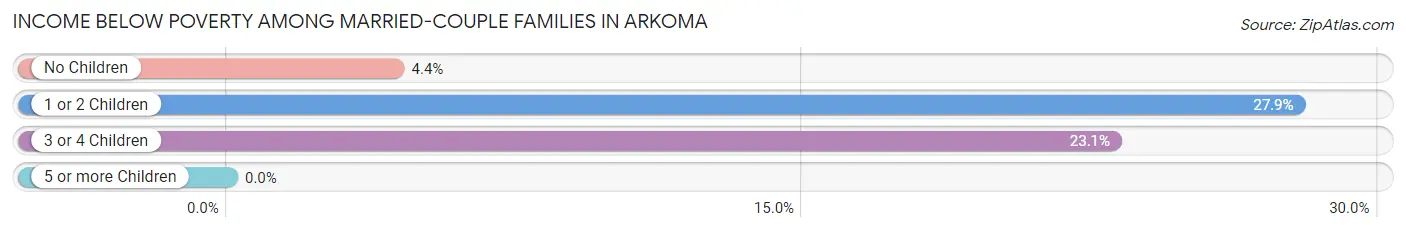
| Children | Above Poverty | Below Poverty |
| No Children | 132 (95.7%) | 6 (4.3%) |
| 1 or 2 Children | 44 (72.1%) | 17 (27.9%) |
| 3 or 4 Children | 20 (76.9%) | 6 (23.1%) |
| 5 or more Children | 0 (0.0%) | 0 (0.0%) |
| Total | 196 (87.1%) | 29 (12.9%) |
Income Below Poverty Among Single-Parent Households in Arkoma
According to the poverty data in Arkoma, 8.5% or 4 single-father households and 38.5% or 60 single-mother households are living below the poverty line. Among single-father households, those with no children have the highest poverty rate, with 4 households (12.9%) experiencing poverty. Likewise, among single-mother households, those with 1 or 2 children have the highest poverty rate, with 41 households (55.4%) falling below the poverty line.
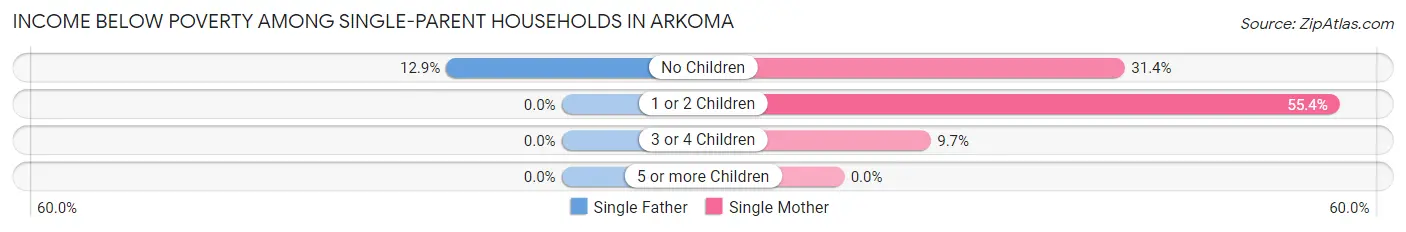
| Children | Single Father | Single Mother |
| No Children | 4 (12.9%) | 16 (31.4%) |
| 1 or 2 Children | 0 (0.0%) | 41 (55.4%) |
| 3 or 4 Children | 0 (0.0%) | 3 (9.7%) |
| 5 or more Children | 0 (0.0%) | 0 (0.0%) |
| Total | 4 (8.5%) | 60 (38.5%) |
Income Below Poverty Among Married-Couple vs Single-Parent Households in Arkoma
The poverty data for Arkoma shows that 29 of the married-couple family households (12.9%) and 64 of the single-parent households (31.5%) are living below the poverty level. Within the married-couple family households, those with 1 or 2 children have the highest poverty rate, with 17 households (27.9%) falling below the poverty line. Among the single-parent households, those with 1 or 2 children have the highest poverty rate, with 41 household (45.6%) living below poverty.
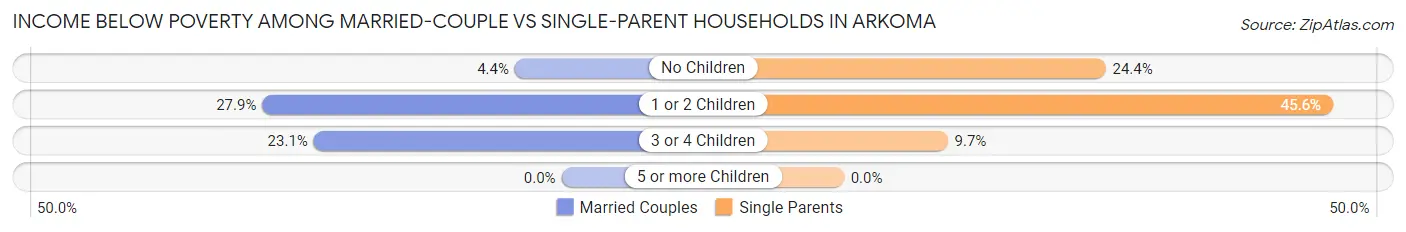
| Children | Married-Couple Families | Single-Parent Households |
| No Children | 6 (4.3%) | 20 (24.4%) |
| 1 or 2 Children | 17 (27.9%) | 41 (45.6%) |
| 3 or 4 Children | 6 (23.1%) | 3 (9.7%) |
| 5 or more Children | 0 (0.0%) | 0 (0.0%) |
| Total | 29 (12.9%) | 64 (31.5%) |
Race in Arkoma
The most populous races in Arkoma are White / Caucasian (1,522 | 81.6%), Two or more Races (177 | 9.5%), and Native / Alaskan (146 | 7.8%).
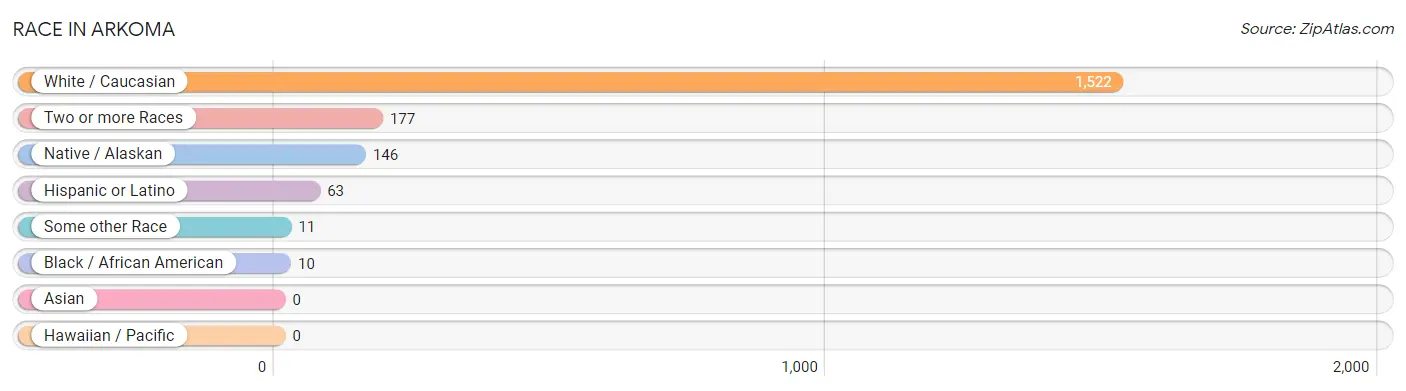
| Race | # Population | % Population |
| Asian | 0 | 0.0% |
| Black / African American | 10 | 0.5% |
| Hawaiian / Pacific | 0 | 0.0% |
| Hispanic or Latino | 63 | 3.4% |
| Native / Alaskan | 146 | 7.8% |
| White / Caucasian | 1,522 | 81.6% |
| Two or more Races | 177 | 9.5% |
| Some other Race | 11 | 0.6% |
| Total | 1,866 | 100.0% |
Ancestry in Arkoma
The most populous ancestries reported in Arkoma are Irish (333 | 17.8%), German (199 | 10.7%), Cherokee (133 | 7.1%), English (108 | 5.8%), and French (107 | 5.7%), together accounting for 47.2% of all Arkoma residents.
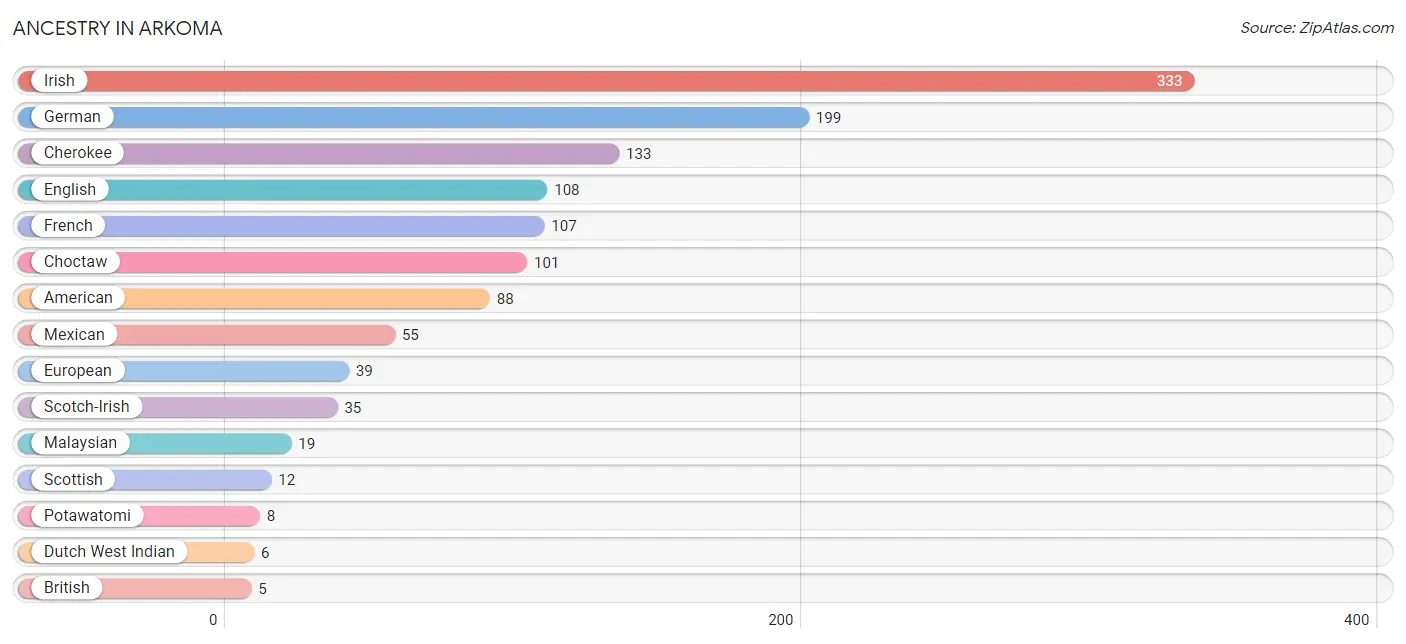
| Ancestry | # Population | % Population |
| American | 88 | 4.7% |
| Bhutanese | 4 | 0.2% |
| British | 5 | 0.3% |
| Central American | 5 | 0.3% |
| Cherokee | 133 | 7.1% |
| Choctaw | 101 | 5.4% |
| Dutch | 3 | 0.2% |
| Dutch West Indian | 6 | 0.3% |
| English | 108 | 5.8% |
| European | 39 | 2.1% |
| French | 107 | 5.7% |
| German | 199 | 10.7% |
| Guatemalan | 5 | 0.3% |
| Irish | 333 | 17.8% |
| Malaysian | 19 | 1.0% |
| Mexican | 55 | 2.9% |
| Potawatomi | 8 | 0.4% |
| Scandinavian | 4 | 0.2% |
| Scotch-Irish | 35 | 1.9% |
| Scottish | 12 | 0.6% |
| Sioux | 4 | 0.2% |
| Spanish | 3 | 0.2% |
| Swedish | 3 | 0.2% |
| Welsh | 2 | 0.1% | View All 24 Rows |
Immigrants in Arkoma
The most numerous immigrant groups reported in Arkoma came from Central America (12 | 0.6%), Latin America (12 | 0.6%), and Mexico (12 | 0.6%), together accounting for 1.9% of all Arkoma residents.
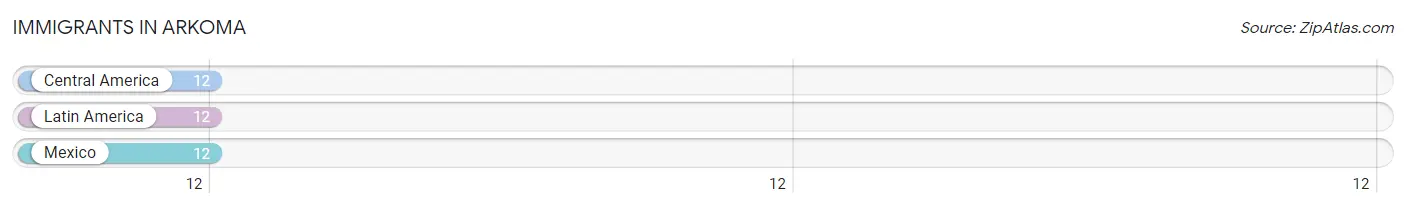
| Immigration Origin | # Population | % Population |
| Central America | 12 | 0.6% |
| Latin America | 12 | 0.6% |
| Mexico | 12 | 0.6% | View All 3 Rows |
Sex and Age in Arkoma
Sex and Age in Arkoma
The most populous age groups in Arkoma are 30 to 34 Years (131 | 14.5%) for men and 30 to 34 Years (87 | 9.0%) for women.
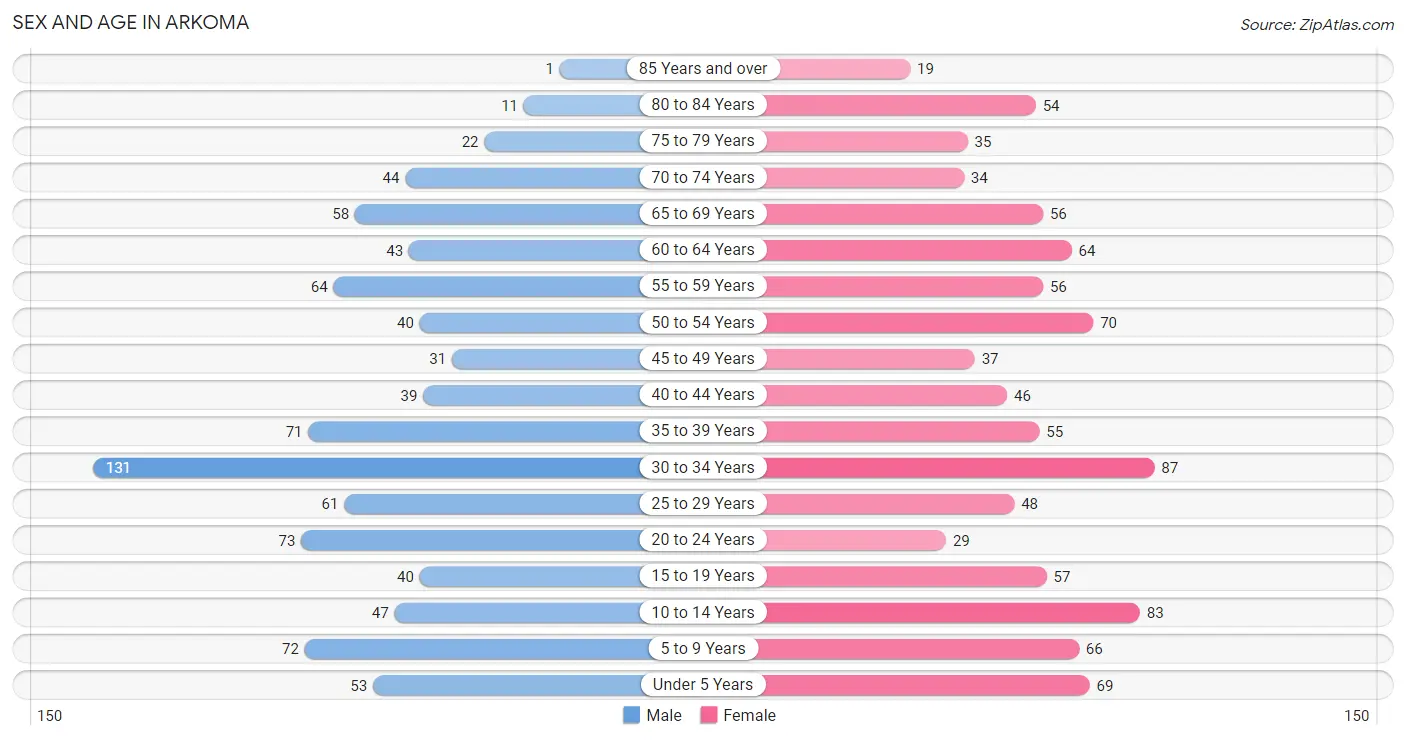
| Age Bracket | Male | Female |
| Under 5 Years | 53 (5.9%) | 69 (7.1%) |
| 5 to 9 Years | 72 (8.0%) | 66 (6.8%) |
| 10 to 14 Years | 47 (5.2%) | 83 (8.6%) |
| 15 to 19 Years | 40 (4.4%) | 57 (5.9%) |
| 20 to 24 Years | 73 (8.1%) | 29 (3.0%) |
| 25 to 29 Years | 61 (6.8%) | 48 (5.0%) |
| 30 to 34 Years | 131 (14.5%) | 87 (9.0%) |
| 35 to 39 Years | 71 (7.9%) | 55 (5.7%) |
| 40 to 44 Years | 39 (4.3%) | 46 (4.8%) |
| 45 to 49 Years | 31 (3.4%) | 37 (3.8%) |
| 50 to 54 Years | 40 (4.4%) | 70 (7.2%) |
| 55 to 59 Years | 64 (7.1%) | 56 (5.8%) |
| 60 to 64 Years | 43 (4.8%) | 64 (6.6%) |
| 65 to 69 Years | 58 (6.4%) | 56 (5.8%) |
| 70 to 74 Years | 44 (4.9%) | 34 (3.5%) |
| 75 to 79 Years | 22 (2.4%) | 35 (3.6%) |
| 80 to 84 Years | 11 (1.2%) | 54 (5.6%) |
| 85 Years and over | 1 (0.1%) | 19 (2.0%) |
| Total | 901 (100.0%) | 965 (100.0%) |
Families and Households in Arkoma
Median Family Size in Arkoma
The median family size in Arkoma is 3.35 persons per family, with married-couple families (225 | 52.6%) accounting for the largest median family size of 3.56 persons per family. On the other hand, single male/father families (47 | 11.0%) represent the smallest median family size with 2.79 persons per family.
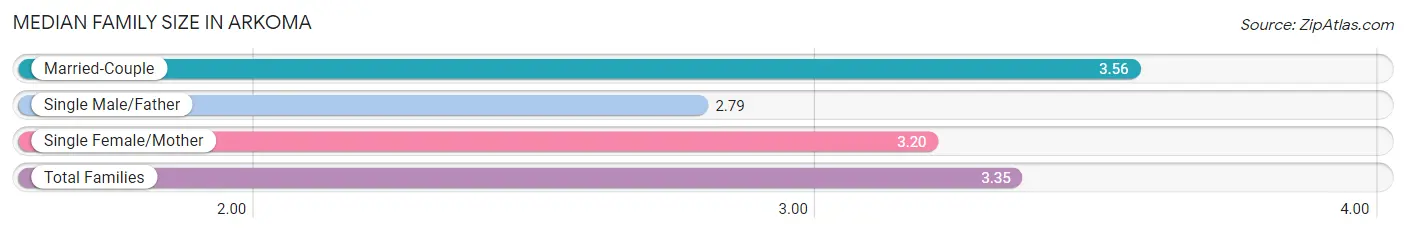
| Family Type | # Families | Family Size |
| Married-Couple | 225 (52.6%) | 3.56 |
| Single Male/Father | 47 (11.0%) | 2.79 |
| Single Female/Mother | 156 (36.4%) | 3.20 |
| Total Families | 428 (100.0%) | 3.35 |
Median Household Size in Arkoma
The median household size in Arkoma is 2.56 persons per household, with married-couple households (225 | 31.5%) accounting for the largest median household size of 3.56 persons per household. non-family households (286 | 40.1%) represent the smallest median household size with 1.20 persons per household.
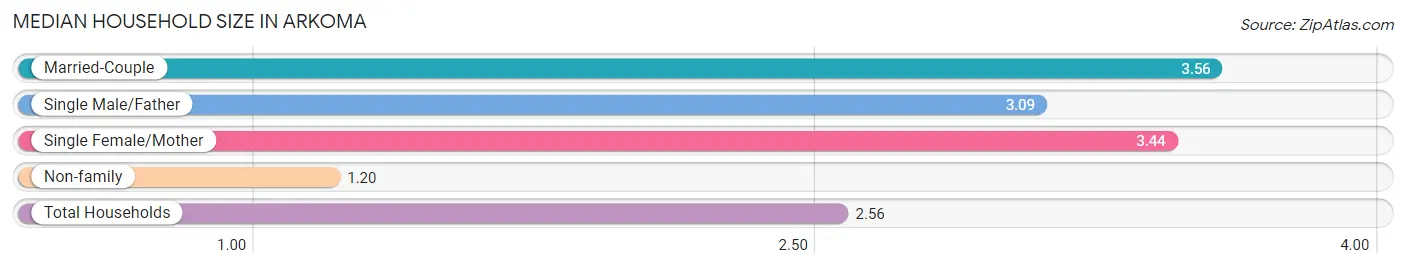
| Household Type | # Households | Household Size |
| Married-Couple | 225 (31.5%) | 3.56 |
| Single Male/Father | 47 (6.6%) | 3.09 |
| Single Female/Mother | 156 (21.8%) | 3.44 |
| Non-family | 286 (40.1%) | 1.20 |
| Total Households | 714 (100.0%) | 2.56 |
Household Size by Marriage Status in Arkoma
Out of a total of 714 households in Arkoma, 428 (59.9%) are family households, while 286 (40.1%) are nonfamily households. The most numerous type of family households are 2-person households, comprising 205, and the most common type of nonfamily households are 1-person households, comprising 257.
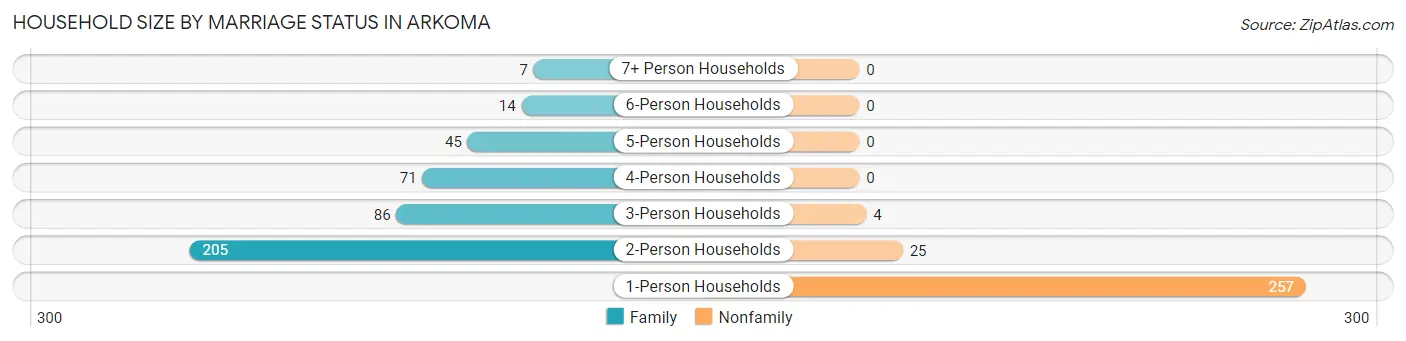
| Household Size | Family Households | Nonfamily Households |
| 1-Person Households | - | 257 (36.0%) |
| 2-Person Households | 205 (28.7%) | 25 (3.5%) |
| 3-Person Households | 86 (12.0%) | 4 (0.6%) |
| 4-Person Households | 71 (9.9%) | 0 (0.0%) |
| 5-Person Households | 45 (6.3%) | 0 (0.0%) |
| 6-Person Households | 14 (2.0%) | 0 (0.0%) |
| 7+ Person Households | 7 (1.0%) | 0 (0.0%) |
| Total | 428 (59.9%) | 286 (40.1%) |
Female Fertility in Arkoma
Fertility by Age in Arkoma
Average fertility rate in Arkoma is 91.0 births per 1,000 women. Women in the age bracket of 20 to 34 years have the highest fertility rate with 146.0 births per 1,000 women. Women in the age bracket of 20 to 34 years acount for 68.6% of all women with births.
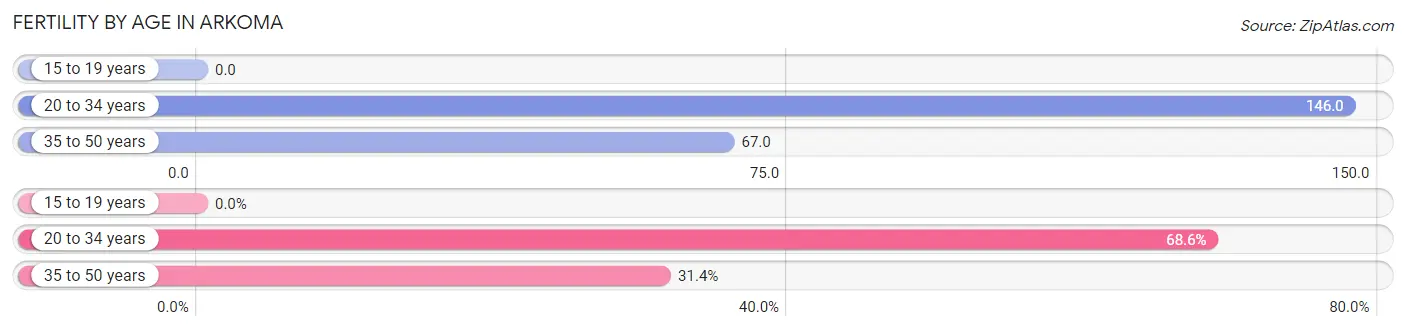
| Age Bracket | Women with Births | Births / 1,000 Women |
| 15 to 19 years | 0 (0.0%) | 0.0 |
| 20 to 34 years | 24 (68.6%) | 146.0 |
| 35 to 50 years | 11 (31.4%) | 67.0 |
| Total | 35 (100.0%) | 91.0 |
Fertility by Age by Marriage Status in Arkoma
54.3% of women with births (35) in Arkoma are married. The highest percentage of unmarried women with births falls into 20 to 34 years age bracket with 45.8% of them unmarried at the time of birth, while the lowest percentage of unmarried women with births belong to 35 to 50 years age bracket with 45.5% of them unmarried.
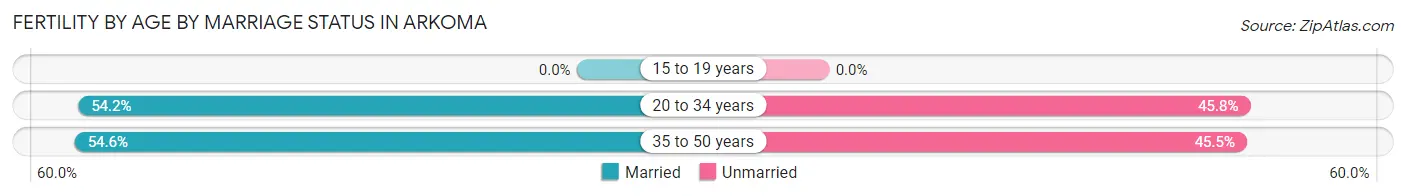
| Age Bracket | Married | Unmarried |
| 15 to 19 years | 0 (0.0%) | 0 (0.0%) |
| 20 to 34 years | 13 (54.2%) | 11 (45.8%) |
| 35 to 50 years | 6 (54.5%) | 5 (45.5%) |
| Total | 19 (54.3%) | 16 (45.7%) |
Fertility by Education in Arkoma
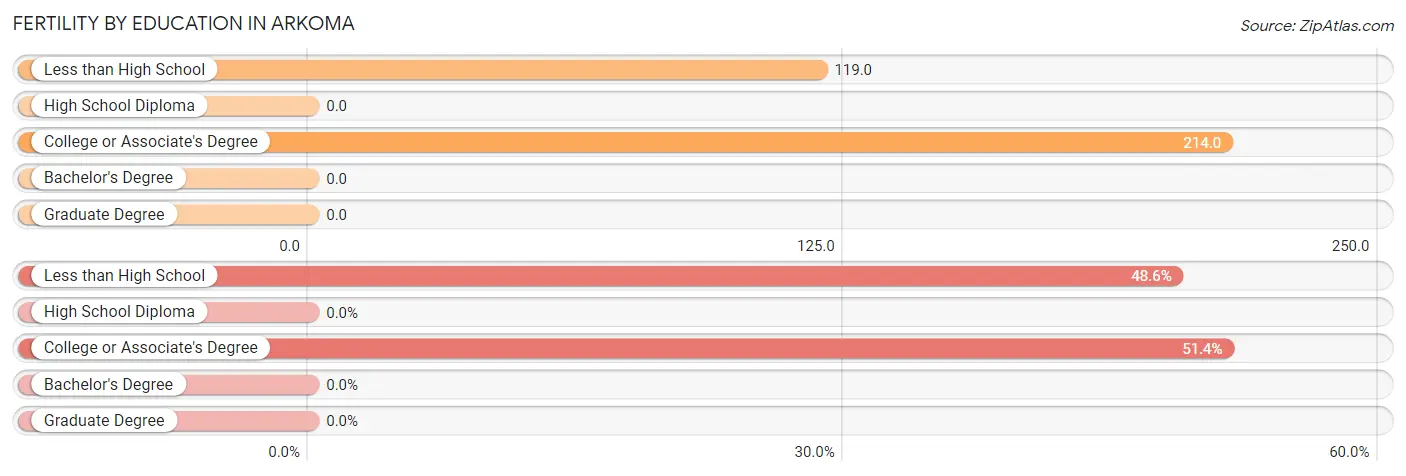
| Educational Attainment | Women with Births | Births / 1,000 Women |
| Less than High School | 17 (48.6%) | 119.0 |
| High School Diploma | 0 (0.0%) | 0.0 |
| College or Associate's Degree | 18 (51.4%) | 214.0 |
| Bachelor's Degree | 0 (0.0%) | 0.0 |
| Graduate Degree | 0 (0.0%) | 0.0 |
| Total | 35 (100.0%) | 91.0 |
Fertility by Education by Marriage Status in Arkoma
45.7% of women with births in Arkoma are unmarried. Women with the educational attainment of college or associate's degree are most likely to be married with 72.2% of them married at childbirth, while women with the educational attainment of less than high school are least likely to be married with 64.7% of them unmarried at childbirth.
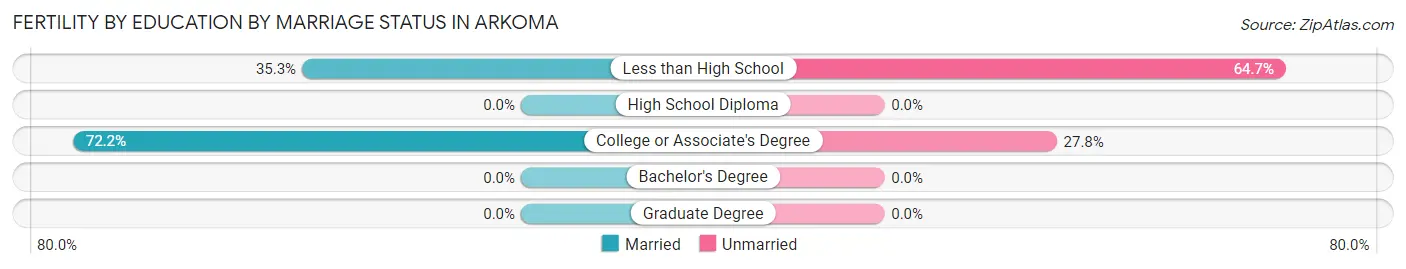
| Educational Attainment | Married | Unmarried |
| Less than High School | 6 (35.3%) | 11 (64.7%) |
| High School Diploma | 0 (0.0%) | 0 (0.0%) |
| College or Associate's Degree | 13 (72.2%) | 5 (27.8%) |
| Bachelor's Degree | 0 (0.0%) | 0 (0.0%) |
| Graduate Degree | 0 (0.0%) | 0 (0.0%) |
| Total | 19 (54.3%) | 16 (45.7%) |
Employment Characteristics in Arkoma
Employment by Class of Employer in Arkoma
Among the 672 employed individuals in Arkoma, private company employees (506 | 75.3%), local government employees (41 | 6.1%), and not-for-profit organizations (39 | 5.8%) make up the most common classes of employment.
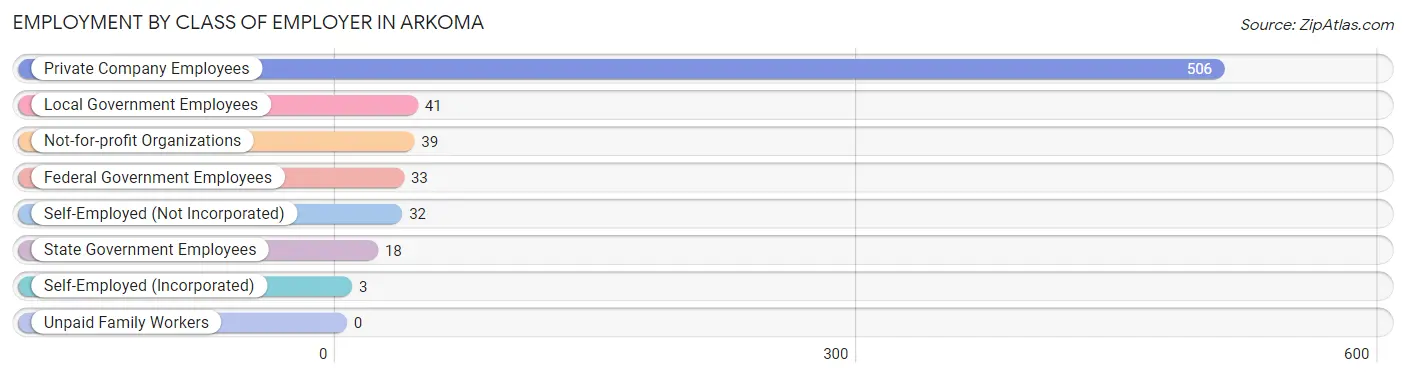
| Employer Class | # Employees | % Employees |
| Private Company Employees | 506 | 75.3% |
| Self-Employed (Incorporated) | 3 | 0.4% |
| Self-Employed (Not Incorporated) | 32 | 4.8% |
| Not-for-profit Organizations | 39 | 5.8% |
| Local Government Employees | 41 | 6.1% |
| State Government Employees | 18 | 2.7% |
| Federal Government Employees | 33 | 4.9% |
| Unpaid Family Workers | 0 | 0.0% |
| Total | 672 | 100.0% |
Employment Status by Age in Arkoma
According to the labor force statistics for Arkoma, out of the total population over 16 years of age (1,435), 52.3% or 751 individuals are in the labor force, with 10.5% or 79 of them unemployed. The age group with the highest labor force participation rate is 25 to 29 years, with 78.0% or 85 individuals in the labor force. Within the labor force, the 16 to 19 years age range has the highest percentage of unemployed individuals, with 58.3% or 7 of them being unemployed.
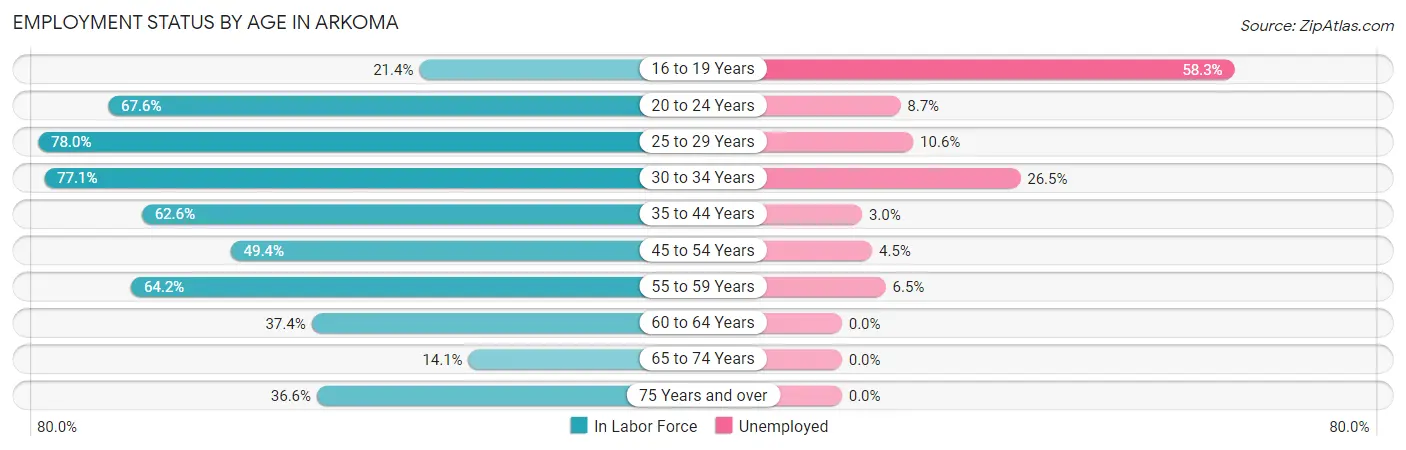
| Age Bracket | In Labor Force | Unemployed |
| 16 to 19 Years | 12 (21.4%) | 7 (58.3%) |
| 20 to 24 Years | 69 (67.6%) | 6 (8.7%) |
| 25 to 29 Years | 85 (78.0%) | 9 (10.6%) |
| 30 to 34 Years | 168 (77.1%) | 45 (26.5%) |
| 35 to 44 Years | 132 (62.6%) | 4 (3.0%) |
| 45 to 54 Years | 88 (49.4%) | 4 (4.5%) |
| 55 to 59 Years | 77 (64.2%) | 5 (6.5%) |
| 60 to 64 Years | 40 (37.4%) | 0 (0.0%) |
| 65 to 74 Years | 27 (14.1%) | 0 (0.0%) |
| 75 Years and over | 52 (36.6%) | 0 (0.0%) |
| Total | 751 (52.3%) | 79 (10.5%) |
Employment Status by Educational Attainment in Arkoma
According to labor force statistics for Arkoma, 62.6% of individuals (590) out of the total population between 25 and 64 years of age (943) are in the labor force, with 11.1% or 65 of them being unemployed. The group with the highest labor force participation rate are those with the educational attainment of bachelor's degree or higher, with 79.0% or 79 individuals in the labor force. Within the labor force, individuals with less than high school education have the highest percentage of unemployment, with 22.5% or 9 of them being unemployed.
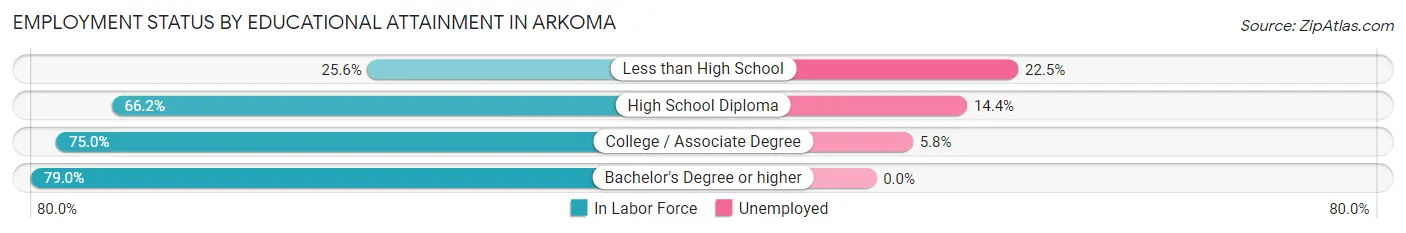
| Educational Attainment | In Labor Force | Unemployed |
| Less than High School | 40 (25.6%) | 35 (22.5%) |
| High School Diploma | 333 (66.2%) | 72 (14.4%) |
| College / Associate Degree | 138 (75.0%) | 11 (5.8%) |
| Bachelor's Degree or higher | 79 (79.0%) | 0 (0.0%) |
| Total | 590 (62.6%) | 105 (11.1%) |
Employment Occupations by Sex in Arkoma
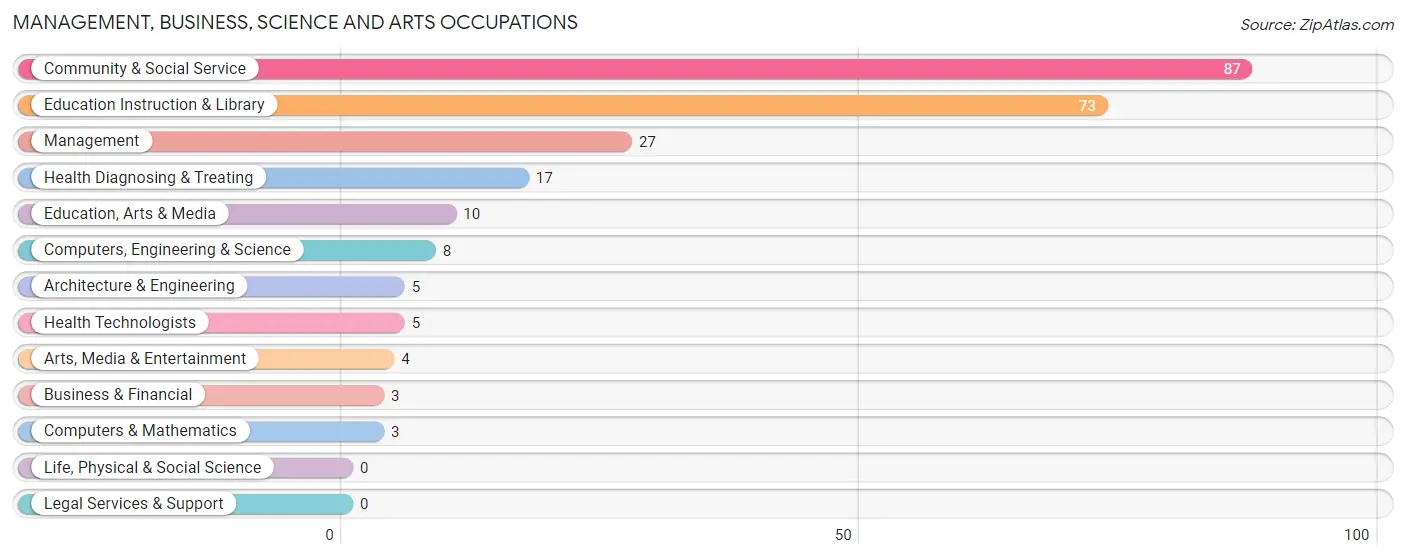
Management, Business, Science and Arts Occupations
The most common Management, Business, Science and Arts occupations in Arkoma are Community & Social Service (87 | 13.1%), Education Instruction & Library (73 | 11.0%), Management (27 | 4.1%), Health Diagnosing & Treating (17 | 2.5%), and Education, Arts & Media (10 | 1.5%).
Management, Business, Science and Arts Occupations by Sex
Within the Management, Business, Science and Arts occupations in Arkoma, the most male-oriented occupations are Business & Financial (100.0%), Computers, Engineering & Science (100.0%), and Computers & Mathematics (100.0%), while the most female-oriented occupations are Health Diagnosing & Treating (100.0%), Health Technologists (100.0%), and Education Instruction & Library (91.8%).
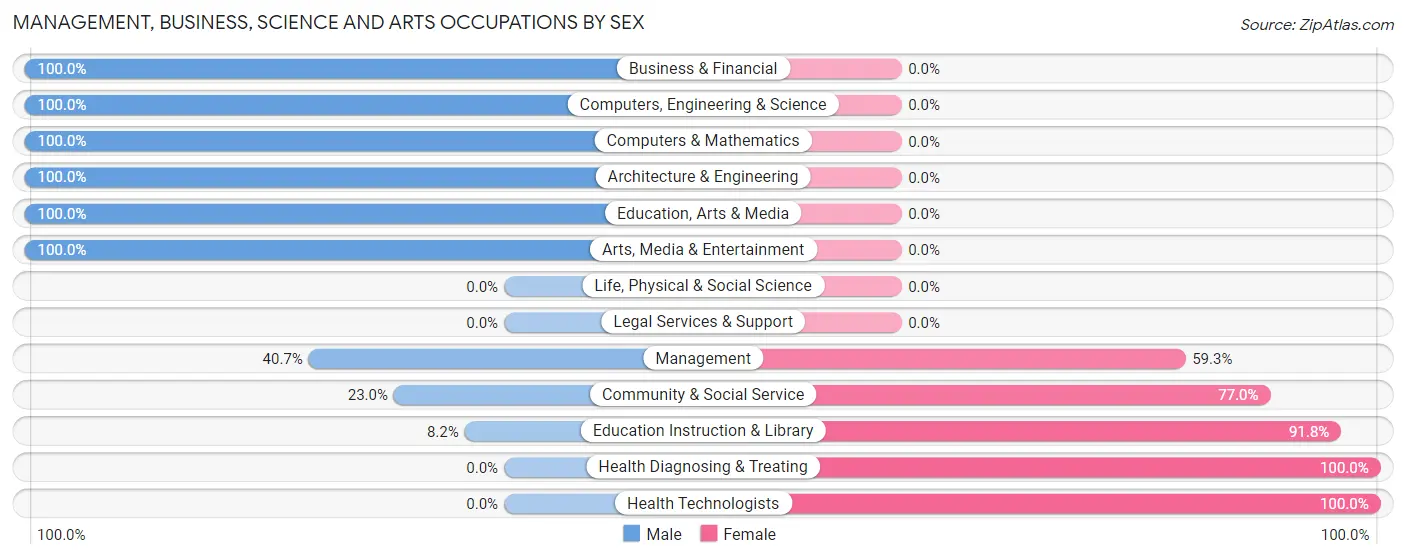
| Occupation | Male | Female |
| Management | 11 (40.7%) | 16 (59.3%) |
| Business & Financial | 3 (100.0%) | 0 (0.0%) |
| Computers, Engineering & Science | 8 (100.0%) | 0 (0.0%) |
| Computers & Mathematics | 3 (100.0%) | 0 (0.0%) |
| Architecture & Engineering | 5 (100.0%) | 0 (0.0%) |
| Life, Physical & Social Science | 0 (0.0%) | 0 (0.0%) |
| Community & Social Service | 20 (23.0%) | 67 (77.0%) |
| Education, Arts & Media | 10 (100.0%) | 0 (0.0%) |
| Legal Services & Support | 0 (0.0%) | 0 (0.0%) |
| Education Instruction & Library | 6 (8.2%) | 67 (91.8%) |
| Arts, Media & Entertainment | 4 (100.0%) | 0 (0.0%) |
| Health Diagnosing & Treating | 0 (0.0%) | 17 (100.0%) |
| Health Technologists | 0 (0.0%) | 5 (100.0%) |
| Total (Category) | 42 (29.6%) | 100 (70.4%) |
| Total (Overall) | 328 (49.2%) | 338 (50.7%) |
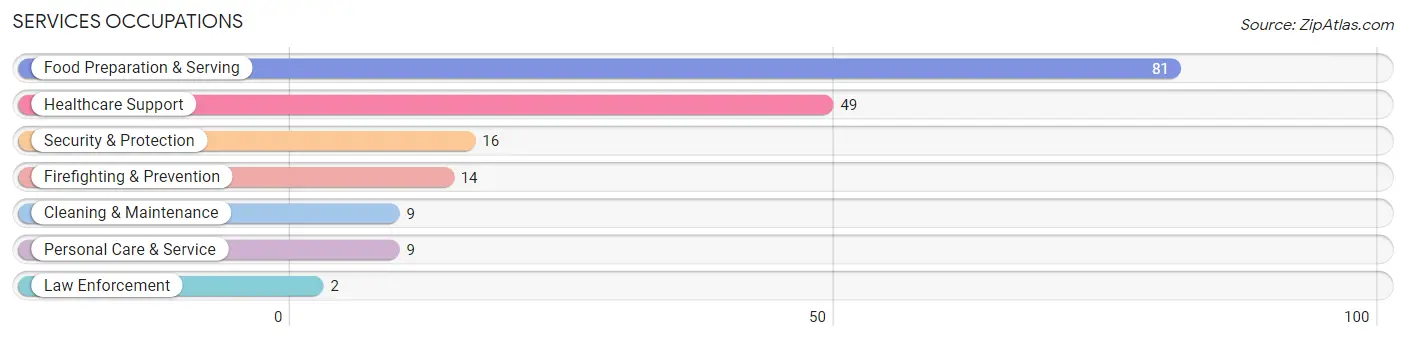
Services Occupations
The most common Services occupations in Arkoma are Food Preparation & Serving (81 | 12.2%), Healthcare Support (49 | 7.4%), Security & Protection (16 | 2.4%), Firefighting & Prevention (14 | 2.1%), and Cleaning & Maintenance (9 | 1.3%).
Services Occupations by Sex
Within the Services occupations in Arkoma, the most male-oriented occupations are Law Enforcement (100.0%), Security & Protection (62.5%), and Firefighting & Prevention (57.1%), while the most female-oriented occupations are Healthcare Support (100.0%), Personal Care & Service (100.0%), and Food Preparation & Serving (77.8%).
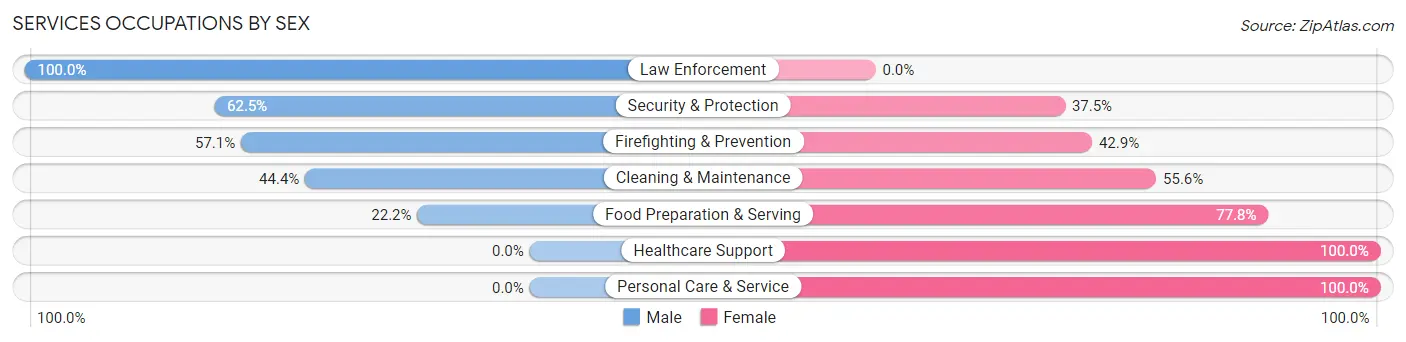
| Occupation | Male | Female |
| Healthcare Support | 0 (0.0%) | 49 (100.0%) |
| Security & Protection | 10 (62.5%) | 6 (37.5%) |
| Firefighting & Prevention | 8 (57.1%) | 6 (42.9%) |
| Law Enforcement | 2 (100.0%) | 0 (0.0%) |
| Food Preparation & Serving | 18 (22.2%) | 63 (77.8%) |
| Cleaning & Maintenance | 4 (44.4%) | 5 (55.6%) |
| Personal Care & Service | 0 (0.0%) | 9 (100.0%) |
| Total (Category) | 32 (19.5%) | 132 (80.5%) |
| Total (Overall) | 328 (49.2%) | 338 (50.7%) |
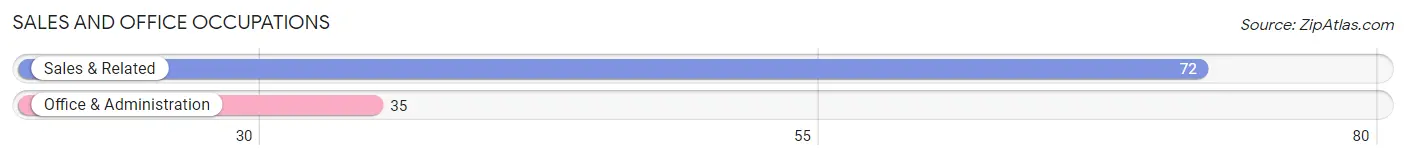
Sales and Office Occupations
The most common Sales and Office occupations in Arkoma are Sales & Related (72 | 10.8%), and Office & Administration (35 | 5.3%).
Sales and Office Occupations by Sex
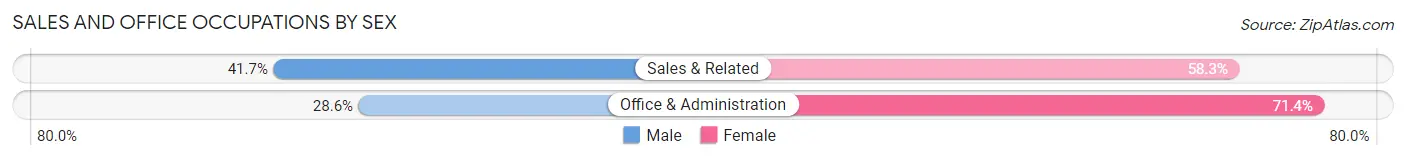
| Occupation | Male | Female |
| Sales & Related | 30 (41.7%) | 42 (58.3%) |
| Office & Administration | 10 (28.6%) | 25 (71.4%) |
| Total (Category) | 40 (37.4%) | 67 (62.6%) |
| Total (Overall) | 328 (49.2%) | 338 (50.7%) |
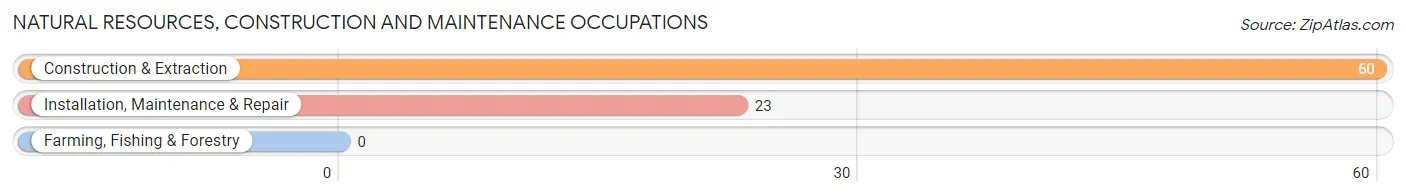
Natural Resources, Construction and Maintenance Occupations
The most common Natural Resources, Construction and Maintenance occupations in Arkoma are Construction & Extraction (60 | 9.0%), and Installation, Maintenance & Repair (23 | 3.5%).
Natural Resources, Construction and Maintenance Occupations by Sex
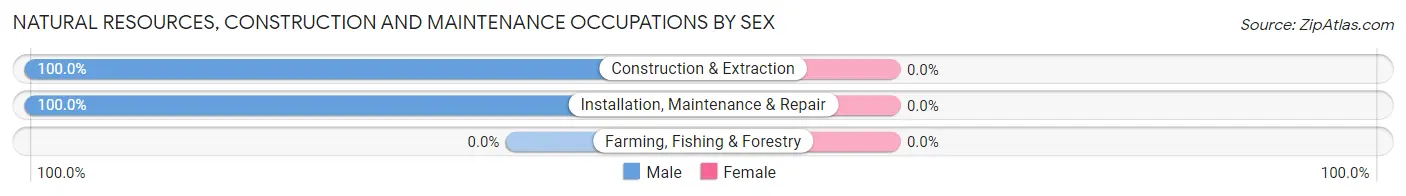
| Occupation | Male | Female |
| Farming, Fishing & Forestry | 0 (0.0%) | 0 (0.0%) |
| Construction & Extraction | 60 (100.0%) | 0 (0.0%) |
| Installation, Maintenance & Repair | 23 (100.0%) | 0 (0.0%) |
| Total (Category) | 83 (100.0%) | 0 (0.0%) |
| Total (Overall) | 328 (49.2%) | 338 (50.7%) |
Production, Transportation and Moving Occupations
The most common Production, Transportation and Moving occupations in Arkoma are Material Moving (75 | 11.3%), Production (53 | 8.0%), and Transportation (42 | 6.3%).
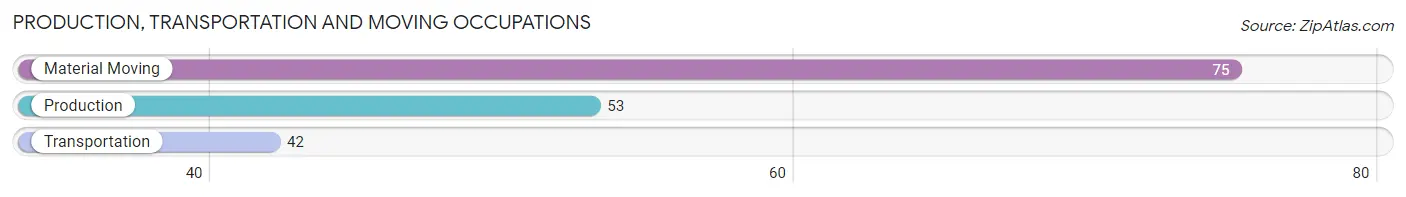
Production, Transportation and Moving Occupations by Sex
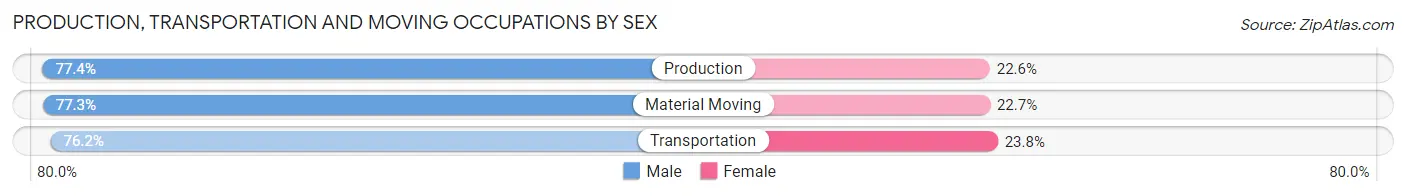
| Occupation | Male | Female |
| Production | 41 (77.4%) | 12 (22.6%) |
| Transportation | 32 (76.2%) | 10 (23.8%) |
| Material Moving | 58 (77.3%) | 17 (22.7%) |
| Total (Category) | 131 (77.1%) | 39 (22.9%) |
| Total (Overall) | 328 (49.2%) | 338 (50.7%) |
Employment Industries by Sex in Arkoma
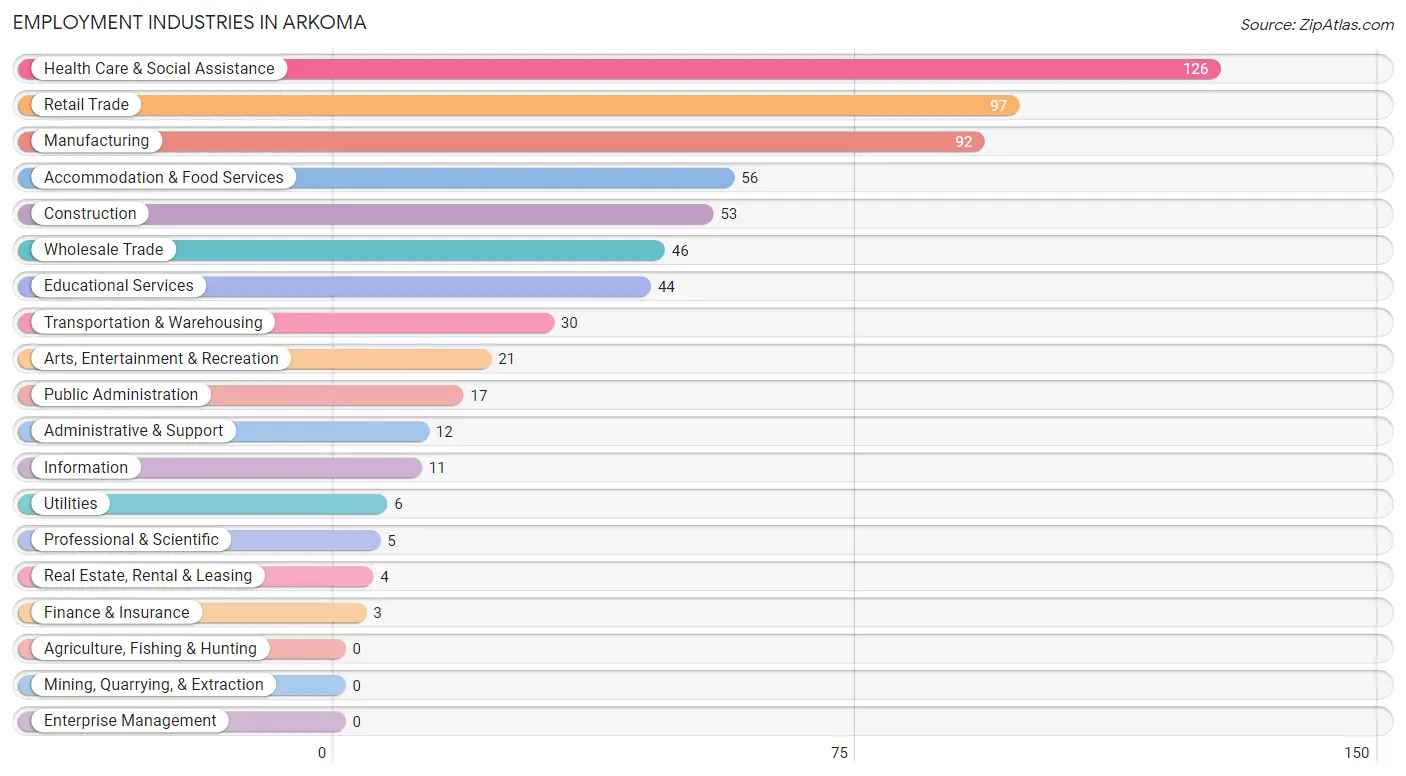
Employment Industries in Arkoma
The major employment industries in Arkoma include Health Care & Social Assistance (126 | 18.9%), Retail Trade (97 | 14.6%), Manufacturing (92 | 13.8%), Accommodation & Food Services (56 | 8.4%), and Construction (53 | 8.0%).
Employment Industries by Sex in Arkoma
The Arkoma industries that see more men than women are Construction (100.0%), Finance & Insurance (100.0%), and Wholesale Trade (95.7%), whereas the industries that tend to have a higher number of women are Information (100.0%), Real Estate, Rental & Leasing (100.0%), and Professional & Scientific (100.0%).
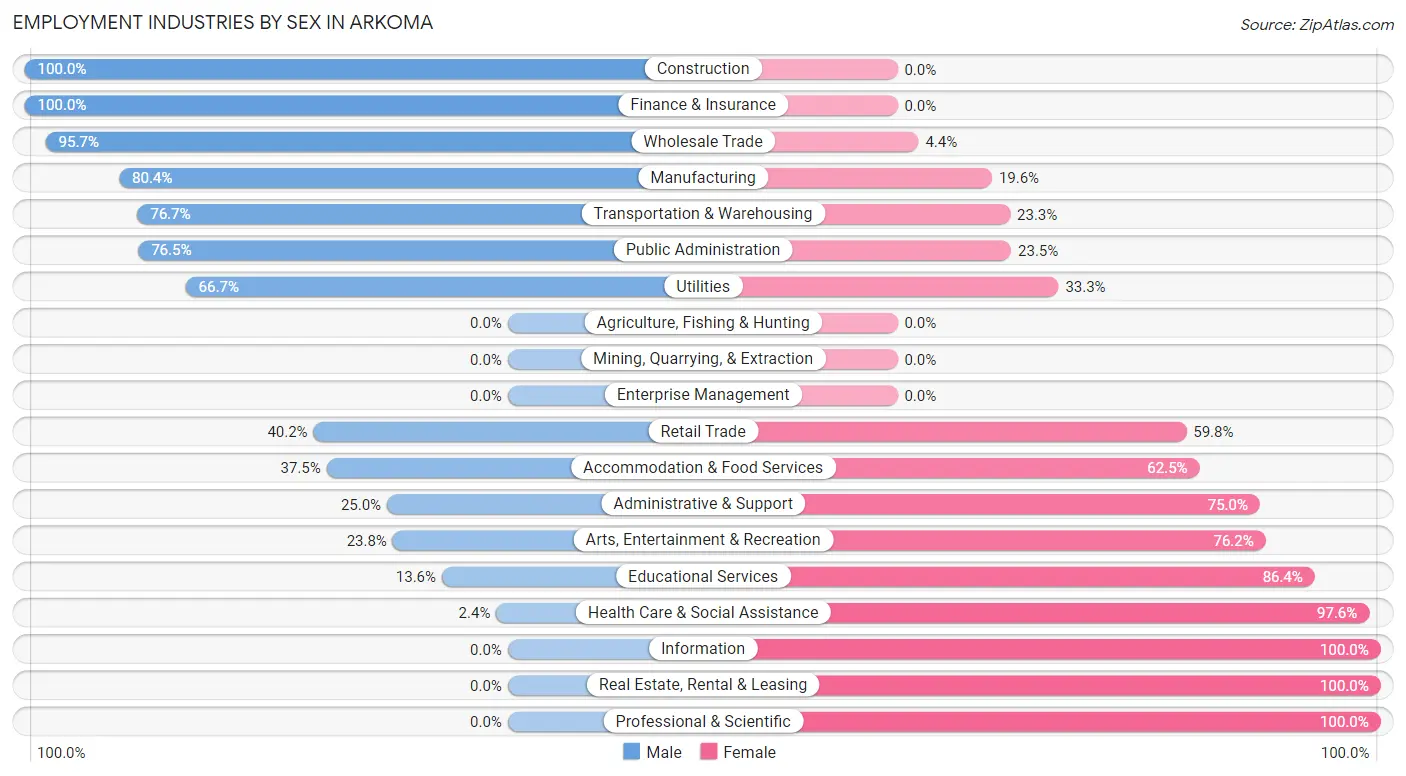
| Industry | Male | Female |
| Agriculture, Fishing & Hunting | 0 (0.0%) | 0 (0.0%) |
| Mining, Quarrying, & Extraction | 0 (0.0%) | 0 (0.0%) |
| Construction | 53 (100.0%) | 0 (0.0%) |
| Manufacturing | 74 (80.4%) | 18 (19.6%) |
| Wholesale Trade | 44 (95.7%) | 2 (4.3%) |
| Retail Trade | 39 (40.2%) | 58 (59.8%) |
| Transportation & Warehousing | 23 (76.7%) | 7 (23.3%) |
| Utilities | 4 (66.7%) | 2 (33.3%) |
| Information | 0 (0.0%) | 11 (100.0%) |
| Finance & Insurance | 3 (100.0%) | 0 (0.0%) |
| Real Estate, Rental & Leasing | 0 (0.0%) | 4 (100.0%) |
| Professional & Scientific | 0 (0.0%) | 5 (100.0%) |
| Enterprise Management | 0 (0.0%) | 0 (0.0%) |
| Administrative & Support | 3 (25.0%) | 9 (75.0%) |
| Educational Services | 6 (13.6%) | 38 (86.4%) |
| Health Care & Social Assistance | 3 (2.4%) | 123 (97.6%) |
| Arts, Entertainment & Recreation | 5 (23.8%) | 16 (76.2%) |
| Accommodation & Food Services | 21 (37.5%) | 35 (62.5%) |
| Public Administration | 13 (76.5%) | 4 (23.5%) |
| Total | 328 (49.2%) | 338 (50.7%) |
Education in Arkoma
School Enrollment in Arkoma
The most common levels of schooling among the 359 students in Arkoma are elementary school (131 | 36.5%), middle school (98 | 27.3%), and high school (65 | 18.1%).
| School Level | # Students | % Students |
| Nursery / Preschool | 18 | 5.0% |
| Kindergarten | 19 | 5.3% |
| Elementary School | 131 | 36.5% |
| Middle School | 98 | 27.3% |
| High School | 65 | 18.1% |
| College / Undergraduate | 19 | 5.3% |
| Graduate / Professional | 9 | 2.5% |
| Total | 359 | 100.0% |
School Enrollment by Age by Funding Source in Arkoma
Out of a total of 359 students who are enrolled in schools in Arkoma, 36 (10.0%) attend a private institution, while the remaining 323 (90.0%) are enrolled in public schools. The age group of 35 years and over has the highest likelihood of being enrolled in private schools, with 6 (100.0% in the age bracket) enrolled. Conversely, the age group of 15 to 17 year olds has the lowest likelihood of being enrolled in a private school, with 62 (100.0% in the age bracket) attending a public institution.
| Age Bracket | Public School | Private School |
| 3 to 4 Year Olds | 14 (77.8%) | 4 (22.2%) |
| 5 to 9 Year Old | 108 (87.1%) | 16 (12.9%) |
| 10 to 14 Year Olds | 116 (92.1%) | 10 (7.9%) |
| 15 to 17 Year Olds | 62 (100.0%) | 0 (0.0%) |
| 18 to 19 Year Olds | 10 (100.0%) | 0 (0.0%) |
| 20 to 24 Year Olds | 7 (100.0%) | 0 (0.0%) |
| 25 to 34 Year Olds | 6 (100.0%) | 0 (0.0%) |
| 35 Years and over | 0 (0.0%) | 6 (100.0%) |
| Total | 323 (90.0%) | 36 (10.0%) |
Educational Attainment by Field of Study in Arkoma
Education (46 | 33.3%), arts & humanities (26 | 18.8%), business (19 | 13.8%), science & technology (12 | 8.7%), and psychology (8 | 5.8%) are the most common fields of study among 138 individuals in Arkoma who have obtained a bachelor's degree or higher.
| Field of Study | # Graduates | % Graduates |
| Computers & Mathematics | 5 | 3.6% |
| Bio, Nature & Agricultural | 4 | 2.9% |
| Physical & Health Sciences | 0 | 0.0% |
| Psychology | 8 | 5.8% |
| Social Sciences | 4 | 2.9% |
| Engineering | 0 | 0.0% |
| Multidisciplinary Studies | 0 | 0.0% |
| Science & Technology | 12 | 8.7% |
| Business | 19 | 13.8% |
| Education | 46 | 33.3% |
| Literature & Languages | 0 | 0.0% |
| Liberal Arts & History | 5 | 3.6% |
| Visual & Performing Arts | 4 | 2.9% |
| Communications | 5 | 3.6% |
| Arts & Humanities | 26 | 18.8% |
| Total | 138 | 100.0% |
Transportation & Commute in Arkoma
Vehicle Availability by Sex in Arkoma
The most prevalent vehicle ownership categories in Arkoma are males with 2 vehicles (146, accounting for 43.7%) and females with 2 vehicles (112, making up 43.2%).
| Vehicles Available | Male | Female |
| No Vehicle | 15 (4.5%) | 3 (0.9%) |
| 1 Vehicle | 71 (21.3%) | 167 (49.4%) |
| 2 Vehicles | 146 (43.7%) | 112 (33.1%) |
| 3 Vehicles | 57 (17.1%) | 23 (6.8%) |
| 4 Vehicles | 37 (11.1%) | 21 (6.2%) |
| 5 or more Vehicles | 8 (2.4%) | 12 (3.5%) |
| Total | 334 (100.0%) | 338 (100.0%) |
Commute Time in Arkoma
The most frequently occuring commute durations in Arkoma are 15 to 19 minutes (163 commuters, 25.8%), 10 to 14 minutes (154 commuters, 24.3%), and 5 to 9 minutes (118 commuters, 18.6%).
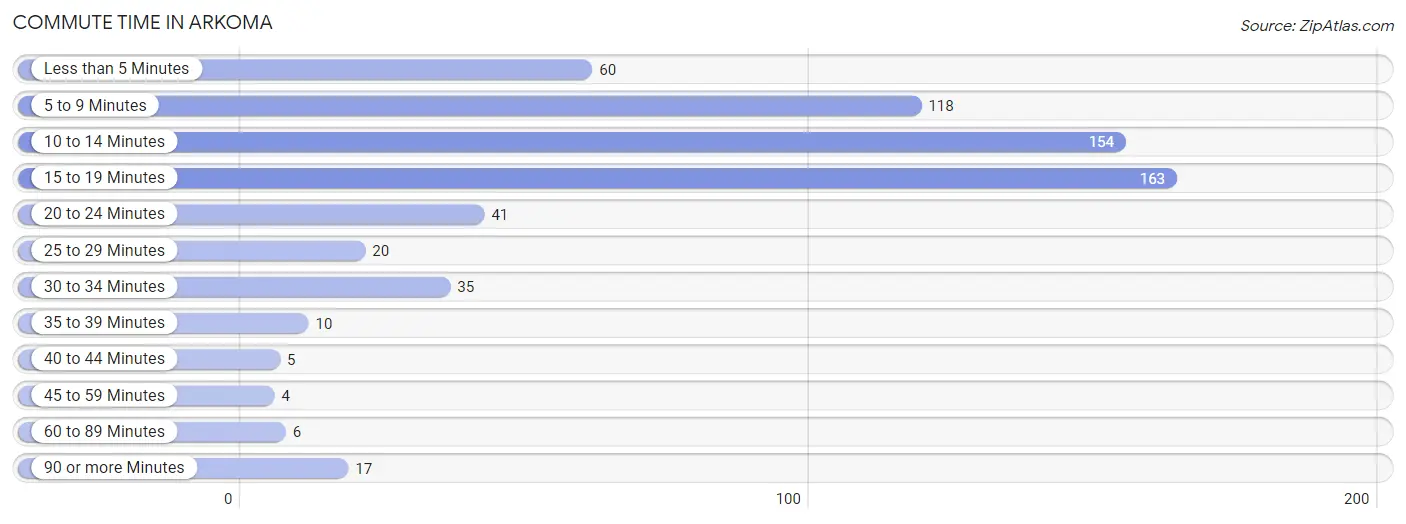
| Commute Time | # Commuters | % Commuters |
| Less than 5 Minutes | 60 | 9.5% |
| 5 to 9 Minutes | 118 | 18.6% |
| 10 to 14 Minutes | 154 | 24.3% |
| 15 to 19 Minutes | 163 | 25.8% |
| 20 to 24 Minutes | 41 | 6.5% |
| 25 to 29 Minutes | 20 | 3.2% |
| 30 to 34 Minutes | 35 | 5.5% |
| 35 to 39 Minutes | 10 | 1.6% |
| 40 to 44 Minutes | 5 | 0.8% |
| 45 to 59 Minutes | 4 | 0.6% |
| 60 to 89 Minutes | 6 | 0.9% |
| 90 or more Minutes | 17 | 2.7% |
Commute Time by Sex in Arkoma
The most common commute times in Arkoma are 15 to 19 minutes (103 commuters, 32.6%) for males and 10 to 14 minutes (94 commuters, 29.6%) for females.
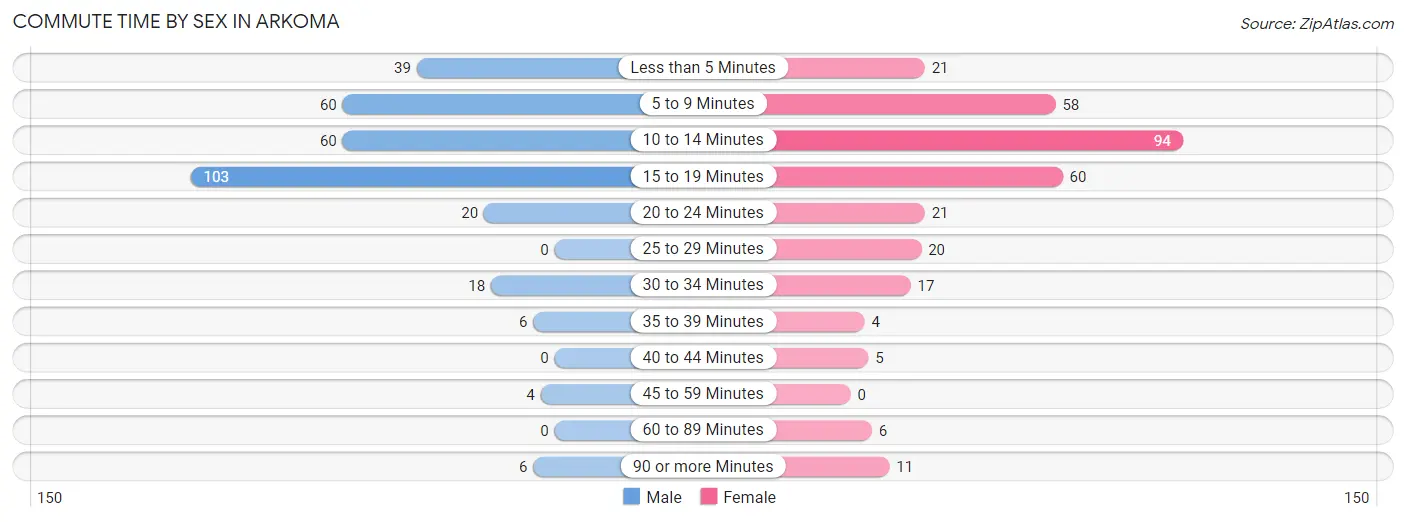
| Commute Time | Male | Female |
| Less than 5 Minutes | 39 (12.3%) | 21 (6.6%) |
| 5 to 9 Minutes | 60 (19.0%) | 58 (18.3%) |
| 10 to 14 Minutes | 60 (19.0%) | 94 (29.6%) |
| 15 to 19 Minutes | 103 (32.6%) | 60 (18.9%) |
| 20 to 24 Minutes | 20 (6.3%) | 21 (6.6%) |
| 25 to 29 Minutes | 0 (0.0%) | 20 (6.3%) |
| 30 to 34 Minutes | 18 (5.7%) | 17 (5.4%) |
| 35 to 39 Minutes | 6 (1.9%) | 4 (1.3%) |
| 40 to 44 Minutes | 0 (0.0%) | 5 (1.6%) |
| 45 to 59 Minutes | 4 (1.3%) | 0 (0.0%) |
| 60 to 89 Minutes | 0 (0.0%) | 6 (1.9%) |
| 90 or more Minutes | 6 (1.9%) | 11 (3.5%) |
Time of Departure to Work by Sex in Arkoma
The most frequent times of departure to work in Arkoma are 7:00 AM to 7:29 AM (53, 16.8%) for males and 5:00 AM to 5:29 AM (53, 16.7%) for females.
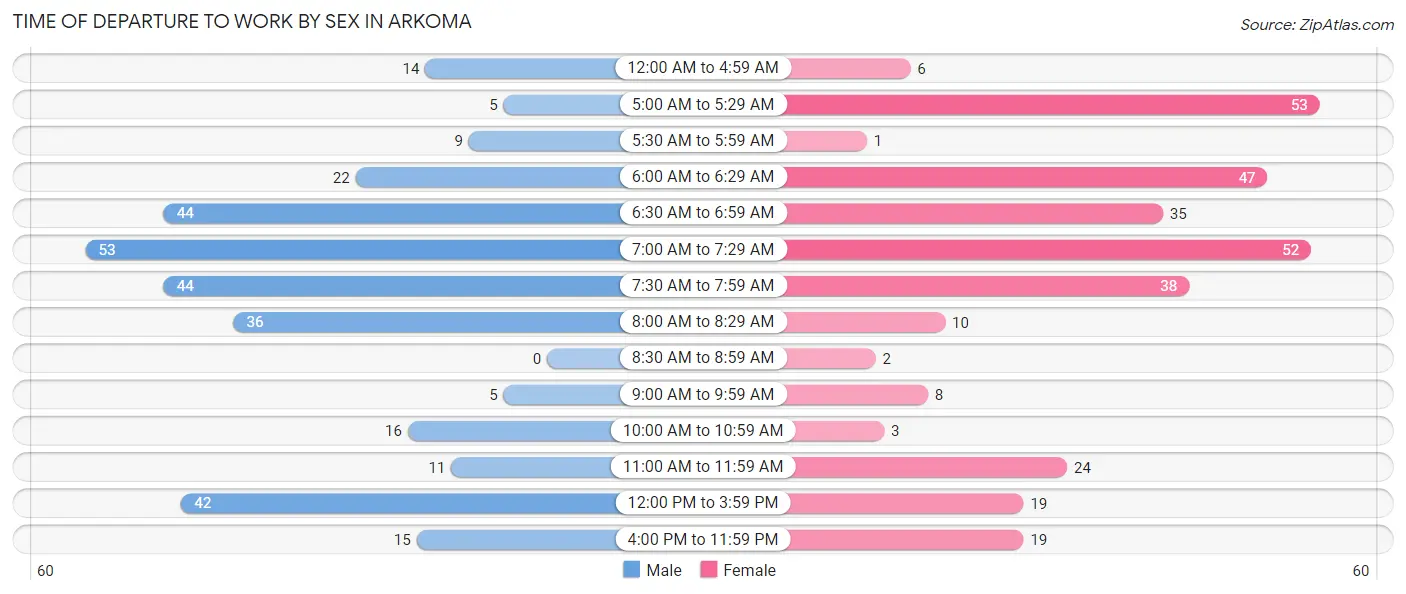
| Time of Departure | Male | Female |
| 12:00 AM to 4:59 AM | 14 (4.4%) | 6 (1.9%) |
| 5:00 AM to 5:29 AM | 5 (1.6%) | 53 (16.7%) |
| 5:30 AM to 5:59 AM | 9 (2.9%) | 1 (0.3%) |
| 6:00 AM to 6:29 AM | 22 (7.0%) | 47 (14.8%) |
| 6:30 AM to 6:59 AM | 44 (13.9%) | 35 (11.0%) |
| 7:00 AM to 7:29 AM | 53 (16.8%) | 52 (16.4%) |
| 7:30 AM to 7:59 AM | 44 (13.9%) | 38 (12.0%) |
| 8:00 AM to 8:29 AM | 36 (11.4%) | 10 (3.2%) |
| 8:30 AM to 8:59 AM | 0 (0.0%) | 2 (0.6%) |
| 9:00 AM to 9:59 AM | 5 (1.6%) | 8 (2.5%) |
| 10:00 AM to 10:59 AM | 16 (5.1%) | 3 (0.9%) |
| 11:00 AM to 11:59 AM | 11 (3.5%) | 24 (7.6%) |
| 12:00 PM to 3:59 PM | 42 (13.3%) | 19 (6.0%) |
| 4:00 PM to 11:59 PM | 15 (4.8%) | 19 (6.0%) |
| Total | 316 (100.0%) | 317 (100.0%) |
Housing Occupancy in Arkoma
Occupancy by Ownership in Arkoma
Of the total 714 dwellings in Arkoma, owner-occupied units account for 429 (60.1%), while renter-occupied units make up 285 (39.9%).
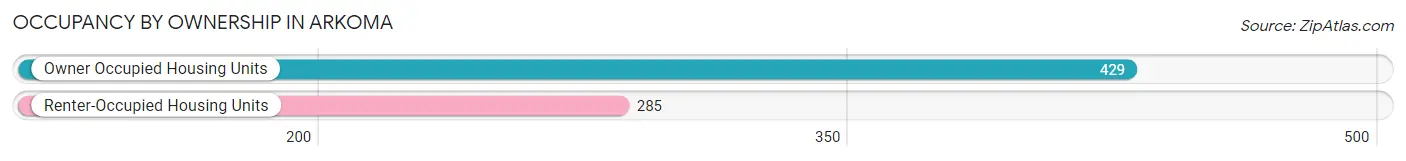
| Occupancy | # Housing Units | % Housing Units |
| Owner Occupied Housing Units | 429 | 60.1% |
| Renter-Occupied Housing Units | 285 | 39.9% |
| Total Occupied Housing Units | 714 | 100.0% |
Occupancy by Household Size in Arkoma
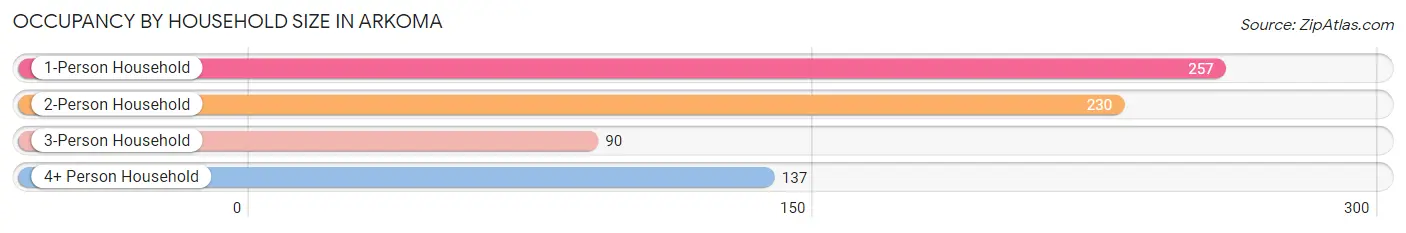
| Household Size | # Housing Units | % Housing Units |
| 1-Person Household | 257 | 36.0% |
| 2-Person Household | 230 | 32.2% |
| 3-Person Household | 90 | 12.6% |
| 4+ Person Household | 137 | 19.2% |
| Total Housing Units | 714 | 100.0% |
Occupancy by Ownership by Household Size in Arkoma
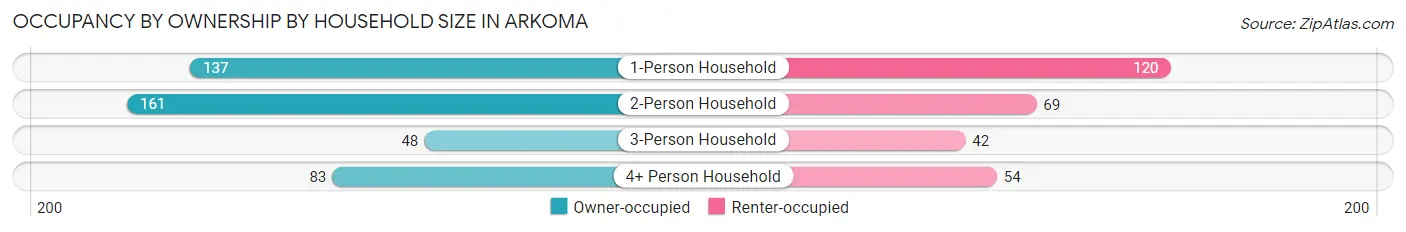
| Household Size | Owner-occupied | Renter-occupied |
| 1-Person Household | 137 (53.3%) | 120 (46.7%) |
| 2-Person Household | 161 (70.0%) | 69 (30.0%) |
| 3-Person Household | 48 (53.3%) | 42 (46.7%) |
| 4+ Person Household | 83 (60.6%) | 54 (39.4%) |
| Total Housing Units | 429 (60.1%) | 285 (39.9%) |
Occupancy by Educational Attainment in Arkoma
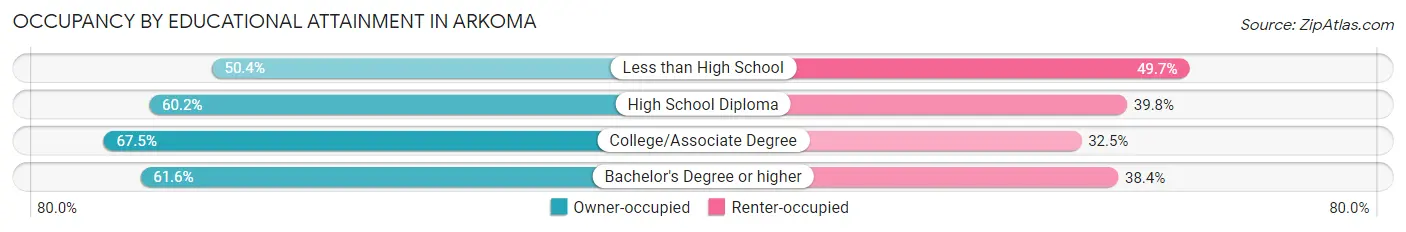
| Household Size | Owner-occupied | Renter-occupied |
| Less than High School | 71 (50.3%) | 70 (49.6%) |
| High School Diploma | 203 (60.2%) | 134 (39.8%) |
| College/Associate Degree | 110 (67.5%) | 53 (32.5%) |
| Bachelor's Degree or higher | 45 (61.6%) | 28 (38.4%) |
Occupancy by Age of Householder in Arkoma
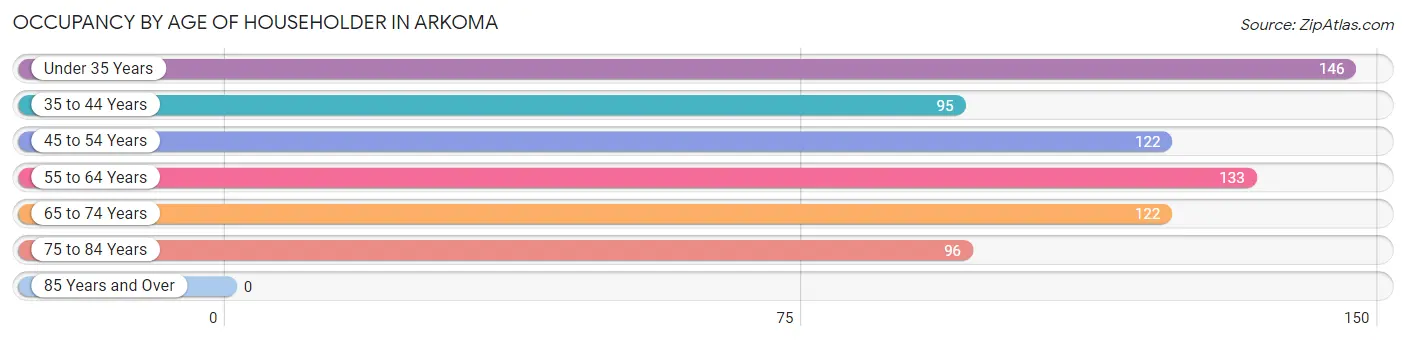
| Age Bracket | # Households | % Households |
| Under 35 Years | 146 | 20.4% |
| 35 to 44 Years | 95 | 13.3% |
| 45 to 54 Years | 122 | 17.1% |
| 55 to 64 Years | 133 | 18.6% |
| 65 to 74 Years | 122 | 17.1% |
| 75 to 84 Years | 96 | 13.5% |
| 85 Years and Over | 0 | 0.0% |
| Total | 714 | 100.0% |
Housing Finances in Arkoma
Median Income by Occupancy in Arkoma
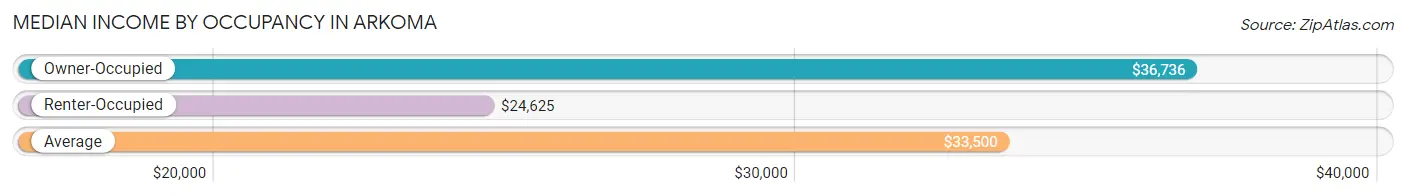
| Occupancy Type | # Households | Median Income |
| Owner-Occupied | 429 (60.1%) | $36,736 |
| Renter-Occupied | 285 (39.9%) | $24,625 |
| Average | 714 (100.0%) | $33,500 |
Occupancy by Householder Income Bracket in Arkoma
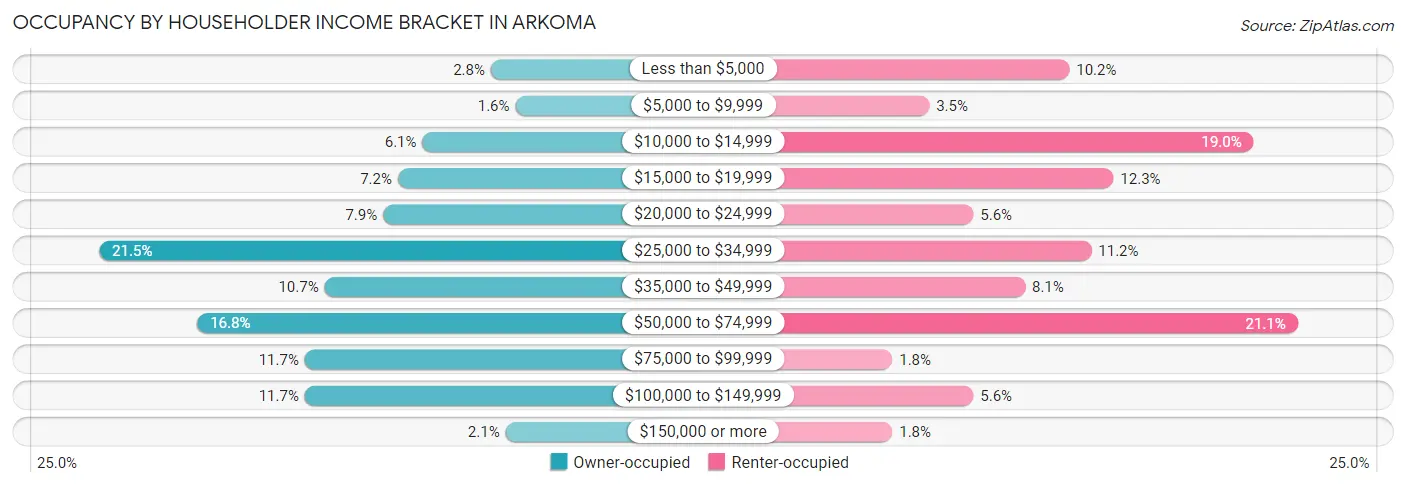
| Income Bracket | Owner-occupied | Renter-occupied |
| Less than $5,000 | 12 (2.8%) | 29 (10.2%) |
| $5,000 to $9,999 | 7 (1.6%) | 10 (3.5%) |
| $10,000 to $14,999 | 26 (6.1%) | 54 (19.0%) |
| $15,000 to $19,999 | 31 (7.2%) | 35 (12.3%) |
| $20,000 to $24,999 | 34 (7.9%) | 16 (5.6%) |
| $25,000 to $34,999 | 92 (21.4%) | 32 (11.2%) |
| $35,000 to $49,999 | 46 (10.7%) | 23 (8.1%) |
| $50,000 to $74,999 | 72 (16.8%) | 60 (21.0%) |
| $75,000 to $99,999 | 50 (11.7%) | 5 (1.8%) |
| $100,000 to $149,999 | 50 (11.7%) | 16 (5.6%) |
| $150,000 or more | 9 (2.1%) | 5 (1.8%) |
| Total | 429 (100.0%) | 285 (100.0%) |
Monthly Housing Cost Tiers in Arkoma
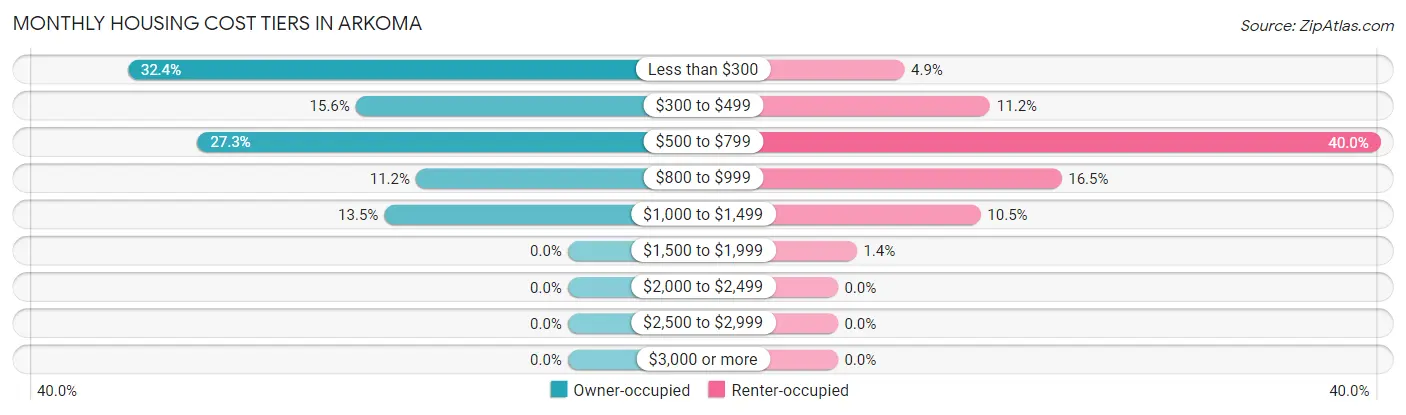
| Monthly Cost | Owner-occupied | Renter-occupied |
| Less than $300 | 139 (32.4%) | 14 (4.9%) |
| $300 to $499 | 67 (15.6%) | 32 (11.2%) |
| $500 to $799 | 117 (27.3%) | 114 (40.0%) |
| $800 to $999 | 48 (11.2%) | 47 (16.5%) |
| $1,000 to $1,499 | 58 (13.5%) | 30 (10.5%) |
| $1,500 to $1,999 | 0 (0.0%) | 4 (1.4%) |
| $2,000 to $2,499 | 0 (0.0%) | 0 (0.0%) |
| $2,500 to $2,999 | 0 (0.0%) | 0 (0.0%) |
| $3,000 or more | 0 (0.0%) | 0 (0.0%) |
| Total | 429 (100.0%) | 285 (100.0%) |
Physical Housing Characteristics in Arkoma
Housing Structures in Arkoma
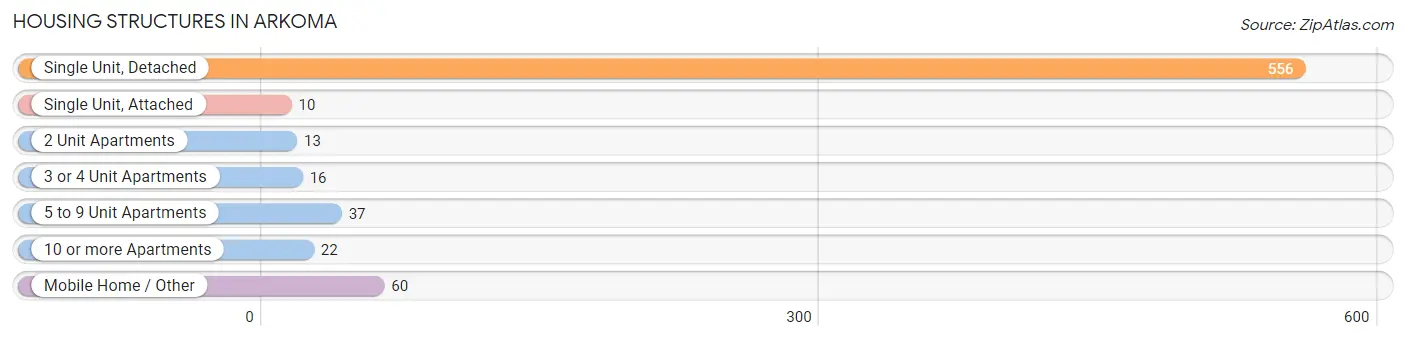
| Structure Type | # Housing Units | % Housing Units |
| Single Unit, Detached | 556 | 77.9% |
| Single Unit, Attached | 10 | 1.4% |
| 2 Unit Apartments | 13 | 1.8% |
| 3 or 4 Unit Apartments | 16 | 2.2% |
| 5 to 9 Unit Apartments | 37 | 5.2% |
| 10 or more Apartments | 22 | 3.1% |
| Mobile Home / Other | 60 | 8.4% |
| Total | 714 | 100.0% |
Housing Structures by Occupancy in Arkoma
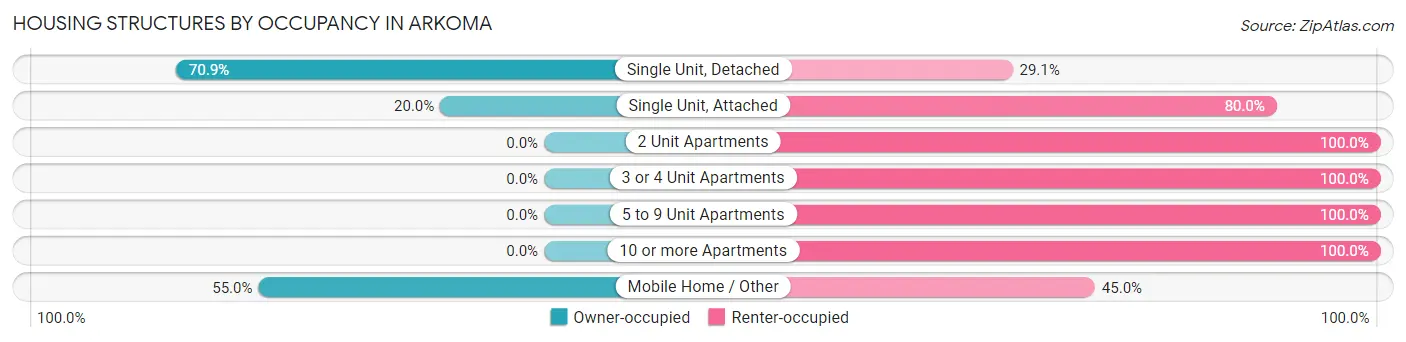
| Structure Type | Owner-occupied | Renter-occupied |
| Single Unit, Detached | 394 (70.9%) | 162 (29.1%) |
| Single Unit, Attached | 2 (20.0%) | 8 (80.0%) |
| 2 Unit Apartments | 0 (0.0%) | 13 (100.0%) |
| 3 or 4 Unit Apartments | 0 (0.0%) | 16 (100.0%) |
| 5 to 9 Unit Apartments | 0 (0.0%) | 37 (100.0%) |
| 10 or more Apartments | 0 (0.0%) | 22 (100.0%) |
| Mobile Home / Other | 33 (55.0%) | 27 (45.0%) |
| Total | 429 (60.1%) | 285 (39.9%) |
Housing Structures by Number of Rooms in Arkoma
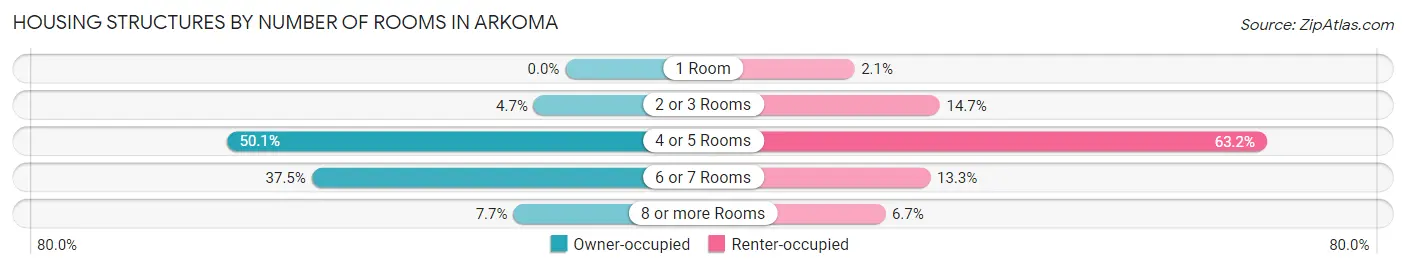
| Number of Rooms | Owner-occupied | Renter-occupied |
| 1 Room | 0 (0.0%) | 6 (2.1%) |
| 2 or 3 Rooms | 20 (4.7%) | 42 (14.7%) |
| 4 or 5 Rooms | 215 (50.1%) | 180 (63.2%) |
| 6 or 7 Rooms | 161 (37.5%) | 38 (13.3%) |
| 8 or more Rooms | 33 (7.7%) | 19 (6.7%) |
| Total | 429 (100.0%) | 285 (100.0%) |
Housing Structure by Heating Type in Arkoma
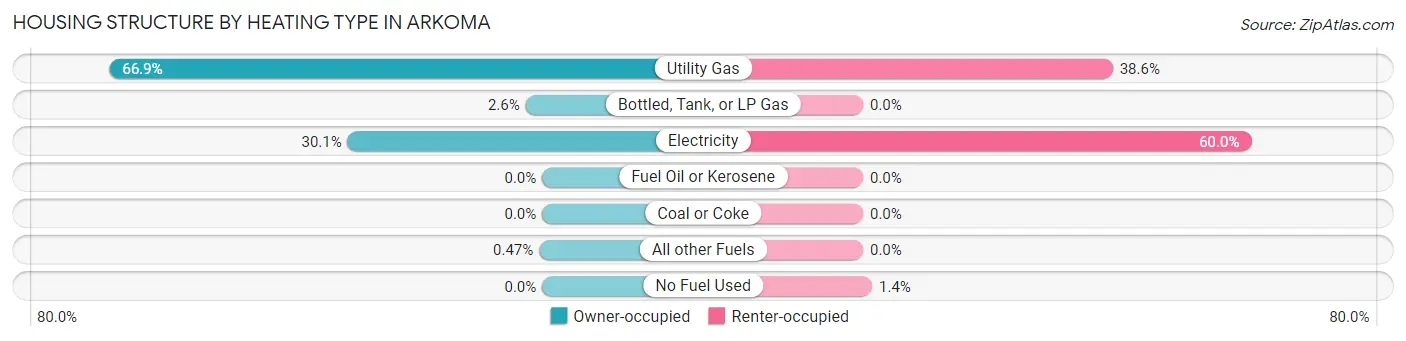
| Heating Type | Owner-occupied | Renter-occupied |
| Utility Gas | 287 (66.9%) | 110 (38.6%) |
| Bottled, Tank, or LP Gas | 11 (2.6%) | 0 (0.0%) |
| Electricity | 129 (30.1%) | 171 (60.0%) |
| Fuel Oil or Kerosene | 0 (0.0%) | 0 (0.0%) |
| Coal or Coke | 0 (0.0%) | 0 (0.0%) |
| All other Fuels | 2 (0.5%) | 0 (0.0%) |
| No Fuel Used | 0 (0.0%) | 4 (1.4%) |
| Total | 429 (100.0%) | 285 (100.0%) |
Household Vehicle Usage in Arkoma
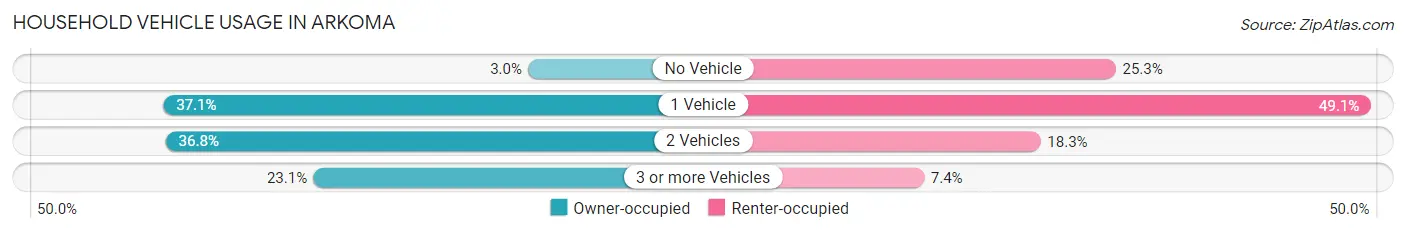
| Vehicles per Household | Owner-occupied | Renter-occupied |
| No Vehicle | 13 (3.0%) | 72 (25.3%) |
| 1 Vehicle | 159 (37.1%) | 140 (49.1%) |
| 2 Vehicles | 158 (36.8%) | 52 (18.2%) |
| 3 or more Vehicles | 99 (23.1%) | 21 (7.4%) |
| Total | 429 (100.0%) | 285 (100.0%) |
Real Estate & Mortgages in Arkoma
Real Estate and Mortgage Overview in Arkoma
| Characteristic | Without Mortgage | With Mortgage |
| Housing Units | 246 | 183 |
| Median Property Value | $45,900 | $88,900 |
| Median Household Income | $34,167 | $7 |
| Monthly Housing Costs | $281 | $0 |
| Real Estate Taxes | $248 | $23 |
Property Value by Mortgage Status in Arkoma
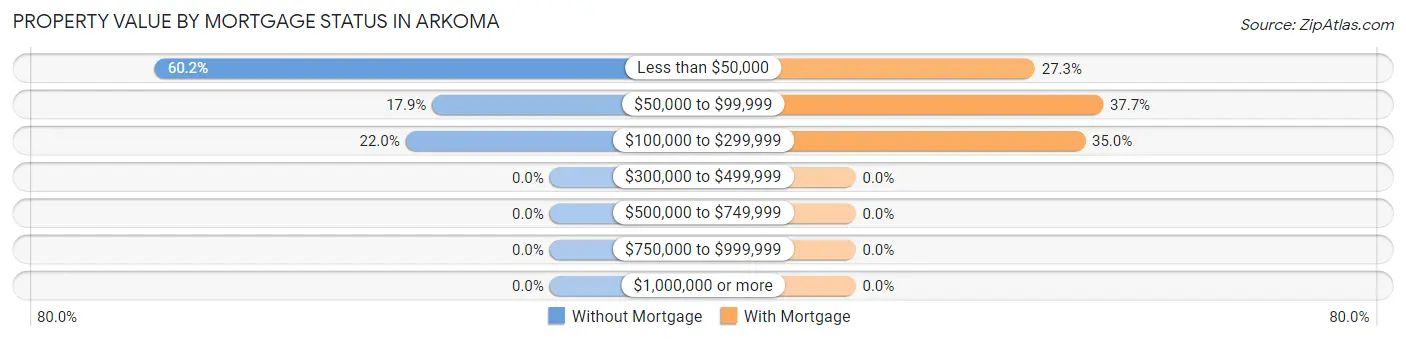
| Property Value | Without Mortgage | With Mortgage |
| Less than $50,000 | 148 (60.2%) | 50 (27.3%) |
| $50,000 to $99,999 | 44 (17.9%) | 69 (37.7%) |
| $100,000 to $299,999 | 54 (22.0%) | 64 (35.0%) |
| $300,000 to $499,999 | 0 (0.0%) | 0 (0.0%) |
| $500,000 to $749,999 | 0 (0.0%) | 0 (0.0%) |
| $750,000 to $999,999 | 0 (0.0%) | 0 (0.0%) |
| $1,000,000 or more | 0 (0.0%) | 0 (0.0%) |
| Total | 246 (100.0%) | 183 (100.0%) |
Household Income by Mortgage Status in Arkoma
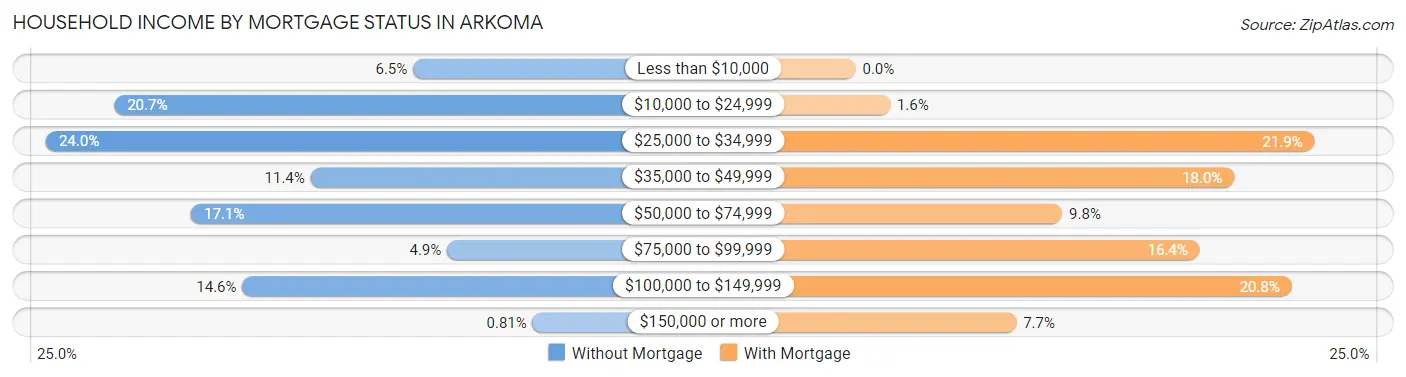
| Household Income | Without Mortgage | With Mortgage |
| Less than $10,000 | 16 (6.5%) | 0 (0.0%) |
| $10,000 to $24,999 | 51 (20.7%) | 3 (1.6%) |
| $25,000 to $34,999 | 59 (24.0%) | 40 (21.9%) |
| $35,000 to $49,999 | 28 (11.4%) | 33 (18.0%) |
| $50,000 to $74,999 | 42 (17.1%) | 18 (9.8%) |
| $75,000 to $99,999 | 12 (4.9%) | 30 (16.4%) |
| $100,000 to $149,999 | 36 (14.6%) | 38 (20.8%) |
| $150,000 or more | 2 (0.8%) | 14 (7.6%) |
| Total | 246 (100.0%) | 183 (100.0%) |
Property Value to Household Income Ratio in Arkoma
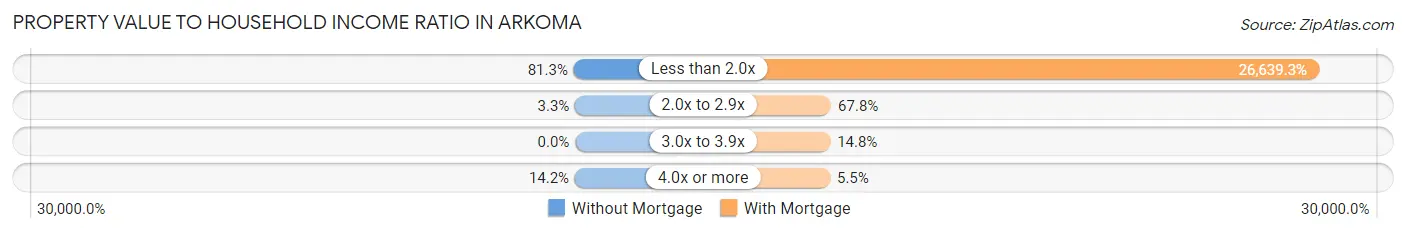
| Value-to-Income Ratio | Without Mortgage | With Mortgage |
| Less than 2.0x | 200 (81.3%) | 48,750 (26,639.3%) |
| 2.0x to 2.9x | 8 (3.3%) | 124 (67.8%) |
| 3.0x to 3.9x | 0 (0.0%) | 27 (14.7%) |
| 4.0x or more | 35 (14.2%) | 10 (5.5%) |
| Total | 246 (100.0%) | 183 (100.0%) |
Real Estate Taxes by Mortgage Status in Arkoma
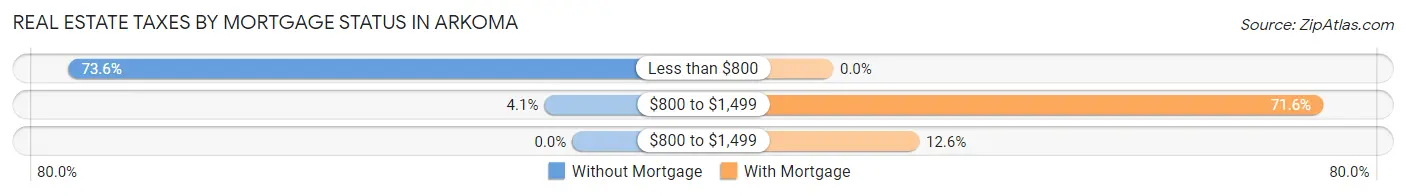
| Property Taxes | Without Mortgage | With Mortgage |
| Less than $800 | 181 (73.6%) | 0 (0.0%) |
| $800 to $1,499 | 10 (4.1%) | 131 (71.6%) |
| $800 to $1,499 | 0 (0.0%) | 23 (12.6%) |
| Total | 246 (100.0%) | 183 (100.0%) |
Health & Disability in Arkoma
Health Insurance Coverage by Age in Arkoma
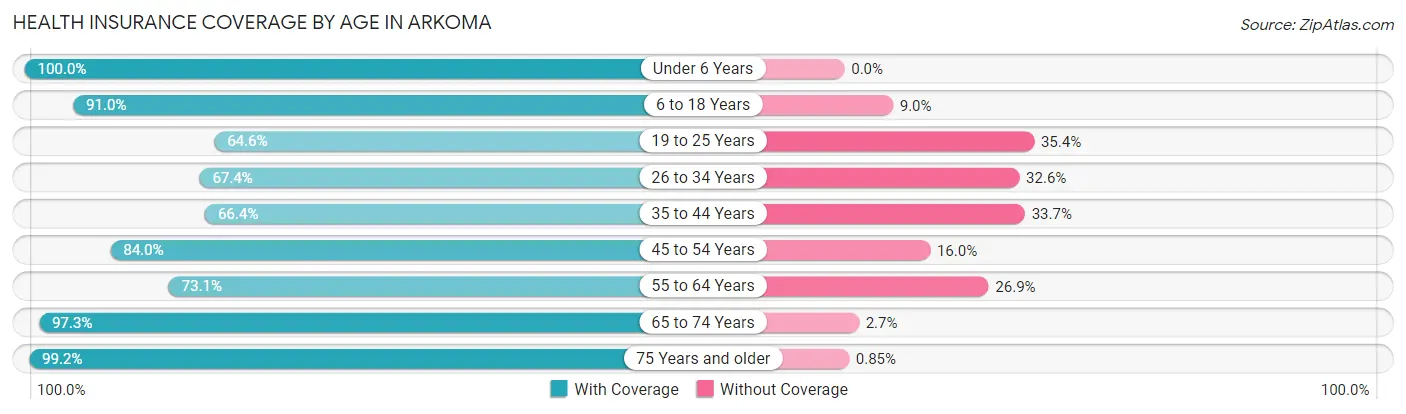
| Age Bracket | With Coverage | Without Coverage |
| Under 6 Years | 127 (100.0%) | 0 (0.0%) |
| 6 to 18 Years | 312 (91.0%) | 31 (9.0%) |
| 19 to 25 Years | 106 (64.6%) | 58 (35.4%) |
| 26 to 34 Years | 186 (67.4%) | 90 (32.6%) |
| 35 to 44 Years | 140 (66.3%) | 71 (33.7%) |
| 45 to 54 Years | 142 (84.0%) | 27 (16.0%) |
| 55 to 64 Years | 166 (73.1%) | 61 (26.9%) |
| 65 to 74 Years | 181 (97.3%) | 5 (2.7%) |
| 75 Years and older | 117 (99.2%) | 1 (0.9%) |
| Total | 1,477 (81.1%) | 344 (18.9%) |
Health Insurance Coverage by Citizenship Status in Arkoma
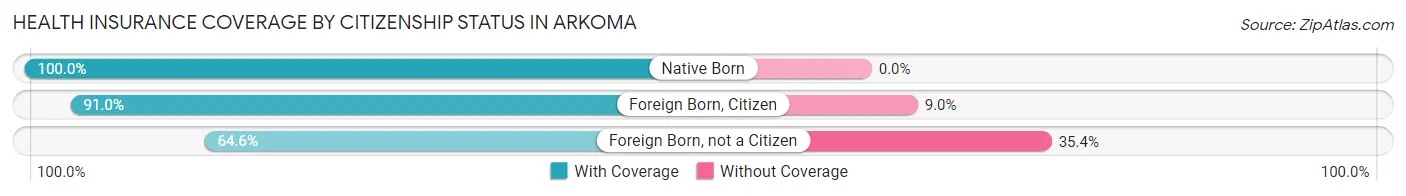
| Citizenship Status | With Coverage | Without Coverage |
| Native Born | 127 (100.0%) | 0 (0.0%) |
| Foreign Born, Citizen | 312 (91.0%) | 31 (9.0%) |
| Foreign Born, not a Citizen | 106 (64.6%) | 58 (35.4%) |
Health Insurance Coverage by Household Income in Arkoma
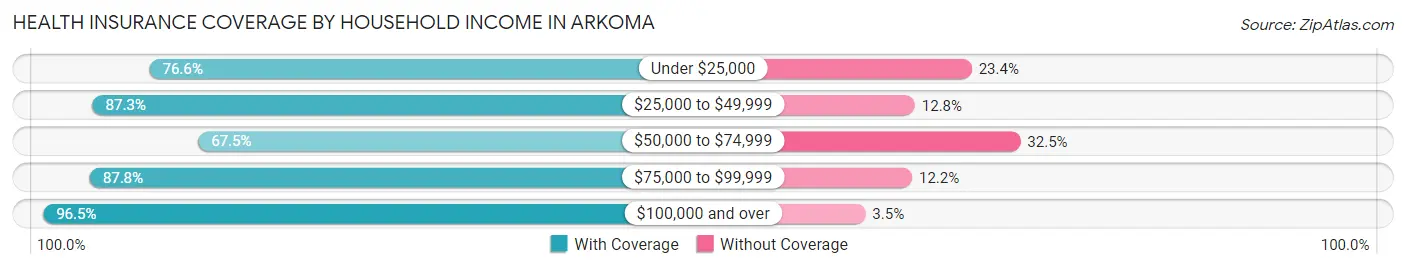
| Household Income | With Coverage | Without Coverage |
| Under $25,000 | 373 (76.6%) | 114 (23.4%) |
| $25,000 to $49,999 | 438 (87.3%) | 64 (12.8%) |
| $50,000 to $74,999 | 280 (67.5%) | 135 (32.5%) |
| $75,000 to $99,999 | 165 (87.8%) | 23 (12.2%) |
| $100,000 and over | 221 (96.5%) | 8 (3.5%) |
Public vs Private Health Insurance Coverage by Age in Arkoma
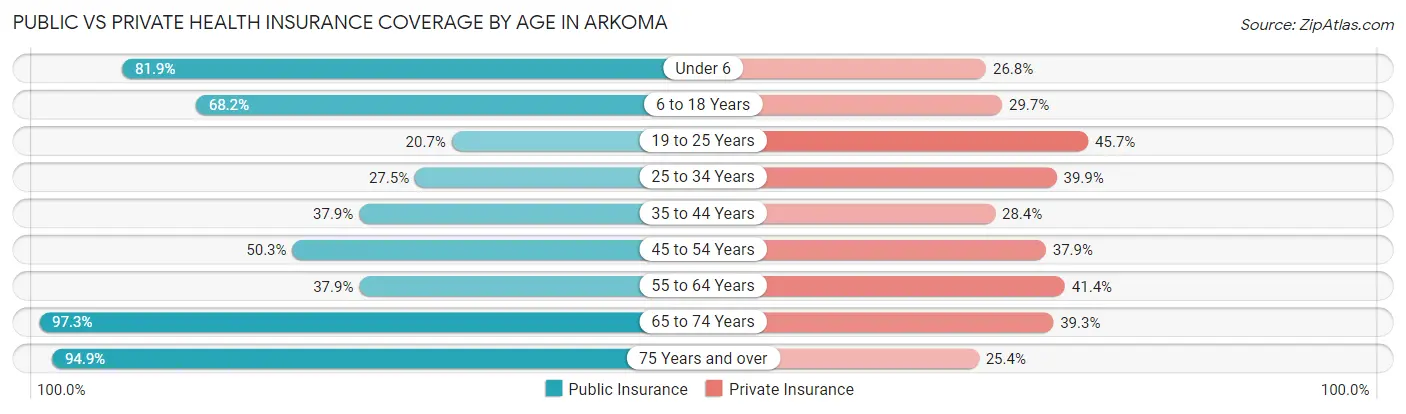
| Age Bracket | Public Insurance | Private Insurance |
| Under 6 | 104 (81.9%) | 34 (26.8%) |
| 6 to 18 Years | 234 (68.2%) | 102 (29.7%) |
| 19 to 25 Years | 34 (20.7%) | 75 (45.7%) |
| 25 to 34 Years | 76 (27.5%) | 110 (39.9%) |
| 35 to 44 Years | 80 (37.9%) | 60 (28.4%) |
| 45 to 54 Years | 85 (50.3%) | 64 (37.9%) |
| 55 to 64 Years | 86 (37.9%) | 94 (41.4%) |
| 65 to 74 Years | 181 (97.3%) | 73 (39.3%) |
| 75 Years and over | 112 (94.9%) | 30 (25.4%) |
| Total | 992 (54.5%) | 642 (35.3%) |
Disability Status by Sex by Age in Arkoma
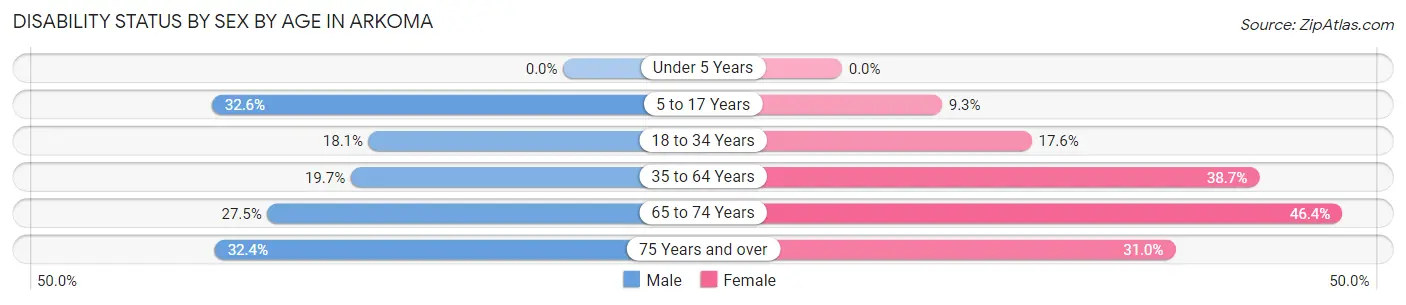
| Age Bracket | Male | Female |
| Under 5 Years | 0 (0.0%) | 0 (0.0%) |
| 5 to 17 Years | 46 (32.6%) | 18 (9.3%) |
| 18 to 34 Years | 50 (18.0%) | 31 (17.6%) |
| 35 to 64 Years | 55 (19.7%) | 127 (38.7%) |
| 65 to 74 Years | 28 (27.5%) | 39 (46.4%) |
| 75 Years and over | 11 (32.4%) | 26 (30.9%) |
Disability Class by Sex by Age in Arkoma
Disability Class: Hearing Difficulty
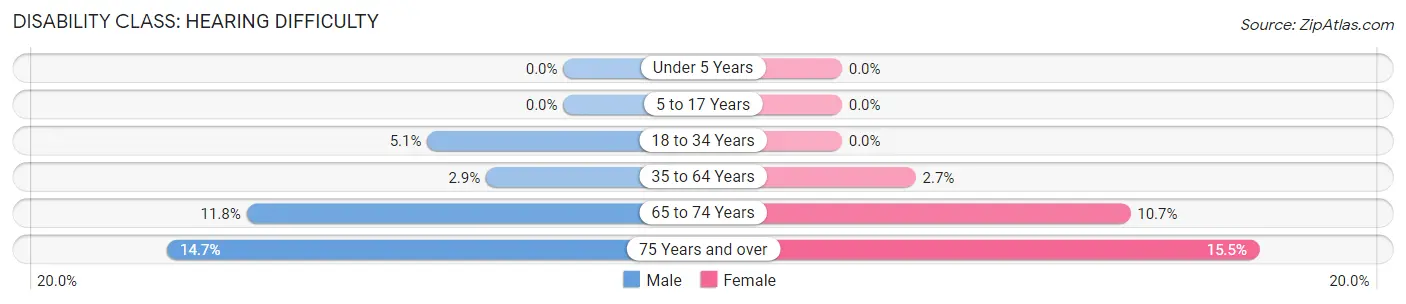
| Age Bracket | Male | Female |
| Under 5 Years | 0 (0.0%) | 0 (0.0%) |
| 5 to 17 Years | 0 (0.0%) | 0 (0.0%) |
| 18 to 34 Years | 14 (5.1%) | 0 (0.0%) |
| 35 to 64 Years | 8 (2.9%) | 9 (2.7%) |
| 65 to 74 Years | 12 (11.8%) | 9 (10.7%) |
| 75 Years and over | 5 (14.7%) | 13 (15.5%) |
Disability Class: Vision Difficulty
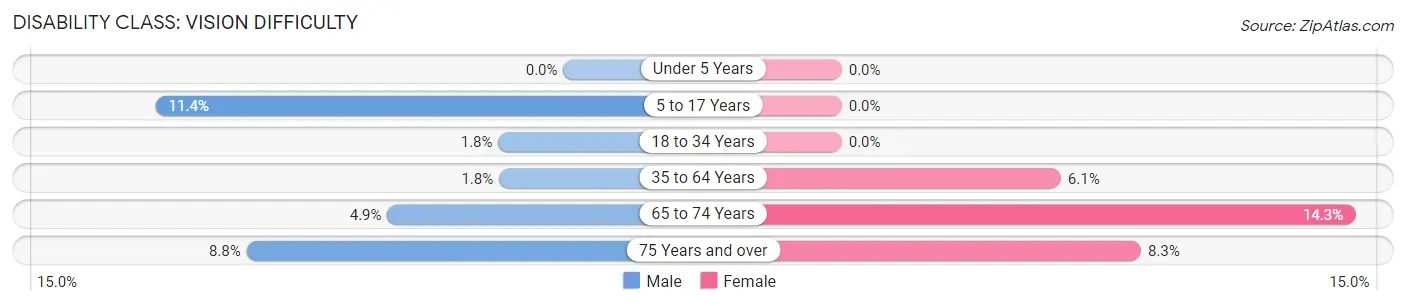
| Age Bracket | Male | Female |
| Under 5 Years | 0 (0.0%) | 0 (0.0%) |
| 5 to 17 Years | 16 (11.4%) | 0 (0.0%) |
| 18 to 34 Years | 5 (1.8%) | 0 (0.0%) |
| 35 to 64 Years | 5 (1.8%) | 20 (6.1%) |
| 65 to 74 Years | 5 (4.9%) | 12 (14.3%) |
| 75 Years and over | 3 (8.8%) | 7 (8.3%) |
Disability Class: Cognitive Difficulty
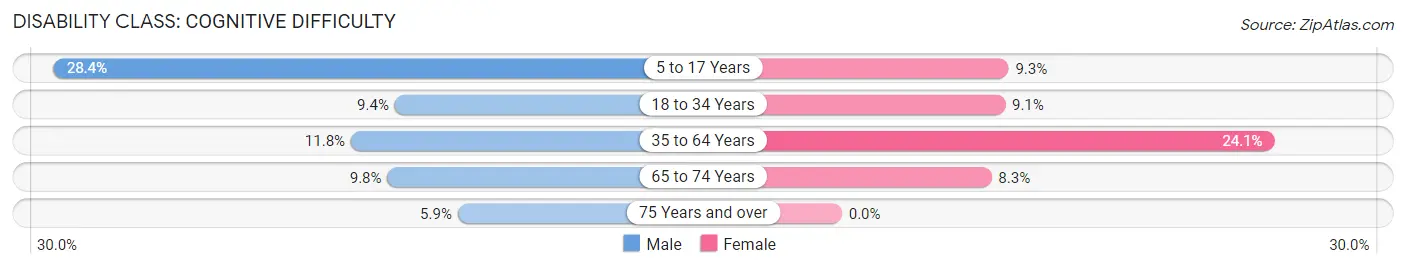
| Age Bracket | Male | Female |
| 5 to 17 Years | 40 (28.4%) | 18 (9.3%) |
| 18 to 34 Years | 26 (9.4%) | 16 (9.1%) |
| 35 to 64 Years | 33 (11.8%) | 79 (24.1%) |
| 65 to 74 Years | 10 (9.8%) | 7 (8.3%) |
| 75 Years and over | 2 (5.9%) | 0 (0.0%) |
Disability Class: Ambulatory Difficulty
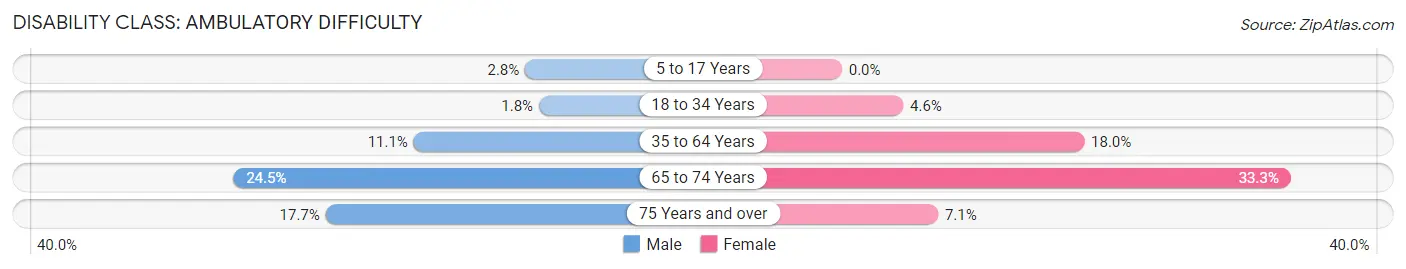
| Age Bracket | Male | Female |
| 5 to 17 Years | 4 (2.8%) | 0 (0.0%) |
| 18 to 34 Years | 5 (1.8%) | 8 (4.5%) |
| 35 to 64 Years | 31 (11.1%) | 59 (18.0%) |
| 65 to 74 Years | 25 (24.5%) | 28 (33.3%) |
| 75 Years and over | 6 (17.6%) | 6 (7.1%) |
Disability Class: Self-Care Difficulty
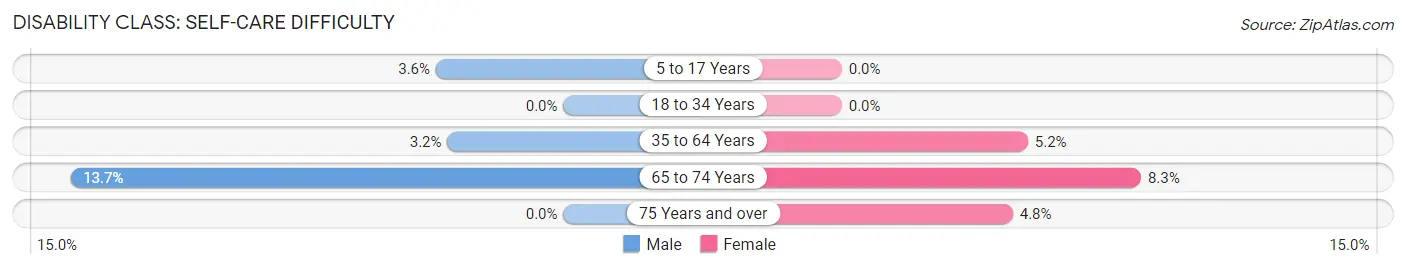
| Age Bracket | Male | Female |
| 5 to 17 Years | 5 (3.5%) | 0 (0.0%) |
| 18 to 34 Years | 0 (0.0%) | 0 (0.0%) |
| 35 to 64 Years | 9 (3.2%) | 17 (5.2%) |
| 65 to 74 Years | 14 (13.7%) | 7 (8.3%) |
| 75 Years and over | 0 (0.0%) | 4 (4.8%) |
Technology Access in Arkoma
Computing Device Access in Arkoma
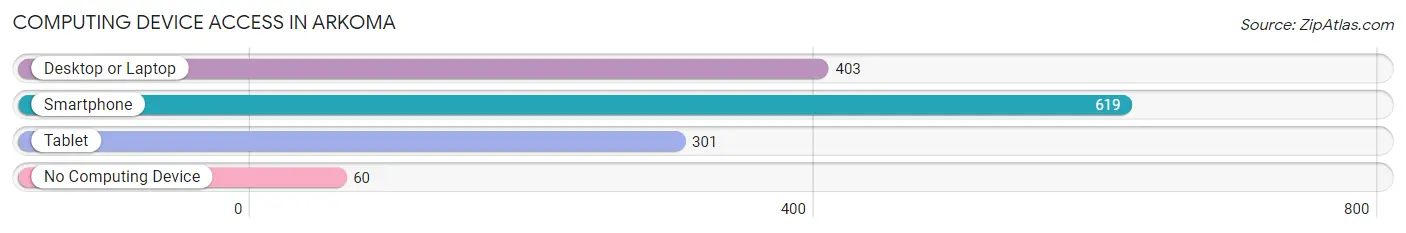
| Device Type | # Households | % Households |
| Desktop or Laptop | 403 | 56.4% |
| Smartphone | 619 | 86.7% |
| Tablet | 301 | 42.2% |
| No Computing Device | 60 | 8.4% |
| Total | 714 | 100.0% |
Internet Access in Arkoma
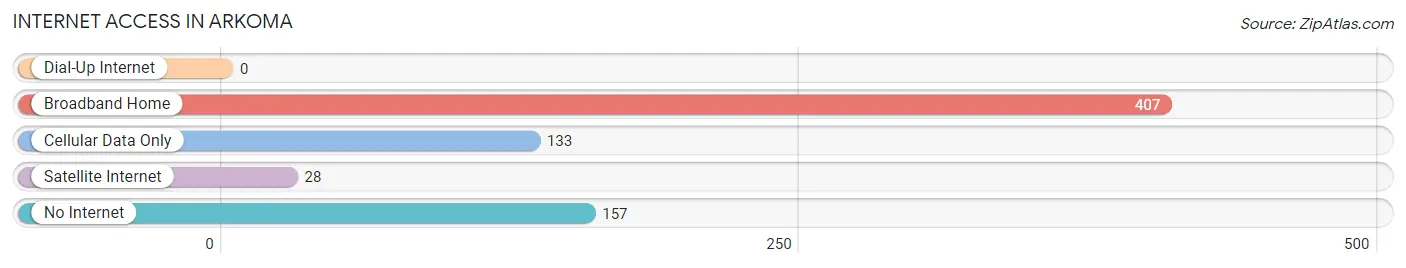
| Internet Type | # Households | % Households |
| Dial-Up Internet | 0 | 0.0% |
| Broadband Home | 407 | 57.0% |
| Cellular Data Only | 133 | 18.6% |
| Satellite Internet | 28 | 3.9% |
| No Internet | 157 | 22.0% |
| Total | 714 | 100.0% |
Arkoma Summary
History
The town of Arkoma, Oklahoma is located in LeFlore County in the southeastern corner of the state. It was founded in 1894 by the Choctaw Nation and named after the nearby Arkoma Creek. The town was originally a farming community, but it soon became a center for oil and gas production. The first oil well was drilled in the area in 1901, and by the 1920s, Arkoma had become a major oil and gas producer.
The town experienced a boom in the 1950s and 1960s, when the oil and gas industry was at its peak. During this time, Arkoma was home to several large oil and gas companies, including Phillips Petroleum, Texaco, and Gulf Oil. The town also had a thriving business district, with several stores, restaurants, and other businesses.
In the 1970s, the oil and gas industry began to decline, and Arkoma’s economy suffered. Many of the businesses closed, and the population began to decline. In the 1980s, the town began to experience a resurgence, as new businesses opened and the population began to grow again.
Today, Arkoma is a small town with a population of about 1,500. It is still a center for oil and gas production, and many of the businesses that opened during the town’s resurgence are still in operation.
Geography
Arkoma is located in the southeastern corner of Oklahoma, in LeFlore County. It is situated on the Arkansas River, about 20 miles south of Fort Smith, Arkansas. The town is surrounded by rolling hills and wooded areas, and is located in a region known as the Ozark Mountains.
The climate in Arkoma is generally mild, with hot summers and cold winters. The average annual temperature is around 60 degrees Fahrenheit, and the average annual precipitation is around 40 inches.
Economy
Arkoma’s economy is largely based on oil and gas production. The town is home to several oil and gas companies, including Phillips Petroleum, Texaco, and Gulf Oil. These companies employ a large number of people in the area, and the town’s economy is heavily dependent on the oil and gas industry.
In addition to oil and gas production, Arkoma is also home to several other businesses, including restaurants, stores, and other services. The town also has a small manufacturing sector, which produces a variety of products, including furniture and clothing.
Demographics
As of the 2010 census, the population of Arkoma was 1,521. The racial makeup of the town was 94.3% White, 0.7% African American, 0.3% Native American, 0.2% Asian, 0.1% Pacific Islander, and 4.4% from other races. The median household income was $31,250, and the median family income was $37,500.
The town is served by the Arkoma Public School District, which includes one elementary school, one middle school, and one high school. The town also has a library, a post office, and several churches.
Conclusion
Arkoma, Oklahoma is a small town located in the southeastern corner of the state. It was founded in 1894 and is still a center for oil and gas production. The town has a population of about 1,500 and is served by the Arkoma Public School District. The town’s economy is largely based on oil and gas production, but it also has a small manufacturing sector and several other businesses.
Common Questions
What is Per Capita Income in Arkoma?
Per Capita income in Arkoma is $20,024.
What is the Median Family Income in Arkoma?
Median Family Income in Arkoma is $43,500.
What is the Median Household income in Arkoma?
Median Household Income in Arkoma is $33,500.
What is Income or Wage Gap in Arkoma?
Income or Wage Gap in Arkoma is 39.7%.
Women in Arkoma earn 60.3 cents for every dollar earned by a man.
What is Inequality or Gini Index in Arkoma?
Inequality or Gini Index in Arkoma is 0.47.
What is the Total Population of Arkoma?
Total Population of Arkoma is 1,866.
What is the Total Male Population of Arkoma?
Total Male Population of Arkoma is 901.
What is the Total Female Population of Arkoma?
Total Female Population of Arkoma is 965.
What is the Ratio of Males per 100 Females in Arkoma?
There are 93.37 Males per 100 Females in Arkoma.
What is the Ratio of Females per 100 Males in Arkoma?
There are 107.10 Females per 100 Males in Arkoma.
What is the Median Population Age in Arkoma?
Median Population Age in Arkoma is 35.3 Years.
What is the Average Family Size in Arkoma
Average Family Size in Arkoma is 3.4 People.
What is the Average Household Size in Arkoma
Average Household Size in Arkoma is 2.6 People.
How Large is the Labor Force in Arkoma?
There are 751 People in the Labor Forcein in Arkoma.
What is the Percentage of People in the Labor Force in Arkoma?
52.3% of People are in the Labor Force in Arkoma.
What is the Unemployment Rate in Arkoma?
Unemployment Rate in Arkoma is 10.5%.