Allen, OK Map & Demographics
Allen Map
Allen Overview
$21,359
PER CAPITA INCOME
$46,250
AVG FAMILY INCOME
$38,988
AVG HOUSEHOLD INCOME
27.9%
WAGE / INCOME GAP [ % ]
72.1¢/ $1
WAGE / INCOME GAP [ $ ]
0.40
INEQUALITY / GINI INDEX
930
TOTAL POPULATION
448
MALE POPULATION
482
FEMALE POPULATION
92.95
MALES / 100 FEMALES
107.59
FEMALES / 100 MALES
37.6
MEDIAN AGE
2.8
AVG FAMILY SIZE
2.5
AVG HOUSEHOLD SIZE
353
LABOR FORCE [ PEOPLE ]
50.4%
PERCENT IN LABOR FORCE
7.1%
UNEMPLOYMENT RATE
Allen Zip Codes
Allen Area Codes
Income in Allen
Income Overview in Allen
Per Capita Income in Allen is $21,359, while median incomes of families and households are $46,250 and $38,988 respectively.
| Characteristic | Number | Measure |
| Per Capita Income | 930 | $21,359 |
| Median Family Income | 271 | $46,250 |
| Mean Family Income | 271 | $58,023 |
| Median Household Income | 353 | $38,988 |
| Mean Household Income | 353 | $52,300 |
| Income Deficit | 271 | $0 |
| Wage / Income Gap (%) | 930 | 27.94% |
| Wage / Income Gap ($) | 930 | 72.06¢ per $1 |
| Gini / Inequality Index | 930 | 0.40 |
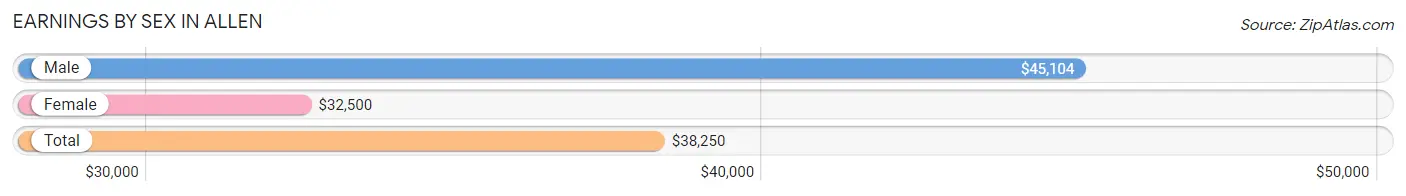
Earnings by Sex in Allen
Average Earnings in Allen are $38,250, $45,104 for men and $32,500 for women, a difference of 27.9%.
| Sex | Number | Average Earnings |
| Male | 173 (49.9%) | $45,104 |
| Female | 174 (50.1%) | $32,500 |
| Total | 347 (100.0%) | $38,250 |
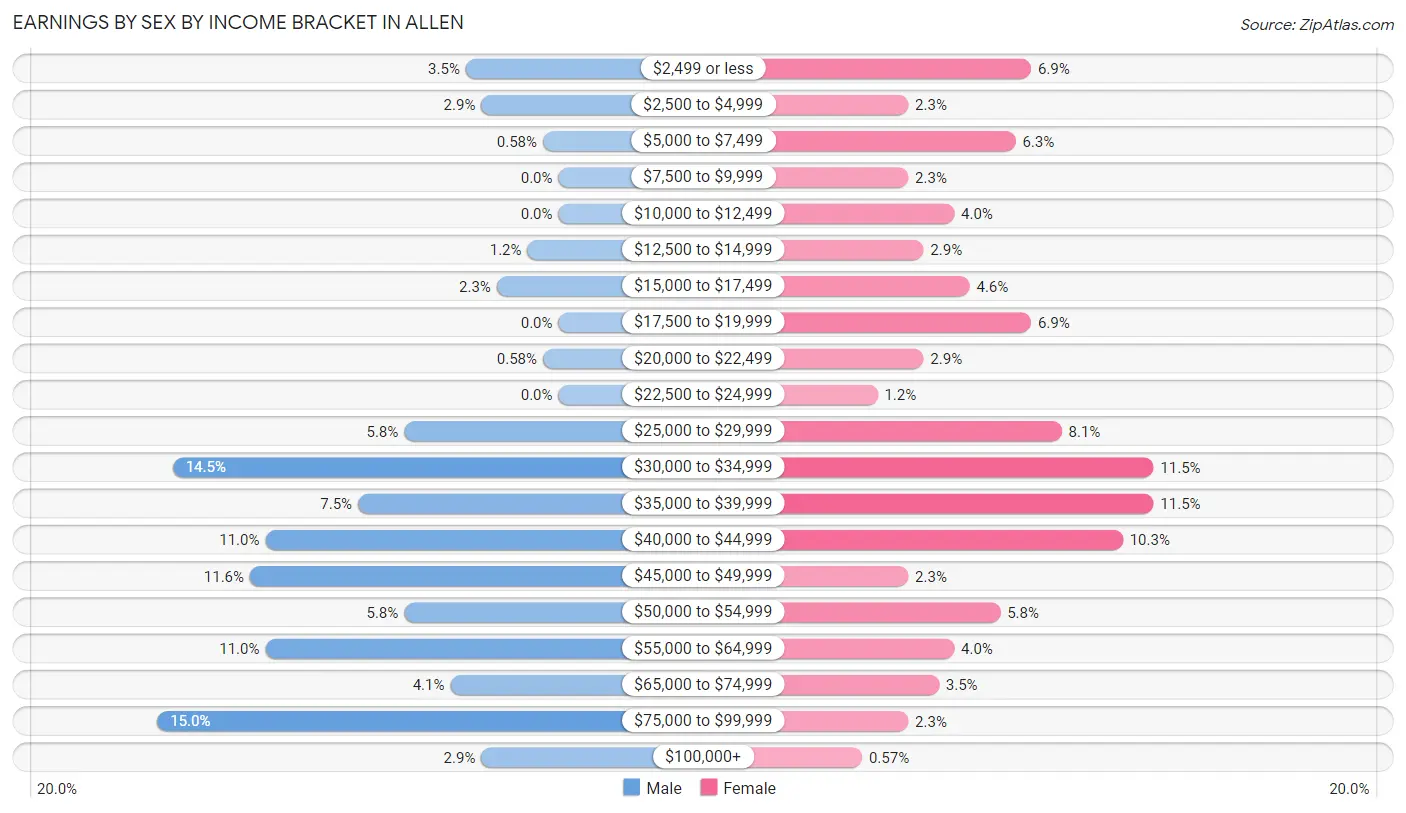
Earnings by Sex by Income Bracket in Allen
The most common earnings brackets in Allen are $75,000 to $99,999 for men (26 | 15.0%) and $30,000 to $34,999 for women (20 | 11.5%).
| Income | Male | Female |
| $2,499 or less | 6 (3.5%) | 12 (6.9%) |
| $2,500 to $4,999 | 5 (2.9%) | 4 (2.3%) |
| $5,000 to $7,499 | 1 (0.6%) | 11 (6.3%) |
| $7,500 to $9,999 | 0 (0.0%) | 4 (2.3%) |
| $10,000 to $12,499 | 0 (0.0%) | 7 (4.0%) |
| $12,500 to $14,999 | 2 (1.2%) | 5 (2.9%) |
| $15,000 to $17,499 | 4 (2.3%) | 8 (4.6%) |
| $17,500 to $19,999 | 0 (0.0%) | 12 (6.9%) |
| $20,000 to $22,499 | 1 (0.6%) | 5 (2.9%) |
| $22,500 to $24,999 | 0 (0.0%) | 2 (1.1%) |
| $25,000 to $29,999 | 10 (5.8%) | 14 (8.1%) |
| $30,000 to $34,999 | 25 (14.4%) | 20 (11.5%) |
| $35,000 to $39,999 | 13 (7.5%) | 20 (11.5%) |
| $40,000 to $44,999 | 19 (11.0%) | 18 (10.3%) |
| $45,000 to $49,999 | 20 (11.6%) | 4 (2.3%) |
| $50,000 to $54,999 | 10 (5.8%) | 10 (5.8%) |
| $55,000 to $64,999 | 19 (11.0%) | 7 (4.0%) |
| $65,000 to $74,999 | 7 (4.1%) | 6 (3.5%) |
| $75,000 to $99,999 | 26 (15.0%) | 4 (2.3%) |
| $100,000+ | 5 (2.9%) | 1 (0.6%) |
| Total | 173 (100.0%) | 174 (100.0%) |
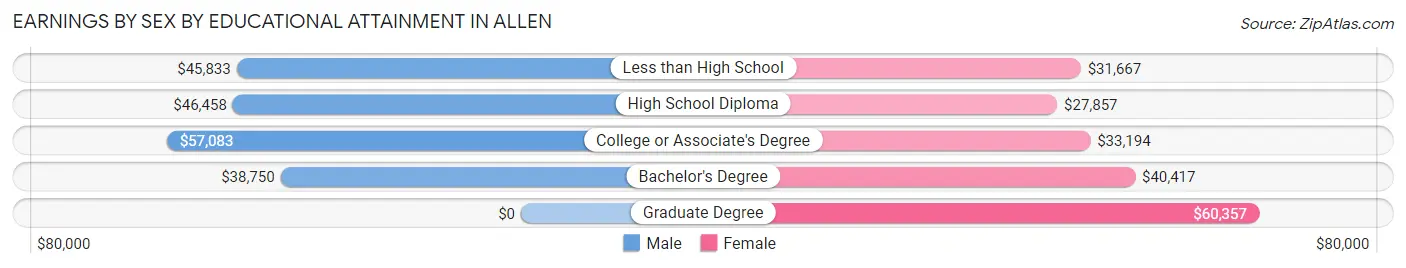
Earnings by Sex by Educational Attainment in Allen
Average earnings in Allen are $46,458 for men and $33,214 for women, a difference of 28.5%. Men with an educational attainment of college or associate's degree enjoy the highest average annual earnings of $57,083, while those with bachelor's degree education earn the least with $38,750. Women with an educational attainment of graduate degree earn the most with the average annual earnings of $60,357, while those with high school diploma education have the smallest earnings of $27,857.
| Educational Attainment | Male Income | Female Income |
| Less than High School | $45,833 | $31,667 |
| High School Diploma | $46,458 | $27,857 |
| College or Associate's Degree | $57,083 | $33,194 |
| Bachelor's Degree | $38,750 | $40,417 |
| Graduate Degree | - | - |
| Total | $46,458 | $33,214 |
Family Income in Allen
Family Income Brackets in Allen
According to the Allen family income data, there are 73 families falling into the $15,000 to $24,999 income range, which is the most common income bracket and makes up 26.9% of all families. Conversely, the $150,000 to $199,999 income bracket is the least frequent group with only 1 families (0.4%) belonging to this category.
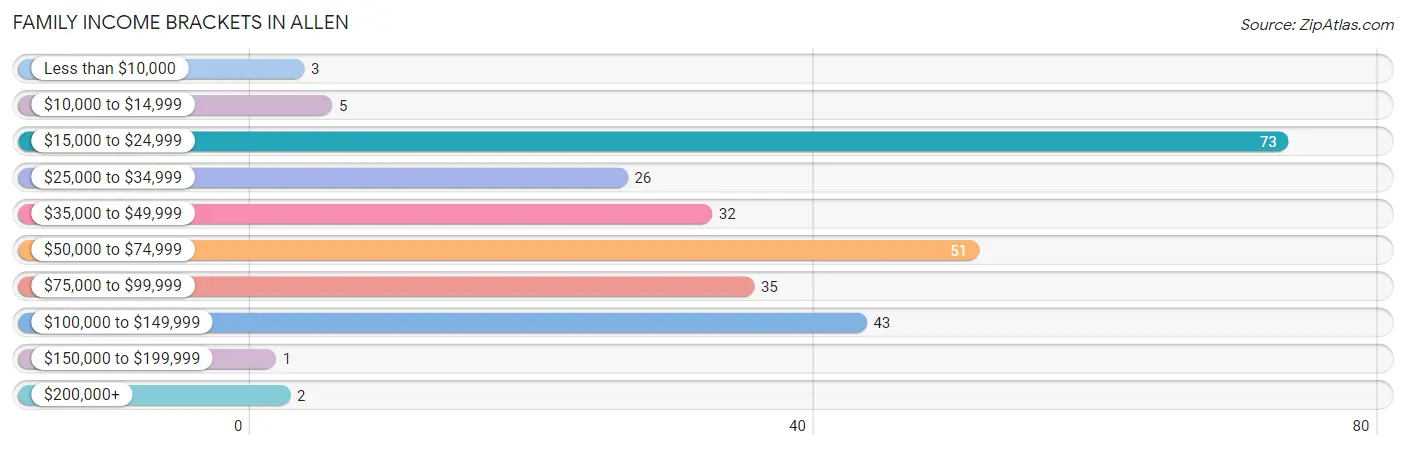
| Income Bracket | # Families | % Families |
| Less than $10,000 | 3 | 1.1% |
| $10,000 to $14,999 | 5 | 1.8% |
| $15,000 to $24,999 | 73 | 26.9% |
| $25,000 to $34,999 | 26 | 9.6% |
| $35,000 to $49,999 | 32 | 11.8% |
| $50,000 to $74,999 | 51 | 18.8% |
| $75,000 to $99,999 | 35 | 12.9% |
| $100,000 to $149,999 | 43 | 15.9% |
| $150,000 to $199,999 | 1 | 0.4% |
| $200,000+ | 2 | 0.7% |
Family Income by Famaliy Size in Allen
5-person families (25 | 9.2%) account for the highest median family income in Allen with $65,417 per family, while 2-person families (89 | 32.8%) have the highest median income of $27,292 per family member.
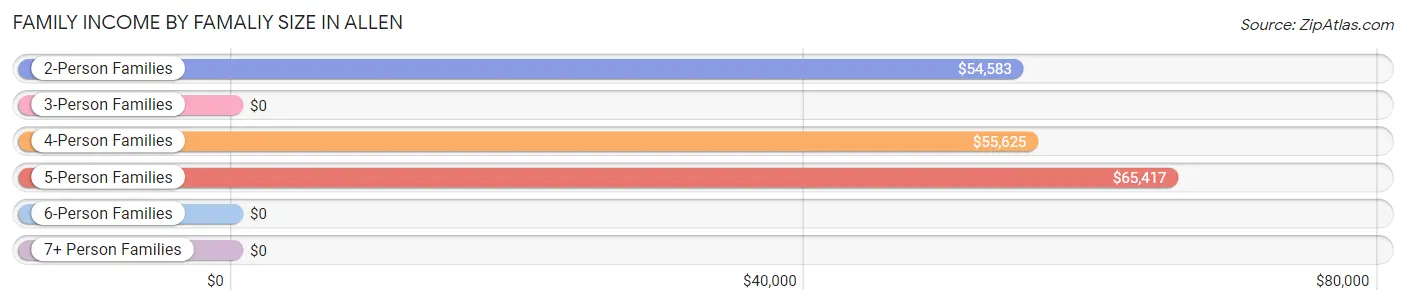
| Income Bracket | # Families | Median Income |
| 2-Person Families | 89 (32.8%) | $54,583 |
| 3-Person Families | 108 (39.9%) | $0 |
| 4-Person Families | 45 (16.6%) | $55,625 |
| 5-Person Families | 25 (9.2%) | $65,417 |
| 6-Person Families | 2 (0.7%) | $0 |
| 7+ Person Families | 2 (0.7%) | $0 |
| Total | 271 (100.0%) | $46,250 |
Family Income by Number of Earners in Allen
The median family income in Allen is $46,250, with families comprising 3+ earners (13) having the highest median family income of $111,875, while families with no earners (86) have the lowest median family income of $21,545, accounting for 4.8% and 31.7% of families, respectively.
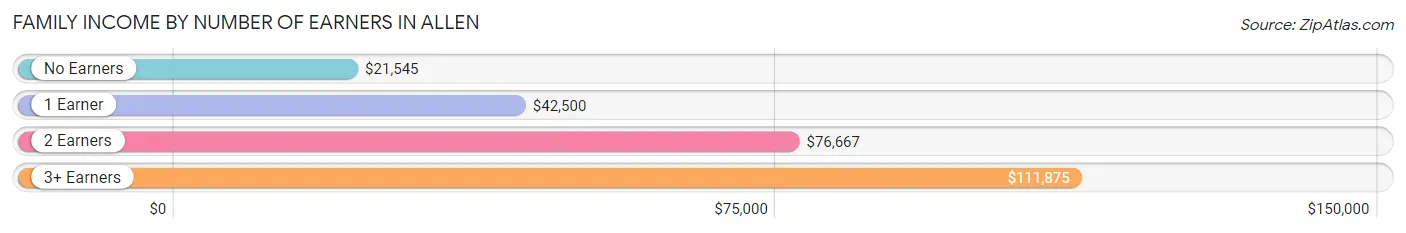
| Number of Earners | # Families | Median Income |
| No Earners | 86 (31.7%) | $21,545 |
| 1 Earner | 98 (36.2%) | $42,500 |
| 2 Earners | 74 (27.3%) | $76,667 |
| 3+ Earners | 13 (4.8%) | $111,875 |
| Total | 271 (100.0%) | $46,250 |
Household Income in Allen
Household Income Brackets in Allen
With 93 households falling in the category, the $15,000 to $24,999 income range is the most frequent in Allen, accounting for 26.4% of all households. In contrast, only 1 households (0.3%) fall into the $150,000 to $199,999 income bracket, making it the least populous group.
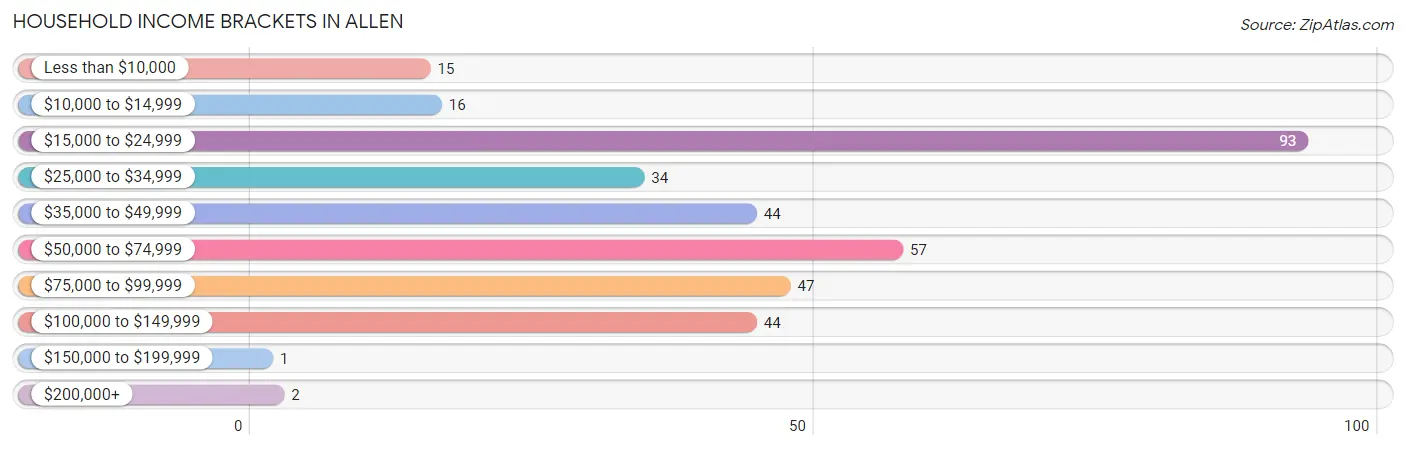
| Income Bracket | # Households | % Households |
| Less than $10,000 | 15 | 4.2% |
| $10,000 to $14,999 | 16 | 4.5% |
| $15,000 to $24,999 | 93 | 26.3% |
| $25,000 to $34,999 | 34 | 9.6% |
| $35,000 to $49,999 | 44 | 12.5% |
| $50,000 to $74,999 | 57 | 16.1% |
| $75,000 to $99,999 | 47 | 13.3% |
| $100,000 to $149,999 | 44 | 12.5% |
| $150,000 to $199,999 | 1 | 0.3% |
| $200,000+ | 2 | 0.6% |
Household Income by Householder Age in Allen
The median household income in Allen is $38,988, with the highest median household income of $75,000 found in the 45 to 64 years age bracket for the primary householder. A total of 90 households (25.5%) fall into this category. Meanwhile, the 65+ years age bracket for the primary householder has the lowest median household income of $22,146, with 143 households (40.5%) in this group.
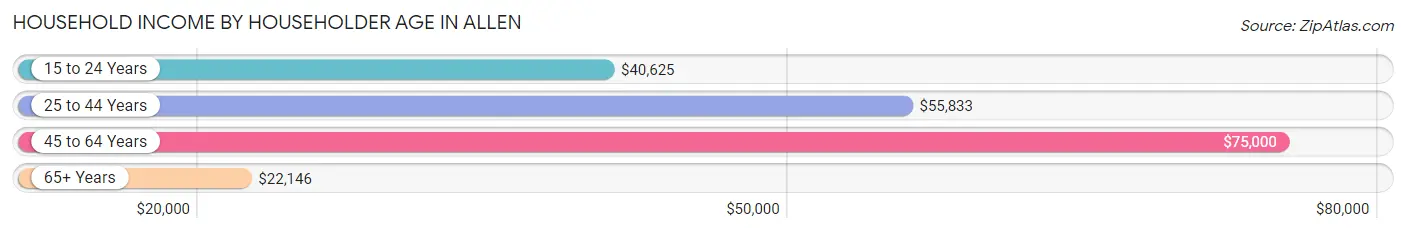
| Income Bracket | # Households | Median Income |
| 15 to 24 Years | 8 (2.3%) | $40,625 |
| 25 to 44 Years | 112 (31.7%) | $55,833 |
| 45 to 64 Years | 90 (25.5%) | $75,000 |
| 65+ Years | 143 (40.5%) | $22,146 |
| Total | 353 (100.0%) | $38,988 |
Poverty in Allen
Income Below Poverty by Sex and Age in Allen
With 22.2% poverty level for males and 25.7% for females among the residents of Allen, 75 year old and over males and 75 year old and over females are the most vulnerable to poverty, with 17 males (44.7%) and 63 females (50.8%) in their respective age groups living below the poverty level.
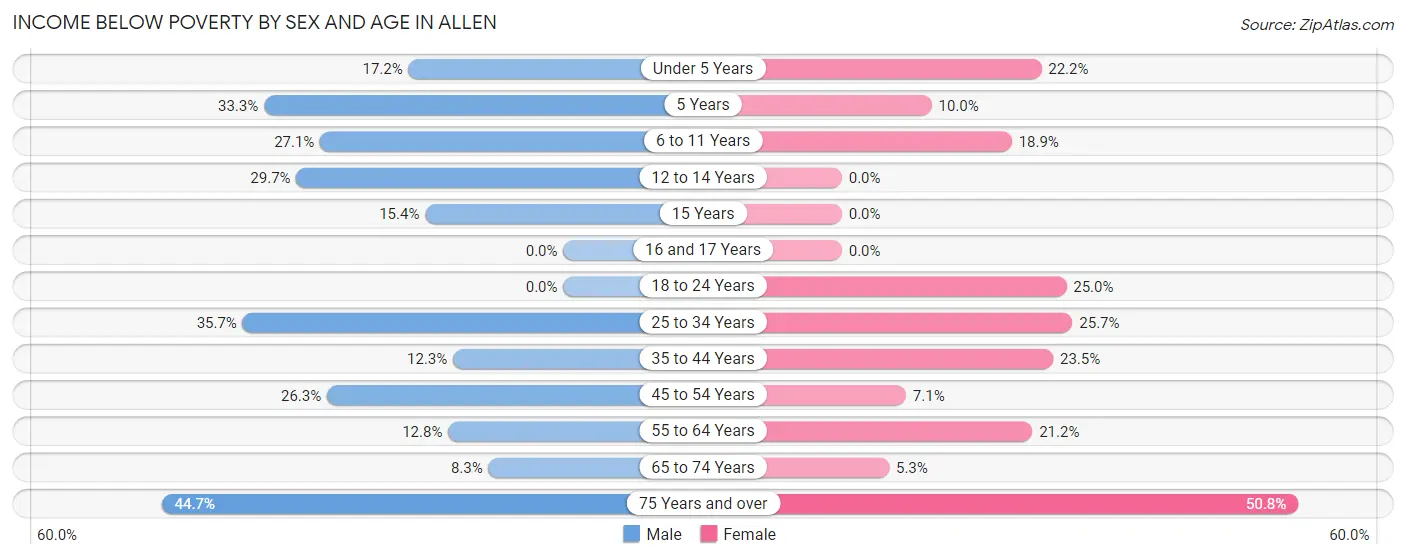
| Age Bracket | Male | Female |
| Under 5 Years | 5 (17.2%) | 4 (22.2%) |
| 5 Years | 2 (33.3%) | 1 (10.0%) |
| 6 to 11 Years | 13 (27.1%) | 7 (18.9%) |
| 12 to 14 Years | 11 (29.7%) | 0 (0.0%) |
| 15 Years | 2 (15.4%) | 0 (0.0%) |
| 16 and 17 Years | 0 (0.0%) | 0 (0.0%) |
| 18 to 24 Years | 0 (0.0%) | 4 (25.0%) |
| 25 to 34 Years | 20 (35.7%) | 19 (25.7%) |
| 35 to 44 Years | 7 (12.3%) | 12 (23.5%) |
| 45 to 54 Years | 15 (26.3%) | 3 (7.1%) |
| 55 to 64 Years | 5 (12.8%) | 7 (21.2%) |
| 65 to 74 Years | 2 (8.3%) | 2 (5.3%) |
| 75 Years and over | 17 (44.7%) | 63 (50.8%) |
| Total | 99 (22.2%) | 122 (25.7%) |
Income Above Poverty by Sex and Age in Allen
According to the poverty statistics in Allen, males aged 16 and 17 years and females aged 12 to 14 years are the age groups that are most secure financially, with 100.0% of males and 100.0% of females in these age groups living above the poverty line.
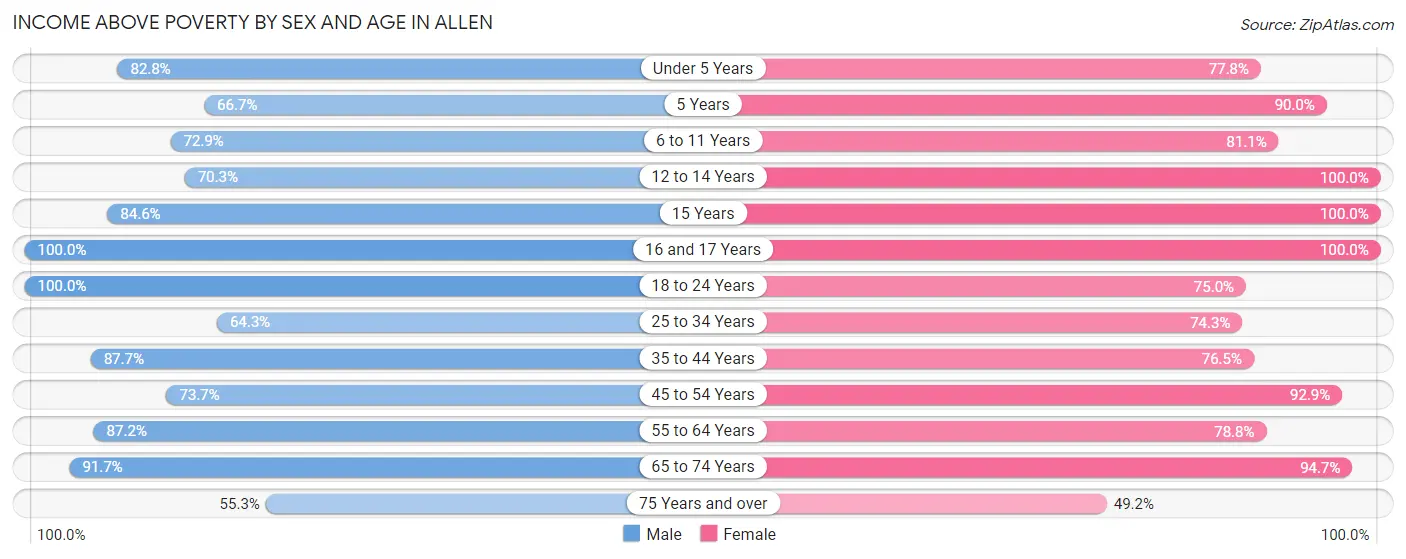
| Age Bracket | Male | Female |
| Under 5 Years | 24 (82.8%) | 14 (77.8%) |
| 5 Years | 4 (66.7%) | 9 (90.0%) |
| 6 to 11 Years | 35 (72.9%) | 30 (81.1%) |
| 12 to 14 Years | 26 (70.3%) | 19 (100.0%) |
| 15 Years | 11 (84.6%) | 7 (100.0%) |
| 16 and 17 Years | 11 (100.0%) | 6 (100.0%) |
| 18 to 24 Years | 31 (100.0%) | 12 (75.0%) |
| 25 to 34 Years | 36 (64.3%) | 55 (74.3%) |
| 35 to 44 Years | 50 (87.7%) | 39 (76.5%) |
| 45 to 54 Years | 42 (73.7%) | 39 (92.9%) |
| 55 to 64 Years | 34 (87.2%) | 26 (78.8%) |
| 65 to 74 Years | 22 (91.7%) | 36 (94.7%) |
| 75 Years and over | 21 (55.3%) | 61 (49.2%) |
| Total | 347 (77.8%) | 353 (74.3%) |
Income Below Poverty Among Married-Couple Families in Allen
The poverty statistics for married-couple families in Allen show that 11.0% or 16 of the total 145 families live below the poverty line. Families with 3 or 4 children have the highest poverty rate of 23.5%, comprising of 4 families. On the other hand, families with 1 or 2 children have the lowest poverty rate of 7.0%, which includes 4 families.
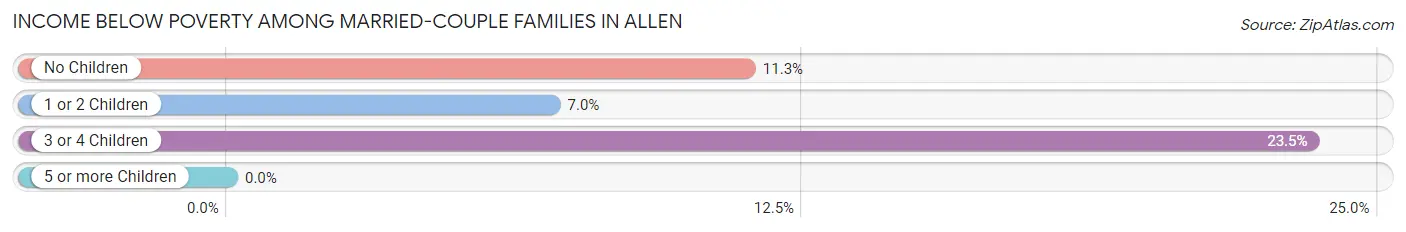
| Children | Above Poverty | Below Poverty |
| No Children | 63 (88.7%) | 8 (11.3%) |
| 1 or 2 Children | 53 (93.0%) | 4 (7.0%) |
| 3 or 4 Children | 13 (76.5%) | 4 (23.5%) |
| 5 or more Children | 0 (0.0%) | 0 (0.0%) |
| Total | 129 (89.0%) | 16 (11.0%) |
Income Below Poverty Among Single-Parent Households in Allen
According to the poverty data in Allen, 4.0% or 1 single-father households and 63.4% or 64 single-mother households are living below the poverty line. Among single-father households, those with 3 or 4 children have the highest poverty rate, with 1 households (25.0%) experiencing poverty. Likewise, among single-mother households, those with 1 or 2 children have the highest poverty rate, with 61 households (79.2%) falling below the poverty line.
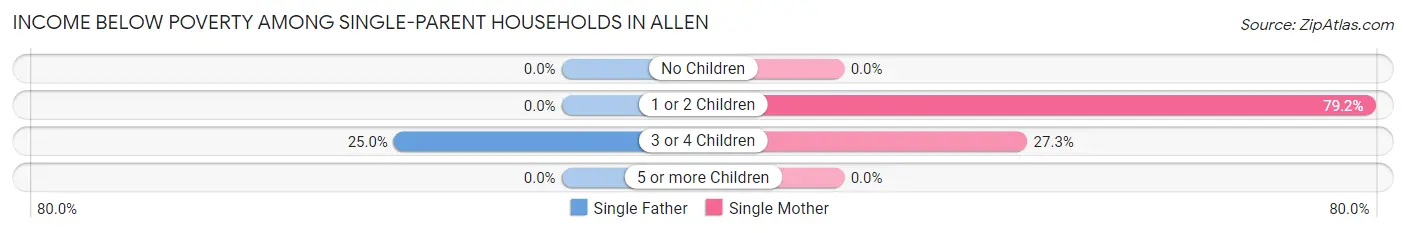
| Children | Single Father | Single Mother |
| No Children | 0 (0.0%) | 0 (0.0%) |
| 1 or 2 Children | 0 (0.0%) | 61 (79.2%) |
| 3 or 4 Children | 1 (25.0%) | 3 (27.3%) |
| 5 or more Children | 0 (0.0%) | 0 (0.0%) |
| Total | 1 (4.0%) | 64 (63.4%) |
Income Below Poverty Among Married-Couple vs Single-Parent Households in Allen
The poverty data for Allen shows that 16 of the married-couple family households (11.0%) and 65 of the single-parent households (51.6%) are living below the poverty level. Within the married-couple family households, those with 3 or 4 children have the highest poverty rate, with 4 households (23.5%) falling below the poverty line. Among the single-parent households, those with 1 or 2 children have the highest poverty rate, with 61 household (71.8%) living below poverty.
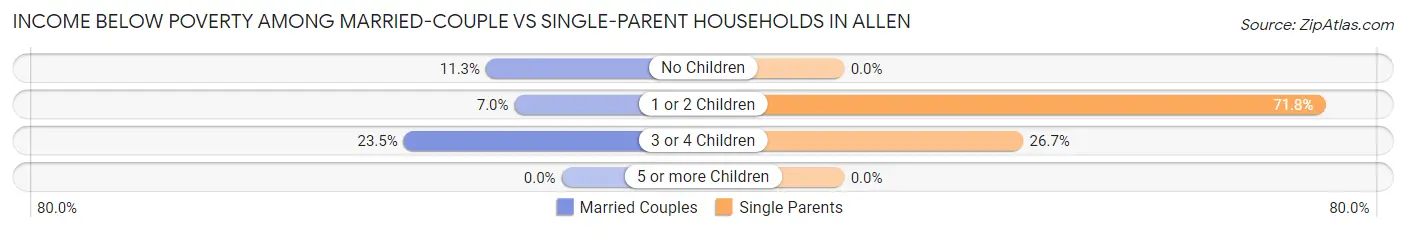
| Children | Married-Couple Families | Single-Parent Households |
| No Children | 8 (11.3%) | 0 (0.0%) |
| 1 or 2 Children | 4 (7.0%) | 61 (71.8%) |
| 3 or 4 Children | 4 (23.5%) | 4 (26.7%) |
| 5 or more Children | 0 (0.0%) | 0 (0.0%) |
| Total | 16 (11.0%) | 65 (51.6%) |
Race in Allen
The most populous races in Allen are White / Caucasian (680 | 73.1%), Native / Alaskan (162 | 17.4%), and Two or more Races (77 | 8.3%).
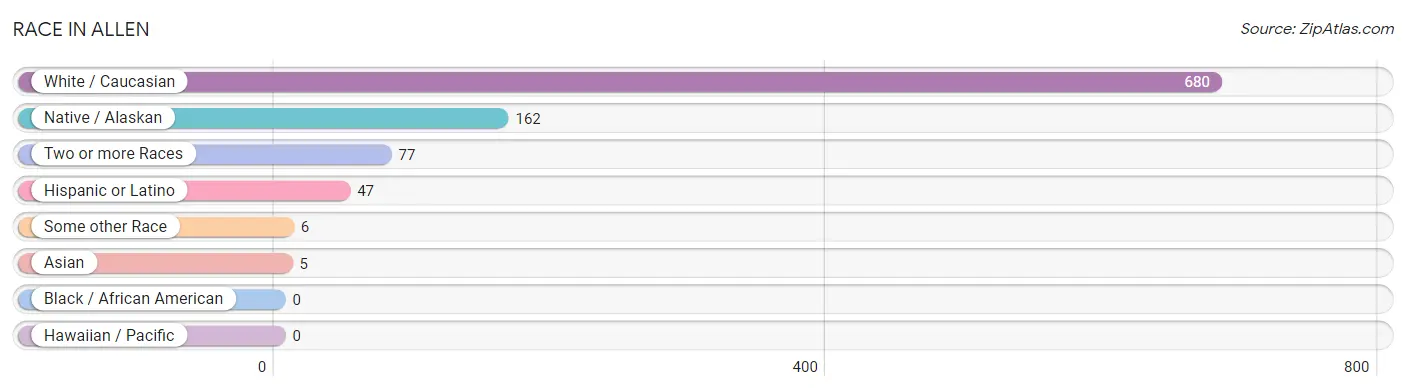
| Race | # Population | % Population |
| Asian | 5 | 0.5% |
| Black / African American | 0 | 0.0% |
| Hawaiian / Pacific | 0 | 0.0% |
| Hispanic or Latino | 47 | 5.1% |
| Native / Alaskan | 162 | 17.4% |
| White / Caucasian | 680 | 73.1% |
| Two or more Races | 77 | 8.3% |
| Some other Race | 6 | 0.6% |
| Total | 930 | 100.0% |
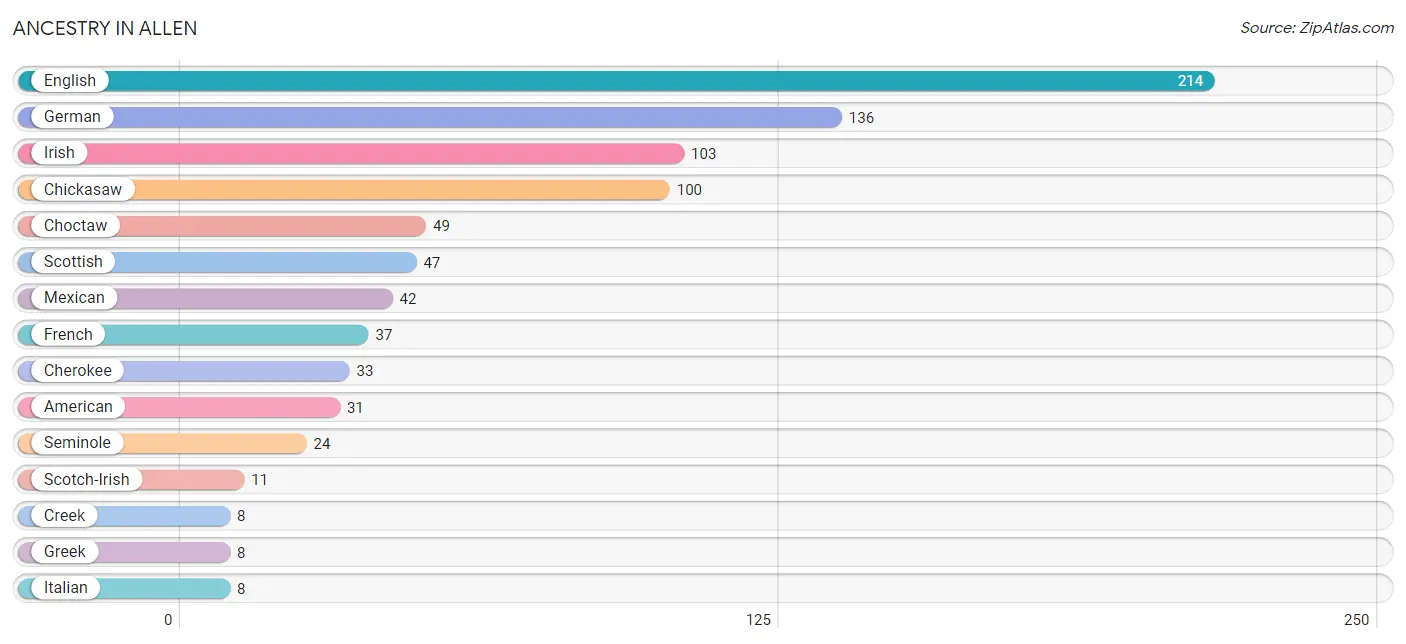
Ancestry in Allen
The most populous ancestries reported in Allen are English (214 | 23.0%), German (136 | 14.6%), Irish (103 | 11.1%), Chickasaw (100 | 10.7%), and Choctaw (49 | 5.3%), together accounting for 64.7% of all Allen residents.
| Ancestry | # Population | % Population |
| American | 31 | 3.3% |
| Basque | 2 | 0.2% |
| Cherokee | 33 | 3.5% |
| Chickasaw | 100 | 10.7% |
| Chippewa | 2 | 0.2% |
| Choctaw | 49 | 5.3% |
| Creek | 8 | 0.9% |
| Dutch | 7 | 0.7% |
| Dutch West Indian | 2 | 0.2% |
| English | 214 | 23.0% |
| European | 2 | 0.2% |
| French | 37 | 4.0% |
| French Canadian | 6 | 0.6% |
| German | 136 | 14.6% |
| Greek | 8 | 0.9% |
| Indonesian | 5 | 0.5% |
| Irish | 103 | 11.1% |
| Italian | 8 | 0.9% |
| Korean | 7 | 0.7% |
| Mexican | 42 | 4.5% |
| Native Hawaiian | 4 | 0.4% |
| Norwegian | 2 | 0.2% |
| Polish | 7 | 0.7% |
| Portuguese | 2 | 0.2% |
| Potawatomi | 2 | 0.2% |
| Scandinavian | 3 | 0.3% |
| Scotch-Irish | 11 | 1.2% |
| Scottish | 47 | 5.1% |
| Seminole | 24 | 2.6% |
| Spaniard | 3 | 0.3% |
| Spanish | 2 | 0.2% |
| Swedish | 4 | 0.4% |
| Welsh | 5 | 0.5% | View All 33 Rows |
Immigrants in Allen
The most numerous immigrant groups reported in Allen came from Central America (5 | 0.5%), Latin America (5 | 0.5%), Mexico (5 | 0.5%), Asia (4 | 0.4%), and South Eastern Asia (3 | 0.3%), together accounting for 2.4% of all Allen residents.
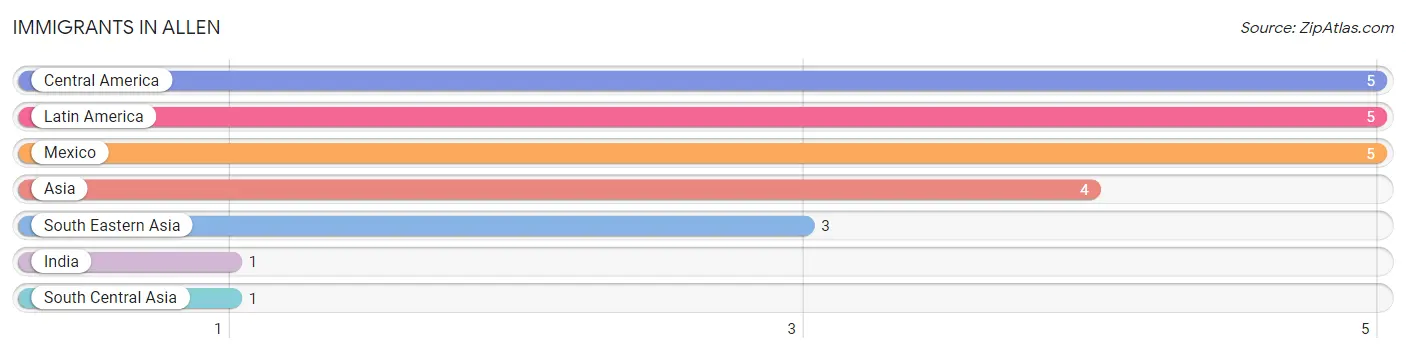
| Immigration Origin | # Population | % Population |
| Asia | 4 | 0.4% |
| Central America | 5 | 0.5% |
| India | 1 | 0.1% |
| Latin America | 5 | 0.5% |
| Mexico | 5 | 0.5% |
| South Central Asia | 1 | 0.1% |
| South Eastern Asia | 3 | 0.3% | View All 7 Rows |
Sex and Age in Allen
Sex and Age in Allen
The most populous age groups in Allen are 10 to 14 Years (56 | 12.5%) for men and 75 to 79 Years (75 | 15.6%) for women.
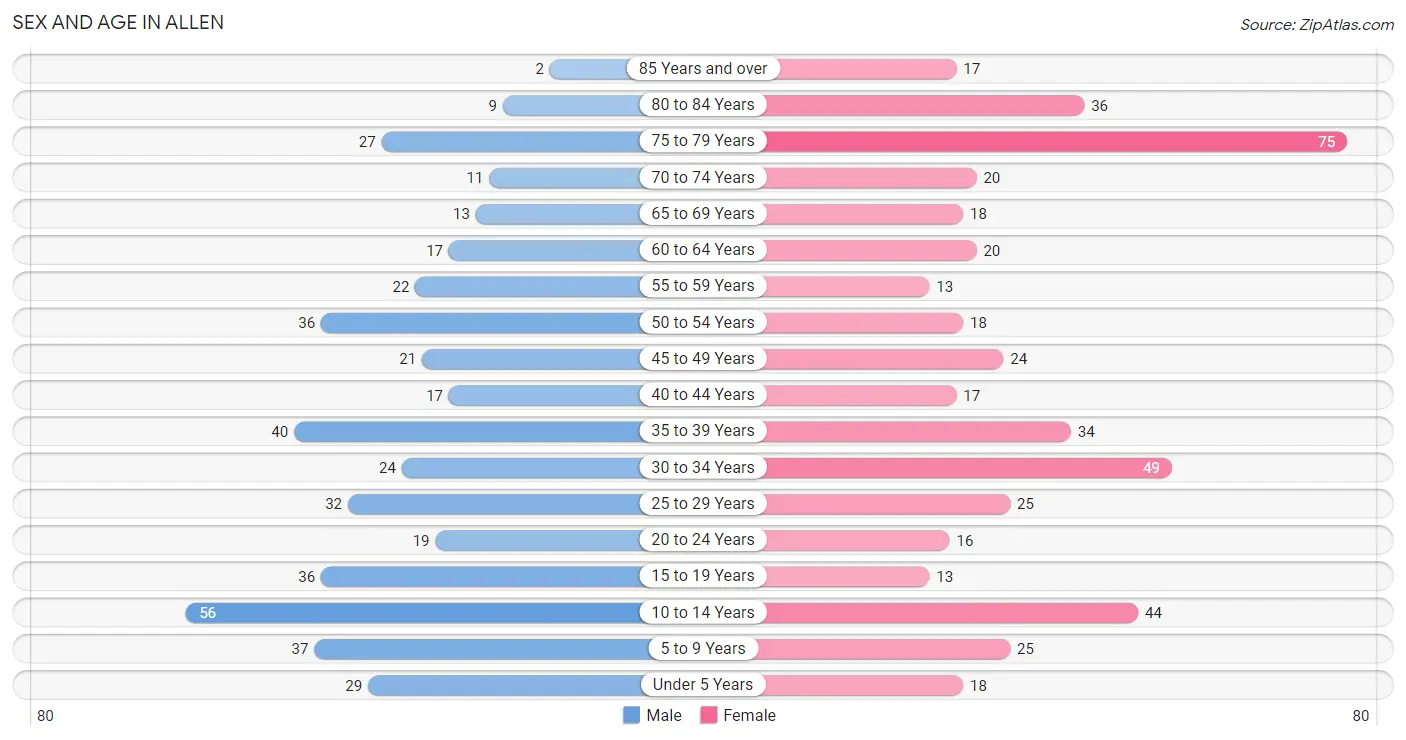
| Age Bracket | Male | Female |
| Under 5 Years | 29 (6.5%) | 18 (3.7%) |
| 5 to 9 Years | 37 (8.3%) | 25 (5.2%) |
| 10 to 14 Years | 56 (12.5%) | 44 (9.1%) |
| 15 to 19 Years | 36 (8.0%) | 13 (2.7%) |
| 20 to 24 Years | 19 (4.2%) | 16 (3.3%) |
| 25 to 29 Years | 32 (7.1%) | 25 (5.2%) |
| 30 to 34 Years | 24 (5.4%) | 49 (10.2%) |
| 35 to 39 Years | 40 (8.9%) | 34 (7.0%) |
| 40 to 44 Years | 17 (3.8%) | 17 (3.5%) |
| 45 to 49 Years | 21 (4.7%) | 24 (5.0%) |
| 50 to 54 Years | 36 (8.0%) | 18 (3.7%) |
| 55 to 59 Years | 22 (4.9%) | 13 (2.7%) |
| 60 to 64 Years | 17 (3.8%) | 20 (4.2%) |
| 65 to 69 Years | 13 (2.9%) | 18 (3.7%) |
| 70 to 74 Years | 11 (2.5%) | 20 (4.2%) |
| 75 to 79 Years | 27 (6.0%) | 75 (15.6%) |
| 80 to 84 Years | 9 (2.0%) | 36 (7.5%) |
| 85 Years and over | 2 (0.4%) | 17 (3.5%) |
| Total | 448 (100.0%) | 482 (100.0%) |
Families and Households in Allen
Median Family Size in Allen
The median family size in Allen is 2.81 persons per family, with married-couple families (145 | 53.5%) accounting for the largest median family size of 3.32 persons per family. On the other hand, single female/mother families (101 | 37.3%) represent the smallest median family size with 1.97 persons per family.
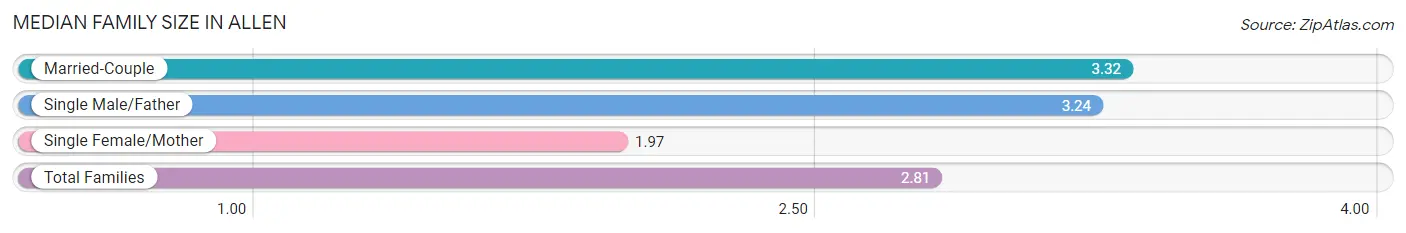
| Family Type | # Families | Family Size |
| Married-Couple | 145 (53.5%) | 3.32 |
| Single Male/Father | 25 (9.2%) | 3.24 |
| Single Female/Mother | 101 (37.3%) | 1.97 |
| Total Families | 271 (100.0%) | 2.81 |
Median Household Size in Allen
The median household size in Allen is 2.50 persons per household, with single male/father households (25 | 7.1%) accounting for the largest median household size of 3.84 persons per household. non-family households (82 | 23.2%) represent the smallest median household size with 1.12 persons per household.
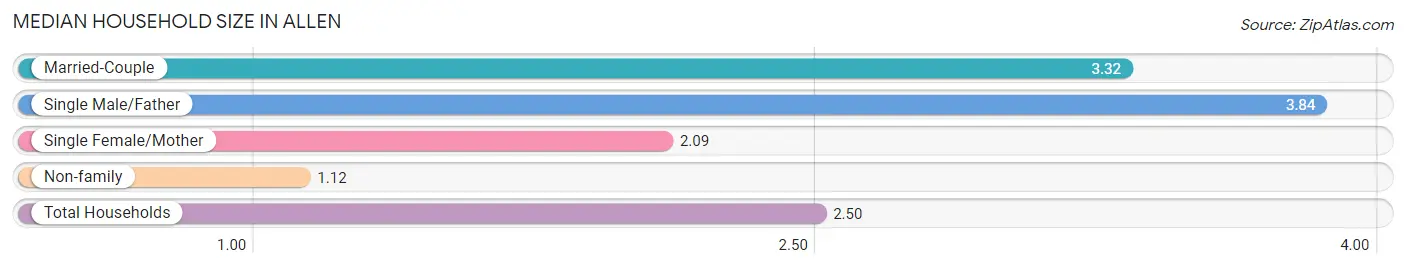
| Household Type | # Households | Household Size |
| Married-Couple | 145 (41.1%) | 3.32 |
| Single Male/Father | 25 (7.1%) | 3.84 |
| Single Female/Mother | 101 (28.6%) | 2.09 |
| Non-family | 82 (23.2%) | 1.12 |
| Total Households | 353 (100.0%) | 2.50 |
Household Size by Marriage Status in Allen
Out of a total of 353 households in Allen, 271 (76.8%) are family households, while 82 (23.2%) are nonfamily households. The most numerous type of family households are 3-person households, comprising 111, and the most common type of nonfamily households are 1-person households, comprising 71.
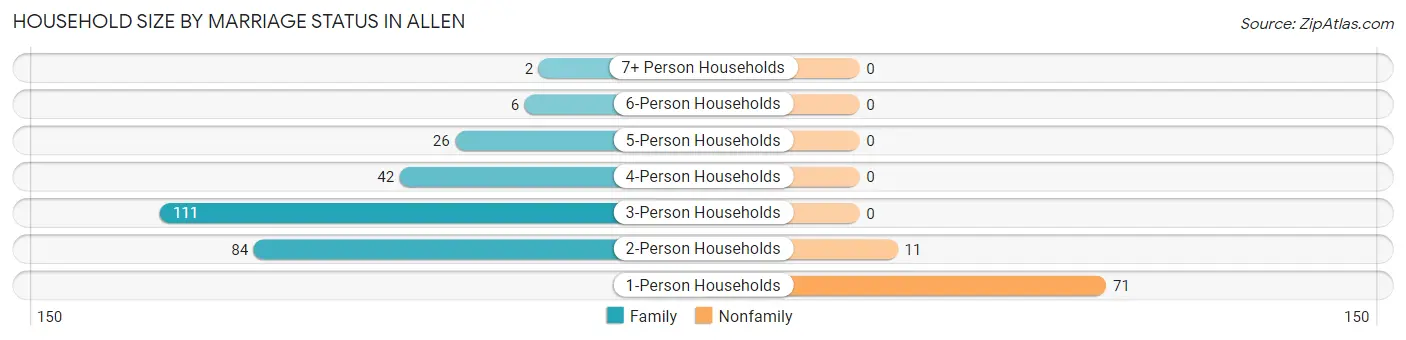
| Household Size | Family Households | Nonfamily Households |
| 1-Person Households | - | 71 (20.1%) |
| 2-Person Households | 84 (23.8%) | 11 (3.1%) |
| 3-Person Households | 111 (31.4%) | 0 (0.0%) |
| 4-Person Households | 42 (11.9%) | 0 (0.0%) |
| 5-Person Households | 26 (7.4%) | 0 (0.0%) |
| 6-Person Households | 6 (1.7%) | 0 (0.0%) |
| 7+ Person Households | 2 (0.6%) | 0 (0.0%) |
| Total | 271 (76.8%) | 82 (23.2%) |
Female Fertility in Allen
Fertility by Age in Allen
Average fertility rate in Allen is 67.0 births per 1,000 women. Women in the age bracket of 20 to 34 years have the highest fertility rate with 111.0 births per 1,000 women. Women in the age bracket of 20 to 34 years acount for 83.3% of all women with births.
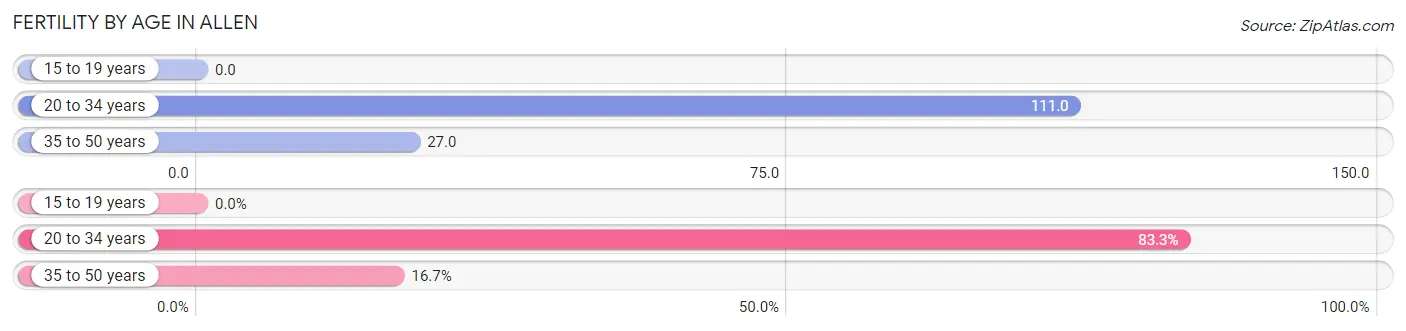
| Age Bracket | Women with Births | Births / 1,000 Women |
| 15 to 19 years | 0 (0.0%) | 0.0 |
| 20 to 34 years | 10 (83.3%) | 111.0 |
| 35 to 50 years | 2 (16.7%) | 27.0 |
| Total | 12 (100.0%) | 67.0 |
Fertility by Age by Marriage Status in Allen
50.0% of women with births (12) in Allen are married. The highest percentage of unmarried women with births falls into 20 to 34 years age bracket with 60.0% of them unmarried at the time of birth, while the lowest percentage of unmarried women with births belong to 35 to 50 years age bracket with 0.0% of them unmarried.
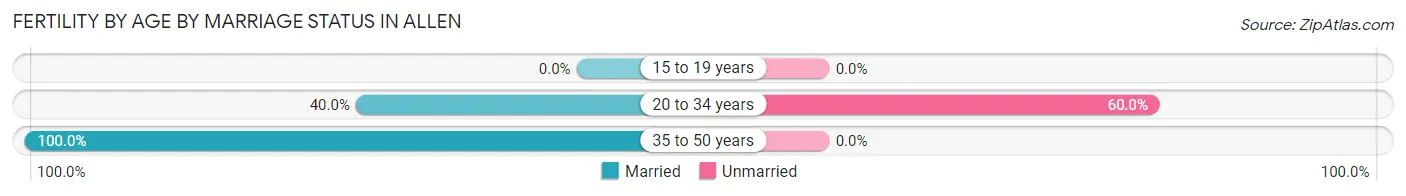
| Age Bracket | Married | Unmarried |
| 15 to 19 years | 0 (0.0%) | 0 (0.0%) |
| 20 to 34 years | 4 (40.0%) | 6 (60.0%) |
| 35 to 50 years | 2 (100.0%) | 0 (0.0%) |
| Total | 6 (50.0%) | 6 (50.0%) |
Fertility by Education in Allen
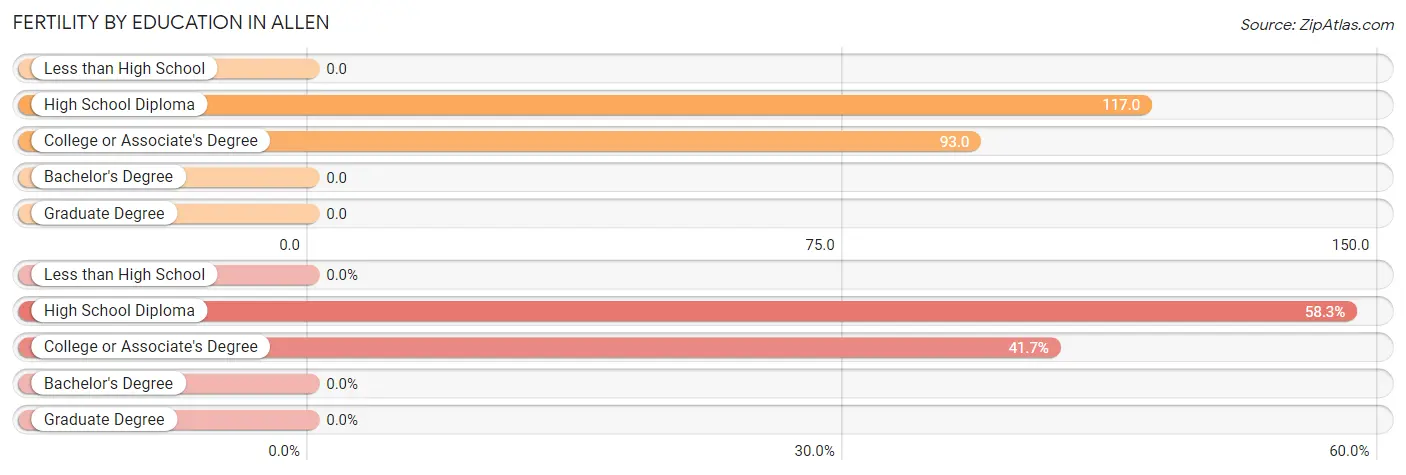
| Educational Attainment | Women with Births | Births / 1,000 Women |
| Less than High School | 0 (0.0%) | 0.0 |
| High School Diploma | 7 (58.3%) | 117.0 |
| College or Associate's Degree | 5 (41.7%) | 93.0 |
| Bachelor's Degree | 0 (0.0%) | 0.0 |
| Graduate Degree | 0 (0.0%) | 0.0 |
| Total | 12 (100.0%) | 67.0 |
Fertility by Education by Marriage Status in Allen
50.0% of women with births in Allen are unmarried. Women with the educational attainment of high school diploma are most likely to be married with 57.1% of them married at childbirth, while women with the educational attainment of college or associate's degree are least likely to be married with 60.0% of them unmarried at childbirth.
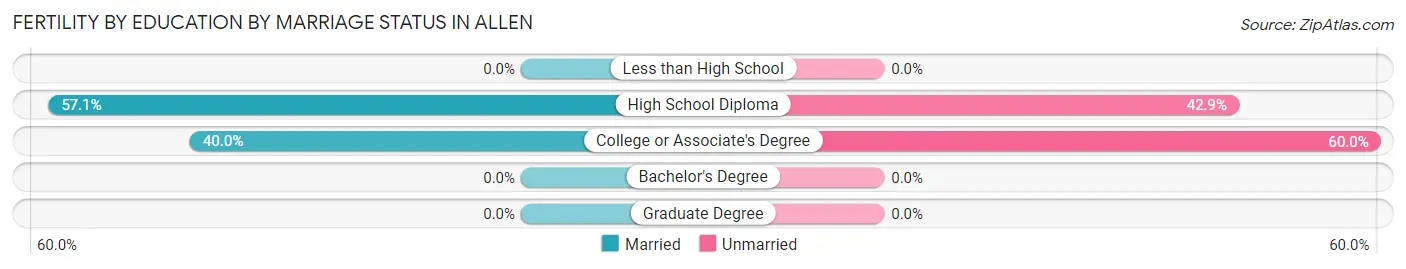
| Educational Attainment | Married | Unmarried |
| Less than High School | 0 (0.0%) | 0 (0.0%) |
| High School Diploma | 4 (57.1%) | 3 (42.9%) |
| College or Associate's Degree | 2 (40.0%) | 3 (60.0%) |
| Bachelor's Degree | 0 (0.0%) | 0 (0.0%) |
| Graduate Degree | 0 (0.0%) | 0 (0.0%) |
| Total | 6 (50.0%) | 6 (50.0%) |
Employment Characteristics in Allen
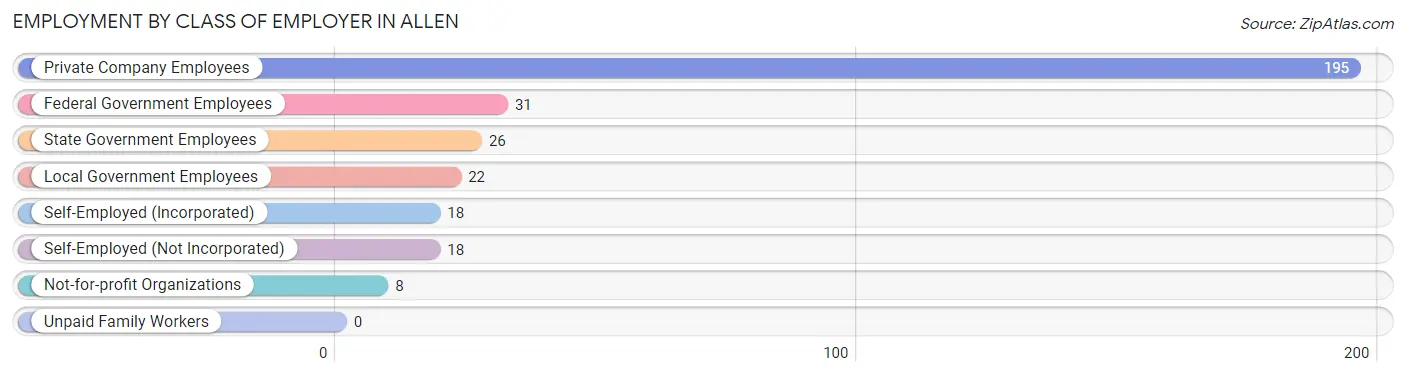
Employment by Class of Employer in Allen
Among the 318 employed individuals in Allen, private company employees (195 | 61.3%), federal government employees (31 | 9.8%), and state government employees (26 | 8.2%) make up the most common classes of employment.
| Employer Class | # Employees | % Employees |
| Private Company Employees | 195 | 61.3% |
| Self-Employed (Incorporated) | 18 | 5.7% |
| Self-Employed (Not Incorporated) | 18 | 5.7% |
| Not-for-profit Organizations | 8 | 2.5% |
| Local Government Employees | 22 | 6.9% |
| State Government Employees | 26 | 8.2% |
| Federal Government Employees | 31 | 9.8% |
| Unpaid Family Workers | 0 | 0.0% |
| Total | 318 | 100.0% |
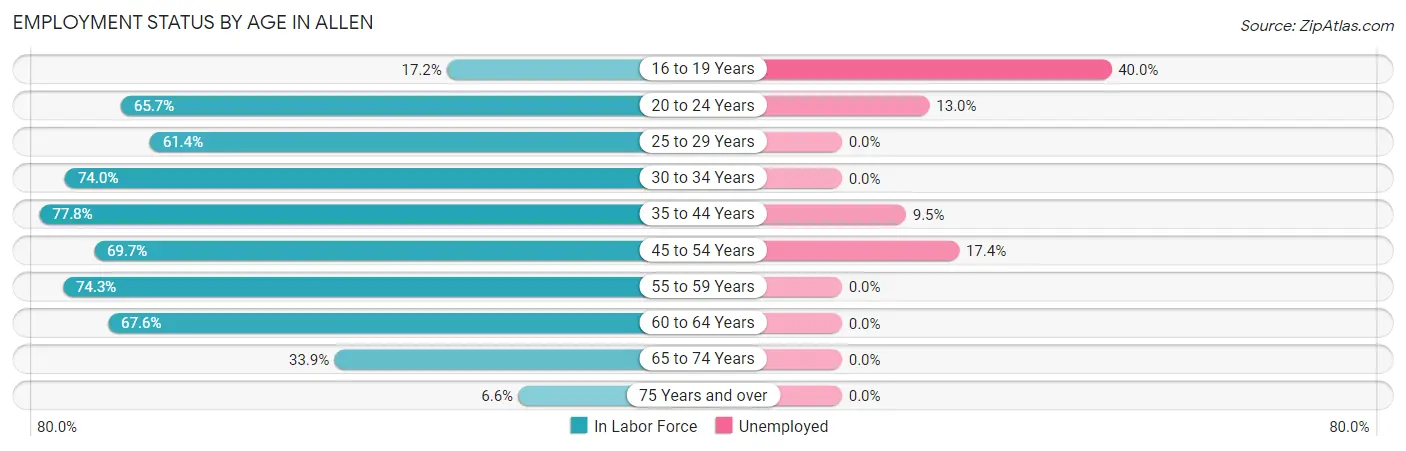
Employment Status by Age in Allen
According to the labor force statistics for Allen, out of the total population over 16 years of age (701), 50.4% or 353 individuals are in the labor force, with 7.1% or 25 of them unemployed. The age group with the highest labor force participation rate is 35 to 44 years, with 77.8% or 84 individuals in the labor force. Within the labor force, the 16 to 19 years age range has the highest percentage of unemployed individuals, with 40.0% or 2 of them being unemployed.
| Age Bracket | In Labor Force | Unemployed |
| 16 to 19 Years | 5 (17.2%) | 2 (40.0%) |
| 20 to 24 Years | 23 (65.7%) | 3 (13.0%) |
| 25 to 29 Years | 35 (61.4%) | 0 (0.0%) |
| 30 to 34 Years | 54 (74.0%) | 0 (0.0%) |
| 35 to 44 Years | 84 (77.8%) | 8 (9.5%) |
| 45 to 54 Years | 69 (69.7%) | 12 (17.4%) |
| 55 to 59 Years | 26 (74.3%) | 0 (0.0%) |
| 60 to 64 Years | 25 (67.6%) | 0 (0.0%) |
| 65 to 74 Years | 21 (33.9%) | 0 (0.0%) |
| 75 Years and over | 11 (6.6%) | 0 (0.0%) |
| Total | 353 (50.4%) | 25 (7.1%) |
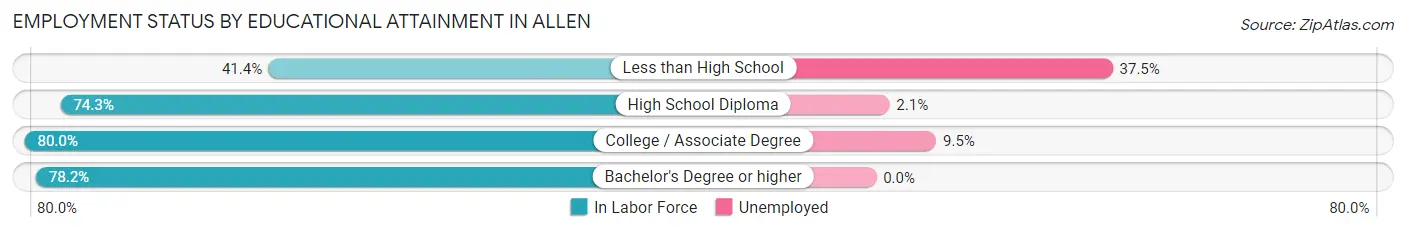
Employment Status by Educational Attainment in Allen
According to labor force statistics for Allen, 71.6% of individuals (293) out of the total population between 25 and 64 years of age (409) are in the labor force, with 6.8% or 20 of them being unemployed. The group with the highest labor force participation rate are those with the educational attainment of college / associate degree, with 80.0% or 84 individuals in the labor force. Within the labor force, individuals with less than high school education have the highest percentage of unemployment, with 37.5% or 9 of them being unemployed.
| Educational Attainment | In Labor Force | Unemployed |
| Less than High School | 24 (41.4%) | 22 (37.5%) |
| High School Diploma | 142 (74.3%) | 4 (2.1%) |
| College / Associate Degree | 84 (80.0%) | 10 (9.5%) |
| Bachelor's Degree or higher | 43 (78.2%) | 0 (0.0%) |
| Total | 293 (71.6%) | 28 (6.8%) |
Employment Occupations by Sex in Allen
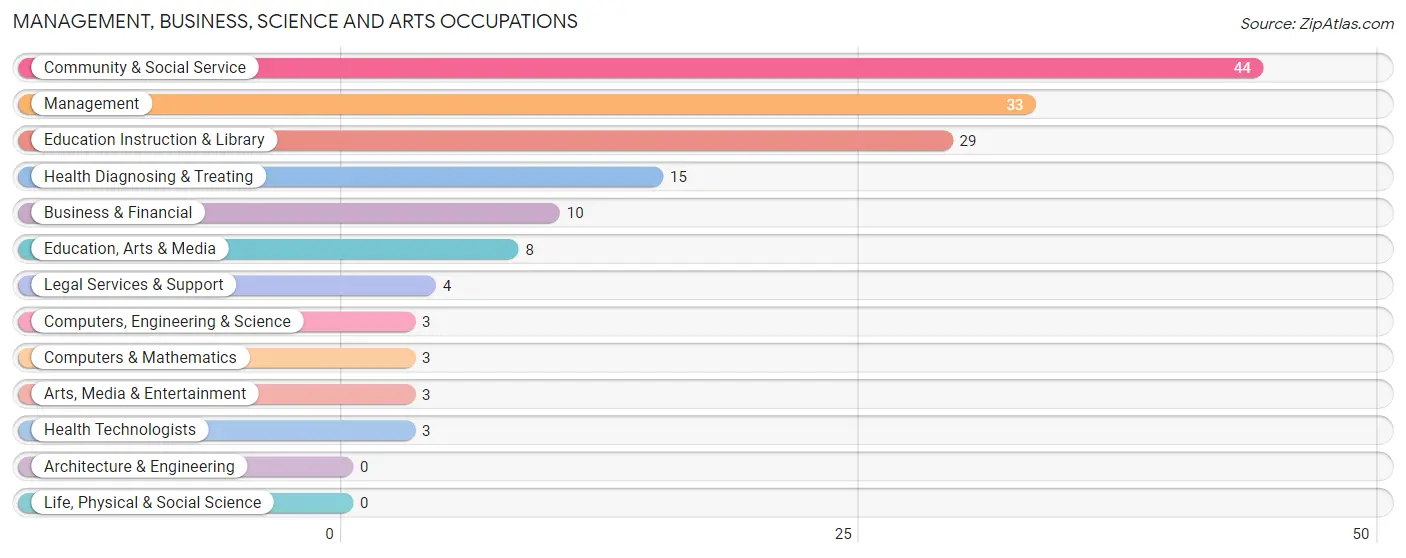
Management, Business, Science and Arts Occupations
The most common Management, Business, Science and Arts occupations in Allen are Community & Social Service (44 | 13.4%), Management (33 | 10.1%), Education Instruction & Library (29 | 8.8%), Health Diagnosing & Treating (15 | 4.6%), and Business & Financial (10 | 3.0%).
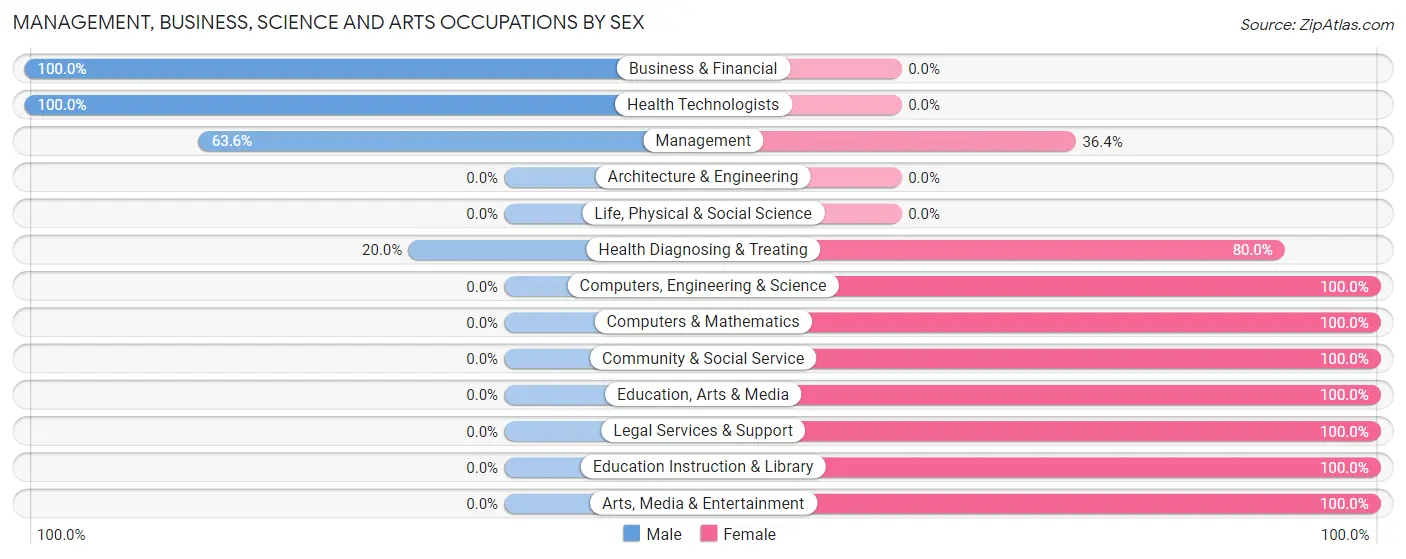
Management, Business, Science and Arts Occupations by Sex
Within the Management, Business, Science and Arts occupations in Allen, the most male-oriented occupations are Business & Financial (100.0%), Health Technologists (100.0%), and Management (63.6%), while the most female-oriented occupations are Computers, Engineering & Science (100.0%), Computers & Mathematics (100.0%), and Community & Social Service (100.0%).
| Occupation | Male | Female |
| Management | 21 (63.6%) | 12 (36.4%) |
| Business & Financial | 10 (100.0%) | 0 (0.0%) |
| Computers, Engineering & Science | 0 (0.0%) | 3 (100.0%) |
| Computers & Mathematics | 0 (0.0%) | 3 (100.0%) |
| Architecture & Engineering | 0 (0.0%) | 0 (0.0%) |
| Life, Physical & Social Science | 0 (0.0%) | 0 (0.0%) |
| Community & Social Service | 0 (0.0%) | 44 (100.0%) |
| Education, Arts & Media | 0 (0.0%) | 8 (100.0%) |
| Legal Services & Support | 0 (0.0%) | 4 (100.0%) |
| Education Instruction & Library | 0 (0.0%) | 29 (100.0%) |
| Arts, Media & Entertainment | 0 (0.0%) | 3 (100.0%) |
| Health Diagnosing & Treating | 3 (20.0%) | 12 (80.0%) |
| Health Technologists | 3 (100.0%) | 0 (0.0%) |
| Total (Category) | 34 (32.4%) | 71 (67.6%) |
| Total (Overall) | 160 (48.8%) | 168 (51.2%) |
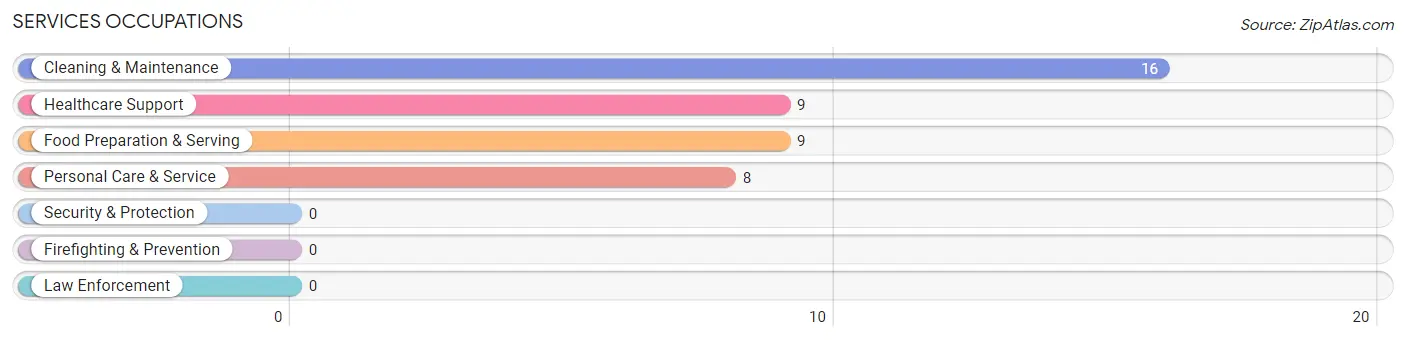
Services Occupations
The most common Services occupations in Allen are Cleaning & Maintenance (16 | 4.9%), Healthcare Support (9 | 2.7%), Food Preparation & Serving (9 | 2.7%), and Personal Care & Service (8 | 2.4%).
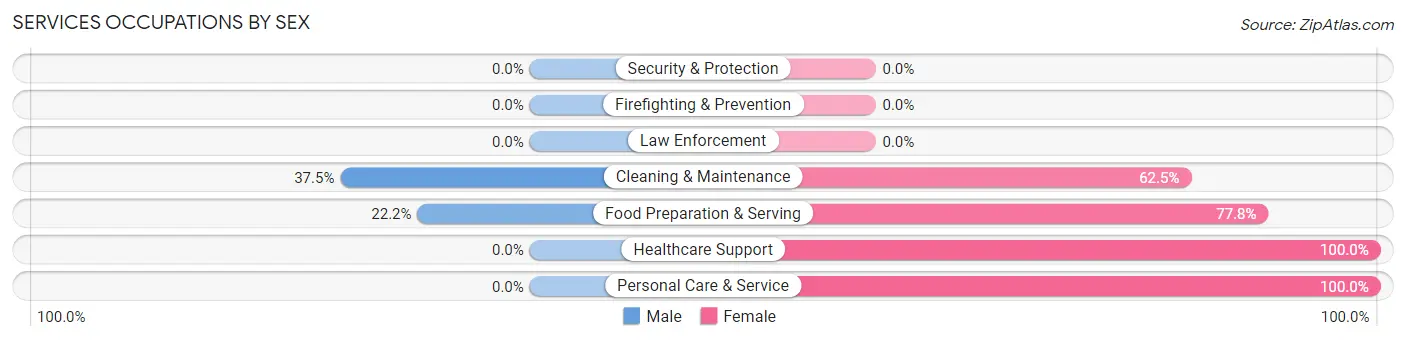
Services Occupations by Sex
Within the Services occupations in Allen, the most male-oriented occupations are Cleaning & Maintenance (37.5%), and Food Preparation & Serving (22.2%), while the most female-oriented occupations are Healthcare Support (100.0%), Personal Care & Service (100.0%), and Food Preparation & Serving (77.8%).
| Occupation | Male | Female |
| Healthcare Support | 0 (0.0%) | 9 (100.0%) |
| Security & Protection | 0 (0.0%) | 0 (0.0%) |
| Firefighting & Prevention | 0 (0.0%) | 0 (0.0%) |
| Law Enforcement | 0 (0.0%) | 0 (0.0%) |
| Food Preparation & Serving | 2 (22.2%) | 7 (77.8%) |
| Cleaning & Maintenance | 6 (37.5%) | 10 (62.5%) |
| Personal Care & Service | 0 (0.0%) | 8 (100.0%) |
| Total (Category) | 8 (19.1%) | 34 (80.9%) |
| Total (Overall) | 160 (48.8%) | 168 (51.2%) |
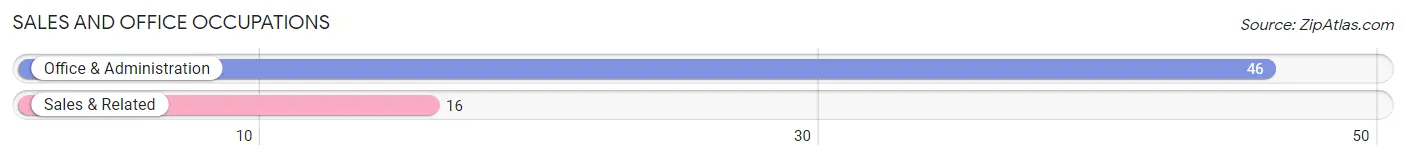
Sales and Office Occupations
The most common Sales and Office occupations in Allen are Office & Administration (46 | 14.0%), and Sales & Related (16 | 4.9%).
Sales and Office Occupations by Sex
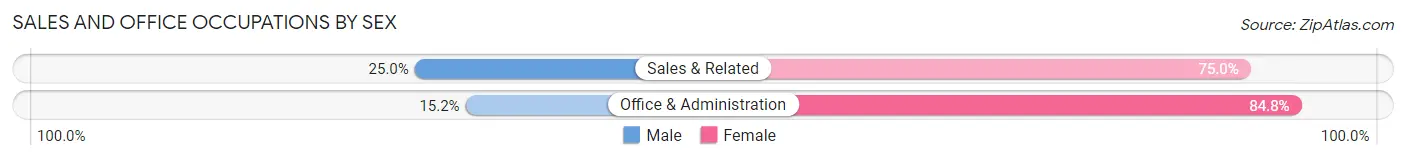
| Occupation | Male | Female |
| Sales & Related | 4 (25.0%) | 12 (75.0%) |
| Office & Administration | 7 (15.2%) | 39 (84.8%) |
| Total (Category) | 11 (17.7%) | 51 (82.3%) |
| Total (Overall) | 160 (48.8%) | 168 (51.2%) |
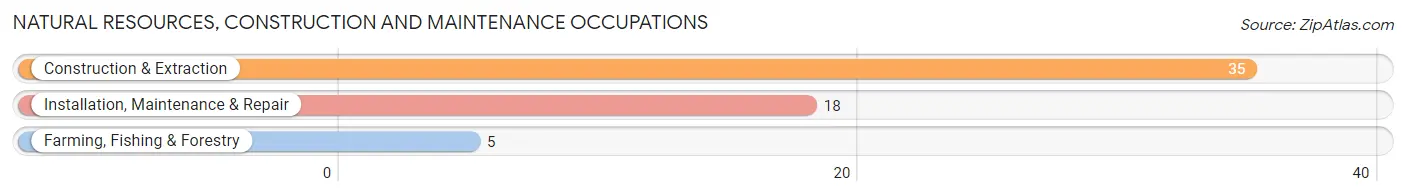
Natural Resources, Construction and Maintenance Occupations
The most common Natural Resources, Construction and Maintenance occupations in Allen are Construction & Extraction (35 | 10.7%), Installation, Maintenance & Repair (18 | 5.5%), and Farming, Fishing & Forestry (5 | 1.5%).
Natural Resources, Construction and Maintenance Occupations by Sex
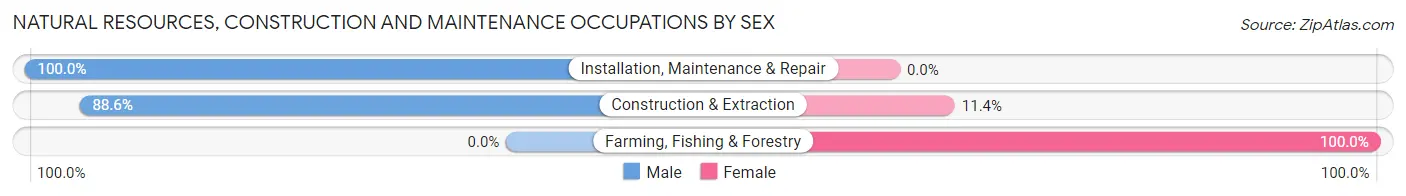
| Occupation | Male | Female |
| Farming, Fishing & Forestry | 0 (0.0%) | 5 (100.0%) |
| Construction & Extraction | 31 (88.6%) | 4 (11.4%) |
| Installation, Maintenance & Repair | 18 (100.0%) | 0 (0.0%) |
| Total (Category) | 49 (84.5%) | 9 (15.5%) |
| Total (Overall) | 160 (48.8%) | 168 (51.2%) |
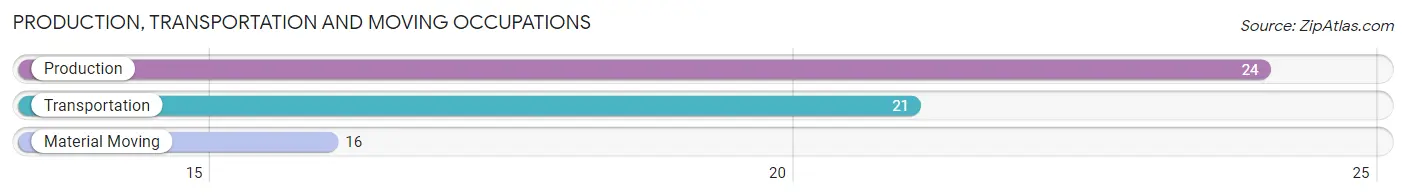
Production, Transportation and Moving Occupations
The most common Production, Transportation and Moving occupations in Allen are Production (24 | 7.3%), Transportation (21 | 6.4%), and Material Moving (16 | 4.9%).
Production, Transportation and Moving Occupations by Sex
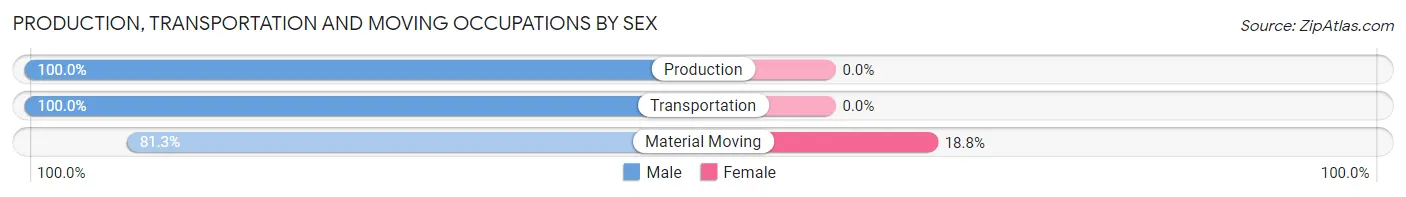
| Occupation | Male | Female |
| Production | 24 (100.0%) | 0 (0.0%) |
| Transportation | 21 (100.0%) | 0 (0.0%) |
| Material Moving | 13 (81.2%) | 3 (18.8%) |
| Total (Category) | 58 (95.1%) | 3 (4.9%) |
| Total (Overall) | 160 (48.8%) | 168 (51.2%) |
Employment Industries by Sex in Allen
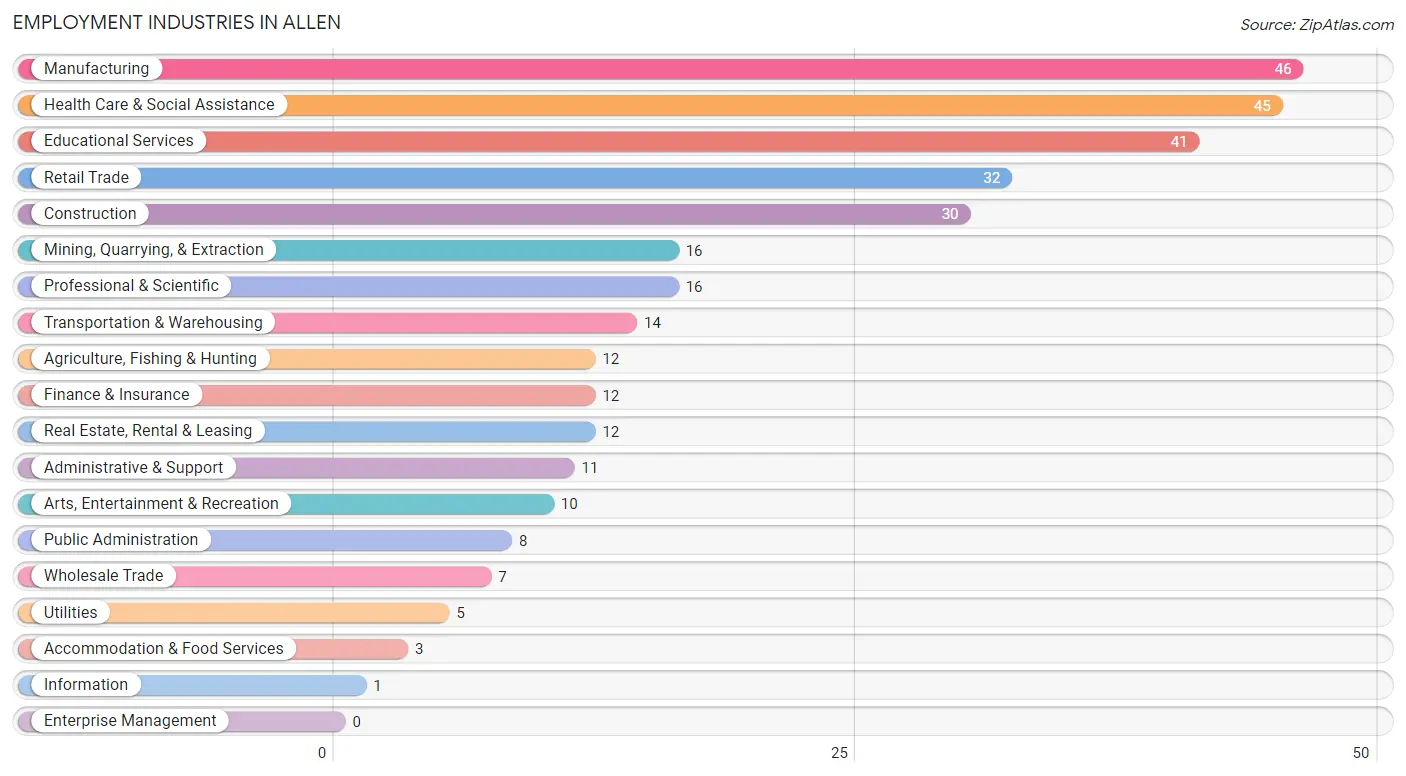
Employment Industries in Allen
The major employment industries in Allen include Manufacturing (46 | 14.0%), Health Care & Social Assistance (45 | 13.7%), Educational Services (41 | 12.5%), Retail Trade (32 | 9.8%), and Construction (30 | 9.1%).
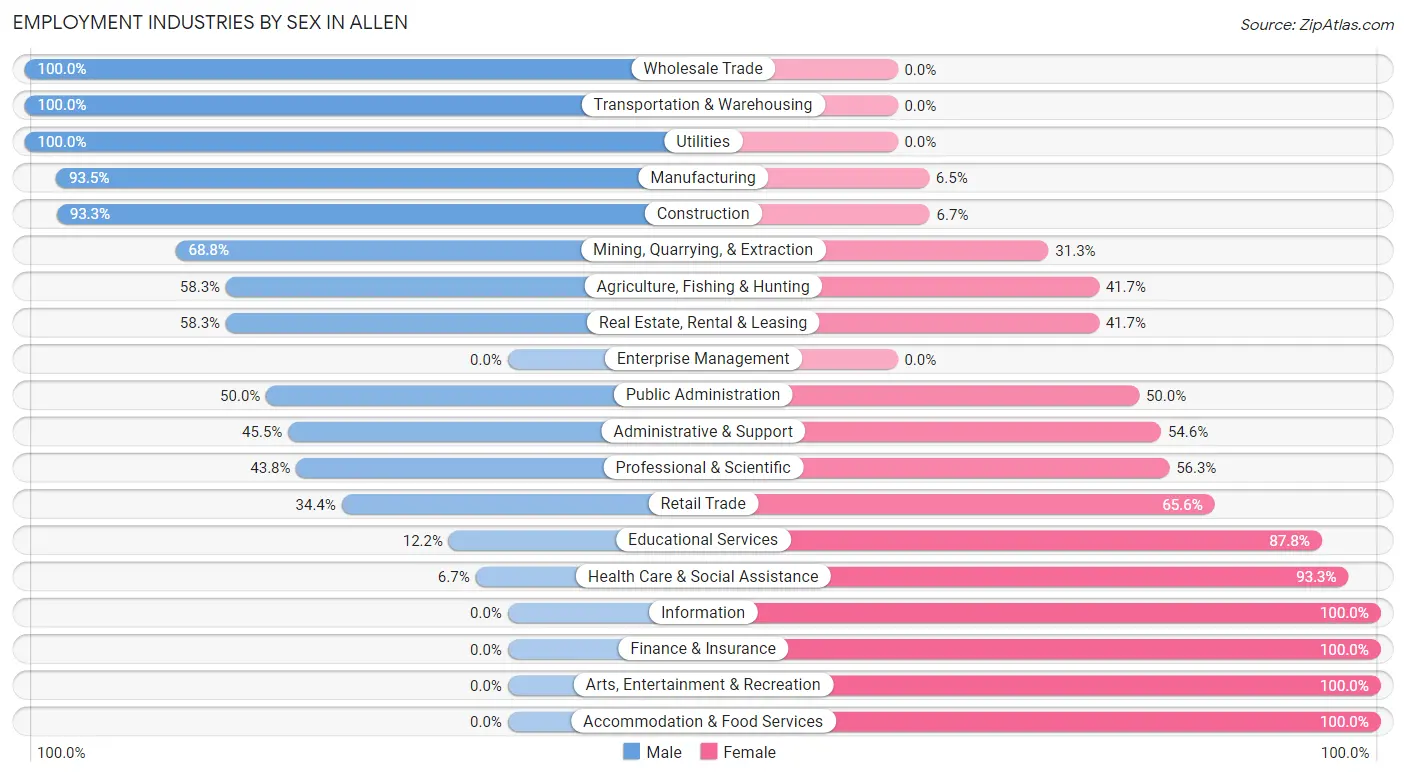
Employment Industries by Sex in Allen
The Allen industries that see more men than women are Wholesale Trade (100.0%), Transportation & Warehousing (100.0%), and Utilities (100.0%), whereas the industries that tend to have a higher number of women are Information (100.0%), Finance & Insurance (100.0%), and Arts, Entertainment & Recreation (100.0%).
| Industry | Male | Female |
| Agriculture, Fishing & Hunting | 7 (58.3%) | 5 (41.7%) |
| Mining, Quarrying, & Extraction | 11 (68.8%) | 5 (31.2%) |
| Construction | 28 (93.3%) | 2 (6.7%) |
| Manufacturing | 43 (93.5%) | 3 (6.5%) |
| Wholesale Trade | 7 (100.0%) | 0 (0.0%) |
| Retail Trade | 11 (34.4%) | 21 (65.6%) |
| Transportation & Warehousing | 14 (100.0%) | 0 (0.0%) |
| Utilities | 5 (100.0%) | 0 (0.0%) |
| Information | 0 (0.0%) | 1 (100.0%) |
| Finance & Insurance | 0 (0.0%) | 12 (100.0%) |
| Real Estate, Rental & Leasing | 7 (58.3%) | 5 (41.7%) |
| Professional & Scientific | 7 (43.8%) | 9 (56.2%) |
| Enterprise Management | 0 (0.0%) | 0 (0.0%) |
| Administrative & Support | 5 (45.5%) | 6 (54.5%) |
| Educational Services | 5 (12.2%) | 36 (87.8%) |
| Health Care & Social Assistance | 3 (6.7%) | 42 (93.3%) |
| Arts, Entertainment & Recreation | 0 (0.0%) | 10 (100.0%) |
| Accommodation & Food Services | 0 (0.0%) | 3 (100.0%) |
| Public Administration | 4 (50.0%) | 4 (50.0%) |
| Total | 160 (48.8%) | 168 (51.2%) |
Education in Allen
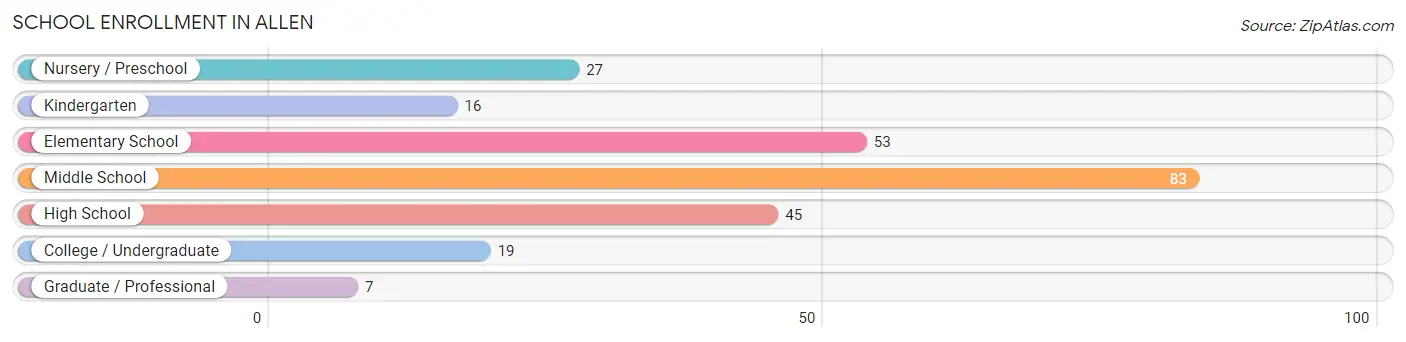
School Enrollment in Allen
The most common levels of schooling among the 250 students in Allen are middle school (83 | 33.2%), elementary school (53 | 21.2%), and high school (45 | 18.0%).
| School Level | # Students | % Students |
| Nursery / Preschool | 27 | 10.8% |
| Kindergarten | 16 | 6.4% |
| Elementary School | 53 | 21.2% |
| Middle School | 83 | 33.2% |
| High School | 45 | 18.0% |
| College / Undergraduate | 19 | 7.6% |
| Graduate / Professional | 7 | 2.8% |
| Total | 250 | 100.0% |
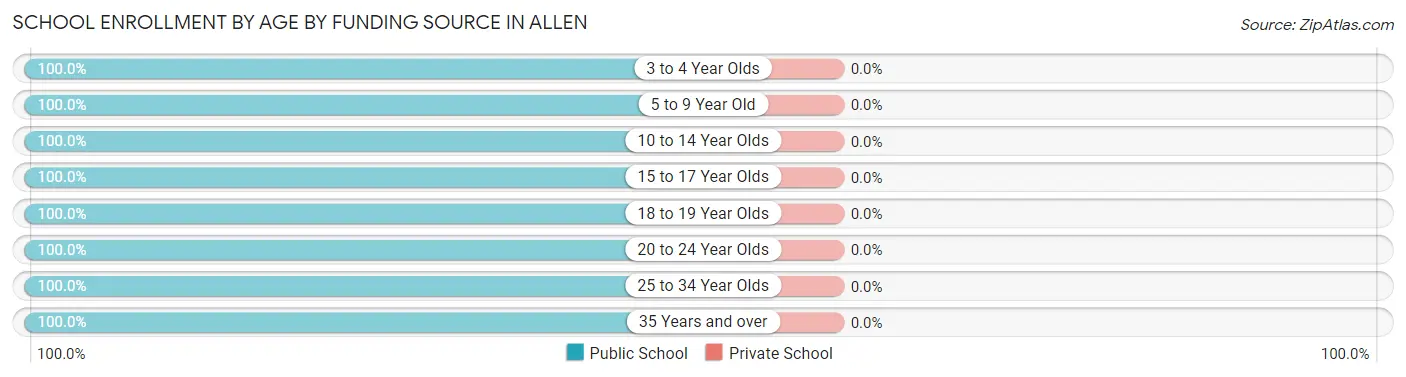
School Enrollment by Age by Funding Source in Allen
| Age Bracket | Public School | Private School |
| 3 to 4 Year Olds | 22 (100.0%) | 0 (0.0%) |
| 5 to 9 Year Old | 62 (100.0%) | 0 (0.0%) |
| 10 to 14 Year Olds | 97 (100.0%) | 0 (0.0%) |
| 15 to 17 Year Olds | 37 (100.0%) | 0 (0.0%) |
| 18 to 19 Year Olds | 7 (100.0%) | 0 (0.0%) |
| 20 to 24 Year Olds | 9 (100.0%) | 0 (0.0%) |
| 25 to 34 Year Olds | 11 (100.0%) | 0 (0.0%) |
| 35 Years and over | 5 (100.0%) | 0 (0.0%) |
| Total | 250 (100.0%) | 0 (0.0%) |
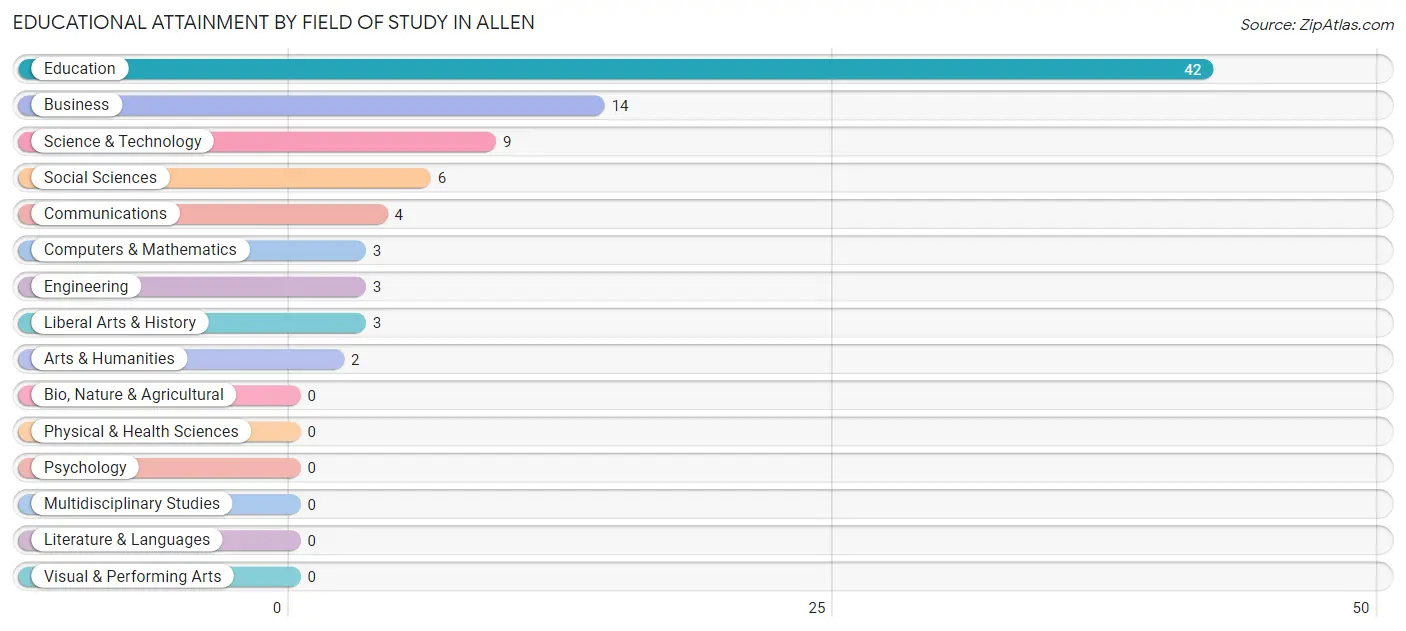
Educational Attainment by Field of Study in Allen
Education (42 | 48.8%), business (14 | 16.3%), science & technology (9 | 10.5%), social sciences (6 | 7.0%), and communications (4 | 4.6%) are the most common fields of study among 86 individuals in Allen who have obtained a bachelor's degree or higher.
| Field of Study | # Graduates | % Graduates |
| Computers & Mathematics | 3 | 3.5% |
| Bio, Nature & Agricultural | 0 | 0.0% |
| Physical & Health Sciences | 0 | 0.0% |
| Psychology | 0 | 0.0% |
| Social Sciences | 6 | 7.0% |
| Engineering | 3 | 3.5% |
| Multidisciplinary Studies | 0 | 0.0% |
| Science & Technology | 9 | 10.5% |
| Business | 14 | 16.3% |
| Education | 42 | 48.8% |
| Literature & Languages | 0 | 0.0% |
| Liberal Arts & History | 3 | 3.5% |
| Visual & Performing Arts | 0 | 0.0% |
| Communications | 4 | 4.6% |
| Arts & Humanities | 2 | 2.3% |
| Total | 86 | 100.0% |
Transportation & Commute in Allen
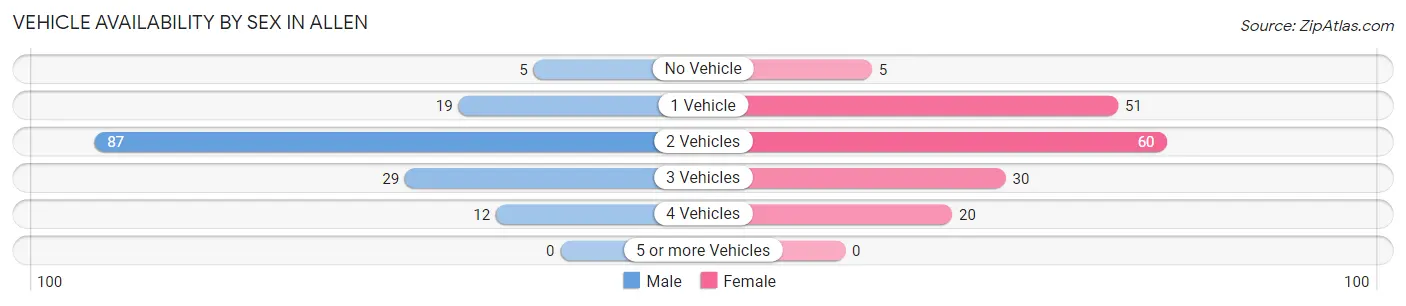
Vehicle Availability by Sex in Allen
The most prevalent vehicle ownership categories in Allen are males with 2 vehicles (87, accounting for 57.2%) and females with 2 vehicles (60, making up 52.4%).
| Vehicles Available | Male | Female |
| No Vehicle | 5 (3.3%) | 5 (3.0%) |
| 1 Vehicle | 19 (12.5%) | 51 (30.7%) |
| 2 Vehicles | 87 (57.2%) | 60 (36.1%) |
| 3 Vehicles | 29 (19.1%) | 30 (18.1%) |
| 4 Vehicles | 12 (7.9%) | 20 (12.0%) |
| 5 or more Vehicles | 0 (0.0%) | 0 (0.0%) |
| Total | 152 (100.0%) | 166 (100.0%) |
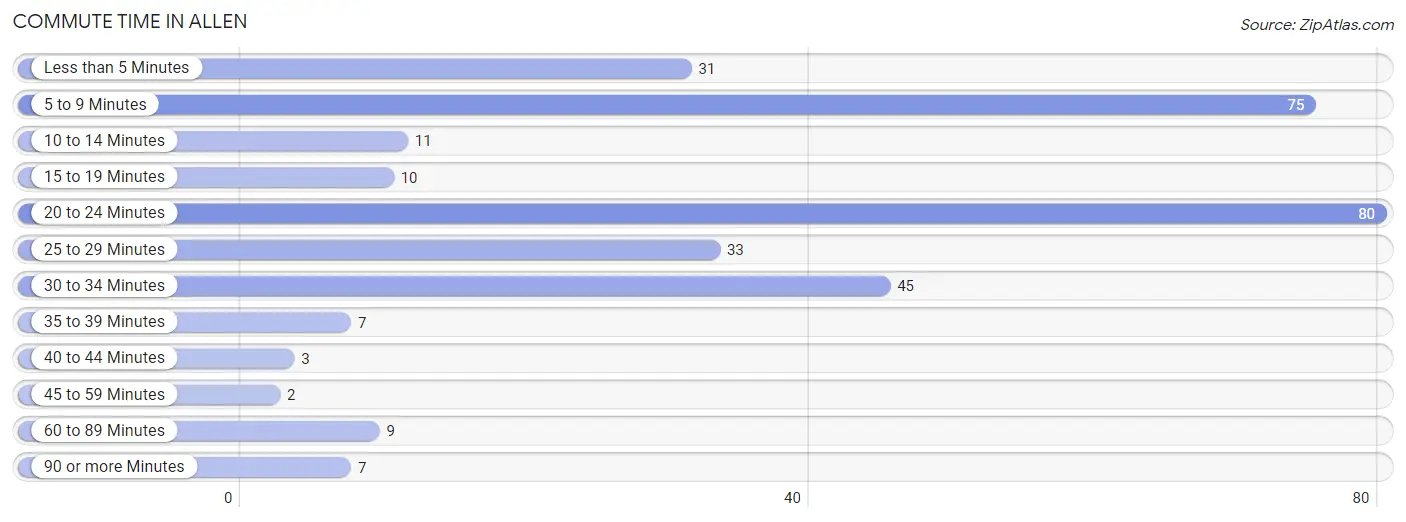
Commute Time in Allen
The most frequently occuring commute durations in Allen are 20 to 24 minutes (80 commuters, 25.6%), 5 to 9 minutes (75 commuters, 24.0%), and 30 to 34 minutes (45 commuters, 14.4%).
| Commute Time | # Commuters | % Commuters |
| Less than 5 Minutes | 31 | 9.9% |
| 5 to 9 Minutes | 75 | 24.0% |
| 10 to 14 Minutes | 11 | 3.5% |
| 15 to 19 Minutes | 10 | 3.2% |
| 20 to 24 Minutes | 80 | 25.6% |
| 25 to 29 Minutes | 33 | 10.5% |
| 30 to 34 Minutes | 45 | 14.4% |
| 35 to 39 Minutes | 7 | 2.2% |
| 40 to 44 Minutes | 3 | 1.0% |
| 45 to 59 Minutes | 2 | 0.6% |
| 60 to 89 Minutes | 9 | 2.9% |
| 90 or more Minutes | 7 | 2.2% |
Commute Time by Sex in Allen
The most common commute times in Allen are 20 to 24 minutes (33 commuters, 21.7%) for males and 20 to 24 minutes (47 commuters, 29.2%) for females.
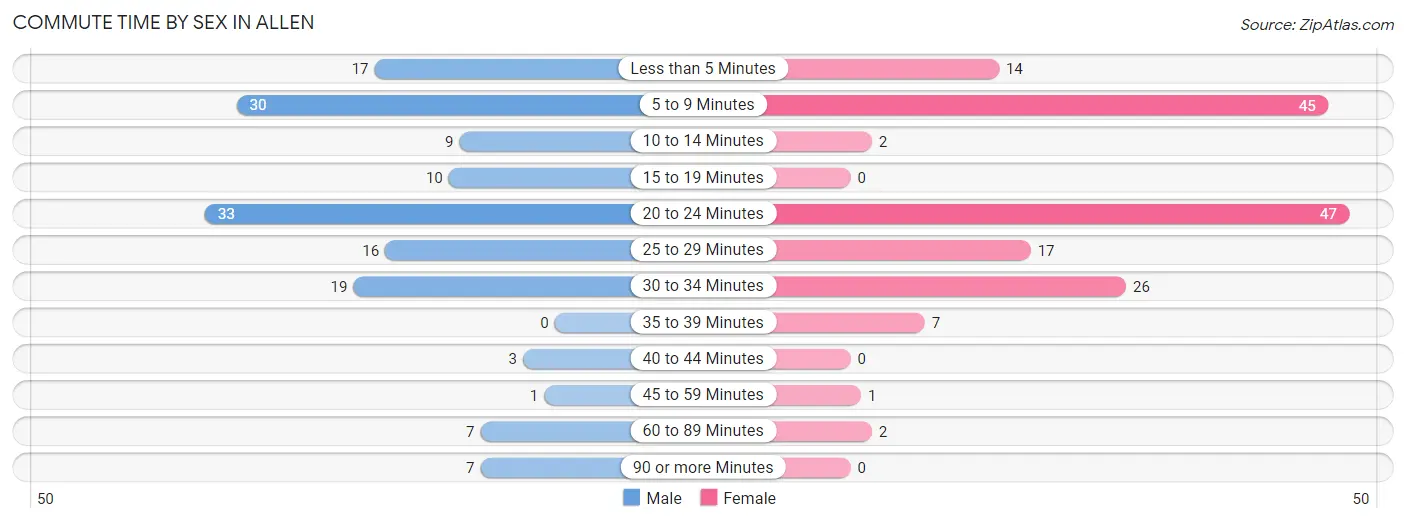
| Commute Time | Male | Female |
| Less than 5 Minutes | 17 (11.2%) | 14 (8.7%) |
| 5 to 9 Minutes | 30 (19.7%) | 45 (28.0%) |
| 10 to 14 Minutes | 9 (5.9%) | 2 (1.2%) |
| 15 to 19 Minutes | 10 (6.6%) | 0 (0.0%) |
| 20 to 24 Minutes | 33 (21.7%) | 47 (29.2%) |
| 25 to 29 Minutes | 16 (10.5%) | 17 (10.6%) |
| 30 to 34 Minutes | 19 (12.5%) | 26 (16.2%) |
| 35 to 39 Minutes | 0 (0.0%) | 7 (4.3%) |
| 40 to 44 Minutes | 3 (2.0%) | 0 (0.0%) |
| 45 to 59 Minutes | 1 (0.7%) | 1 (0.6%) |
| 60 to 89 Minutes | 7 (4.6%) | 2 (1.2%) |
| 90 or more Minutes | 7 (4.6%) | 0 (0.0%) |
Time of Departure to Work by Sex in Allen
The most frequent times of departure to work in Allen are 7:30 AM to 7:59 AM (27, 17.8%) for males and 7:30 AM to 7:59 AM (55, 34.2%) for females.
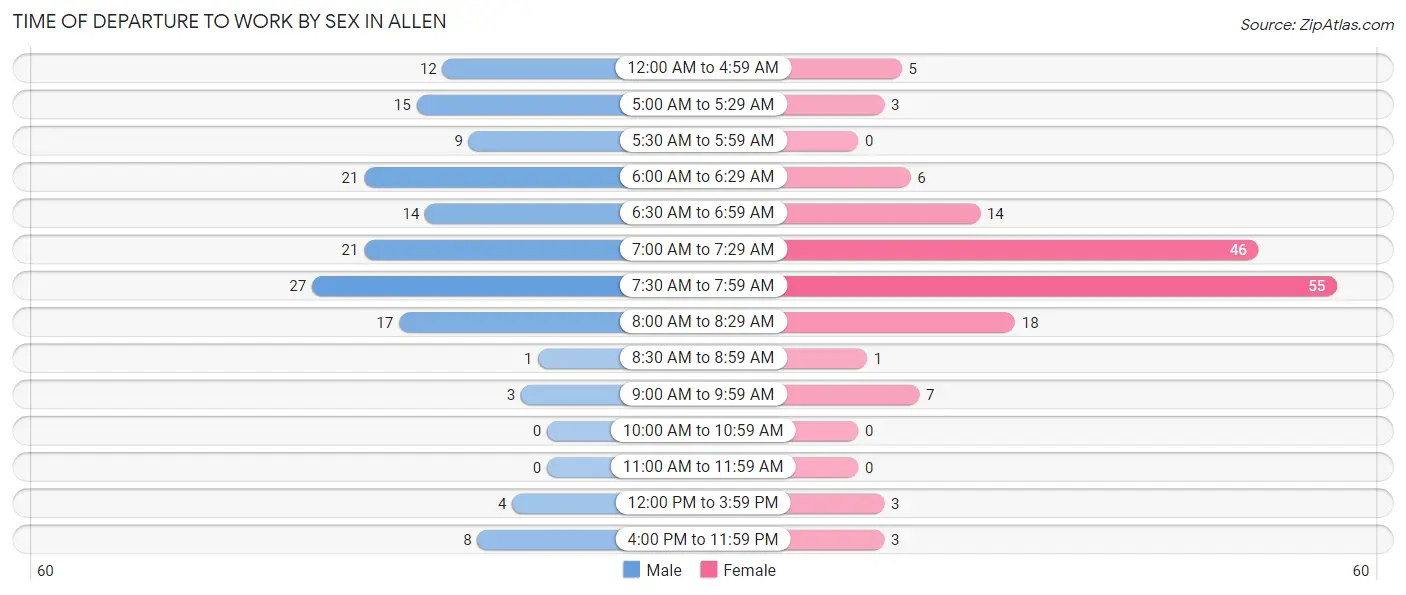
| Time of Departure | Male | Female |
| 12:00 AM to 4:59 AM | 12 (7.9%) | 5 (3.1%) |
| 5:00 AM to 5:29 AM | 15 (9.9%) | 3 (1.9%) |
| 5:30 AM to 5:59 AM | 9 (5.9%) | 0 (0.0%) |
| 6:00 AM to 6:29 AM | 21 (13.8%) | 6 (3.7%) |
| 6:30 AM to 6:59 AM | 14 (9.2%) | 14 (8.7%) |
| 7:00 AM to 7:29 AM | 21 (13.8%) | 46 (28.6%) |
| 7:30 AM to 7:59 AM | 27 (17.8%) | 55 (34.2%) |
| 8:00 AM to 8:29 AM | 17 (11.2%) | 18 (11.2%) |
| 8:30 AM to 8:59 AM | 1 (0.7%) | 1 (0.6%) |
| 9:00 AM to 9:59 AM | 3 (2.0%) | 7 (4.3%) |
| 10:00 AM to 10:59 AM | 0 (0.0%) | 0 (0.0%) |
| 11:00 AM to 11:59 AM | 0 (0.0%) | 0 (0.0%) |
| 12:00 PM to 3:59 PM | 4 (2.6%) | 3 (1.9%) |
| 4:00 PM to 11:59 PM | 8 (5.3%) | 3 (1.9%) |
| Total | 152 (100.0%) | 161 (100.0%) |
Housing Occupancy in Allen
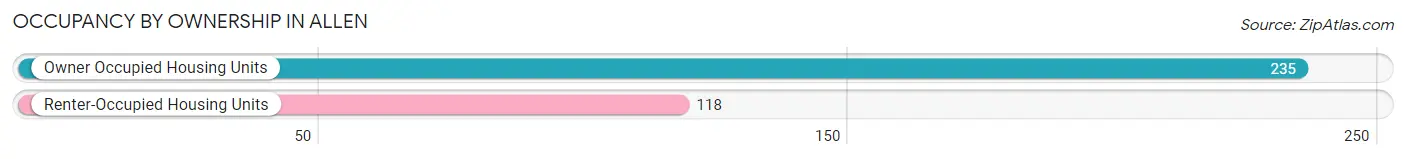
Occupancy by Ownership in Allen
Of the total 353 dwellings in Allen, owner-occupied units account for 235 (66.6%), while renter-occupied units make up 118 (33.4%).
| Occupancy | # Housing Units | % Housing Units |
| Owner Occupied Housing Units | 235 | 66.6% |
| Renter-Occupied Housing Units | 118 | 33.4% |
| Total Occupied Housing Units | 353 | 100.0% |
Occupancy by Household Size in Allen
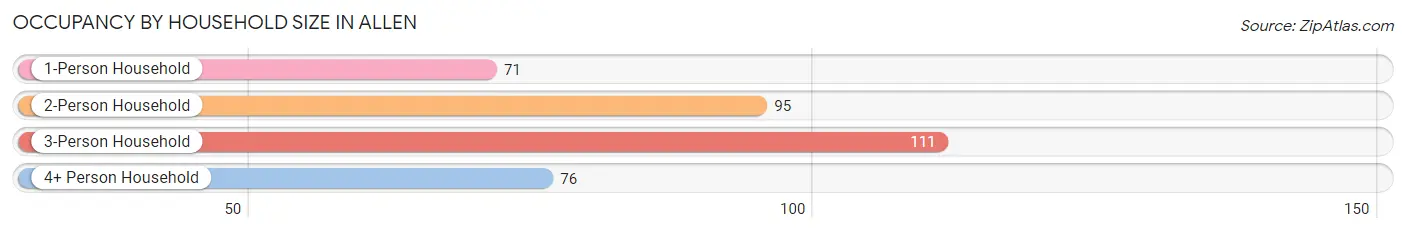
| Household Size | # Housing Units | % Housing Units |
| 1-Person Household | 71 | 20.1% |
| 2-Person Household | 95 | 26.9% |
| 3-Person Household | 111 | 31.4% |
| 4+ Person Household | 76 | 21.5% |
| Total Housing Units | 353 | 100.0% |
Occupancy by Ownership by Household Size in Allen
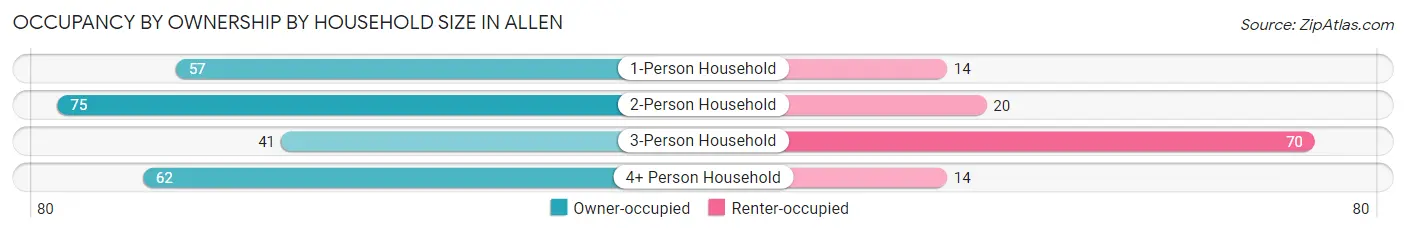
| Household Size | Owner-occupied | Renter-occupied |
| 1-Person Household | 57 (80.3%) | 14 (19.7%) |
| 2-Person Household | 75 (78.9%) | 20 (21.0%) |
| 3-Person Household | 41 (36.9%) | 70 (63.1%) |
| 4+ Person Household | 62 (81.6%) | 14 (18.4%) |
| Total Housing Units | 235 (66.6%) | 118 (33.4%) |
Occupancy by Educational Attainment in Allen
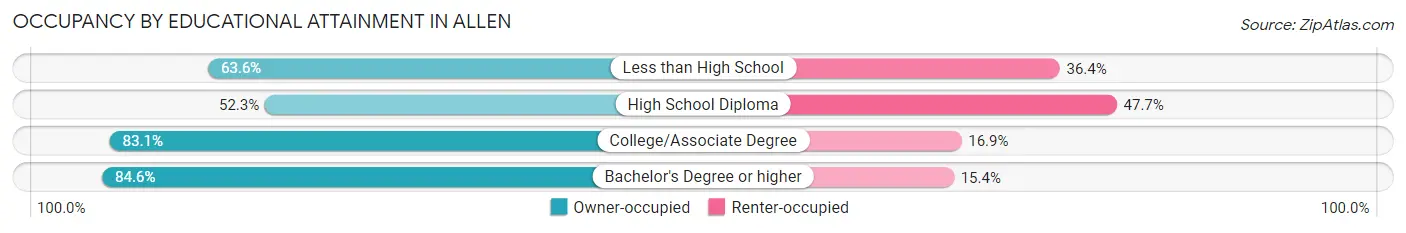
| Household Size | Owner-occupied | Renter-occupied |
| Less than High School | 21 (63.6%) | 12 (36.4%) |
| High School Diploma | 90 (52.3%) | 82 (47.7%) |
| College/Associate Degree | 69 (83.1%) | 14 (16.9%) |
| Bachelor's Degree or higher | 55 (84.6%) | 10 (15.4%) |
Occupancy by Age of Householder in Allen
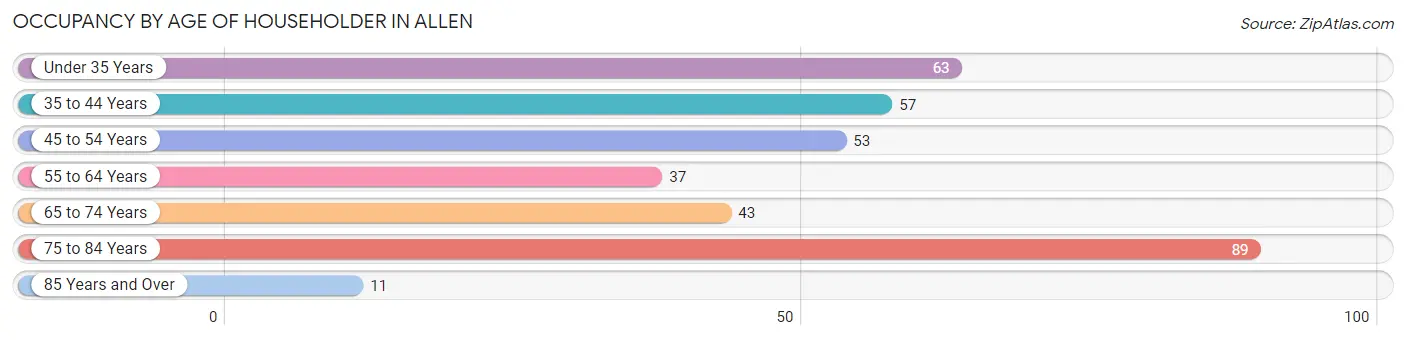
| Age Bracket | # Households | % Households |
| Under 35 Years | 63 | 17.8% |
| 35 to 44 Years | 57 | 16.2% |
| 45 to 54 Years | 53 | 15.0% |
| 55 to 64 Years | 37 | 10.5% |
| 65 to 74 Years | 43 | 12.2% |
| 75 to 84 Years | 89 | 25.2% |
| 85 Years and Over | 11 | 3.1% |
| Total | 353 | 100.0% |
Housing Finances in Allen
Median Income by Occupancy in Allen
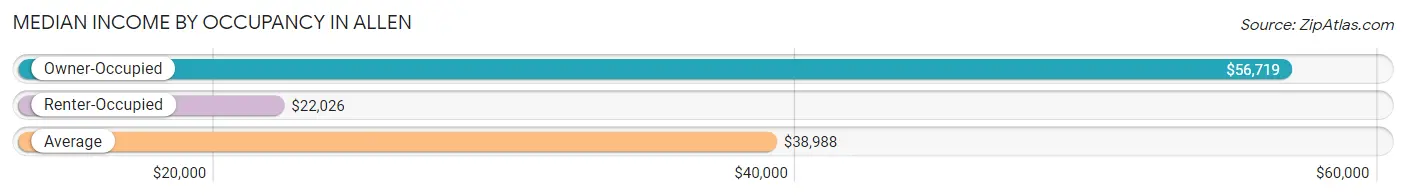
| Occupancy Type | # Households | Median Income |
| Owner-Occupied | 235 (66.6%) | $56,719 |
| Renter-Occupied | 118 (33.4%) | $22,026 |
| Average | 353 (100.0%) | $38,988 |
Occupancy by Householder Income Bracket in Allen
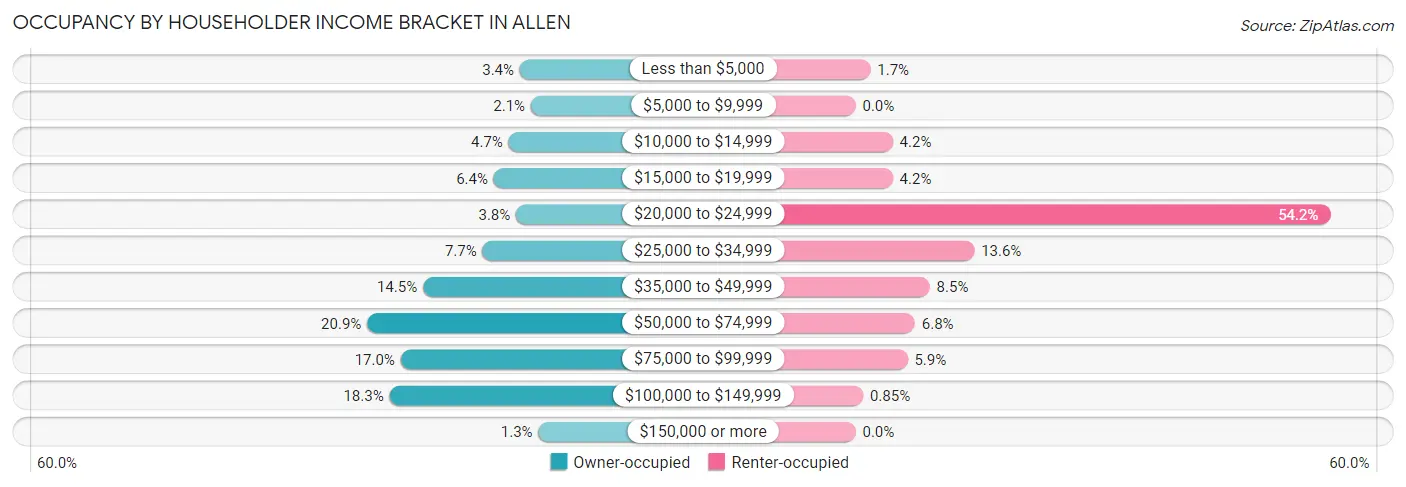
| Income Bracket | Owner-occupied | Renter-occupied |
| Less than $5,000 | 8 (3.4%) | 2 (1.7%) |
| $5,000 to $9,999 | 5 (2.1%) | 0 (0.0%) |
| $10,000 to $14,999 | 11 (4.7%) | 5 (4.2%) |
| $15,000 to $19,999 | 15 (6.4%) | 5 (4.2%) |
| $20,000 to $24,999 | 9 (3.8%) | 64 (54.2%) |
| $25,000 to $34,999 | 18 (7.7%) | 16 (13.6%) |
| $35,000 to $49,999 | 34 (14.5%) | 10 (8.5%) |
| $50,000 to $74,999 | 49 (20.8%) | 8 (6.8%) |
| $75,000 to $99,999 | 40 (17.0%) | 7 (5.9%) |
| $100,000 to $149,999 | 43 (18.3%) | 1 (0.9%) |
| $150,000 or more | 3 (1.3%) | 0 (0.0%) |
| Total | 235 (100.0%) | 118 (100.0%) |
Monthly Housing Cost Tiers in Allen
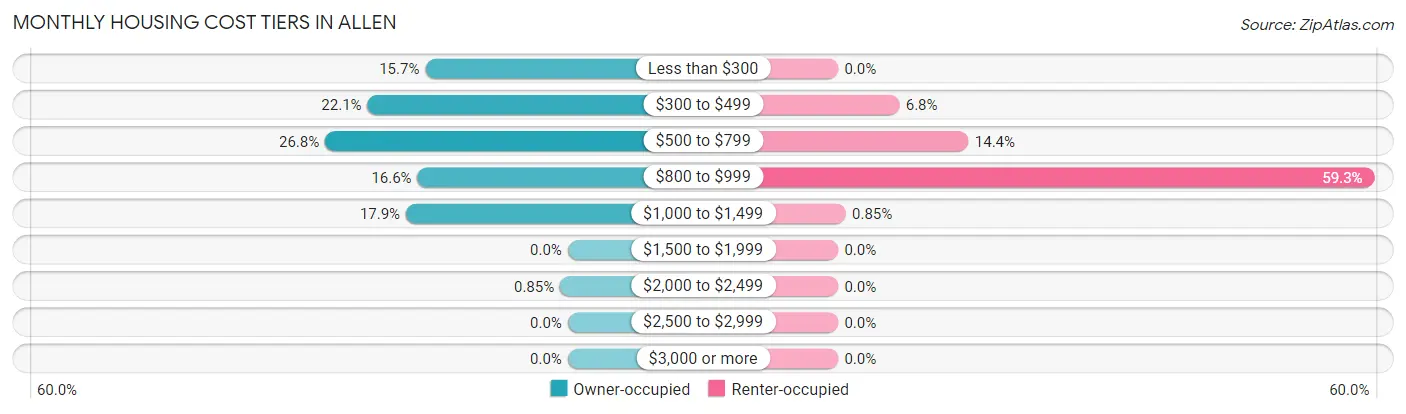
| Monthly Cost | Owner-occupied | Renter-occupied |
| Less than $300 | 37 (15.7%) | 0 (0.0%) |
| $300 to $499 | 52 (22.1%) | 8 (6.8%) |
| $500 to $799 | 63 (26.8%) | 17 (14.4%) |
| $800 to $999 | 39 (16.6%) | 70 (59.3%) |
| $1,000 to $1,499 | 42 (17.9%) | 1 (0.9%) |
| $1,500 to $1,999 | 0 (0.0%) | 0 (0.0%) |
| $2,000 to $2,499 | 2 (0.9%) | 0 (0.0%) |
| $2,500 to $2,999 | 0 (0.0%) | 0 (0.0%) |
| $3,000 or more | 0 (0.0%) | 0 (0.0%) |
| Total | 235 (100.0%) | 118 (100.0%) |
Physical Housing Characteristics in Allen
Housing Structures in Allen
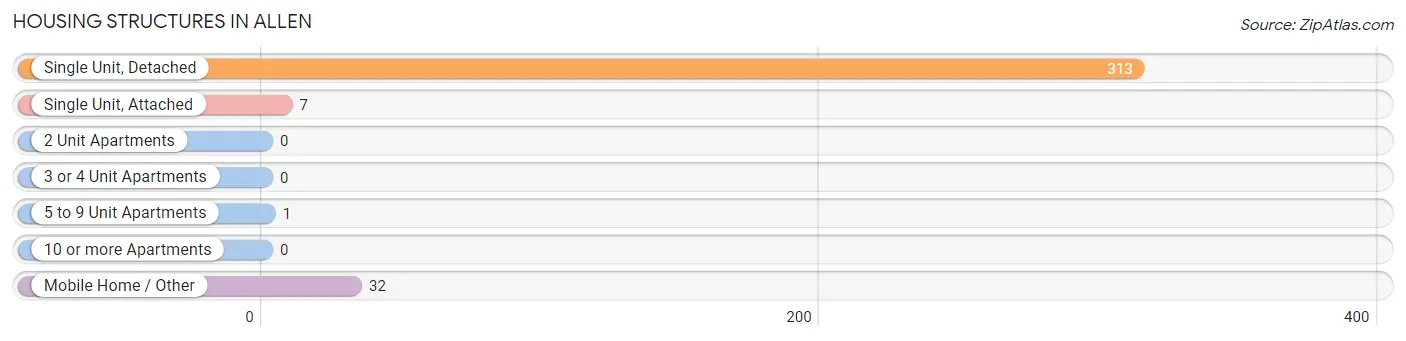
| Structure Type | # Housing Units | % Housing Units |
| Single Unit, Detached | 313 | 88.7% |
| Single Unit, Attached | 7 | 2.0% |
| 2 Unit Apartments | 0 | 0.0% |
| 3 or 4 Unit Apartments | 0 | 0.0% |
| 5 to 9 Unit Apartments | 1 | 0.3% |
| 10 or more Apartments | 0 | 0.0% |
| Mobile Home / Other | 32 | 9.1% |
| Total | 353 | 100.0% |
Housing Structures by Occupancy in Allen
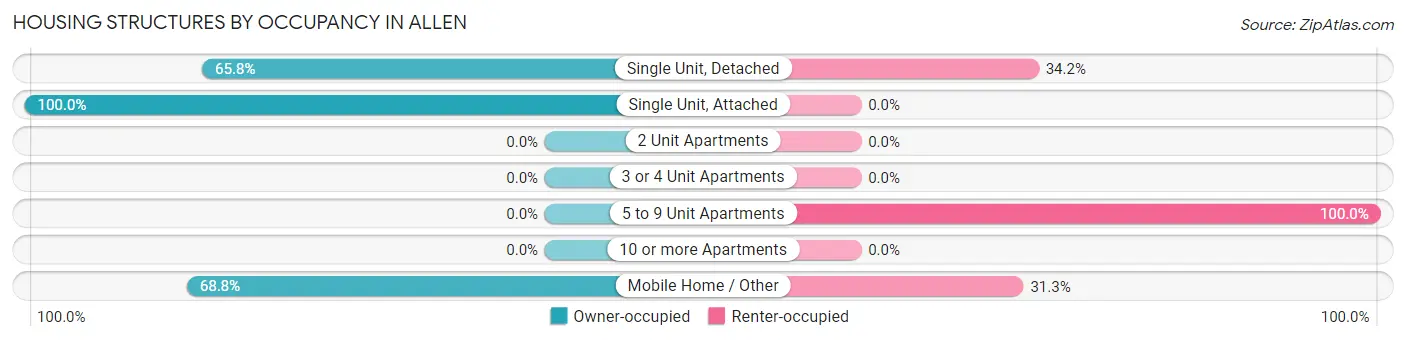
| Structure Type | Owner-occupied | Renter-occupied |
| Single Unit, Detached | 206 (65.8%) | 107 (34.2%) |
| Single Unit, Attached | 7 (100.0%) | 0 (0.0%) |
| 2 Unit Apartments | 0 (0.0%) | 0 (0.0%) |
| 3 or 4 Unit Apartments | 0 (0.0%) | 0 (0.0%) |
| 5 to 9 Unit Apartments | 0 (0.0%) | 1 (100.0%) |
| 10 or more Apartments | 0 (0.0%) | 0 (0.0%) |
| Mobile Home / Other | 22 (68.8%) | 10 (31.2%) |
| Total | 235 (66.6%) | 118 (33.4%) |
Housing Structures by Number of Rooms in Allen
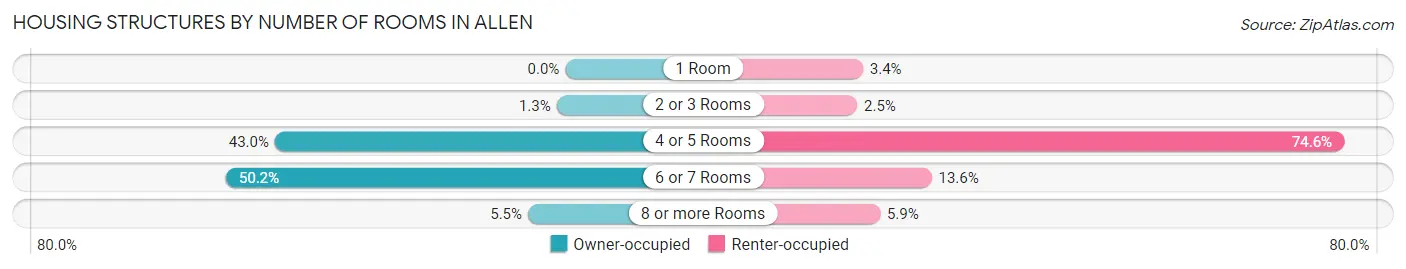
| Number of Rooms | Owner-occupied | Renter-occupied |
| 1 Room | 0 (0.0%) | 4 (3.4%) |
| 2 or 3 Rooms | 3 (1.3%) | 3 (2.5%) |
| 4 or 5 Rooms | 101 (43.0%) | 88 (74.6%) |
| 6 or 7 Rooms | 118 (50.2%) | 16 (13.6%) |
| 8 or more Rooms | 13 (5.5%) | 7 (5.9%) |
| Total | 235 (100.0%) | 118 (100.0%) |
Housing Structure by Heating Type in Allen
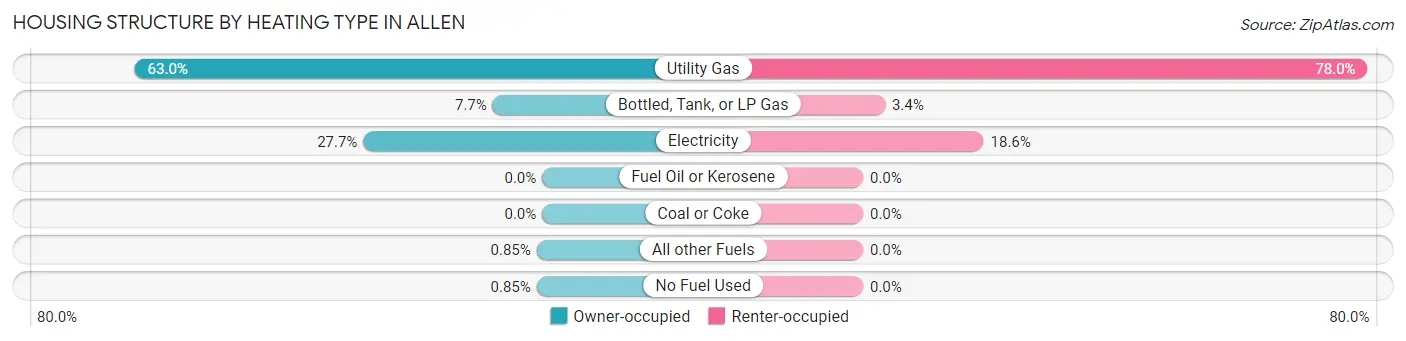
| Heating Type | Owner-occupied | Renter-occupied |
| Utility Gas | 148 (63.0%) | 92 (78.0%) |
| Bottled, Tank, or LP Gas | 18 (7.7%) | 4 (3.4%) |
| Electricity | 65 (27.7%) | 22 (18.6%) |
| Fuel Oil or Kerosene | 0 (0.0%) | 0 (0.0%) |
| Coal or Coke | 0 (0.0%) | 0 (0.0%) |
| All other Fuels | 2 (0.9%) | 0 (0.0%) |
| No Fuel Used | 2 (0.9%) | 0 (0.0%) |
| Total | 235 (100.0%) | 118 (100.0%) |
Household Vehicle Usage in Allen
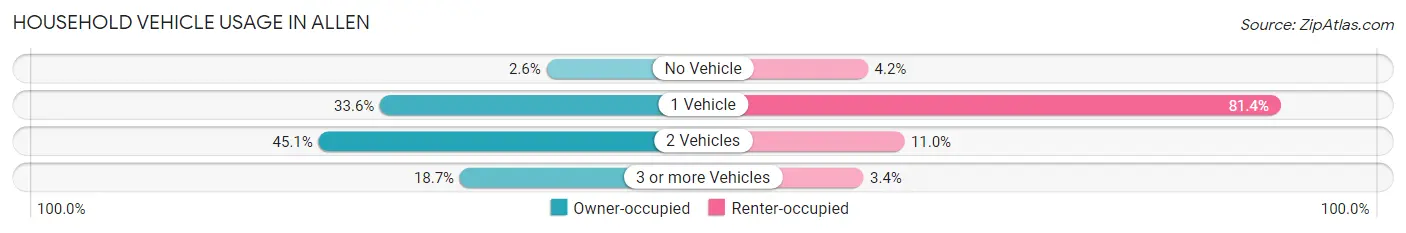
| Vehicles per Household | Owner-occupied | Renter-occupied |
| No Vehicle | 6 (2.5%) | 5 (4.2%) |
| 1 Vehicle | 79 (33.6%) | 96 (81.4%) |
| 2 Vehicles | 106 (45.1%) | 13 (11.0%) |
| 3 or more Vehicles | 44 (18.7%) | 4 (3.4%) |
| Total | 235 (100.0%) | 118 (100.0%) |
Real Estate & Mortgages in Allen
Real Estate and Mortgage Overview in Allen
| Characteristic | Without Mortgage | With Mortgage |
| Housing Units | 111 | 124 |
| Median Property Value | $81,700 | $80,800 |
| Median Household Income | $39,861 | $2 |
| Monthly Housing Costs | $351 | $0 |
| Real Estate Taxes | $407 | $10 |
Property Value by Mortgage Status in Allen
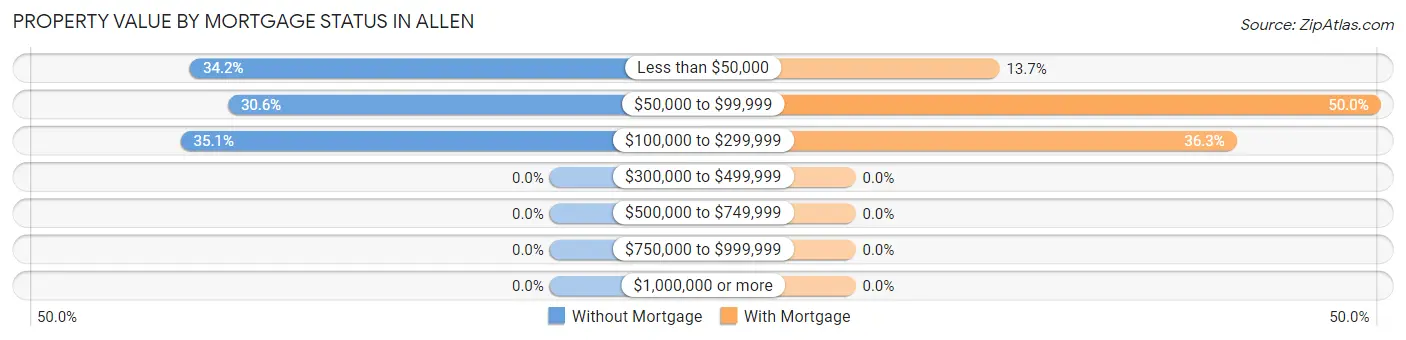
| Property Value | Without Mortgage | With Mortgage |
| Less than $50,000 | 38 (34.2%) | 17 (13.7%) |
| $50,000 to $99,999 | 34 (30.6%) | 62 (50.0%) |
| $100,000 to $299,999 | 39 (35.1%) | 45 (36.3%) |
| $300,000 to $499,999 | 0 (0.0%) | 0 (0.0%) |
| $500,000 to $749,999 | 0 (0.0%) | 0 (0.0%) |
| $750,000 to $999,999 | 0 (0.0%) | 0 (0.0%) |
| $1,000,000 or more | 0 (0.0%) | 0 (0.0%) |
| Total | 111 (100.0%) | 124 (100.0%) |
Household Income by Mortgage Status in Allen
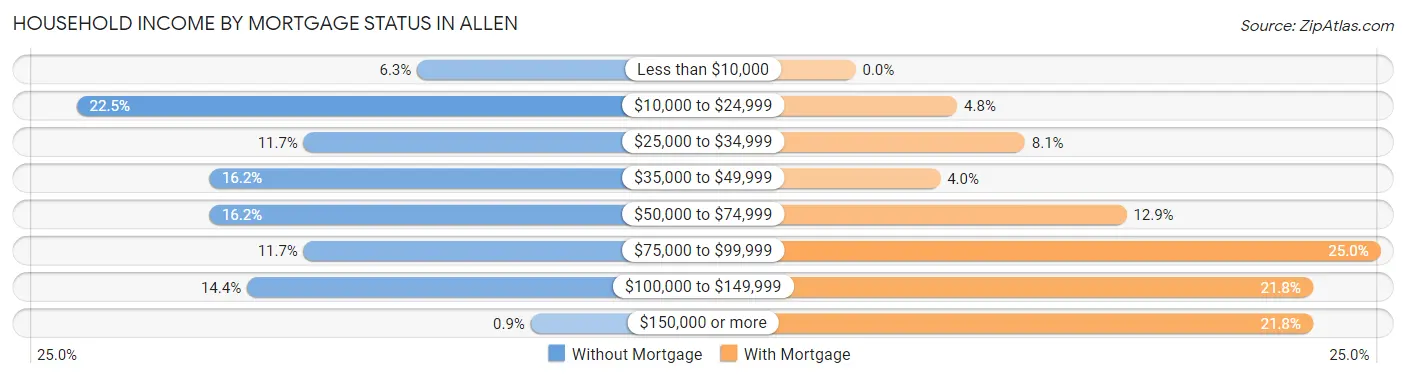
| Household Income | Without Mortgage | With Mortgage |
| Less than $10,000 | 7 (6.3%) | 0 (0.0%) |
| $10,000 to $24,999 | 25 (22.5%) | 6 (4.8%) |
| $25,000 to $34,999 | 13 (11.7%) | 10 (8.1%) |
| $35,000 to $49,999 | 18 (16.2%) | 5 (4.0%) |
| $50,000 to $74,999 | 18 (16.2%) | 16 (12.9%) |
| $75,000 to $99,999 | 13 (11.7%) | 31 (25.0%) |
| $100,000 to $149,999 | 16 (14.4%) | 27 (21.8%) |
| $150,000 or more | 1 (0.9%) | 27 (21.8%) |
| Total | 111 (100.0%) | 124 (100.0%) |
Property Value to Household Income Ratio in Allen
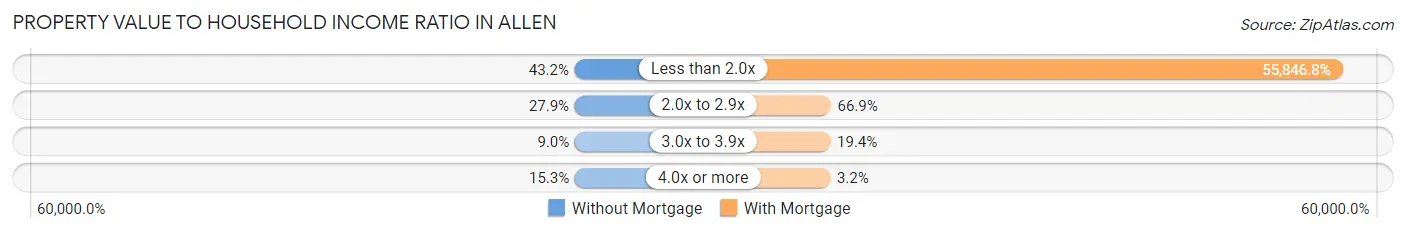
| Value-to-Income Ratio | Without Mortgage | With Mortgage |
| Less than 2.0x | 48 (43.2%) | 69,250 (55,846.8%) |
| 2.0x to 2.9x | 31 (27.9%) | 83 (66.9%) |
| 3.0x to 3.9x | 10 (9.0%) | 24 (19.4%) |
| 4.0x or more | 17 (15.3%) | 4 (3.2%) |
| Total | 111 (100.0%) | 124 (100.0%) |
Real Estate Taxes by Mortgage Status in Allen
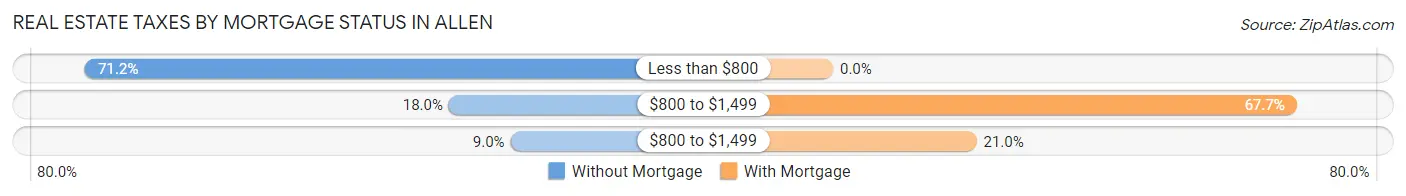
| Property Taxes | Without Mortgage | With Mortgage |
| Less than $800 | 79 (71.2%) | 0 (0.0%) |
| $800 to $1,499 | 20 (18.0%) | 84 (67.7%) |
| $800 to $1,499 | 10 (9.0%) | 26 (21.0%) |
| Total | 111 (100.0%) | 124 (100.0%) |
Health & Disability in Allen
Health Insurance Coverage by Age in Allen
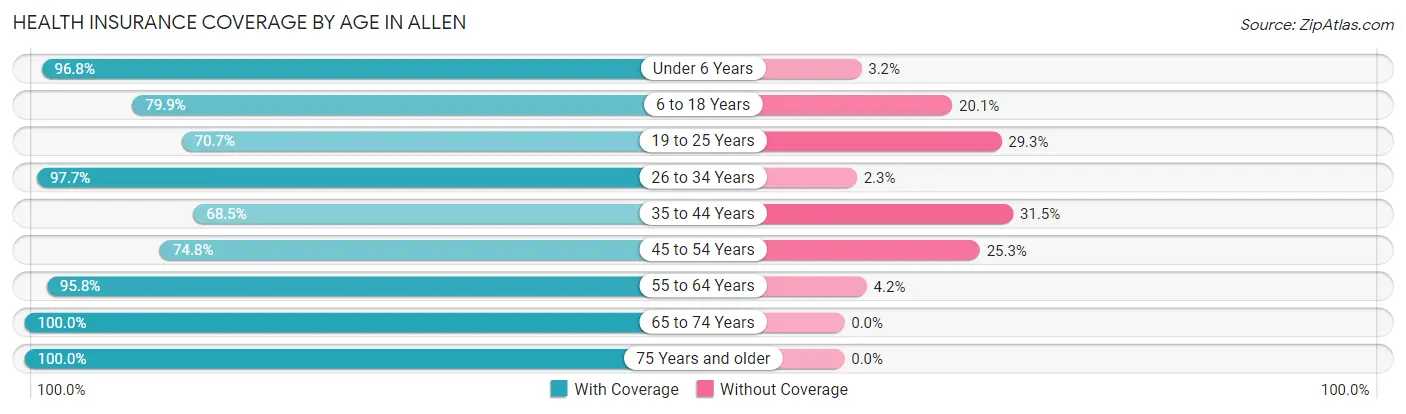
| Age Bracket | With Coverage | Without Coverage |
| Under 6 Years | 61 (96.8%) | 2 (3.2%) |
| 6 to 18 Years | 151 (79.9%) | 38 (20.1%) |
| 19 to 25 Years | 29 (70.7%) | 12 (29.3%) |
| 26 to 34 Years | 127 (97.7%) | 3 (2.3%) |
| 35 to 44 Years | 74 (68.5%) | 34 (31.5%) |
| 45 to 54 Years | 74 (74.8%) | 25 (25.3%) |
| 55 to 64 Years | 69 (95.8%) | 3 (4.2%) |
| 65 to 74 Years | 62 (100.0%) | 0 (0.0%) |
| 75 Years and older | 162 (100.0%) | 0 (0.0%) |
| Total | 809 (87.4%) | 117 (12.6%) |
Health Insurance Coverage by Citizenship Status in Allen
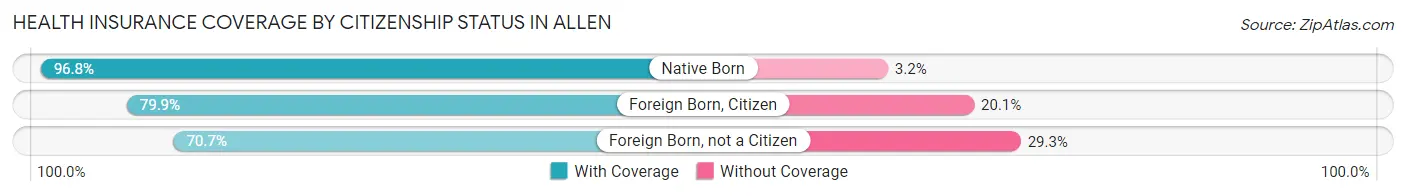
| Citizenship Status | With Coverage | Without Coverage |
| Native Born | 61 (96.8%) | 2 (3.2%) |
| Foreign Born, Citizen | 151 (79.9%) | 38 (20.1%) |
| Foreign Born, not a Citizen | 29 (70.7%) | 12 (29.3%) |
Health Insurance Coverage by Household Income in Allen
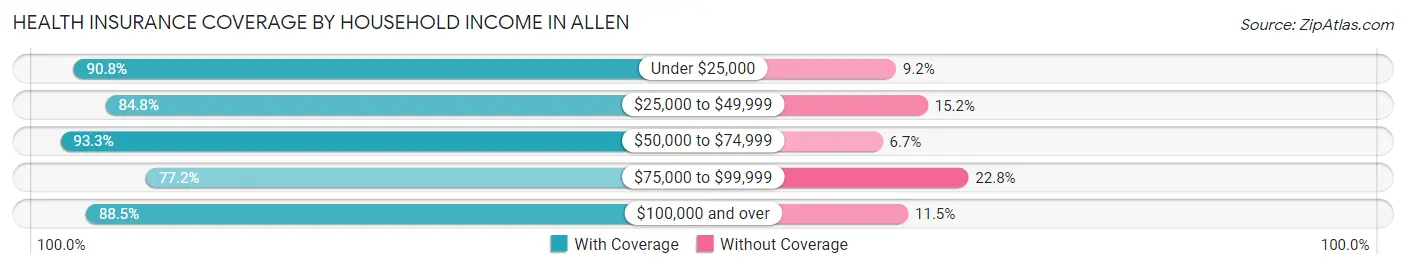
| Household Income | With Coverage | Without Coverage |
| Under $25,000 | 148 (90.8%) | 15 (9.2%) |
| $25,000 to $49,999 | 179 (84.8%) | 32 (15.2%) |
| $50,000 to $74,999 | 167 (93.3%) | 12 (6.7%) |
| $75,000 to $99,999 | 139 (77.2%) | 41 (22.8%) |
| $100,000 and over | 131 (88.5%) | 17 (11.5%) |
Public vs Private Health Insurance Coverage by Age in Allen
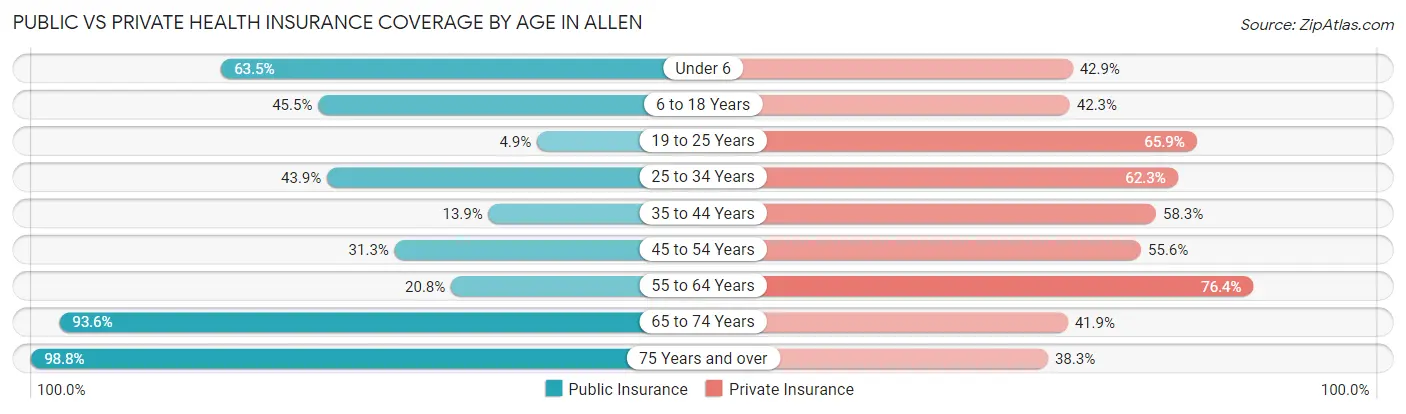
| Age Bracket | Public Insurance | Private Insurance |
| Under 6 | 40 (63.5%) | 27 (42.9%) |
| 6 to 18 Years | 86 (45.5%) | 80 (42.3%) |
| 19 to 25 Years | 2 (4.9%) | 27 (65.8%) |
| 25 to 34 Years | 57 (43.9%) | 81 (62.3%) |
| 35 to 44 Years | 15 (13.9%) | 63 (58.3%) |
| 45 to 54 Years | 31 (31.3%) | 55 (55.6%) |
| 55 to 64 Years | 15 (20.8%) | 55 (76.4%) |
| 65 to 74 Years | 58 (93.5%) | 26 (41.9%) |
| 75 Years and over | 160 (98.8%) | 62 (38.3%) |
| Total | 464 (50.1%) | 476 (51.4%) |
Disability Status by Sex by Age in Allen
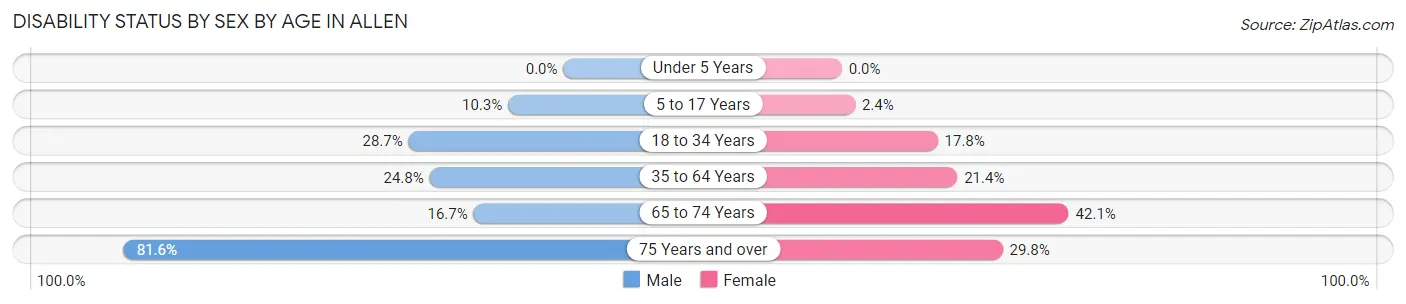
| Age Bracket | Male | Female |
| Under 5 Years | 0 (0.0%) | 0 (0.0%) |
| 5 to 17 Years | 12 (10.3%) | 2 (2.4%) |
| 18 to 34 Years | 25 (28.7%) | 16 (17.8%) |
| 35 to 64 Years | 38 (24.8%) | 27 (21.4%) |
| 65 to 74 Years | 4 (16.7%) | 16 (42.1%) |
| 75 Years and over | 31 (81.6%) | 37 (29.8%) |
Disability Class by Sex by Age in Allen
Disability Class: Hearing Difficulty
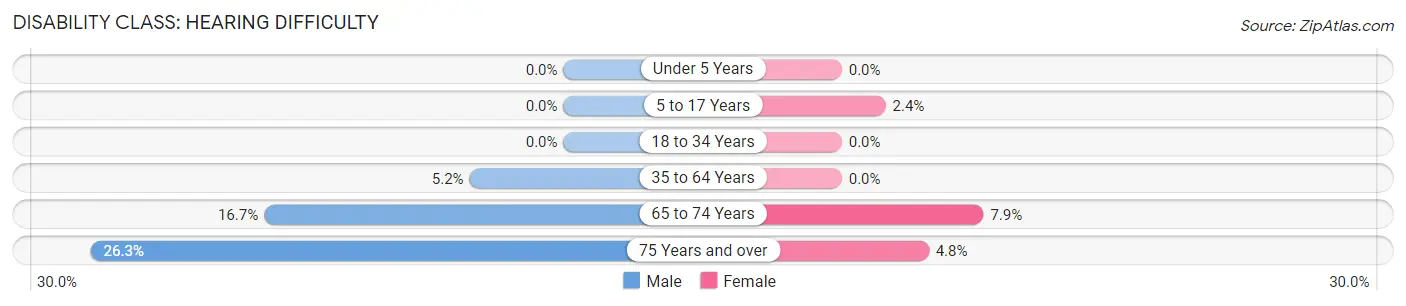
| Age Bracket | Male | Female |
| Under 5 Years | 0 (0.0%) | 0 (0.0%) |
| 5 to 17 Years | 0 (0.0%) | 2 (2.4%) |
| 18 to 34 Years | 0 (0.0%) | 0 (0.0%) |
| 35 to 64 Years | 8 (5.2%) | 0 (0.0%) |
| 65 to 74 Years | 4 (16.7%) | 3 (7.9%) |
| 75 Years and over | 10 (26.3%) | 6 (4.8%) |
Disability Class: Vision Difficulty
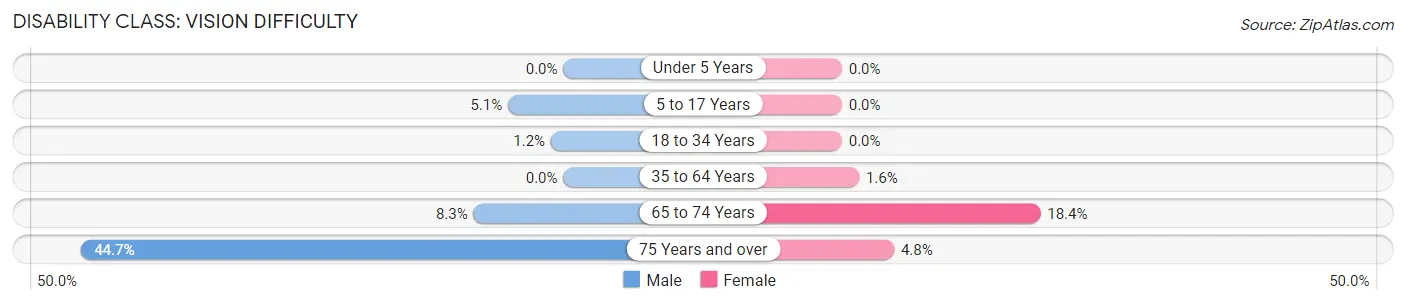
| Age Bracket | Male | Female |
| Under 5 Years | 0 (0.0%) | 0 (0.0%) |
| 5 to 17 Years | 6 (5.1%) | 0 (0.0%) |
| 18 to 34 Years | 1 (1.1%) | 0 (0.0%) |
| 35 to 64 Years | 0 (0.0%) | 2 (1.6%) |
| 65 to 74 Years | 2 (8.3%) | 7 (18.4%) |
| 75 Years and over | 17 (44.7%) | 6 (4.8%) |
Disability Class: Cognitive Difficulty
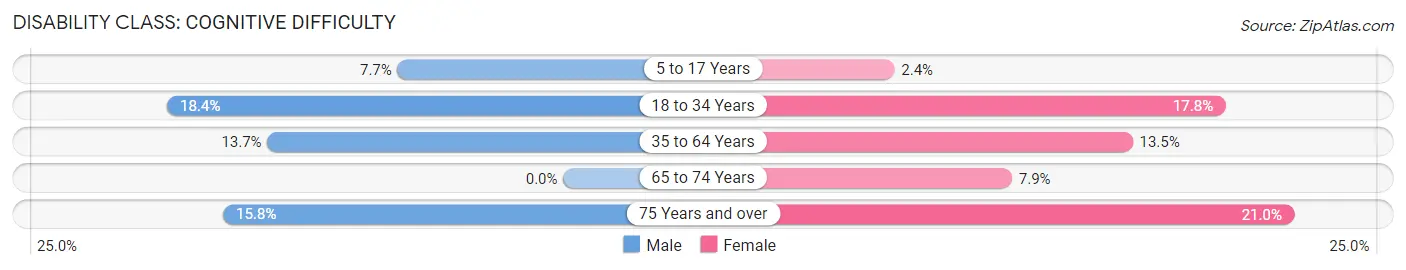
| Age Bracket | Male | Female |
| 5 to 17 Years | 9 (7.7%) | 2 (2.4%) |
| 18 to 34 Years | 16 (18.4%) | 16 (17.8%) |
| 35 to 64 Years | 21 (13.7%) | 17 (13.5%) |
| 65 to 74 Years | 0 (0.0%) | 3 (7.9%) |
| 75 Years and over | 6 (15.8%) | 26 (21.0%) |
Disability Class: Ambulatory Difficulty
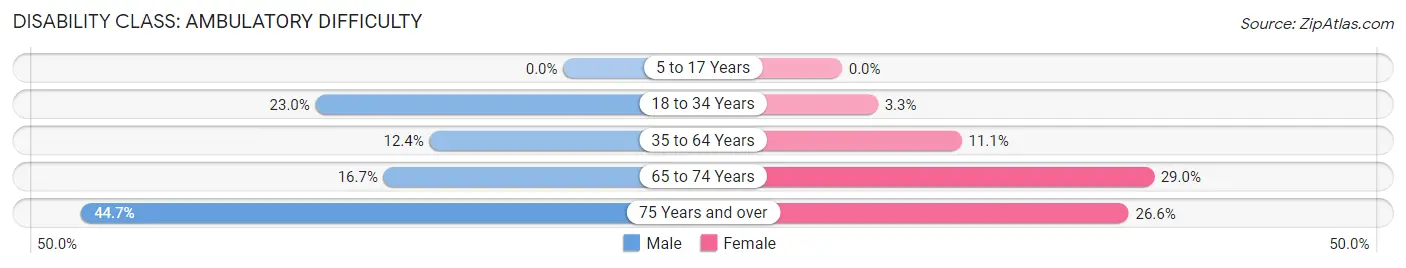
| Age Bracket | Male | Female |
| 5 to 17 Years | 0 (0.0%) | 0 (0.0%) |
| 18 to 34 Years | 20 (23.0%) | 3 (3.3%) |
| 35 to 64 Years | 19 (12.4%) | 14 (11.1%) |
| 65 to 74 Years | 4 (16.7%) | 11 (28.9%) |
| 75 Years and over | 17 (44.7%) | 33 (26.6%) |
Disability Class: Self-Care Difficulty
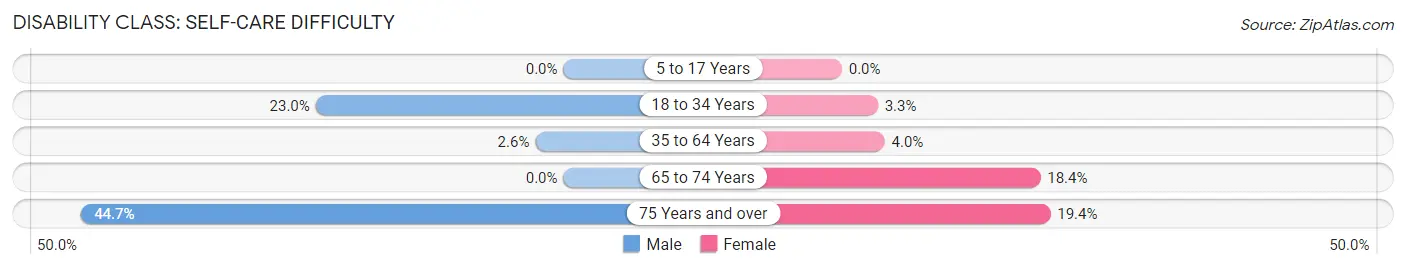
| Age Bracket | Male | Female |
| 5 to 17 Years | 0 (0.0%) | 0 (0.0%) |
| 18 to 34 Years | 20 (23.0%) | 3 (3.3%) |
| 35 to 64 Years | 4 (2.6%) | 5 (4.0%) |
| 65 to 74 Years | 0 (0.0%) | 7 (18.4%) |
| 75 Years and over | 17 (44.7%) | 24 (19.4%) |
Technology Access in Allen
Computing Device Access in Allen
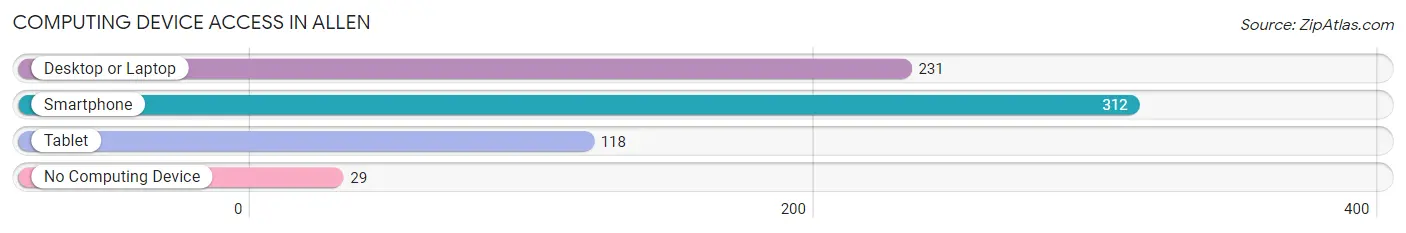
| Device Type | # Households | % Households |
| Desktop or Laptop | 231 | 65.4% |
| Smartphone | 312 | 88.4% |
| Tablet | 118 | 33.4% |
| No Computing Device | 29 | 8.2% |
| Total | 353 | 100.0% |
Internet Access in Allen
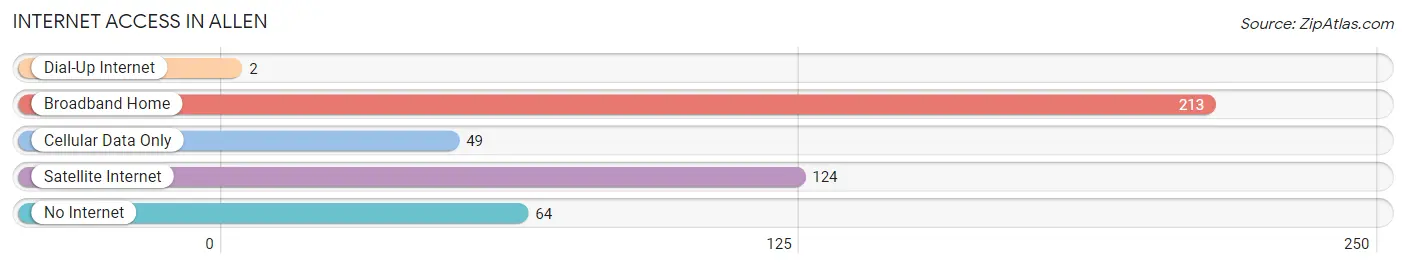
| Internet Type | # Households | % Households |
| Dial-Up Internet | 2 | 0.6% |
| Broadband Home | 213 | 60.3% |
| Cellular Data Only | 49 | 13.9% |
| Satellite Internet | 124 | 35.1% |
| No Internet | 64 | 18.1% |
| Total | 353 | 100.0% |
Allen Summary
Allen, Oklahoma is a small town located in the northeastern corner of the state. It is situated in the foothills of the Ozark Mountains and is part of the Ozark Plateau. The town is located in the county of Sequoyah and is part of the Fort Smith metropolitan area. The population of Allen was 1,845 in the 2010 census.
History
The area that is now Allen was originally inhabited by the Cherokee Nation. The town was founded in 1872 by a group of settlers from Arkansas. The town was named after the Allen family, who were among the first settlers. The town was incorporated in 1891.
In the early 1900s, Allen was a thriving agricultural community. The town was home to several cotton gins, a grist mill, and a sawmill. The town also had a hotel, a bank, and a post office.
In the 1920s, the town began to decline as the Great Depression hit the area. The population decreased and many businesses closed. The town was revitalized in the 1940s when the nearby Fort Chaffee military base was established. The base brought new jobs and economic growth to the area.
Geography
Allen is located in the foothills of the Ozark Mountains. The town is situated in the Sequoyah County and is part of the Fort Smith metropolitan area. The town is located at the intersection of US Highway 59 and State Highway 64.
The town has a total area of 1.3 square miles, all of which is land. The town is located at an elevation of 845 feet above sea level. The climate in Allen is humid subtropical, with hot summers and mild winters.
Economy
The economy of Allen is largely based on agriculture and tourism. The town is home to several farms and ranches, which produce a variety of crops and livestock. The town is also home to several tourist attractions, including the Sequoyah National Wildlife Refuge and the Fort Chaffee Military Base.
The town is also home to several small businesses, including restaurants, retail stores, and service providers. The town is also home to a branch of the Bank of Oklahoma.
Demographics
As of the 2010 census, the population of Allen was 1,845. The racial makeup of the town was 94.3% White, 0.7% African American, 0.7% Native American, 0.2% Asian, 0.1% Pacific Islander, and 3.1% from other races. The median household income was $35,938. The per capita income was $17,845.
Conclusion
Allen, Oklahoma is a small town located in the northeastern corner of the state. It is situated in the foothills of the Ozark Mountains and is part of the Ozark Plateau. The town is home to several farms and ranches, as well as several tourist attractions. The town has a population of 1,845 and a median household income of $35,938. The town is home to several small businesses, including restaurants, retail stores, and service providers.
Common Questions
What is Per Capita Income in Allen?
Per Capita income in Allen is $21,359.
What is the Median Family Income in Allen?
Median Family Income in Allen is $46,250.
What is the Median Household income in Allen?
Median Household Income in Allen is $38,988.
What is Income or Wage Gap in Allen?
Income or Wage Gap in Allen is 27.9%.
Women in Allen earn 72.1 cents for every dollar earned by a man.
What is Inequality or Gini Index in Allen?
Inequality or Gini Index in Allen is 0.40.
What is the Total Population of Allen?
Total Population of Allen is 930.
What is the Total Male Population of Allen?
Total Male Population of Allen is 448.
What is the Total Female Population of Allen?
Total Female Population of Allen is 482.
What is the Ratio of Males per 100 Females in Allen?
There are 92.95 Males per 100 Females in Allen.
What is the Ratio of Females per 100 Males in Allen?
There are 107.59 Females per 100 Males in Allen.
What is the Median Population Age in Allen?
Median Population Age in Allen is 37.6 Years.
What is the Average Family Size in Allen
Average Family Size in Allen is 2.8 People.
What is the Average Household Size in Allen
Average Household Size in Allen is 2.5 People.
How Large is the Labor Force in Allen?
There are 353 People in the Labor Forcein in Allen.
What is the Percentage of People in the Labor Force in Allen?
50.4% of People are in the Labor Force in Allen.
What is the Unemployment Rate in Allen?
Unemployment Rate in Allen is 7.1%.