Alex, OK Map & Demographics
Alex Map
Alex Overview
$23,179
PER CAPITA INCOME
$78,041
AVG FAMILY INCOME
$64,375
AVG HOUSEHOLD INCOME
2.8%
WAGE / INCOME GAP [ % ]
97.2¢/ $1
WAGE / INCOME GAP [ $ ]
$9,665
FAMILY INCOME DEFICIT
0.33
INEQUALITY / GINI INDEX
633
TOTAL POPULATION
267
MALE POPULATION
366
FEMALE POPULATION
72.95
MALES / 100 FEMALES
137.08
FEMALES / 100 MALES
31.9
MEDIAN AGE
3.5
AVG FAMILY SIZE
3.0
AVG HOUSEHOLD SIZE
241
LABOR FORCE [ PEOPLE ]
50.5%
PERCENT IN LABOR FORCE
4.6%
UNEMPLOYMENT RATE
Alex Zip Codes
Alex Area Codes
Income in Alex
Income Overview in Alex
Per Capita Income in Alex is $23,179, while median incomes of families and households are $78,041 and $64,375 respectively.
| Characteristic | Number | Measure |
| Per Capita Income | 633 | $23,179 |
| Median Family Income | 166 | $78,041 |
| Mean Family Income | 166 | $74,024 |
| Median Household Income | 212 | $64,375 |
| Mean Household Income | 212 | $66,813 |
| Income Deficit | 166 | $9,665 |
| Wage / Income Gap (%) | 633 | 2.84% |
| Wage / Income Gap ($) | 633 | 97.16¢ per $1 |
| Gini / Inequality Index | 633 | 0.33 |
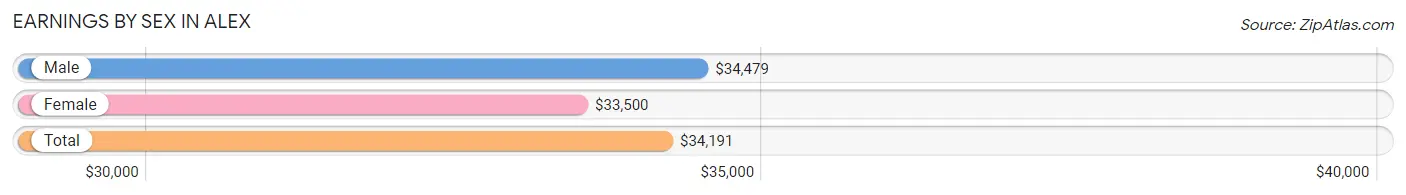
Earnings by Sex in Alex
Average Earnings in Alex are $34,191, $34,479 for men and $33,500 for women, a difference of 2.8%.
| Sex | Number | Average Earnings |
| Male | 137 (55.0%) | $34,479 |
| Female | 112 (45.0%) | $33,500 |
| Total | 249 (100.0%) | $34,191 |
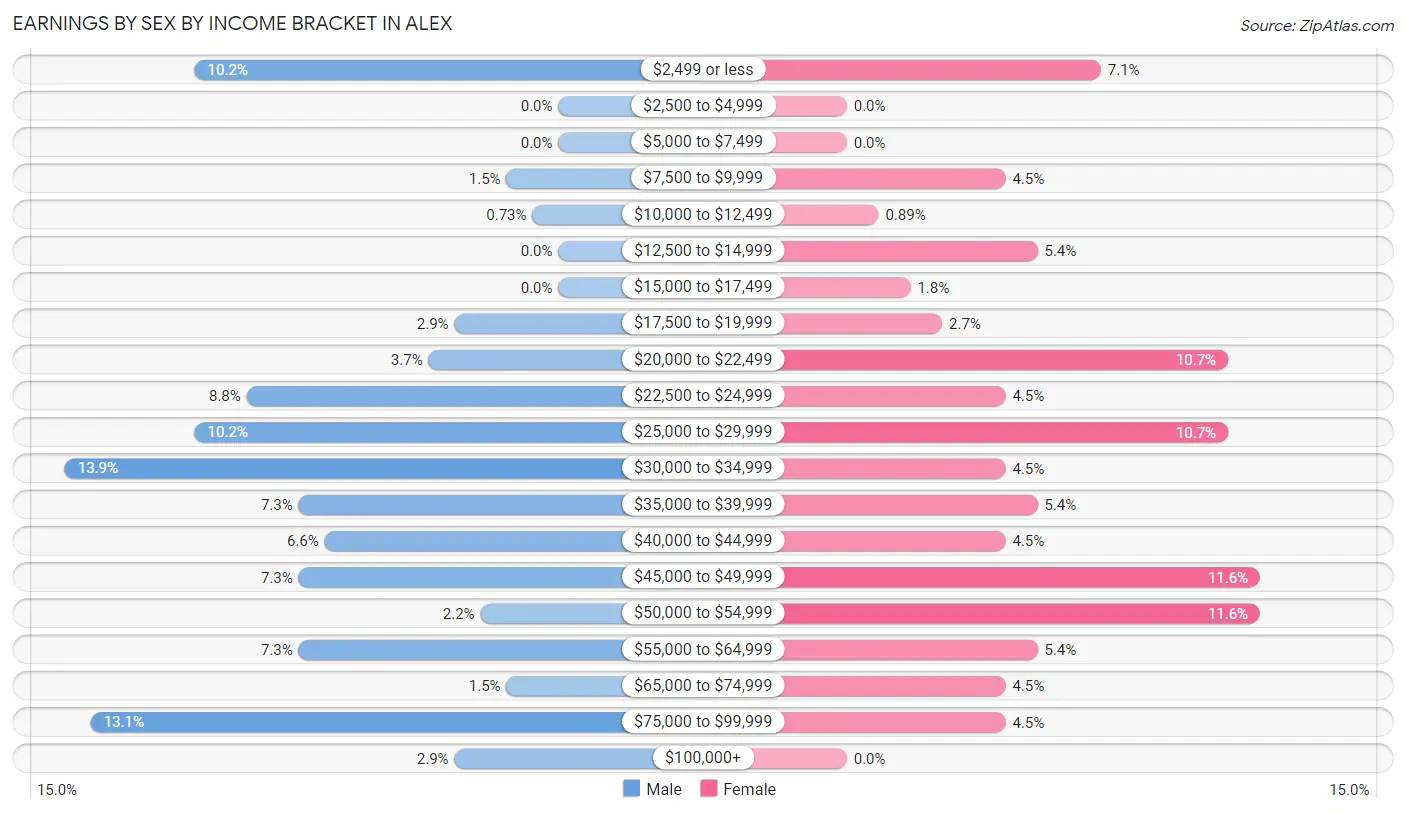
Earnings by Sex by Income Bracket in Alex
The most common earnings brackets in Alex are $30,000 to $34,999 for men (19 | 13.9%) and $45,000 to $49,999 for women (13 | 11.6%).
| Income | Male | Female |
| $2,499 or less | 14 (10.2%) | 8 (7.1%) |
| $2,500 to $4,999 | 0 (0.0%) | 0 (0.0%) |
| $5,000 to $7,499 | 0 (0.0%) | 0 (0.0%) |
| $7,500 to $9,999 | 2 (1.5%) | 5 (4.5%) |
| $10,000 to $12,499 | 1 (0.7%) | 1 (0.9%) |
| $12,500 to $14,999 | 0 (0.0%) | 6 (5.4%) |
| $15,000 to $17,499 | 0 (0.0%) | 2 (1.8%) |
| $17,500 to $19,999 | 4 (2.9%) | 3 (2.7%) |
| $20,000 to $22,499 | 5 (3.6%) | 12 (10.7%) |
| $22,500 to $24,999 | 12 (8.8%) | 5 (4.5%) |
| $25,000 to $29,999 | 14 (10.2%) | 12 (10.7%) |
| $30,000 to $34,999 | 19 (13.9%) | 5 (4.5%) |
| $35,000 to $39,999 | 10 (7.3%) | 6 (5.4%) |
| $40,000 to $44,999 | 9 (6.6%) | 5 (4.5%) |
| $45,000 to $49,999 | 10 (7.3%) | 13 (11.6%) |
| $50,000 to $54,999 | 3 (2.2%) | 13 (11.6%) |
| $55,000 to $64,999 | 10 (7.3%) | 6 (5.4%) |
| $65,000 to $74,999 | 2 (1.5%) | 5 (4.5%) |
| $75,000 to $99,999 | 18 (13.1%) | 5 (4.5%) |
| $100,000+ | 4 (2.9%) | 0 (0.0%) |
| Total | 137 (100.0%) | 112 (100.0%) |
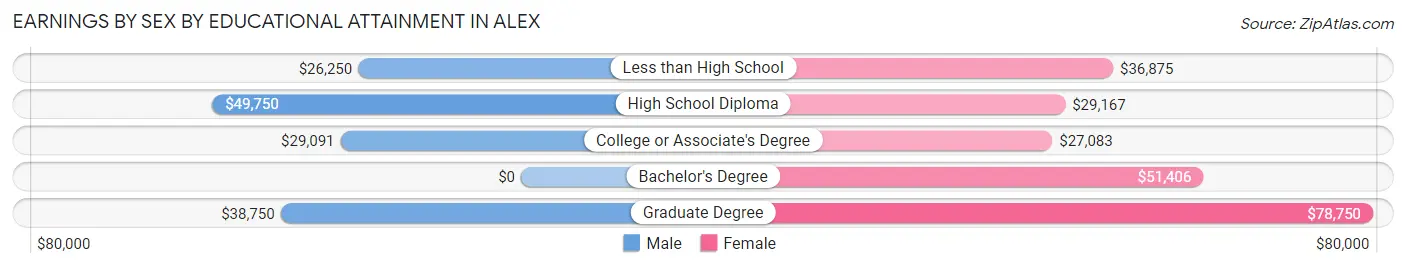
Earnings by Sex by Educational Attainment in Alex
Average earnings in Alex are $37,656 for men and $34,000 for women, a difference of 9.7%. Men with an educational attainment of high school diploma enjoy the highest average annual earnings of $49,750, while those with less than high school education earn the least with $26,250. Women with an educational attainment of graduate degree earn the most with the average annual earnings of $78,750, while those with college or associate's degree education have the smallest earnings of $27,083.
| Educational Attainment | Male Income | Female Income |
| Less than High School | $26,250 | $36,875 |
| High School Diploma | $49,750 | $29,167 |
| College or Associate's Degree | $29,091 | $27,083 |
| Bachelor's Degree | - | - |
| Graduate Degree | $38,750 | $78,750 |
| Total | $37,656 | $34,000 |
Family Income in Alex
Family Income Brackets in Alex
According to the Alex family income data, there are 54 families falling into the $75,000 to $99,999 income range, which is the most common income bracket and makes up 32.5% of all families.
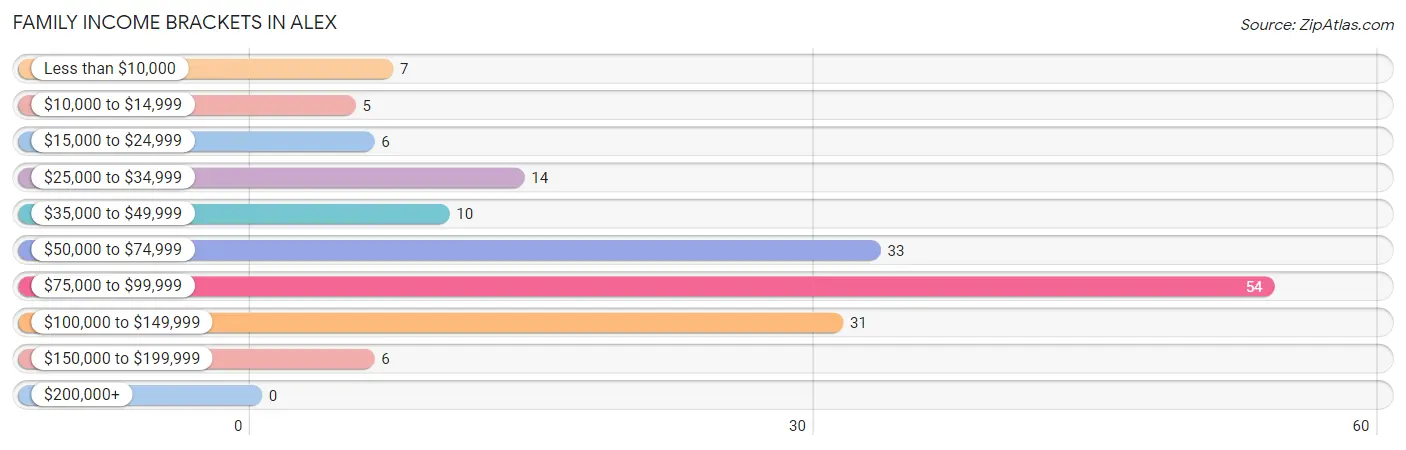
| Income Bracket | # Families | % Families |
| Less than $10,000 | 7 | 4.2% |
| $10,000 to $14,999 | 5 | 3.0% |
| $15,000 to $24,999 | 6 | 3.6% |
| $25,000 to $34,999 | 14 | 8.4% |
| $35,000 to $49,999 | 10 | 6.0% |
| $50,000 to $74,999 | 33 | 19.9% |
| $75,000 to $99,999 | 54 | 32.5% |
| $100,000 to $149,999 | 31 | 18.7% |
| $150,000 to $199,999 | 6 | 3.6% |
| $200,000+ | 0 | 0.0% |
Family Income by Famaliy Size in Alex
4-person families (14 | 8.4%) account for the highest median family income in Alex with $79,375 per family, while 2-person families (96 | 57.8%) have the highest median income of $39,242 per family member.
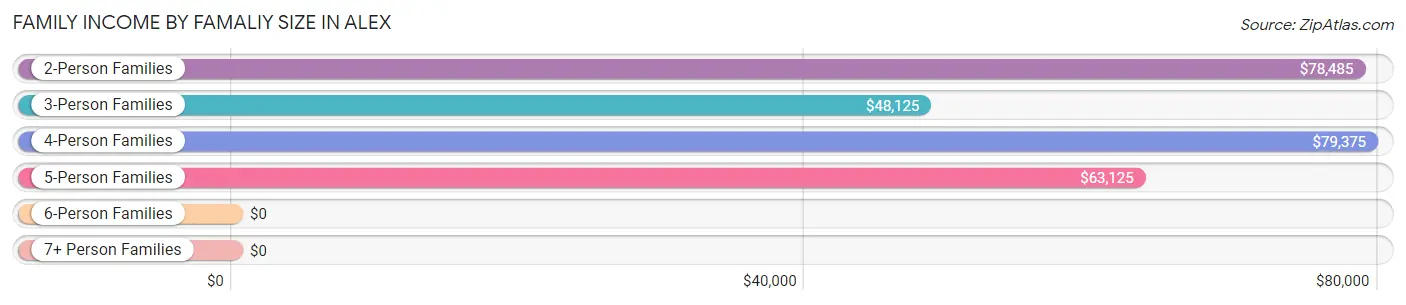
| Income Bracket | # Families | Median Income |
| 2-Person Families | 96 (57.8%) | $78,485 |
| 3-Person Families | 29 (17.5%) | $48,125 |
| 4-Person Families | 14 (8.4%) | $79,375 |
| 5-Person Families | 15 (9.0%) | $63,125 |
| 6-Person Families | 1 (0.6%) | $0 |
| 7+ Person Families | 11 (6.6%) | $0 |
| Total | 166 (100.0%) | $78,041 |
Family Income by Number of Earners in Alex
The median family income in Alex is $78,041, with families comprising 3+ earners (5) having the highest median family income of $133,125, while families with 1 earner (40) have the lowest median family income of $59,167, accounting for 3.0% and 24.1% of families, respectively.
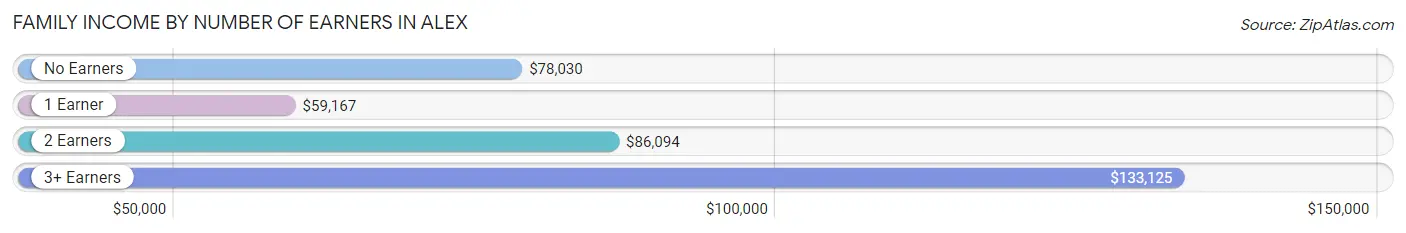
| Number of Earners | # Families | Median Income |
| No Earners | 62 (37.3%) | $78,030 |
| 1 Earner | 40 (24.1%) | $59,167 |
| 2 Earners | 59 (35.5%) | $86,094 |
| 3+ Earners | 5 (3.0%) | $133,125 |
| Total | 166 (100.0%) | $78,041 |
Household Income in Alex
Household Income Brackets in Alex
With 56 households falling in the category, the $75,000 to $99,999 income range is the most frequent in Alex, accounting for 26.4% of all households.
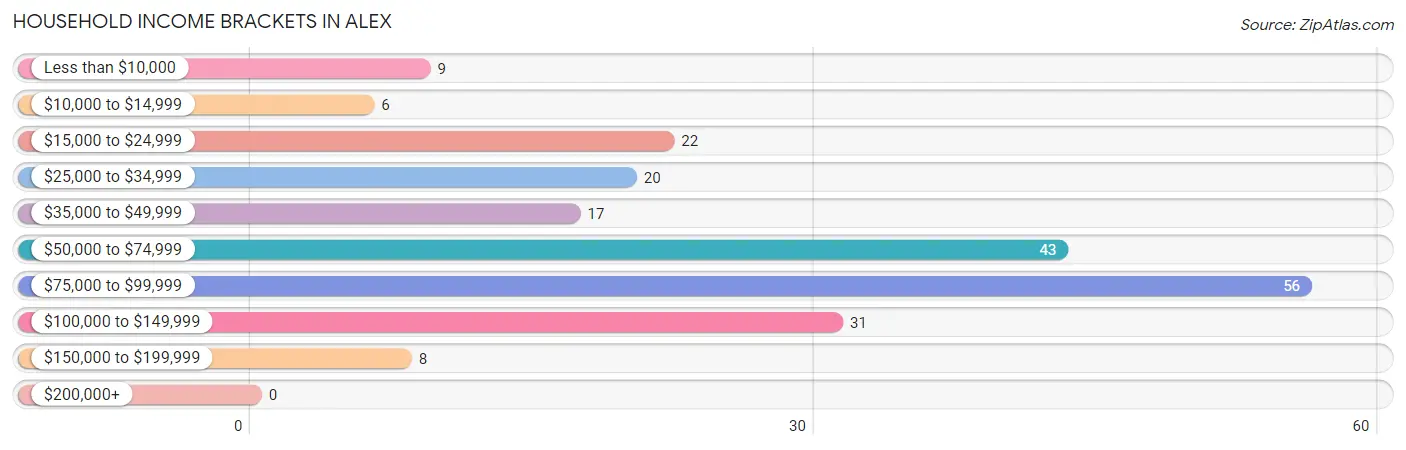
| Income Bracket | # Households | % Households |
| Less than $10,000 | 9 | 4.2% |
| $10,000 to $14,999 | 6 | 2.8% |
| $15,000 to $24,999 | 22 | 10.4% |
| $25,000 to $34,999 | 20 | 9.4% |
| $35,000 to $49,999 | 17 | 8.0% |
| $50,000 to $74,999 | 43 | 20.3% |
| $75,000 to $99,999 | 56 | 26.4% |
| $100,000 to $149,999 | 31 | 14.6% |
| $150,000 to $199,999 | 8 | 3.8% |
| $200,000+ | 0 | 0.0% |
Household Income by Householder Age in Alex
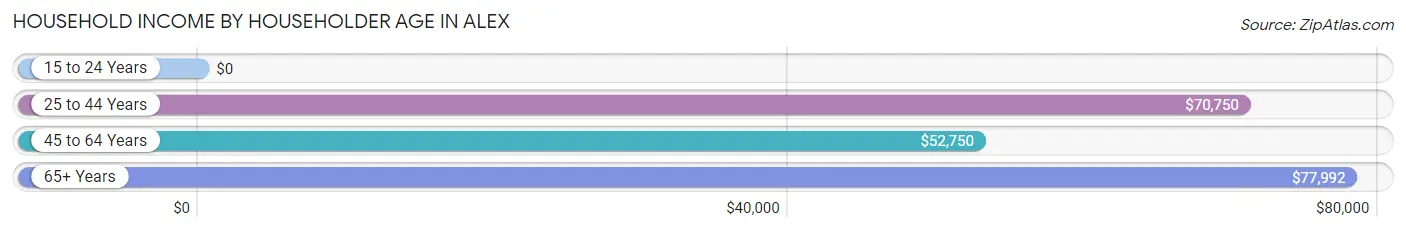
The median household income in Alex is $64,375, with the highest median household income of $77,992 found in the 65+ years age bracket for the primary householder. A total of 77 households (36.3%) fall into this category. Meanwhile, the 15 to 24 years age bracket for the primary householder has the lowest median household income of $0, with 5 households (2.4%) in this group.
| Income Bracket | # Households | Median Income |
| 15 to 24 Years | 5 (2.4%) | $0 |
| 25 to 44 Years | 79 (37.3%) | $70,750 |
| 45 to 64 Years | 51 (24.1%) | $52,750 |
| 65+ Years | 77 (36.3%) | $77,992 |
| Total | 212 (100.0%) | $64,375 |
Poverty in Alex
Income Below Poverty by Sex and Age in Alex
With 10.5% poverty level for males and 14.7% for females among the residents of Alex, 12 to 14 year old males and 5 year old females are the most vulnerable to poverty, with 3 males (27.3%) and 2 females (100.0%) in their respective age groups living below the poverty level.
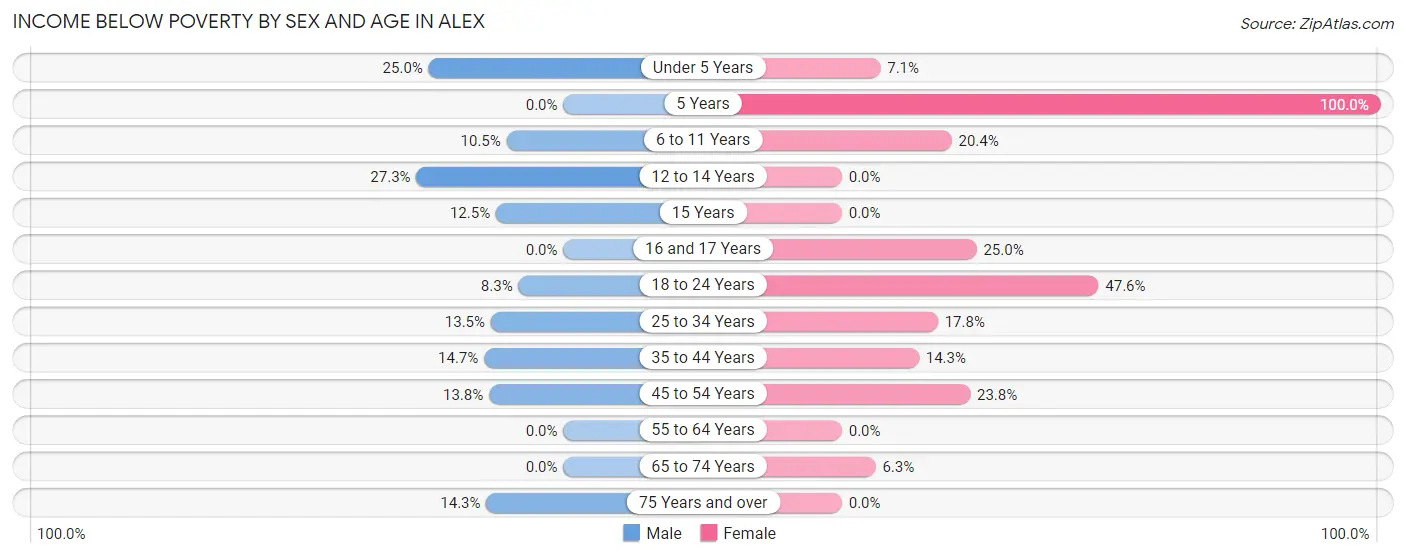
| Age Bracket | Male | Female |
| Under 5 Years | 2 (25.0%) | 2 (7.1%) |
| 5 Years | 0 (0.0%) | 2 (100.0%) |
| 6 to 11 Years | 2 (10.5%) | 11 (20.4%) |
| 12 to 14 Years | 3 (27.3%) | 0 (0.0%) |
| 15 Years | 2 (12.5%) | 0 (0.0%) |
| 16 and 17 Years | 0 (0.0%) | 2 (25.0%) |
| 18 to 24 Years | 2 (8.3%) | 10 (47.6%) |
| 25 to 34 Years | 7 (13.5%) | 13 (17.8%) |
| 35 to 44 Years | 5 (14.7%) | 8 (14.3%) |
| 45 to 54 Years | 4 (13.8%) | 5 (23.8%) |
| 55 to 64 Years | 0 (0.0%) | 0 (0.0%) |
| 65 to 74 Years | 0 (0.0%) | 1 (6.2%) |
| 75 Years and over | 1 (14.3%) | 0 (0.0%) |
| Total | 28 (10.5%) | 54 (14.7%) |
Income Above Poverty by Sex and Age in Alex
According to the poverty statistics in Alex, males aged 5 years and females aged 12 to 14 years are the age groups that are most secure financially, with 100.0% of males and 100.0% of females in these age groups living above the poverty line.
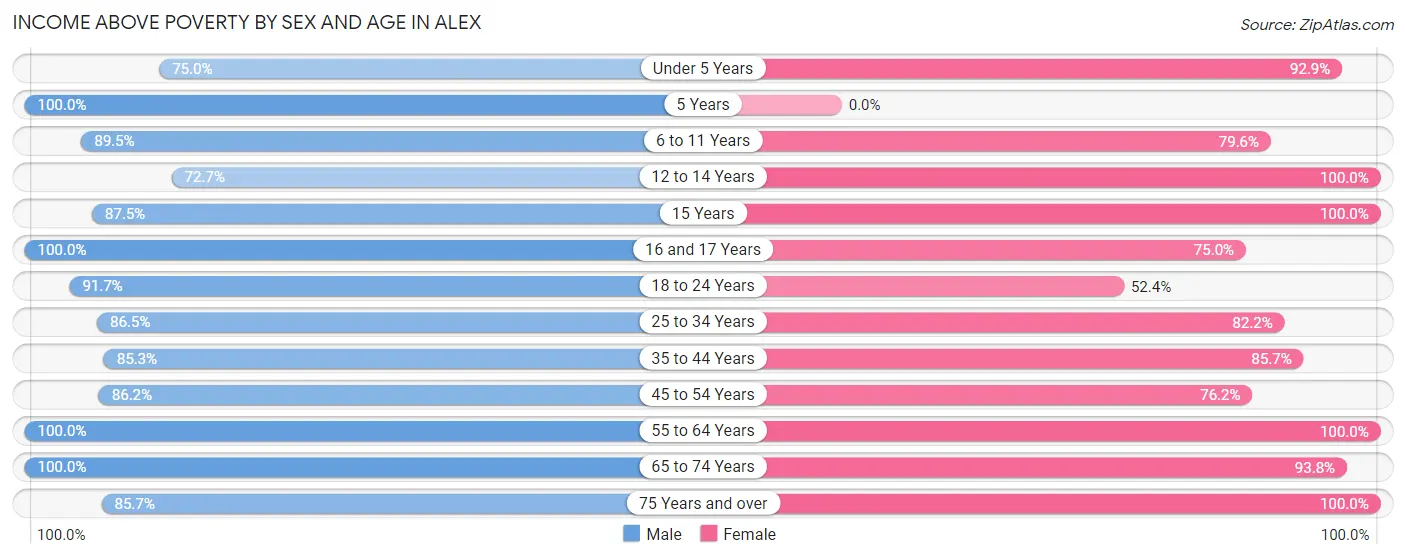
| Age Bracket | Male | Female |
| Under 5 Years | 6 (75.0%) | 26 (92.9%) |
| 5 Years | 9 (100.0%) | 0 (0.0%) |
| 6 to 11 Years | 17 (89.5%) | 43 (79.6%) |
| 12 to 14 Years | 8 (72.7%) | 7 (100.0%) |
| 15 Years | 14 (87.5%) | 2 (100.0%) |
| 16 and 17 Years | 16 (100.0%) | 6 (75.0%) |
| 18 to 24 Years | 22 (91.7%) | 11 (52.4%) |
| 25 to 34 Years | 45 (86.5%) | 60 (82.2%) |
| 35 to 44 Years | 29 (85.3%) | 48 (85.7%) |
| 45 to 54 Years | 25 (86.2%) | 16 (76.2%) |
| 55 to 64 Years | 21 (100.0%) | 26 (100.0%) |
| 65 to 74 Years | 21 (100.0%) | 15 (93.8%) |
| 75 Years and over | 6 (85.7%) | 52 (100.0%) |
| Total | 239 (89.5%) | 312 (85.3%) |
Income Below Poverty Among Married-Couple Families in Alex
The poverty statistics for married-couple families in Alex show that 12.0% or 12 of the total 100 families live below the poverty line. Families with 1 or 2 children have the highest poverty rate of 25.0%, comprising of 5 families. On the other hand, families with 5 or more children have the lowest poverty rate of 0.0%, which includes 0 families.
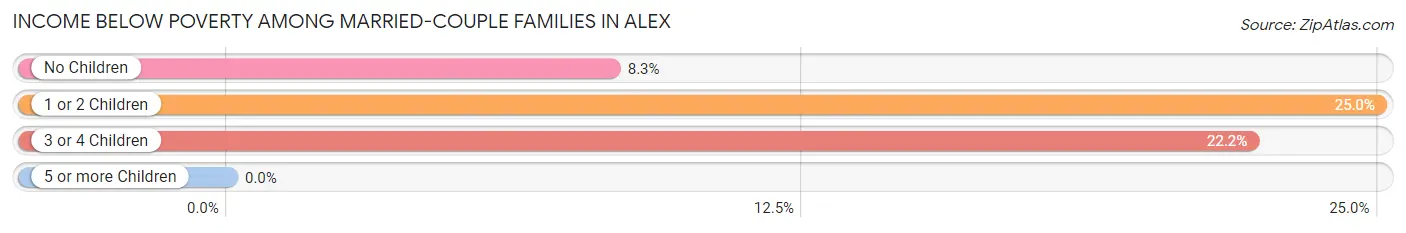
| Children | Above Poverty | Below Poverty |
| No Children | 55 (91.7%) | 5 (8.3%) |
| 1 or 2 Children | 15 (75.0%) | 5 (25.0%) |
| 3 or 4 Children | 7 (77.8%) | 2 (22.2%) |
| 5 or more Children | 11 (100.0%) | 0 (0.0%) |
| Total | 88 (88.0%) | 12 (12.0%) |
Income Below Poverty Among Single-Parent Households in Alex
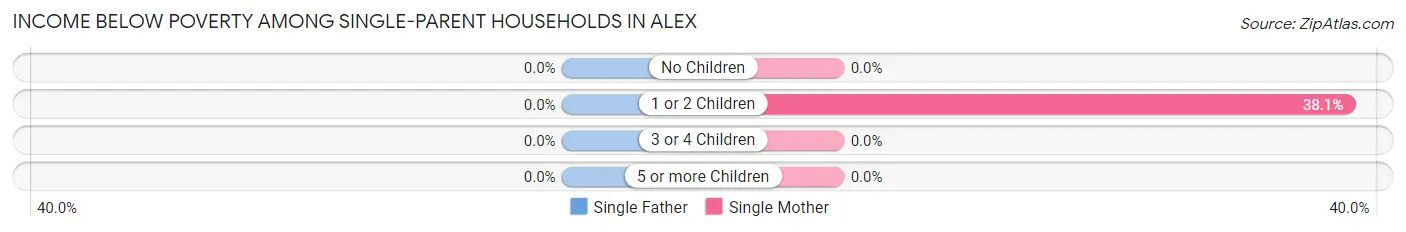
| Children | Single Father | Single Mother |
| No Children | 0 (0.0%) | 0 (0.0%) |
| 1 or 2 Children | 0 (0.0%) | 8 (38.1%) |
| 3 or 4 Children | 0 (0.0%) | 0 (0.0%) |
| 5 or more Children | 0 (0.0%) | 0 (0.0%) |
| Total | 0 (0.0%) | 8 (13.1%) |
Income Below Poverty Among Married-Couple vs Single-Parent Households in Alex
The poverty data for Alex shows that 12 of the married-couple family households (12.0%) and 8 of the single-parent households (12.1%) are living below the poverty level. Within the married-couple family households, those with 1 or 2 children have the highest poverty rate, with 5 households (25.0%) falling below the poverty line. Among the single-parent households, those with 1 or 2 children have the highest poverty rate, with 8 household (34.8%) living below poverty.
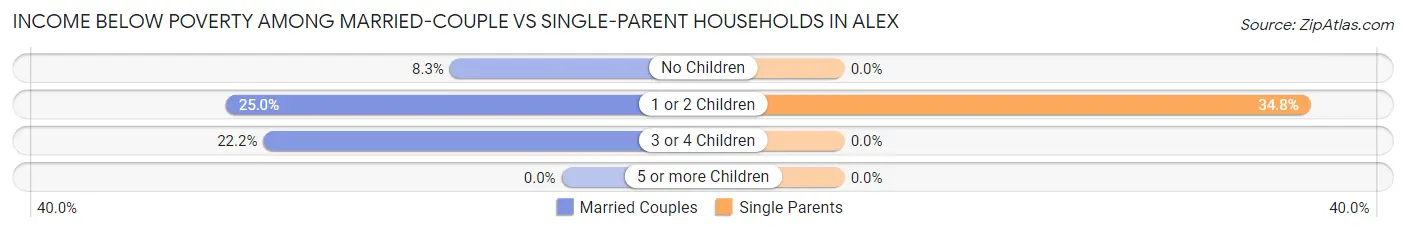
| Children | Married-Couple Families | Single-Parent Households |
| No Children | 5 (8.3%) | 0 (0.0%) |
| 1 or 2 Children | 5 (25.0%) | 8 (34.8%) |
| 3 or 4 Children | 2 (22.2%) | 0 (0.0%) |
| 5 or more Children | 0 (0.0%) | 0 (0.0%) |
| Total | 12 (12.0%) | 8 (12.1%) |
Race in Alex
The most populous races in Alex are White / Caucasian (449 | 70.9%), Two or more Races (122 | 19.3%), and Native / Alaskan (51 | 8.1%).
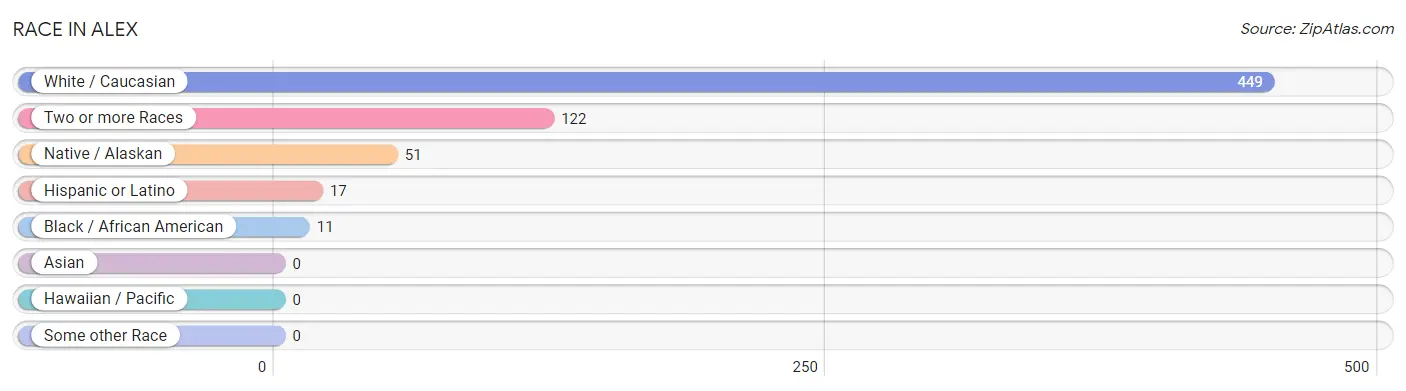
| Race | # Population | % Population |
| Asian | 0 | 0.0% |
| Black / African American | 11 | 1.7% |
| Hawaiian / Pacific | 0 | 0.0% |
| Hispanic or Latino | 17 | 2.7% |
| Native / Alaskan | 51 | 8.1% |
| White / Caucasian | 449 | 70.9% |
| Two or more Races | 122 | 19.3% |
| Some other Race | 0 | 0.0% |
| Total | 633 | 100.0% |
Ancestry in Alex
The most populous ancestries reported in Alex are German (118 | 18.6%), Irish (114 | 18.0%), English (89 | 14.1%), Chickasaw (52 | 8.2%), and American (51 | 8.1%), together accounting for 67.0% of all Alex residents.
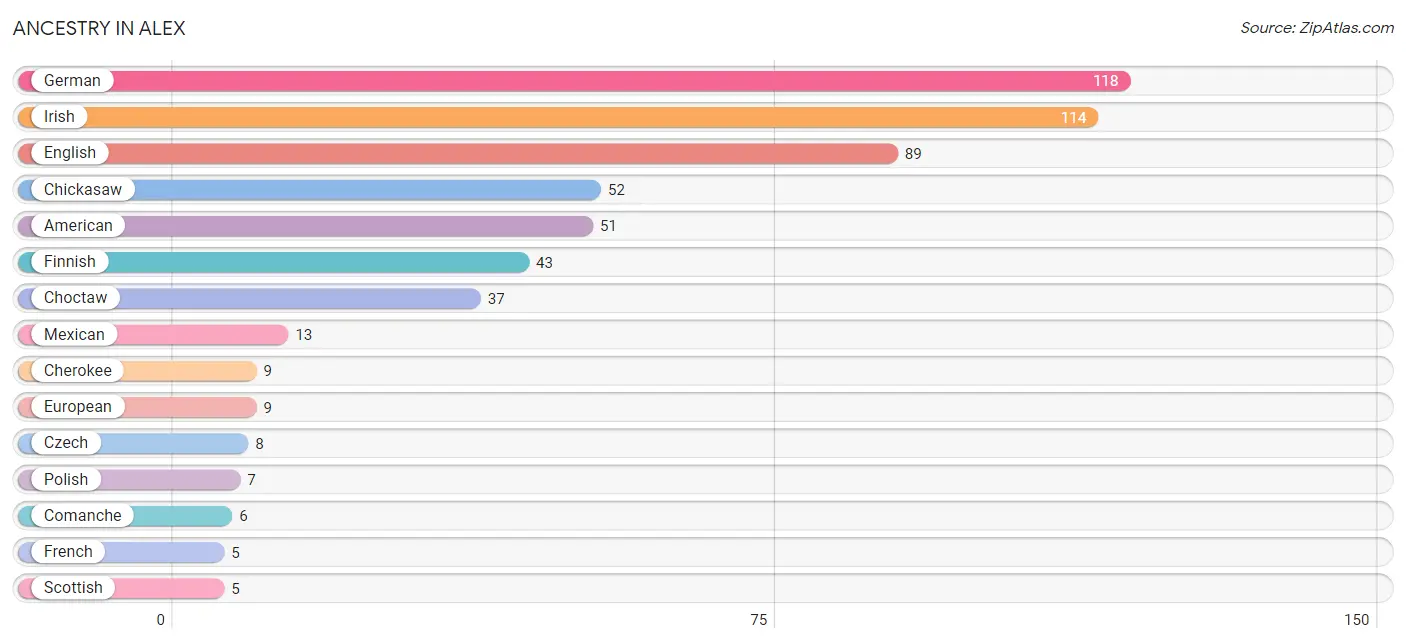
| Ancestry | # Population | % Population |
| American | 51 | 8.1% |
| Bhutanese | 3 | 0.5% |
| Cherokee | 9 | 1.4% |
| Chickasaw | 52 | 8.2% |
| Choctaw | 37 | 5.9% |
| Comanche | 6 | 0.9% |
| Czech | 8 | 1.3% |
| Dutch | 2 | 0.3% |
| Dutch West Indian | 1 | 0.2% |
| Eastern European | 2 | 0.3% |
| English | 89 | 14.1% |
| European | 9 | 1.4% |
| Finnish | 43 | 6.8% |
| French | 5 | 0.8% |
| French Canadian | 2 | 0.3% |
| German | 118 | 18.6% |
| Irish | 114 | 18.0% |
| Italian | 2 | 0.3% |
| Kiowa | 4 | 0.6% |
| Korean | 3 | 0.5% |
| Mexican | 13 | 2.1% |
| Nigerian | 2 | 0.3% |
| Osage | 1 | 0.2% |
| Polish | 7 | 1.1% |
| Scotch-Irish | 3 | 0.5% |
| Scottish | 5 | 0.8% |
| Seminole | 2 | 0.3% |
| Spaniard | 4 | 0.6% |
| Subsaharan African | 2 | 0.3% |
| Swiss | 3 | 0.5% |
| Yugoslavian | 2 | 0.3% | View All 31 Rows |
Immigrants in Alex
The most numerous immigrant groups reported in Alex came from Africa (2 | 0.3%), Nigeria (2 | 0.3%), and Western Africa (2 | 0.3%), together accounting for 1.0% of all Alex residents.
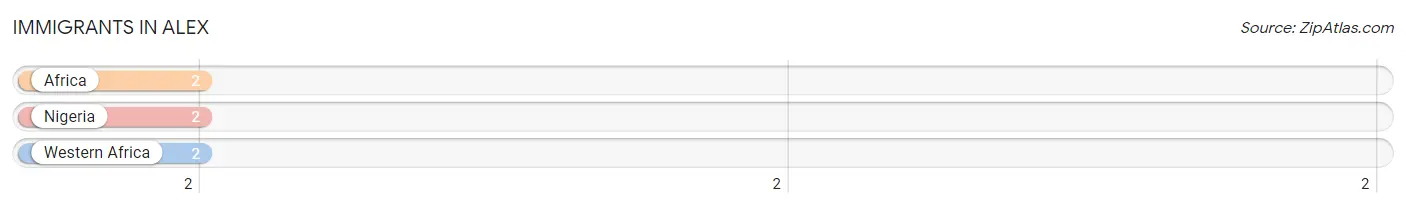
| Immigration Origin | # Population | % Population |
| Africa | 2 | 0.3% |
| Nigeria | 2 | 0.3% |
| Western Africa | 2 | 0.3% | View All 3 Rows |
Sex and Age in Alex
Sex and Age in Alex
The most populous age groups in Alex are 15 to 19 Years (40 | 15.0%) for men and 25 to 29 Years (40 | 10.9%) for women.
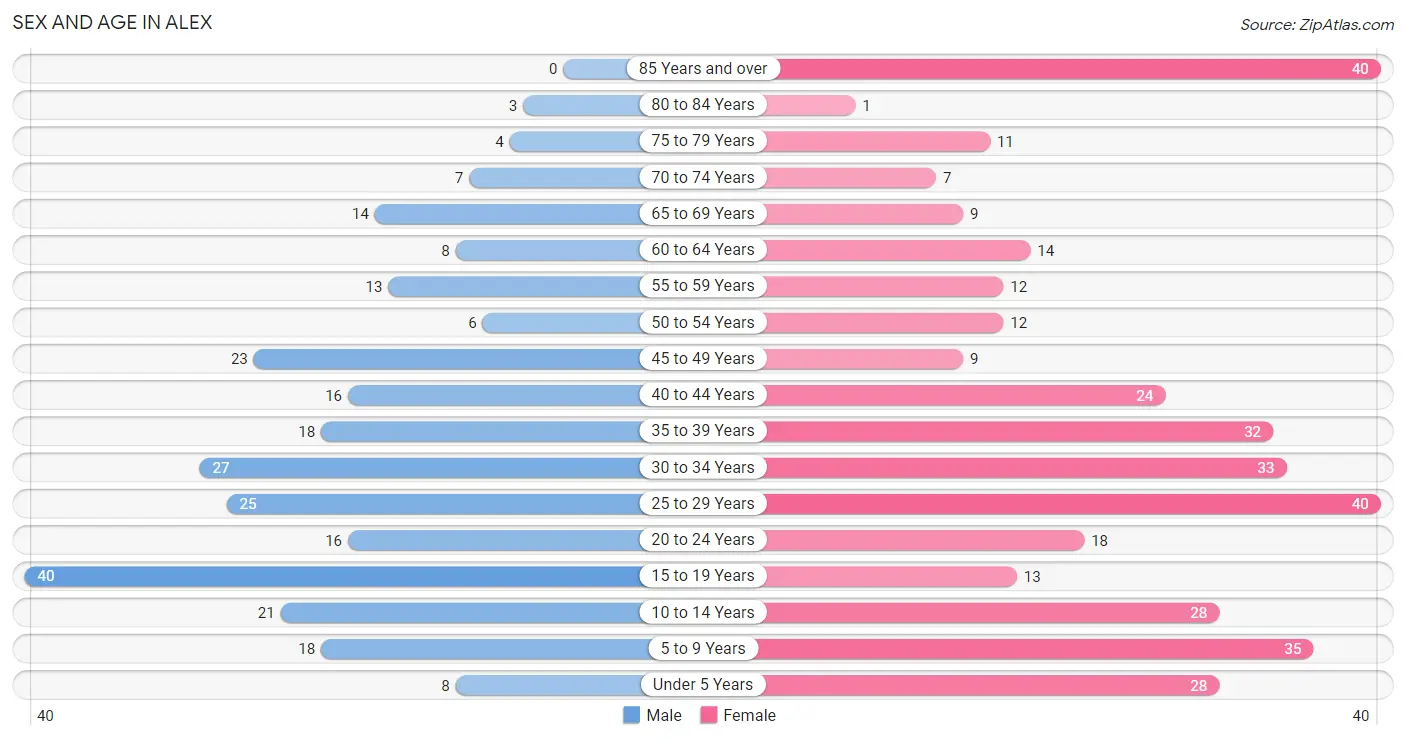
| Age Bracket | Male | Female |
| Under 5 Years | 8 (3.0%) | 28 (7.6%) |
| 5 to 9 Years | 18 (6.7%) | 35 (9.6%) |
| 10 to 14 Years | 21 (7.9%) | 28 (7.6%) |
| 15 to 19 Years | 40 (15.0%) | 13 (3.5%) |
| 20 to 24 Years | 16 (6.0%) | 18 (4.9%) |
| 25 to 29 Years | 25 (9.4%) | 40 (10.9%) |
| 30 to 34 Years | 27 (10.1%) | 33 (9.0%) |
| 35 to 39 Years | 18 (6.7%) | 32 (8.7%) |
| 40 to 44 Years | 16 (6.0%) | 24 (6.6%) |
| 45 to 49 Years | 23 (8.6%) | 9 (2.5%) |
| 50 to 54 Years | 6 (2.2%) | 12 (3.3%) |
| 55 to 59 Years | 13 (4.9%) | 12 (3.3%) |
| 60 to 64 Years | 8 (3.0%) | 14 (3.8%) |
| 65 to 69 Years | 14 (5.2%) | 9 (2.5%) |
| 70 to 74 Years | 7 (2.6%) | 7 (1.9%) |
| 75 to 79 Years | 4 (1.5%) | 11 (3.0%) |
| 80 to 84 Years | 3 (1.1%) | 1 (0.3%) |
| 85 Years and over | 0 (0.0%) | 40 (10.9%) |
| Total | 267 (100.0%) | 366 (100.0%) |
Families and Households in Alex
Median Family Size in Alex
The median family size in Alex is 3.46 persons per family, with single male/father families (5 | 3.0%) accounting for the largest median family size of 4.4 persons per family. On the other hand, single female/mother families (61 | 36.7%) represent the smallest median family size with 2.67 persons per family.
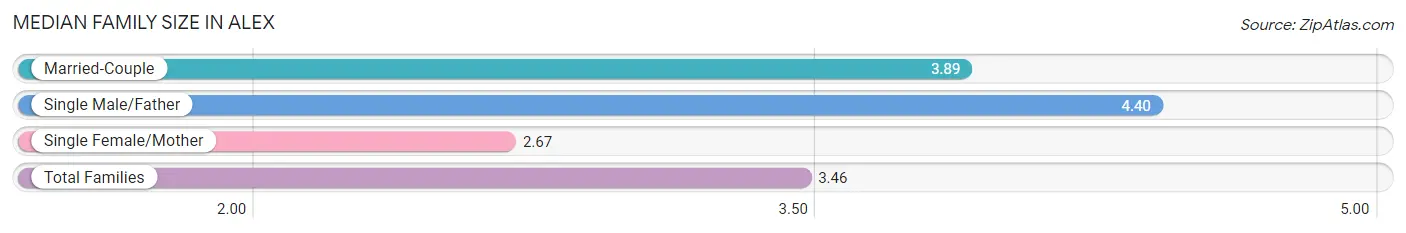
| Family Type | # Families | Family Size |
| Married-Couple | 100 (60.2%) | 3.89 |
| Single Male/Father | 5 (3.0%) | 4.40 |
| Single Female/Mother | 61 (36.7%) | 2.67 |
| Total Families | 166 (100.0%) | 3.46 |
Median Household Size in Alex
The median household size in Alex is 2.99 persons per household, with single male/father households (5 | 2.4%) accounting for the largest median household size of 4.4 persons per household. non-family households (46 | 21.7%) represent the smallest median household size with 1.17 persons per household.
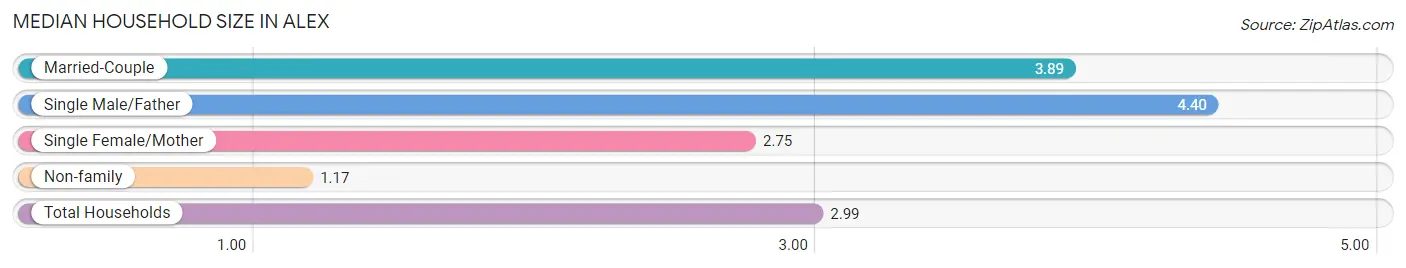
| Household Type | # Households | Household Size |
| Married-Couple | 100 (47.2%) | 3.89 |
| Single Male/Father | 5 (2.4%) | 4.40 |
| Single Female/Mother | 61 (28.8%) | 2.75 |
| Non-family | 46 (21.7%) | 1.17 |
| Total Households | 212 (100.0%) | 2.99 |
Household Size by Marriage Status in Alex
Out of a total of 212 households in Alex, 166 (78.3%) are family households, while 46 (21.7%) are nonfamily households. The most numerous type of family households are 2-person households, comprising 96, and the most common type of nonfamily households are 1-person households, comprising 41.
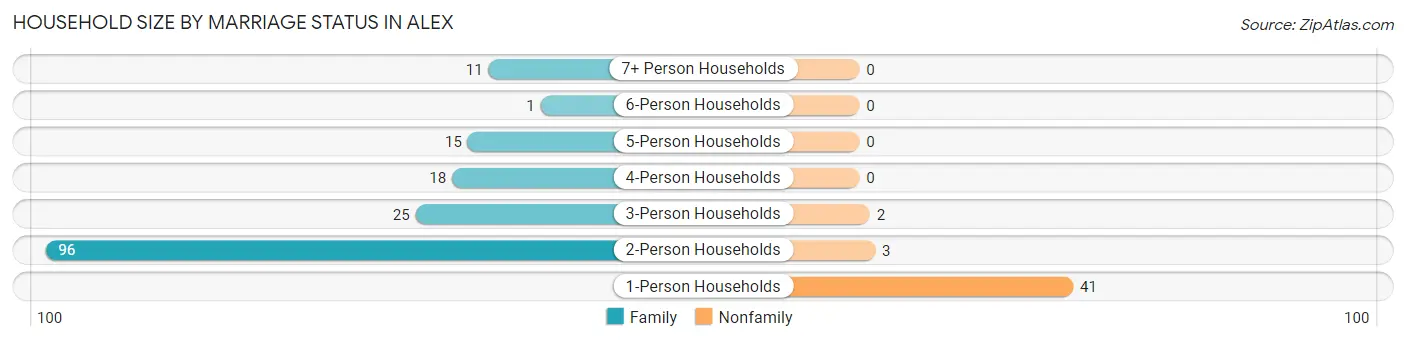
| Household Size | Family Households | Nonfamily Households |
| 1-Person Households | - | 41 (19.3%) |
| 2-Person Households | 96 (45.3%) | 3 (1.4%) |
| 3-Person Households | 25 (11.8%) | 2 (0.9%) |
| 4-Person Households | 18 (8.5%) | 0 (0.0%) |
| 5-Person Households | 15 (7.1%) | 0 (0.0%) |
| 6-Person Households | 1 (0.5%) | 0 (0.0%) |
| 7+ Person Households | 11 (5.2%) | 0 (0.0%) |
| Total | 166 (78.3%) | 46 (21.7%) |
Female Fertility in Alex
Fertility by Age in Alex
Average fertility rate in Alex is 65.0 births per 1,000 women. Women in the age bracket of 20 to 34 years have the highest fertility rate with 121.0 births per 1,000 women. Women in the age bracket of 20 to 34 years acount for 100.0% of all women with births.
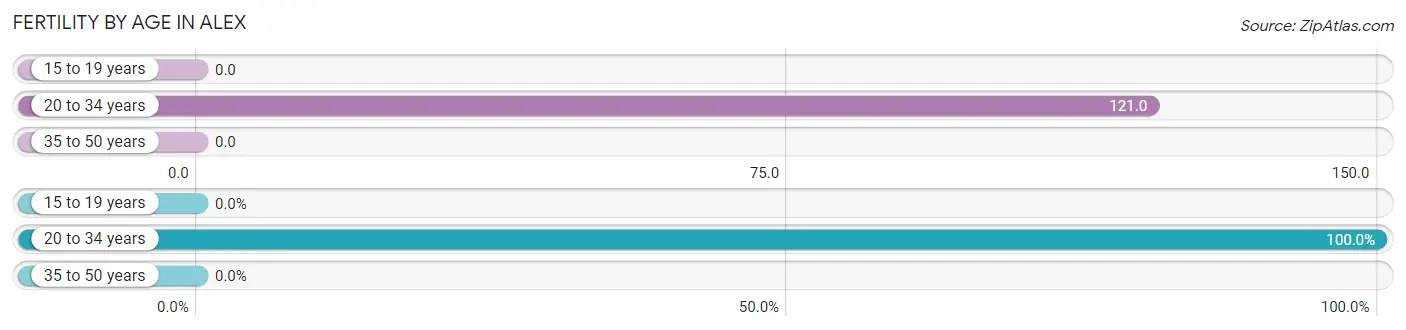
| Age Bracket | Women with Births | Births / 1,000 Women |
| 15 to 19 years | 0 (0.0%) | 0.0 |
| 20 to 34 years | 11 (100.0%) | 121.0 |
| 35 to 50 years | 0 (0.0%) | 0.0 |
| Total | 11 (100.0%) | 65.0 |
Fertility by Age by Marriage Status in Alex
72.7% of women with births (11) in Alex are married. The highest percentage of unmarried women with births falls into 20 to 34 years age bracket with 27.3% of them unmarried at the time of birth, while the lowest percentage of unmarried women with births belong to 20 to 34 years age bracket with 27.3% of them unmarried.
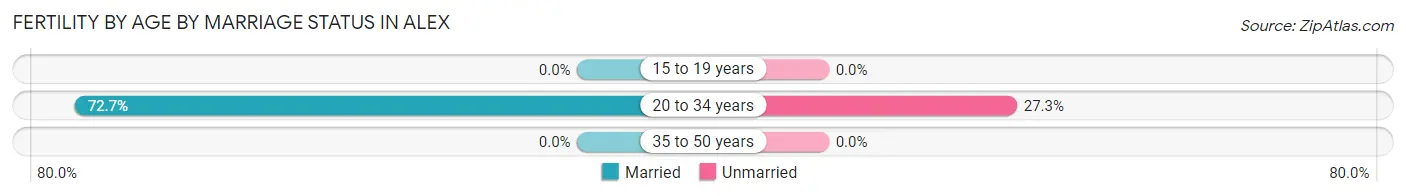
| Age Bracket | Married | Unmarried |
| 15 to 19 years | 0 (0.0%) | 0 (0.0%) |
| 20 to 34 years | 8 (72.7%) | 3 (27.3%) |
| 35 to 50 years | 0 (0.0%) | 0 (0.0%) |
| Total | 8 (72.7%) | 3 (27.3%) |
Fertility by Education in Alex
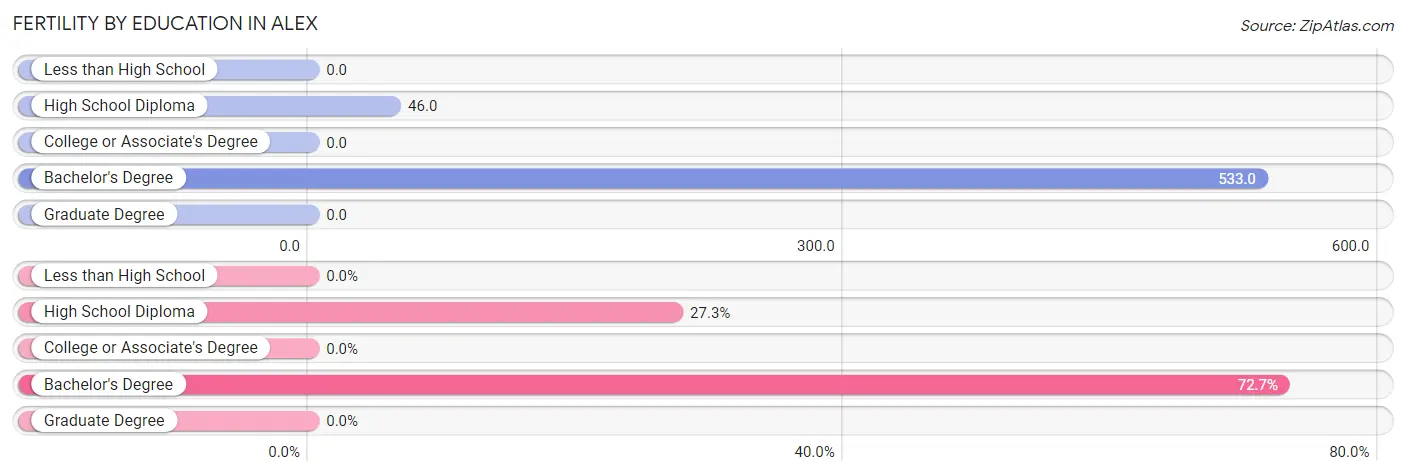
| Educational Attainment | Women with Births | Births / 1,000 Women |
| Less than High School | 0 (0.0%) | 0.0 |
| High School Diploma | 3 (27.3%) | 46.0 |
| College or Associate's Degree | 0 (0.0%) | 0.0 |
| Bachelor's Degree | 8 (72.7%) | 533.0 |
| Graduate Degree | 0 (0.0%) | 0.0 |
| Total | 11 (100.0%) | 65.0 |
Fertility by Education by Marriage Status in Alex
27.3% of women with births in Alex are unmarried. Women with the educational attainment of bachelor's degree are most likely to be married with 100.0% of them married at childbirth, while women with the educational attainment of high school diploma are least likely to be married with 100.0% of them unmarried at childbirth.
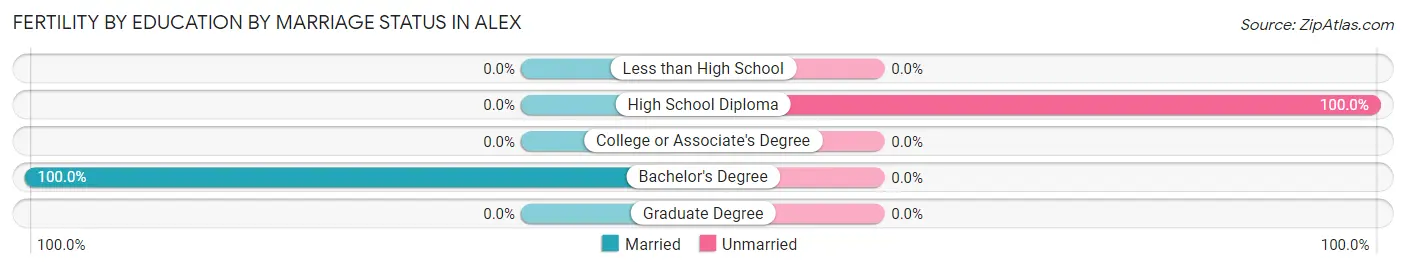
| Educational Attainment | Married | Unmarried |
| Less than High School | 0 (0.0%) | 0 (0.0%) |
| High School Diploma | 0 (0.0%) | 3 (100.0%) |
| College or Associate's Degree | 0 (0.0%) | 0 (0.0%) |
| Bachelor's Degree | 8 (100.0%) | 0 (0.0%) |
| Graduate Degree | 0 (0.0%) | 0 (0.0%) |
| Total | 8 (72.7%) | 3 (27.3%) |
Employment Characteristics in Alex
Employment by Class of Employer in Alex
Among the 230 employed individuals in Alex, private company employees (176 | 76.5%), local government employees (16 | 7.0%), and self-employed (not incorporated) (15 | 6.5%) make up the most common classes of employment.
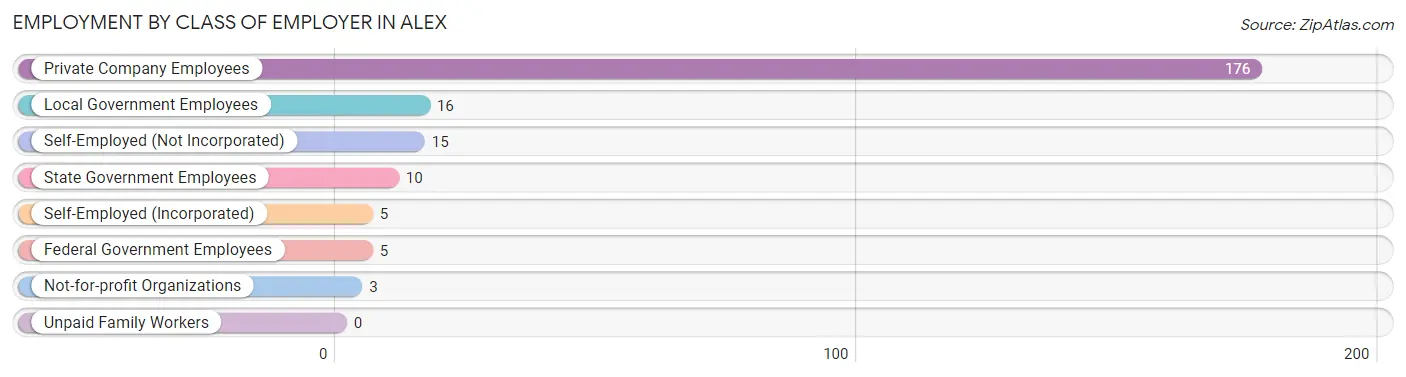
| Employer Class | # Employees | % Employees |
| Private Company Employees | 176 | 76.5% |
| Self-Employed (Incorporated) | 5 | 2.2% |
| Self-Employed (Not Incorporated) | 15 | 6.5% |
| Not-for-profit Organizations | 3 | 1.3% |
| Local Government Employees | 16 | 7.0% |
| State Government Employees | 10 | 4.3% |
| Federal Government Employees | 5 | 2.2% |
| Unpaid Family Workers | 0 | 0.0% |
| Total | 230 | 100.0% |
Employment Status by Age in Alex
According to the labor force statistics for Alex, out of the total population over 16 years of age (477), 50.5% or 241 individuals are in the labor force, with 4.6% or 11 of them unemployed. The age group with the highest labor force participation rate is 30 to 34 years, with 83.3% or 50 individuals in the labor force. Within the labor force, the 16 to 19 years age range has the highest percentage of unemployed individuals, with 50.0% or 3 of them being unemployed.
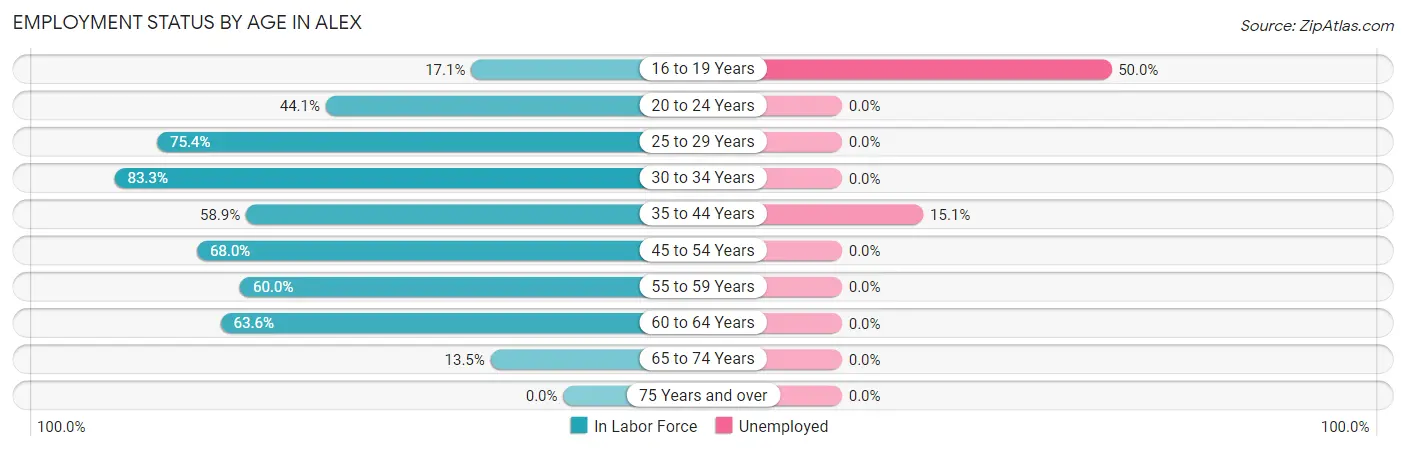
| Age Bracket | In Labor Force | Unemployed |
| 16 to 19 Years | 6 (17.1%) | 3 (50.0%) |
| 20 to 24 Years | 15 (44.1%) | 0 (0.0%) |
| 25 to 29 Years | 49 (75.4%) | 0 (0.0%) |
| 30 to 34 Years | 50 (83.3%) | 0 (0.0%) |
| 35 to 44 Years | 53 (58.9%) | 8 (15.1%) |
| 45 to 54 Years | 34 (68.0%) | 0 (0.0%) |
| 55 to 59 Years | 15 (60.0%) | 0 (0.0%) |
| 60 to 64 Years | 14 (63.6%) | 0 (0.0%) |
| 65 to 74 Years | 5 (13.5%) | 0 (0.0%) |
| 75 Years and over | 0 (0.0%) | 0 (0.0%) |
| Total | 241 (50.5%) | 11 (4.6%) |
Employment Status by Educational Attainment in Alex
According to labor force statistics for Alex, 68.9% of individuals (215) out of the total population between 25 and 64 years of age (312) are in the labor force, with 3.7% or 8 of them being unemployed. The group with the highest labor force participation rate are those with the educational attainment of bachelor's degree or higher, with 80.8% or 42 individuals in the labor force. Within the labor force, individuals with college / associate degree education have the highest percentage of unemployment, with 7.8% or 6 of them being unemployed.
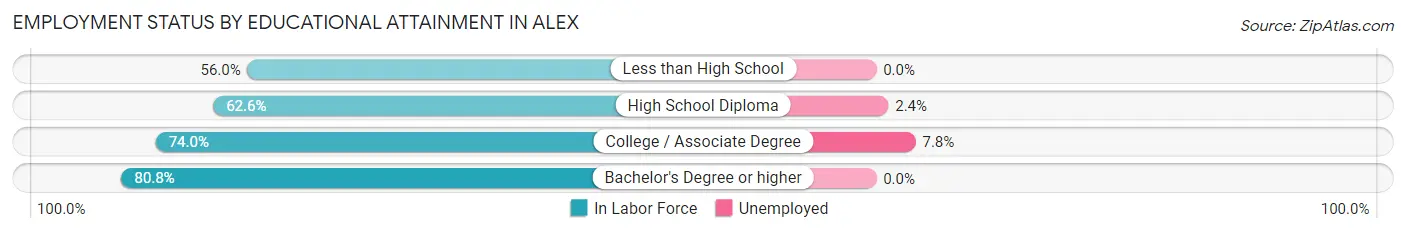
| Educational Attainment | In Labor Force | Unemployed |
| Less than High School | 14 (56.0%) | 0 (0.0%) |
| High School Diploma | 82 (62.6%) | 3 (2.4%) |
| College / Associate Degree | 77 (74.0%) | 8 (7.8%) |
| Bachelor's Degree or higher | 42 (80.8%) | 0 (0.0%) |
| Total | 215 (68.9%) | 12 (3.7%) |
Employment Occupations by Sex in Alex
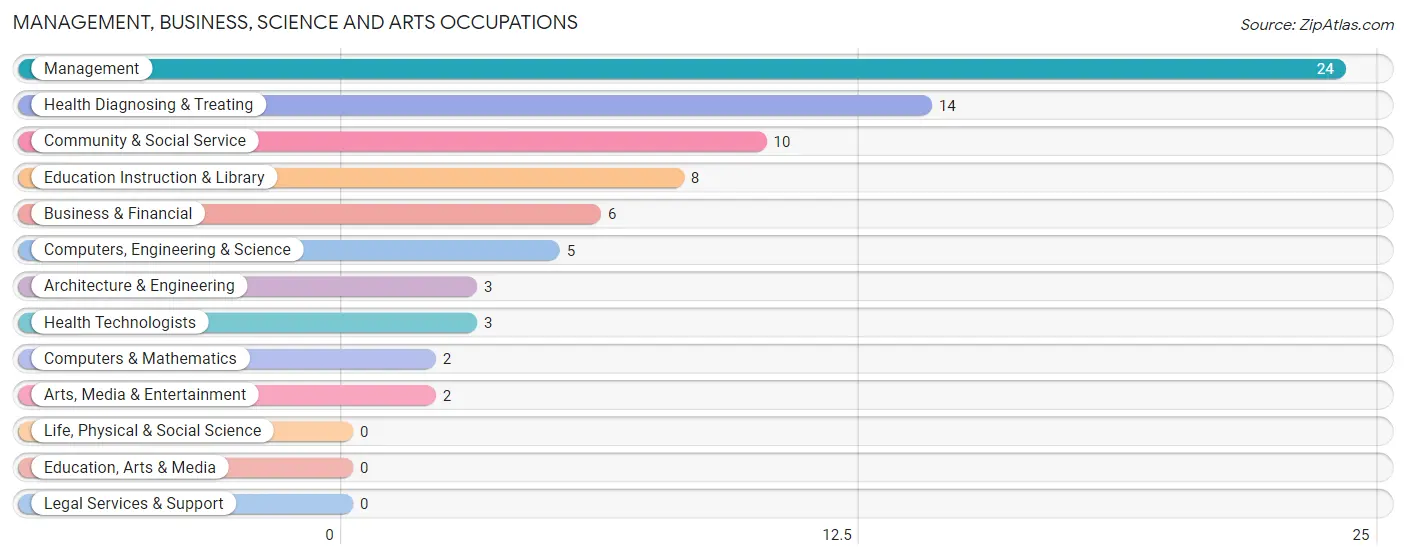
Management, Business, Science and Arts Occupations
The most common Management, Business, Science and Arts occupations in Alex are Management (24 | 10.4%), Health Diagnosing & Treating (14 | 6.1%), Community & Social Service (10 | 4.3%), Education Instruction & Library (8 | 3.5%), and Business & Financial (6 | 2.6%).
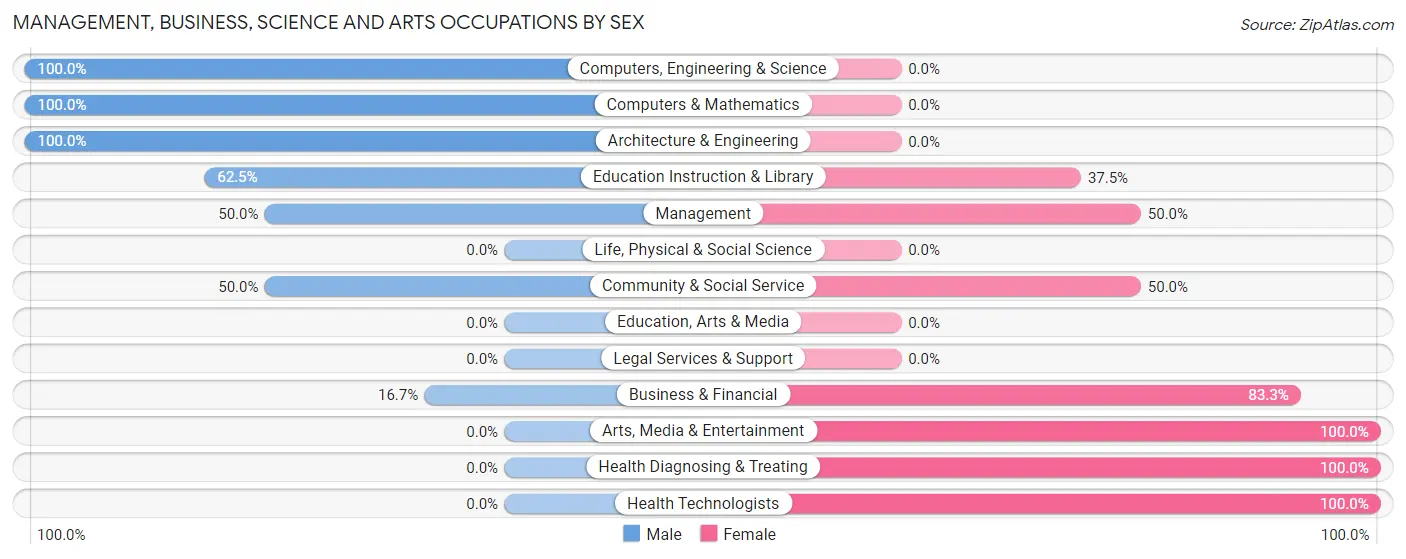
Management, Business, Science and Arts Occupations by Sex
Within the Management, Business, Science and Arts occupations in Alex, the most male-oriented occupations are Computers, Engineering & Science (100.0%), Computers & Mathematics (100.0%), and Architecture & Engineering (100.0%), while the most female-oriented occupations are Arts, Media & Entertainment (100.0%), Health Diagnosing & Treating (100.0%), and Health Technologists (100.0%).
| Occupation | Male | Female |
| Management | 12 (50.0%) | 12 (50.0%) |
| Business & Financial | 1 (16.7%) | 5 (83.3%) |
| Computers, Engineering & Science | 5 (100.0%) | 0 (0.0%) |
| Computers & Mathematics | 2 (100.0%) | 0 (0.0%) |
| Architecture & Engineering | 3 (100.0%) | 0 (0.0%) |
| Life, Physical & Social Science | 0 (0.0%) | 0 (0.0%) |
| Community & Social Service | 5 (50.0%) | 5 (50.0%) |
| Education, Arts & Media | 0 (0.0%) | 0 (0.0%) |
| Legal Services & Support | 0 (0.0%) | 0 (0.0%) |
| Education Instruction & Library | 5 (62.5%) | 3 (37.5%) |
| Arts, Media & Entertainment | 0 (0.0%) | 2 (100.0%) |
| Health Diagnosing & Treating | 0 (0.0%) | 14 (100.0%) |
| Health Technologists | 0 (0.0%) | 3 (100.0%) |
| Total (Category) | 23 (39.0%) | 36 (61.0%) |
| Total (Overall) | 130 (56.5%) | 100 (43.5%) |
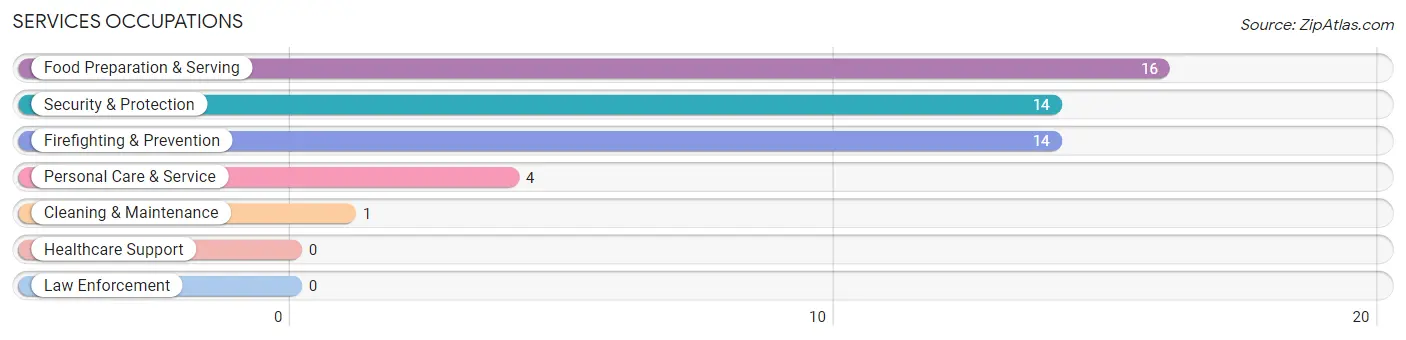
Services Occupations
The most common Services occupations in Alex are Food Preparation & Serving (16 | 7.0%), Security & Protection (14 | 6.1%), Firefighting & Prevention (14 | 6.1%), Personal Care & Service (4 | 1.7%), and Cleaning & Maintenance (1 | 0.4%).
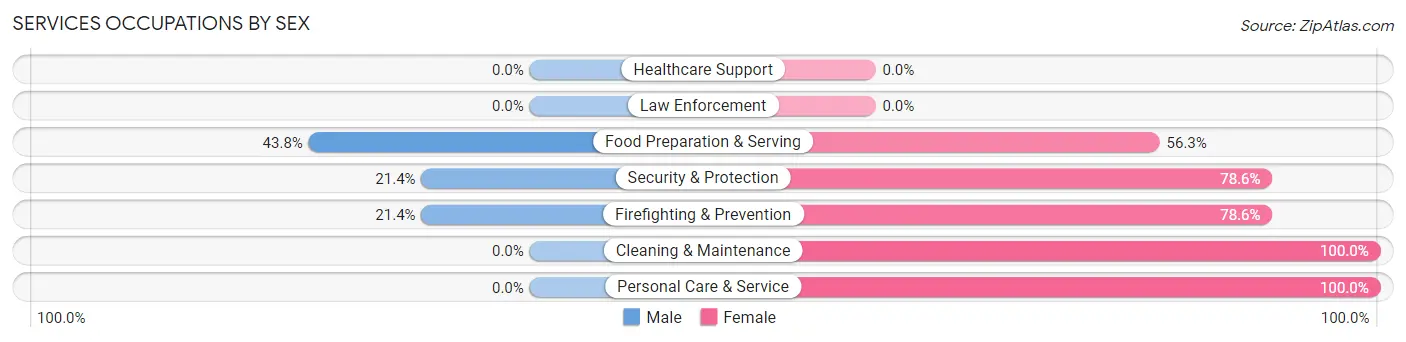
Services Occupations by Sex
Within the Services occupations in Alex, the most male-oriented occupations are Food Preparation & Serving (43.8%), Security & Protection (21.4%), and Firefighting & Prevention (21.4%), while the most female-oriented occupations are Cleaning & Maintenance (100.0%), Personal Care & Service (100.0%), and Security & Protection (78.6%).
| Occupation | Male | Female |
| Healthcare Support | 0 (0.0%) | 0 (0.0%) |
| Security & Protection | 3 (21.4%) | 11 (78.6%) |
| Firefighting & Prevention | 3 (21.4%) | 11 (78.6%) |
| Law Enforcement | 0 (0.0%) | 0 (0.0%) |
| Food Preparation & Serving | 7 (43.8%) | 9 (56.2%) |
| Cleaning & Maintenance | 0 (0.0%) | 1 (100.0%) |
| Personal Care & Service | 0 (0.0%) | 4 (100.0%) |
| Total (Category) | 10 (28.6%) | 25 (71.4%) |
| Total (Overall) | 130 (56.5%) | 100 (43.5%) |
Sales and Office Occupations
The most common Sales and Office occupations in Alex are Office & Administration (37 | 16.1%), and Sales & Related (24 | 10.4%).
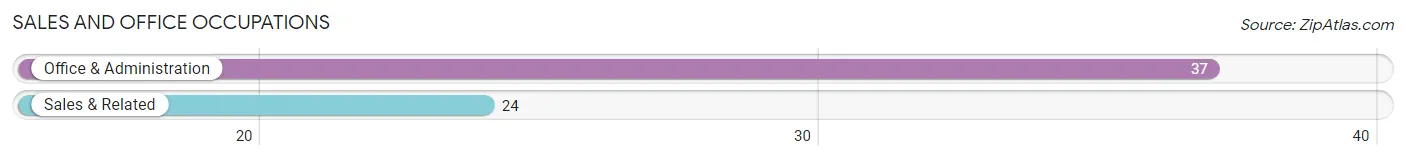
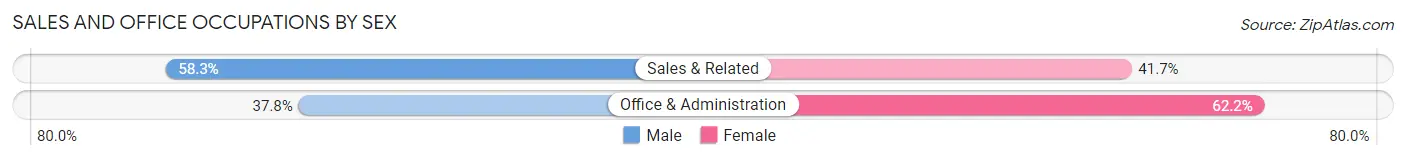
Sales and Office Occupations by Sex
| Occupation | Male | Female |
| Sales & Related | 14 (58.3%) | 10 (41.7%) |
| Office & Administration | 14 (37.8%) | 23 (62.2%) |
| Total (Category) | 28 (45.9%) | 33 (54.1%) |
| Total (Overall) | 130 (56.5%) | 100 (43.5%) |
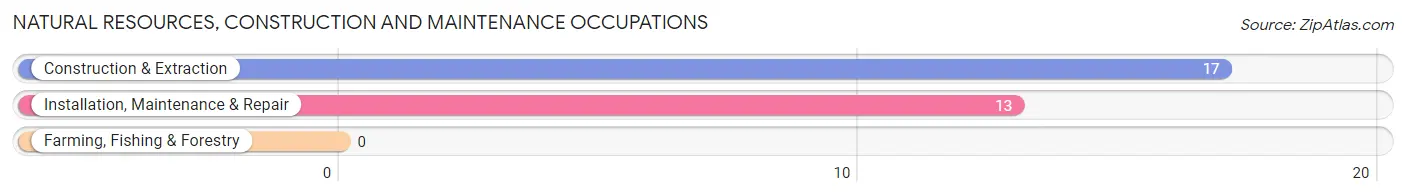
Natural Resources, Construction and Maintenance Occupations
The most common Natural Resources, Construction and Maintenance occupations in Alex are Construction & Extraction (17 | 7.4%), and Installation, Maintenance & Repair (13 | 5.7%).
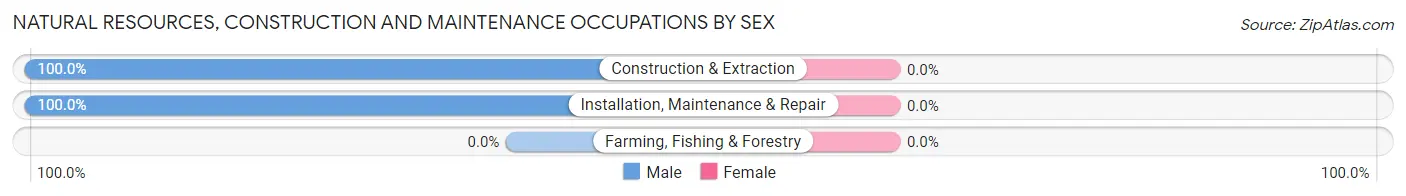
Natural Resources, Construction and Maintenance Occupations by Sex
| Occupation | Male | Female |
| Farming, Fishing & Forestry | 0 (0.0%) | 0 (0.0%) |
| Construction & Extraction | 17 (100.0%) | 0 (0.0%) |
| Installation, Maintenance & Repair | 13 (100.0%) | 0 (0.0%) |
| Total (Category) | 30 (100.0%) | 0 (0.0%) |
| Total (Overall) | 130 (56.5%) | 100 (43.5%) |
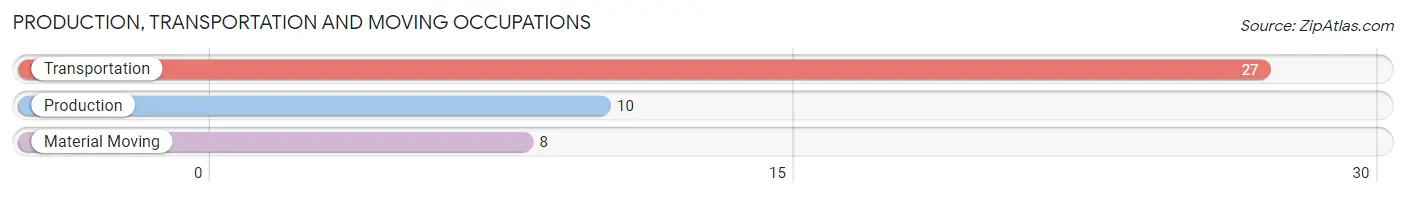
Production, Transportation and Moving Occupations
The most common Production, Transportation and Moving occupations in Alex are Transportation (27 | 11.7%), Production (10 | 4.3%), and Material Moving (8 | 3.5%).
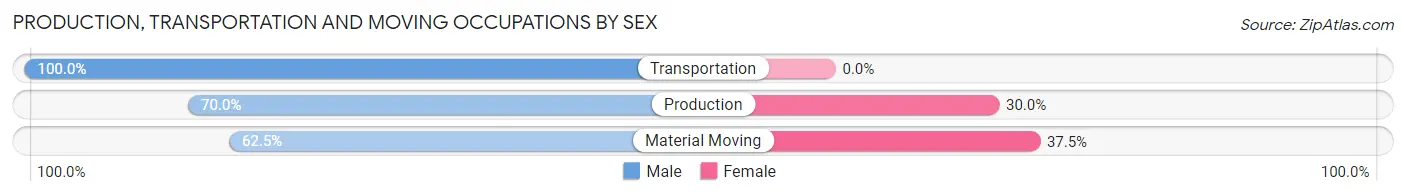
Production, Transportation and Moving Occupations by Sex
| Occupation | Male | Female |
| Production | 7 (70.0%) | 3 (30.0%) |
| Transportation | 27 (100.0%) | 0 (0.0%) |
| Material Moving | 5 (62.5%) | 3 (37.5%) |
| Total (Category) | 39 (86.7%) | 6 (13.3%) |
| Total (Overall) | 130 (56.5%) | 100 (43.5%) |
Employment Industries by Sex in Alex
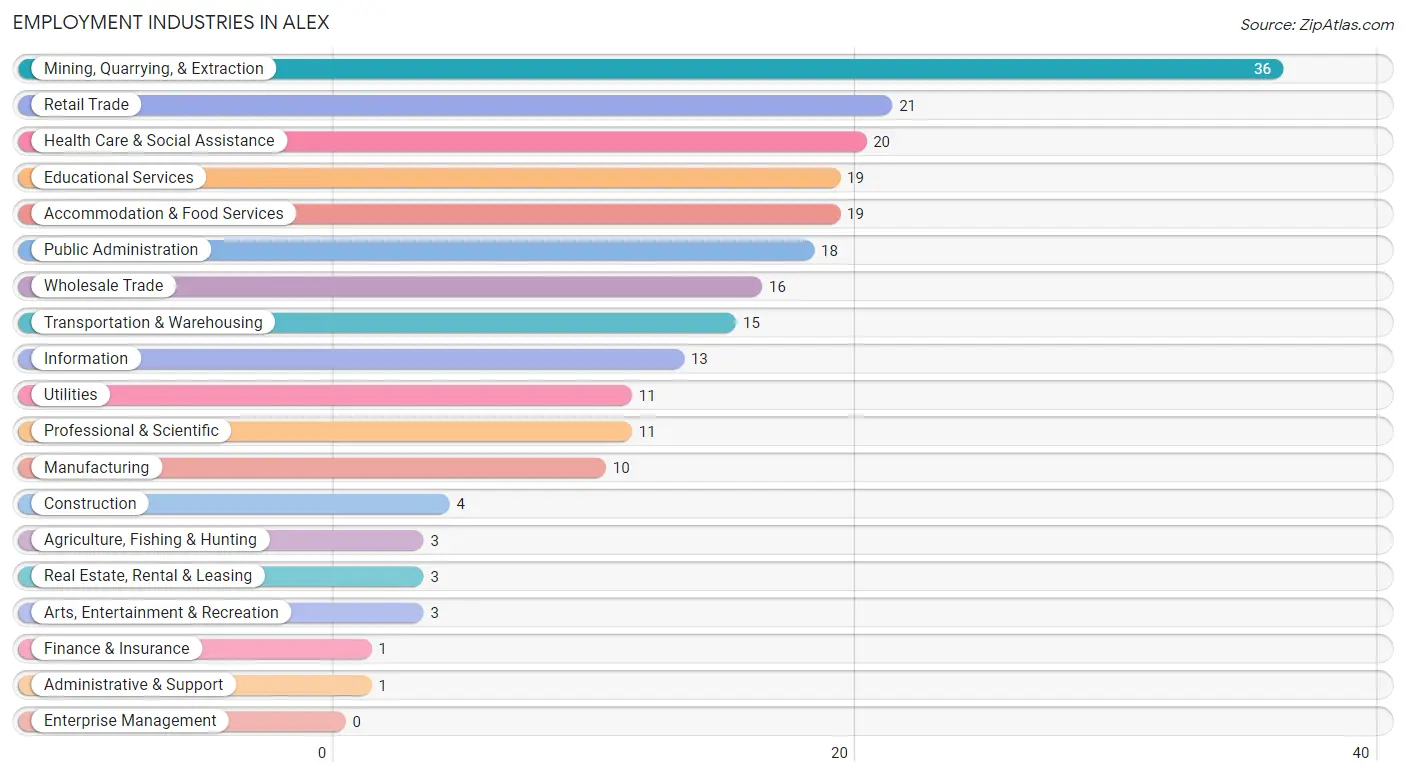
Employment Industries in Alex
The major employment industries in Alex include Mining, Quarrying, & Extraction (36 | 15.7%), Retail Trade (21 | 9.1%), Health Care & Social Assistance (20 | 8.7%), Educational Services (19 | 8.3%), and Accommodation & Food Services (19 | 8.3%).
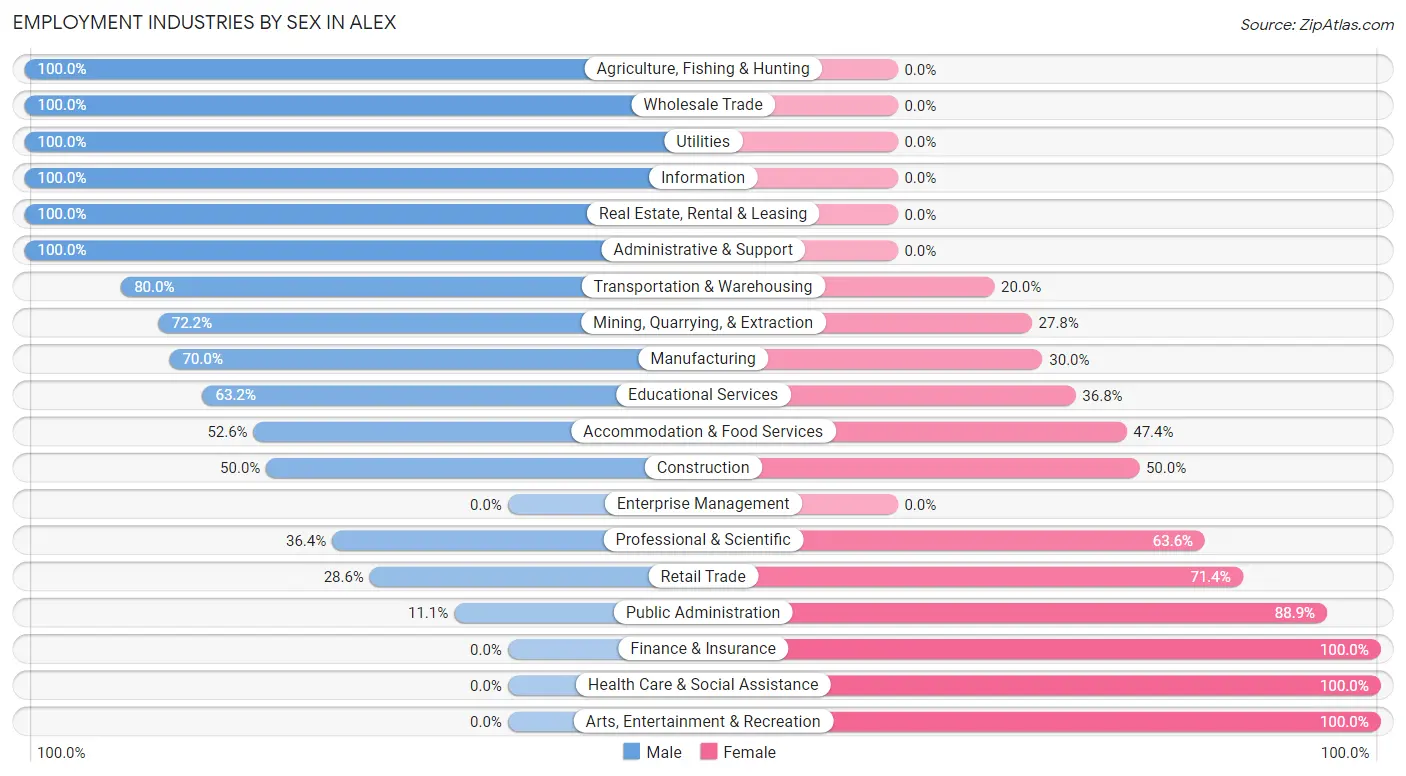
Employment Industries by Sex in Alex
The Alex industries that see more men than women are Agriculture, Fishing & Hunting (100.0%), Wholesale Trade (100.0%), and Utilities (100.0%), whereas the industries that tend to have a higher number of women are Finance & Insurance (100.0%), Health Care & Social Assistance (100.0%), and Arts, Entertainment & Recreation (100.0%).
| Industry | Male | Female |
| Agriculture, Fishing & Hunting | 3 (100.0%) | 0 (0.0%) |
| Mining, Quarrying, & Extraction | 26 (72.2%) | 10 (27.8%) |
| Construction | 2 (50.0%) | 2 (50.0%) |
| Manufacturing | 7 (70.0%) | 3 (30.0%) |
| Wholesale Trade | 16 (100.0%) | 0 (0.0%) |
| Retail Trade | 6 (28.6%) | 15 (71.4%) |
| Transportation & Warehousing | 12 (80.0%) | 3 (20.0%) |
| Utilities | 11 (100.0%) | 0 (0.0%) |
| Information | 13 (100.0%) | 0 (0.0%) |
| Finance & Insurance | 0 (0.0%) | 1 (100.0%) |
| Real Estate, Rental & Leasing | 3 (100.0%) | 0 (0.0%) |
| Professional & Scientific | 4 (36.4%) | 7 (63.6%) |
| Enterprise Management | 0 (0.0%) | 0 (0.0%) |
| Administrative & Support | 1 (100.0%) | 0 (0.0%) |
| Educational Services | 12 (63.2%) | 7 (36.8%) |
| Health Care & Social Assistance | 0 (0.0%) | 20 (100.0%) |
| Arts, Entertainment & Recreation | 0 (0.0%) | 3 (100.0%) |
| Accommodation & Food Services | 10 (52.6%) | 9 (47.4%) |
| Public Administration | 2 (11.1%) | 16 (88.9%) |
| Total | 130 (56.5%) | 100 (43.5%) |
Education in Alex
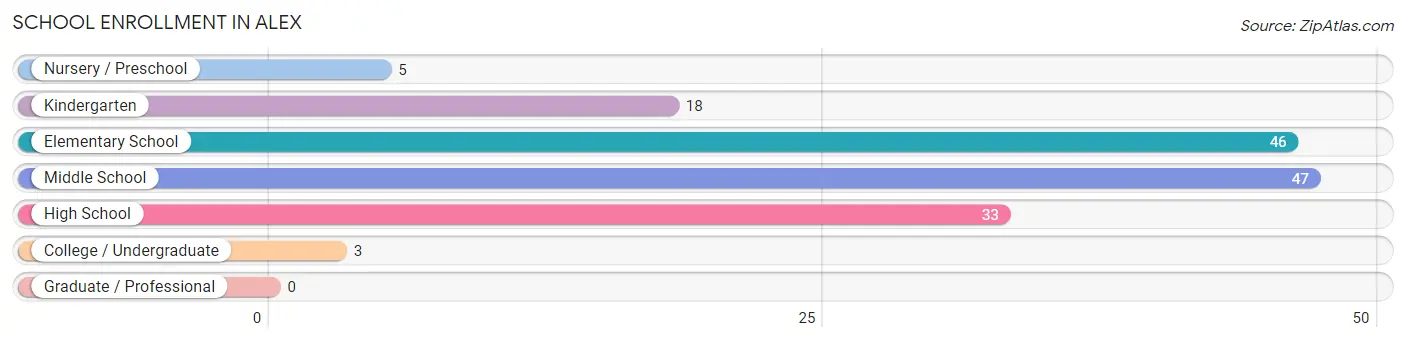
School Enrollment in Alex
The most common levels of schooling among the 152 students in Alex are middle school (47 | 30.9%), elementary school (46 | 30.3%), and high school (33 | 21.7%).
| School Level | # Students | % Students |
| Nursery / Preschool | 5 | 3.3% |
| Kindergarten | 18 | 11.8% |
| Elementary School | 46 | 30.3% |
| Middle School | 47 | 30.9% |
| High School | 33 | 21.7% |
| College / Undergraduate | 3 | 2.0% |
| Graduate / Professional | 0 | 0.0% |
| Total | 152 | 100.0% |
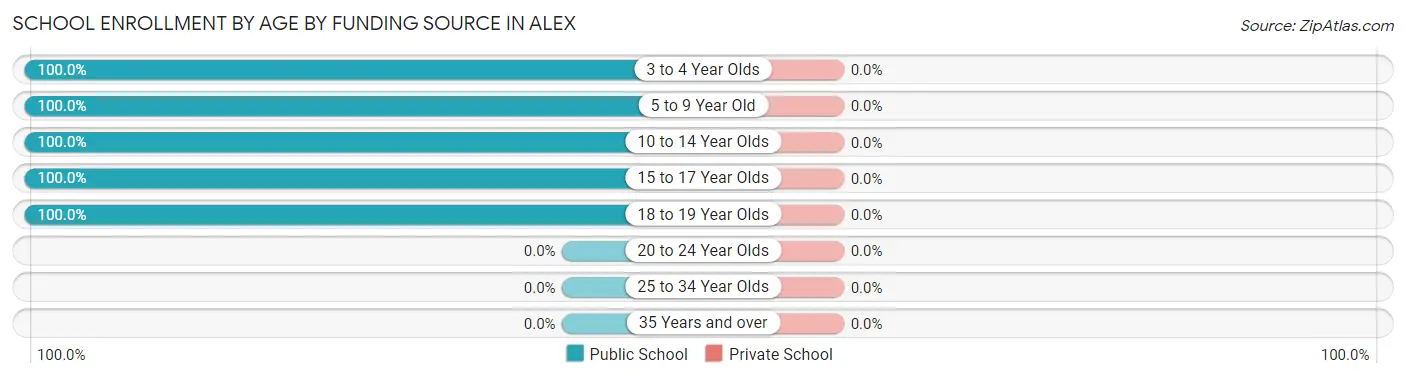
School Enrollment by Age by Funding Source in Alex
| Age Bracket | Public School | Private School |
| 3 to 4 Year Olds | 3 (100.0%) | 0 (0.0%) |
| 5 to 9 Year Old | 50 (100.0%) | 0 (0.0%) |
| 10 to 14 Year Olds | 49 (100.0%) | 0 (0.0%) |
| 15 to 17 Year Olds | 42 (100.0%) | 0 (0.0%) |
| 18 to 19 Year Olds | 8 (100.0%) | 0 (0.0%) |
| 20 to 24 Year Olds | 0 (0.0%) | 0 (0.0%) |
| 25 to 34 Year Olds | 0 (0.0%) | 0 (0.0%) |
| 35 Years and over | 0 (0.0%) | 0 (0.0%) |
| Total | 152 (100.0%) | 0 (0.0%) |
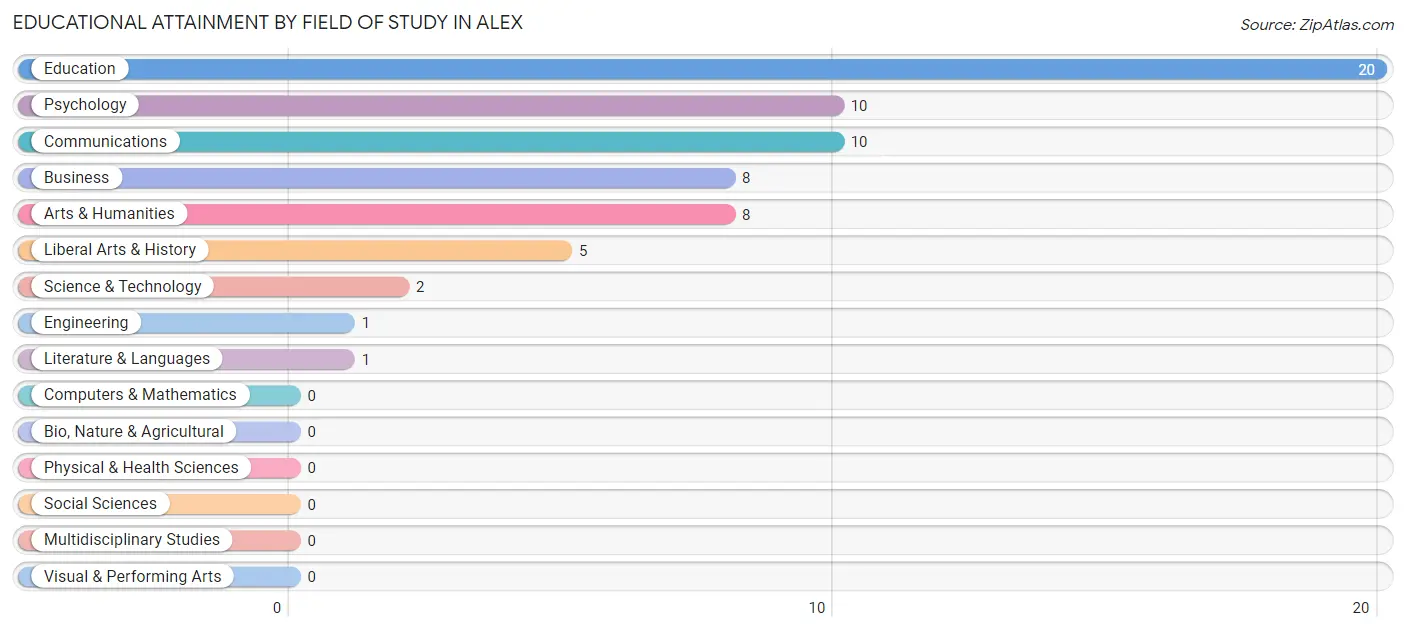
Educational Attainment by Field of Study in Alex
Education (20 | 30.8%), psychology (10 | 15.4%), communications (10 | 15.4%), business (8 | 12.3%), and arts & humanities (8 | 12.3%) are the most common fields of study among 65 individuals in Alex who have obtained a bachelor's degree or higher.
| Field of Study | # Graduates | % Graduates |
| Computers & Mathematics | 0 | 0.0% |
| Bio, Nature & Agricultural | 0 | 0.0% |
| Physical & Health Sciences | 0 | 0.0% |
| Psychology | 10 | 15.4% |
| Social Sciences | 0 | 0.0% |
| Engineering | 1 | 1.5% |
| Multidisciplinary Studies | 0 | 0.0% |
| Science & Technology | 2 | 3.1% |
| Business | 8 | 12.3% |
| Education | 20 | 30.8% |
| Literature & Languages | 1 | 1.5% |
| Liberal Arts & History | 5 | 7.7% |
| Visual & Performing Arts | 0 | 0.0% |
| Communications | 10 | 15.4% |
| Arts & Humanities | 8 | 12.3% |
| Total | 65 | 100.0% |
Transportation & Commute in Alex
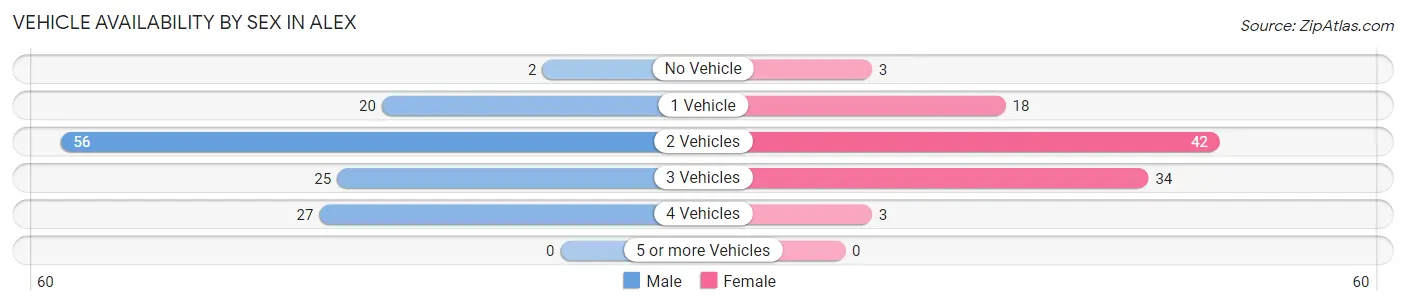
Vehicle Availability by Sex in Alex
The most prevalent vehicle ownership categories in Alex are males with 2 vehicles (56, accounting for 43.1%) and females with 2 vehicles (42, making up 56.0%).
| Vehicles Available | Male | Female |
| No Vehicle | 2 (1.5%) | 3 (3.0%) |
| 1 Vehicle | 20 (15.4%) | 18 (18.0%) |
| 2 Vehicles | 56 (43.1%) | 42 (42.0%) |
| 3 Vehicles | 25 (19.2%) | 34 (34.0%) |
| 4 Vehicles | 27 (20.8%) | 3 (3.0%) |
| 5 or more Vehicles | 0 (0.0%) | 0 (0.0%) |
| Total | 130 (100.0%) | 100 (100.0%) |
Commute Time in Alex
The most frequently occuring commute durations in Alex are 20 to 24 minutes (64 commuters, 29.1%), 30 to 34 minutes (41 commuters, 18.6%), and 15 to 19 minutes (40 commuters, 18.2%).
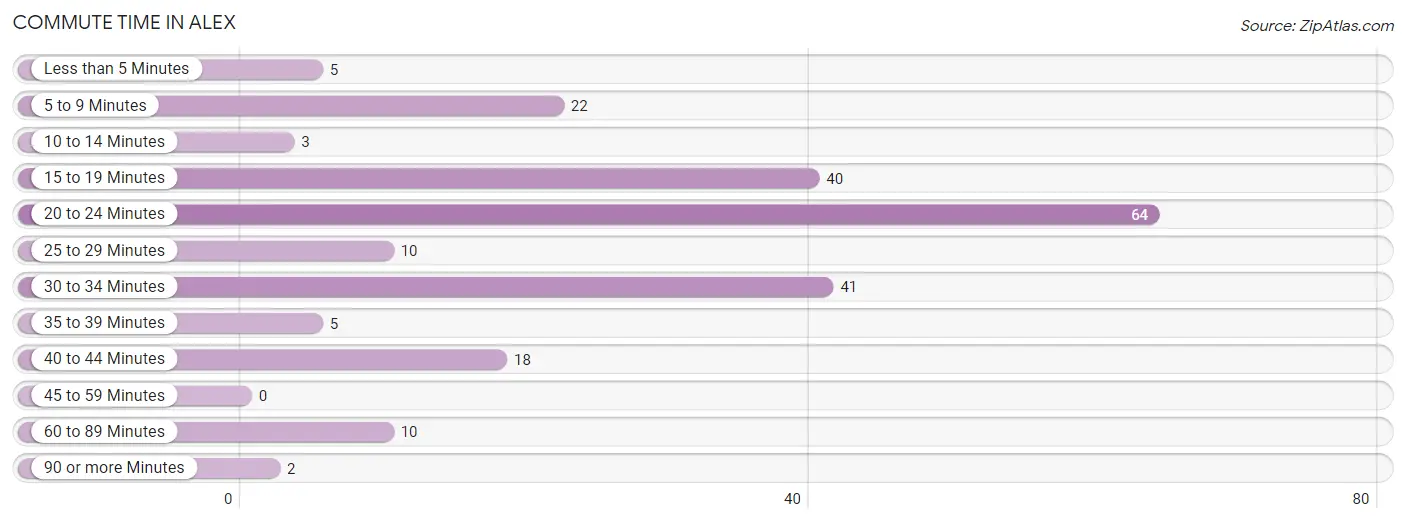
| Commute Time | # Commuters | % Commuters |
| Less than 5 Minutes | 5 | 2.3% |
| 5 to 9 Minutes | 22 | 10.0% |
| 10 to 14 Minutes | 3 | 1.4% |
| 15 to 19 Minutes | 40 | 18.2% |
| 20 to 24 Minutes | 64 | 29.1% |
| 25 to 29 Minutes | 10 | 4.5% |
| 30 to 34 Minutes | 41 | 18.6% |
| 35 to 39 Minutes | 5 | 2.3% |
| 40 to 44 Minutes | 18 | 8.2% |
| 45 to 59 Minutes | 0 | 0.0% |
| 60 to 89 Minutes | 10 | 4.5% |
| 90 or more Minutes | 2 | 0.9% |
Commute Time by Sex in Alex
The most common commute times in Alex are 30 to 34 minutes (25 commuters, 20.0%) for males and 20 to 24 minutes (40 commuters, 42.1%) for females.
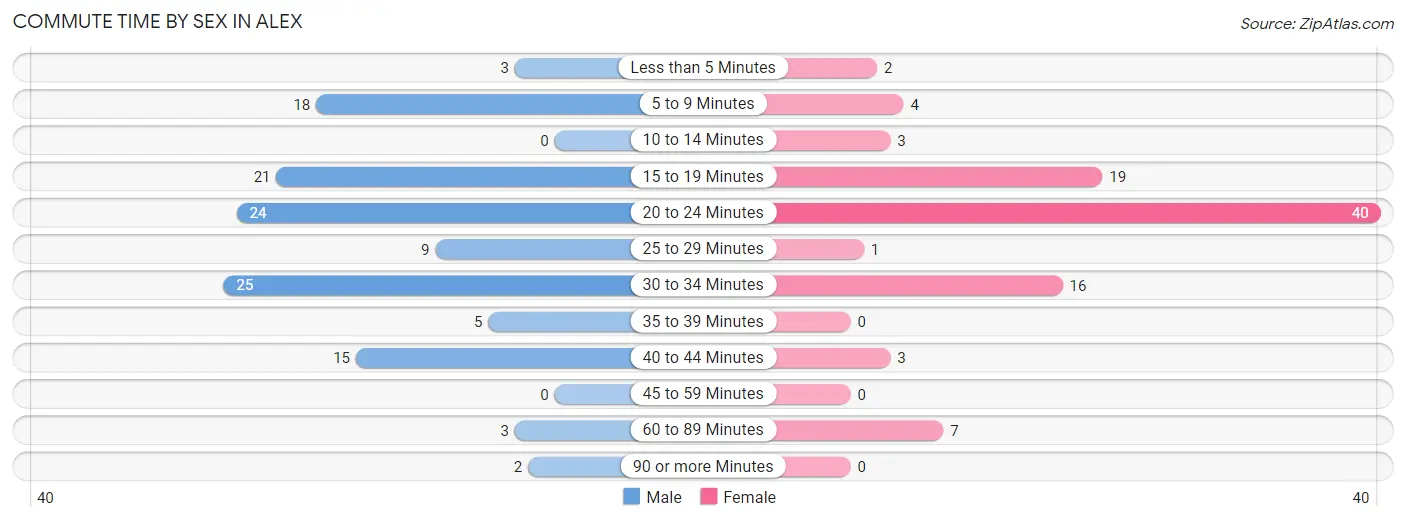
| Commute Time | Male | Female |
| Less than 5 Minutes | 3 (2.4%) | 2 (2.1%) |
| 5 to 9 Minutes | 18 (14.4%) | 4 (4.2%) |
| 10 to 14 Minutes | 0 (0.0%) | 3 (3.2%) |
| 15 to 19 Minutes | 21 (16.8%) | 19 (20.0%) |
| 20 to 24 Minutes | 24 (19.2%) | 40 (42.1%) |
| 25 to 29 Minutes | 9 (7.2%) | 1 (1.1%) |
| 30 to 34 Minutes | 25 (20.0%) | 16 (16.8%) |
| 35 to 39 Minutes | 5 (4.0%) | 0 (0.0%) |
| 40 to 44 Minutes | 15 (12.0%) | 3 (3.2%) |
| 45 to 59 Minutes | 0 (0.0%) | 0 (0.0%) |
| 60 to 89 Minutes | 3 (2.4%) | 7 (7.4%) |
| 90 or more Minutes | 2 (1.6%) | 0 (0.0%) |
Time of Departure to Work by Sex in Alex
The most frequent times of departure to work in Alex are 7:00 AM to 7:29 AM (52, 41.6%) for males and 7:00 AM to 7:29 AM (21, 22.1%) for females.
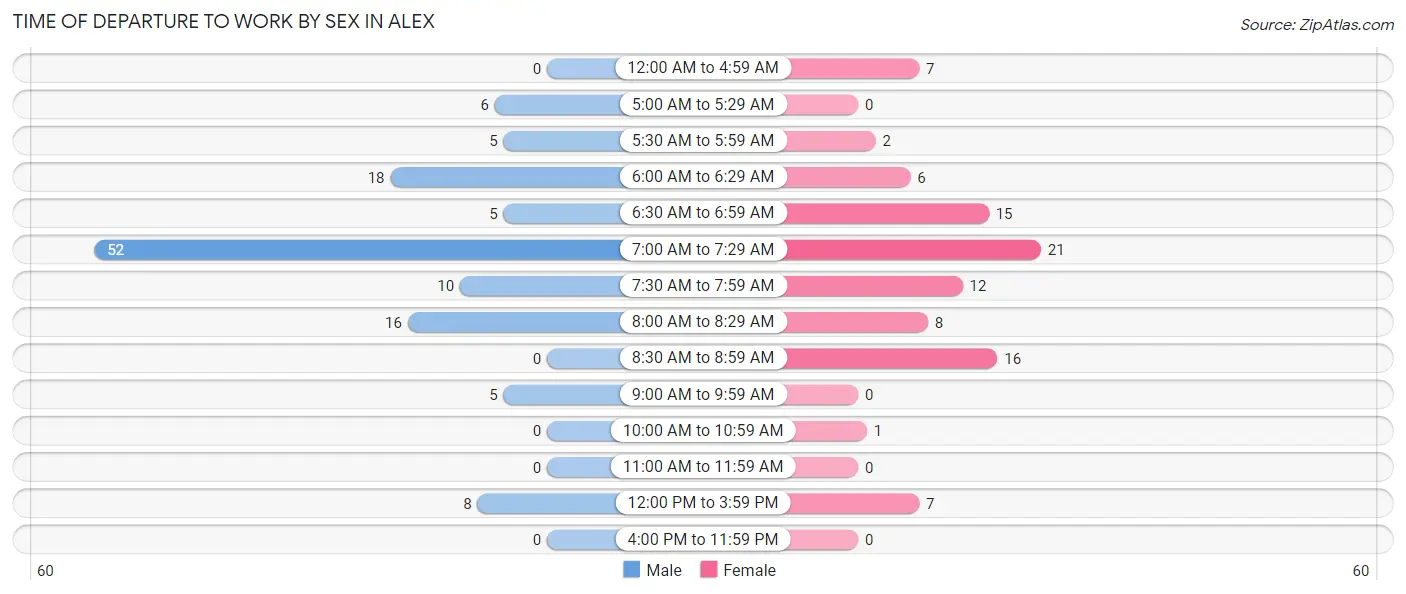
| Time of Departure | Male | Female |
| 12:00 AM to 4:59 AM | 0 (0.0%) | 7 (7.4%) |
| 5:00 AM to 5:29 AM | 6 (4.8%) | 0 (0.0%) |
| 5:30 AM to 5:59 AM | 5 (4.0%) | 2 (2.1%) |
| 6:00 AM to 6:29 AM | 18 (14.4%) | 6 (6.3%) |
| 6:30 AM to 6:59 AM | 5 (4.0%) | 15 (15.8%) |
| 7:00 AM to 7:29 AM | 52 (41.6%) | 21 (22.1%) |
| 7:30 AM to 7:59 AM | 10 (8.0%) | 12 (12.6%) |
| 8:00 AM to 8:29 AM | 16 (12.8%) | 8 (8.4%) |
| 8:30 AM to 8:59 AM | 0 (0.0%) | 16 (16.8%) |
| 9:00 AM to 9:59 AM | 5 (4.0%) | 0 (0.0%) |
| 10:00 AM to 10:59 AM | 0 (0.0%) | 1 (1.1%) |
| 11:00 AM to 11:59 AM | 0 (0.0%) | 0 (0.0%) |
| 12:00 PM to 3:59 PM | 8 (6.4%) | 7 (7.4%) |
| 4:00 PM to 11:59 PM | 0 (0.0%) | 0 (0.0%) |
| Total | 125 (100.0%) | 95 (100.0%) |
Housing Occupancy in Alex
Occupancy by Ownership in Alex
Of the total 212 dwellings in Alex, owner-occupied units account for 172 (81.1%), while renter-occupied units make up 40 (18.9%).
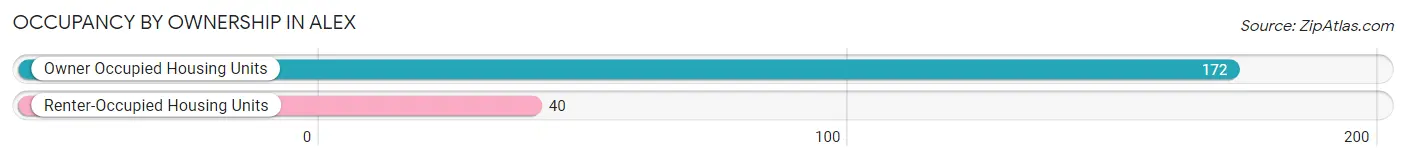
| Occupancy | # Housing Units | % Housing Units |
| Owner Occupied Housing Units | 172 | 81.1% |
| Renter-Occupied Housing Units | 40 | 18.9% |
| Total Occupied Housing Units | 212 | 100.0% |
Occupancy by Household Size in Alex
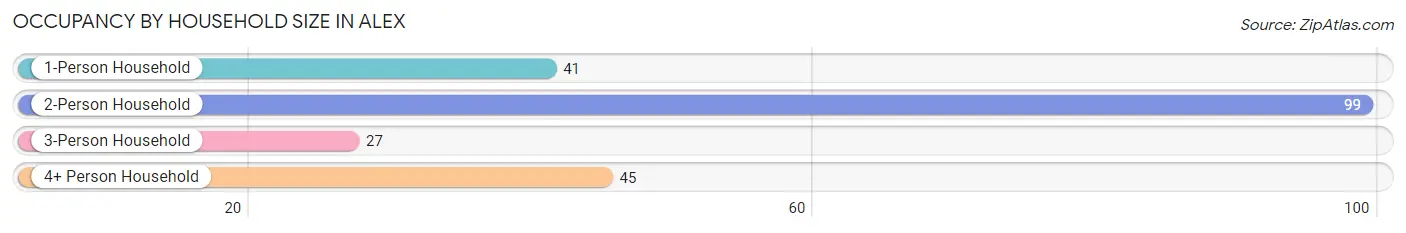
| Household Size | # Housing Units | % Housing Units |
| 1-Person Household | 41 | 19.3% |
| 2-Person Household | 99 | 46.7% |
| 3-Person Household | 27 | 12.7% |
| 4+ Person Household | 45 | 21.2% |
| Total Housing Units | 212 | 100.0% |
Occupancy by Ownership by Household Size in Alex
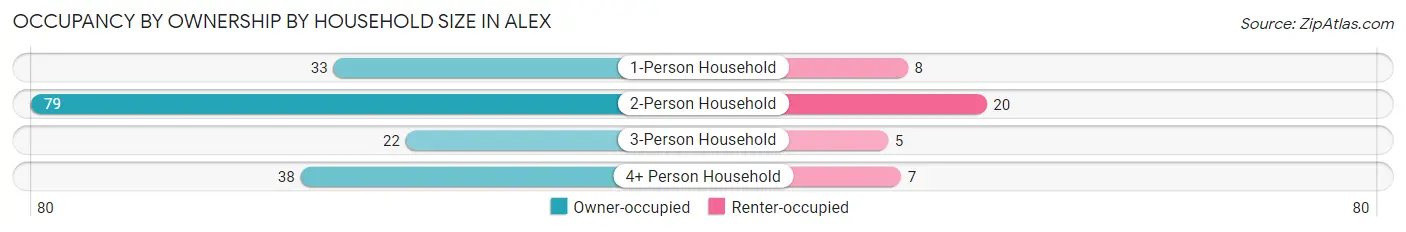
| Household Size | Owner-occupied | Renter-occupied |
| 1-Person Household | 33 (80.5%) | 8 (19.5%) |
| 2-Person Household | 79 (79.8%) | 20 (20.2%) |
| 3-Person Household | 22 (81.5%) | 5 (18.5%) |
| 4+ Person Household | 38 (84.4%) | 7 (15.6%) |
| Total Housing Units | 172 (81.1%) | 40 (18.9%) |
Occupancy by Educational Attainment in Alex
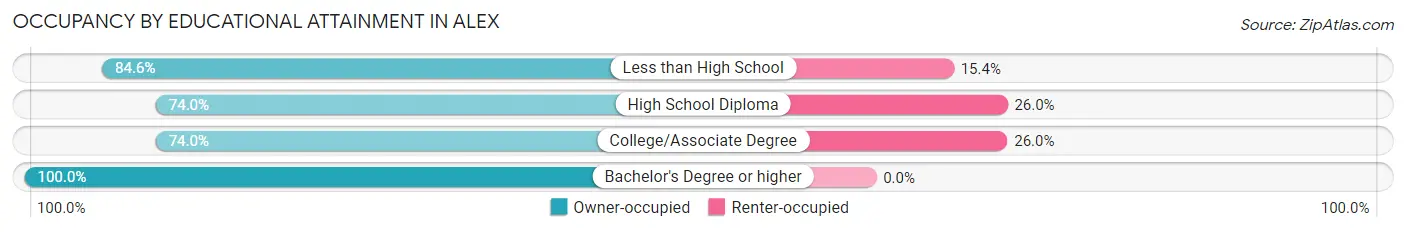
| Household Size | Owner-occupied | Renter-occupied |
| Less than High School | 44 (84.6%) | 8 (15.4%) |
| High School Diploma | 54 (74.0%) | 19 (26.0%) |
| College/Associate Degree | 37 (74.0%) | 13 (26.0%) |
| Bachelor's Degree or higher | 37 (100.0%) | 0 (0.0%) |
Occupancy by Age of Householder in Alex
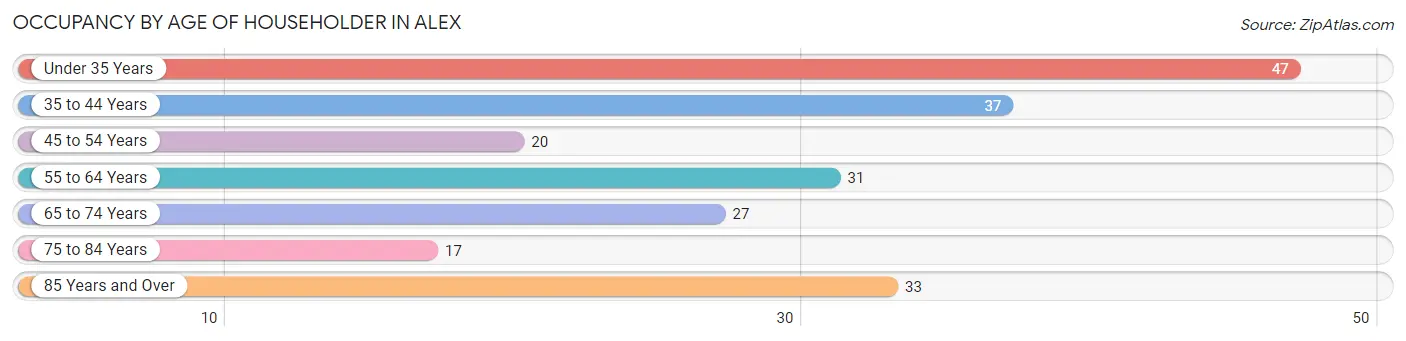
| Age Bracket | # Households | % Households |
| Under 35 Years | 47 | 22.2% |
| 35 to 44 Years | 37 | 17.4% |
| 45 to 54 Years | 20 | 9.4% |
| 55 to 64 Years | 31 | 14.6% |
| 65 to 74 Years | 27 | 12.7% |
| 75 to 84 Years | 17 | 8.0% |
| 85 Years and Over | 33 | 15.6% |
| Total | 212 | 100.0% |
Housing Finances in Alex
Median Income by Occupancy in Alex
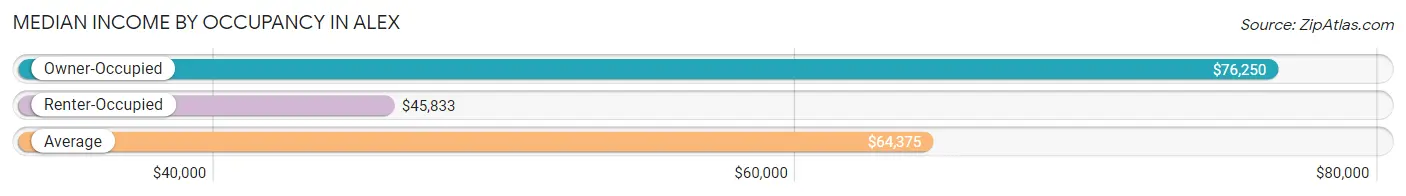
| Occupancy Type | # Households | Median Income |
| Owner-Occupied | 172 (81.1%) | $76,250 |
| Renter-Occupied | 40 (18.9%) | $45,833 |
| Average | 212 (100.0%) | $64,375 |
Occupancy by Householder Income Bracket in Alex
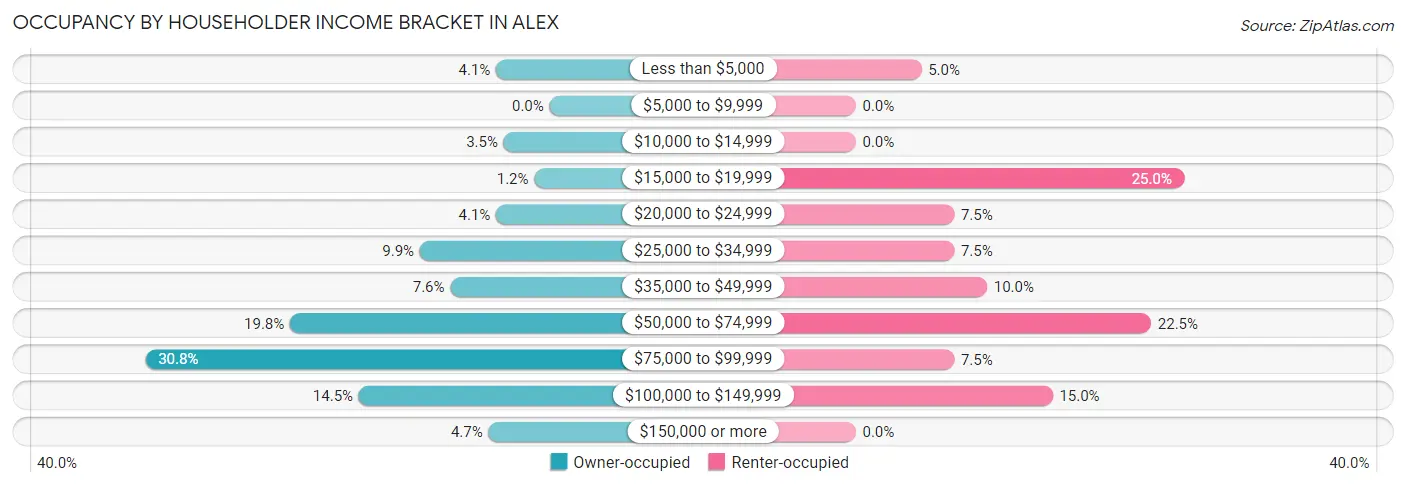
| Income Bracket | Owner-occupied | Renter-occupied |
| Less than $5,000 | 7 (4.1%) | 2 (5.0%) |
| $5,000 to $9,999 | 0 (0.0%) | 0 (0.0%) |
| $10,000 to $14,999 | 6 (3.5%) | 0 (0.0%) |
| $15,000 to $19,999 | 2 (1.2%) | 10 (25.0%) |
| $20,000 to $24,999 | 7 (4.1%) | 3 (7.5%) |
| $25,000 to $34,999 | 17 (9.9%) | 3 (7.5%) |
| $35,000 to $49,999 | 13 (7.6%) | 4 (10.0%) |
| $50,000 to $74,999 | 34 (19.8%) | 9 (22.5%) |
| $75,000 to $99,999 | 53 (30.8%) | 3 (7.5%) |
| $100,000 to $149,999 | 25 (14.5%) | 6 (15.0%) |
| $150,000 or more | 8 (4.6%) | 0 (0.0%) |
| Total | 172 (100.0%) | 40 (100.0%) |
Monthly Housing Cost Tiers in Alex
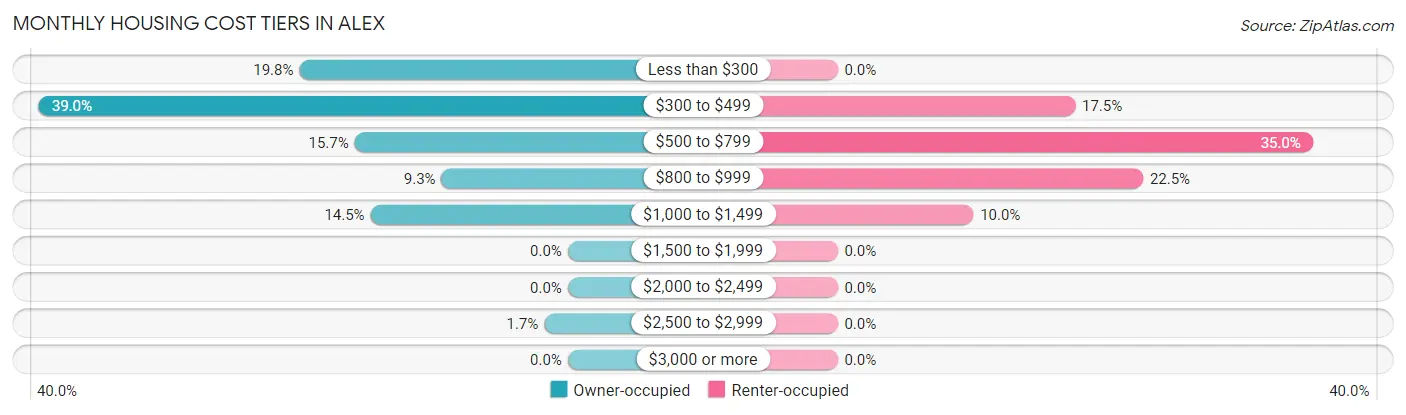
| Monthly Cost | Owner-occupied | Renter-occupied |
| Less than $300 | 34 (19.8%) | 0 (0.0%) |
| $300 to $499 | 67 (39.0%) | 7 (17.5%) |
| $500 to $799 | 27 (15.7%) | 14 (35.0%) |
| $800 to $999 | 16 (9.3%) | 9 (22.5%) |
| $1,000 to $1,499 | 25 (14.5%) | 4 (10.0%) |
| $1,500 to $1,999 | 0 (0.0%) | 0 (0.0%) |
| $2,000 to $2,499 | 0 (0.0%) | 0 (0.0%) |
| $2,500 to $2,999 | 3 (1.7%) | 0 (0.0%) |
| $3,000 or more | 0 (0.0%) | 0 (0.0%) |
| Total | 172 (100.0%) | 40 (100.0%) |
Physical Housing Characteristics in Alex
Housing Structures in Alex
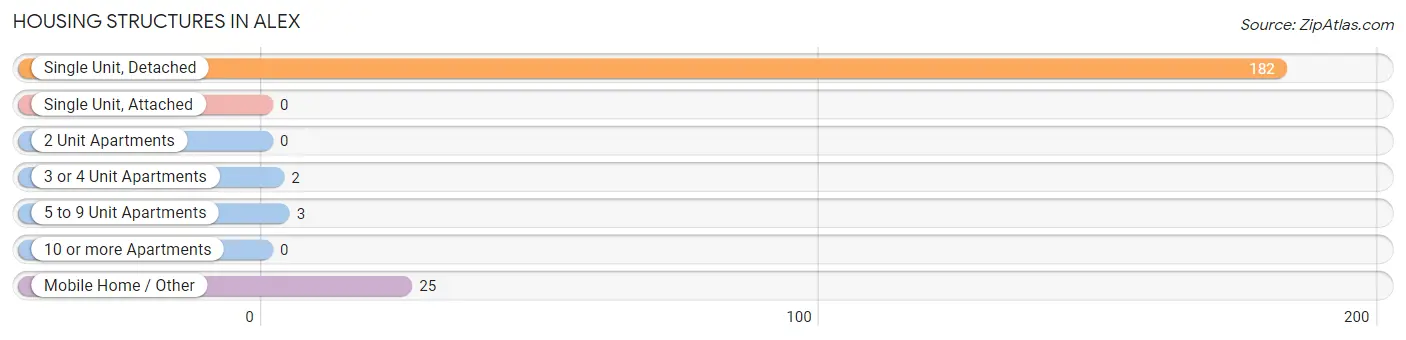
| Structure Type | # Housing Units | % Housing Units |
| Single Unit, Detached | 182 | 85.9% |
| Single Unit, Attached | 0 | 0.0% |
| 2 Unit Apartments | 0 | 0.0% |
| 3 or 4 Unit Apartments | 2 | 0.9% |
| 5 to 9 Unit Apartments | 3 | 1.4% |
| 10 or more Apartments | 0 | 0.0% |
| Mobile Home / Other | 25 | 11.8% |
| Total | 212 | 100.0% |
Housing Structures by Occupancy in Alex
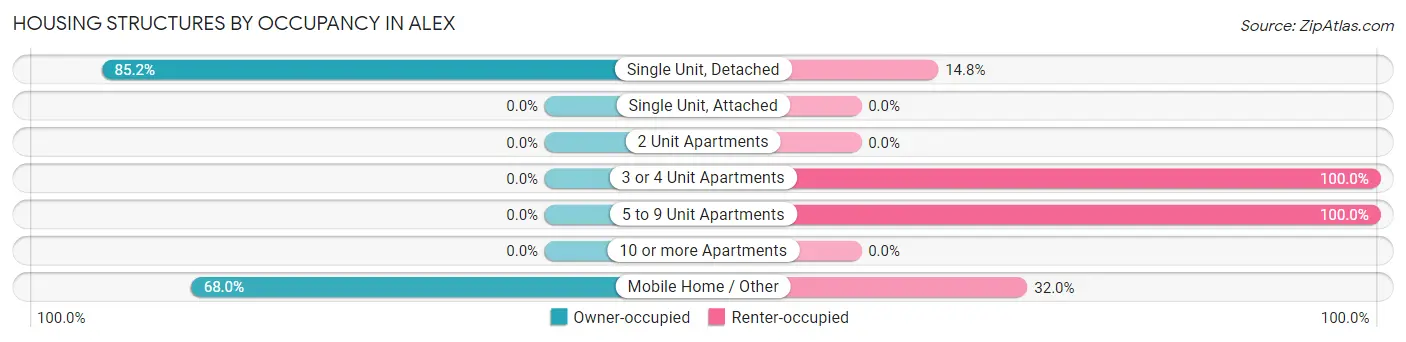
| Structure Type | Owner-occupied | Renter-occupied |
| Single Unit, Detached | 155 (85.2%) | 27 (14.8%) |
| Single Unit, Attached | 0 (0.0%) | 0 (0.0%) |
| 2 Unit Apartments | 0 (0.0%) | 0 (0.0%) |
| 3 or 4 Unit Apartments | 0 (0.0%) | 2 (100.0%) |
| 5 to 9 Unit Apartments | 0 (0.0%) | 3 (100.0%) |
| 10 or more Apartments | 0 (0.0%) | 0 (0.0%) |
| Mobile Home / Other | 17 (68.0%) | 8 (32.0%) |
| Total | 172 (81.1%) | 40 (18.9%) |
Housing Structures by Number of Rooms in Alex
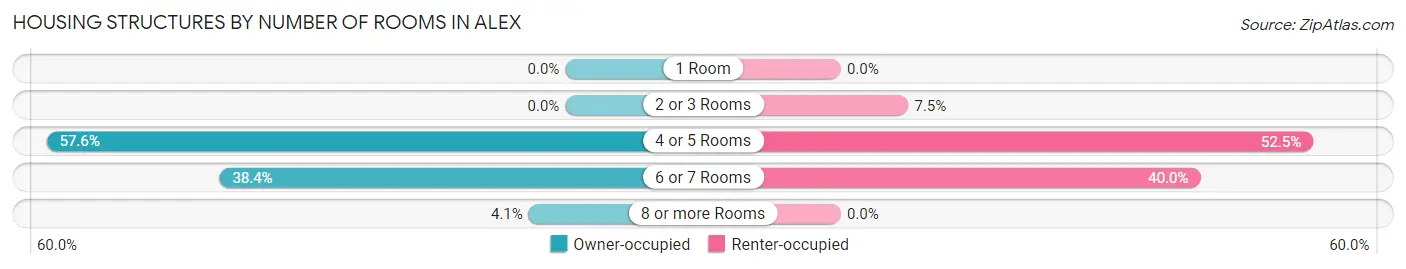
| Number of Rooms | Owner-occupied | Renter-occupied |
| 1 Room | 0 (0.0%) | 0 (0.0%) |
| 2 or 3 Rooms | 0 (0.0%) | 3 (7.5%) |
| 4 or 5 Rooms | 99 (57.6%) | 21 (52.5%) |
| 6 or 7 Rooms | 66 (38.4%) | 16 (40.0%) |
| 8 or more Rooms | 7 (4.1%) | 0 (0.0%) |
| Total | 172 (100.0%) | 40 (100.0%) |
Housing Structure by Heating Type in Alex
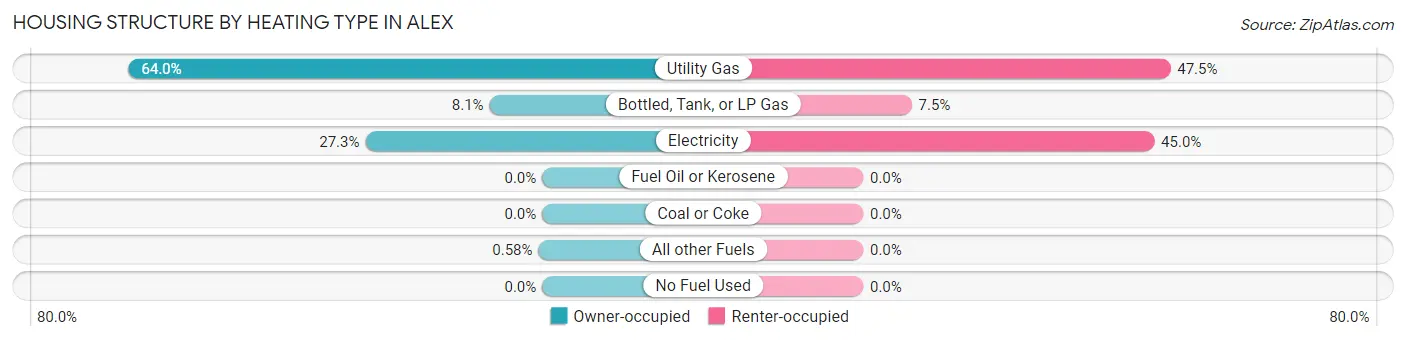
| Heating Type | Owner-occupied | Renter-occupied |
| Utility Gas | 110 (63.9%) | 19 (47.5%) |
| Bottled, Tank, or LP Gas | 14 (8.1%) | 3 (7.5%) |
| Electricity | 47 (27.3%) | 18 (45.0%) |
| Fuel Oil or Kerosene | 0 (0.0%) | 0 (0.0%) |
| Coal or Coke | 0 (0.0%) | 0 (0.0%) |
| All other Fuels | 1 (0.6%) | 0 (0.0%) |
| No Fuel Used | 0 (0.0%) | 0 (0.0%) |
| Total | 172 (100.0%) | 40 (100.0%) |
Household Vehicle Usage in Alex
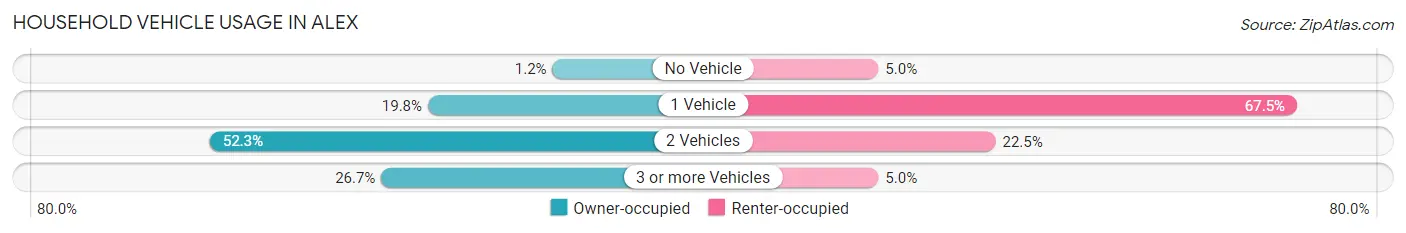
| Vehicles per Household | Owner-occupied | Renter-occupied |
| No Vehicle | 2 (1.2%) | 2 (5.0%) |
| 1 Vehicle | 34 (19.8%) | 27 (67.5%) |
| 2 Vehicles | 90 (52.3%) | 9 (22.5%) |
| 3 or more Vehicles | 46 (26.7%) | 2 (5.0%) |
| Total | 172 (100.0%) | 40 (100.0%) |
Real Estate & Mortgages in Alex
Real Estate and Mortgage Overview in Alex
| Characteristic | Without Mortgage | With Mortgage |
| Housing Units | 113 | 59 |
| Median Property Value | $38,300 | $100,800 |
| Median Household Income | $68,125 | $8 |
| Monthly Housing Costs | $326 | $0 |
| Real Estate Taxes | $199 | $2 |
Property Value by Mortgage Status in Alex
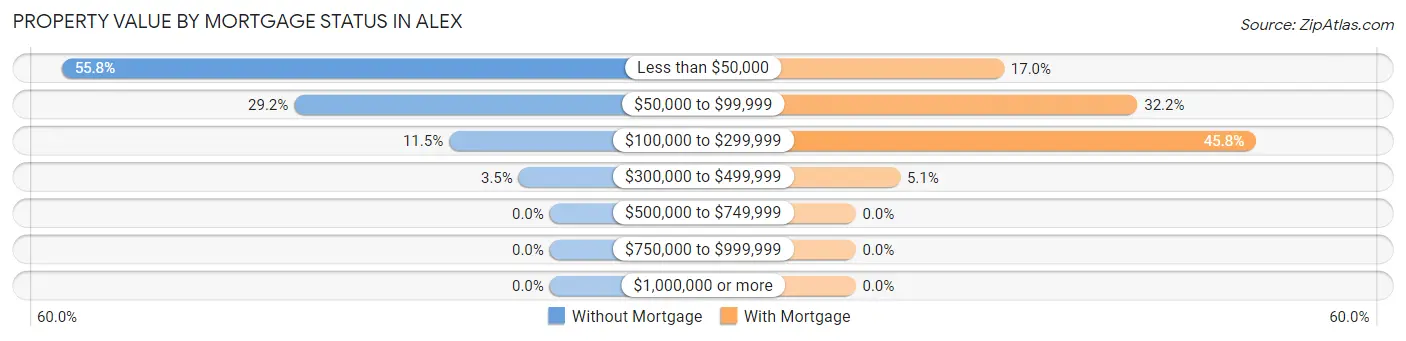
| Property Value | Without Mortgage | With Mortgage |
| Less than $50,000 | 63 (55.7%) | 10 (17.0%) |
| $50,000 to $99,999 | 33 (29.2%) | 19 (32.2%) |
| $100,000 to $299,999 | 13 (11.5%) | 27 (45.8%) |
| $300,000 to $499,999 | 4 (3.5%) | 3 (5.1%) |
| $500,000 to $749,999 | 0 (0.0%) | 0 (0.0%) |
| $750,000 to $999,999 | 0 (0.0%) | 0 (0.0%) |
| $1,000,000 or more | 0 (0.0%) | 0 (0.0%) |
| Total | 113 (100.0%) | 59 (100.0%) |
Household Income by Mortgage Status in Alex
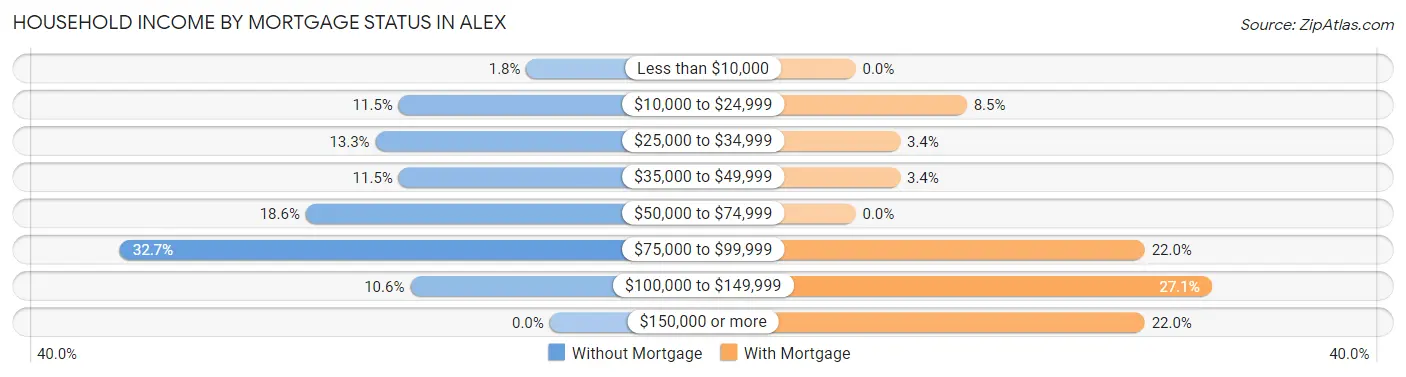
| Household Income | Without Mortgage | With Mortgage |
| Less than $10,000 | 2 (1.8%) | 0 (0.0%) |
| $10,000 to $24,999 | 13 (11.5%) | 5 (8.5%) |
| $25,000 to $34,999 | 15 (13.3%) | 2 (3.4%) |
| $35,000 to $49,999 | 13 (11.5%) | 2 (3.4%) |
| $50,000 to $74,999 | 21 (18.6%) | 0 (0.0%) |
| $75,000 to $99,999 | 37 (32.7%) | 13 (22.0%) |
| $100,000 to $149,999 | 12 (10.6%) | 16 (27.1%) |
| $150,000 or more | 0 (0.0%) | 13 (22.0%) |
| Total | 113 (100.0%) | 59 (100.0%) |
Property Value to Household Income Ratio in Alex
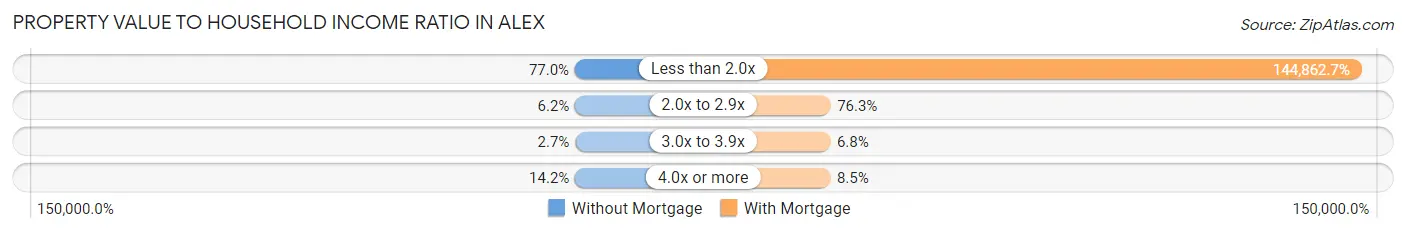
| Value-to-Income Ratio | Without Mortgage | With Mortgage |
| Less than 2.0x | 87 (77.0%) | 85,469 (144,862.7%) |
| 2.0x to 2.9x | 7 (6.2%) | 45 (76.3%) |
| 3.0x to 3.9x | 3 (2.6%) | 4 (6.8%) |
| 4.0x or more | 16 (14.2%) | 5 (8.5%) |
| Total | 113 (100.0%) | 59 (100.0%) |
Real Estate Taxes by Mortgage Status in Alex
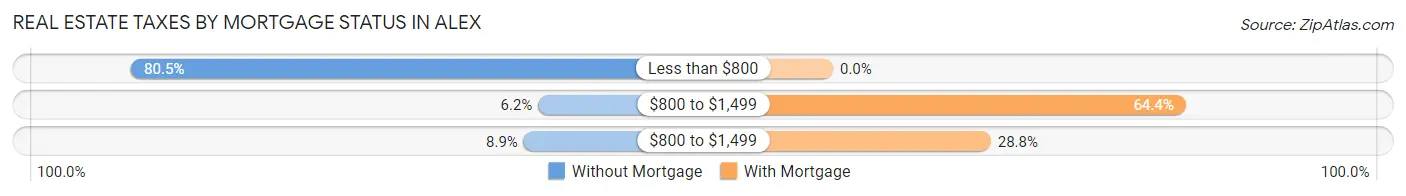
| Property Taxes | Without Mortgage | With Mortgage |
| Less than $800 | 91 (80.5%) | 0 (0.0%) |
| $800 to $1,499 | 7 (6.2%) | 38 (64.4%) |
| $800 to $1,499 | 10 (8.8%) | 17 (28.8%) |
| Total | 113 (100.0%) | 59 (100.0%) |
Health & Disability in Alex
Health Insurance Coverage by Age in Alex
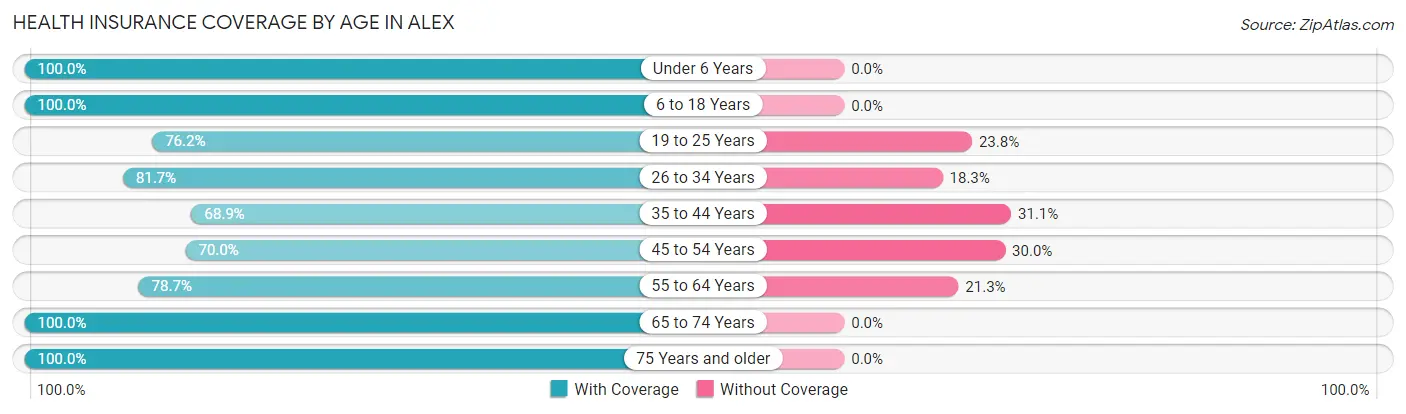
| Age Bracket | With Coverage | Without Coverage |
| Under 6 Years | 47 (100.0%) | 0 (0.0%) |
| 6 to 18 Years | 141 (100.0%) | 0 (0.0%) |
| 19 to 25 Years | 32 (76.2%) | 10 (23.8%) |
| 26 to 34 Years | 98 (81.7%) | 22 (18.3%) |
| 35 to 44 Years | 62 (68.9%) | 28 (31.1%) |
| 45 to 54 Years | 35 (70.0%) | 15 (30.0%) |
| 55 to 64 Years | 37 (78.7%) | 10 (21.3%) |
| 65 to 74 Years | 37 (100.0%) | 0 (0.0%) |
| 75 Years and older | 59 (100.0%) | 0 (0.0%) |
| Total | 548 (86.6%) | 85 (13.4%) |
Health Insurance Coverage by Citizenship Status in Alex
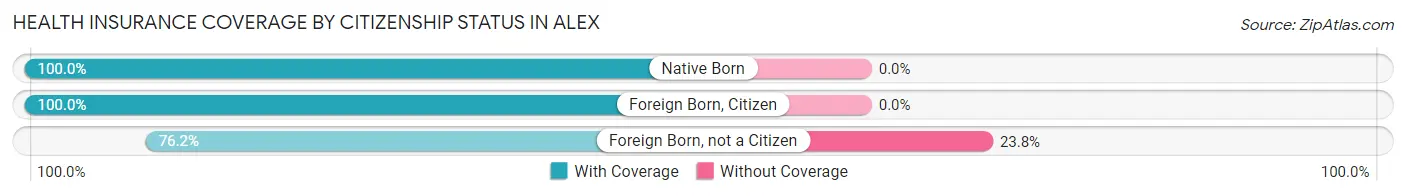
| Citizenship Status | With Coverage | Without Coverage |
| Native Born | 47 (100.0%) | 0 (0.0%) |
| Foreign Born, Citizen | 141 (100.0%) | 0 (0.0%) |
| Foreign Born, not a Citizen | 32 (76.2%) | 10 (23.8%) |
Health Insurance Coverage by Household Income in Alex
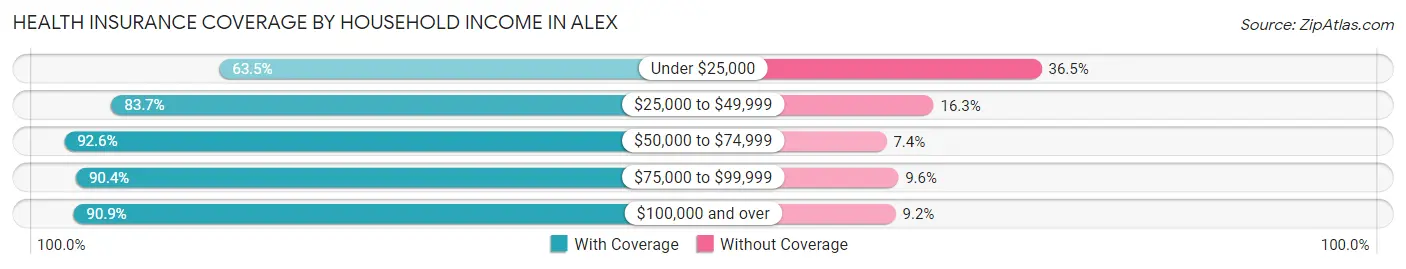
| Household Income | With Coverage | Without Coverage |
| Under $25,000 | 47 (63.5%) | 27 (36.5%) |
| $25,000 to $49,999 | 103 (83.7%) | 20 (16.3%) |
| $50,000 to $74,999 | 137 (92.6%) | 11 (7.4%) |
| $75,000 to $99,999 | 122 (90.4%) | 13 (9.6%) |
| $100,000 and over | 139 (90.8%) | 14 (9.1%) |
Public vs Private Health Insurance Coverage by Age in Alex
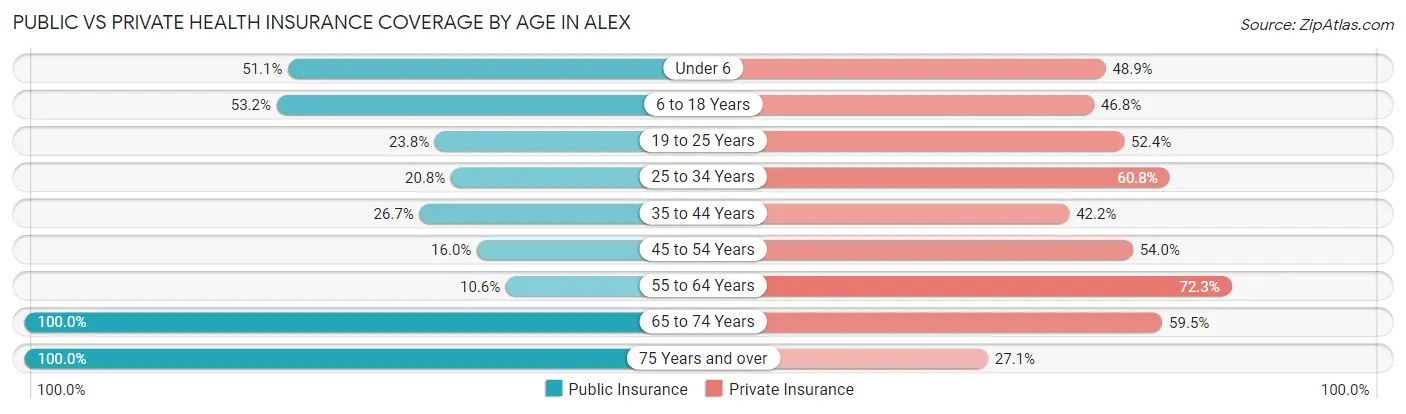
| Age Bracket | Public Insurance | Private Insurance |
| Under 6 | 24 (51.1%) | 23 (48.9%) |
| 6 to 18 Years | 75 (53.2%) | 66 (46.8%) |
| 19 to 25 Years | 10 (23.8%) | 22 (52.4%) |
| 25 to 34 Years | 25 (20.8%) | 73 (60.8%) |
| 35 to 44 Years | 24 (26.7%) | 38 (42.2%) |
| 45 to 54 Years | 8 (16.0%) | 27 (54.0%) |
| 55 to 64 Years | 5 (10.6%) | 34 (72.3%) |
| 65 to 74 Years | 37 (100.0%) | 22 (59.5%) |
| 75 Years and over | 59 (100.0%) | 16 (27.1%) |
| Total | 267 (42.2%) | 321 (50.7%) |
Disability Status by Sex by Age in Alex
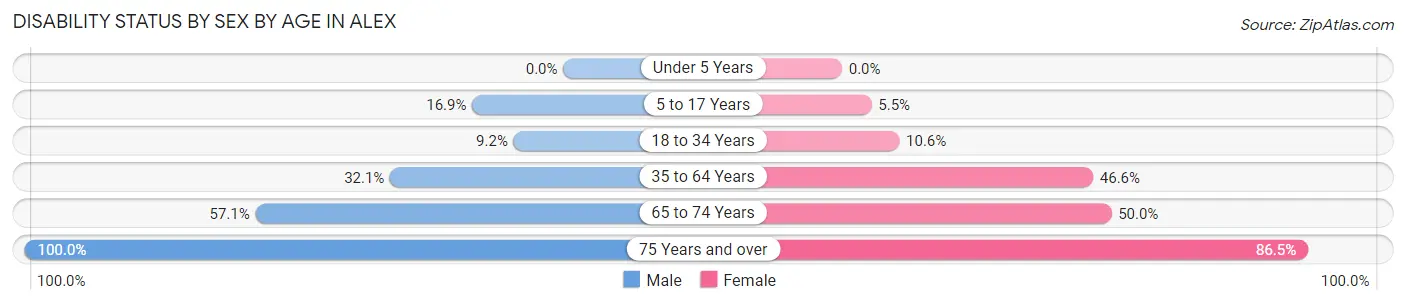
| Age Bracket | Male | Female |
| Under 5 Years | 0 (0.0%) | 0 (0.0%) |
| 5 to 17 Years | 12 (16.9%) | 4 (5.5%) |
| 18 to 34 Years | 7 (9.2%) | 10 (10.6%) |
| 35 to 64 Years | 27 (32.1%) | 48 (46.6%) |
| 65 to 74 Years | 12 (57.1%) | 8 (50.0%) |
| 75 Years and over | 7 (100.0%) | 45 (86.5%) |
Disability Class by Sex by Age in Alex
Disability Class: Hearing Difficulty
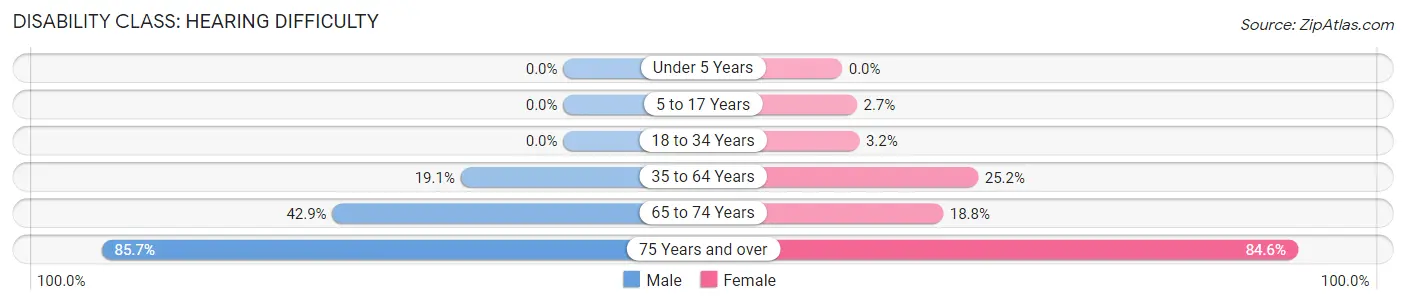
| Age Bracket | Male | Female |
| Under 5 Years | 0 (0.0%) | 0 (0.0%) |
| 5 to 17 Years | 0 (0.0%) | 2 (2.7%) |
| 18 to 34 Years | 0 (0.0%) | 3 (3.2%) |
| 35 to 64 Years | 16 (19.1%) | 26 (25.2%) |
| 65 to 74 Years | 9 (42.9%) | 3 (18.8%) |
| 75 Years and over | 6 (85.7%) | 44 (84.6%) |
Disability Class: Vision Difficulty
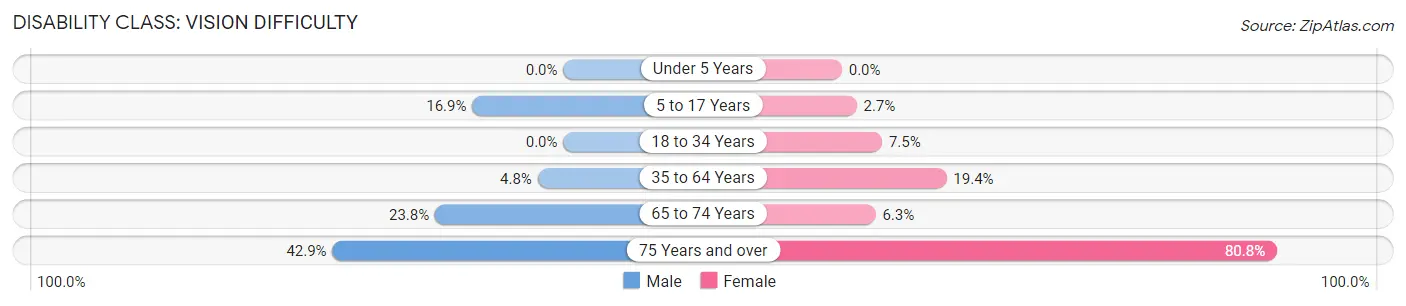
| Age Bracket | Male | Female |
| Under 5 Years | 0 (0.0%) | 0 (0.0%) |
| 5 to 17 Years | 12 (16.9%) | 2 (2.7%) |
| 18 to 34 Years | 0 (0.0%) | 7 (7.4%) |
| 35 to 64 Years | 4 (4.8%) | 20 (19.4%) |
| 65 to 74 Years | 5 (23.8%) | 1 (6.2%) |
| 75 Years and over | 3 (42.9%) | 42 (80.8%) |
Disability Class: Cognitive Difficulty
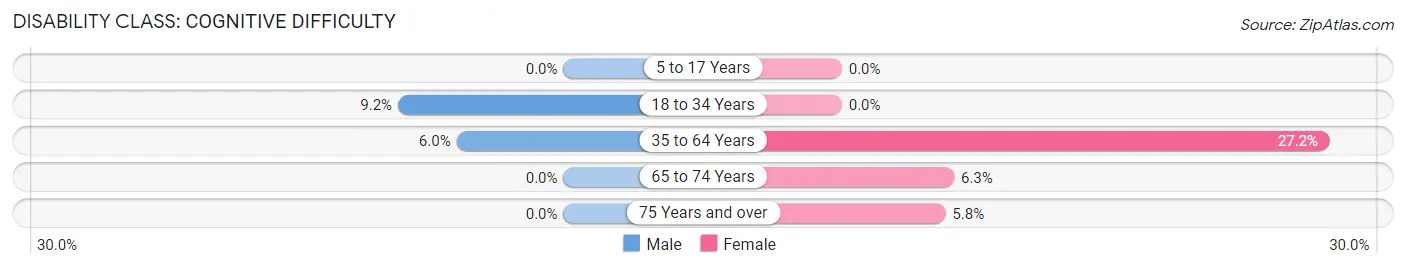
| Age Bracket | Male | Female |
| 5 to 17 Years | 0 (0.0%) | 0 (0.0%) |
| 18 to 34 Years | 7 (9.2%) | 0 (0.0%) |
| 35 to 64 Years | 5 (5.9%) | 28 (27.2%) |
| 65 to 74 Years | 0 (0.0%) | 1 (6.2%) |
| 75 Years and over | 0 (0.0%) | 3 (5.8%) |
Disability Class: Ambulatory Difficulty
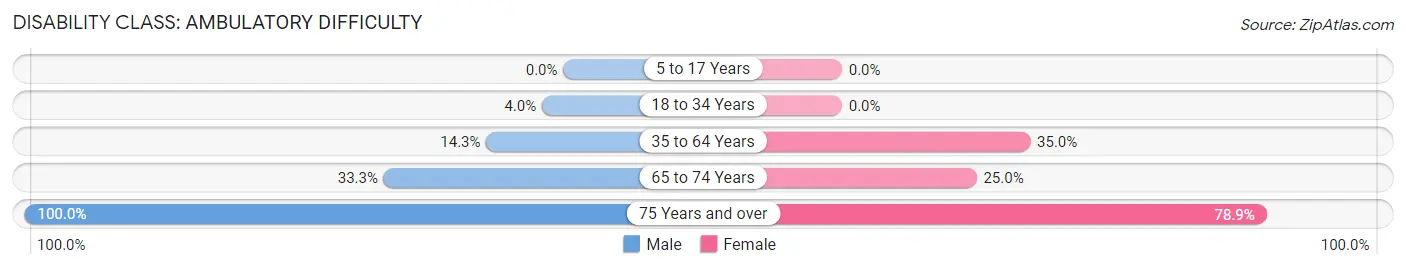
| Age Bracket | Male | Female |
| 5 to 17 Years | 0 (0.0%) | 0 (0.0%) |
| 18 to 34 Years | 3 (4.0%) | 0 (0.0%) |
| 35 to 64 Years | 12 (14.3%) | 36 (34.9%) |
| 65 to 74 Years | 7 (33.3%) | 4 (25.0%) |
| 75 Years and over | 7 (100.0%) | 41 (78.8%) |
Disability Class: Self-Care Difficulty
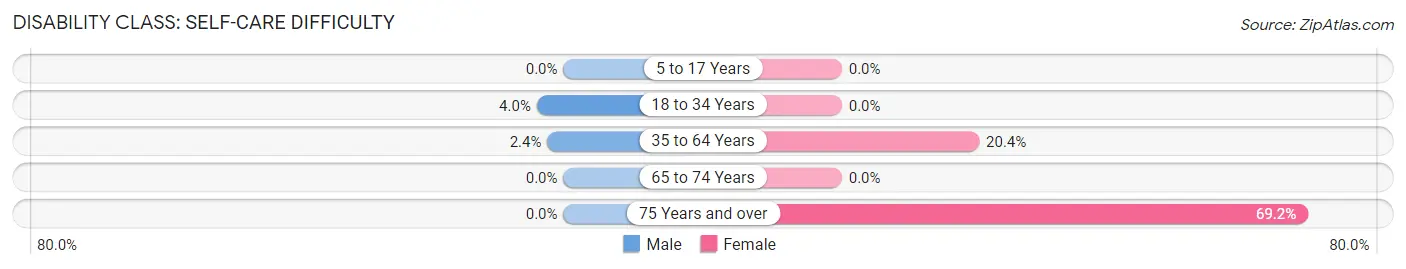
| Age Bracket | Male | Female |
| 5 to 17 Years | 0 (0.0%) | 0 (0.0%) |
| 18 to 34 Years | 3 (4.0%) | 0 (0.0%) |
| 35 to 64 Years | 2 (2.4%) | 21 (20.4%) |
| 65 to 74 Years | 0 (0.0%) | 0 (0.0%) |
| 75 Years and over | 0 (0.0%) | 36 (69.2%) |
Technology Access in Alex
Computing Device Access in Alex
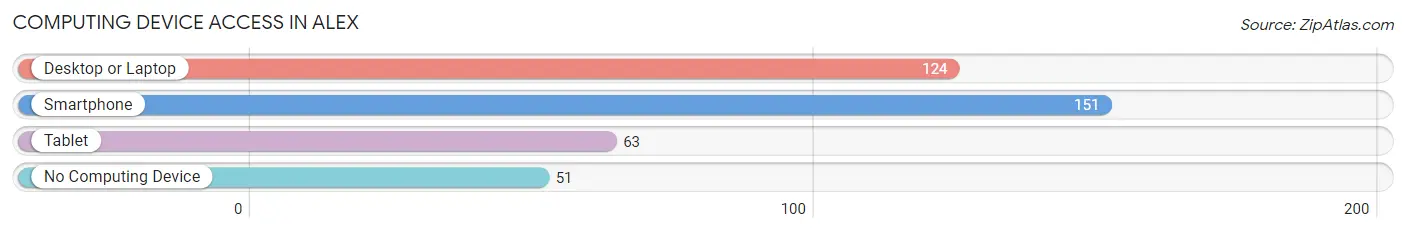
| Device Type | # Households | % Households |
| Desktop or Laptop | 124 | 58.5% |
| Smartphone | 151 | 71.2% |
| Tablet | 63 | 29.7% |
| No Computing Device | 51 | 24.1% |
| Total | 212 | 100.0% |
Internet Access in Alex
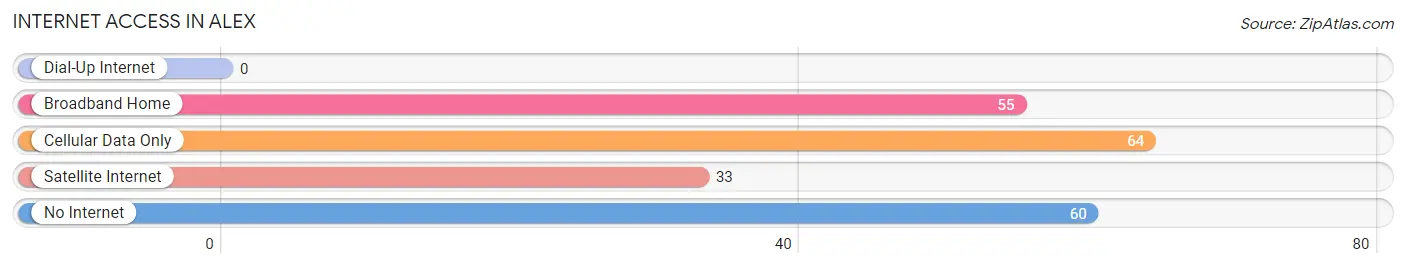
| Internet Type | # Households | % Households |
| Dial-Up Internet | 0 | 0.0% |
| Broadband Home | 55 | 25.9% |
| Cellular Data Only | 64 | 30.2% |
| Satellite Internet | 33 | 15.6% |
| No Internet | 60 | 28.3% |
| Total | 212 | 100.0% |
Alex Summary
History
Oklahoma is a state located in the South Central region of the United States. It is bordered by Kansas to the north, Missouri to the northeast, Arkansas to the east, Texas to the south and west, and New Mexico to the west of its Panhandle region. The state's name is derived from the Choctaw words okla and humma, meaning "red people". It is also known informally by its nickname, The Sooner State, in reference to the non-Native settlers who staked their claims on the choicest pieces of land prior to the official opening date of lands in the western Oklahoma Territory or before the Indian Appropriations Act of 1889, which increased European-American settlement in the eastern part of the territory.
Oklahoma has a rich and varied history. The area was inhabited by Native American tribes for thousands of years before the arrival of European settlers. The first Europeans to explore the area were Spanish explorers in the 16th century. In the 19th century, the area was part of the Louisiana Purchase and became part of the United States. In the early 20th century, Oklahoma was admitted to the Union as the 46th state.
Oklahoma has a long and complex history of Native American settlement. The area was home to many different tribes, including the Apache, Comanche, Kiowa, Osage, and Quapaw. These tribes were nomadic, hunting buffalo and other game. In the early 19th century, the United States government began to forcibly relocate Native Americans to reservations in Oklahoma. This process, known as the Trail of Tears, resulted in the displacement of thousands of Native Americans.
In the late 19th century, the federal government opened up the area for settlement by non-Native Americans. This led to a land rush, as settlers from across the United States and around the world rushed to stake their claims. The area quickly became known as the "Wild West," and was home to cowboys, outlaws, and lawmen.
In 1907, Oklahoma became the 46th state admitted to the Union. The state quickly developed an economy based on agriculture and oil. In the 1920s, Oklahoma was hit hard by the Great Depression, but the state recovered in the 1940s and 1950s. In the 1960s and 1970s, Oklahoma experienced a period of economic growth and diversification.
Geography
Oklahoma is located in the South Central region of the United States. It is bordered by Kansas to the north, Missouri to the northeast, Arkansas to the east, Texas to the south and west, and New Mexico to the west of its Panhandle region. The state covers an area of 69,899 square miles, making it the 20th largest state in the country.
Oklahoma is divided into four distinct geographic regions. The eastern part of the state is known as the Ouachita Mountains, which are part of the Ozark Plateau. The western part of the state is known as the Great Plains, which is characterized by flat, rolling terrain. The central part of the state is known as the Cross Timbers, which is a mix of woodlands and prairies. The Panhandle region is located in the northwest corner of the state and is characterized by flat, dry terrain.
Economy
Oklahoma has a diverse economy that is driven by agriculture, energy, manufacturing, and services. The state is a major producer of oil and natural gas, and is home to several major oil and gas companies. Agriculture is also an important part of the state’s economy, with wheat, cotton, and cattle being the main products.
Manufacturing is also an important part of the state’s economy. Oklahoma is home to several major manufacturing companies, including aircraft manufacturer Boeing, tire manufacturer Goodyear, and appliance manufacturer Whirlpool. The state is also home to several major military bases, which provide a significant boost to the local economy.
The service sector is also an important part of the state’s economy. Oklahoma is home to several major universities, including the University of Oklahoma and Oklahoma State University. The state is also home to several major health care providers, including the Oklahoma Health Care Authority and the Oklahoma State Department of Health.
Demographics
As of 2019, Oklahoma had an estimated population of 3.9 million people. The state is home to a diverse population, with the largest ethnic groups being White (68.3%), American Indian and Alaska Native (9.2%), Black or African American (7.7%), and Hispanic or Latino (7.2%).
The median household income in Oklahoma is $50,051, and the median home value is $133,400. The state has a poverty rate of 16.2%, which is slightly higher than the national average. The largest cities in Oklahoma are Oklahoma City, Tulsa, Norman, Broken Arrow, and Lawton.
Common Questions
What is Per Capita Income in Alex?
Per Capita income in Alex is $23,179.
What is the Median Family Income in Alex?
Median Family Income in Alex is $78,041.
What is the Median Household income in Alex?
Median Household Income in Alex is $64,375.
What is Income or Wage Gap in Alex?
Income or Wage Gap in Alex is 2.8%.
Women in Alex earn 97.2 cents for every dollar earned by a man.
What is Family Income Deficit in Alex?
Family Income Deficit in Alex is $9,665.
Families that are below poverty line in Alex earn $9,665 less on average than the poverty threshold level.
What is Inequality or Gini Index in Alex?
Inequality or Gini Index in Alex is 0.33.
What is the Total Population of Alex?
Total Population of Alex is 633.
What is the Total Male Population of Alex?
Total Male Population of Alex is 267.
What is the Total Female Population of Alex?
Total Female Population of Alex is 366.
What is the Ratio of Males per 100 Females in Alex?
There are 72.95 Males per 100 Females in Alex.
What is the Ratio of Females per 100 Males in Alex?
There are 137.08 Females per 100 Males in Alex.
What is the Median Population Age in Alex?
Median Population Age in Alex is 31.9 Years.
What is the Average Family Size in Alex
Average Family Size in Alex is 3.5 People.
What is the Average Household Size in Alex
Average Household Size in Alex is 3.0 People.
How Large is the Labor Force in Alex?
There are 241 People in the Labor Forcein in Alex.
What is the Percentage of People in the Labor Force in Alex?
50.5% of People are in the Labor Force in Alex.
What is the Unemployment Rate in Alex?
Unemployment Rate in Alex is 4.6%.