Albany, OK Map & Demographics
Albany Map
Albany Overview
$20,618
PER CAPITA INCOME
$47,292
AVG FAMILY INCOME
$45,417
AVG HOUSEHOLD INCOME
0.32
INEQUALITY / GINI INDEX
114
TOTAL POPULATION
62
MALE POPULATION
52
FEMALE POPULATION
119.23
MALES / 100 FEMALES
83.87
FEMALES / 100 MALES
44.8
MEDIAN AGE
3.0
AVG FAMILY SIZE
2.6
AVG HOUSEHOLD SIZE
25
LABOR FORCE [ PEOPLE ]
28.7%
PERCENT IN LABOR FORCE
Albany Area Codes
Income in Albany
Income Overview in Albany
Per Capita Income in Albany is $20,618, while median incomes of families and households are $47,292 and $45,417 respectively.
| Characteristic | Number | Measure |
| Per Capita Income | 114 | $20,618 |
| Median Family Income | 35 | $47,292 |
| Mean Family Income | 35 | $55,271 |
| Median Household Income | 44 | $45,417 |
| Mean Household Income | 44 | $51,539 |
| Income Deficit | 35 | $0 |
| Wage / Income Gap (%) | 114 | 0.00% |
| Wage / Income Gap ($) | 114 | 100.00¢ per $1 |
| Gini / Inequality Index | 114 | 0.32 |
Earnings by Sex in Albany
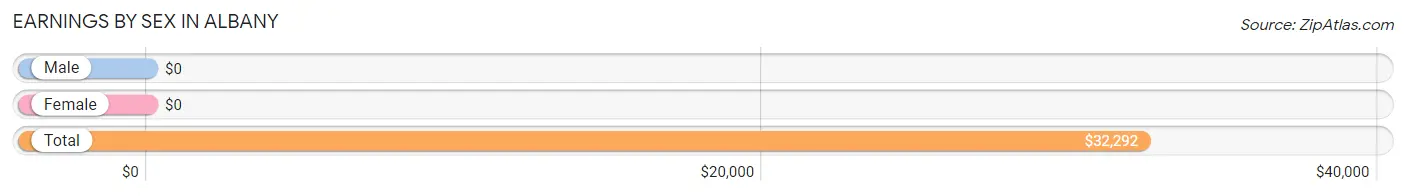
| Sex | Number | Average Earnings |
| Male | 12 (48.0%) | $0 |
| Female | 13 (52.0%) | $0 |
| Total | 25 (100.0%) | $32,292 |
Earnings by Sex by Income Bracket in Albany
The most common earnings brackets in Albany are $30,000 to $34,999 for men (6 | 50.0%) and $22,500 to $24,999 for women (7 | 53.8%).
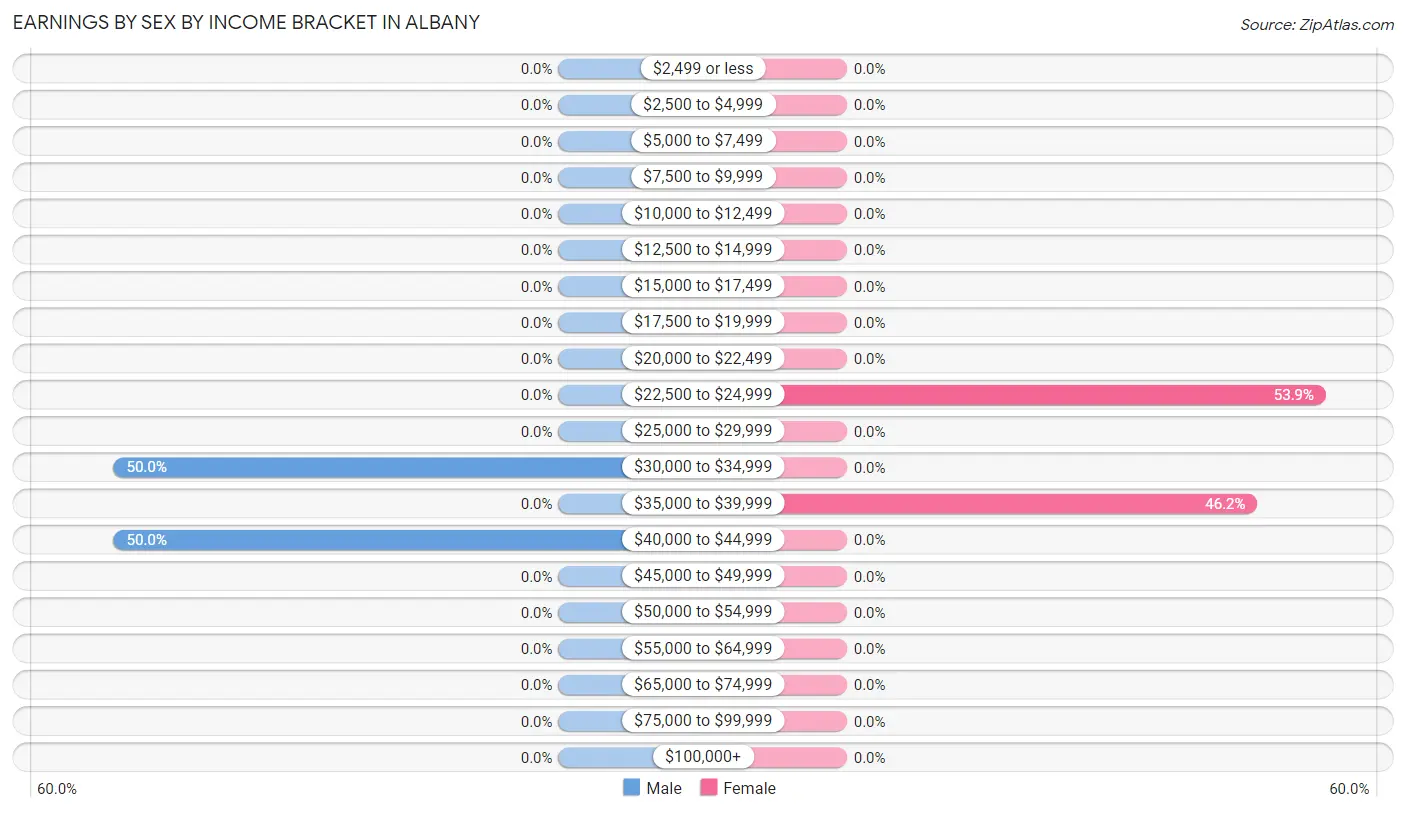
| Income | Male | Female |
| $2,499 or less | 0 (0.0%) | 0 (0.0%) |
| $2,500 to $4,999 | 0 (0.0%) | 0 (0.0%) |
| $5,000 to $7,499 | 0 (0.0%) | 0 (0.0%) |
| $7,500 to $9,999 | 0 (0.0%) | 0 (0.0%) |
| $10,000 to $12,499 | 0 (0.0%) | 0 (0.0%) |
| $12,500 to $14,999 | 0 (0.0%) | 0 (0.0%) |
| $15,000 to $17,499 | 0 (0.0%) | 0 (0.0%) |
| $17,500 to $19,999 | 0 (0.0%) | 0 (0.0%) |
| $20,000 to $22,499 | 0 (0.0%) | 0 (0.0%) |
| $22,500 to $24,999 | 0 (0.0%) | 7 (53.8%) |
| $25,000 to $29,999 | 0 (0.0%) | 0 (0.0%) |
| $30,000 to $34,999 | 6 (50.0%) | 0 (0.0%) |
| $35,000 to $39,999 | 0 (0.0%) | 6 (46.2%) |
| $40,000 to $44,999 | 6 (50.0%) | 0 (0.0%) |
| $45,000 to $49,999 | 0 (0.0%) | 0 (0.0%) |
| $50,000 to $54,999 | 0 (0.0%) | 0 (0.0%) |
| $55,000 to $64,999 | 0 (0.0%) | 0 (0.0%) |
| $65,000 to $74,999 | 0 (0.0%) | 0 (0.0%) |
| $75,000 to $99,999 | 0 (0.0%) | 0 (0.0%) |
| $100,000+ | 0 (0.0%) | 0 (0.0%) |
| Total | 12 (100.0%) | 13 (100.0%) |
Earnings by Sex by Educational Attainment in Albany
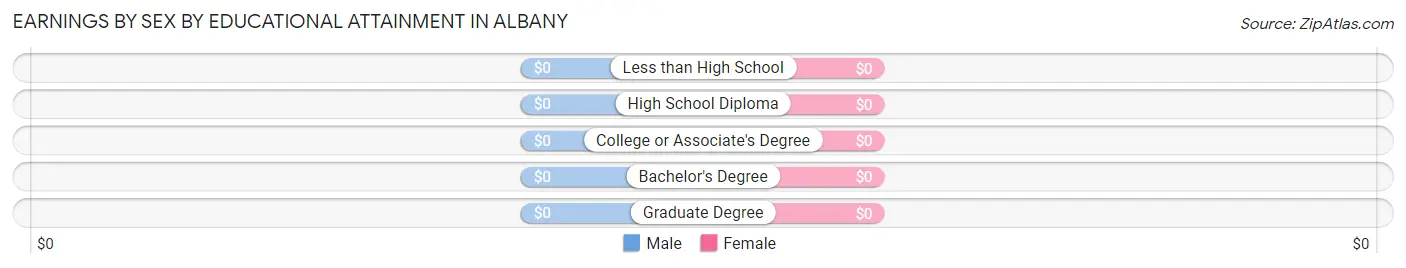
| Educational Attainment | Male Income | Female Income |
| Less than High School | - | - |
| High School Diploma | - | - |
| College or Associate's Degree | - | - |
| Bachelor's Degree | - | - |
| Graduate Degree | - | - |
| Total | - | - |
Family Income in Albany
Family Income Brackets in Albany
According to the Albany family income data, there are 12 families falling into the $15,000 to $24,999 income range, which is the most common income bracket and makes up 34.3% of all families.
| Income Bracket | # Families | % Families |
| Less than $10,000 | 0 | 0.0% |
| $10,000 to $14,999 | 0 | 0.0% |
| $15,000 to $24,999 | 12 | 34.3% |
| $25,000 to $34,999 | 0 | 0.0% |
| $35,000 to $49,999 | 6 | 17.1% |
| $50,000 to $74,999 | 12 | 34.3% |
| $75,000 to $99,999 | 0 | 0.0% |
| $100,000 to $149,999 | 5 | 14.3% |
| $150,000 to $199,999 | 0 | 0.0% |
| $200,000+ | 0 | 0.0% |
Family Income by Famaliy Size in Albany
| Income Bracket | # Families | Median Income |
| 2-Person Families | 23 (65.7%) | $0 |
| 3-Person Families | 6 (17.1%) | $0 |
| 4-Person Families | 0 (0.0%) | $0 |
| 5-Person Families | 0 (0.0%) | $0 |
| 6-Person Families | 6 (17.1%) | $0 |
| 7+ Person Families | 0 (0.0%) | $0 |
| Total | 35 (100.0%) | $47,292 |
Family Income by Number of Earners in Albany
| Number of Earners | # Families | Median Income |
| No Earners | 23 (65.7%) | $0 |
| 1 Earner | 6 (17.1%) | $0 |
| 2 Earners | 6 (17.1%) | $0 |
| 3+ Earners | 0 (0.0%) | $0 |
| Total | 35 (100.0%) | $47,292 |
Household Income in Albany
Household Income Brackets in Albany
With 12 households falling in the category, the $15,000 to $24,999 income range is the most frequent in Albany, accounting for 27.3% of all households.
| Income Bracket | # Households | % Households |
| Less than $10,000 | 0 | 0.0% |
| $10,000 to $14,999 | 0 | 0.0% |
| $15,000 to $24,999 | 12 | 27.3% |
| $25,000 to $34,999 | 3 | 6.8% |
| $35,000 to $49,999 | 12 | 27.3% |
| $50,000 to $74,999 | 12 | 27.3% |
| $75,000 to $99,999 | 0 | 0.0% |
| $100,000 to $149,999 | 5 | 11.4% |
| $150,000 to $199,999 | 0 | 0.0% |
| $200,000+ | 0 | 0.0% |
Household Income by Householder Age in Albany
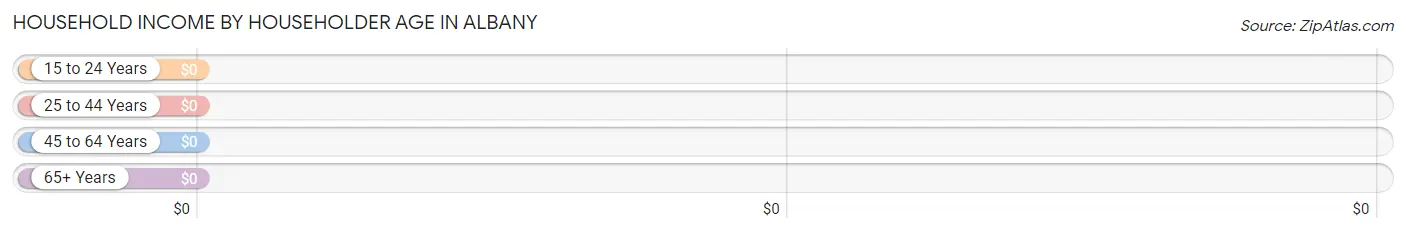
| Income Bracket | # Households | Median Income |
| 15 to 24 Years | 0 (0.0%) | $0 |
| 25 to 44 Years | 12 (27.3%) | $0 |
| 45 to 64 Years | 23 (52.3%) | $0 |
| 65+ Years | 9 (20.4%) | $0 |
| Total | 44 (100.0%) | $45,417 |
Poverty in Albany
Income Below Poverty by Sex and Age in Albany
| Age Bracket | Male | Female |
| Under 5 Years | 0 (0.0%) | 0 (0.0%) |
| 5 Years | 0 (0.0%) | 0 (0.0%) |
| 6 to 11 Years | 0 (0.0%) | 0 (0.0%) |
| 12 to 14 Years | 0 (0.0%) | 0 (0.0%) |
| 15 Years | 0 (0.0%) | 0 (0.0%) |
| 16 and 17 Years | 0 (0.0%) | 0 (0.0%) |
| 18 to 24 Years | 0 (0.0%) | 0 (0.0%) |
| 25 to 34 Years | 0 (0.0%) | 0 (0.0%) |
| 35 to 44 Years | 0 (0.0%) | 0 (0.0%) |
| 45 to 54 Years | 0 (0.0%) | 0 (0.0%) |
| 55 to 64 Years | 0 (0.0%) | 0 (0.0%) |
| 65 to 74 Years | 0 (0.0%) | 0 (0.0%) |
| 75 Years and over | 0 (0.0%) | 0 (0.0%) |
| Total | 0 (0.0%) | 0 (0.0%) |
Income Above Poverty by Sex and Age in Albany
According to the poverty statistics in Albany, males aged under 5 years and females aged 12 to 14 years are the age groups that are most secure financially, with 100.0% of males and 100.0% of females in these age groups living above the poverty line.
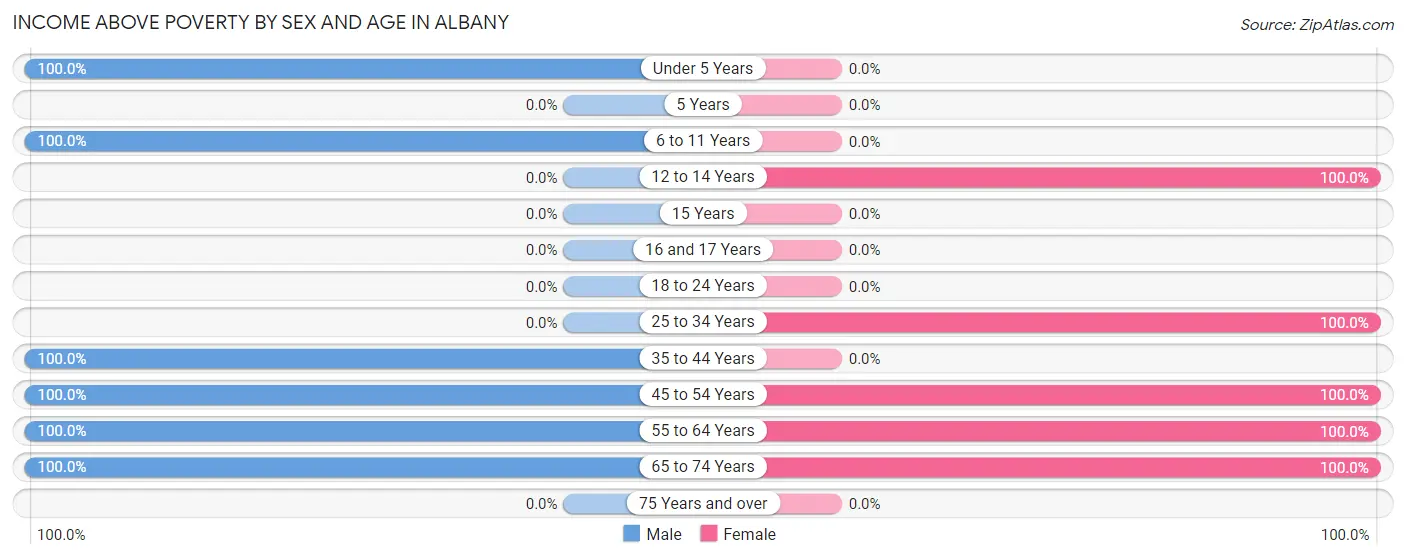
| Age Bracket | Male | Female |
| Under 5 Years | 5 (100.0%) | 0 (0.0%) |
| 5 Years | 0 (0.0%) | 0 (0.0%) |
| 6 to 11 Years | 18 (100.0%) | 0 (0.0%) |
| 12 to 14 Years | 0 (0.0%) | 4 (100.0%) |
| 15 Years | 0 (0.0%) | 0 (0.0%) |
| 16 and 17 Years | 0 (0.0%) | 0 (0.0%) |
| 18 to 24 Years | 0 (0.0%) | 0 (0.0%) |
| 25 to 34 Years | 0 (0.0%) | 19 (100.0%) |
| 35 to 44 Years | 12 (100.0%) | 0 (0.0%) |
| 45 to 54 Years | 7 (100.0%) | 6 (100.0%) |
| 55 to 64 Years | 5 (100.0%) | 16 (100.0%) |
| 65 to 74 Years | 15 (100.0%) | 7 (100.0%) |
| 75 Years and over | 0 (0.0%) | 0 (0.0%) |
| Total | 62 (100.0%) | 52 (100.0%) |
Income Below Poverty Among Married-Couple Families in Albany
| Children | Above Poverty | Below Poverty |
| No Children | 18 (100.0%) | 0 (0.0%) |
| 1 or 2 Children | 0 (0.0%) | 0 (0.0%) |
| 3 or 4 Children | 6 (100.0%) | 0 (0.0%) |
| 5 or more Children | 0 (0.0%) | 0 (0.0%) |
| Total | 24 (100.0%) | 0 (0.0%) |
Income Below Poverty Among Single-Parent Households in Albany
| Children | Single Father | Single Mother |
| No Children | 0 (0.0%) | 0 (0.0%) |
| 1 or 2 Children | 0 (0.0%) | 0 (0.0%) |
| 3 or 4 Children | 0 (0.0%) | 0 (0.0%) |
| 5 or more Children | 0 (0.0%) | 0 (0.0%) |
| Total | 0 (0.0%) | 0 (0.0%) |
Income Below Poverty Among Married-Couple vs Single-Parent Households in Albany
| Children | Married-Couple Families | Single-Parent Households |
| No Children | 0 (0.0%) | 0 (0.0%) |
| 1 or 2 Children | 0 (0.0%) | 0 (0.0%) |
| 3 or 4 Children | 0 (0.0%) | 0 (0.0%) |
| 5 or more Children | 0 (0.0%) | 0 (0.0%) |
| Total | 0 (0.0%) | 0 (0.0%) |
Race in Albany
The most populous races in Albany are White / Caucasian (87 | 76.3%), Native / Alaskan (24 | 21.0%), and Hispanic or Latino (6 | 5.3%).
| Race | # Population | % Population |
| Asian | 0 | 0.0% |
| Black / African American | 0 | 0.0% |
| Hawaiian / Pacific | 0 | 0.0% |
| Hispanic or Latino | 6 | 5.3% |
| Native / Alaskan | 24 | 21.0% |
| White / Caucasian | 87 | 76.3% |
| Two or more Races | 3 | 2.6% |
| Some other Race | 0 | 0.0% |
| Total | 114 | 100.0% |
Ancestry in Albany
The most populous ancestries reported in Albany are American (82 | 71.9%), Chickasaw (24 | 21.0%), German (13 | 11.4%), Mexican (6 | 5.3%), and Choctaw (3 | 2.6%), together accounting for 112.3% of all Albany residents.
| Ancestry | # Population | % Population |
| American | 82 | 71.9% |
| Chickasaw | 24 | 21.0% |
| Choctaw | 3 | 2.6% |
| German | 13 | 11.4% |
| Mexican | 6 | 5.3% | View All 5 Rows |
Immigrants in Albany

| Immigration Origin | # Population | % Population | View All 0 Rows |
Sex and Age in Albany
Sex and Age in Albany
The most populous age groups in Albany are 5 to 9 Years (14 | 22.6%) for men and 25 to 29 Years (19 | 36.5%) for women.
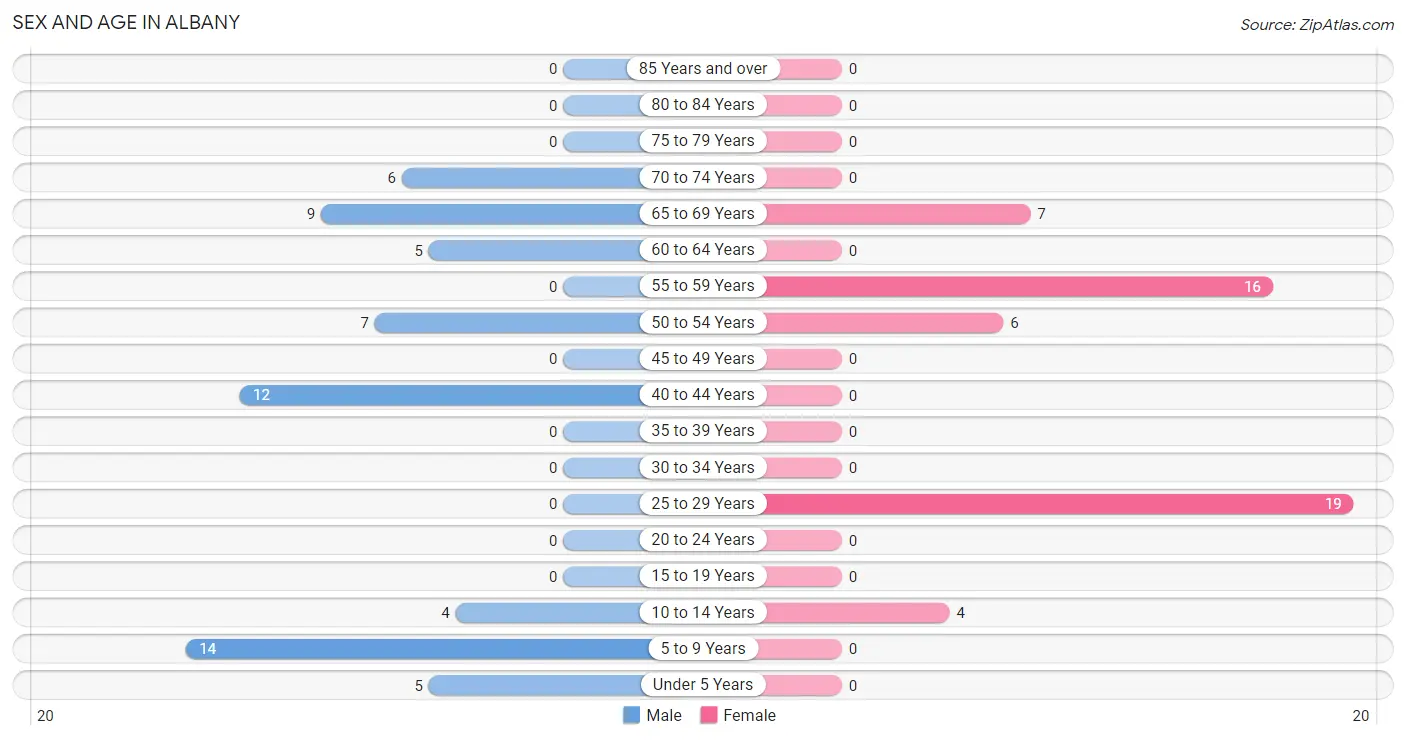
| Age Bracket | Male | Female |
| Under 5 Years | 5 (8.1%) | 0 (0.0%) |
| 5 to 9 Years | 14 (22.6%) | 0 (0.0%) |
| 10 to 14 Years | 4 (6.5%) | 4 (7.7%) |
| 15 to 19 Years | 0 (0.0%) | 0 (0.0%) |
| 20 to 24 Years | 0 (0.0%) | 0 (0.0%) |
| 25 to 29 Years | 0 (0.0%) | 19 (36.5%) |
| 30 to 34 Years | 0 (0.0%) | 0 (0.0%) |
| 35 to 39 Years | 0 (0.0%) | 0 (0.0%) |
| 40 to 44 Years | 12 (19.4%) | 0 (0.0%) |
| 45 to 49 Years | 0 (0.0%) | 0 (0.0%) |
| 50 to 54 Years | 7 (11.3%) | 6 (11.5%) |
| 55 to 59 Years | 0 (0.0%) | 16 (30.8%) |
| 60 to 64 Years | 5 (8.1%) | 0 (0.0%) |
| 65 to 69 Years | 9 (14.5%) | 7 (13.5%) |
| 70 to 74 Years | 6 (9.7%) | 0 (0.0%) |
| 75 to 79 Years | 0 (0.0%) | 0 (0.0%) |
| 80 to 84 Years | 0 (0.0%) | 0 (0.0%) |
| 85 Years and over | 0 (0.0%) | 0 (0.0%) |
| Total | 62 (100.0%) | 52 (100.0%) |
Families and Households in Albany
Median Family Size in Albany
The median family size in Albany is 3.00 persons per family, with single female/mother families (6 | 17.1%) accounting for the largest median family size of 4.5 persons per family. On the other hand, single male/father families (5 | 14.3%) represent the smallest median family size with 2.40 persons per family.
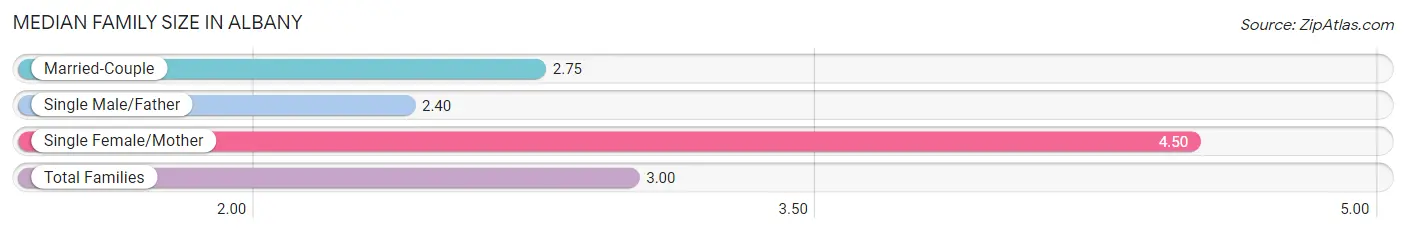
| Family Type | # Families | Family Size |
| Married-Couple | 24 (68.6%) | 2.75 |
| Single Male/Father | 5 (14.3%) | 2.40 |
| Single Female/Mother | 6 (17.1%) | 4.50 |
| Total Families | 35 (100.0%) | 3.00 |
Median Household Size in Albany
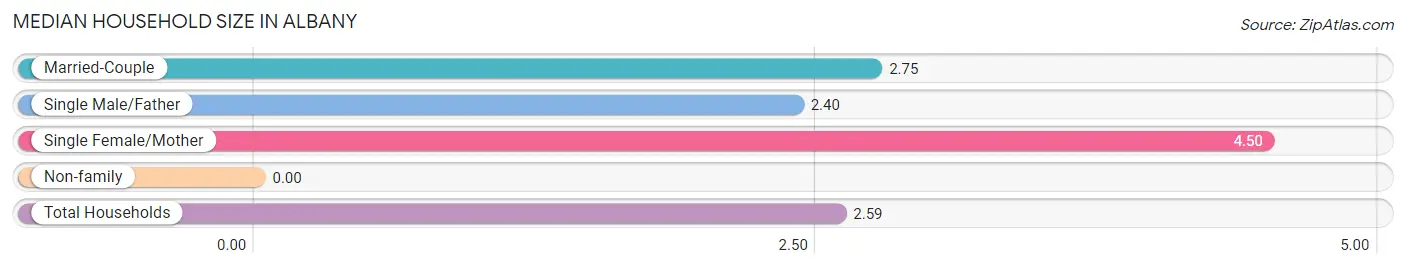
| Household Type | # Households | Household Size |
| Married-Couple | 24 (54.5%) | 2.75 |
| Single Male/Father | 5 (11.4%) | 2.40 |
| Single Female/Mother | 6 (13.6%) | 4.50 |
| Non-family | 9 (20.4%) | - |
| Total Households | 44 (100.0%) | 2.59 |
Household Size by Marriage Status in Albany
Out of a total of 44 households in Albany, 35 (79.5%) are family households, while 9 (20.4%) are nonfamily households. The most numerous type of family households are 2-person households, comprising 23, and the most common type of nonfamily households are 1-person households, comprising 9.
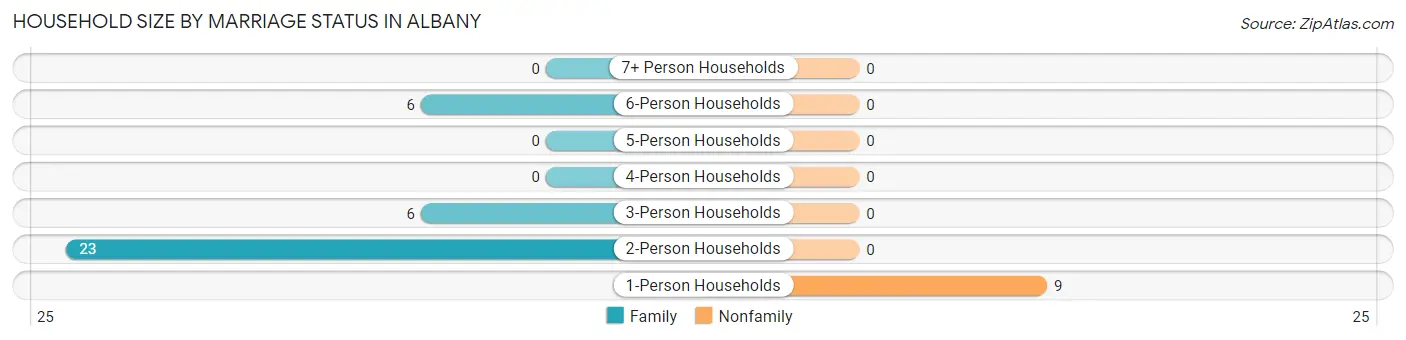
| Household Size | Family Households | Nonfamily Households |
| 1-Person Households | - | 9 (20.4%) |
| 2-Person Households | 23 (52.3%) | 0 (0.0%) |
| 3-Person Households | 6 (13.6%) | 0 (0.0%) |
| 4-Person Households | 0 (0.0%) | 0 (0.0%) |
| 5-Person Households | 0 (0.0%) | 0 (0.0%) |
| 6-Person Households | 6 (13.6%) | 0 (0.0%) |
| 7+ Person Households | 0 (0.0%) | 0 (0.0%) |
| Total | 35 (79.5%) | 9 (20.4%) |
Female Fertility in Albany
Fertility by Age in Albany
| Age Bracket | Women with Births | Births / 1,000 Women |
| 15 to 19 years | 0 (0.0%) | 0.0 |
| 20 to 34 years | 0 (0.0%) | 0.0 |
| 35 to 50 years | 0 (0.0%) | 0.0 |
| Total | 0 (0.0%) | 0.0 |
Fertility by Age by Marriage Status in Albany
| Age Bracket | Married | Unmarried |
| 15 to 19 years | 0 (0.0%) | 0 (0.0%) |
| 20 to 34 years | 0 (0.0%) | 0 (0.0%) |
| 35 to 50 years | 0 (0.0%) | 0 (0.0%) |
| Total | 0 (0.0%) | 0 (0.0%) |
Fertility by Education in Albany
| Educational Attainment | Women with Births | Births / 1,000 Women |
| Less than High School | 0 (0.0%) | 0.0 |
| High School Diploma | 0 (0.0%) | 0.0 |
| College or Associate's Degree | 0 (0.0%) | 0.0 |
| Bachelor's Degree | 0 (0.0%) | 0.0 |
| Graduate Degree | 0 (0.0%) | 0.0 |
| Total | 0 (0.0%) | 0.0 |
Fertility by Education by Marriage Status in Albany
| Educational Attainment | Married | Unmarried |
| Less than High School | 0 (0.0%) | 0 (0.0%) |
| High School Diploma | 0 (0.0%) | 0 (0.0%) |
| College or Associate's Degree | 0 (0.0%) | 0 (0.0%) |
| Bachelor's Degree | 0 (0.0%) | 0 (0.0%) |
| Graduate Degree | 0 (0.0%) | 0 (0.0%) |
| Total | 0 (0.0%) | 0 (0.0%) |
Employment Characteristics in Albany
Employment by Class of Employer in Albany
Among the 25 employed individuals in Albany, private company employees (19 | 76.0%), and state government employees (6 | 24.0%) make up the most common classes of employment.
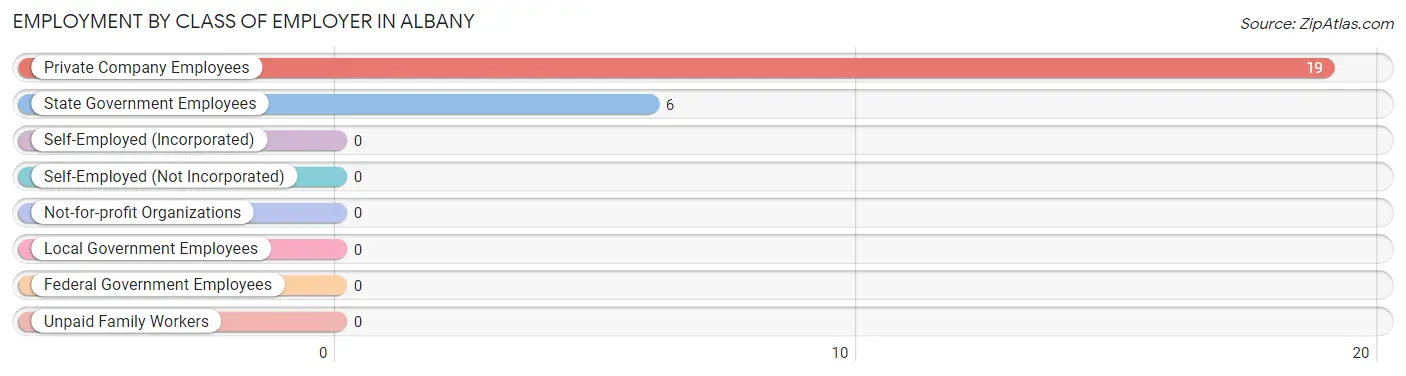
| Employer Class | # Employees | % Employees |
| Private Company Employees | 19 | 76.0% |
| Self-Employed (Incorporated) | 0 | 0.0% |
| Self-Employed (Not Incorporated) | 0 | 0.0% |
| Not-for-profit Organizations | 0 | 0.0% |
| Local Government Employees | 0 | 0.0% |
| State Government Employees | 6 | 24.0% |
| Federal Government Employees | 0 | 0.0% |
| Unpaid Family Workers | 0 | 0.0% |
| Total | 25 | 100.0% |
Employment Status by Age in Albany
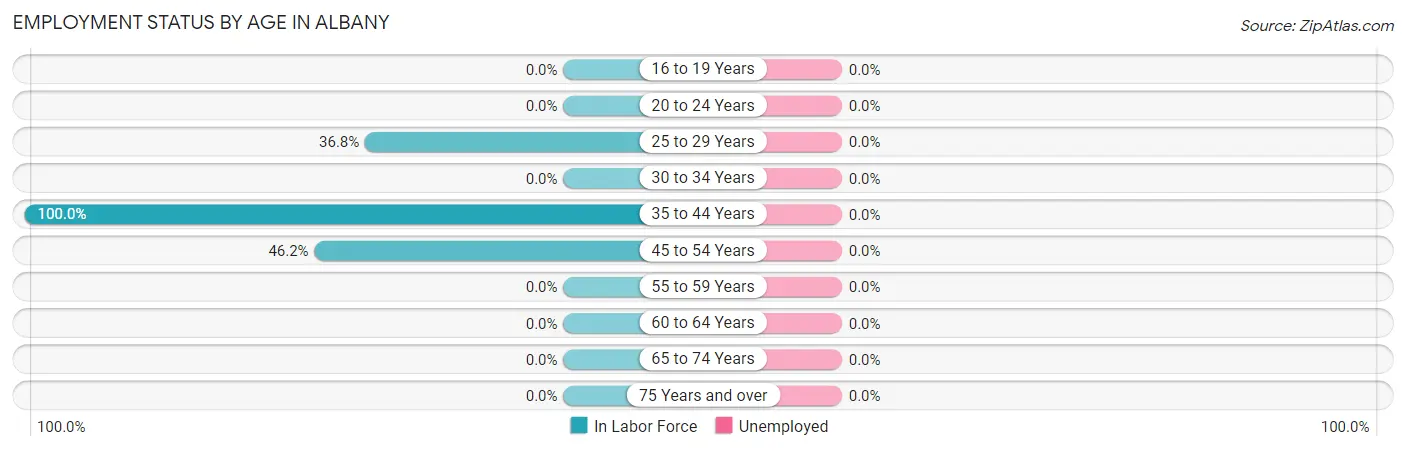
| Age Bracket | In Labor Force | Unemployed |
| 16 to 19 Years | 0 (0.0%) | 0 (0.0%) |
| 20 to 24 Years | 0 (0.0%) | 0 (0.0%) |
| 25 to 29 Years | 7 (36.8%) | 0 (0.0%) |
| 30 to 34 Years | 0 (0.0%) | 0 (0.0%) |
| 35 to 44 Years | 12 (100.0%) | 0 (0.0%) |
| 45 to 54 Years | 6 (46.2%) | 0 (0.0%) |
| 55 to 59 Years | 0 (0.0%) | 0 (0.0%) |
| 60 to 64 Years | 0 (0.0%) | 0 (0.0%) |
| 65 to 74 Years | 0 (0.0%) | 0 (0.0%) |
| 75 Years and over | 0 (0.0%) | 0 (0.0%) |
| Total | 25 (28.7%) | 0 (0.0%) |
Employment Status by Educational Attainment in Albany
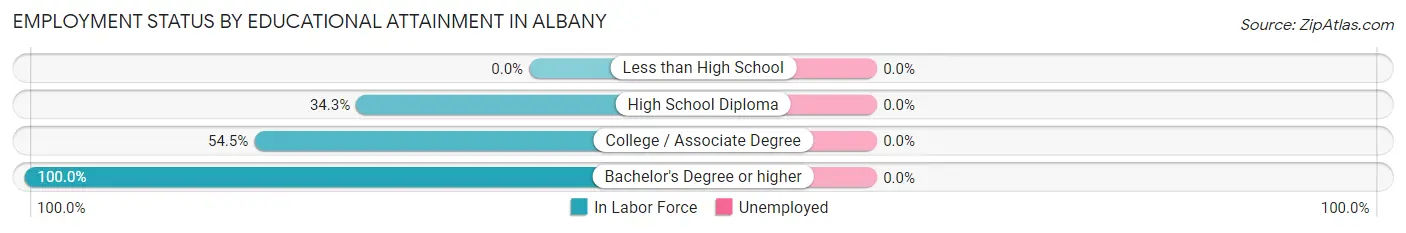
| Educational Attainment | In Labor Force | Unemployed |
| Less than High School | 0 (0.0%) | 0 (0.0%) |
| High School Diploma | 12 (34.3%) | 0 (0.0%) |
| College / Associate Degree | 6 (54.5%) | 0 (0.0%) |
| Bachelor's Degree or higher | 7 (100.0%) | 0 (0.0%) |
| Total | 25 (38.5%) | 0 (0.0%) |
Employment Occupations by Sex in Albany
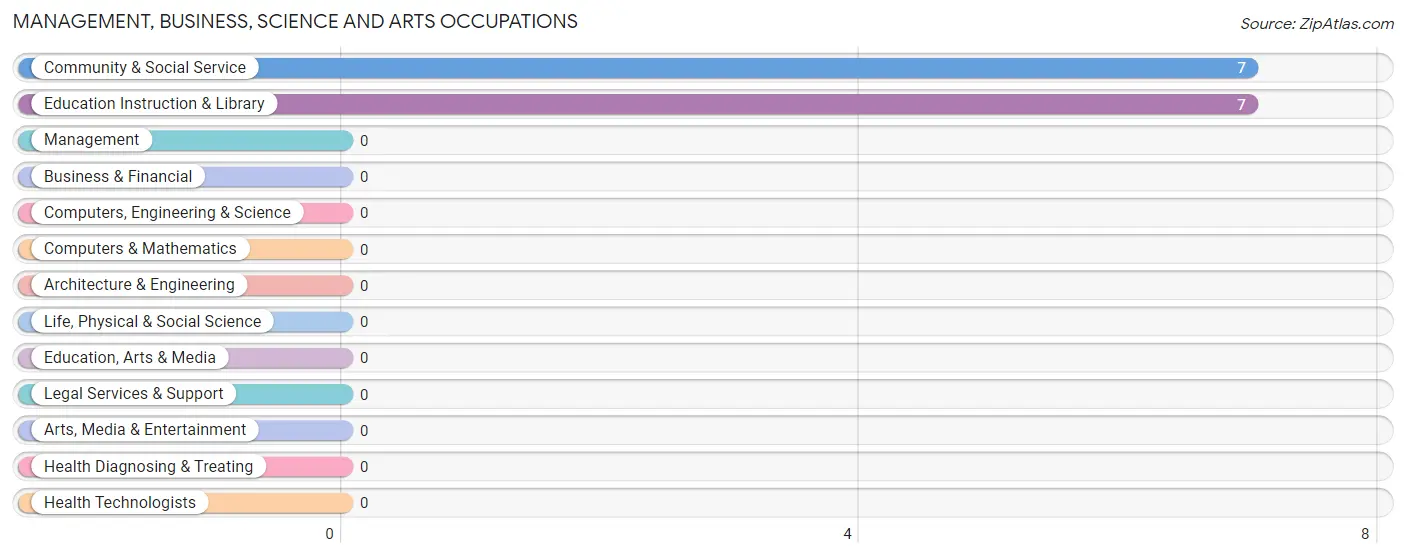
Management, Business, Science and Arts Occupations
The most common Management, Business, Science and Arts occupations in Albany are Community & Social Service (7 | 28.0%), and Education Instruction & Library (7 | 28.0%).
Management, Business, Science and Arts Occupations by Sex
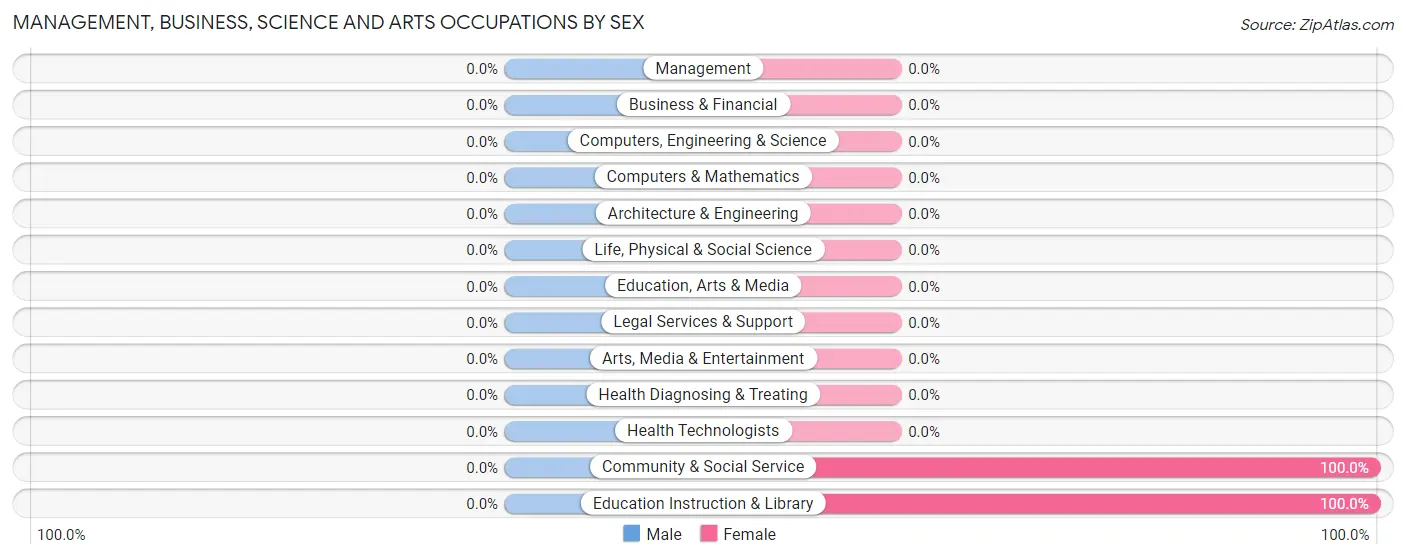
| Occupation | Male | Female |
| Management | 0 (0.0%) | 0 (0.0%) |
| Business & Financial | 0 (0.0%) | 0 (0.0%) |
| Computers, Engineering & Science | 0 (0.0%) | 0 (0.0%) |
| Computers & Mathematics | 0 (0.0%) | 0 (0.0%) |
| Architecture & Engineering | 0 (0.0%) | 0 (0.0%) |
| Life, Physical & Social Science | 0 (0.0%) | 0 (0.0%) |
| Community & Social Service | 0 (0.0%) | 7 (100.0%) |
| Education, Arts & Media | 0 (0.0%) | 0 (0.0%) |
| Legal Services & Support | 0 (0.0%) | 0 (0.0%) |
| Education Instruction & Library | 0 (0.0%) | 7 (100.0%) |
| Arts, Media & Entertainment | 0 (0.0%) | 0 (0.0%) |
| Health Diagnosing & Treating | 0 (0.0%) | 0 (0.0%) |
| Health Technologists | 0 (0.0%) | 0 (0.0%) |
| Total (Category) | 0 (0.0%) | 7 (100.0%) |
| Total (Overall) | 12 (48.0%) | 13 (52.0%) |
Services Occupations
The most common Services occupations in Albany are , and Cleaning & Maintenance (6 | 24.0%).
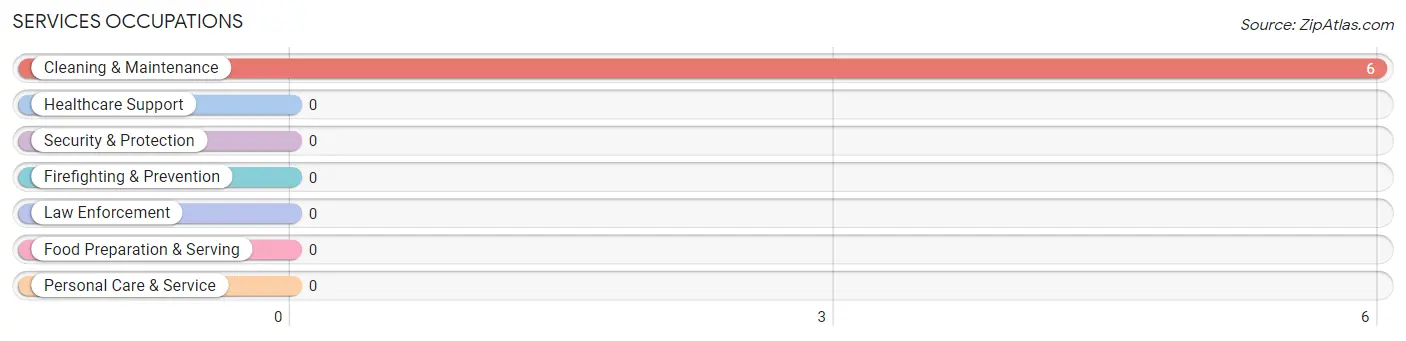
Services Occupations by Sex
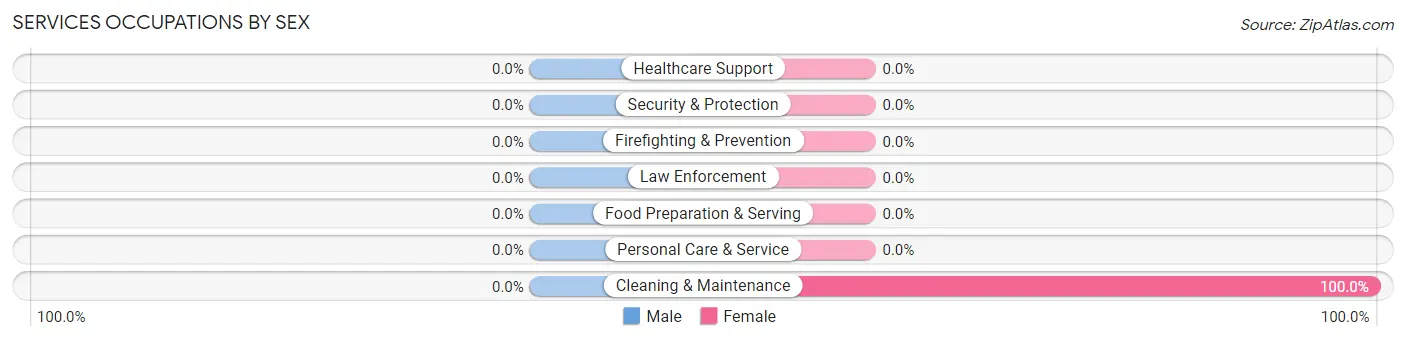
| Occupation | Male | Female |
| Healthcare Support | 0 (0.0%) | 0 (0.0%) |
| Security & Protection | 0 (0.0%) | 0 (0.0%) |
| Firefighting & Prevention | 0 (0.0%) | 0 (0.0%) |
| Law Enforcement | 0 (0.0%) | 0 (0.0%) |
| Food Preparation & Serving | 0 (0.0%) | 0 (0.0%) |
| Cleaning & Maintenance | 0 (0.0%) | 6 (100.0%) |
| Personal Care & Service | 0 (0.0%) | 0 (0.0%) |
| Total (Category) | 0 (0.0%) | 6 (100.0%) |
| Total (Overall) | 12 (48.0%) | 13 (52.0%) |
Sales and Office Occupations
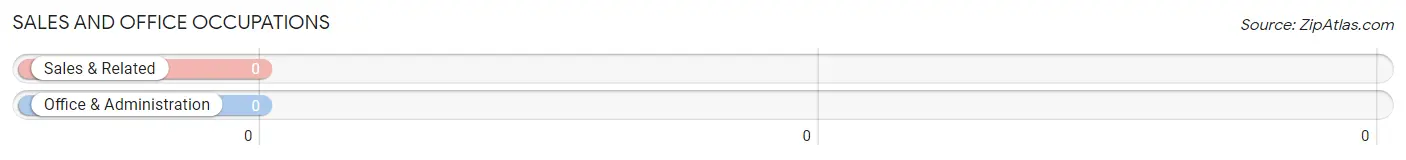
Sales and Office Occupations by Sex
| Occupation | Male | Female |
| Sales & Related | 0 (0.0%) | 0 (0.0%) |
| Office & Administration | 0 (0.0%) | 0 (0.0%) |
| Total (Category) | 0 (0.0%) | 0 (0.0%) |
| Total (Overall) | 12 (48.0%) | 13 (52.0%) |
Natural Resources, Construction and Maintenance Occupations
Natural Resources, Construction and Maintenance Occupations by Sex
| Occupation | Male | Female |
| Farming, Fishing & Forestry | 0 (0.0%) | 0 (0.0%) |
| Construction & Extraction | 0 (0.0%) | 0 (0.0%) |
| Installation, Maintenance & Repair | 0 (0.0%) | 0 (0.0%) |
| Total (Category) | 0 (0.0%) | 0 (0.0%) |
| Total (Overall) | 12 (48.0%) | 13 (52.0%) |
Production, Transportation and Moving Occupations
The most common Production, Transportation and Moving occupations in Albany are Production (6 | 24.0%), and Transportation (6 | 24.0%).
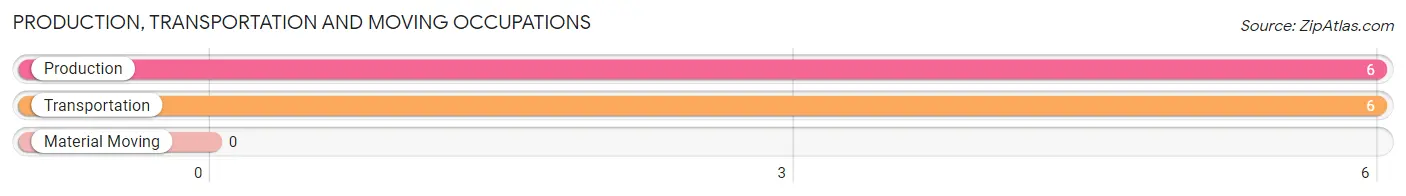
Production, Transportation and Moving Occupations by Sex
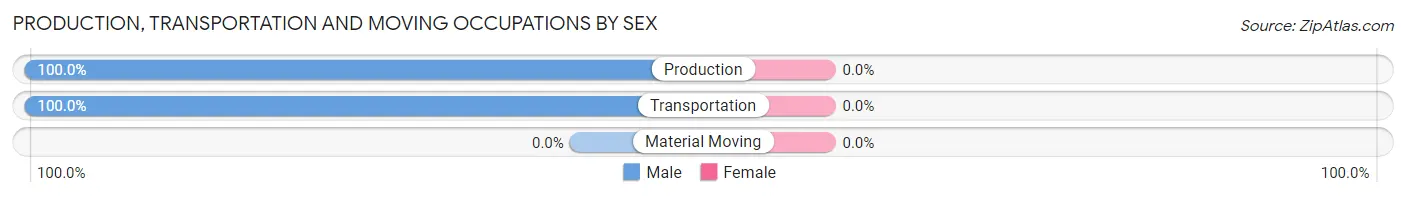
| Occupation | Male | Female |
| Production | 6 (100.0%) | 0 (0.0%) |
| Transportation | 6 (100.0%) | 0 (0.0%) |
| Material Moving | 0 (0.0%) | 0 (0.0%) |
| Total (Category) | 12 (100.0%) | 0 (0.0%) |
| Total (Overall) | 12 (48.0%) | 13 (52.0%) |
Employment Industries by Sex in Albany
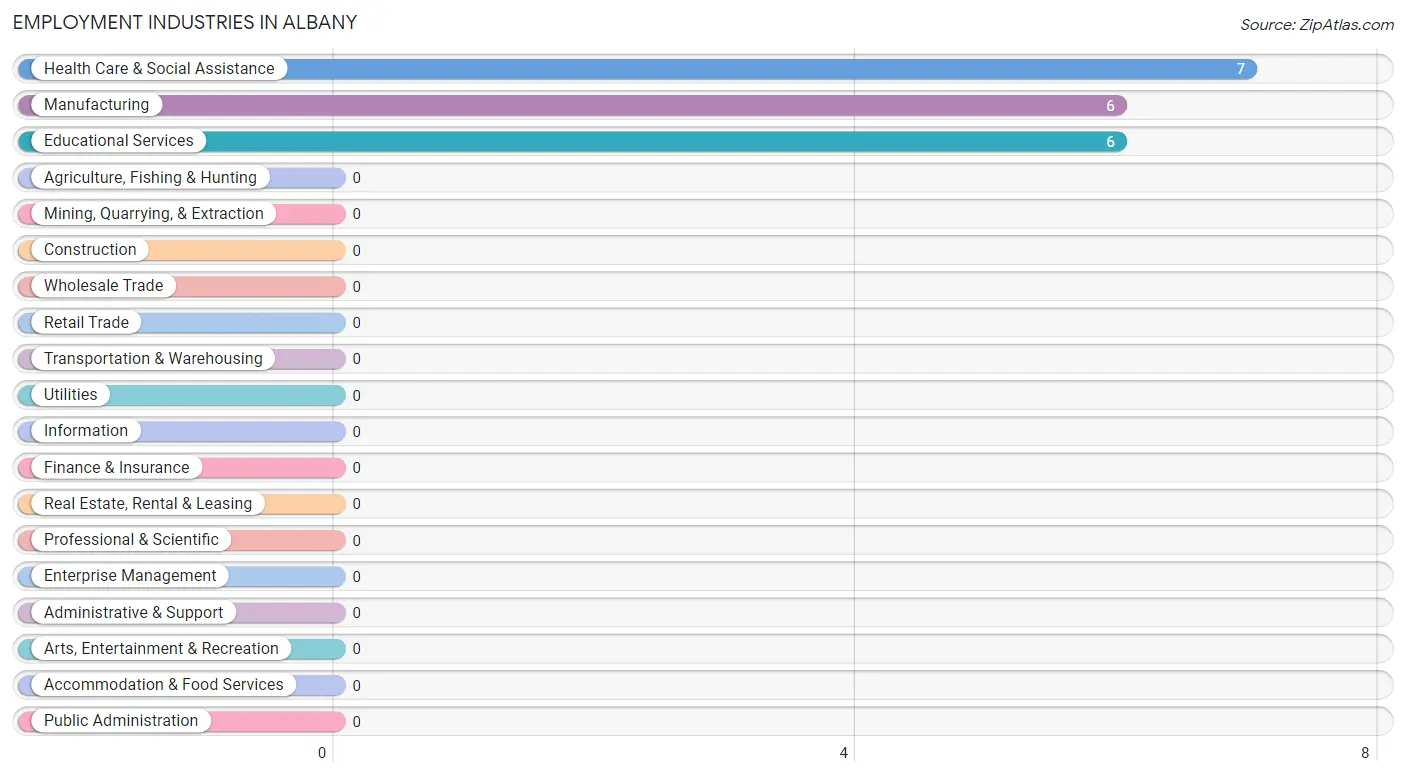
Employment Industries in Albany
The major employment industries in Albany include Health Care & Social Assistance (7 | 28.0%), Manufacturing (6 | 24.0%), and Educational Services (6 | 24.0%).
Employment Industries by Sex in Albany
| Industry | Male | Female |
| Agriculture, Fishing & Hunting | 0 (0.0%) | 0 (0.0%) |
| Mining, Quarrying, & Extraction | 0 (0.0%) | 0 (0.0%) |
| Construction | 0 (0.0%) | 0 (0.0%) |
| Manufacturing | 6 (100.0%) | 0 (0.0%) |
| Wholesale Trade | 0 (0.0%) | 0 (0.0%) |
| Retail Trade | 0 (0.0%) | 0 (0.0%) |
| Transportation & Warehousing | 0 (0.0%) | 0 (0.0%) |
| Utilities | 0 (0.0%) | 0 (0.0%) |
| Information | 0 (0.0%) | 0 (0.0%) |
| Finance & Insurance | 0 (0.0%) | 0 (0.0%) |
| Real Estate, Rental & Leasing | 0 (0.0%) | 0 (0.0%) |
| Professional & Scientific | 0 (0.0%) | 0 (0.0%) |
| Enterprise Management | 0 (0.0%) | 0 (0.0%) |
| Administrative & Support | 0 (0.0%) | 0 (0.0%) |
| Educational Services | 0 (0.0%) | 6 (100.0%) |
| Health Care & Social Assistance | 0 (0.0%) | 7 (100.0%) |
| Arts, Entertainment & Recreation | 0 (0.0%) | 0 (0.0%) |
| Accommodation & Food Services | 0 (0.0%) | 0 (0.0%) |
| Public Administration | 0 (0.0%) | 0 (0.0%) |
| Total | 12 (48.0%) | 13 (52.0%) |
Education in Albany
School Enrollment in Albany
The most common levels of schooling among the 22 students in Albany are elementary school (14 | 63.6%), and middle school (8 | 36.4%).
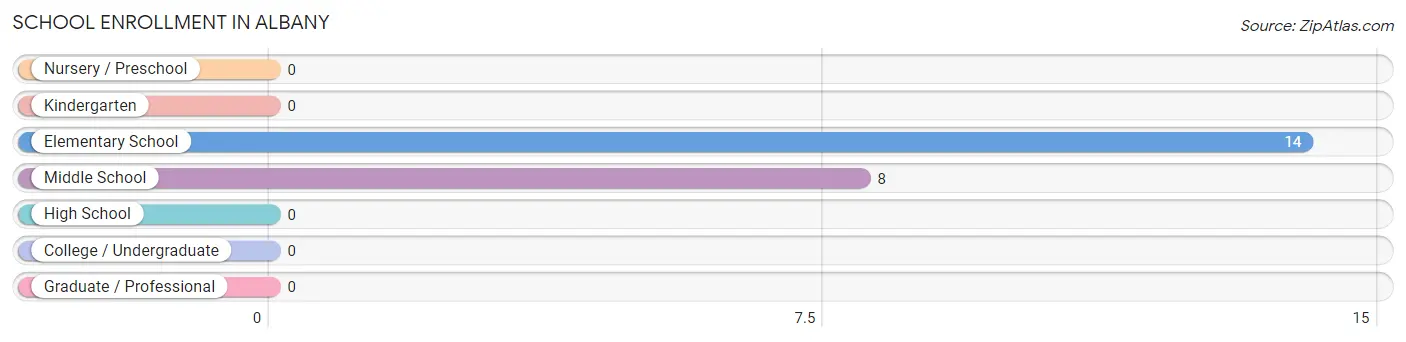
| School Level | # Students | % Students |
| Nursery / Preschool | 0 | 0.0% |
| Kindergarten | 0 | 0.0% |
| Elementary School | 14 | 63.6% |
| Middle School | 8 | 36.4% |
| High School | 0 | 0.0% |
| College / Undergraduate | 0 | 0.0% |
| Graduate / Professional | 0 | 0.0% |
| Total | 22 | 100.0% |
School Enrollment by Age by Funding Source in Albany
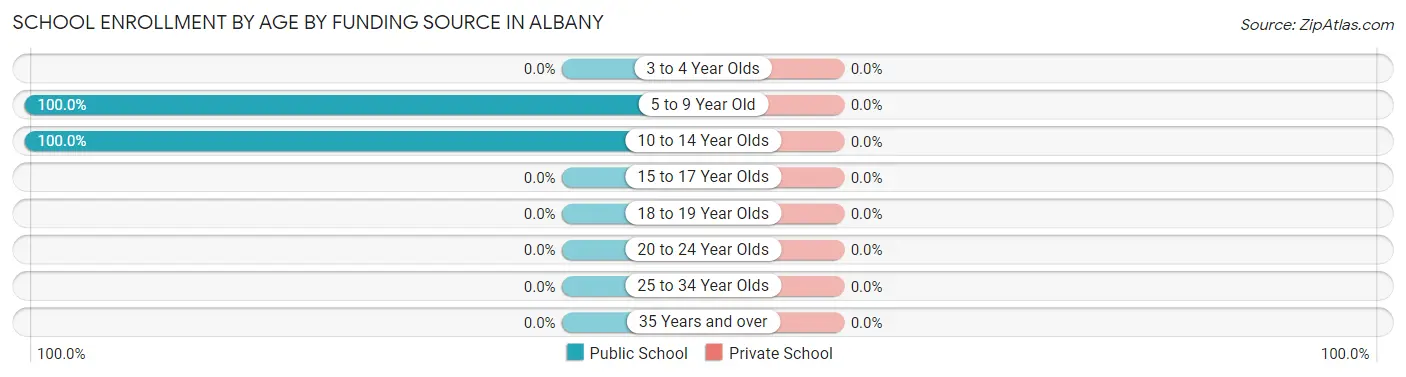
| Age Bracket | Public School | Private School |
| 3 to 4 Year Olds | 0 (0.0%) | 0 (0.0%) |
| 5 to 9 Year Old | 14 (100.0%) | 0 (0.0%) |
| 10 to 14 Year Olds | 8 (100.0%) | 0 (0.0%) |
| 15 to 17 Year Olds | 0 (0.0%) | 0 (0.0%) |
| 18 to 19 Year Olds | 0 (0.0%) | 0 (0.0%) |
| 20 to 24 Year Olds | 0 (0.0%) | 0 (0.0%) |
| 25 to 34 Year Olds | 0 (0.0%) | 0 (0.0%) |
| 35 Years and over | 0 (0.0%) | 0 (0.0%) |
| Total | 22 (100.0%) | 0 (0.0%) |
Educational Attainment by Field of Study in Albany
, and arts & humanities (7 | 100.0%) are the most common fields of study among 7 individuals in Albany who have obtained a bachelor's degree or higher.
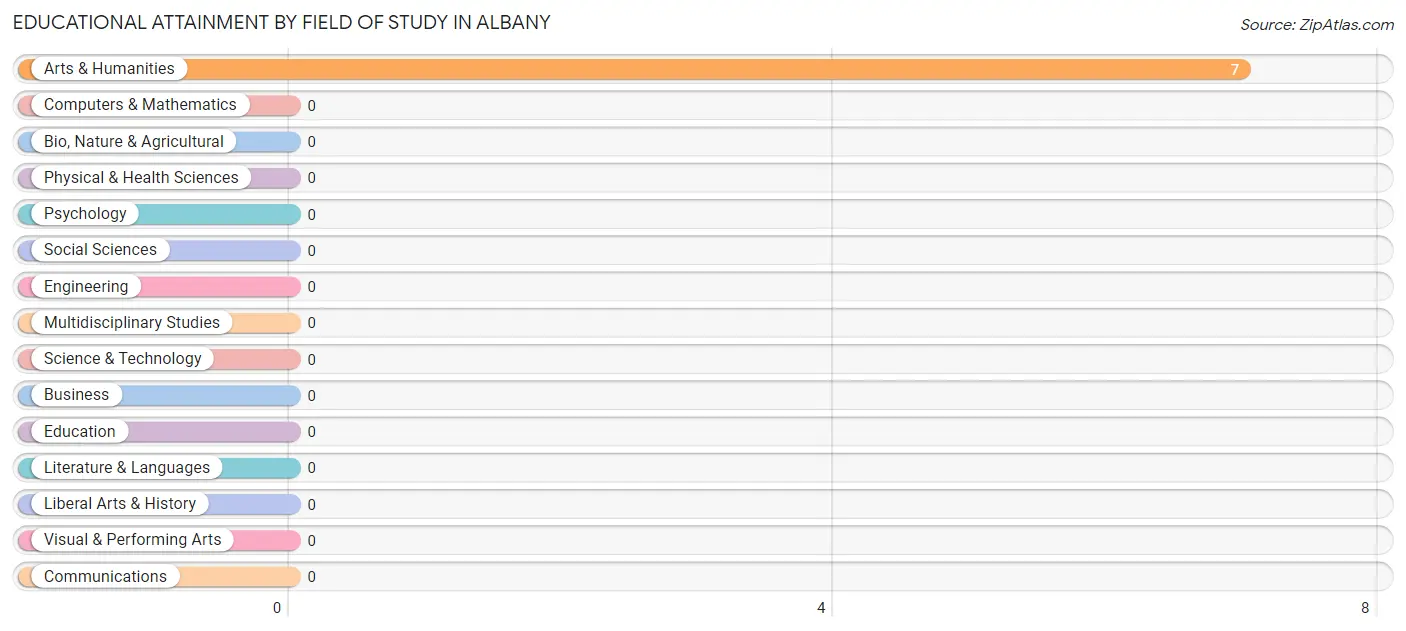
| Field of Study | # Graduates | % Graduates |
| Computers & Mathematics | 0 | 0.0% |
| Bio, Nature & Agricultural | 0 | 0.0% |
| Physical & Health Sciences | 0 | 0.0% |
| Psychology | 0 | 0.0% |
| Social Sciences | 0 | 0.0% |
| Engineering | 0 | 0.0% |
| Multidisciplinary Studies | 0 | 0.0% |
| Science & Technology | 0 | 0.0% |
| Business | 0 | 0.0% |
| Education | 0 | 0.0% |
| Literature & Languages | 0 | 0.0% |
| Liberal Arts & History | 0 | 0.0% |
| Visual & Performing Arts | 0 | 0.0% |
| Communications | 0 | 0.0% |
| Arts & Humanities | 7 | 100.0% |
| Total | 7 | 100.0% |
Transportation & Commute in Albany
Vehicle Availability by Sex in Albany
The most prevalent vehicle ownership categories in Albany are males with 1 vehicle (6, accounting for 50.0%) and females with 1 vehicle (6, making up 46.2%).
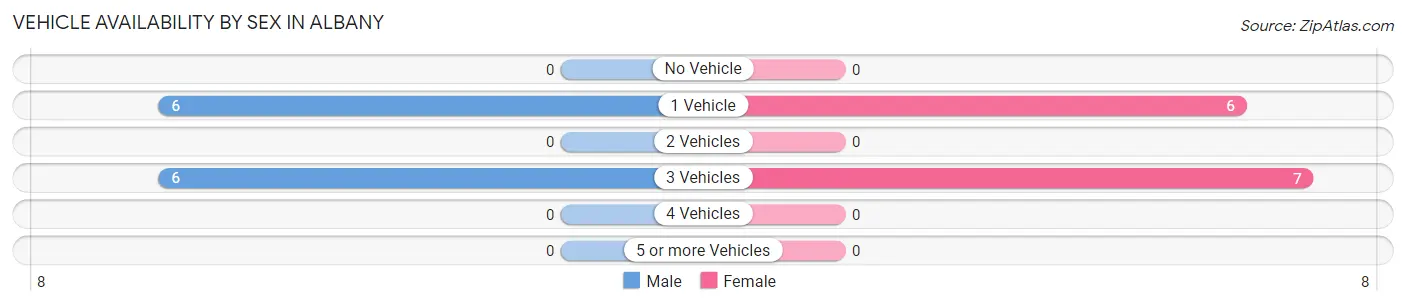
| Vehicles Available | Male | Female |
| No Vehicle | 0 (0.0%) | 0 (0.0%) |
| 1 Vehicle | 6 (50.0%) | 6 (46.2%) |
| 2 Vehicles | 0 (0.0%) | 0 (0.0%) |
| 3 Vehicles | 6 (50.0%) | 7 (53.8%) |
| 4 Vehicles | 0 (0.0%) | 0 (0.0%) |
| 5 or more Vehicles | 0 (0.0%) | 0 (0.0%) |
| Total | 12 (100.0%) | 13 (100.0%) |
Commute Time in Albany
The most frequently occuring commute durations in Albany are 30 to 34 minutes (13 commuters, 52.0%), 25 to 29 minutes (12 commuters, 48.0%), and less than 5 minutes (0 commuters, 0.0%).
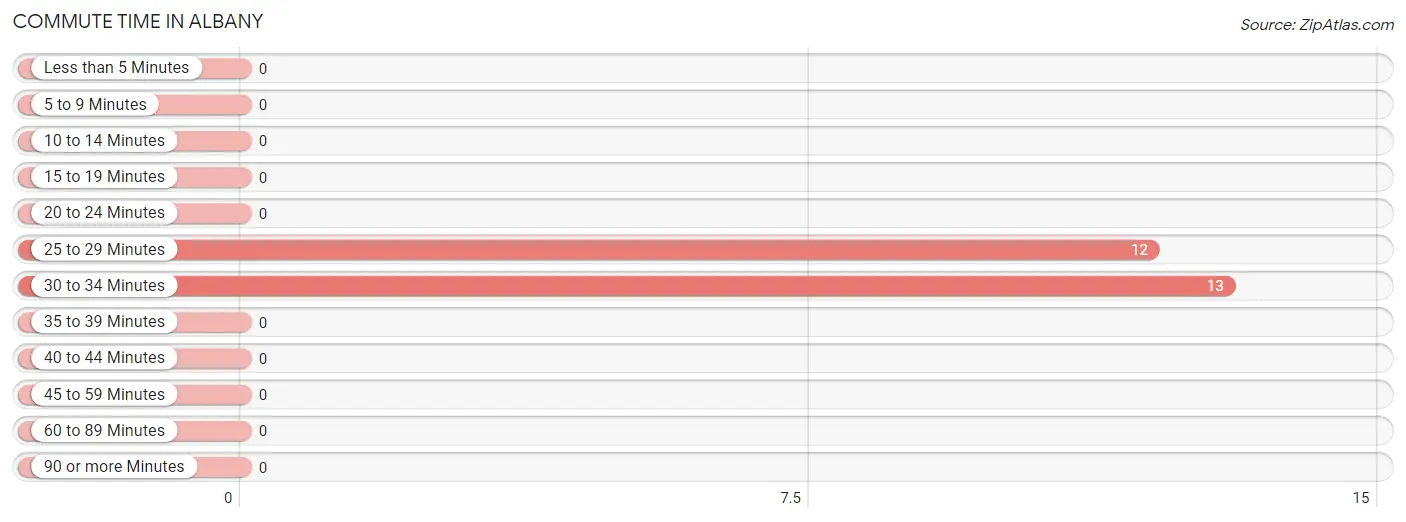
| Commute Time | # Commuters | % Commuters |
| Less than 5 Minutes | 0 | 0.0% |
| 5 to 9 Minutes | 0 | 0.0% |
| 10 to 14 Minutes | 0 | 0.0% |
| 15 to 19 Minutes | 0 | 0.0% |
| 20 to 24 Minutes | 0 | 0.0% |
| 25 to 29 Minutes | 12 | 48.0% |
| 30 to 34 Minutes | 13 | 52.0% |
| 35 to 39 Minutes | 0 | 0.0% |
| 40 to 44 Minutes | 0 | 0.0% |
| 45 to 59 Minutes | 0 | 0.0% |
| 60 to 89 Minutes | 0 | 0.0% |
| 90 or more Minutes | 0 | 0.0% |
Commute Time by Sex in Albany
The most common commute times in Albany are 25 to 29 minutes (6 commuters, 50.0%) for males and 30 to 34 minutes (7 commuters, 53.8%) for females.
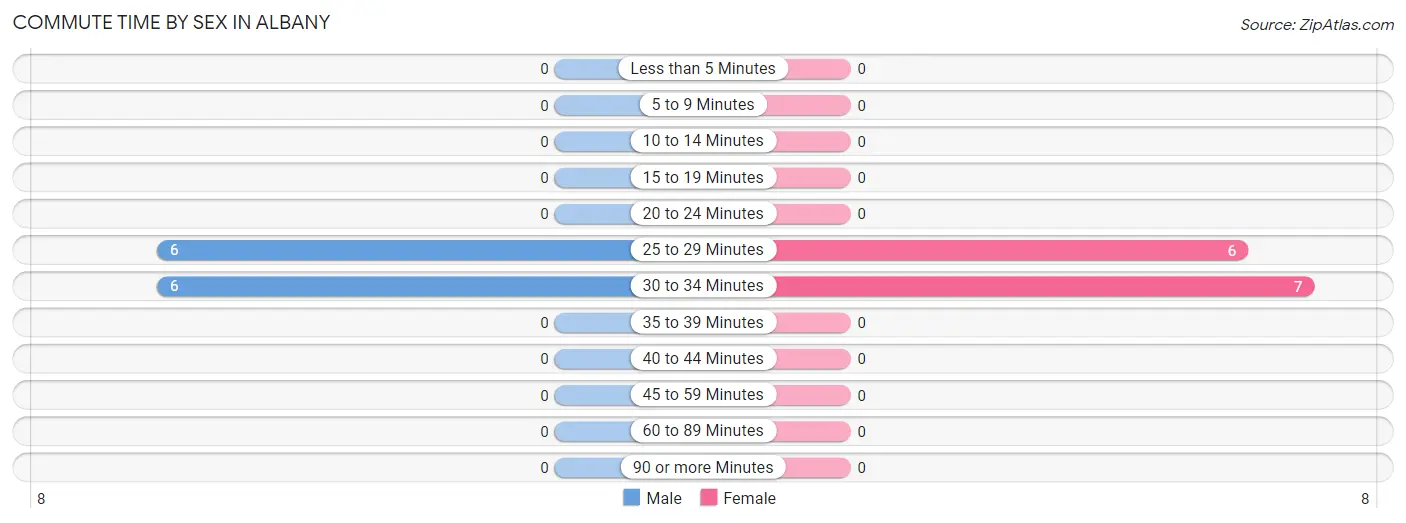
| Commute Time | Male | Female |
| Less than 5 Minutes | 0 (0.0%) | 0 (0.0%) |
| 5 to 9 Minutes | 0 (0.0%) | 0 (0.0%) |
| 10 to 14 Minutes | 0 (0.0%) | 0 (0.0%) |
| 15 to 19 Minutes | 0 (0.0%) | 0 (0.0%) |
| 20 to 24 Minutes | 0 (0.0%) | 0 (0.0%) |
| 25 to 29 Minutes | 6 (50.0%) | 6 (46.2%) |
| 30 to 34 Minutes | 6 (50.0%) | 7 (53.8%) |
| 35 to 39 Minutes | 0 (0.0%) | 0 (0.0%) |
| 40 to 44 Minutes | 0 (0.0%) | 0 (0.0%) |
| 45 to 59 Minutes | 0 (0.0%) | 0 (0.0%) |
| 60 to 89 Minutes | 0 (0.0%) | 0 (0.0%) |
| 90 or more Minutes | 0 (0.0%) | 0 (0.0%) |
Time of Departure to Work by Sex in Albany
The most frequent times of departure to work in Albany are 6:00 AM to 6:29 AM (6, 50.0%) for males and 5:00 AM to 5:29 AM (7, 53.8%) for females.
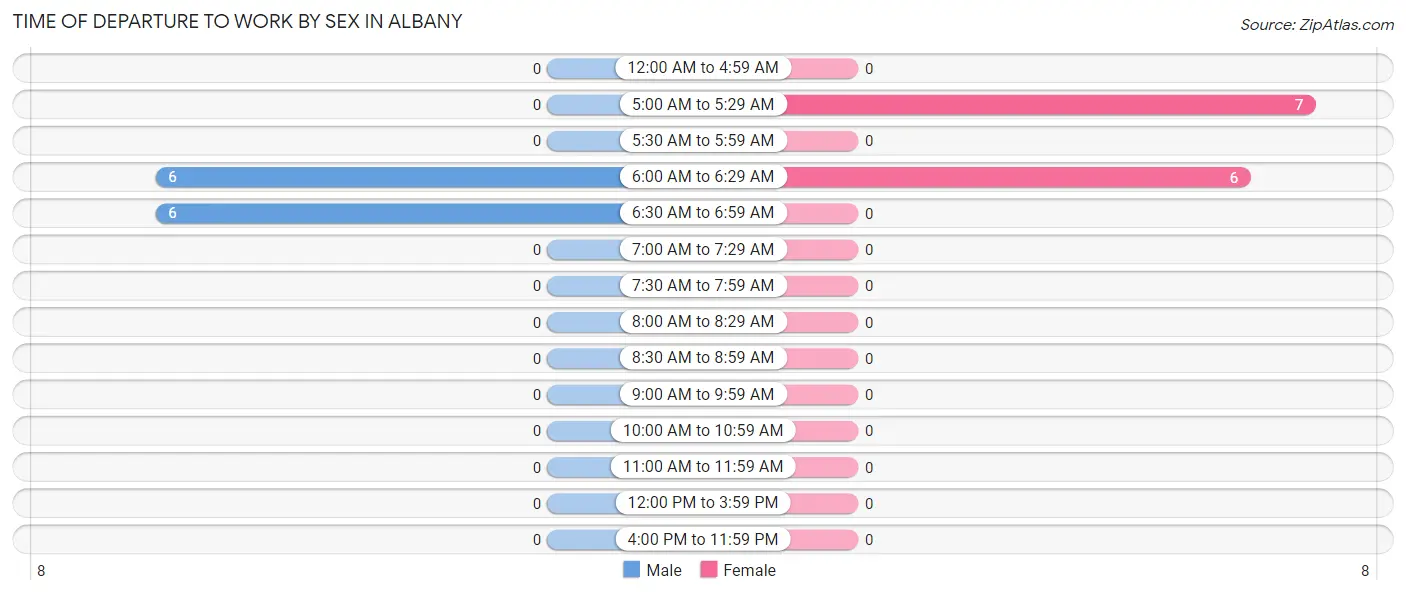
| Time of Departure | Male | Female |
| 12:00 AM to 4:59 AM | 0 (0.0%) | 0 (0.0%) |
| 5:00 AM to 5:29 AM | 0 (0.0%) | 7 (53.8%) |
| 5:30 AM to 5:59 AM | 0 (0.0%) | 0 (0.0%) |
| 6:00 AM to 6:29 AM | 6 (50.0%) | 6 (46.2%) |
| 6:30 AM to 6:59 AM | 6 (50.0%) | 0 (0.0%) |
| 7:00 AM to 7:29 AM | 0 (0.0%) | 0 (0.0%) |
| 7:30 AM to 7:59 AM | 0 (0.0%) | 0 (0.0%) |
| 8:00 AM to 8:29 AM | 0 (0.0%) | 0 (0.0%) |
| 8:30 AM to 8:59 AM | 0 (0.0%) | 0 (0.0%) |
| 9:00 AM to 9:59 AM | 0 (0.0%) | 0 (0.0%) |
| 10:00 AM to 10:59 AM | 0 (0.0%) | 0 (0.0%) |
| 11:00 AM to 11:59 AM | 0 (0.0%) | 0 (0.0%) |
| 12:00 PM to 3:59 PM | 0 (0.0%) | 0 (0.0%) |
| 4:00 PM to 11:59 PM | 0 (0.0%) | 0 (0.0%) |
| Total | 12 (100.0%) | 13 (100.0%) |
Housing Occupancy in Albany
Occupancy by Ownership in Albany
Of the total 44 dwellings in Albany, owner-occupied units account for 38 (86.4%), while renter-occupied units make up 6 (13.6%).

| Occupancy | # Housing Units | % Housing Units |
| Owner Occupied Housing Units | 38 | 86.4% |
| Renter-Occupied Housing Units | 6 | 13.6% |
| Total Occupied Housing Units | 44 | 100.0% |
Occupancy by Household Size in Albany
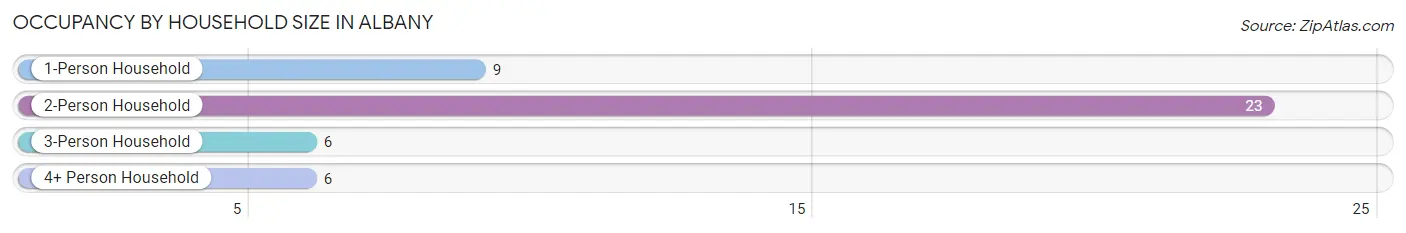
| Household Size | # Housing Units | % Housing Units |
| 1-Person Household | 9 | 20.4% |
| 2-Person Household | 23 | 52.3% |
| 3-Person Household | 6 | 13.6% |
| 4+ Person Household | 6 | 13.6% |
| Total Housing Units | 44 | 100.0% |
Occupancy by Ownership by Household Size in Albany
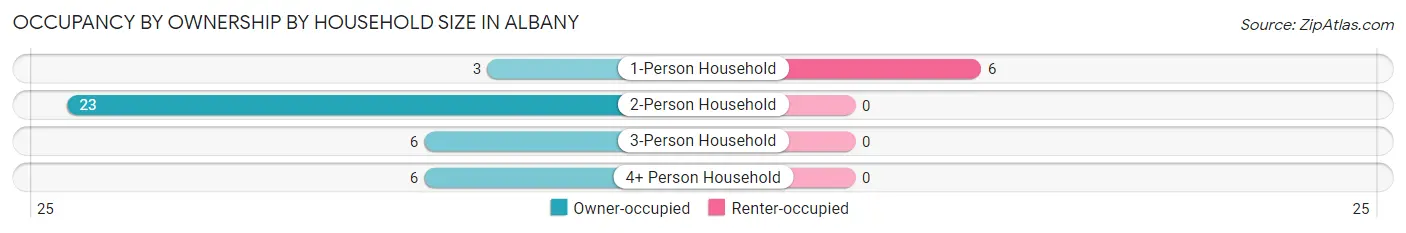
| Household Size | Owner-occupied | Renter-occupied |
| 1-Person Household | 3 (33.3%) | 6 (66.7%) |
| 2-Person Household | 23 (100.0%) | 0 (0.0%) |
| 3-Person Household | 6 (100.0%) | 0 (0.0%) |
| 4+ Person Household | 6 (100.0%) | 0 (0.0%) |
| Total Housing Units | 38 (86.4%) | 6 (13.6%) |
Occupancy by Educational Attainment in Albany
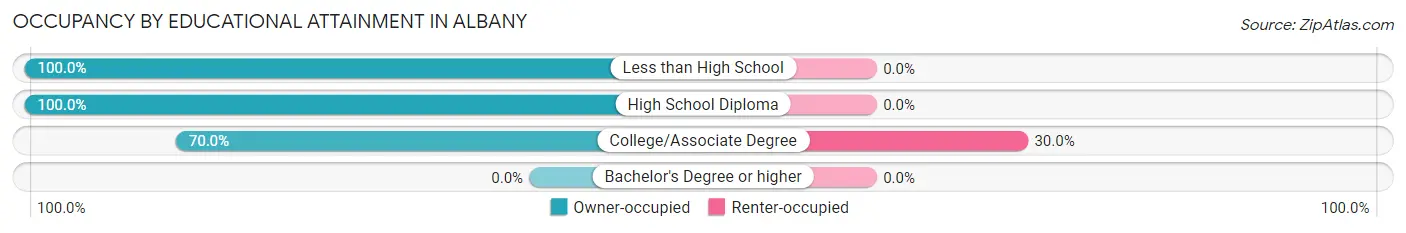
| Household Size | Owner-occupied | Renter-occupied |
| Less than High School | 5 (100.0%) | 0 (0.0%) |
| High School Diploma | 19 (100.0%) | 0 (0.0%) |
| College/Associate Degree | 14 (70.0%) | 6 (30.0%) |
| Bachelor's Degree or higher | 0 (0.0%) | 0 (0.0%) |
Occupancy by Age of Householder in Albany
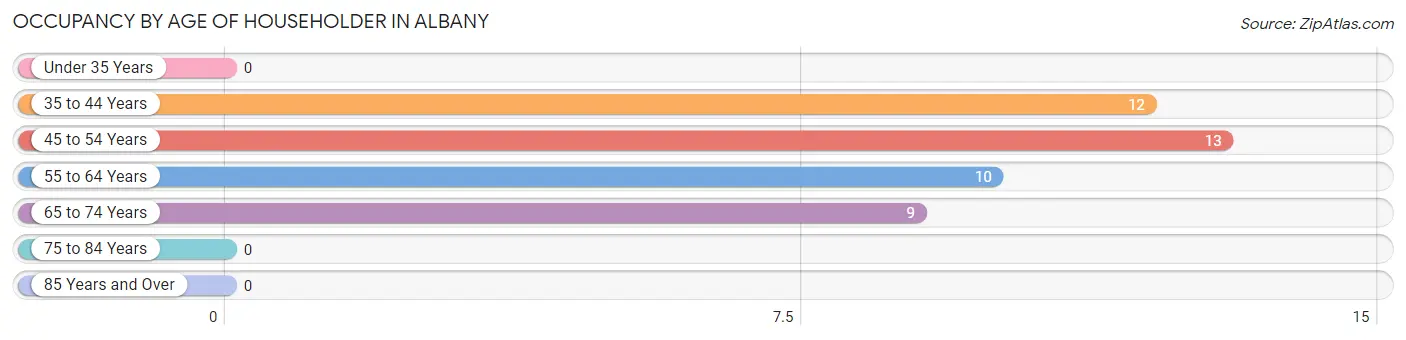
| Age Bracket | # Households | % Households |
| Under 35 Years | 0 | 0.0% |
| 35 to 44 Years | 12 | 27.3% |
| 45 to 54 Years | 13 | 29.5% |
| 55 to 64 Years | 10 | 22.7% |
| 65 to 74 Years | 9 | 20.4% |
| 75 to 84 Years | 0 | 0.0% |
| 85 Years and Over | 0 | 0.0% |
| Total | 44 | 100.0% |
Housing Finances in Albany
Median Income by Occupancy in Albany
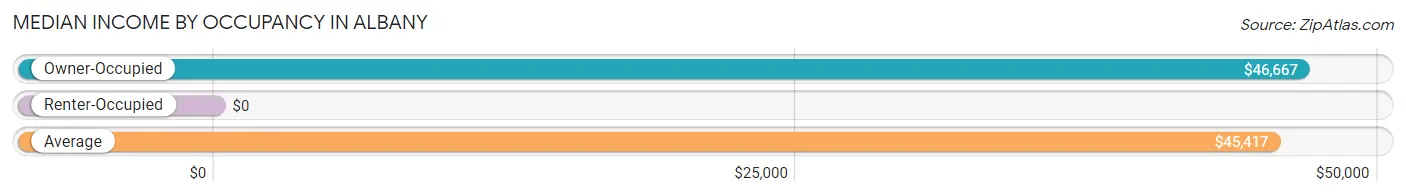
| Occupancy Type | # Households | Median Income |
| Owner-Occupied | 38 (86.4%) | $46,667 |
| Renter-Occupied | 6 (13.6%) | $0 |
| Average | 44 (100.0%) | $45,417 |
Occupancy by Householder Income Bracket in Albany
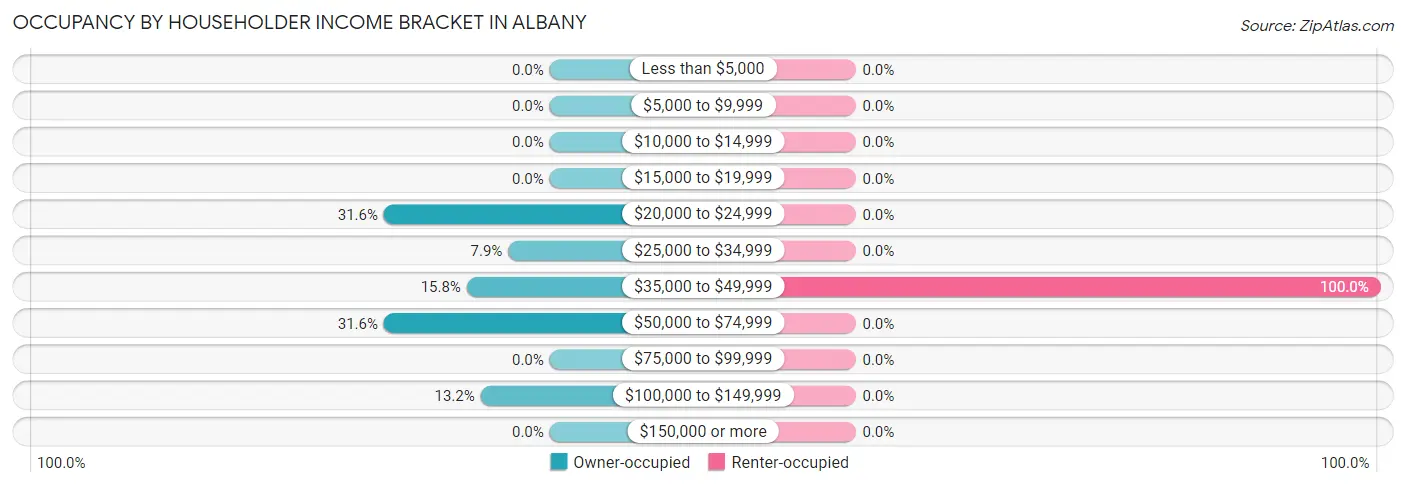
| Income Bracket | Owner-occupied | Renter-occupied |
| Less than $5,000 | 0 (0.0%) | 0 (0.0%) |
| $5,000 to $9,999 | 0 (0.0%) | 0 (0.0%) |
| $10,000 to $14,999 | 0 (0.0%) | 0 (0.0%) |
| $15,000 to $19,999 | 0 (0.0%) | 0 (0.0%) |
| $20,000 to $24,999 | 12 (31.6%) | 0 (0.0%) |
| $25,000 to $34,999 | 3 (7.9%) | 0 (0.0%) |
| $35,000 to $49,999 | 6 (15.8%) | 6 (100.0%) |
| $50,000 to $74,999 | 12 (31.6%) | 0 (0.0%) |
| $75,000 to $99,999 | 0 (0.0%) | 0 (0.0%) |
| $100,000 to $149,999 | 5 (13.2%) | 0 (0.0%) |
| $150,000 or more | 0 (0.0%) | 0 (0.0%) |
| Total | 38 (100.0%) | 6 (100.0%) |
Monthly Housing Cost Tiers in Albany
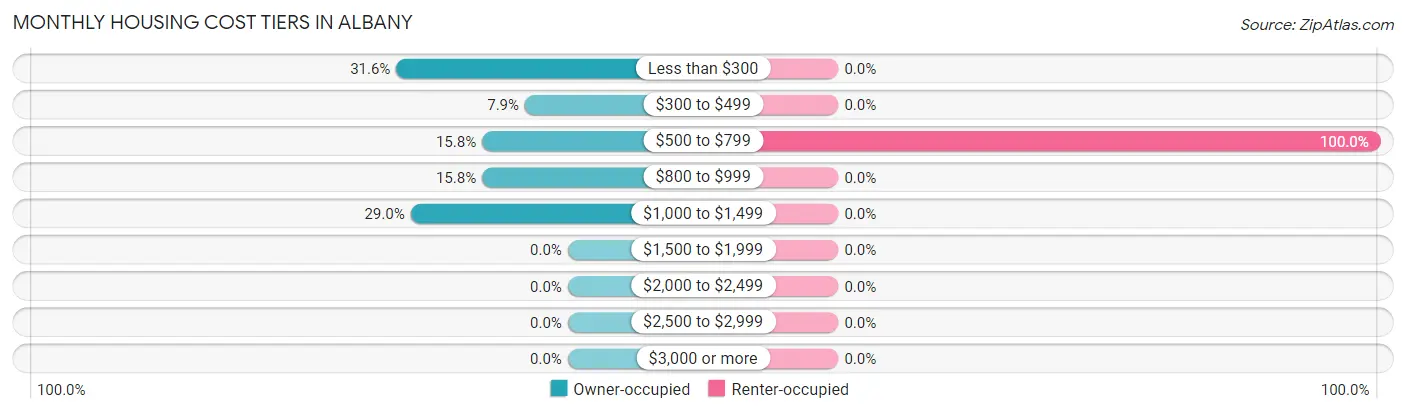
| Monthly Cost | Owner-occupied | Renter-occupied |
| Less than $300 | 12 (31.6%) | 0 (0.0%) |
| $300 to $499 | 3 (7.9%) | 0 (0.0%) |
| $500 to $799 | 6 (15.8%) | 6 (100.0%) |
| $800 to $999 | 6 (15.8%) | 0 (0.0%) |
| $1,000 to $1,499 | 11 (28.9%) | 0 (0.0%) |
| $1,500 to $1,999 | 0 (0.0%) | 0 (0.0%) |
| $2,000 to $2,499 | 0 (0.0%) | 0 (0.0%) |
| $2,500 to $2,999 | 0 (0.0%) | 0 (0.0%) |
| $3,000 or more | 0 (0.0%) | 0 (0.0%) |
| Total | 38 (100.0%) | 6 (100.0%) |
Physical Housing Characteristics in Albany
Housing Structures in Albany
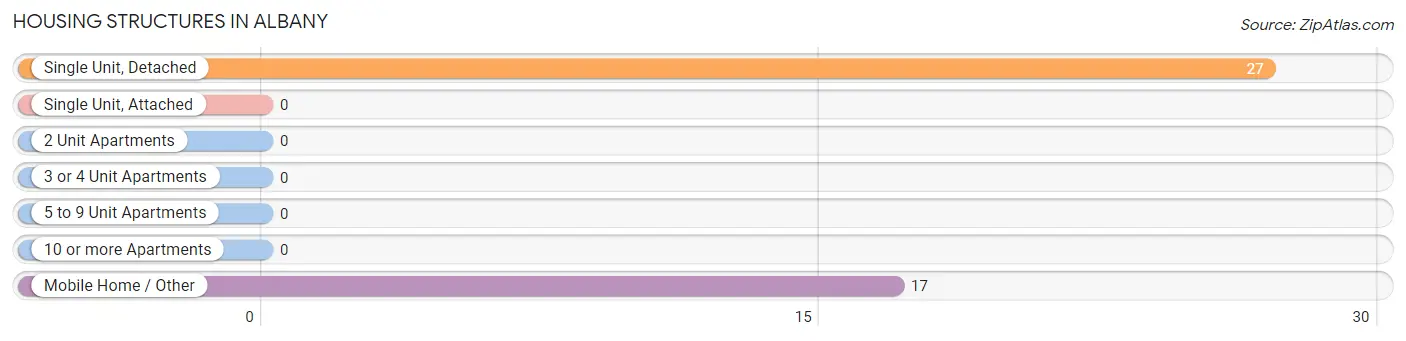
| Structure Type | # Housing Units | % Housing Units |
| Single Unit, Detached | 27 | 61.4% |
| Single Unit, Attached | 0 | 0.0% |
| 2 Unit Apartments | 0 | 0.0% |
| 3 or 4 Unit Apartments | 0 | 0.0% |
| 5 to 9 Unit Apartments | 0 | 0.0% |
| 10 or more Apartments | 0 | 0.0% |
| Mobile Home / Other | 17 | 38.6% |
| Total | 44 | 100.0% |
Housing Structures by Occupancy in Albany
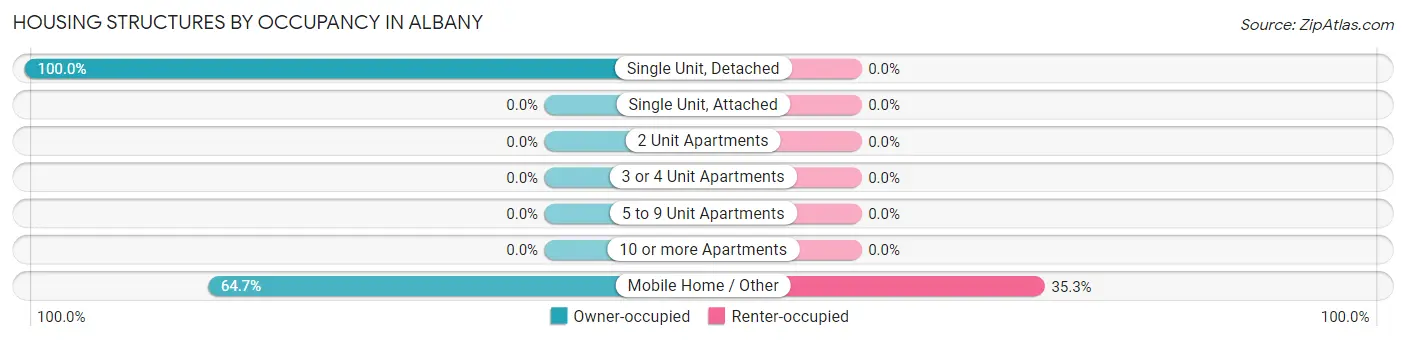
| Structure Type | Owner-occupied | Renter-occupied |
| Single Unit, Detached | 27 (100.0%) | 0 (0.0%) |
| Single Unit, Attached | 0 (0.0%) | 0 (0.0%) |
| 2 Unit Apartments | 0 (0.0%) | 0 (0.0%) |
| 3 or 4 Unit Apartments | 0 (0.0%) | 0 (0.0%) |
| 5 to 9 Unit Apartments | 0 (0.0%) | 0 (0.0%) |
| 10 or more Apartments | 0 (0.0%) | 0 (0.0%) |
| Mobile Home / Other | 11 (64.7%) | 6 (35.3%) |
| Total | 38 (86.4%) | 6 (13.6%) |
Housing Structures by Number of Rooms in Albany
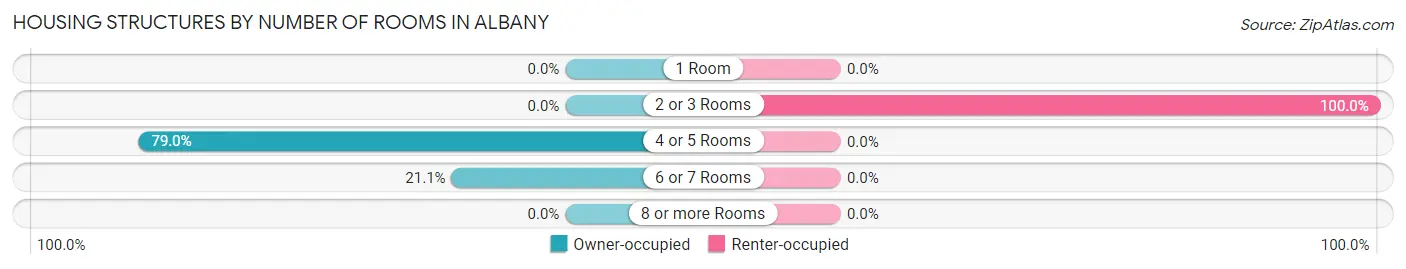
| Number of Rooms | Owner-occupied | Renter-occupied |
| 1 Room | 0 (0.0%) | 0 (0.0%) |
| 2 or 3 Rooms | 0 (0.0%) | 6 (100.0%) |
| 4 or 5 Rooms | 30 (78.9%) | 0 (0.0%) |
| 6 or 7 Rooms | 8 (21.0%) | 0 (0.0%) |
| 8 or more Rooms | 0 (0.0%) | 0 (0.0%) |
| Total | 38 (100.0%) | 6 (100.0%) |
Housing Structure by Heating Type in Albany
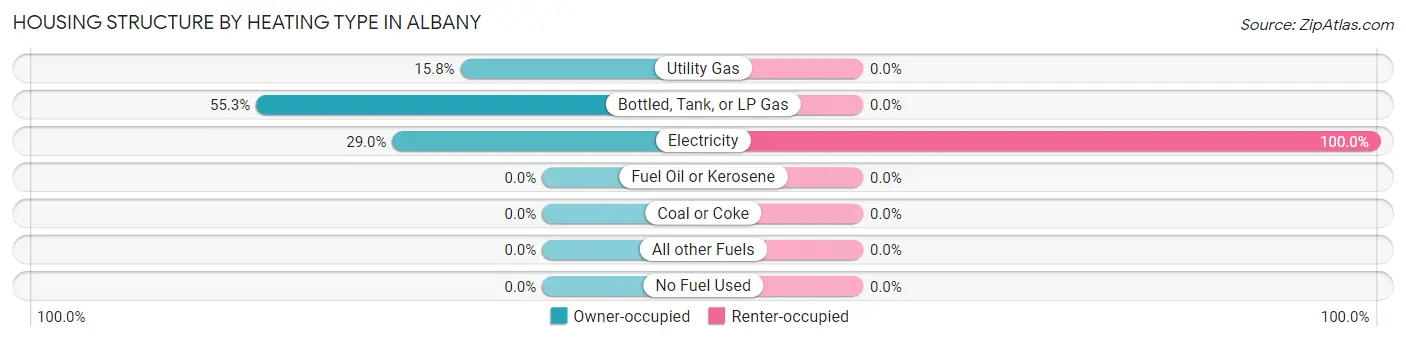
| Heating Type | Owner-occupied | Renter-occupied |
| Utility Gas | 6 (15.8%) | 0 (0.0%) |
| Bottled, Tank, or LP Gas | 21 (55.3%) | 0 (0.0%) |
| Electricity | 11 (28.9%) | 6 (100.0%) |
| Fuel Oil or Kerosene | 0 (0.0%) | 0 (0.0%) |
| Coal or Coke | 0 (0.0%) | 0 (0.0%) |
| All other Fuels | 0 (0.0%) | 0 (0.0%) |
| No Fuel Used | 0 (0.0%) | 0 (0.0%) |
| Total | 38 (100.0%) | 6 (100.0%) |
Household Vehicle Usage in Albany
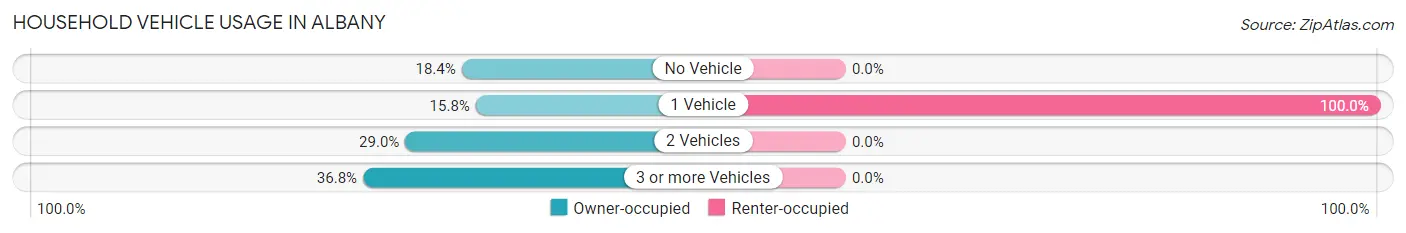
| Vehicles per Household | Owner-occupied | Renter-occupied |
| No Vehicle | 7 (18.4%) | 0 (0.0%) |
| 1 Vehicle | 6 (15.8%) | 6 (100.0%) |
| 2 Vehicles | 11 (28.9%) | 0 (0.0%) |
| 3 or more Vehicles | 14 (36.8%) | 0 (0.0%) |
| Total | 38 (100.0%) | 6 (100.0%) |
Real Estate & Mortgages in Albany
Real Estate and Mortgage Overview in Albany
| Characteristic | Without Mortgage | With Mortgage |
| Housing Units | 12 | 26 |
| Median Property Value | - | - |
| Median Household Income | - | - |
| Monthly Housing Costs | - | - |
| Real Estate Taxes | - | - |
Property Value by Mortgage Status in Albany
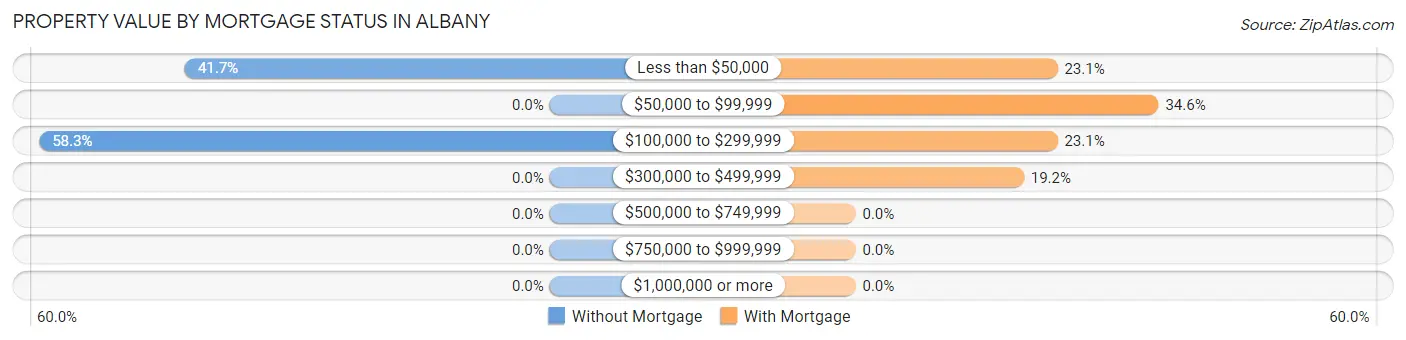
| Property Value | Without Mortgage | With Mortgage |
| Less than $50,000 | 5 (41.7%) | 6 (23.1%) |
| $50,000 to $99,999 | 0 (0.0%) | 9 (34.6%) |
| $100,000 to $299,999 | 7 (58.3%) | 6 (23.1%) |
| $300,000 to $499,999 | 0 (0.0%) | 5 (19.2%) |
| $500,000 to $749,999 | 0 (0.0%) | 0 (0.0%) |
| $750,000 to $999,999 | 0 (0.0%) | 0 (0.0%) |
| $1,000,000 or more | 0 (0.0%) | 0 (0.0%) |
| Total | 12 (100.0%) | 26 (100.0%) |
Household Income by Mortgage Status in Albany
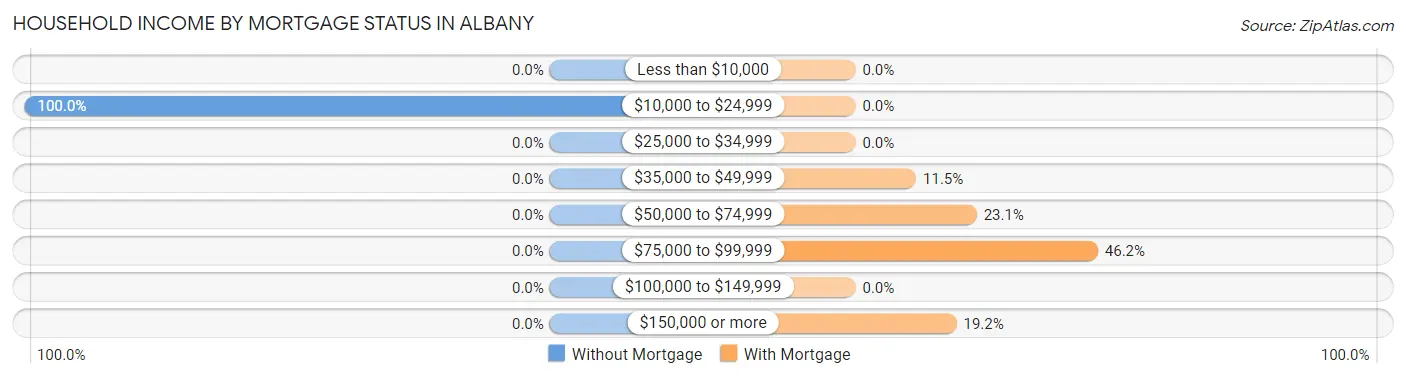
| Household Income | Without Mortgage | With Mortgage |
| Less than $10,000 | 0 (0.0%) | 0 (0.0%) |
| $10,000 to $24,999 | 12 (100.0%) | 0 (0.0%) |
| $25,000 to $34,999 | 0 (0.0%) | 0 (0.0%) |
| $35,000 to $49,999 | 0 (0.0%) | 3 (11.5%) |
| $50,000 to $74,999 | 0 (0.0%) | 6 (23.1%) |
| $75,000 to $99,999 | 0 (0.0%) | 12 (46.2%) |
| $100,000 to $149,999 | 0 (0.0%) | 0 (0.0%) |
| $150,000 or more | 0 (0.0%) | 5 (19.2%) |
| Total | 12 (100.0%) | 26 (100.0%) |
Property Value to Household Income Ratio in Albany
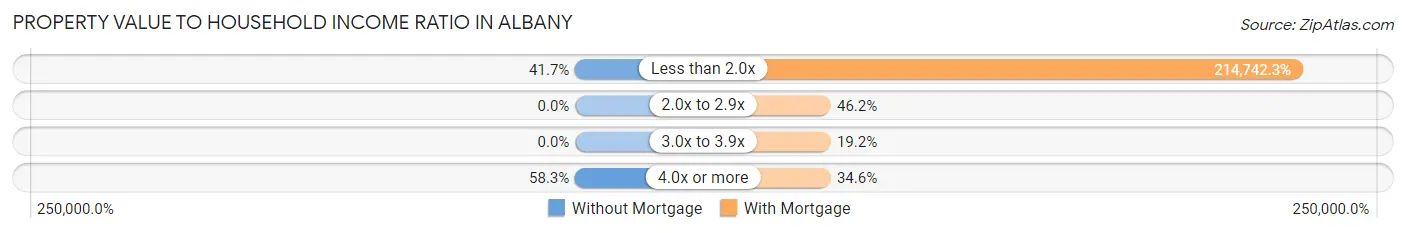
| Value-to-Income Ratio | Without Mortgage | With Mortgage |
| Less than 2.0x | 5 (41.7%) | 55,833 (214,742.3%) |
| 2.0x to 2.9x | 0 (0.0%) | 12 (46.2%) |
| 3.0x to 3.9x | 0 (0.0%) | 5 (19.2%) |
| 4.0x or more | 7 (58.3%) | 9 (34.6%) |
| Total | 12 (100.0%) | 26 (100.0%) |
Real Estate Taxes by Mortgage Status in Albany
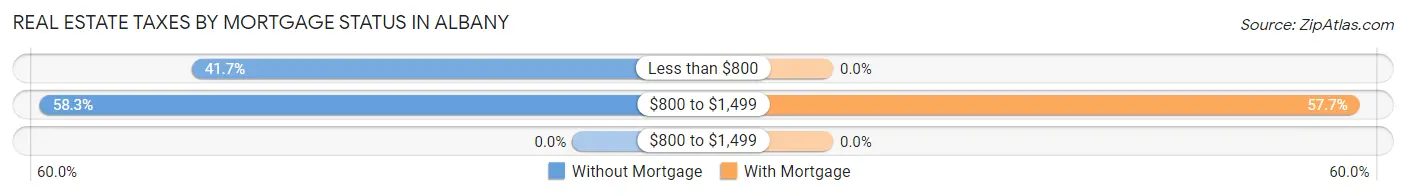
| Property Taxes | Without Mortgage | With Mortgage |
| Less than $800 | 5 (41.7%) | 0 (0.0%) |
| $800 to $1,499 | 7 (58.3%) | 15 (57.7%) |
| $800 to $1,499 | 0 (0.0%) | 0 (0.0%) |
| Total | 12 (100.0%) | 26 (100.0%) |
Health & Disability in Albany
Health Insurance Coverage by Age in Albany
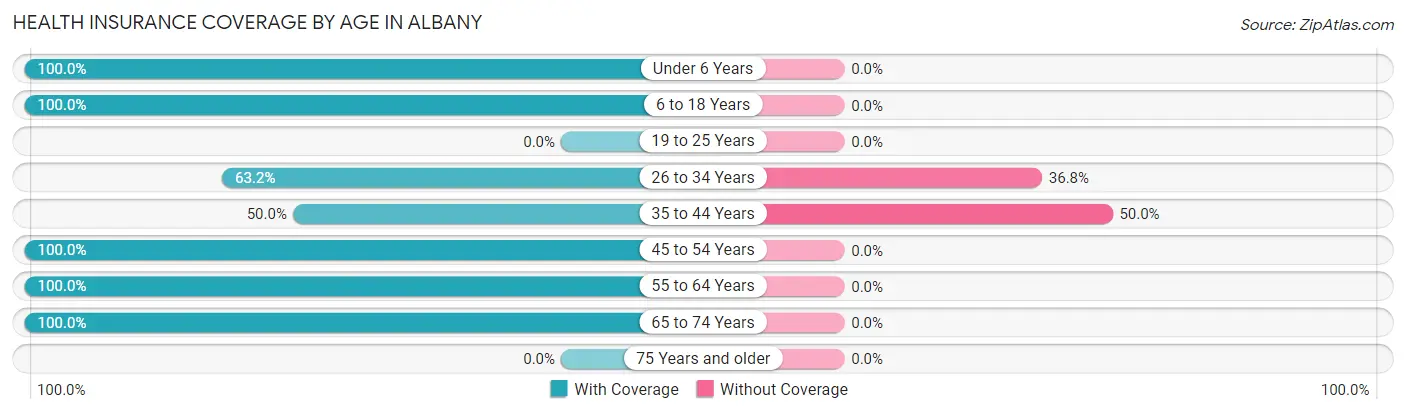
| Age Bracket | With Coverage | Without Coverage |
| Under 6 Years | 5 (100.0%) | 0 (0.0%) |
| 6 to 18 Years | 22 (100.0%) | 0 (0.0%) |
| 19 to 25 Years | 0 (0.0%) | 0 (0.0%) |
| 26 to 34 Years | 12 (63.2%) | 7 (36.8%) |
| 35 to 44 Years | 6 (50.0%) | 6 (50.0%) |
| 45 to 54 Years | 13 (100.0%) | 0 (0.0%) |
| 55 to 64 Years | 21 (100.0%) | 0 (0.0%) |
| 65 to 74 Years | 22 (100.0%) | 0 (0.0%) |
| 75 Years and older | 0 (0.0%) | 0 (0.0%) |
| Total | 101 (88.6%) | 13 (11.4%) |
Health Insurance Coverage by Citizenship Status in Albany
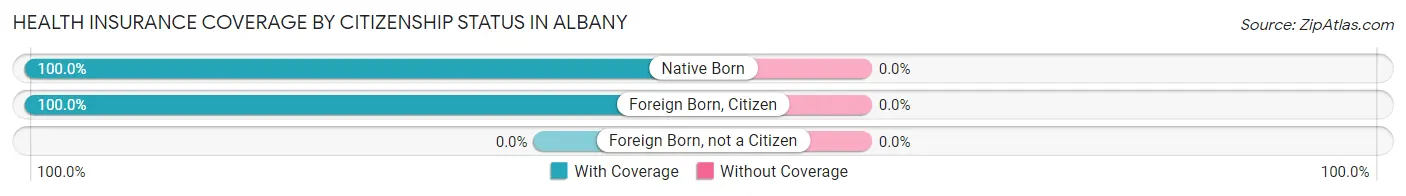
| Citizenship Status | With Coverage | Without Coverage |
| Native Born | 5 (100.0%) | 0 (0.0%) |
| Foreign Born, Citizen | 22 (100.0%) | 0 (0.0%) |
| Foreign Born, not a Citizen | 0 (0.0%) | 0 (0.0%) |
Health Insurance Coverage by Household Income in Albany
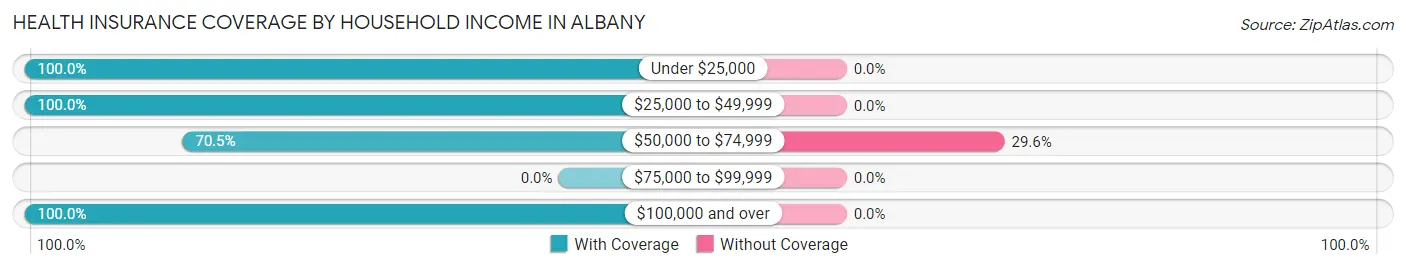
| Household Income | With Coverage | Without Coverage |
| Under $25,000 | 23 (100.0%) | 0 (0.0%) |
| $25,000 to $49,999 | 36 (100.0%) | 0 (0.0%) |
| $50,000 to $74,999 | 31 (70.5%) | 13 (29.5%) |
| $75,000 to $99,999 | 0 (0.0%) | 0 (0.0%) |
| $100,000 and over | 11 (100.0%) | 0 (0.0%) |
Public vs Private Health Insurance Coverage by Age in Albany
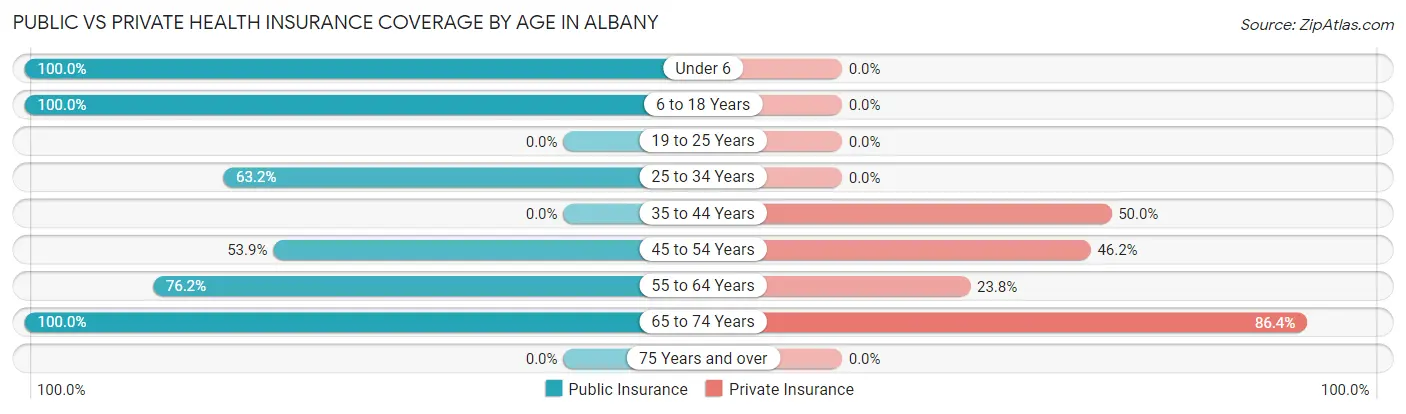
| Age Bracket | Public Insurance | Private Insurance |
| Under 6 | 5 (100.0%) | 0 (0.0%) |
| 6 to 18 Years | 22 (100.0%) | 0 (0.0%) |
| 19 to 25 Years | 0 (0.0%) | 0 (0.0%) |
| 25 to 34 Years | 12 (63.2%) | 0 (0.0%) |
| 35 to 44 Years | 0 (0.0%) | 6 (50.0%) |
| 45 to 54 Years | 7 (53.8%) | 6 (46.2%) |
| 55 to 64 Years | 16 (76.2%) | 5 (23.8%) |
| 65 to 74 Years | 22 (100.0%) | 19 (86.4%) |
| 75 Years and over | 0 (0.0%) | 0 (0.0%) |
| Total | 84 (73.7%) | 36 (31.6%) |
Disability Status by Sex by Age in Albany
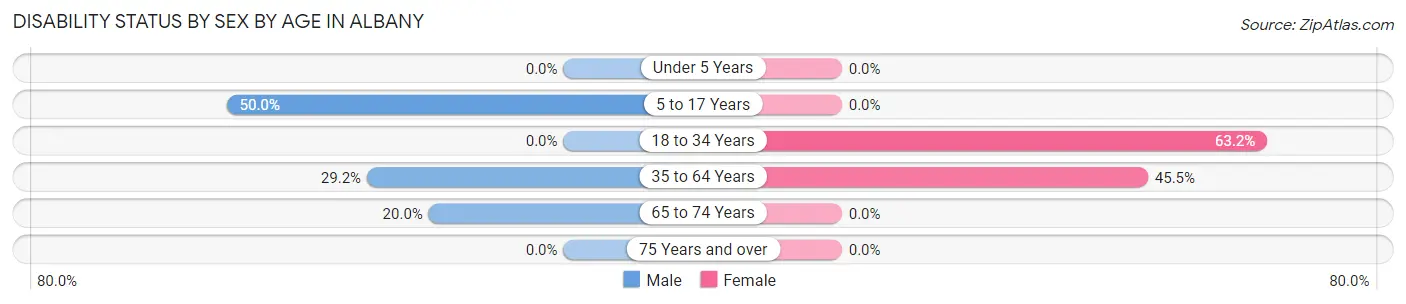
| Age Bracket | Male | Female |
| Under 5 Years | 0 (0.0%) | 0 (0.0%) |
| 5 to 17 Years | 9 (50.0%) | 0 (0.0%) |
| 18 to 34 Years | 0 (0.0%) | 12 (63.2%) |
| 35 to 64 Years | 7 (29.2%) | 10 (45.5%) |
| 65 to 74 Years | 3 (20.0%) | 0 (0.0%) |
| 75 Years and over | 0 (0.0%) | 0 (0.0%) |
Disability Class by Sex by Age in Albany
Disability Class: Hearing Difficulty
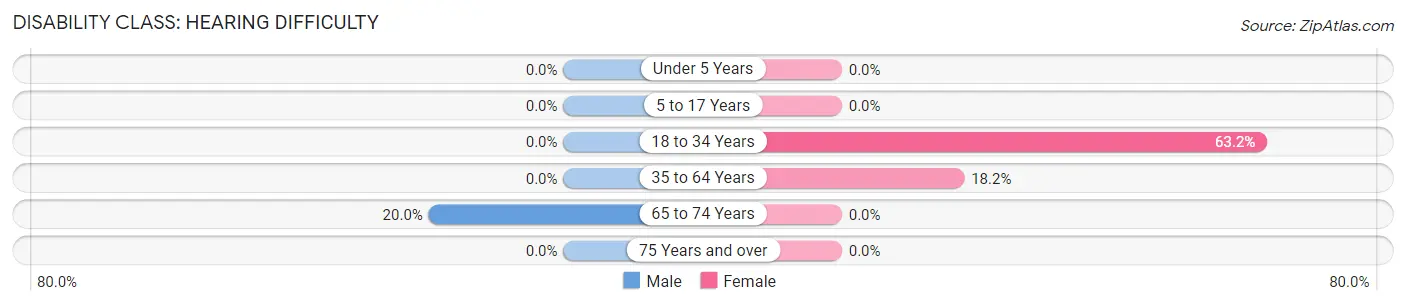
| Age Bracket | Male | Female |
| Under 5 Years | 0 (0.0%) | 0 (0.0%) |
| 5 to 17 Years | 0 (0.0%) | 0 (0.0%) |
| 18 to 34 Years | 0 (0.0%) | 12 (63.2%) |
| 35 to 64 Years | 0 (0.0%) | 4 (18.2%) |
| 65 to 74 Years | 3 (20.0%) | 0 (0.0%) |
| 75 Years and over | 0 (0.0%) | 0 (0.0%) |
Disability Class: Vision Difficulty
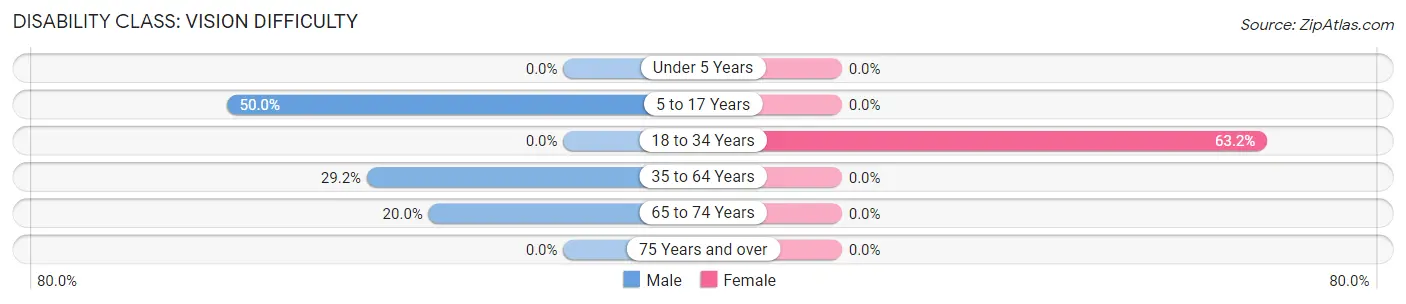
| Age Bracket | Male | Female |
| Under 5 Years | 0 (0.0%) | 0 (0.0%) |
| 5 to 17 Years | 9 (50.0%) | 0 (0.0%) |
| 18 to 34 Years | 0 (0.0%) | 12 (63.2%) |
| 35 to 64 Years | 7 (29.2%) | 0 (0.0%) |
| 65 to 74 Years | 3 (20.0%) | 0 (0.0%) |
| 75 Years and over | 0 (0.0%) | 0 (0.0%) |
Disability Class: Cognitive Difficulty
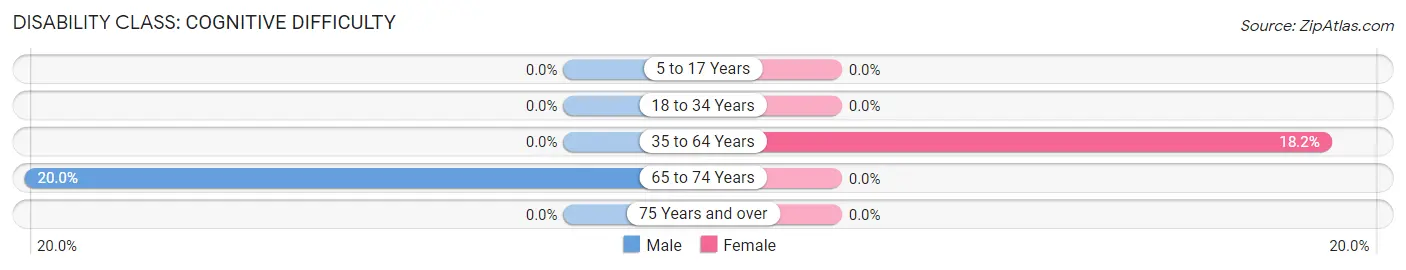
| Age Bracket | Male | Female |
| 5 to 17 Years | 0 (0.0%) | 0 (0.0%) |
| 18 to 34 Years | 0 (0.0%) | 0 (0.0%) |
| 35 to 64 Years | 0 (0.0%) | 4 (18.2%) |
| 65 to 74 Years | 3 (20.0%) | 0 (0.0%) |
| 75 Years and over | 0 (0.0%) | 0 (0.0%) |
Disability Class: Ambulatory Difficulty
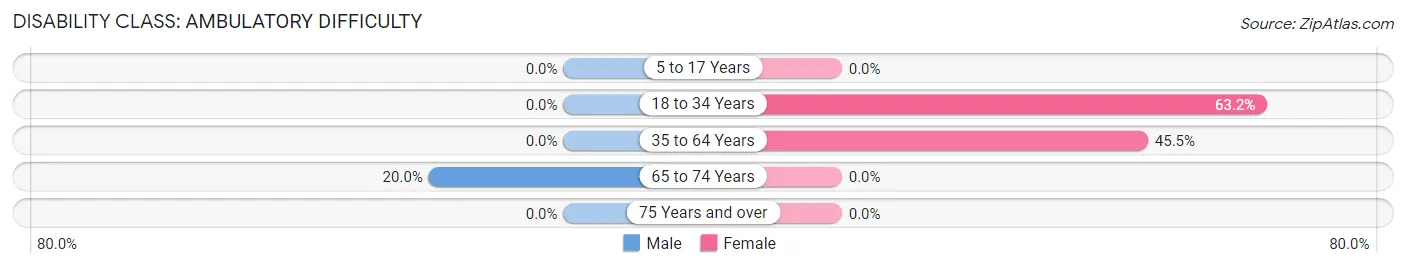
| Age Bracket | Male | Female |
| 5 to 17 Years | 0 (0.0%) | 0 (0.0%) |
| 18 to 34 Years | 0 (0.0%) | 12 (63.2%) |
| 35 to 64 Years | 0 (0.0%) | 10 (45.5%) |
| 65 to 74 Years | 3 (20.0%) | 0 (0.0%) |
| 75 Years and over | 0 (0.0%) | 0 (0.0%) |
Disability Class: Self-Care Difficulty
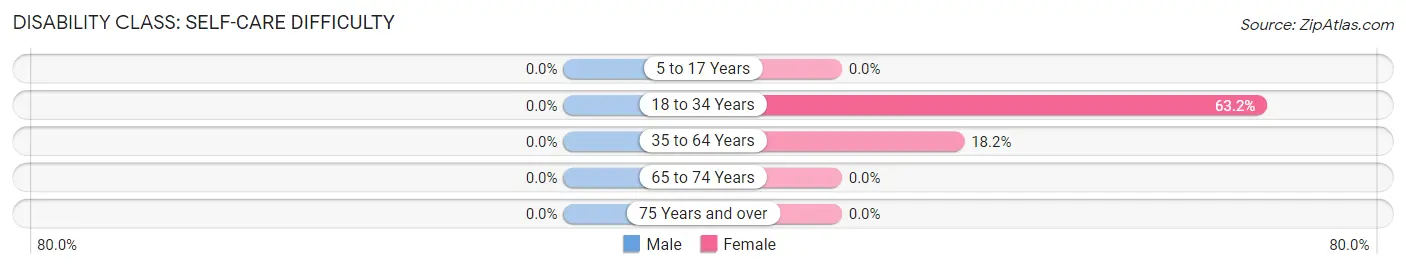
| Age Bracket | Male | Female |
| 5 to 17 Years | 0 (0.0%) | 0 (0.0%) |
| 18 to 34 Years | 0 (0.0%) | 12 (63.2%) |
| 35 to 64 Years | 0 (0.0%) | 4 (18.2%) |
| 65 to 74 Years | 0 (0.0%) | 0 (0.0%) |
| 75 Years and over | 0 (0.0%) | 0 (0.0%) |
Technology Access in Albany
Computing Device Access in Albany
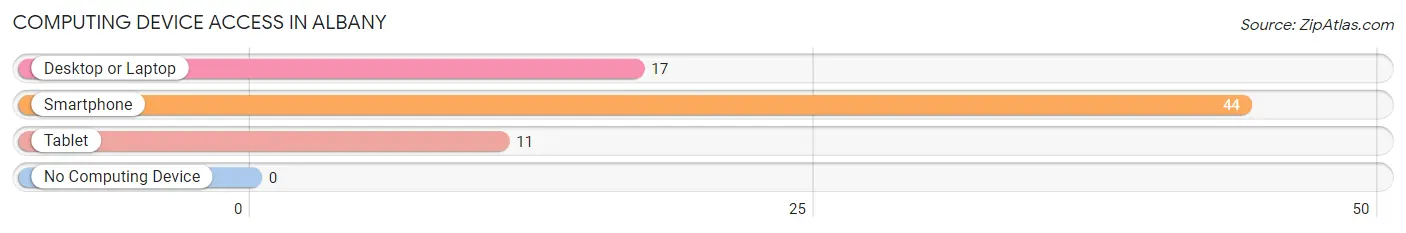
| Device Type | # Households | % Households |
| Desktop or Laptop | 17 | 38.6% |
| Smartphone | 44 | 100.0% |
| Tablet | 11 | 25.0% |
| No Computing Device | 0 | 0.0% |
| Total | 44 | 100.0% |
Internet Access in Albany
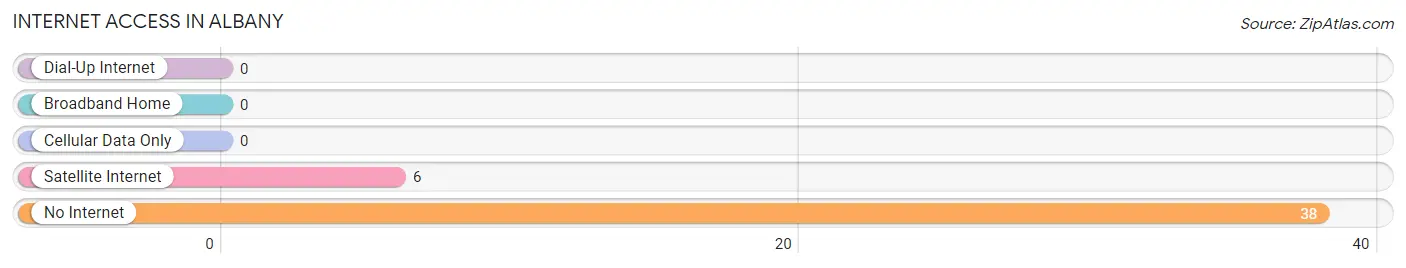
| Internet Type | # Households | % Households |
| Dial-Up Internet | 0 | 0.0% |
| Broadband Home | 0 | 0.0% |
| Cellular Data Only | 0 | 0.0% |
| Satellite Internet | 6 | 13.6% |
| No Internet | 38 | 86.4% |
| Total | 44 | 100.0% |
Albany Summary
Albany is a small town located in the southwestern corner of Oklahoma, in the United States. It is situated in the foothills of the Wichita Mountains, and is part of the Lawton-Fort Sill metropolitan area. The town has a population of approximately 1,000 people, and is the county seat of Kiowa County.
History
Albany was founded in 1891, when the Kiowa County Land Office opened in the area. The town was named after the city of Albany, New York, and was originally intended to be a trading post for the Kiowa and Comanche tribes. The town was officially incorporated in 1901, and the first post office was established in 1902.
In the early 1900s, Albany was a thriving agricultural community, with cotton, corn, and wheat being the main crops. The town also had a number of businesses, including a bank, a hotel, a general store, and a blacksmith shop.
In the 1920s, the town began to decline, as the Great Depression hit the area. The population decreased, and many of the businesses closed. However, the town was able to survive, and in the 1940s, the economy began to improve.
Geography
Albany is located in southwestern Oklahoma, in the foothills of the Wichita Mountains. The town is situated at an elevation of 1,400 feet, and is part of the Lawton-Fort Sill metropolitan area. The town is located approximately 25 miles from Lawton, and is approximately 75 miles from Oklahoma City.
The town is located in a semi-arid climate, with hot summers and mild winters. The average annual temperature is around 65 degrees Fahrenheit, and the average annual precipitation is around 25 inches.
Economy
Albany’s economy is largely based on agriculture, with cotton, corn, and wheat being the main crops. The town also has a number of businesses, including a bank, a hotel, a general store, and a blacksmith shop.
The town is also home to a number of manufacturing companies, including a furniture factory, a metal fabrication plant, and a plastics factory. The town is also home to a number of oil and gas companies, as well as a number of small businesses.
Demographics
As of the 2010 census, Albany had a population of 1,000 people. The racial makeup of the town was 94.2% White, 0.7% African American, 0.3% Native American, 0.2% Asian, 0.1% Pacific Islander, and 4.5% from other races. The median household income was $31,250, and the median family income was $37,500.
Conclusion
Albany is a small town located in the southwestern corner of Oklahoma, in the United States. It is situated in the foothills of the Wichita Mountains, and is part of the Lawton-Fort Sill metropolitan area. The town has a population of approximately 1,000 people, and is the county seat of Kiowa County. The town’s economy is largely based on agriculture, with cotton, corn, and wheat being the main crops. The town also has a number of businesses, including a bank, a hotel, a general store, and a blacksmith shop. The town is also home to a number of manufacturing companies, as well as a number of oil and gas companies. The racial makeup of the town is 94.2% White, 0.7% African American, 0.3% Native American, 0.2% Asian, 0.1% Pacific Islander, and 4.5% from other races. The median household income was $31,250, and the median family income was $37,500.
Common Questions
What is Per Capita Income in Albany?
Per Capita income in Albany is $20,618.
What is the Median Family Income in Albany?
Median Family Income in Albany is $47,292.
What is the Median Household income in Albany?
Median Household Income in Albany is $45,417.
What is Inequality or Gini Index in Albany?
Inequality or Gini Index in Albany is 0.32.
What is the Total Population of Albany?
Total Population of Albany is 114.
What is the Total Male Population of Albany?
Total Male Population of Albany is 62.
What is the Total Female Population of Albany?
Total Female Population of Albany is 52.
What is the Ratio of Males per 100 Females in Albany?
There are 119.23 Males per 100 Females in Albany.
What is the Ratio of Females per 100 Males in Albany?
There are 83.87 Females per 100 Males in Albany.
What is the Median Population Age in Albany?
Median Population Age in Albany is 44.8 Years.
What is the Average Family Size in Albany
Average Family Size in Albany is 3.0 People.
What is the Average Household Size in Albany
Average Household Size in Albany is 2.6 People.
How Large is the Labor Force in Albany?
There are 25 People in the Labor Forcein in Albany.
What is the Percentage of People in the Labor Force in Albany?
28.7% of People are in the Labor Force in Albany.