Zip Codes with the Highest Percentage of Population Employed in Arts, Entertainment & Recreation in Hamilton, OH
RELATED REPORTS & OPTIONS
Arts, Entertainment & Recreation
Hamilton
Compare Zip Codes
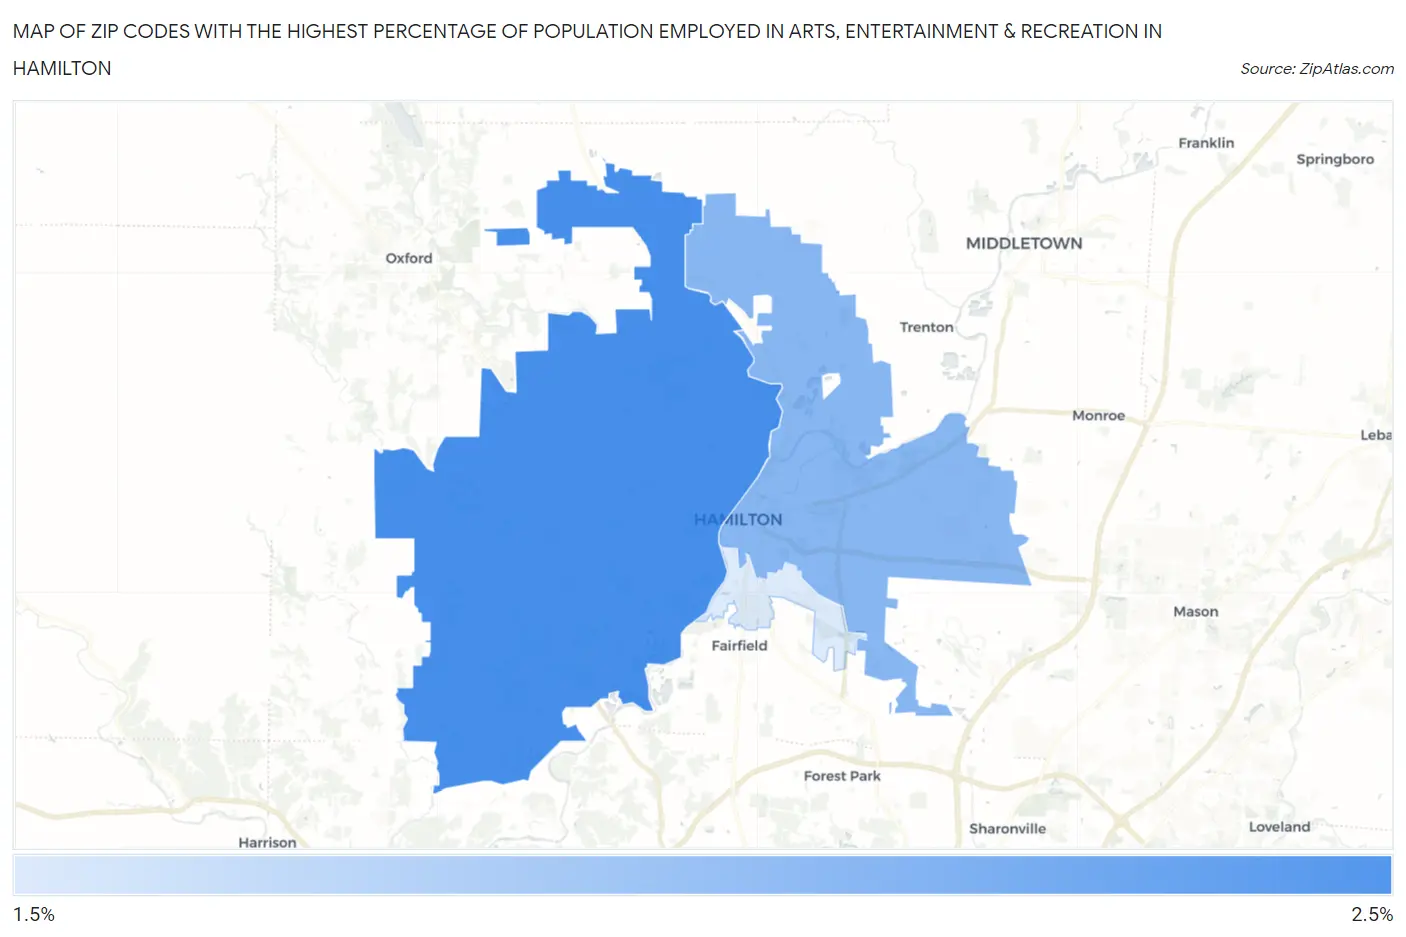
Map of Zip Codes with the Highest Percentage of Population Employed in Arts, Entertainment & Recreation in Hamilton
0.0%
2.5%
Zip Codes with the Highest Percentage of Population Employed in Arts, Entertainment & Recreation in Hamilton, OH
| Zip Code | % Employed | vs State | vs National | |
| 1. | 45013 | 2.3% | 1.7%(+0.601)#205 | 2.1%(+0.197)#8,222 |
| 2. | 45011 | 2.1% | 1.7%(+0.416)#243 | 2.1%(+0.012)#9,240 |
| 3. | 45015 | 1.8% | 1.7%(+0.169)#295 | 2.1%(-0.235)#10,702 |
1
Common Questions
What are the Top Zip Codes with the Highest Percentage of Population Employed in Arts, Entertainment & Recreation in Hamilton, OH?
Top Zip Codes with the Highest Percentage of Population Employed in Arts, Entertainment & Recreation in Hamilton, OH are:
What zip code has the Highest Percentage of Population Employed in Arts, Entertainment & Recreation in Hamilton, OH?
45013 has the Highest Percentage of Population Employed in Arts, Entertainment & Recreation in Hamilton, OH with 2.3%.
What is the Percentage of Population Employed in Arts, Entertainment & Recreation in Hamilton, OH?
Percentage of Population Employed in Arts, Entertainment & Recreation in Hamilton is 2.3%.
What is the Percentage of Population Employed in Arts, Entertainment & Recreation in Ohio?
Percentage of Population Employed in Arts, Entertainment & Recreation in Ohio is 1.7%.
What is the Percentage of Population Employed in Arts, Entertainment & Recreation in the United States?
Percentage of Population Employed in Arts, Entertainment & Recreation in the United States is 2.1%.