Silver City, NV Map & Demographics
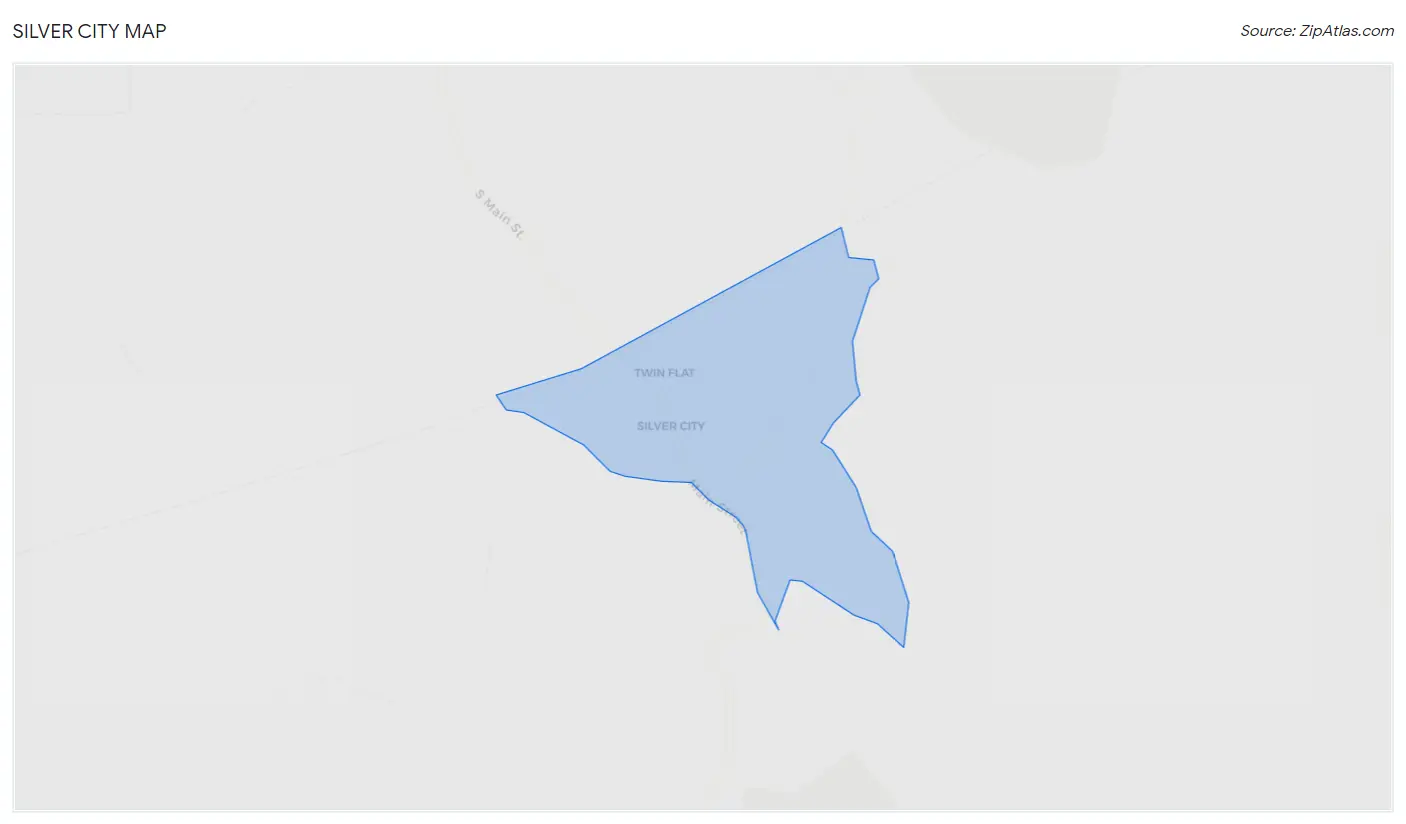
Silver City Map
Silver City Overview
$26,881
PER CAPITA INCOME
$77,250
AVG FAMILY INCOME
$76,750
AVG HOUSEHOLD INCOME
0.27
INEQUALITY / GINI INDEX
105
TOTAL POPULATION
57
MALE POPULATION
48
FEMALE POPULATION
118.75
MALES / 100 FEMALES
84.21
FEMALES / 100 MALES
36.3
MEDIAN AGE
3.1
AVG FAMILY SIZE
2.7
AVG HOUSEHOLD SIZE
35
LABOR FORCE [ PEOPLE ]
46.7%
PERCENT IN LABOR FORCE
Silver City Zip Codes
Silver City Area Codes
Income in Silver City
Income Overview in Silver City
Per Capita Income in Silver City is $26,881, while median incomes of families and households are $77,250 and $76,750 respectively.
| Characteristic | Number | Measure |
| Per Capita Income | 105 | $26,881 |
| Median Family Income | 29 | $77,250 |
| Mean Family Income | 29 | $67,338 |
| Median Household Income | 39 | $76,750 |
| Mean Household Income | 39 | $69,513 |
| Income Deficit | 29 | $0 |
| Wage / Income Gap (%) | 105 | 0.00% |
| Wage / Income Gap ($) | 105 | 100.00¢ per $1 |
| Gini / Inequality Index | 105 | 0.27 |
Earnings by Sex in Silver City
| Sex | Number | Average Earnings |
| Male | 18 (58.1%) | $0 |
| Female | 13 (41.9%) | $0 |
| Total | 31 (100.0%) | $0 |
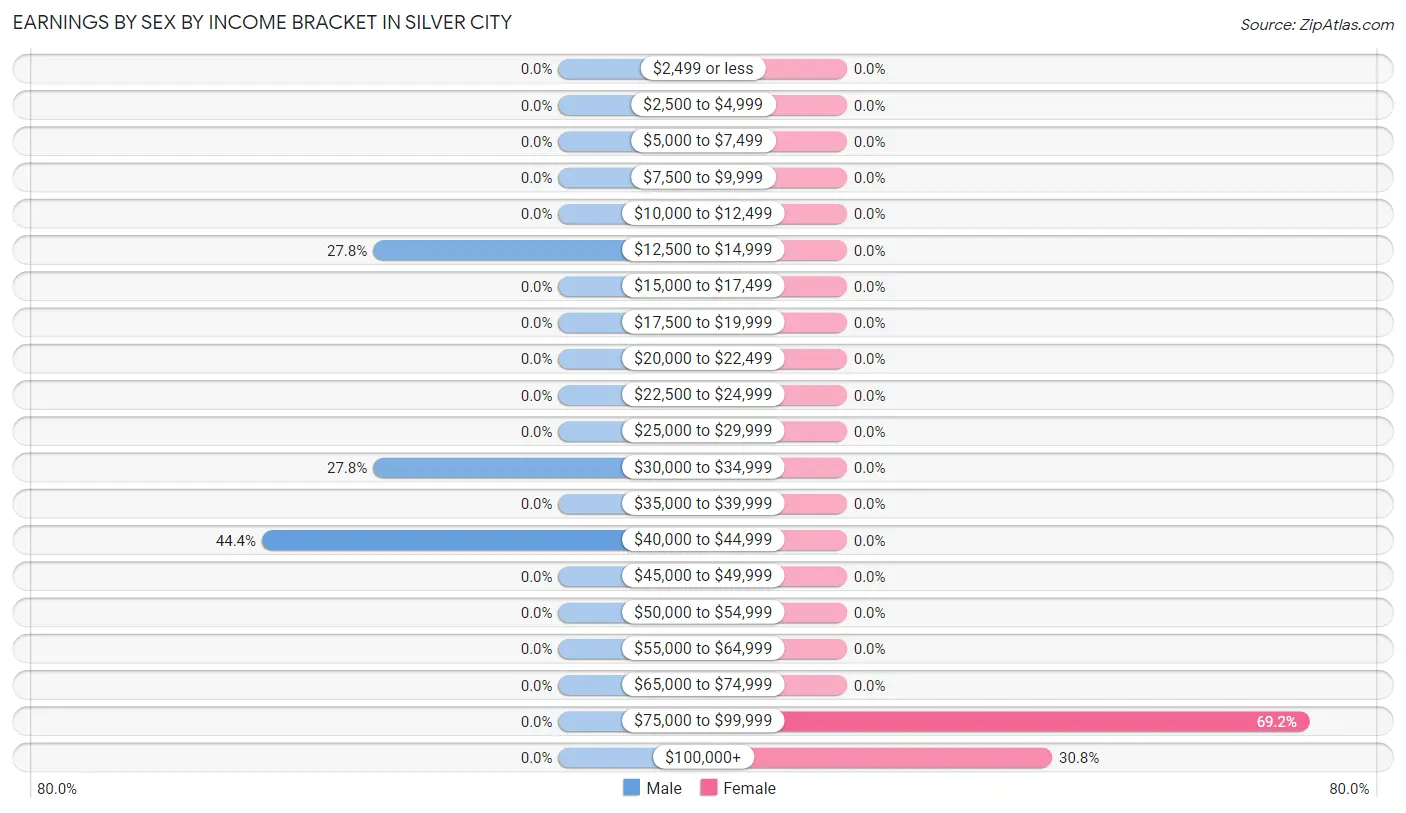
Earnings by Sex by Income Bracket in Silver City
The most common earnings brackets in Silver City are $40,000 to $44,999 for men (8 | 44.4%) and $75,000 to $99,999 for women (9 | 69.2%).
| Income | Male | Female |
| $2,499 or less | 0 (0.0%) | 0 (0.0%) |
| $2,500 to $4,999 | 0 (0.0%) | 0 (0.0%) |
| $5,000 to $7,499 | 0 (0.0%) | 0 (0.0%) |
| $7,500 to $9,999 | 0 (0.0%) | 0 (0.0%) |
| $10,000 to $12,499 | 0 (0.0%) | 0 (0.0%) |
| $12,500 to $14,999 | 5 (27.8%) | 0 (0.0%) |
| $15,000 to $17,499 | 0 (0.0%) | 0 (0.0%) |
| $17,500 to $19,999 | 0 (0.0%) | 0 (0.0%) |
| $20,000 to $22,499 | 0 (0.0%) | 0 (0.0%) |
| $22,500 to $24,999 | 0 (0.0%) | 0 (0.0%) |
| $25,000 to $29,999 | 0 (0.0%) | 0 (0.0%) |
| $30,000 to $34,999 | 5 (27.8%) | 0 (0.0%) |
| $35,000 to $39,999 | 0 (0.0%) | 0 (0.0%) |
| $40,000 to $44,999 | 8 (44.4%) | 0 (0.0%) |
| $45,000 to $49,999 | 0 (0.0%) | 0 (0.0%) |
| $50,000 to $54,999 | 0 (0.0%) | 0 (0.0%) |
| $55,000 to $64,999 | 0 (0.0%) | 0 (0.0%) |
| $65,000 to $74,999 | 0 (0.0%) | 0 (0.0%) |
| $75,000 to $99,999 | 0 (0.0%) | 9 (69.2%) |
| $100,000+ | 0 (0.0%) | 4 (30.8%) |
| Total | 18 (100.0%) | 13 (100.0%) |
Earnings by Sex by Educational Attainment in Silver City
| Educational Attainment | Male Income | Female Income |
| Less than High School | - | - |
| High School Diploma | - | - |
| College or Associate's Degree | - | - |
| Bachelor's Degree | - | - |
| Graduate Degree | - | - |
| Total | - | - |
Family Income in Silver City
Family Income Brackets in Silver City
According to the Silver City family income data, there are 19 families falling into the $75,000 to $99,999 income range, which is the most common income bracket and makes up 65.5% of all families.
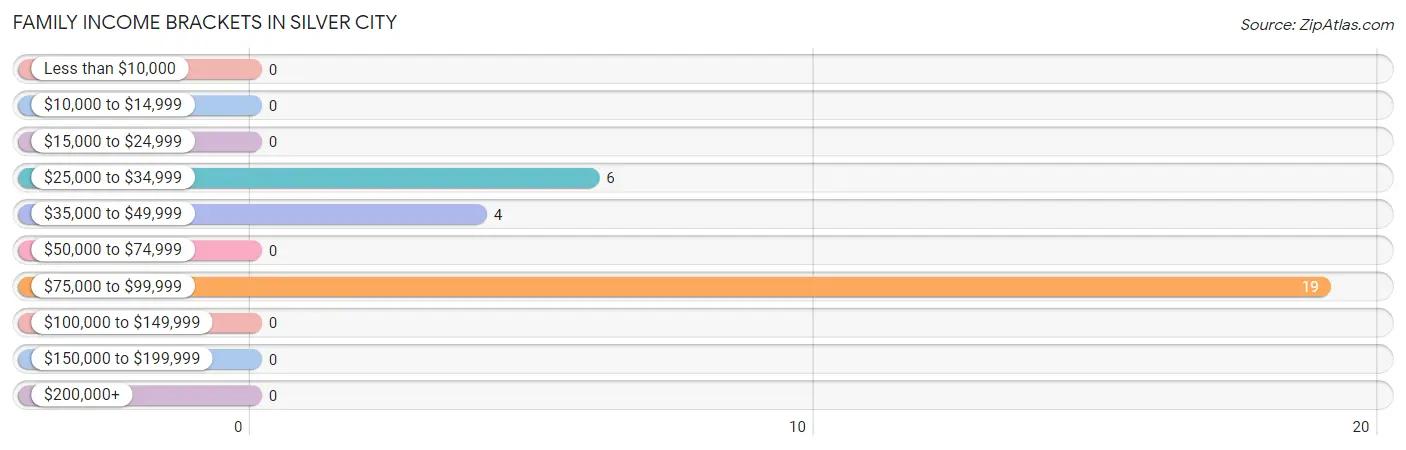
| Income Bracket | # Families | % Families |
| Less than $10,000 | 0 | 0.0% |
| $10,000 to $14,999 | 0 | 0.0% |
| $15,000 to $24,999 | 0 | 0.0% |
| $25,000 to $34,999 | 6 | 20.7% |
| $35,000 to $49,999 | 4 | 13.8% |
| $50,000 to $74,999 | 0 | 0.0% |
| $75,000 to $99,999 | 19 | 65.5% |
| $100,000 to $149,999 | 0 | 0.0% |
| $150,000 to $199,999 | 0 | 0.0% |
| $200,000+ | 0 | 0.0% |
Family Income by Famaliy Size in Silver City
2-person families (24 | 82.8%) account for the highest median family income in Silver City with $76,000 per family, while 2-person families (24 | 82.8%) have the highest median income of $38,000 per family member.
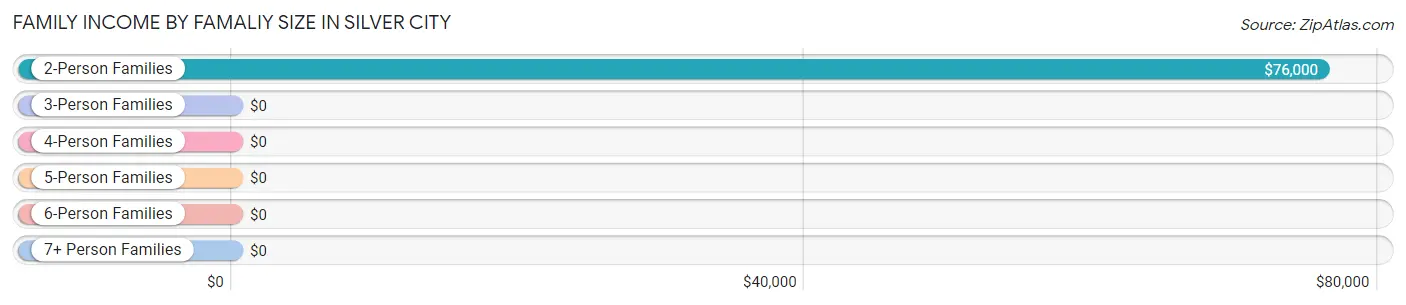
| Income Bracket | # Families | Median Income |
| 2-Person Families | 24 (82.8%) | $76,000 |
| 3-Person Families | 0 (0.0%) | $0 |
| 4-Person Families | 0 (0.0%) | $0 |
| 5-Person Families | 0 (0.0%) | $0 |
| 6-Person Families | 0 (0.0%) | $0 |
| 7+ Person Families | 5 (17.2%) | $0 |
| Total | 29 (100.0%) | $77,250 |
Family Income by Number of Earners in Silver City
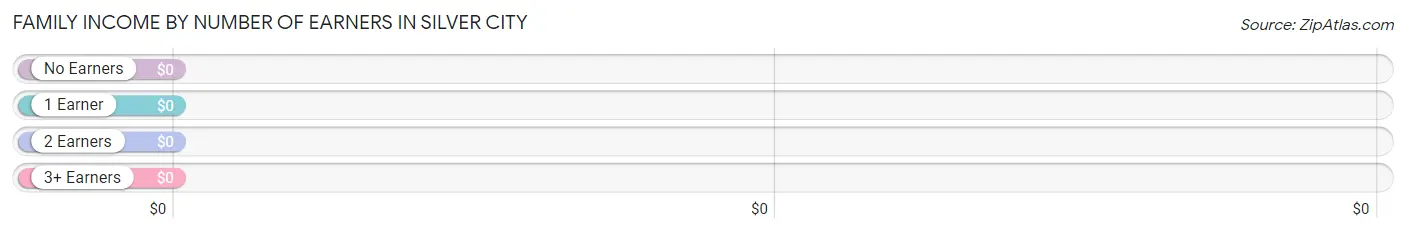
| Number of Earners | # Families | Median Income |
| No Earners | 11 (37.9%) | $0 |
| 1 Earner | 13 (44.8%) | $0 |
| 2 Earners | 5 (17.2%) | $0 |
| 3+ Earners | 0 (0.0%) | $0 |
| Total | 29 (100.0%) | $77,250 |
Household Income in Silver City
Household Income Brackets in Silver City
With 19 households falling in the category, the $75,000 to $99,999 income range is the most frequent in Silver City, accounting for 48.7% of all households.
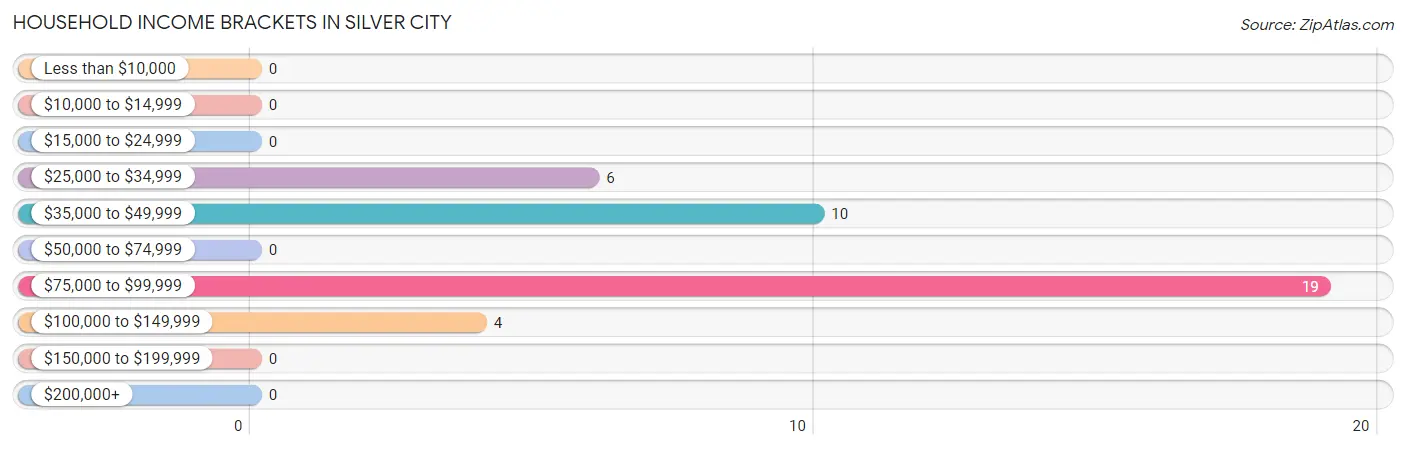
| Income Bracket | # Households | % Households |
| Less than $10,000 | 0 | 0.0% |
| $10,000 to $14,999 | 0 | 0.0% |
| $15,000 to $24,999 | 0 | 0.0% |
| $25,000 to $34,999 | 6 | 15.4% |
| $35,000 to $49,999 | 10 | 25.6% |
| $50,000 to $74,999 | 0 | 0.0% |
| $75,000 to $99,999 | 19 | 48.7% |
| $100,000 to $149,999 | 4 | 10.3% |
| $150,000 to $199,999 | 0 | 0.0% |
| $200,000+ | 0 | 0.0% |
Household Income by Householder Age in Silver City
The median household income in Silver City is $76,750, with the highest median household income of $36,875 found in the 65+ years age bracket for the primary householder. A total of 15 households (38.5%) fall into this category.
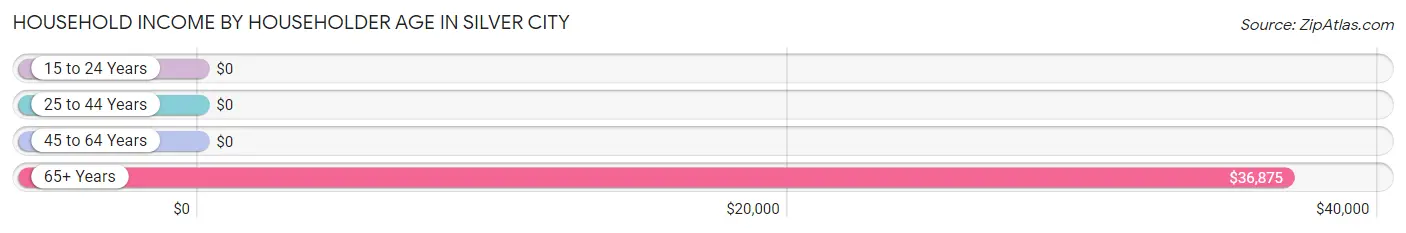
| Income Bracket | # Households | Median Income |
| 15 to 24 Years | 0 (0.0%) | $0 |
| 25 to 44 Years | 9 (23.1%) | $0 |
| 45 to 64 Years | 15 (38.5%) | $0 |
| 65+ Years | 15 (38.5%) | $36,875 |
| Total | 39 (100.0%) | $76,750 |
Poverty in Silver City
Income Below Poverty by Sex and Age in Silver City
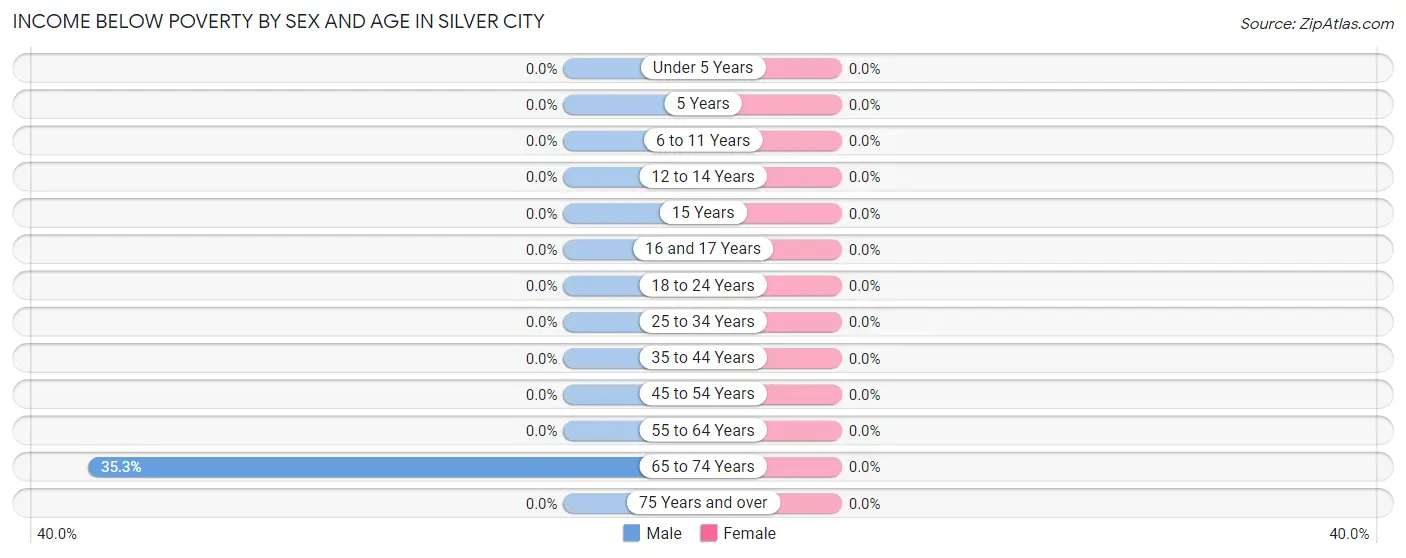
| Age Bracket | Male | Female |
| Under 5 Years | 0 (0.0%) | 0 (0.0%) |
| 5 Years | 0 (0.0%) | 0 (0.0%) |
| 6 to 11 Years | 0 (0.0%) | 0 (0.0%) |
| 12 to 14 Years | 0 (0.0%) | 0 (0.0%) |
| 15 Years | 0 (0.0%) | 0 (0.0%) |
| 16 and 17 Years | 0 (0.0%) | 0 (0.0%) |
| 18 to 24 Years | 0 (0.0%) | 0 (0.0%) |
| 25 to 34 Years | 0 (0.0%) | 0 (0.0%) |
| 35 to 44 Years | 0 (0.0%) | 0 (0.0%) |
| 45 to 54 Years | 0 (0.0%) | 0 (0.0%) |
| 55 to 64 Years | 0 (0.0%) | 0 (0.0%) |
| 65 to 74 Years | 6 (35.3%) | 0 (0.0%) |
| 75 Years and over | 0 (0.0%) | 0 (0.0%) |
| Total | 6 (10.5%) | 0 (0.0%) |
Income Above Poverty by Sex and Age in Silver City
According to the poverty statistics in Silver City, males aged 6 to 11 years and females aged 6 to 11 years are the age groups that are most secure financially, with 100.0% of males and 100.0% of females in these age groups living above the poverty line.
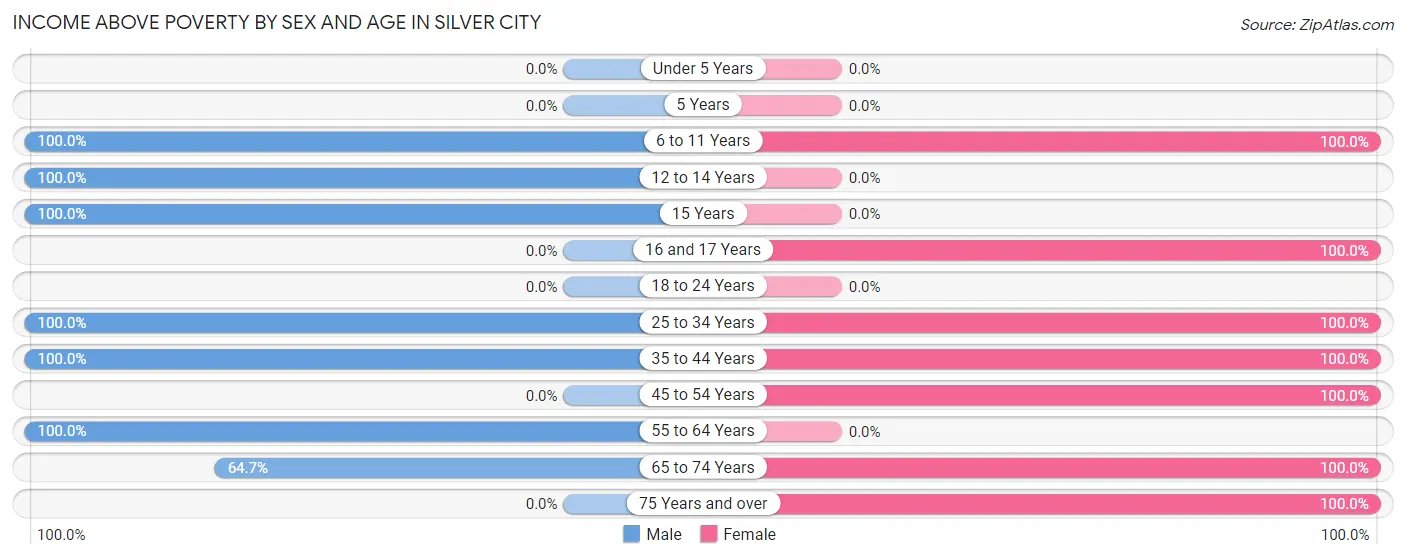
| Age Bracket | Male | Female |
| Under 5 Years | 0 (0.0%) | 0 (0.0%) |
| 5 Years | 0 (0.0%) | 0 (0.0%) |
| 6 to 11 Years | 8 (100.0%) | 14 (100.0%) |
| 12 to 14 Years | 4 (100.0%) | 0 (0.0%) |
| 15 Years | 4 (100.0%) | 0 (0.0%) |
| 16 and 17 Years | 0 (0.0%) | 8 (100.0%) |
| 18 to 24 Years | 0 (0.0%) | 0 (0.0%) |
| 25 to 34 Years | 8 (100.0%) | 5 (100.0%) |
| 35 to 44 Years | 10 (100.0%) | 4 (100.0%) |
| 45 to 54 Years | 0 (0.0%) | 9 (100.0%) |
| 55 to 64 Years | 6 (100.0%) | 0 (0.0%) |
| 65 to 74 Years | 11 (64.7%) | 4 (100.0%) |
| 75 Years and over | 0 (0.0%) | 4 (100.0%) |
| Total | 51 (89.5%) | 48 (100.0%) |
Income Below Poverty Among Married-Couple Families in Silver City
| Children | Above Poverty | Below Poverty |
| No Children | 5 (100.0%) | 0 (0.0%) |
| 1 or 2 Children | 0 (0.0%) | 0 (0.0%) |
| 3 or 4 Children | 0 (0.0%) | 0 (0.0%) |
| 5 or more Children | 5 (100.0%) | 0 (0.0%) |
| Total | 10 (100.0%) | 0 (0.0%) |
Income Below Poverty Among Single-Parent Households in Silver City
| Children | Single Father | Single Mother |
| No Children | 0 (0.0%) | 0 (0.0%) |
| 1 or 2 Children | 0 (0.0%) | 0 (0.0%) |
| 3 or 4 Children | 0 (0.0%) | 0 (0.0%) |
| 5 or more Children | 0 (0.0%) | 0 (0.0%) |
| Total | 0 (0.0%) | 0 (0.0%) |
Income Below Poverty Among Married-Couple vs Single-Parent Households in Silver City
| Children | Married-Couple Families | Single-Parent Households |
| No Children | 0 (0.0%) | 0 (0.0%) |
| 1 or 2 Children | 0 (0.0%) | 0 (0.0%) |
| 3 or 4 Children | 0 (0.0%) | 0 (0.0%) |
| 5 or more Children | 0 (0.0%) | 0 (0.0%) |
| Total | 0 (0.0%) | 0 (0.0%) |
Race in Silver City
The most populous races in Silver City are White / Caucasian (105 | 100.0%), and Hispanic or Latino (8 | 7.6%).
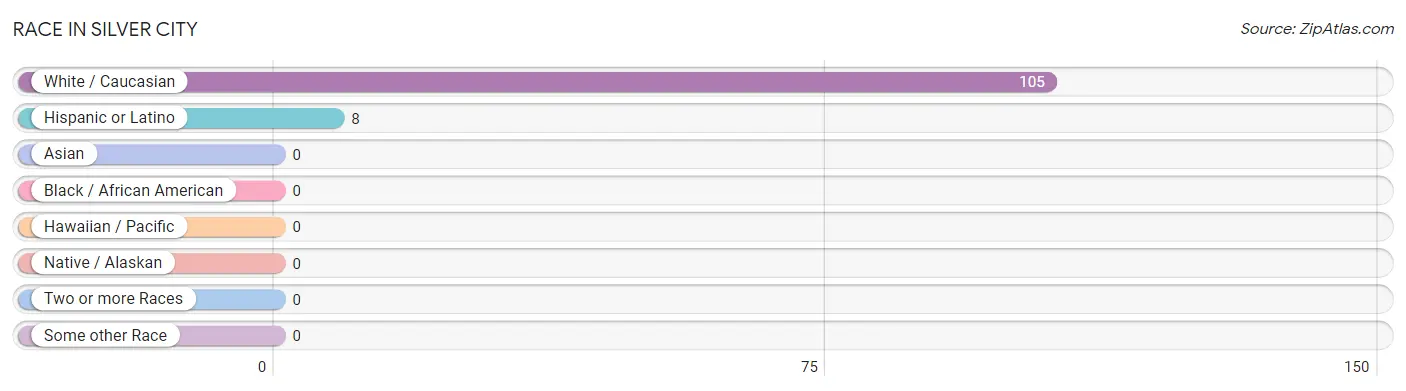
| Race | # Population | % Population |
| Asian | 0 | 0.0% |
| Black / African American | 0 | 0.0% |
| Hawaiian / Pacific | 0 | 0.0% |
| Hispanic or Latino | 8 | 7.6% |
| Native / Alaskan | 0 | 0.0% |
| White / Caucasian | 105 | 100.0% |
| Two or more Races | 0 | 0.0% |
| Some other Race | 0 | 0.0% |
| Total | 105 | 100.0% |
Ancestry in Silver City
The most populous ancestries reported in Silver City are German (25 | 23.8%), European (17 | 16.2%), Scottish (13 | 12.4%), English (10 | 9.5%), and Welsh (10 | 9.5%), together accounting for 71.4% of all Silver City residents.
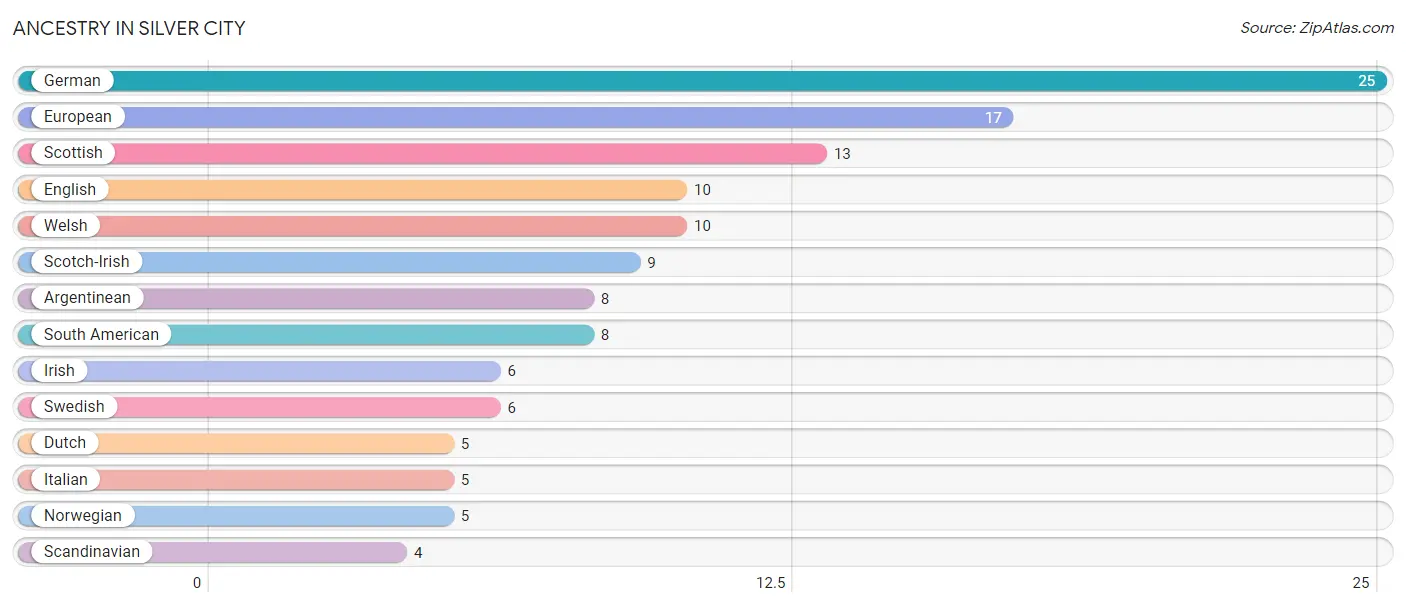
| Ancestry | # Population | % Population |
| Argentinean | 8 | 7.6% |
| Dutch | 5 | 4.8% |
| English | 10 | 9.5% |
| European | 17 | 16.2% |
| German | 25 | 23.8% |
| Irish | 6 | 5.7% |
| Italian | 5 | 4.8% |
| Norwegian | 5 | 4.8% |
| Scandinavian | 4 | 3.8% |
| Scotch-Irish | 9 | 8.6% |
| Scottish | 13 | 12.4% |
| South American | 8 | 7.6% |
| Swedish | 6 | 5.7% |
| Welsh | 10 | 9.5% | View All 14 Rows |
Immigrants in Silver City

| Immigration Origin | # Population | % Population | View All 0 Rows |
Sex and Age in Silver City
Sex and Age in Silver City
The most populous age groups in Silver City are 70 to 74 Years (17 | 29.8%) for men and 10 to 14 Years (9 | 18.8%) for women.
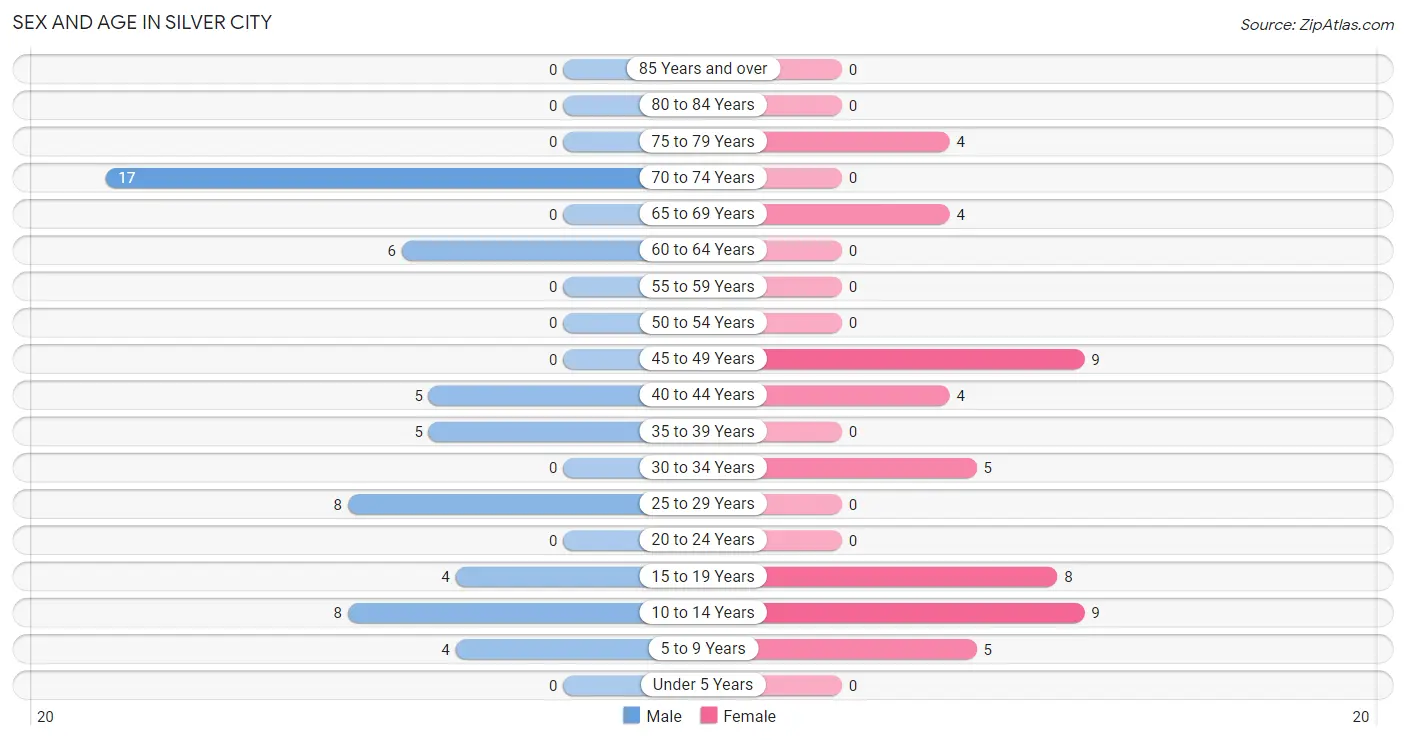
| Age Bracket | Male | Female |
| Under 5 Years | 0 (0.0%) | 0 (0.0%) |
| 5 to 9 Years | 4 (7.0%) | 5 (10.4%) |
| 10 to 14 Years | 8 (14.0%) | 9 (18.8%) |
| 15 to 19 Years | 4 (7.0%) | 8 (16.7%) |
| 20 to 24 Years | 0 (0.0%) | 0 (0.0%) |
| 25 to 29 Years | 8 (14.0%) | 0 (0.0%) |
| 30 to 34 Years | 0 (0.0%) | 5 (10.4%) |
| 35 to 39 Years | 5 (8.8%) | 0 (0.0%) |
| 40 to 44 Years | 5 (8.8%) | 4 (8.3%) |
| 45 to 49 Years | 0 (0.0%) | 9 (18.8%) |
| 50 to 54 Years | 0 (0.0%) | 0 (0.0%) |
| 55 to 59 Years | 0 (0.0%) | 0 (0.0%) |
| 60 to 64 Years | 6 (10.5%) | 0 (0.0%) |
| 65 to 69 Years | 0 (0.0%) | 4 (8.3%) |
| 70 to 74 Years | 17 (29.8%) | 0 (0.0%) |
| 75 to 79 Years | 0 (0.0%) | 4 (8.3%) |
| 80 to 84 Years | 0 (0.0%) | 0 (0.0%) |
| 85 Years and over | 0 (0.0%) | 0 (0.0%) |
| Total | 57 (100.0%) | 48 (100.0%) |
Families and Households in Silver City
Median Family Size in Silver City
The median family size in Silver City is 3.07 persons per family, with married-couple families (10 | 34.5%) accounting for the largest median family size of 5.2 persons per family. On the other hand, single male/father families (6 | 20.7%) represent the smallest median family size with 1.83 persons per family.
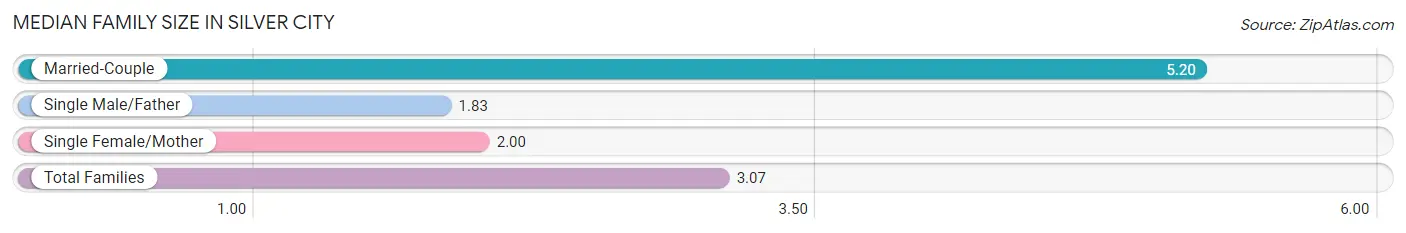
| Family Type | # Families | Family Size |
| Married-Couple | 10 (34.5%) | 5.20 |
| Single Male/Father | 6 (20.7%) | 1.83 |
| Single Female/Mother | 13 (44.8%) | 2.00 |
| Total Families | 29 (100.0%) | 3.07 |
Median Household Size in Silver City
The median household size in Silver City is 2.69 persons per household, with married-couple households (10 | 25.6%) accounting for the largest median household size of 5.2 persons per household. non-family households (10 | 25.6%) represent the smallest median household size with 1.60 persons per household.
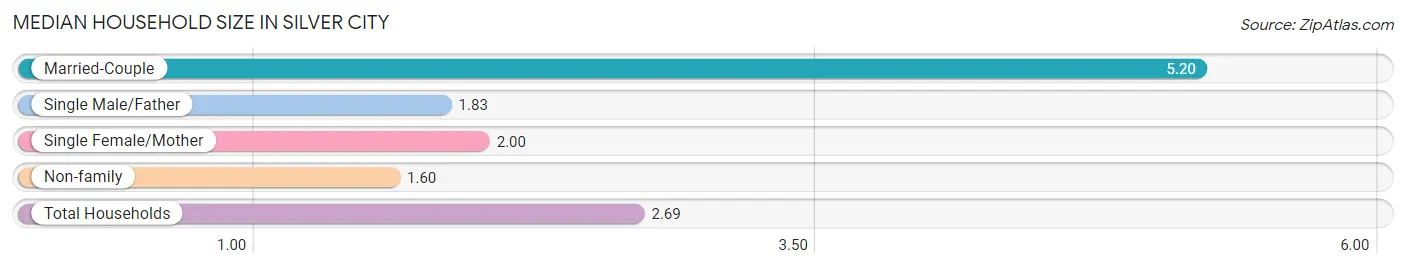
| Household Type | # Households | Household Size |
| Married-Couple | 10 (25.6%) | 5.20 |
| Single Male/Father | 6 (15.4%) | 1.83 |
| Single Female/Mother | 13 (33.3%) | 2.00 |
| Non-family | 10 (25.6%) | 1.60 |
| Total Households | 39 (100.0%) | 2.69 |
Household Size by Marriage Status in Silver City
Out of a total of 39 households in Silver City, 29 (74.4%) are family households, while 10 (25.6%) are nonfamily households. The most numerous type of family households are 2-person households, comprising 24, and the most common type of nonfamily households are 2-person households, comprising 6.
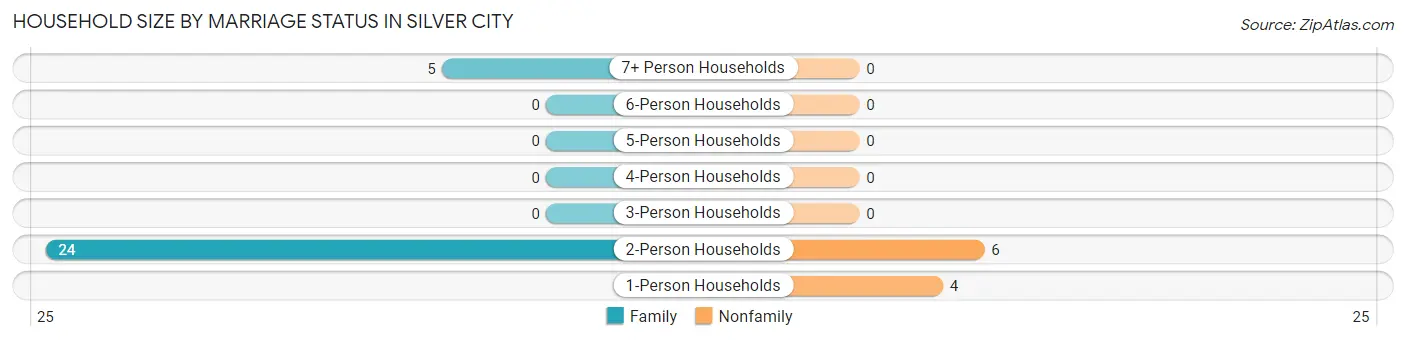
| Household Size | Family Households | Nonfamily Households |
| 1-Person Households | - | 4 (10.3%) |
| 2-Person Households | 24 (61.5%) | 6 (15.4%) |
| 3-Person Households | 0 (0.0%) | 0 (0.0%) |
| 4-Person Households | 0 (0.0%) | 0 (0.0%) |
| 5-Person Households | 0 (0.0%) | 0 (0.0%) |
| 6-Person Households | 0 (0.0%) | 0 (0.0%) |
| 7+ Person Households | 5 (12.8%) | 0 (0.0%) |
| Total | 29 (74.4%) | 10 (25.6%) |
Female Fertility in Silver City
Fertility by Age in Silver City
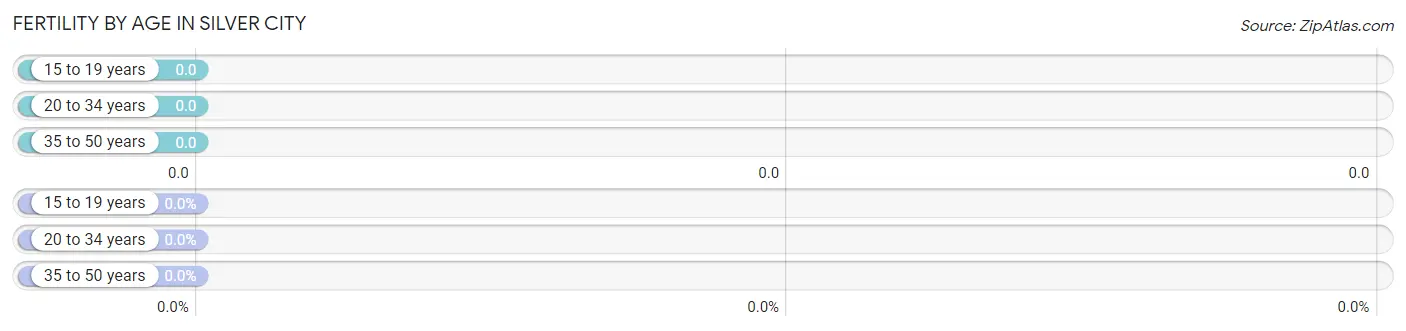
| Age Bracket | Women with Births | Births / 1,000 Women |
| 15 to 19 years | 0 (0.0%) | 0.0 |
| 20 to 34 years | 0 (0.0%) | 0.0 |
| 35 to 50 years | 0 (0.0%) | 0.0 |
| Total | 0 (0.0%) | 0.0 |
Fertility by Age by Marriage Status in Silver City
| Age Bracket | Married | Unmarried |
| 15 to 19 years | 0 (0.0%) | 0 (0.0%) |
| 20 to 34 years | 0 (0.0%) | 0 (0.0%) |
| 35 to 50 years | 0 (0.0%) | 0 (0.0%) |
| Total | 0 (0.0%) | 0 (0.0%) |
Fertility by Education in Silver City
| Educational Attainment | Women with Births | Births / 1,000 Women |
| Less than High School | 0 (0.0%) | 0.0 |
| High School Diploma | 0 (0.0%) | 0.0 |
| College or Associate's Degree | 0 (0.0%) | 0.0 |
| Bachelor's Degree | 0 (0.0%) | 0.0 |
| Graduate Degree | 0 (0.0%) | 0.0 |
| Total | 0 (0.0%) | 0.0 |
Fertility by Education by Marriage Status in Silver City
| Educational Attainment | Married | Unmarried |
| Less than High School | 0 (0.0%) | 0 (0.0%) |
| High School Diploma | 0 (0.0%) | 0 (0.0%) |
| College or Associate's Degree | 0 (0.0%) | 0 (0.0%) |
| Bachelor's Degree | 0 (0.0%) | 0 (0.0%) |
| Graduate Degree | 0 (0.0%) | 0 (0.0%) |
| Total | 0 (0.0%) | 0 (0.0%) |
Employment Characteristics in Silver City
Employment by Class of Employer in Silver City
Among the 35 employed individuals in Silver City, private company employees (17 | 48.6%), federal government employees (9 | 25.7%), and unpaid family workers (9 | 25.7%) make up the most common classes of employment.
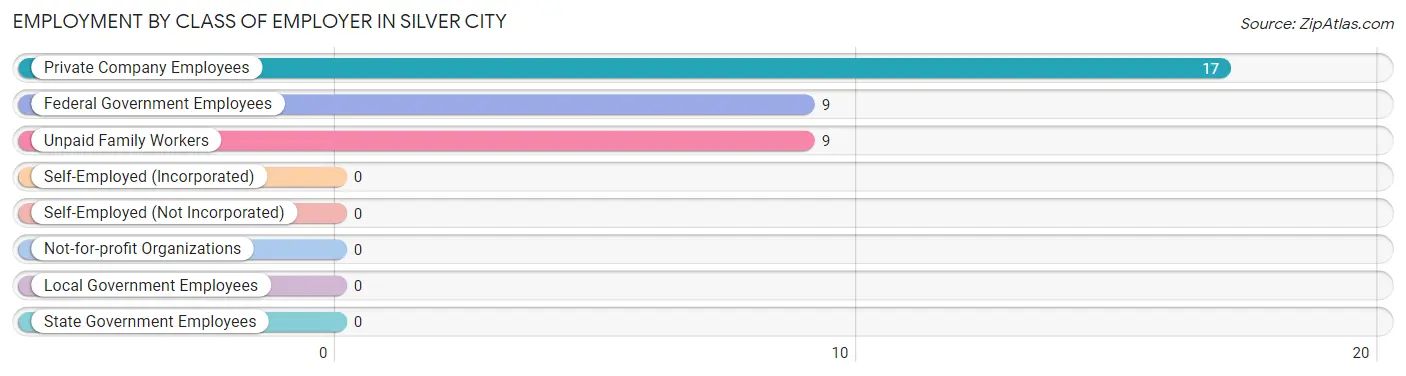
| Employer Class | # Employees | % Employees |
| Private Company Employees | 17 | 48.6% |
| Self-Employed (Incorporated) | 0 | 0.0% |
| Self-Employed (Not Incorporated) | 0 | 0.0% |
| Not-for-profit Organizations | 0 | 0.0% |
| Local Government Employees | 0 | 0.0% |
| State Government Employees | 0 | 0.0% |
| Federal Government Employees | 9 | 25.7% |
| Unpaid Family Workers | 9 | 25.7% |
| Total | 35 | 100.0% |
Employment Status by Age in Silver City
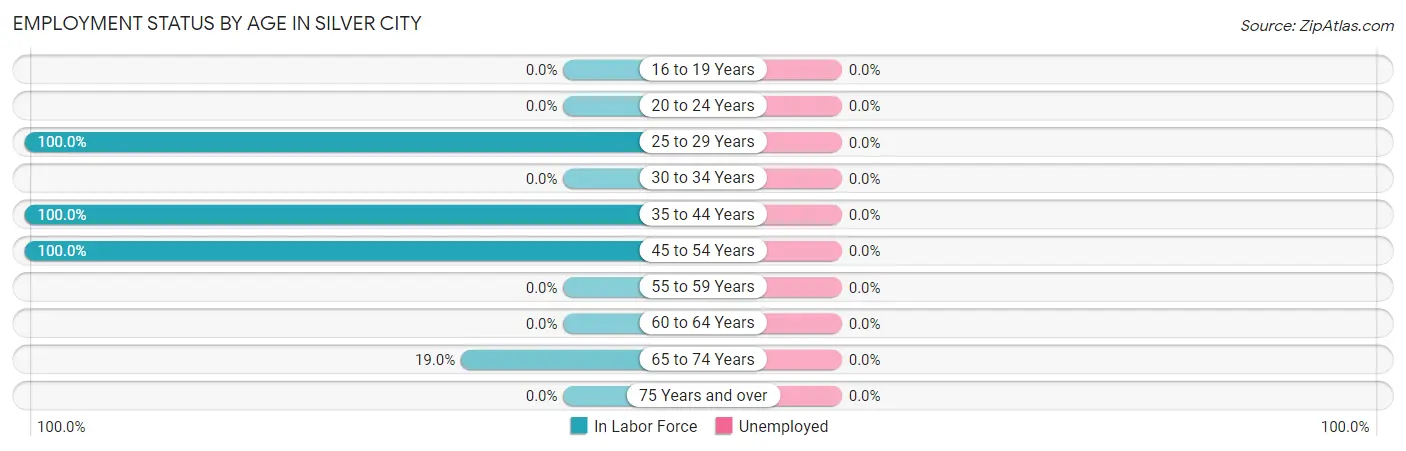
| Age Bracket | In Labor Force | Unemployed |
| 16 to 19 Years | 0 (0.0%) | 0 (0.0%) |
| 20 to 24 Years | 0 (0.0%) | 0 (0.0%) |
| 25 to 29 Years | 8 (100.0%) | 0 (0.0%) |
| 30 to 34 Years | 0 (0.0%) | 0 (0.0%) |
| 35 to 44 Years | 14 (100.0%) | 0 (0.0%) |
| 45 to 54 Years | 9 (100.0%) | 0 (0.0%) |
| 55 to 59 Years | 0 (0.0%) | 0 (0.0%) |
| 60 to 64 Years | 0 (0.0%) | 0 (0.0%) |
| 65 to 74 Years | 4 (19.0%) | 0 (0.0%) |
| 75 Years and over | 0 (0.0%) | 0 (0.0%) |
| Total | 35 (46.7%) | 0 (0.0%) |
Employment Status by Educational Attainment in Silver City
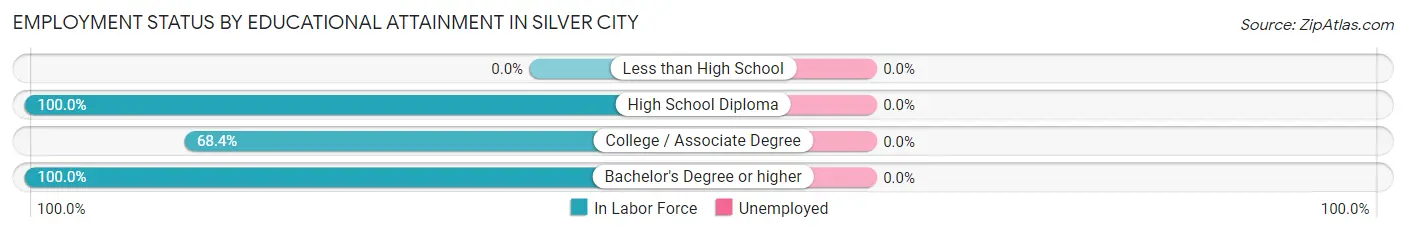
| Educational Attainment | In Labor Force | Unemployed |
| Less than High School | 0 (0.0%) | 0 (0.0%) |
| High School Diploma | 5 (100.0%) | 0 (0.0%) |
| College / Associate Degree | 13 (68.4%) | 0 (0.0%) |
| Bachelor's Degree or higher | 13 (100.0%) | 0 (0.0%) |
| Total | 31 (73.8%) | 0 (0.0%) |
Employment Occupations by Sex in Silver City
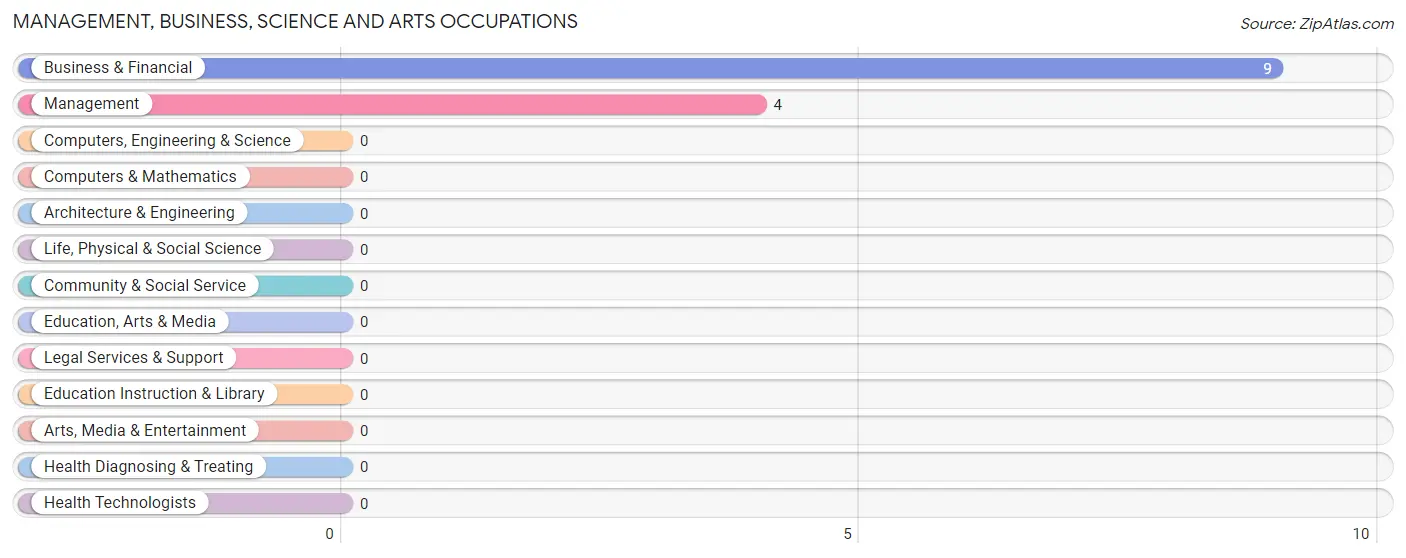
Management, Business, Science and Arts Occupations
The most common Management, Business, Science and Arts occupations in Silver City are Business & Financial (9 | 25.7%), and Management (4 | 11.4%).
Management, Business, Science and Arts Occupations by Sex
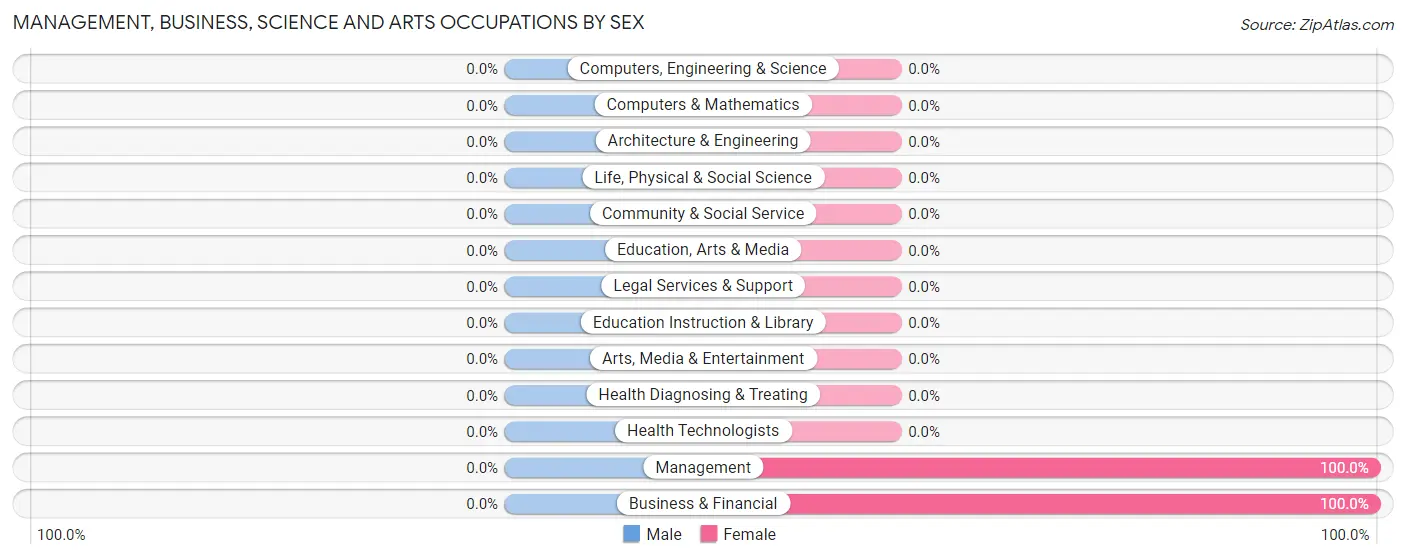
| Occupation | Male | Female |
| Management | 0 (0.0%) | 4 (100.0%) |
| Business & Financial | 0 (0.0%) | 9 (100.0%) |
| Computers, Engineering & Science | 0 (0.0%) | 0 (0.0%) |
| Computers & Mathematics | 0 (0.0%) | 0 (0.0%) |
| Architecture & Engineering | 0 (0.0%) | 0 (0.0%) |
| Life, Physical & Social Science | 0 (0.0%) | 0 (0.0%) |
| Community & Social Service | 0 (0.0%) | 0 (0.0%) |
| Education, Arts & Media | 0 (0.0%) | 0 (0.0%) |
| Legal Services & Support | 0 (0.0%) | 0 (0.0%) |
| Education Instruction & Library | 0 (0.0%) | 0 (0.0%) |
| Arts, Media & Entertainment | 0 (0.0%) | 0 (0.0%) |
| Health Diagnosing & Treating | 0 (0.0%) | 0 (0.0%) |
| Health Technologists | 0 (0.0%) | 0 (0.0%) |
| Total (Category) | 0 (0.0%) | 13 (100.0%) |
| Total (Overall) | 18 (51.4%) | 17 (48.6%) |
Services Occupations
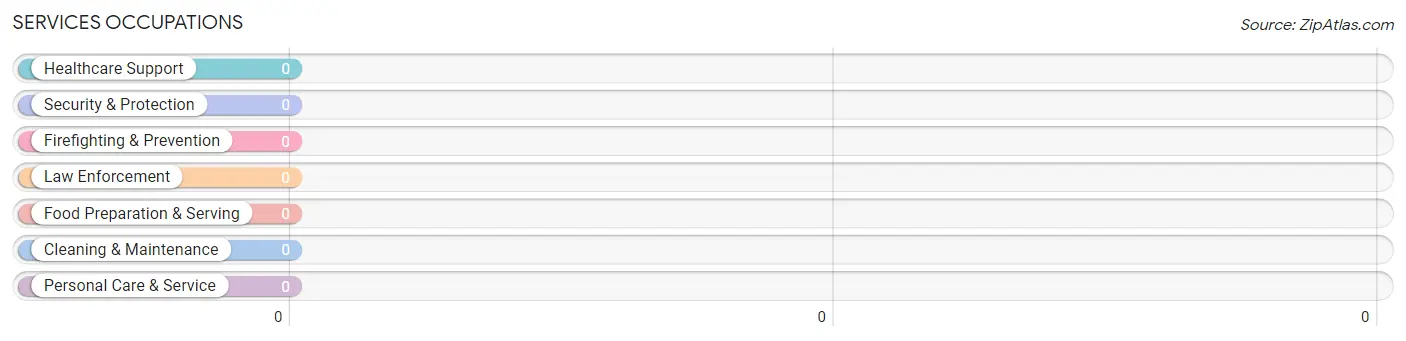
Services Occupations by Sex
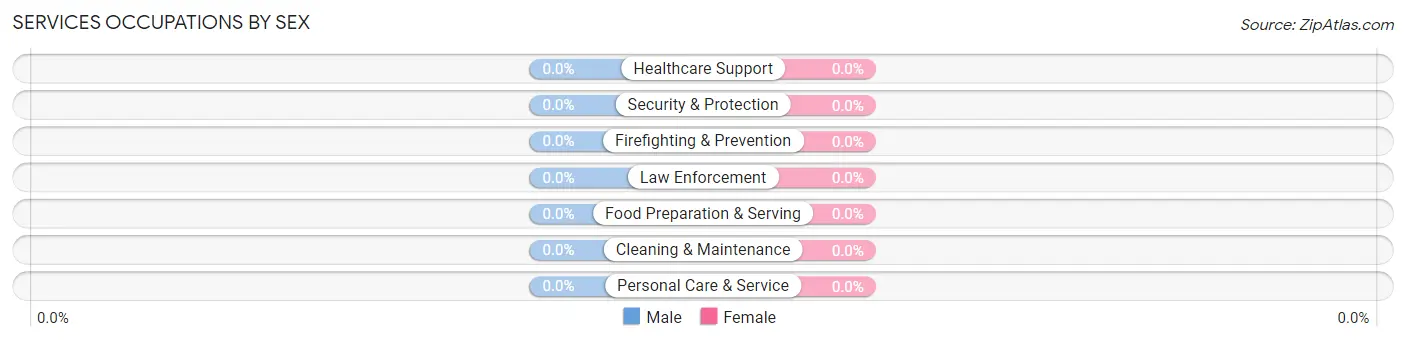
| Occupation | Male | Female |
| Healthcare Support | 0 (0.0%) | 0 (0.0%) |
| Security & Protection | 0 (0.0%) | 0 (0.0%) |
| Firefighting & Prevention | 0 (0.0%) | 0 (0.0%) |
| Law Enforcement | 0 (0.0%) | 0 (0.0%) |
| Food Preparation & Serving | 0 (0.0%) | 0 (0.0%) |
| Cleaning & Maintenance | 0 (0.0%) | 0 (0.0%) |
| Personal Care & Service | 0 (0.0%) | 0 (0.0%) |
| Total (Category) | 0 (0.0%) | 0 (0.0%) |
| Total (Overall) | 18 (51.4%) | 17 (48.6%) |
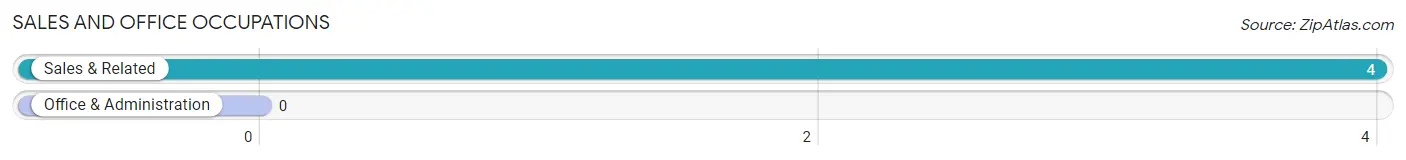
Sales and Office Occupations
The most common Sales and Office occupations in Silver City are , and Sales & Related (4 | 11.4%).
Sales and Office Occupations by Sex
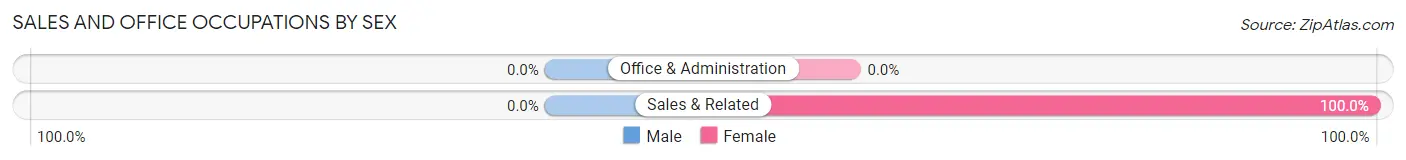
| Occupation | Male | Female |
| Sales & Related | 0 (0.0%) | 4 (100.0%) |
| Office & Administration | 0 (0.0%) | 0 (0.0%) |
| Total (Category) | 0 (0.0%) | 4 (100.0%) |
| Total (Overall) | 18 (51.4%) | 17 (48.6%) |
Natural Resources, Construction and Maintenance Occupations
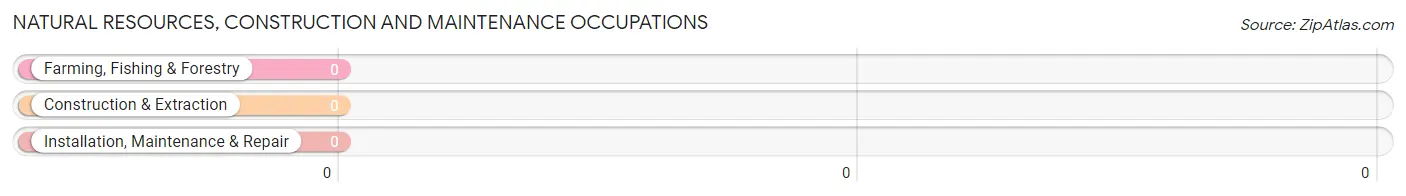
Natural Resources, Construction and Maintenance Occupations by Sex
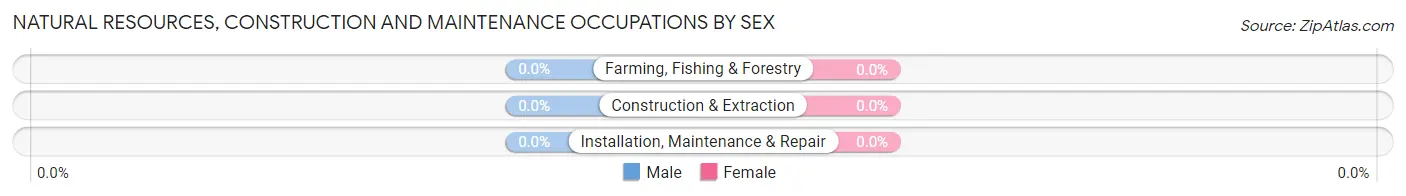
| Occupation | Male | Female |
| Farming, Fishing & Forestry | 0 (0.0%) | 0 (0.0%) |
| Construction & Extraction | 0 (0.0%) | 0 (0.0%) |
| Installation, Maintenance & Repair | 0 (0.0%) | 0 (0.0%) |
| Total (Category) | 0 (0.0%) | 0 (0.0%) |
| Total (Overall) | 18 (51.4%) | 17 (48.6%) |
Production, Transportation and Moving Occupations
The most common Production, Transportation and Moving occupations in Silver City are , and Production (18 | 51.4%).
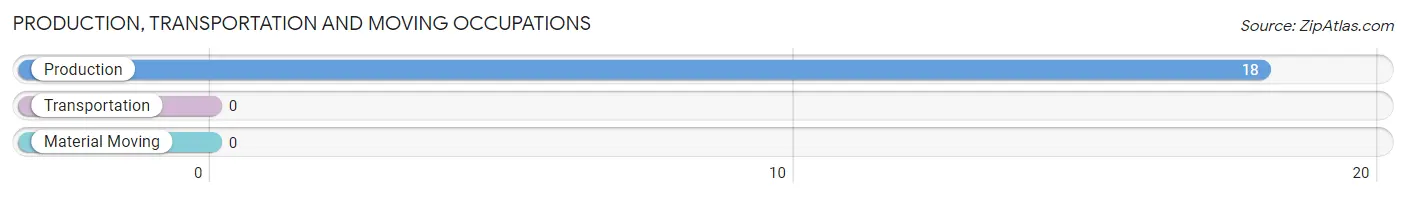
Production, Transportation and Moving Occupations by Sex
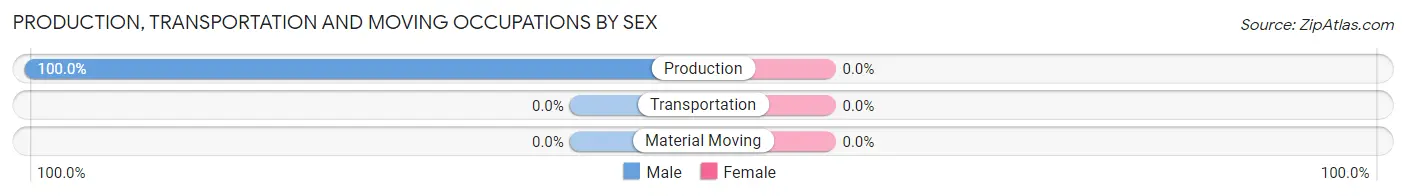
| Occupation | Male | Female |
| Production | 18 (100.0%) | 0 (0.0%) |
| Transportation | 0 (0.0%) | 0 (0.0%) |
| Material Moving | 0 (0.0%) | 0 (0.0%) |
| Total (Category) | 18 (100.0%) | 0 (0.0%) |
| Total (Overall) | 18 (51.4%) | 17 (48.6%) |
Employment Industries by Sex in Silver City
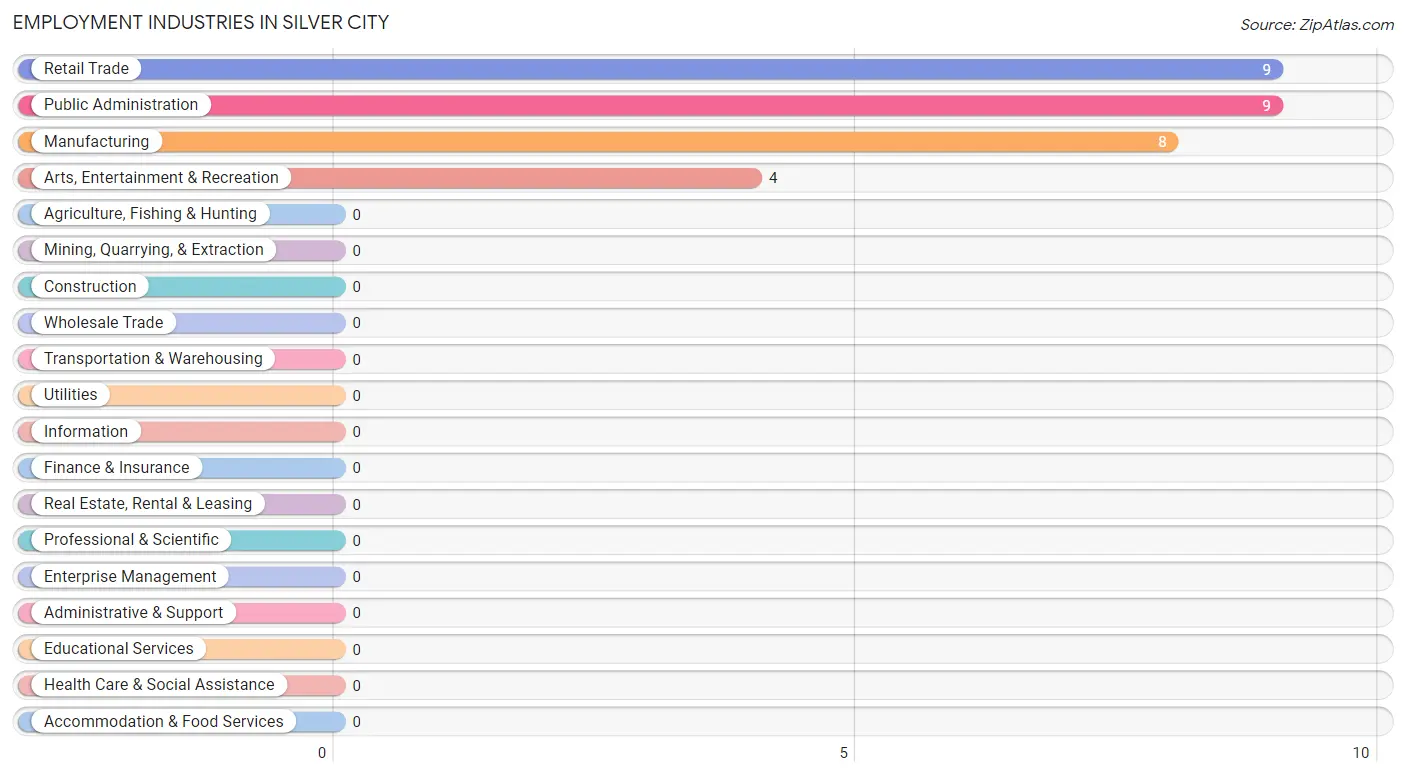
Employment Industries in Silver City
The major employment industries in Silver City include Retail Trade (9 | 25.7%), Public Administration (9 | 25.7%), Manufacturing (8 | 22.9%), and Arts, Entertainment & Recreation (4 | 11.4%).
Employment Industries by Sex in Silver City
The Silver City industries that see more men than women are Manufacturing (100.0%), and Retail Trade (55.6%), whereas the industries that tend to have a higher number of women are Arts, Entertainment & Recreation (100.0%), Public Administration (100.0%), and Retail Trade (44.4%).
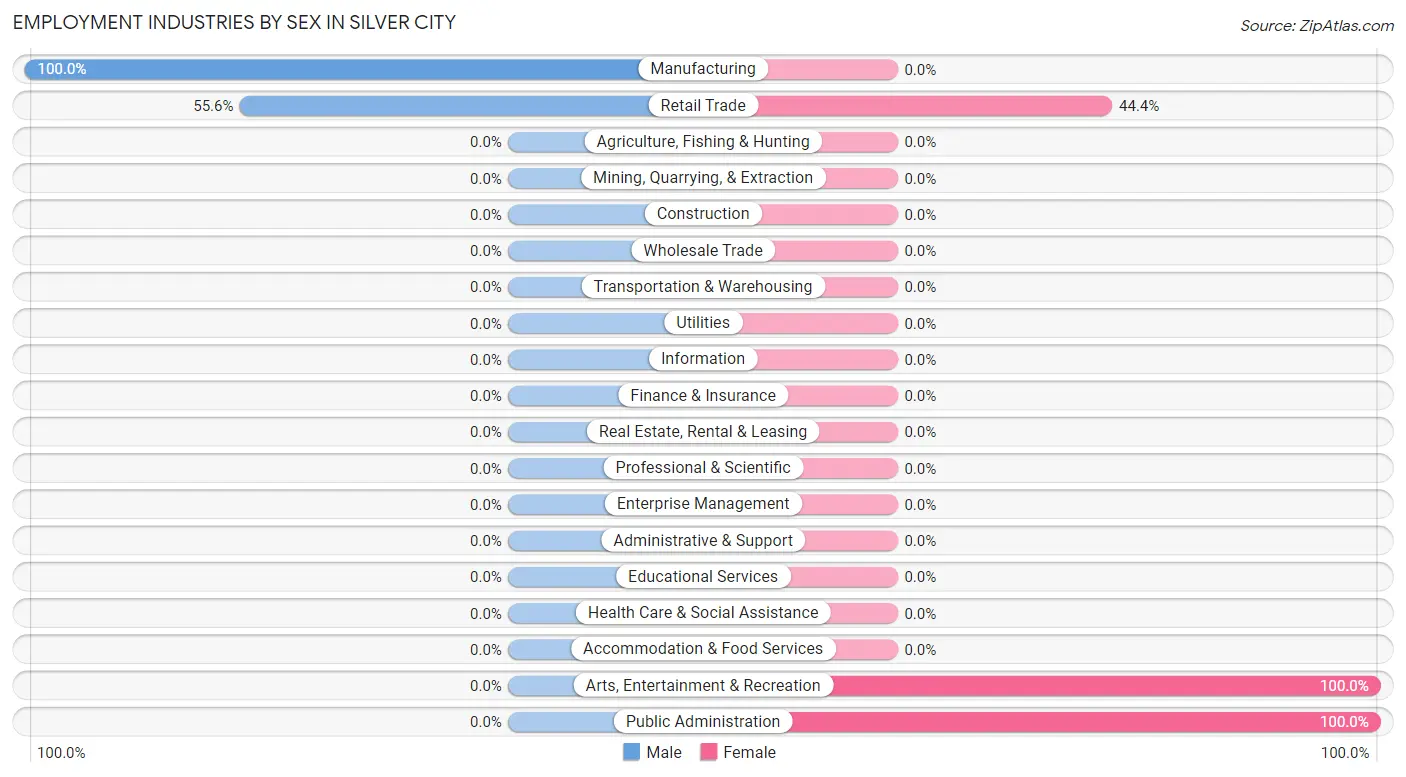
| Industry | Male | Female |
| Agriculture, Fishing & Hunting | 0 (0.0%) | 0 (0.0%) |
| Mining, Quarrying, & Extraction | 0 (0.0%) | 0 (0.0%) |
| Construction | 0 (0.0%) | 0 (0.0%) |
| Manufacturing | 8 (100.0%) | 0 (0.0%) |
| Wholesale Trade | 0 (0.0%) | 0 (0.0%) |
| Retail Trade | 5 (55.6%) | 4 (44.4%) |
| Transportation & Warehousing | 0 (0.0%) | 0 (0.0%) |
| Utilities | 0 (0.0%) | 0 (0.0%) |
| Information | 0 (0.0%) | 0 (0.0%) |
| Finance & Insurance | 0 (0.0%) | 0 (0.0%) |
| Real Estate, Rental & Leasing | 0 (0.0%) | 0 (0.0%) |
| Professional & Scientific | 0 (0.0%) | 0 (0.0%) |
| Enterprise Management | 0 (0.0%) | 0 (0.0%) |
| Administrative & Support | 0 (0.0%) | 0 (0.0%) |
| Educational Services | 0 (0.0%) | 0 (0.0%) |
| Health Care & Social Assistance | 0 (0.0%) | 0 (0.0%) |
| Arts, Entertainment & Recreation | 0 (0.0%) | 4 (100.0%) |
| Accommodation & Food Services | 0 (0.0%) | 0 (0.0%) |
| Public Administration | 0 (0.0%) | 9 (100.0%) |
| Total | 18 (51.4%) | 17 (48.6%) |
Education in Silver City
School Enrollment in Silver City
The most common levels of schooling among the 42 students in Silver City are middle school (17 | 40.5%), high school (12 | 28.6%), and elementary school (9 | 21.4%).
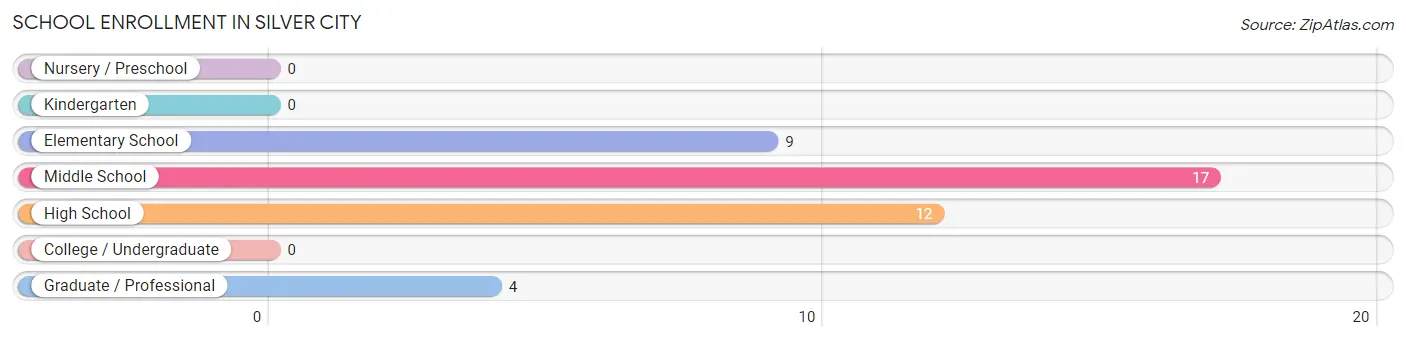
| School Level | # Students | % Students |
| Nursery / Preschool | 0 | 0.0% |
| Kindergarten | 0 | 0.0% |
| Elementary School | 9 | 21.4% |
| Middle School | 17 | 40.5% |
| High School | 12 | 28.6% |
| College / Undergraduate | 0 | 0.0% |
| Graduate / Professional | 4 | 9.5% |
| Total | 42 | 100.0% |
School Enrollment by Age by Funding Source in Silver City
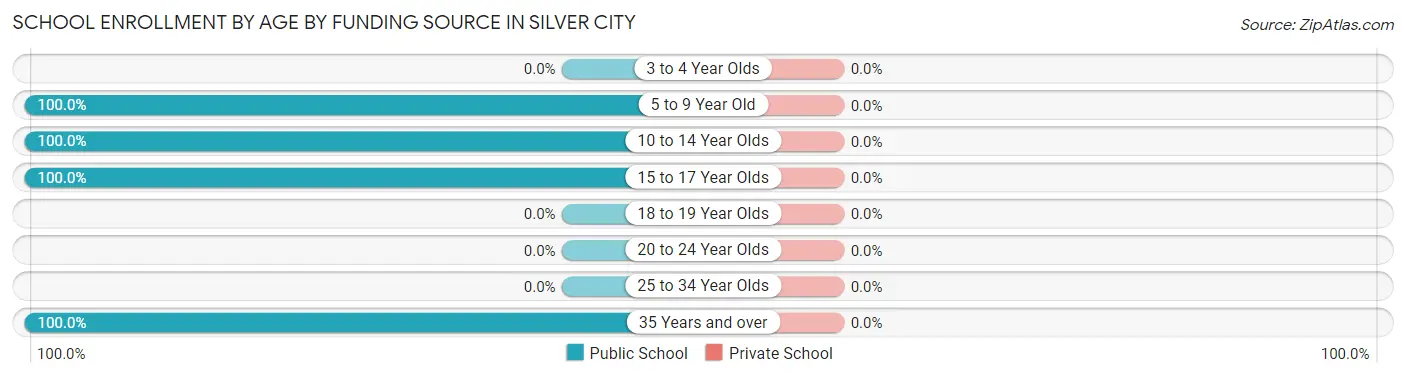
| Age Bracket | Public School | Private School |
| 3 to 4 Year Olds | 0 (0.0%) | 0 (0.0%) |
| 5 to 9 Year Old | 9 (100.0%) | 0 (0.0%) |
| 10 to 14 Year Olds | 17 (100.0%) | 0 (0.0%) |
| 15 to 17 Year Olds | 12 (100.0%) | 0 (0.0%) |
| 18 to 19 Year Olds | 0 (0.0%) | 0 (0.0%) |
| 20 to 24 Year Olds | 0 (0.0%) | 0 (0.0%) |
| 25 to 34 Year Olds | 0 (0.0%) | 0 (0.0%) |
| 35 Years and over | 4 (100.0%) | 0 (0.0%) |
| Total | 42 (100.0%) | 0 (0.0%) |
Educational Attainment by Field of Study in Silver City
Business (13 | 68.4%), and physical & health sciences (6 | 31.6%) are the most common fields of study among 19 individuals in Silver City who have obtained a bachelor's degree or higher.
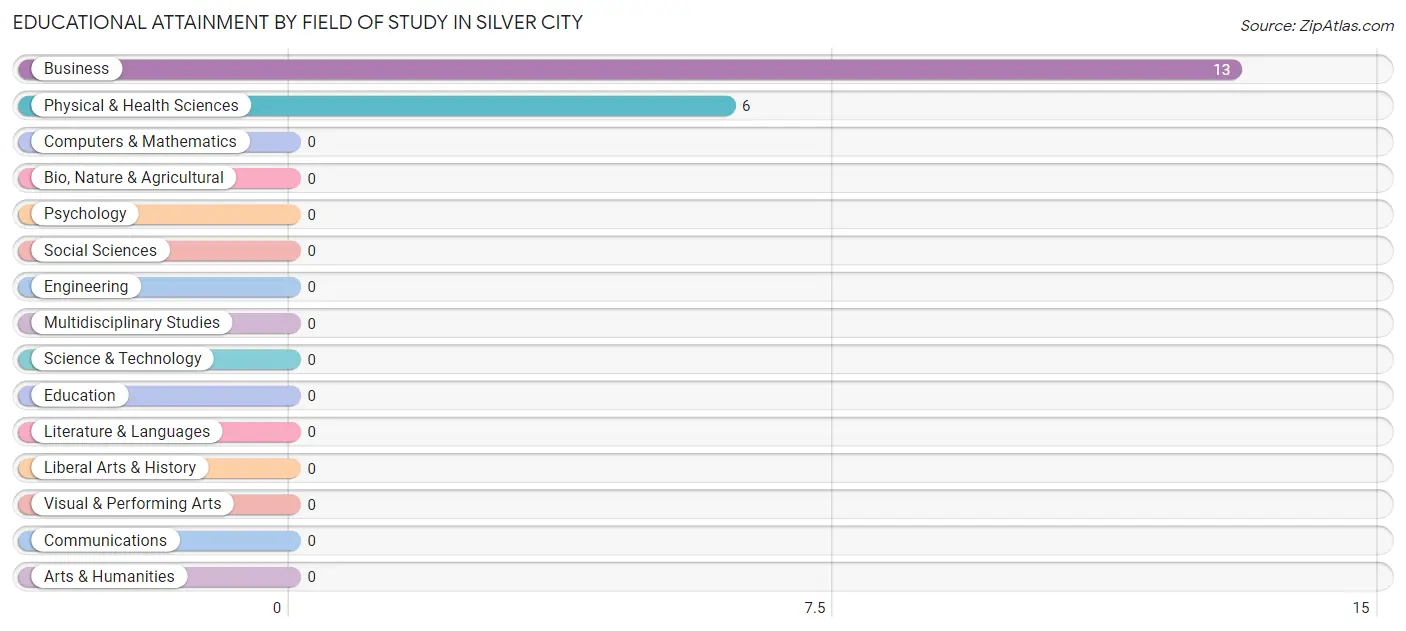
| Field of Study | # Graduates | % Graduates |
| Computers & Mathematics | 0 | 0.0% |
| Bio, Nature & Agricultural | 0 | 0.0% |
| Physical & Health Sciences | 6 | 31.6% |
| Psychology | 0 | 0.0% |
| Social Sciences | 0 | 0.0% |
| Engineering | 0 | 0.0% |
| Multidisciplinary Studies | 0 | 0.0% |
| Science & Technology | 0 | 0.0% |
| Business | 13 | 68.4% |
| Education | 0 | 0.0% |
| Literature & Languages | 0 | 0.0% |
| Liberal Arts & History | 0 | 0.0% |
| Visual & Performing Arts | 0 | 0.0% |
| Communications | 0 | 0.0% |
| Arts & Humanities | 0 | 0.0% |
| Total | 19 | 100.0% |
Transportation & Commute in Silver City
Vehicle Availability by Sex in Silver City
The most prevalent vehicle ownership categories in Silver City are males with 4 vehicles (13, accounting for 72.2%) and females with 4 vehicles (0, making up 76.5%).
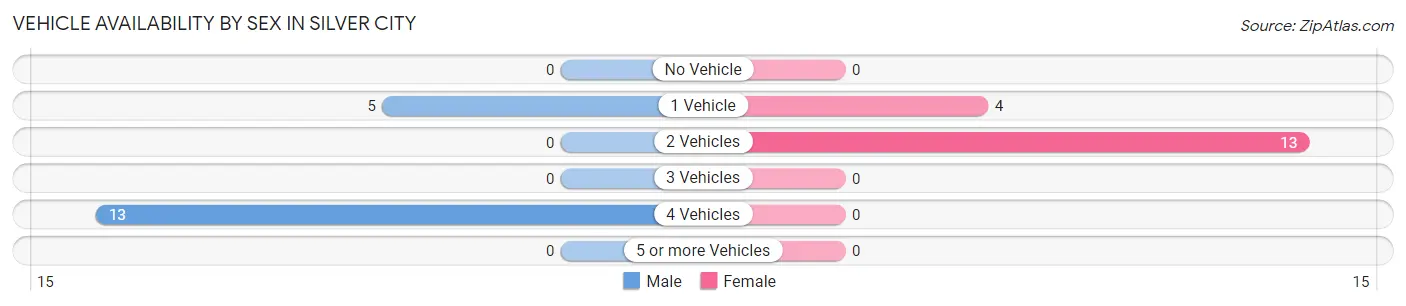
| Vehicles Available | Male | Female |
| No Vehicle | 0 (0.0%) | 0 (0.0%) |
| 1 Vehicle | 5 (27.8%) | 4 (23.5%) |
| 2 Vehicles | 0 (0.0%) | 13 (76.5%) |
| 3 Vehicles | 0 (0.0%) | 0 (0.0%) |
| 4 Vehicles | 13 (72.2%) | 0 (0.0%) |
| 5 or more Vehicles | 0 (0.0%) | 0 (0.0%) |
| Total | 18 (100.0%) | 17 (100.0%) |
Commute Time in Silver City
The most frequently occuring commute durations in Silver City are 15 to 19 minutes (13 commuters, 76.5%), 20 to 24 minutes (4 commuters, 23.5%), and less than 5 minutes (0 commuters, 0.0%).
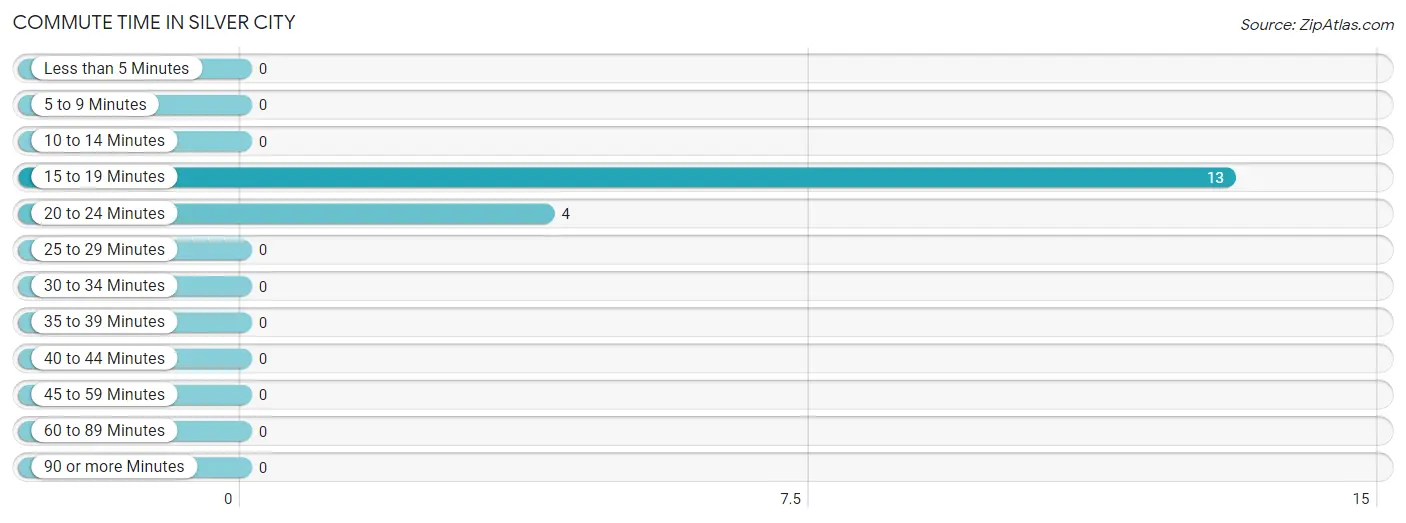
| Commute Time | # Commuters | % Commuters |
| Less than 5 Minutes | 0 | 0.0% |
| 5 to 9 Minutes | 0 | 0.0% |
| 10 to 14 Minutes | 0 | 0.0% |
| 15 to 19 Minutes | 13 | 76.5% |
| 20 to 24 Minutes | 4 | 23.5% |
| 25 to 29 Minutes | 0 | 0.0% |
| 30 to 34 Minutes | 0 | 0.0% |
| 35 to 39 Minutes | 0 | 0.0% |
| 40 to 44 Minutes | 0 | 0.0% |
| 45 to 59 Minutes | 0 | 0.0% |
| 60 to 89 Minutes | 0 | 0.0% |
| 90 or more Minutes | 0 | 0.0% |
Commute Time by Sex in Silver City
The most common commute times in Silver City are 15 to 19 minutes (13 commuters, 100.0%) for males and 20 to 24 minutes (4 commuters, 100.0%) for females.
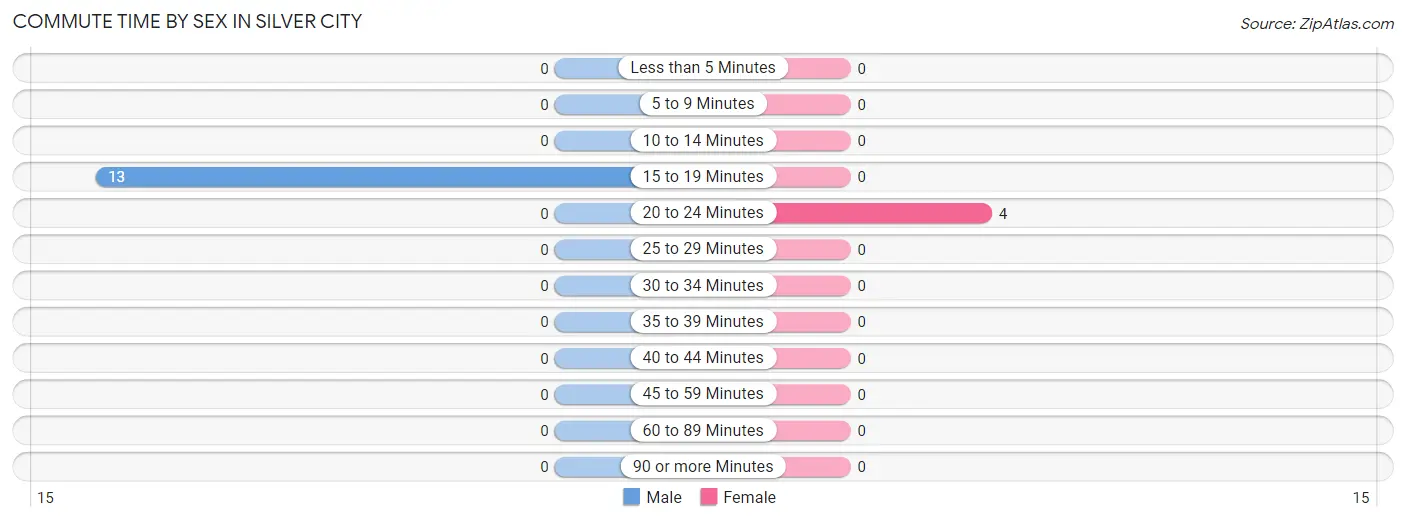
| Commute Time | Male | Female |
| Less than 5 Minutes | 0 (0.0%) | 0 (0.0%) |
| 5 to 9 Minutes | 0 (0.0%) | 0 (0.0%) |
| 10 to 14 Minutes | 0 (0.0%) | 0 (0.0%) |
| 15 to 19 Minutes | 13 (100.0%) | 0 (0.0%) |
| 20 to 24 Minutes | 0 (0.0%) | 4 (100.0%) |
| 25 to 29 Minutes | 0 (0.0%) | 0 (0.0%) |
| 30 to 34 Minutes | 0 (0.0%) | 0 (0.0%) |
| 35 to 39 Minutes | 0 (0.0%) | 0 (0.0%) |
| 40 to 44 Minutes | 0 (0.0%) | 0 (0.0%) |
| 45 to 59 Minutes | 0 (0.0%) | 0 (0.0%) |
| 60 to 89 Minutes | 0 (0.0%) | 0 (0.0%) |
| 90 or more Minutes | 0 (0.0%) | 0 (0.0%) |
Time of Departure to Work by Sex in Silver City
The most frequent times of departure to work in Silver City are 5:30 AM to 5:59 AM (13, 100.0%) for males and 7:30 AM to 7:59 AM (4, 100.0%) for females.
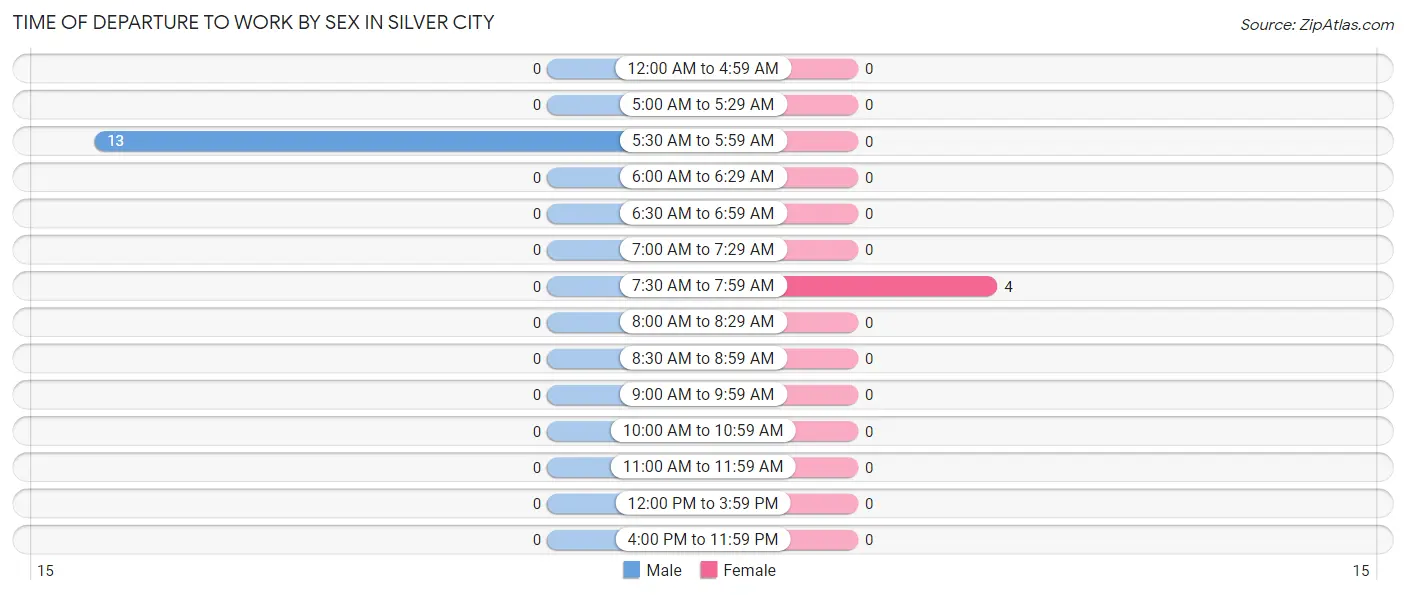
| Time of Departure | Male | Female |
| 12:00 AM to 4:59 AM | 0 (0.0%) | 0 (0.0%) |
| 5:00 AM to 5:29 AM | 0 (0.0%) | 0 (0.0%) |
| 5:30 AM to 5:59 AM | 13 (100.0%) | 0 (0.0%) |
| 6:00 AM to 6:29 AM | 0 (0.0%) | 0 (0.0%) |
| 6:30 AM to 6:59 AM | 0 (0.0%) | 0 (0.0%) |
| 7:00 AM to 7:29 AM | 0 (0.0%) | 0 (0.0%) |
| 7:30 AM to 7:59 AM | 0 (0.0%) | 4 (100.0%) |
| 8:00 AM to 8:29 AM | 0 (0.0%) | 0 (0.0%) |
| 8:30 AM to 8:59 AM | 0 (0.0%) | 0 (0.0%) |
| 9:00 AM to 9:59 AM | 0 (0.0%) | 0 (0.0%) |
| 10:00 AM to 10:59 AM | 0 (0.0%) | 0 (0.0%) |
| 11:00 AM to 11:59 AM | 0 (0.0%) | 0 (0.0%) |
| 12:00 PM to 3:59 PM | 0 (0.0%) | 0 (0.0%) |
| 4:00 PM to 11:59 PM | 0 (0.0%) | 0 (0.0%) |
| Total | 13 (100.0%) | 4 (100.0%) |
Housing Occupancy in Silver City
Occupancy by Ownership in Silver City
Of the total 39 dwellings in Silver City, owner-occupied units account for 28 (71.8%), while renter-occupied units make up 11 (28.2%).
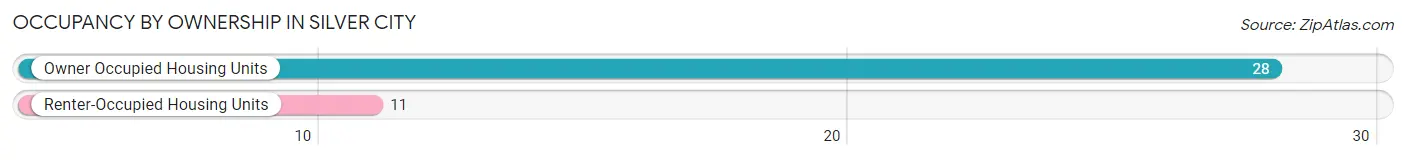
| Occupancy | # Housing Units | % Housing Units |
| Owner Occupied Housing Units | 28 | 71.8% |
| Renter-Occupied Housing Units | 11 | 28.2% |
| Total Occupied Housing Units | 39 | 100.0% |
Occupancy by Household Size in Silver City
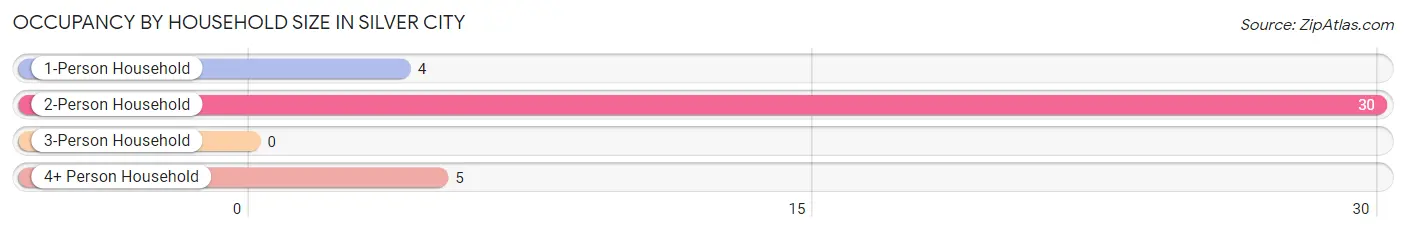
| Household Size | # Housing Units | % Housing Units |
| 1-Person Household | 4 | 10.3% |
| 2-Person Household | 30 | 76.9% |
| 3-Person Household | 0 | 0.0% |
| 4+ Person Household | 5 | 12.8% |
| Total Housing Units | 39 | 100.0% |
Occupancy by Ownership by Household Size in Silver City
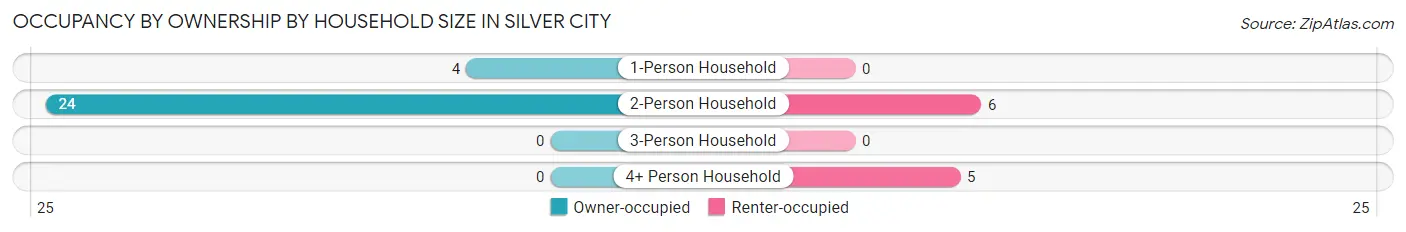
| Household Size | Owner-occupied | Renter-occupied |
| 1-Person Household | 4 (100.0%) | 0 (0.0%) |
| 2-Person Household | 24 (80.0%) | 6 (20.0%) |
| 3-Person Household | 0 (0.0%) | 0 (0.0%) |
| 4+ Person Household | 0 (0.0%) | 5 (100.0%) |
| Total Housing Units | 28 (71.8%) | 11 (28.2%) |
Occupancy by Educational Attainment in Silver City
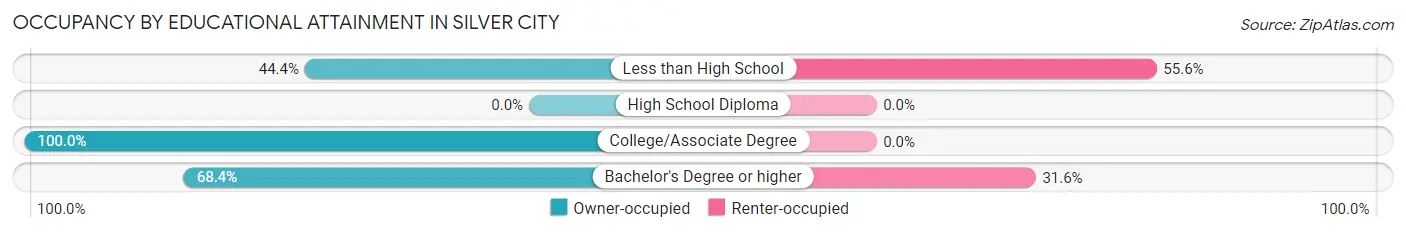
| Household Size | Owner-occupied | Renter-occupied |
| Less than High School | 4 (44.4%) | 5 (55.6%) |
| High School Diploma | 0 (0.0%) | 0 (0.0%) |
| College/Associate Degree | 11 (100.0%) | 0 (0.0%) |
| Bachelor's Degree or higher | 13 (68.4%) | 6 (31.6%) |
Occupancy by Age of Householder in Silver City
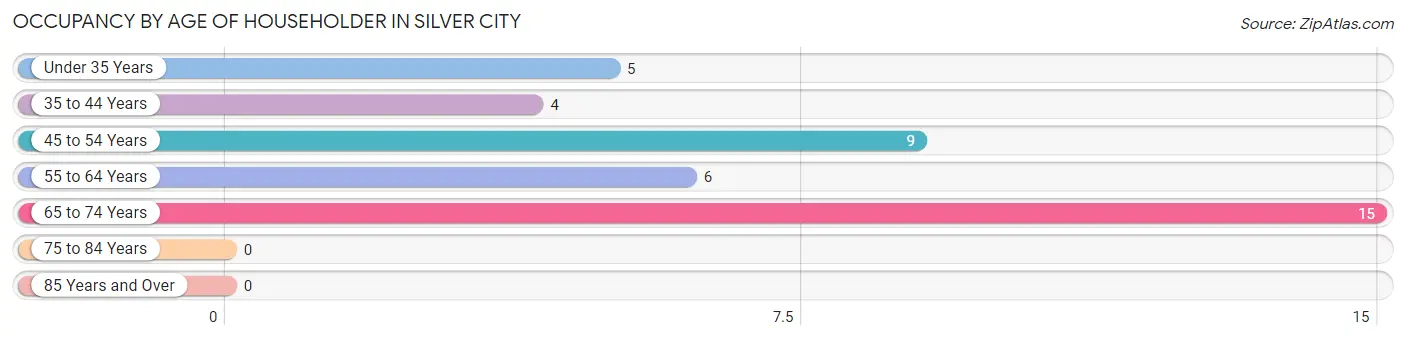
| Age Bracket | # Households | % Households |
| Under 35 Years | 5 | 12.8% |
| 35 to 44 Years | 4 | 10.3% |
| 45 to 54 Years | 9 | 23.1% |
| 55 to 64 Years | 6 | 15.4% |
| 65 to 74 Years | 15 | 38.5% |
| 75 to 84 Years | 0 | 0.0% |
| 85 Years and Over | 0 | 0.0% |
| Total | 39 | 100.0% |
Housing Finances in Silver City
Median Income by Occupancy in Silver City
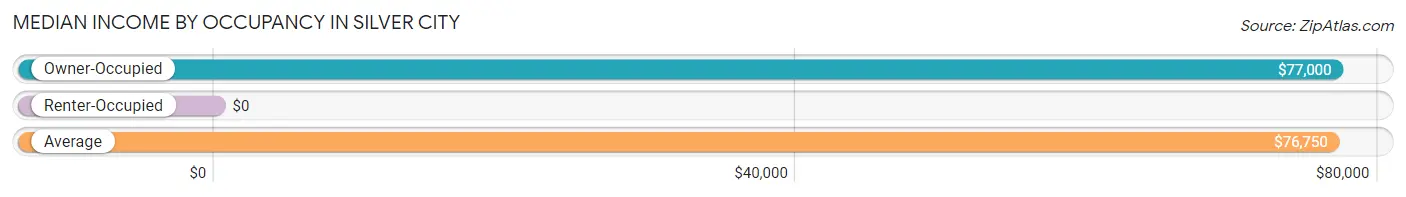
| Occupancy Type | # Households | Median Income |
| Owner-Occupied | 28 (71.8%) | $77,000 |
| Renter-Occupied | 11 (28.2%) | $0 |
| Average | 39 (100.0%) | $76,750 |
Occupancy by Householder Income Bracket in Silver City

| Income Bracket | Owner-occupied | Renter-occupied |
| Less than $5,000 | 0 (0.0%) | 0 (0.0%) |
| $5,000 to $9,999 | 0 (0.0%) | 0 (0.0%) |
| $10,000 to $14,999 | 0 (0.0%) | 0 (0.0%) |
| $15,000 to $19,999 | 0 (0.0%) | 0 (0.0%) |
| $20,000 to $24,999 | 0 (0.0%) | 0 (0.0%) |
| $25,000 to $34,999 | 6 (21.4%) | 0 (0.0%) |
| $35,000 to $49,999 | 4 (14.3%) | 6 (54.5%) |
| $50,000 to $74,999 | 0 (0.0%) | 0 (0.0%) |
| $75,000 to $99,999 | 14 (50.0%) | 5 (45.5%) |
| $100,000 to $149,999 | 4 (14.3%) | 0 (0.0%) |
| $150,000 or more | 0 (0.0%) | 0 (0.0%) |
| Total | 28 (100.0%) | 11 (100.0%) |
Monthly Housing Cost Tiers in Silver City
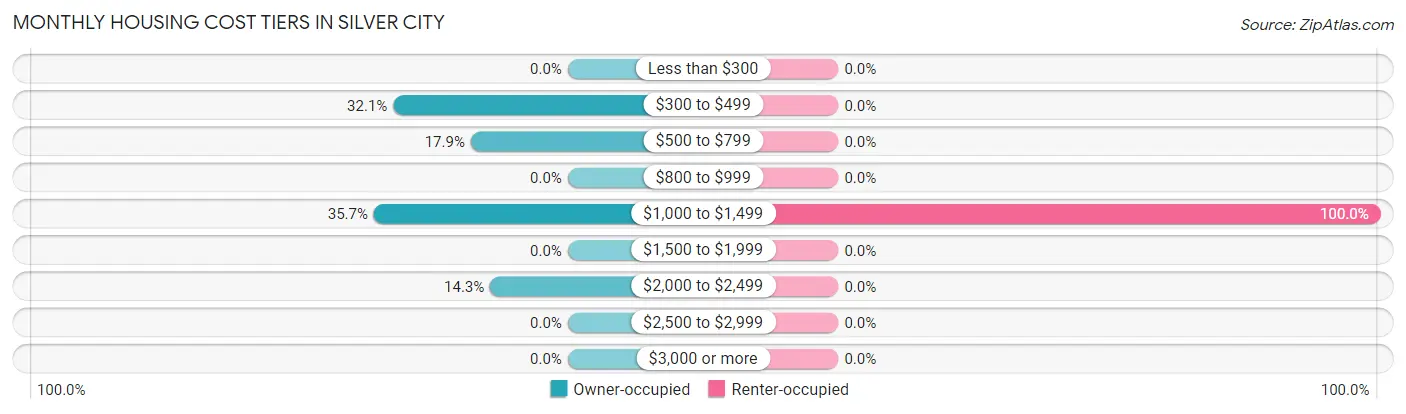
| Monthly Cost | Owner-occupied | Renter-occupied |
| Less than $300 | 0 (0.0%) | 0 (0.0%) |
| $300 to $499 | 9 (32.1%) | 0 (0.0%) |
| $500 to $799 | 5 (17.9%) | 0 (0.0%) |
| $800 to $999 | 0 (0.0%) | 0 (0.0%) |
| $1,000 to $1,499 | 10 (35.7%) | 11 (100.0%) |
| $1,500 to $1,999 | 0 (0.0%) | 0 (0.0%) |
| $2,000 to $2,499 | 4 (14.3%) | 0 (0.0%) |
| $2,500 to $2,999 | 0 (0.0%) | 0 (0.0%) |
| $3,000 or more | 0 (0.0%) | 0 (0.0%) |
| Total | 28 (100.0%) | 11 (100.0%) |
Physical Housing Characteristics in Silver City
Housing Structures in Silver City
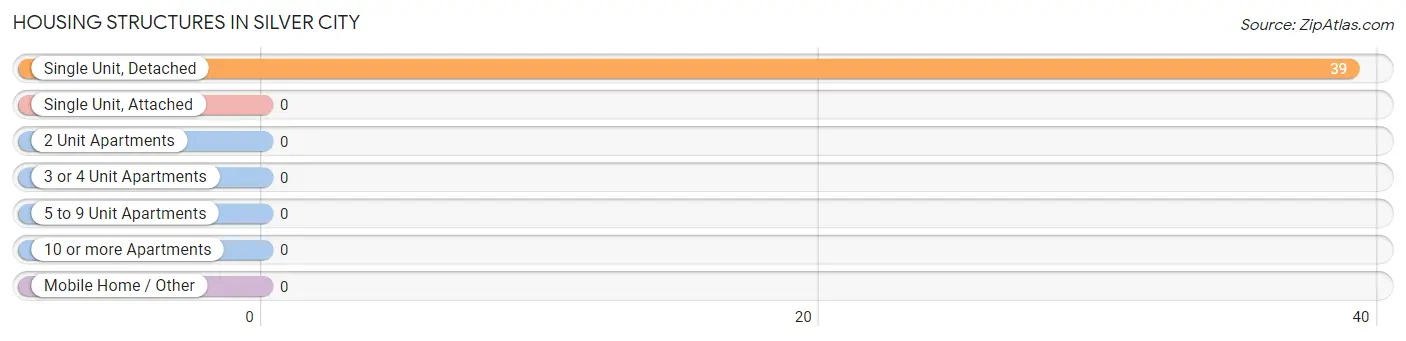
| Structure Type | # Housing Units | % Housing Units |
| Single Unit, Detached | 39 | 100.0% |
| Single Unit, Attached | 0 | 0.0% |
| 2 Unit Apartments | 0 | 0.0% |
| 3 or 4 Unit Apartments | 0 | 0.0% |
| 5 to 9 Unit Apartments | 0 | 0.0% |
| 10 or more Apartments | 0 | 0.0% |
| Mobile Home / Other | 0 | 0.0% |
| Total | 39 | 100.0% |
Housing Structures by Occupancy in Silver City
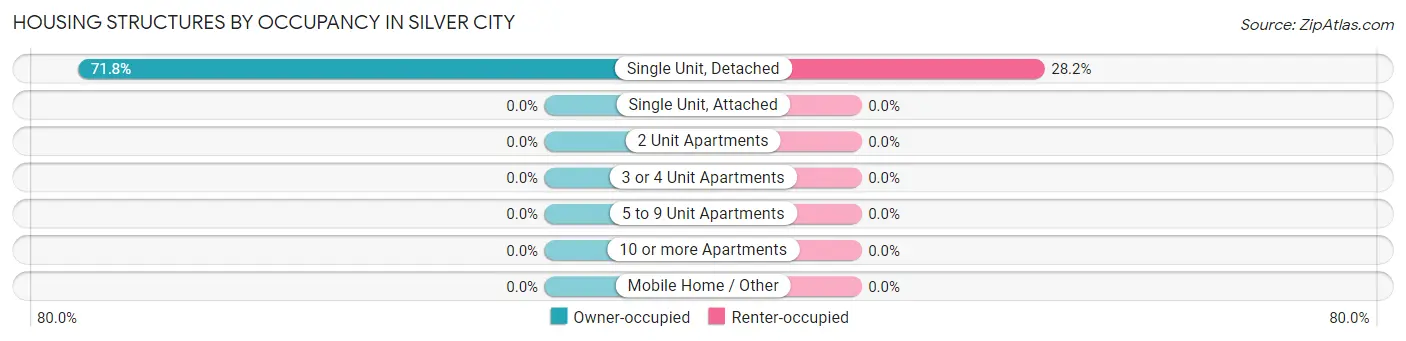
| Structure Type | Owner-occupied | Renter-occupied |
| Single Unit, Detached | 28 (71.8%) | 11 (28.2%) |
| Single Unit, Attached | 0 (0.0%) | 0 (0.0%) |
| 2 Unit Apartments | 0 (0.0%) | 0 (0.0%) |
| 3 or 4 Unit Apartments | 0 (0.0%) | 0 (0.0%) |
| 5 to 9 Unit Apartments | 0 (0.0%) | 0 (0.0%) |
| 10 or more Apartments | 0 (0.0%) | 0 (0.0%) |
| Mobile Home / Other | 0 (0.0%) | 0 (0.0%) |
| Total | 28 (71.8%) | 11 (28.2%) |
Housing Structures by Number of Rooms in Silver City
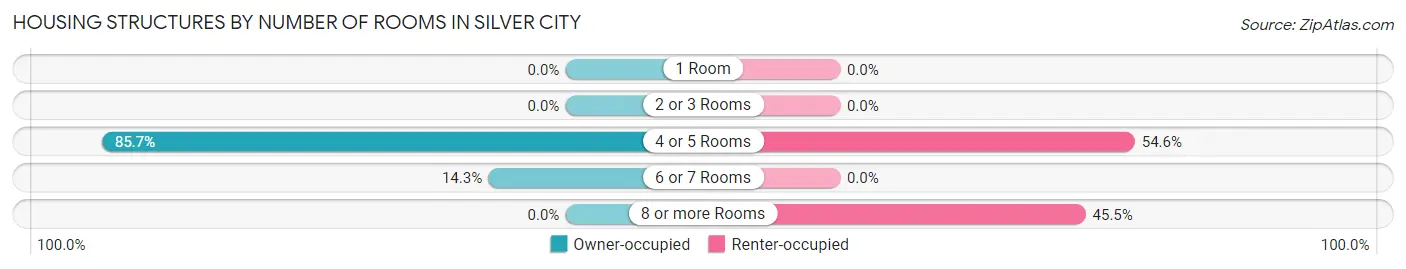
| Number of Rooms | Owner-occupied | Renter-occupied |
| 1 Room | 0 (0.0%) | 0 (0.0%) |
| 2 or 3 Rooms | 0 (0.0%) | 0 (0.0%) |
| 4 or 5 Rooms | 24 (85.7%) | 6 (54.5%) |
| 6 or 7 Rooms | 4 (14.3%) | 0 (0.0%) |
| 8 or more Rooms | 0 (0.0%) | 5 (45.5%) |
| Total | 28 (100.0%) | 11 (100.0%) |
Housing Structure by Heating Type in Silver City
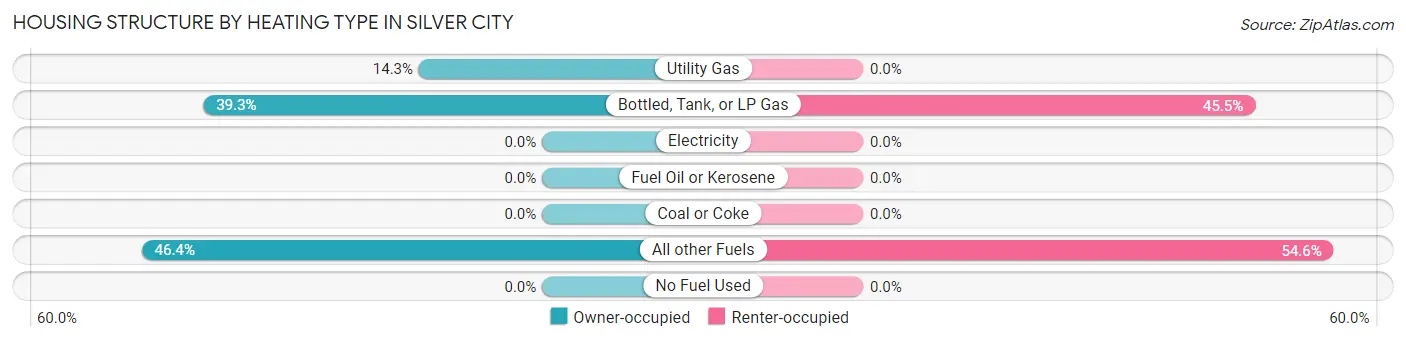
| Heating Type | Owner-occupied | Renter-occupied |
| Utility Gas | 4 (14.3%) | 0 (0.0%) |
| Bottled, Tank, or LP Gas | 11 (39.3%) | 5 (45.5%) |
| Electricity | 0 (0.0%) | 0 (0.0%) |
| Fuel Oil or Kerosene | 0 (0.0%) | 0 (0.0%) |
| Coal or Coke | 0 (0.0%) | 0 (0.0%) |
| All other Fuels | 13 (46.4%) | 6 (54.5%) |
| No Fuel Used | 0 (0.0%) | 0 (0.0%) |
| Total | 28 (100.0%) | 11 (100.0%) |
Household Vehicle Usage in Silver City
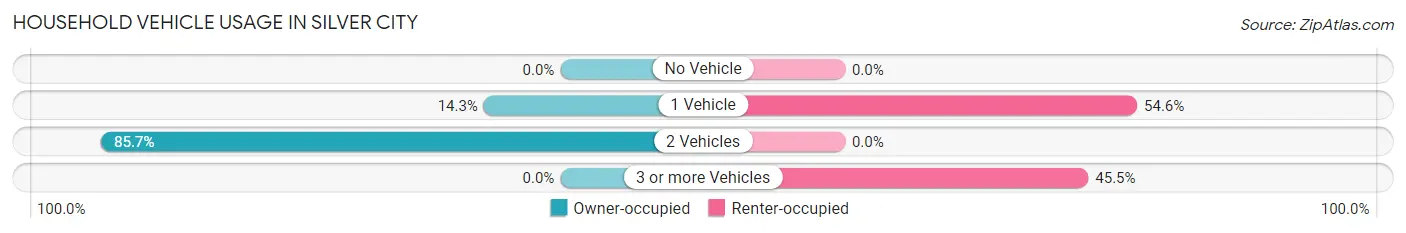
| Vehicles per Household | Owner-occupied | Renter-occupied |
| No Vehicle | 0 (0.0%) | 0 (0.0%) |
| 1 Vehicle | 4 (14.3%) | 6 (54.5%) |
| 2 Vehicles | 24 (85.7%) | 0 (0.0%) |
| 3 or more Vehicles | 0 (0.0%) | 5 (45.5%) |
| Total | 28 (100.0%) | 11 (100.0%) |
Real Estate & Mortgages in Silver City
Real Estate and Mortgage Overview in Silver City
| Characteristic | Without Mortgage | With Mortgage |
| Housing Units | 14 | 14 |
| Median Property Value | - | - |
| Median Household Income | - | - |
| Monthly Housing Costs | - | - |
| Real Estate Taxes | - | - |
Property Value by Mortgage Status in Silver City
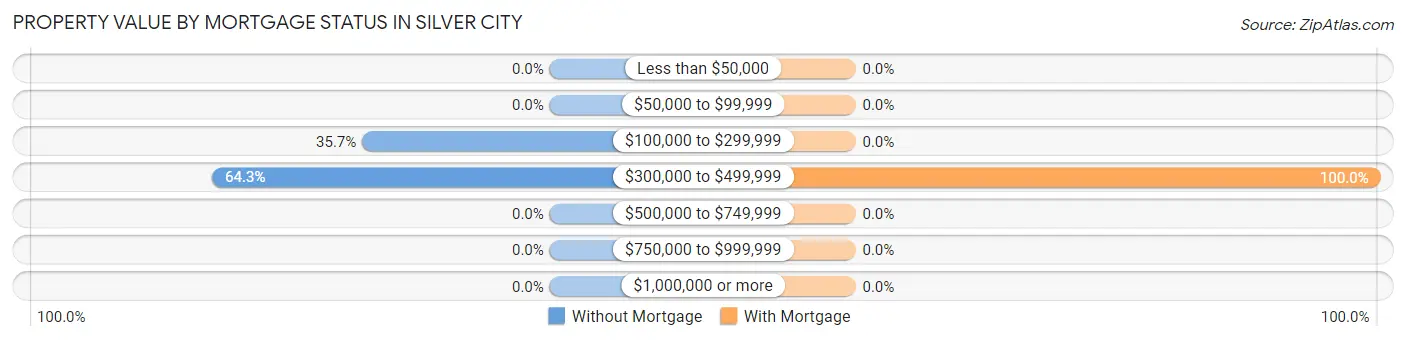
| Property Value | Without Mortgage | With Mortgage |
| Less than $50,000 | 0 (0.0%) | 0 (0.0%) |
| $50,000 to $99,999 | 0 (0.0%) | 0 (0.0%) |
| $100,000 to $299,999 | 5 (35.7%) | 0 (0.0%) |
| $300,000 to $499,999 | 9 (64.3%) | 14 (100.0%) |
| $500,000 to $749,999 | 0 (0.0%) | 0 (0.0%) |
| $750,000 to $999,999 | 0 (0.0%) | 0 (0.0%) |
| $1,000,000 or more | 0 (0.0%) | 0 (0.0%) |
| Total | 14 (100.0%) | 14 (100.0%) |
Household Income by Mortgage Status in Silver City
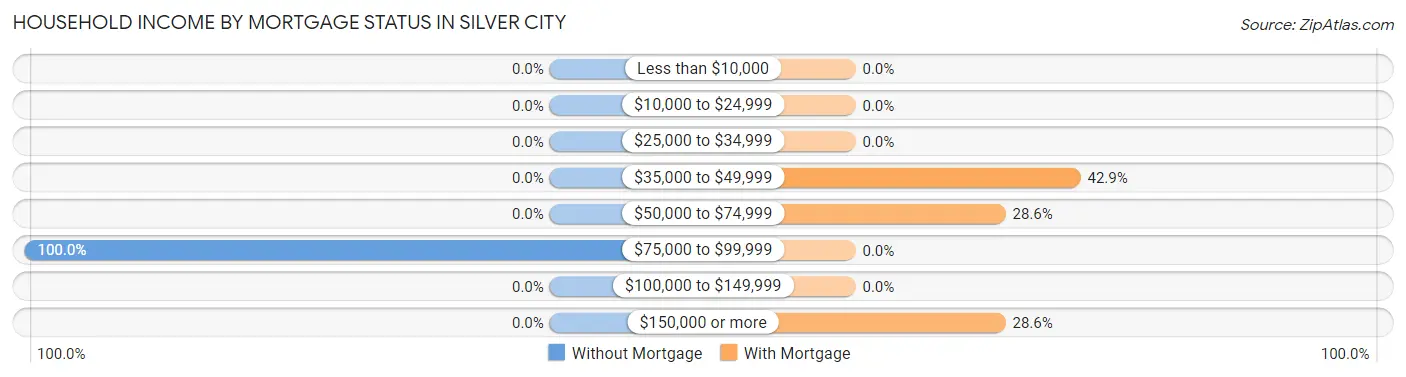
| Household Income | Without Mortgage | With Mortgage |
| Less than $10,000 | 0 (0.0%) | 0 (0.0%) |
| $10,000 to $24,999 | 0 (0.0%) | 0 (0.0%) |
| $25,000 to $34,999 | 0 (0.0%) | 0 (0.0%) |
| $35,000 to $49,999 | 0 (0.0%) | 6 (42.9%) |
| $50,000 to $74,999 | 0 (0.0%) | 4 (28.6%) |
| $75,000 to $99,999 | 14 (100.0%) | 0 (0.0%) |
| $100,000 to $149,999 | 0 (0.0%) | 0 (0.0%) |
| $150,000 or more | 0 (0.0%) | 4 (28.6%) |
| Total | 14 (100.0%) | 14 (100.0%) |
Property Value to Household Income Ratio in Silver City
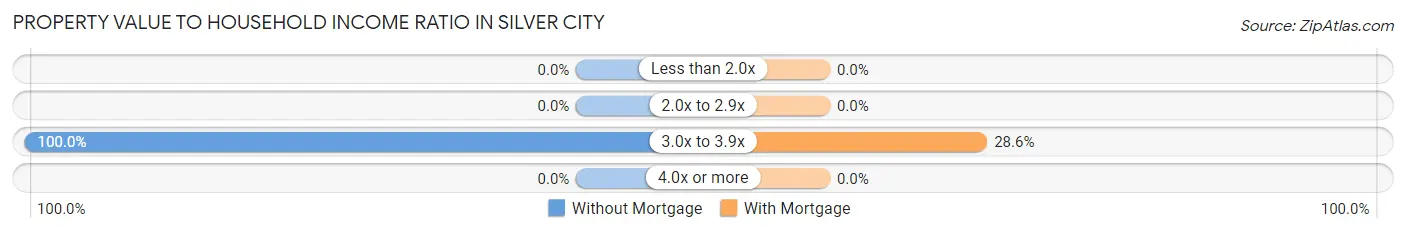
| Value-to-Income Ratio | Without Mortgage | With Mortgage |
| Less than 2.0x | 0 (0.0%) | 0 (0.0%) |
| 2.0x to 2.9x | 0 (0.0%) | 0 (0.0%) |
| 3.0x to 3.9x | 14 (100.0%) | 4 (28.6%) |
| 4.0x or more | 0 (0.0%) | 0 (0.0%) |
| Total | 14 (100.0%) | 14 (100.0%) |
Real Estate Taxes by Mortgage Status in Silver City
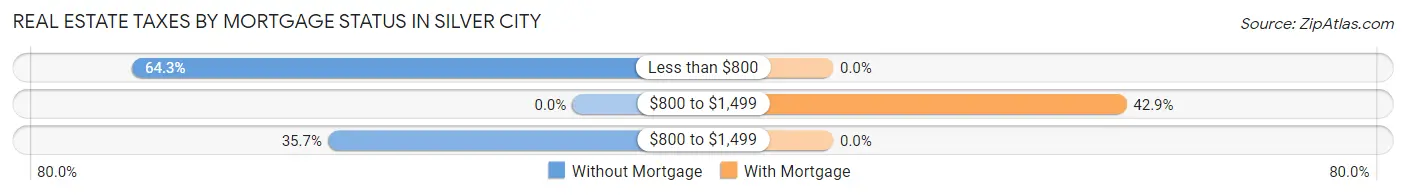
| Property Taxes | Without Mortgage | With Mortgage |
| Less than $800 | 9 (64.3%) | 0 (0.0%) |
| $800 to $1,499 | 0 (0.0%) | 6 (42.9%) |
| $800 to $1,499 | 5 (35.7%) | 0 (0.0%) |
| Total | 14 (100.0%) | 14 (100.0%) |
Health & Disability in Silver City
Health Insurance Coverage by Age in Silver City
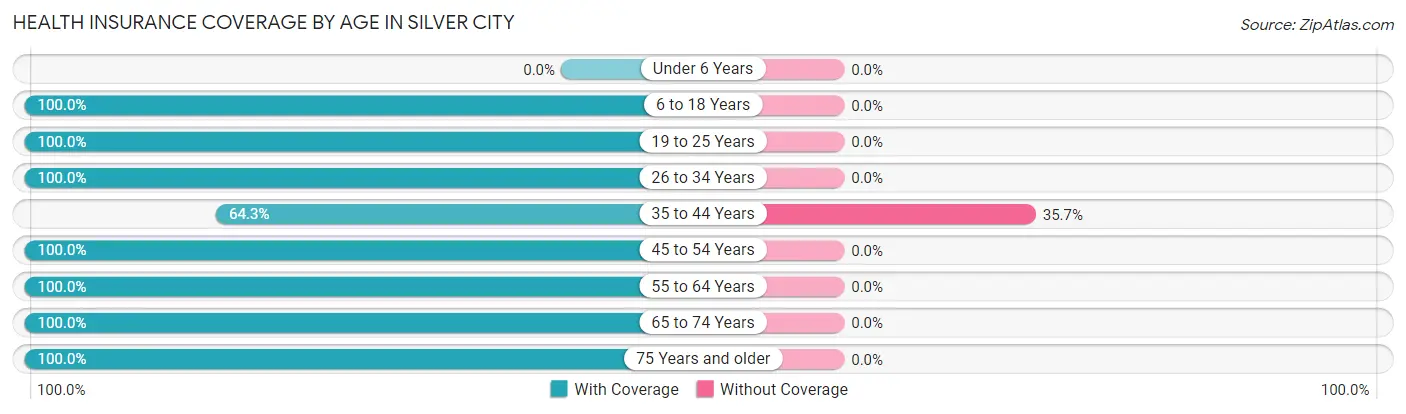
| Age Bracket | With Coverage | Without Coverage |
| Under 6 Years | 0 (0.0%) | 0 (0.0%) |
| 6 to 18 Years | 38 (100.0%) | 0 (0.0%) |
| 19 to 25 Years | 8 (100.0%) | 0 (0.0%) |
| 26 to 34 Years | 5 (100.0%) | 0 (0.0%) |
| 35 to 44 Years | 9 (64.3%) | 5 (35.7%) |
| 45 to 54 Years | 9 (100.0%) | 0 (0.0%) |
| 55 to 64 Years | 6 (100.0%) | 0 (0.0%) |
| 65 to 74 Years | 21 (100.0%) | 0 (0.0%) |
| 75 Years and older | 4 (100.0%) | 0 (0.0%) |
| Total | 100 (95.2%) | 5 (4.8%) |
Health Insurance Coverage by Citizenship Status in Silver City
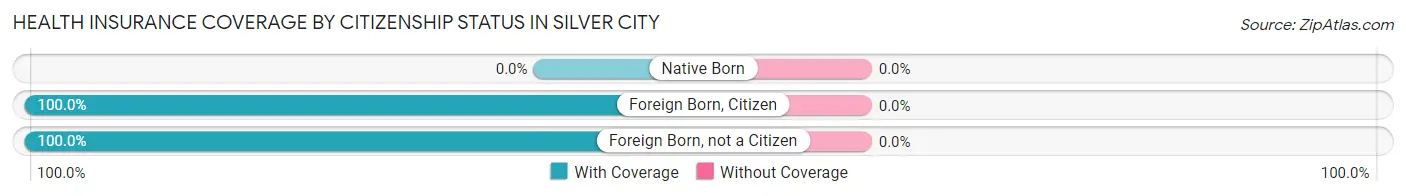
| Citizenship Status | With Coverage | Without Coverage |
| Native Born | 0 (0.0%) | 0 (0.0%) |
| Foreign Born, Citizen | 38 (100.0%) | 0 (0.0%) |
| Foreign Born, not a Citizen | 8 (100.0%) | 0 (0.0%) |
Health Insurance Coverage by Household Income in Silver City
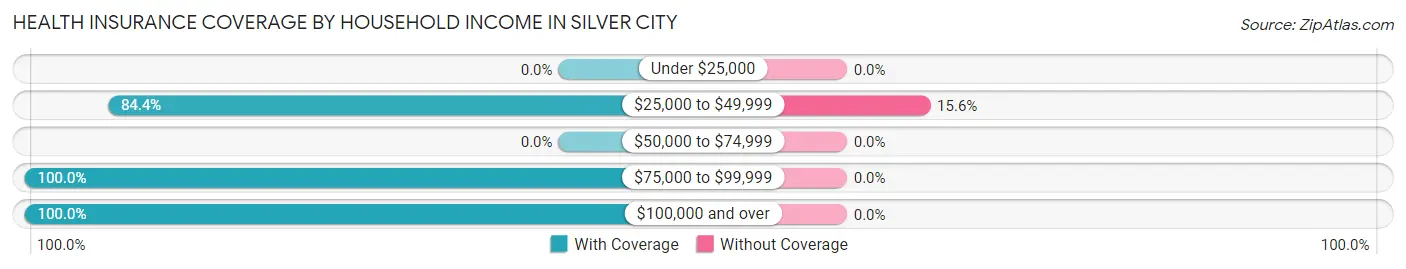
| Household Income | With Coverage | Without Coverage |
| Under $25,000 | 0 (0.0%) | 0 (0.0%) |
| $25,000 to $49,999 | 27 (84.4%) | 5 (15.6%) |
| $50,000 to $74,999 | 0 (0.0%) | 0 (0.0%) |
| $75,000 to $99,999 | 69 (100.0%) | 0 (0.0%) |
| $100,000 and over | 4 (100.0%) | 0 (0.0%) |
Public vs Private Health Insurance Coverage by Age in Silver City
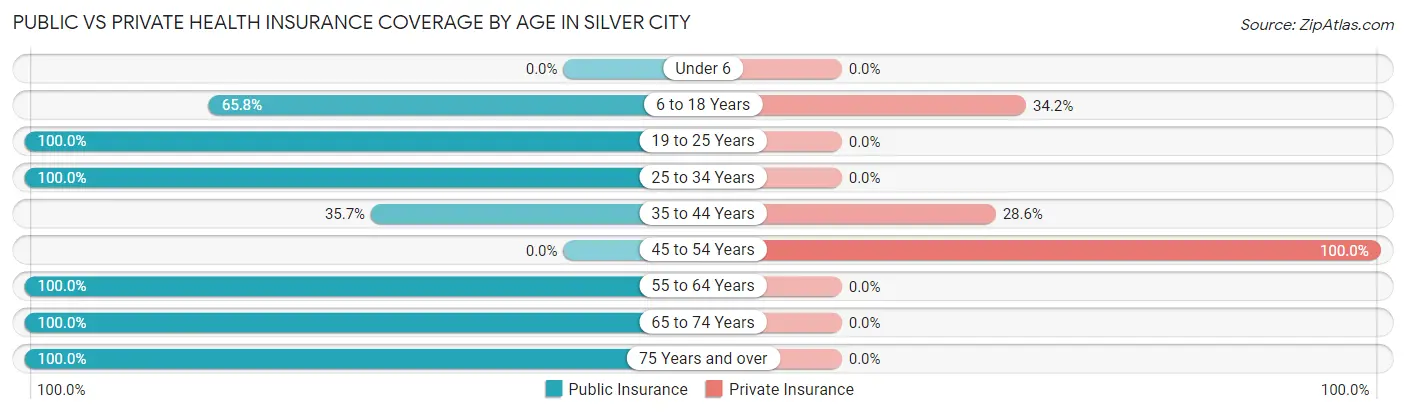
| Age Bracket | Public Insurance | Private Insurance |
| Under 6 | 0 (0.0%) | 0 (0.0%) |
| 6 to 18 Years | 25 (65.8%) | 13 (34.2%) |
| 19 to 25 Years | 8 (100.0%) | 0 (0.0%) |
| 25 to 34 Years | 5 (100.0%) | 0 (0.0%) |
| 35 to 44 Years | 5 (35.7%) | 4 (28.6%) |
| 45 to 54 Years | 0 (0.0%) | 9 (100.0%) |
| 55 to 64 Years | 6 (100.0%) | 0 (0.0%) |
| 65 to 74 Years | 21 (100.0%) | 0 (0.0%) |
| 75 Years and over | 4 (100.0%) | 0 (0.0%) |
| Total | 74 (70.5%) | 26 (24.8%) |
Disability Status by Sex by Age in Silver City
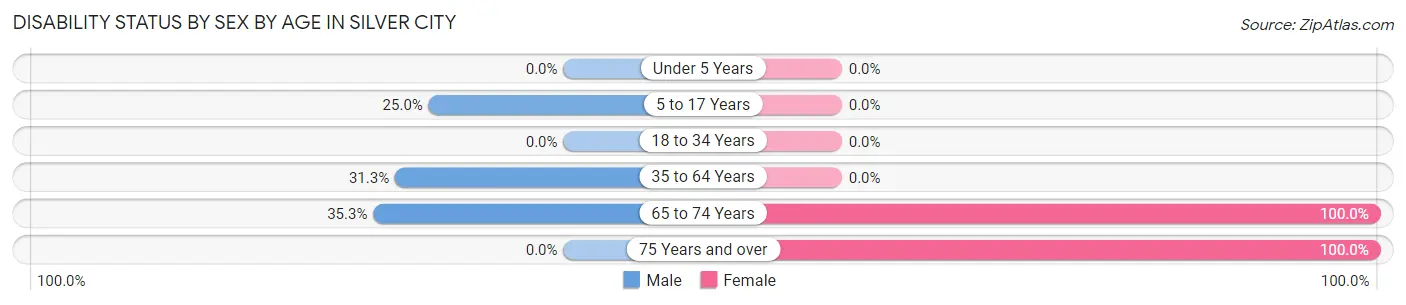
| Age Bracket | Male | Female |
| Under 5 Years | 0 (0.0%) | 0 (0.0%) |
| 5 to 17 Years | 4 (25.0%) | 0 (0.0%) |
| 18 to 34 Years | 0 (0.0%) | 0 (0.0%) |
| 35 to 64 Years | 5 (31.2%) | 0 (0.0%) |
| 65 to 74 Years | 6 (35.3%) | 4 (100.0%) |
| 75 Years and over | 0 (0.0%) | 4 (100.0%) |
Disability Class by Sex by Age in Silver City
Disability Class: Hearing Difficulty
| Age Bracket | Male | Female |
| Under 5 Years | 0 (0.0%) | 0 (0.0%) |
| 5 to 17 Years | 0 (0.0%) | 0 (0.0%) |
| 18 to 34 Years | 0 (0.0%) | 0 (0.0%) |
| 35 to 64 Years | 0 (0.0%) | 0 (0.0%) |
| 65 to 74 Years | 0 (0.0%) | 0 (0.0%) |
| 75 Years and over | 0 (0.0%) | 0 (0.0%) |
Disability Class: Vision Difficulty

| Age Bracket | Male | Female |
| Under 5 Years | 0 (0.0%) | 0 (0.0%) |
| 5 to 17 Years | 0 (0.0%) | 0 (0.0%) |
| 18 to 34 Years | 0 (0.0%) | 0 (0.0%) |
| 35 to 64 Years | 5 (31.2%) | 0 (0.0%) |
| 65 to 74 Years | 6 (35.3%) | 0 (0.0%) |
| 75 Years and over | 0 (0.0%) | 0 (0.0%) |
Disability Class: Cognitive Difficulty

| Age Bracket | Male | Female |
| 5 to 17 Years | 0 (0.0%) | 0 (0.0%) |
| 18 to 34 Years | 0 (0.0%) | 0 (0.0%) |
| 35 to 64 Years | 0 (0.0%) | 0 (0.0%) |
| 65 to 74 Years | 0 (0.0%) | 0 (0.0%) |
| 75 Years and over | 0 (0.0%) | 0 (0.0%) |
Disability Class: Ambulatory Difficulty
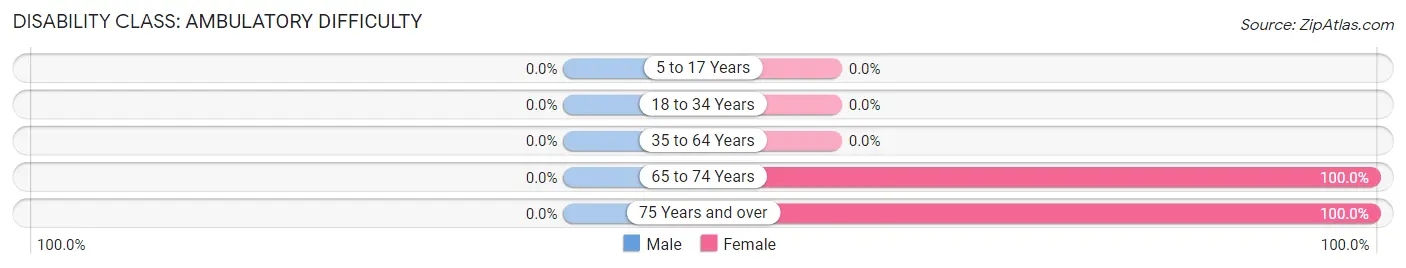
| Age Bracket | Male | Female |
| 5 to 17 Years | 0 (0.0%) | 0 (0.0%) |
| 18 to 34 Years | 0 (0.0%) | 0 (0.0%) |
| 35 to 64 Years | 0 (0.0%) | 0 (0.0%) |
| 65 to 74 Years | 0 (0.0%) | 4 (100.0%) |
| 75 Years and over | 0 (0.0%) | 4 (100.0%) |
Disability Class: Self-Care Difficulty
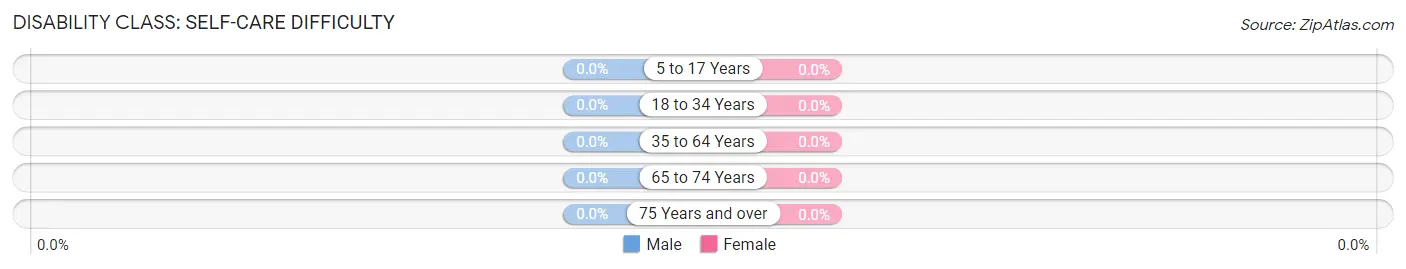
| Age Bracket | Male | Female |
| 5 to 17 Years | 0 (0.0%) | 0 (0.0%) |
| 18 to 34 Years | 0 (0.0%) | 0 (0.0%) |
| 35 to 64 Years | 0 (0.0%) | 0 (0.0%) |
| 65 to 74 Years | 0 (0.0%) | 0 (0.0%) |
| 75 Years and over | 0 (0.0%) | 0 (0.0%) |
Technology Access in Silver City
Computing Device Access in Silver City
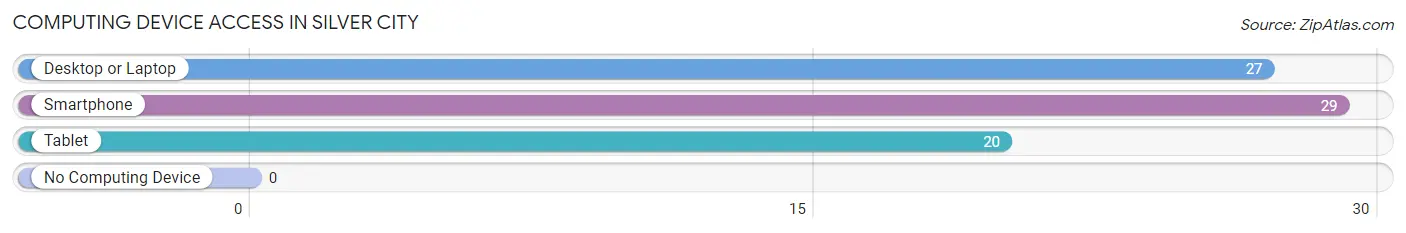
| Device Type | # Households | % Households |
| Desktop or Laptop | 27 | 69.2% |
| Smartphone | 29 | 74.4% |
| Tablet | 20 | 51.3% |
| No Computing Device | 0 | 0.0% |
| Total | 39 | 100.0% |
Internet Access in Silver City
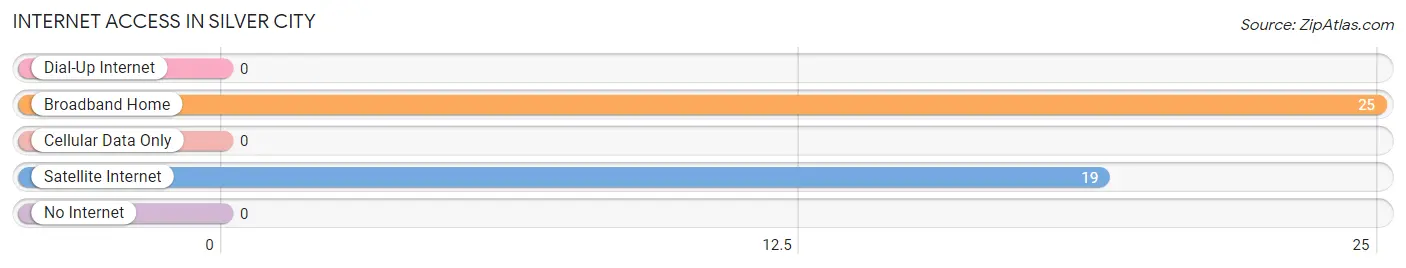
| Internet Type | # Households | % Households |
| Dial-Up Internet | 0 | 0.0% |
| Broadband Home | 25 | 64.1% |
| Cellular Data Only | 0 | 0.0% |
| Satellite Internet | 19 | 48.7% |
| No Internet | 0 | 0.0% |
| Total | 39 | 100.0% |
Silver City Summary
Silver City is a small unincorporated community located in the Humboldt-Toiyabe National Forest in Nye County, Nevada. It is located about 25 miles south of Tonopah, Nevada, and is the only remaining town in the area that was once a bustling mining town. Silver City was founded in 1869 and was once the largest town in Nye County. It was a major silver mining center and was home to several large mines, including the Silver City Mine, the Silver King Mine, and the Silver Queen Mine.
History
Silver City was founded in 1869 by prospectors who discovered silver in the area. The town quickly grew and by 1871, it had a population of over 1,000 people. The town was home to several large silver mines, including the Silver City Mine, the Silver King Mine, and the Silver Queen Mine. The town was also home to several saloons, stores, and other businesses.
In 1873, the town was incorporated and a post office was established. The town continued to grow and by 1880, it had a population of over 2,000 people. The town was home to several churches, a school, and a newspaper.
In the late 1880s, the silver mines began to decline and the population of the town began to decrease. By 1900, the population had dropped to just over 500 people. The town continued to decline and by the 1950s, the population had dropped to just over 100 people.
Geography
Silver City is located in the Humboldt-Toiyabe National Forest in Nye County, Nevada. It is located about 25 miles south of Tonopah, Nevada. The town is situated in a valley surrounded by mountains. The nearest major city is Las Vegas, which is about 200 miles away.
The climate in Silver City is semi-arid, with hot summers and cold winters. The average high temperature in the summer is around 90 degrees Fahrenheit, and the average low temperature in the winter is around 20 degrees Fahrenheit.
Economy
The economy of Silver City is largely based on tourism. The town is a popular destination for hikers, campers, and other outdoor enthusiasts. There are several campgrounds and RV parks in the area, as well as several restaurants and stores.
The town is also home to several small businesses, including a gas station, a grocery store, and a hardware store. The town is also home to several art galleries and antique stores.
Demographics
As of the 2010 census, the population of Silver City was 109 people. The racial makeup of the town was 95.4% White, 0.9% Native American, 0.9% Asian, 0.9% from other races, and 2.8% from two or more races. The median household income was $37,500 and the median family income was $41,250.
Conclusion
Silver City is a small unincorporated community located in the Humboldt-Toiyabe National Forest in Nye County, Nevada. It was founded in 1869 and was once a bustling mining town. The town is now largely dependent on tourism, with several campgrounds and RV parks, as well as several restaurants and stores. The population of Silver City was 109 people as of the 2010 census.
Common Questions
What is Per Capita Income in Silver City?
Per Capita income in Silver City is $26,881.
What is the Median Family Income in Silver City?
Median Family Income in Silver City is $77,250.
What is the Median Household income in Silver City?
Median Household Income in Silver City is $76,750.
What is Inequality or Gini Index in Silver City?
Inequality or Gini Index in Silver City is 0.27.
What is the Total Population of Silver City?
Total Population of Silver City is 105.
What is the Total Male Population of Silver City?
Total Male Population of Silver City is 57.
What is the Total Female Population of Silver City?
Total Female Population of Silver City is 48.
What is the Ratio of Males per 100 Females in Silver City?
There are 118.75 Males per 100 Females in Silver City.
What is the Ratio of Females per 100 Males in Silver City?
There are 84.21 Females per 100 Males in Silver City.
What is the Median Population Age in Silver City?
Median Population Age in Silver City is 36.3 Years.
What is the Average Family Size in Silver City
Average Family Size in Silver City is 3.1 People.
What is the Average Household Size in Silver City
Average Household Size in Silver City is 2.7 People.
How Large is the Labor Force in Silver City?
There are 35 People in the Labor Forcein in Silver City.
What is the Percentage of People in the Labor Force in Silver City?
46.7% of People are in the Labor Force in Silver City.