Pioche, NV Map & Demographics
Pioche Map
Pioche Overview
$27,412
PER CAPITA INCOME
$74,441
AVG FAMILY INCOME
$73,849
AVG HOUSEHOLD INCOME
0.22
INEQUALITY / GINI INDEX
1,111
TOTAL POPULATION
903
MALE POPULATION
208
FEMALE POPULATION
434.13
MALES / 100 FEMALES
23.03
FEMALES / 100 MALES
45.5
MEDIAN AGE
2.4
AVG FAMILY SIZE
2.2
AVG HOUSEHOLD SIZE
367
LABOR FORCE [ PEOPLE ]
35.6%
PERCENT IN LABOR FORCE
15.0%
UNEMPLOYMENT RATE
Pioche Zip Codes
Pioche Area Codes
Income in Pioche
Income Overview in Pioche
Per Capita Income in Pioche is $27,412, while median incomes of families and households are $74,441 and $73,849 respectively.
| Characteristic | Number | Measure |
| Per Capita Income | 1,111 | $27,412 |
| Median Family Income | 239 | $74,441 |
| Mean Family Income | 239 | $88,664 |
| Median Household Income | 317 | $73,849 |
| Mean Household Income | 317 | $82,973 |
| Income Deficit | 239 | $0 |
| Wage / Income Gap (%) | 1,111 | 0.00% |
| Wage / Income Gap ($) | 1,111 | 100.00¢ per $1 |
| Gini / Inequality Index | 1,111 | 0.22 |
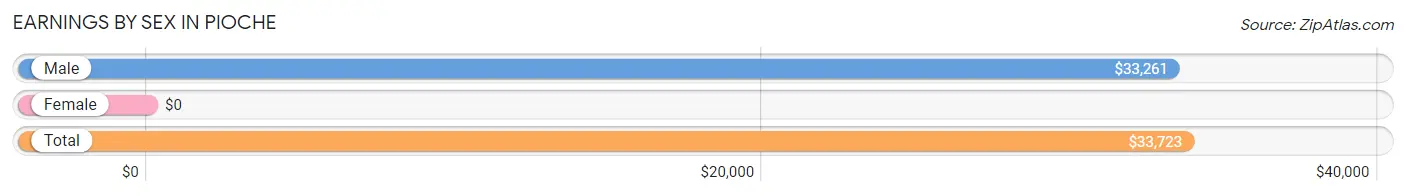
Earnings by Sex in Pioche
| Sex | Number | Average Earnings |
| Male | 450 (85.7%) | $33,261 |
| Female | 75 (14.3%) | $0 |
| Total | 525 (100.0%) | $33,723 |
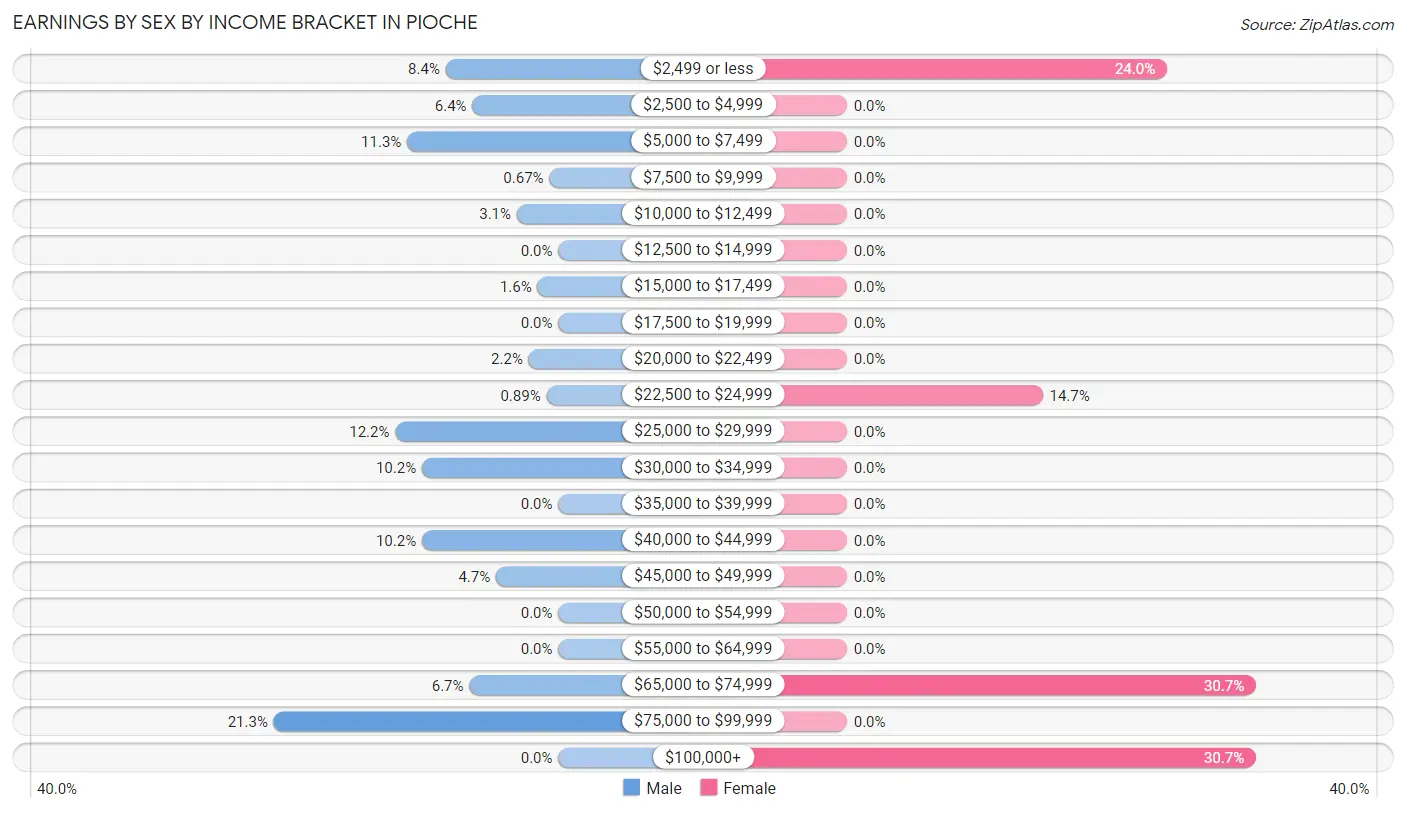
Earnings by Sex by Income Bracket in Pioche
The most common earnings brackets in Pioche are $75,000 to $99,999 for men (96 | 21.3%) and $65,000 to $74,999 for women (23 | 30.7%).
| Income | Male | Female |
| $2,499 or less | 38 (8.4%) | 18 (24.0%) |
| $2,500 to $4,999 | 29 (6.4%) | 0 (0.0%) |
| $5,000 to $7,499 | 51 (11.3%) | 0 (0.0%) |
| $7,500 to $9,999 | 3 (0.7%) | 0 (0.0%) |
| $10,000 to $12,499 | 14 (3.1%) | 0 (0.0%) |
| $12,500 to $14,999 | 0 (0.0%) | 0 (0.0%) |
| $15,000 to $17,499 | 7 (1.6%) | 0 (0.0%) |
| $17,500 to $19,999 | 0 (0.0%) | 0 (0.0%) |
| $20,000 to $22,499 | 10 (2.2%) | 0 (0.0%) |
| $22,500 to $24,999 | 4 (0.9%) | 11 (14.7%) |
| $25,000 to $29,999 | 55 (12.2%) | 0 (0.0%) |
| $30,000 to $34,999 | 46 (10.2%) | 0 (0.0%) |
| $35,000 to $39,999 | 0 (0.0%) | 0 (0.0%) |
| $40,000 to $44,999 | 46 (10.2%) | 0 (0.0%) |
| $45,000 to $49,999 | 21 (4.7%) | 0 (0.0%) |
| $50,000 to $54,999 | 0 (0.0%) | 0 (0.0%) |
| $55,000 to $64,999 | 0 (0.0%) | 0 (0.0%) |
| $65,000 to $74,999 | 30 (6.7%) | 23 (30.7%) |
| $75,000 to $99,999 | 96 (21.3%) | 0 (0.0%) |
| $100,000+ | 0 (0.0%) | 23 (30.7%) |
| Total | 450 (100.0%) | 75 (100.0%) |
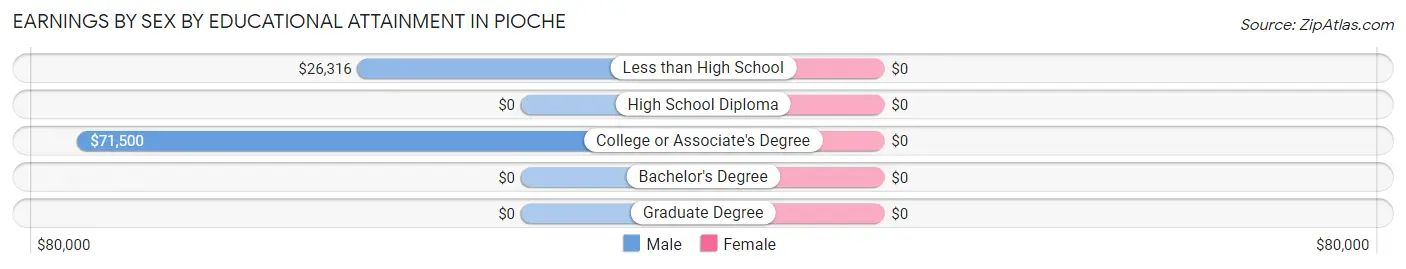
Earnings by Sex by Educational Attainment in Pioche
| Educational Attainment | Male Income | Female Income |
| Less than High School | $26,316 | $0 |
| High School Diploma | - | - |
| College or Associate's Degree | $71,500 | $0 |
| Bachelor's Degree | - | - |
| Graduate Degree | - | - |
| Total | $40,954 | $0 |
Family Income in Pioche
Family Income Brackets in Pioche
According to the Pioche family income data, there are 118 families falling into the $50,000 to $74,999 income range, which is the most common income bracket and makes up 49.4% of all families.
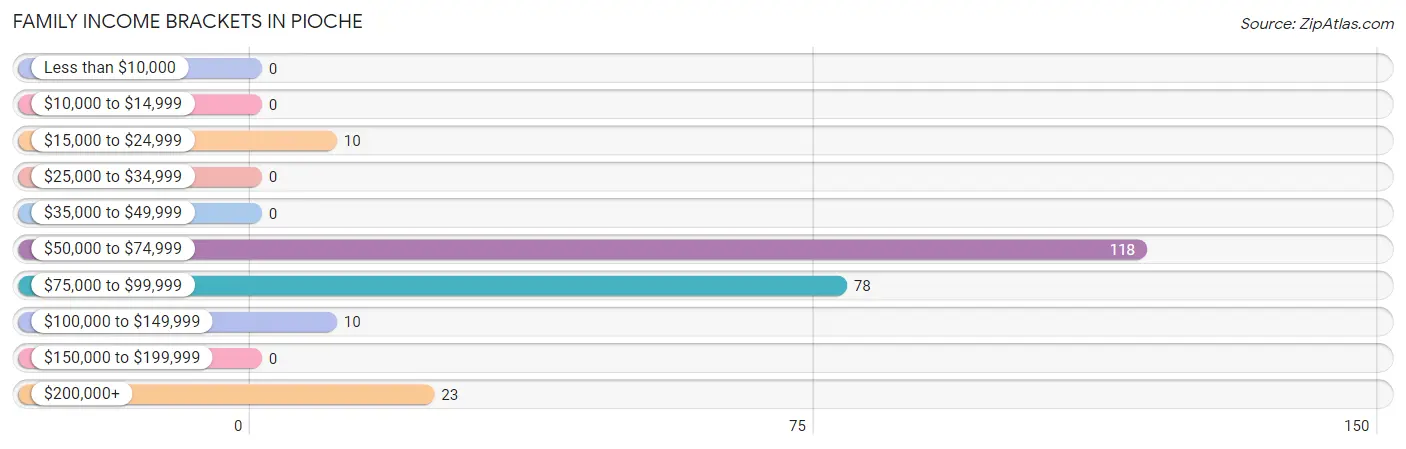
| Income Bracket | # Families | % Families |
| Less than $10,000 | 0 | 0.0% |
| $10,000 to $14,999 | 0 | 0.0% |
| $15,000 to $24,999 | 10 | 4.2% |
| $25,000 to $34,999 | 0 | 0.0% |
| $35,000 to $49,999 | 0 | 0.0% |
| $50,000 to $74,999 | 118 | 49.4% |
| $75,000 to $99,999 | 78 | 32.6% |
| $100,000 to $149,999 | 10 | 4.2% |
| $150,000 to $199,999 | 0 | 0.0% |
| $200,000+ | 23 | 9.6% |
Family Income by Famaliy Size in Pioche
2-person families (182 | 76.1%) account for the highest median family income in Pioche with $74,276 per family, while 2-person families (182 | 76.1%) have the highest median income of $37,138 per family member.
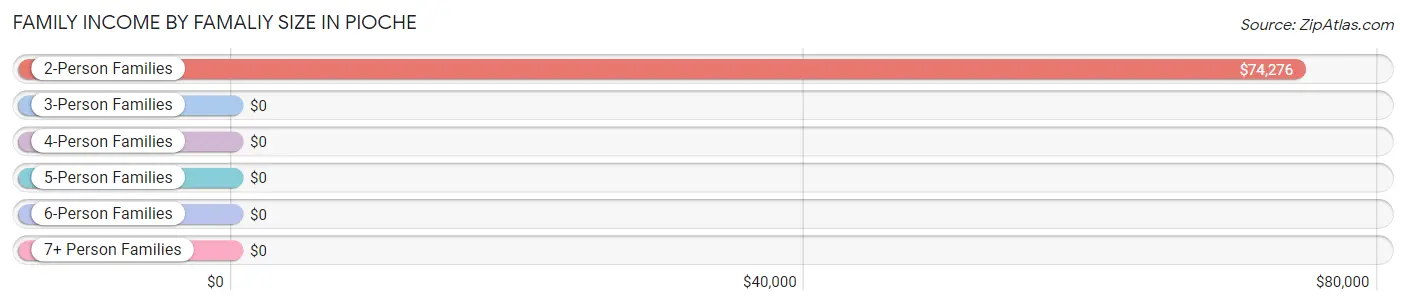
| Income Bracket | # Families | Median Income |
| 2-Person Families | 182 (76.1%) | $74,276 |
| 3-Person Families | 31 (13.0%) | $0 |
| 4-Person Families | 0 (0.0%) | $0 |
| 5-Person Families | 26 (10.9%) | $0 |
| 6-Person Families | 0 (0.0%) | $0 |
| 7+ Person Families | 0 (0.0%) | $0 |
| Total | 239 (100.0%) | $74,441 |
Family Income by Number of Earners in Pioche
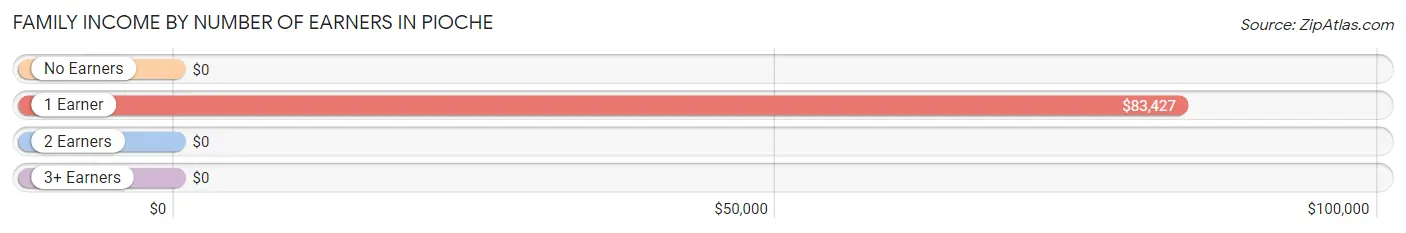
| Number of Earners | # Families | Median Income |
| No Earners | 34 (14.2%) | $0 |
| 1 Earner | 103 (43.1%) | $83,427 |
| 2 Earners | 102 (42.7%) | $0 |
| 3+ Earners | 0 (0.0%) | $0 |
| Total | 239 (100.0%) | $74,441 |
Household Income in Pioche
Household Income Brackets in Pioche
With 137 households falling in the category, the $50,000 to $74,999 income range is the most frequent in Pioche, accounting for 43.2% of all households.
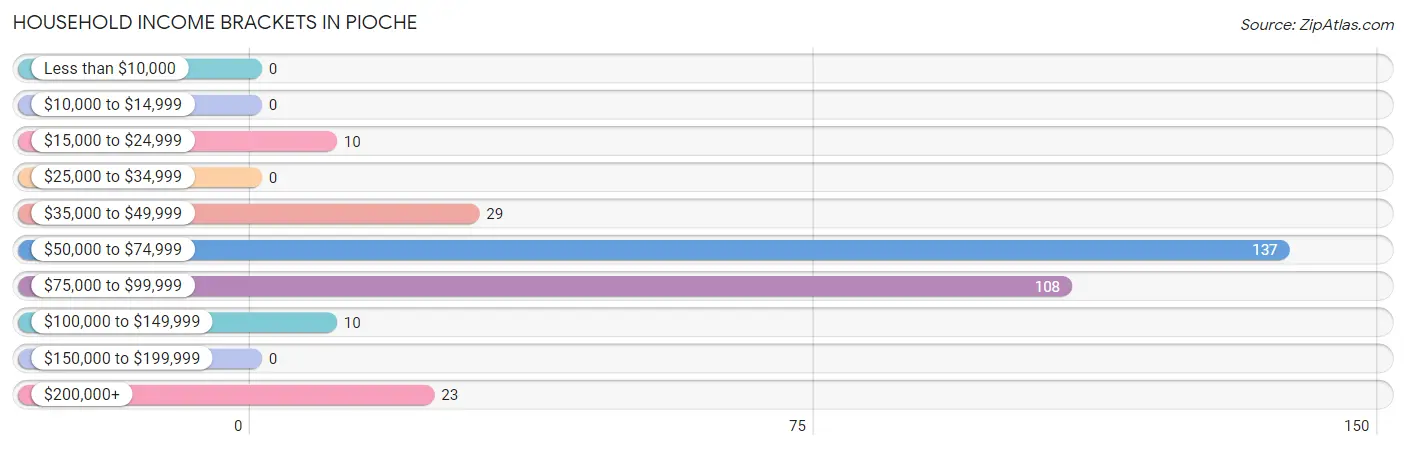
| Income Bracket | # Households | % Households |
| Less than $10,000 | 0 | 0.0% |
| $10,000 to $14,999 | 0 | 0.0% |
| $15,000 to $24,999 | 10 | 3.2% |
| $25,000 to $34,999 | 0 | 0.0% |
| $35,000 to $49,999 | 29 | 9.1% |
| $50,000 to $74,999 | 137 | 43.2% |
| $75,000 to $99,999 | 108 | 34.1% |
| $100,000 to $149,999 | 10 | 3.2% |
| $150,000 to $199,999 | 0 | 0.0% |
| $200,000+ | 23 | 7.3% |
Household Income by Householder Age in Pioche
The median household income in Pioche is $73,849, with the highest median household income of $83,145 found in the 45 to 64 years age bracket for the primary householder. A total of 202 households (63.7%) fall into this category.
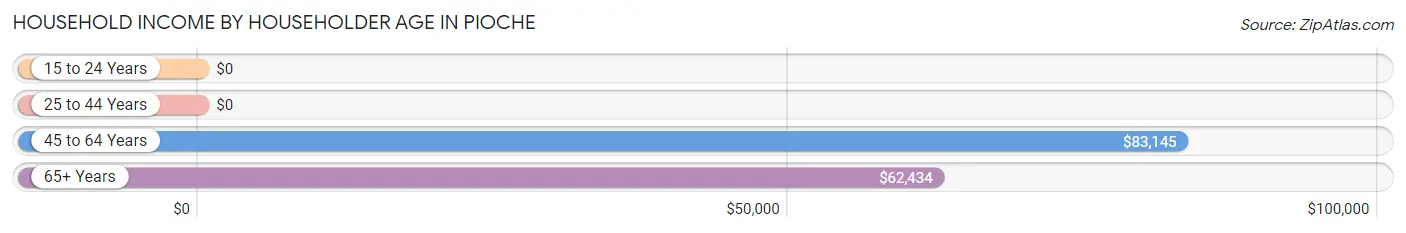
| Income Bracket | # Households | Median Income |
| 15 to 24 Years | 0 (0.0%) | $0 |
| 25 to 44 Years | 20 (6.3%) | $0 |
| 45 to 64 Years | 202 (63.7%) | $83,145 |
| 65+ Years | 95 (30.0%) | $62,434 |
| Total | 317 (100.0%) | $73,849 |
Poverty in Pioche
Income Below Poverty by Sex and Age in Pioche
With 10.5% poverty level for males and 11.5% for females among the residents of Pioche, 6 to 11 year old males and 6 to 11 year old females are the most vulnerable to poverty, with 13 males (100.0%) and 14 females (60.9%) in their respective age groups living below the poverty level.
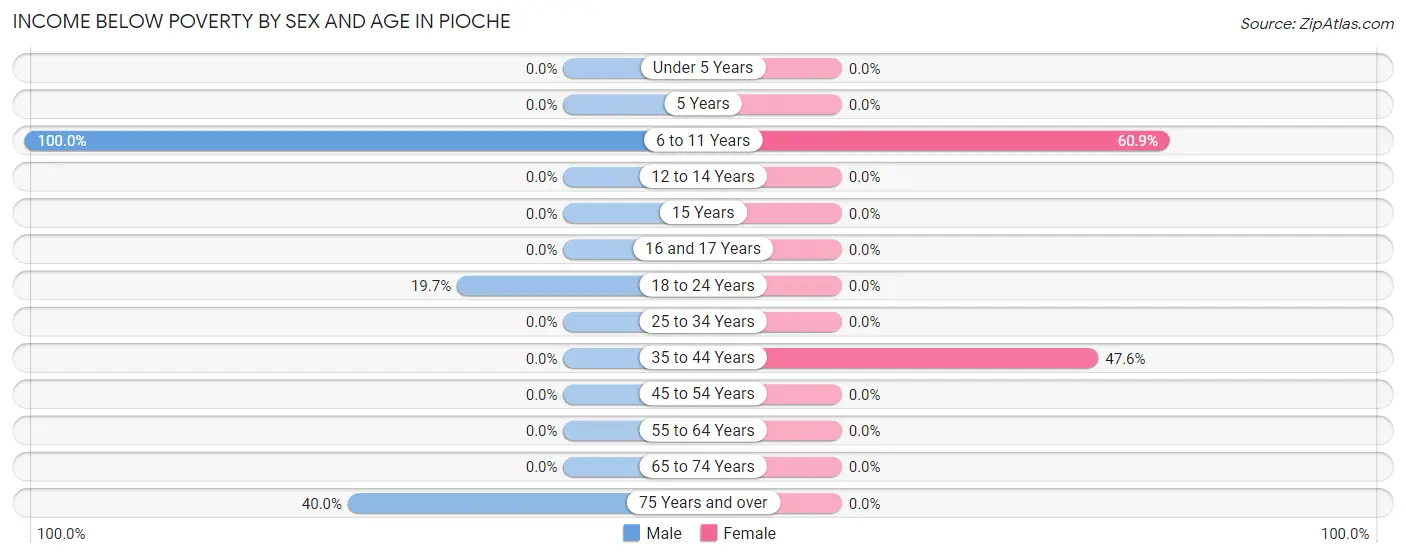
| Age Bracket | Male | Female |
| Under 5 Years | 0 (0.0%) | 0 (0.0%) |
| 5 Years | 0 (0.0%) | 0 (0.0%) |
| 6 to 11 Years | 13 (100.0%) | 14 (60.9%) |
| 12 to 14 Years | 0 (0.0%) | 0 (0.0%) |
| 15 Years | 0 (0.0%) | 0 (0.0%) |
| 16 and 17 Years | 0 (0.0%) | 0 (0.0%) |
| 18 to 24 Years | 15 (19.7%) | 0 (0.0%) |
| 25 to 34 Years | 0 (0.0%) | 0 (0.0%) |
| 35 to 44 Years | 0 (0.0%) | 10 (47.6%) |
| 45 to 54 Years | 0 (0.0%) | 0 (0.0%) |
| 55 to 64 Years | 0 (0.0%) | 0 (0.0%) |
| 65 to 74 Years | 0 (0.0%) | 0 (0.0%) |
| 75 Years and over | 22 (40.0%) | 0 (0.0%) |
| Total | 50 (10.5%) | 24 (11.5%) |
Income Above Poverty by Sex and Age in Pioche
According to the poverty statistics in Pioche, males aged 12 to 14 years and females aged 45 to 54 years are the age groups that are most secure financially, with 100.0% of males and 100.0% of females in these age groups living above the poverty line.
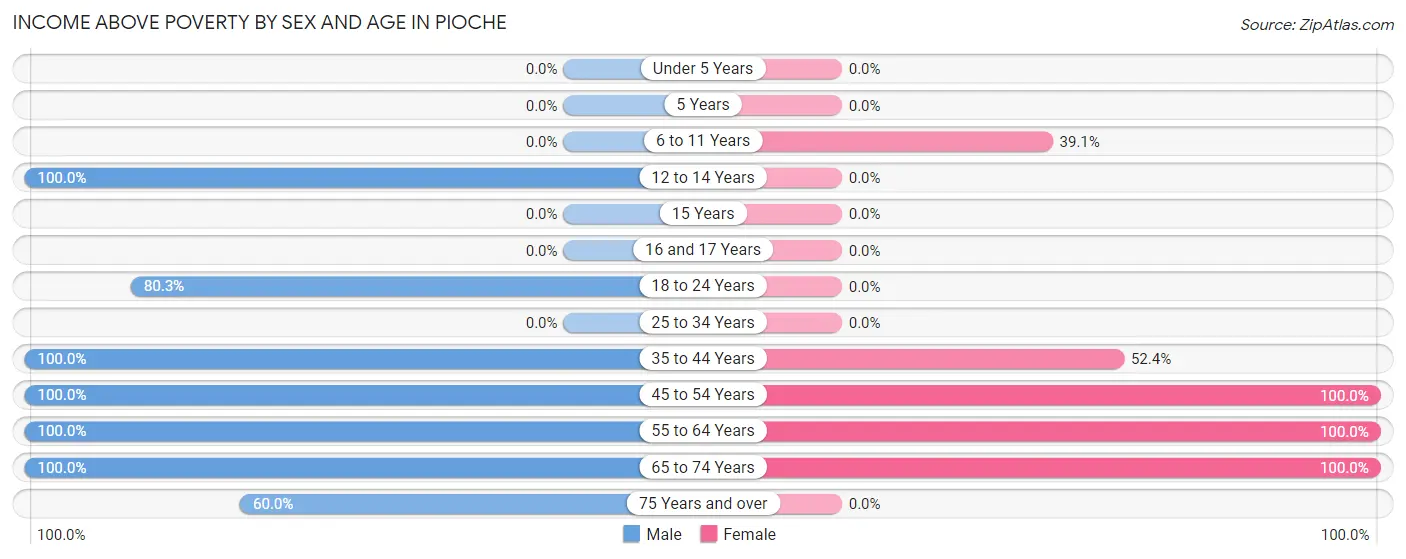
| Age Bracket | Male | Female |
| Under 5 Years | 0 (0.0%) | 0 (0.0%) |
| 5 Years | 0 (0.0%) | 0 (0.0%) |
| 6 to 11 Years | 0 (0.0%) | 9 (39.1%) |
| 12 to 14 Years | 43 (100.0%) | 0 (0.0%) |
| 15 Years | 0 (0.0%) | 0 (0.0%) |
| 16 and 17 Years | 0 (0.0%) | 0 (0.0%) |
| 18 to 24 Years | 61 (80.3%) | 0 (0.0%) |
| 25 to 34 Years | 0 (0.0%) | 0 (0.0%) |
| 35 to 44 Years | 23 (100.0%) | 11 (52.4%) |
| 45 to 54 Years | 31 (100.0%) | 64 (100.0%) |
| 55 to 64 Years | 177 (100.0%) | 39 (100.0%) |
| 65 to 74 Years | 60 (100.0%) | 61 (100.0%) |
| 75 Years and over | 33 (60.0%) | 0 (0.0%) |
| Total | 428 (89.5%) | 184 (88.5%) |
Income Below Poverty Among Married-Couple Families in Pioche
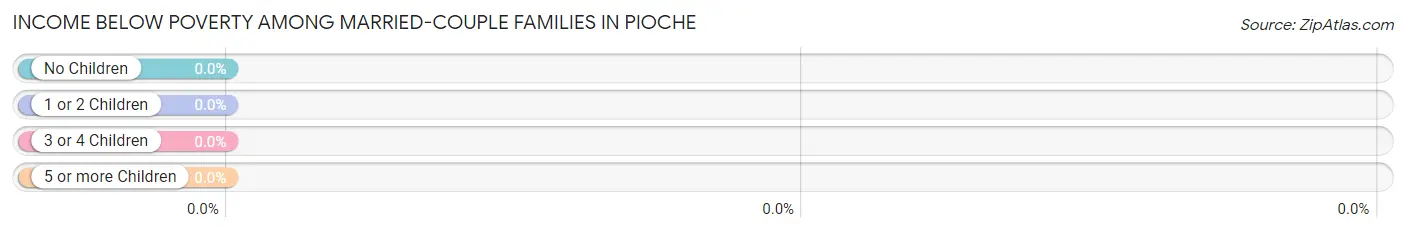
| Children | Above Poverty | Below Poverty |
| No Children | 144 (100.0%) | 0 (0.0%) |
| 1 or 2 Children | 16 (100.0%) | 0 (0.0%) |
| 3 or 4 Children | 0 (0.0%) | 0 (0.0%) |
| 5 or more Children | 0 (0.0%) | 0 (0.0%) |
| Total | 160 (100.0%) | 0 (0.0%) |
Income Below Poverty Among Single-Parent Households in Pioche
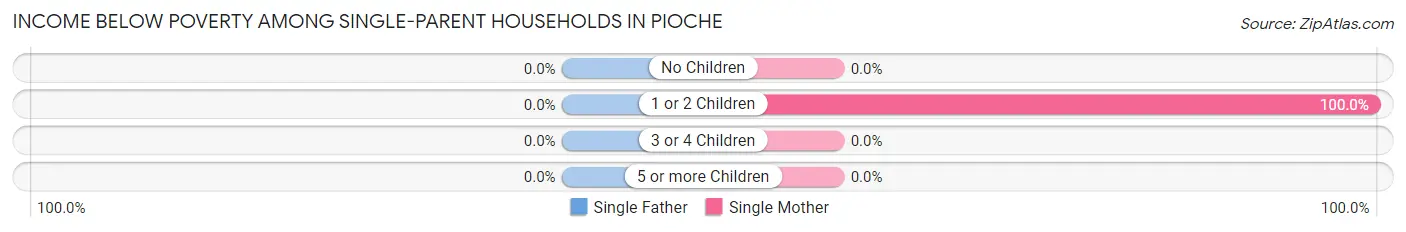
| Children | Single Father | Single Mother |
| No Children | 0 (0.0%) | 0 (0.0%) |
| 1 or 2 Children | 0 (0.0%) | 10 (100.0%) |
| 3 or 4 Children | 0 (0.0%) | 0 (0.0%) |
| 5 or more Children | 0 (0.0%) | 0 (0.0%) |
| Total | 0 (0.0%) | 10 (100.0%) |
Income Below Poverty Among Married-Couple vs Single-Parent Households in Pioche
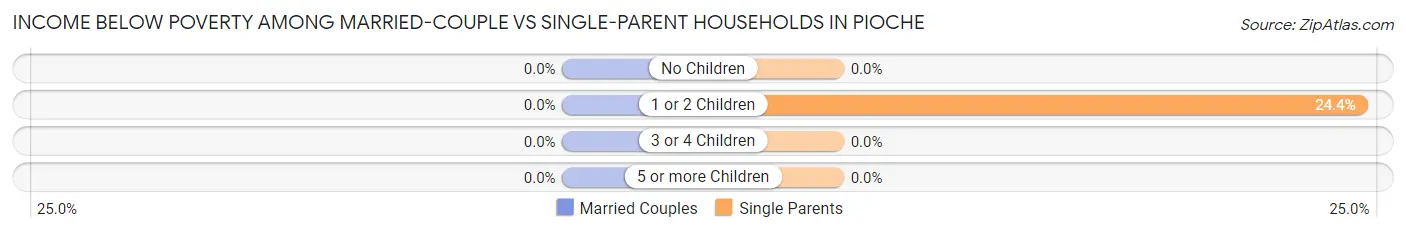
| Children | Married-Couple Families | Single-Parent Households |
| No Children | 0 (0.0%) | 0 (0.0%) |
| 1 or 2 Children | 0 (0.0%) | 10 (24.4%) |
| 3 or 4 Children | 0 (0.0%) | 0 (0.0%) |
| 5 or more Children | 0 (0.0%) | 0 (0.0%) |
| Total | 0 (0.0%) | 10 (12.7%) |
Race in Pioche
The most populous races in Pioche are White / Caucasian (846 | 76.1%), Black / African American (182 | 16.4%), and Hispanic or Latino (112 | 10.1%).
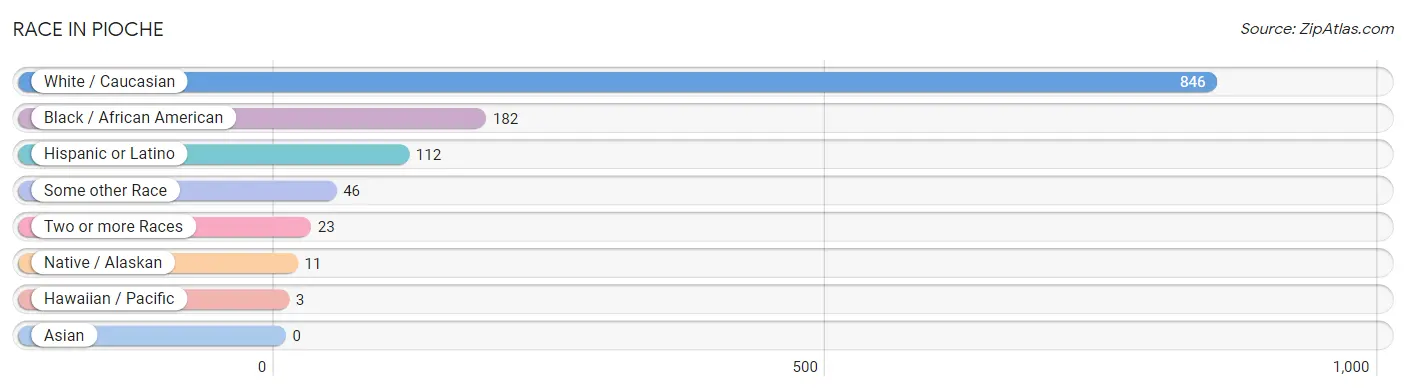
| Race | # Population | % Population |
| Asian | 0 | 0.0% |
| Black / African American | 182 | 16.4% |
| Hawaiian / Pacific | 3 | 0.3% |
| Hispanic or Latino | 112 | 10.1% |
| Native / Alaskan | 11 | 1.0% |
| White / Caucasian | 846 | 76.1% |
| Two or more Races | 23 | 2.1% |
| Some other Race | 46 | 4.1% |
| Total | 1,111 | 100.0% |
Ancestry in Pioche
The most populous ancestries reported in Pioche are German (205 | 18.4%), English (140 | 12.6%), Italian (94 | 8.5%), Mexican (84 | 7.6%), and Irish (74 | 6.7%), together accounting for 53.7% of all Pioche residents.
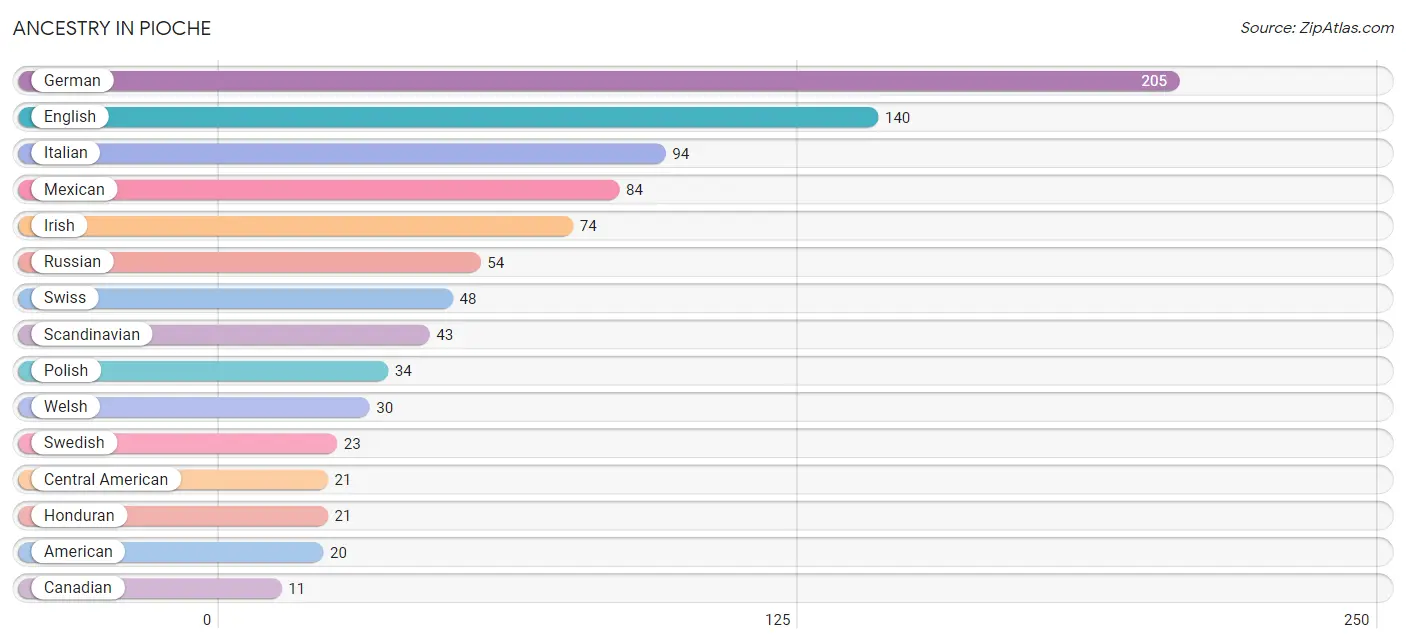
| Ancestry | # Population | % Population |
| American | 20 | 1.8% |
| Canadian | 11 | 1.0% |
| Central American | 21 | 1.9% |
| Cuban | 3 | 0.3% |
| Czech | 8 | 0.7% |
| English | 140 | 12.6% |
| French | 10 | 0.9% |
| German | 205 | 18.4% |
| Honduran | 21 | 1.9% |
| Irish | 74 | 6.7% |
| Italian | 94 | 8.5% |
| Mexican | 84 | 7.6% |
| Native Hawaiian | 9 | 0.8% |
| Polish | 34 | 3.1% |
| Portuguese | 7 | 0.6% |
| Russian | 54 | 4.9% |
| Scandinavian | 43 | 3.9% |
| Spaniard | 4 | 0.4% |
| Swedish | 23 | 2.1% |
| Swiss | 48 | 4.3% |
| Welsh | 30 | 2.7% |
| Yaqui | 11 | 1.0% | View All 22 Rows |
Immigrants in Pioche
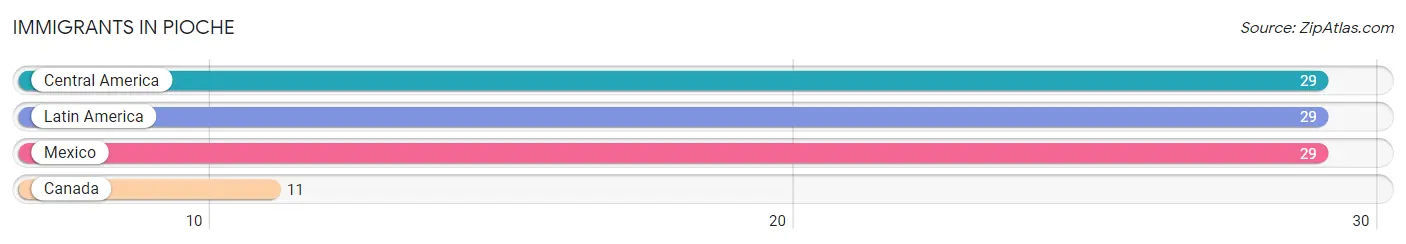
The most numerous immigrant groups reported in Pioche came from Central America (29 | 2.6%), Latin America (29 | 2.6%), Mexico (29 | 2.6%), and Canada (11 | 1.0%), together accounting for 8.8% of all Pioche residents.
| Immigration Origin | # Population | % Population |
| Canada | 11 | 1.0% |
| Central America | 29 | 2.6% |
| Latin America | 29 | 2.6% |
| Mexico | 29 | 2.6% | View All 4 Rows |
Sex and Age in Pioche
Sex and Age in Pioche
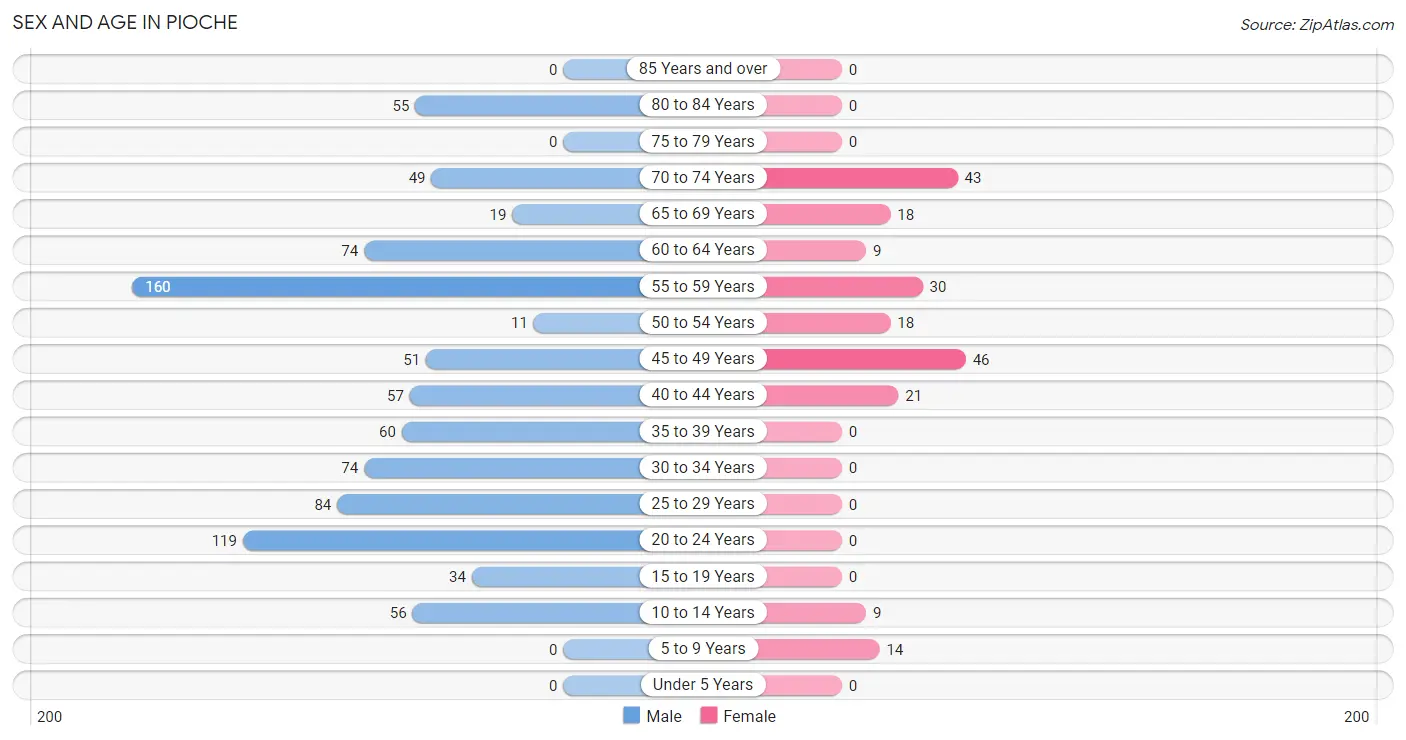
The most populous age groups in Pioche are 55 to 59 Years (160 | 17.7%) for men and 45 to 49 Years (46 | 22.1%) for women.
| Age Bracket | Male | Female |
| Under 5 Years | 0 (0.0%) | 0 (0.0%) |
| 5 to 9 Years | 0 (0.0%) | 14 (6.7%) |
| 10 to 14 Years | 56 (6.2%) | 9 (4.3%) |
| 15 to 19 Years | 34 (3.8%) | 0 (0.0%) |
| 20 to 24 Years | 119 (13.2%) | 0 (0.0%) |
| 25 to 29 Years | 84 (9.3%) | 0 (0.0%) |
| 30 to 34 Years | 74 (8.2%) | 0 (0.0%) |
| 35 to 39 Years | 60 (6.6%) | 0 (0.0%) |
| 40 to 44 Years | 57 (6.3%) | 21 (10.1%) |
| 45 to 49 Years | 51 (5.7%) | 46 (22.1%) |
| 50 to 54 Years | 11 (1.2%) | 18 (8.6%) |
| 55 to 59 Years | 160 (17.7%) | 30 (14.4%) |
| 60 to 64 Years | 74 (8.2%) | 9 (4.3%) |
| 65 to 69 Years | 19 (2.1%) | 18 (8.6%) |
| 70 to 74 Years | 49 (5.4%) | 43 (20.7%) |
| 75 to 79 Years | 0 (0.0%) | 0 (0.0%) |
| 80 to 84 Years | 55 (6.1%) | 0 (0.0%) |
| 85 Years and over | 0 (0.0%) | 0 (0.0%) |
| Total | 903 (100.0%) | 208 (100.0%) |
Families and Households in Pioche
Median Family Size in Pioche
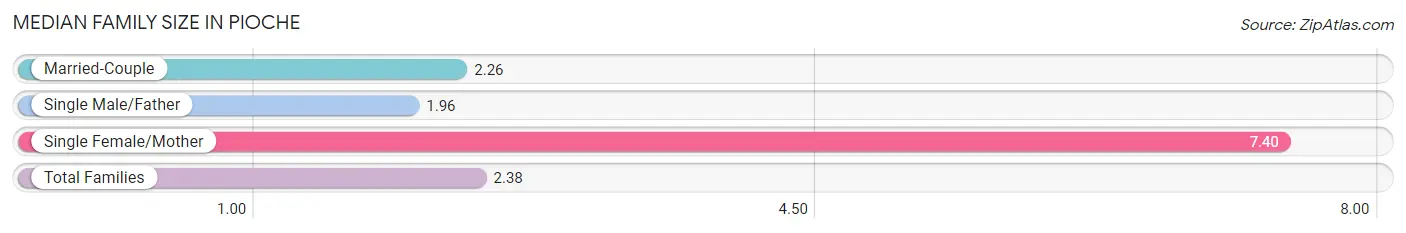
The median family size in Pioche is 2.38 persons per family, with single female/mother families (10 | 4.2%) accounting for the largest median family size of 7.4 persons per family. On the other hand, single male/father families (69 | 28.9%) represent the smallest median family size with 1.96 persons per family.
| Family Type | # Families | Family Size |
| Married-Couple | 160 (66.9%) | 2.26 |
| Single Male/Father | 69 (28.9%) | 1.96 |
| Single Female/Mother | 10 (4.2%) | 7.40 |
| Total Families | 239 (100.0%) | 2.38 |
Median Household Size in Pioche
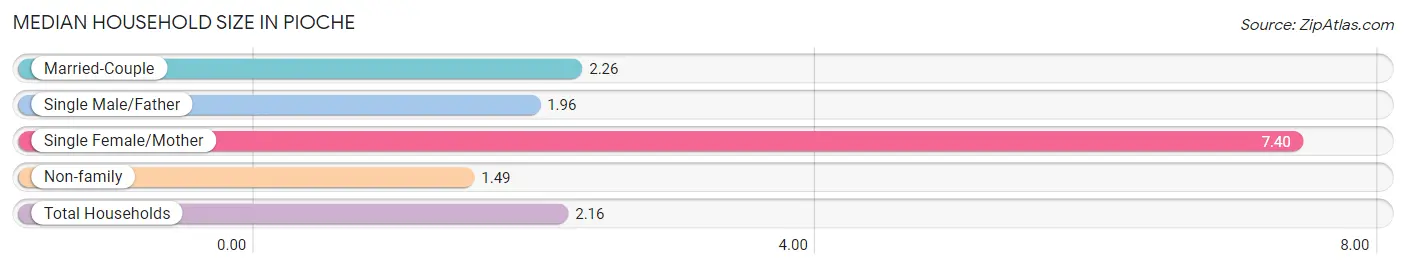
The median household size in Pioche is 2.16 persons per household, with single female/mother households (10 | 3.2%) accounting for the largest median household size of 7.4 persons per household. non-family households (78 | 24.6%) represent the smallest median household size with 1.49 persons per household.
| Household Type | # Households | Household Size |
| Married-Couple | 160 (50.5%) | 2.26 |
| Single Male/Father | 69 (21.8%) | 1.96 |
| Single Female/Mother | 10 (3.2%) | 7.40 |
| Non-family | 78 (24.6%) | 1.49 |
| Total Households | 317 (100.0%) | 2.16 |
Household Size by Marriage Status in Pioche
Out of a total of 317 households in Pioche, 239 (75.4%) are family households, while 78 (24.6%) are nonfamily households. The most numerous type of family households are 2-person households, comprising 182, and the most common type of nonfamily households are 1-person households, comprising 60.
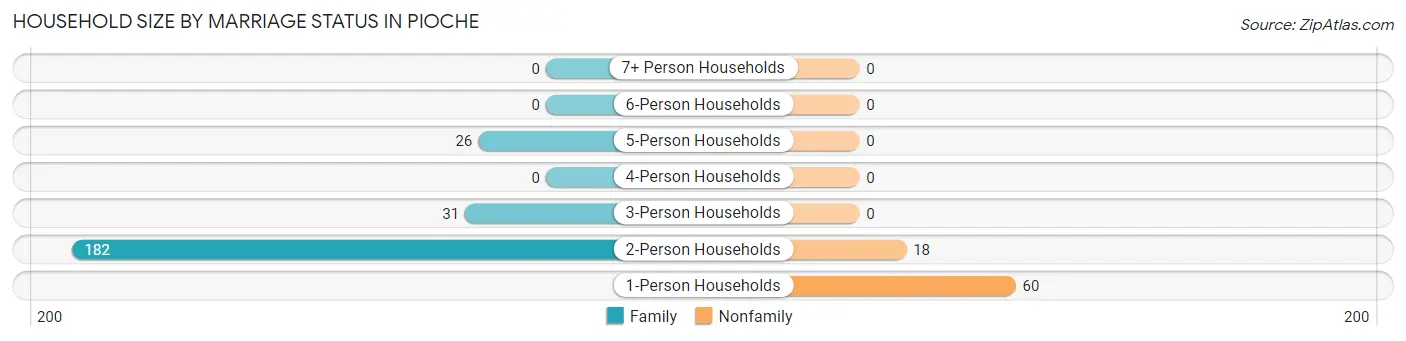
| Household Size | Family Households | Nonfamily Households |
| 1-Person Households | - | 60 (18.9%) |
| 2-Person Households | 182 (57.4%) | 18 (5.7%) |
| 3-Person Households | 31 (9.8%) | 0 (0.0%) |
| 4-Person Households | 0 (0.0%) | 0 (0.0%) |
| 5-Person Households | 26 (8.2%) | 0 (0.0%) |
| 6-Person Households | 0 (0.0%) | 0 (0.0%) |
| 7+ Person Households | 0 (0.0%) | 0 (0.0%) |
| Total | 239 (75.4%) | 78 (24.6%) |
Female Fertility in Pioche
Fertility by Age in Pioche
| Age Bracket | Women with Births | Births / 1,000 Women |
| 15 to 19 years | 0 (0.0%) | 0.0 |
| 20 to 34 years | 0 (0.0%) | 0.0 |
| 35 to 50 years | 0 (0.0%) | 0.0 |
| Total | 0 (0.0%) | 0.0 |
Fertility by Age by Marriage Status in Pioche
| Age Bracket | Married | Unmarried |
| 15 to 19 years | 0 (0.0%) | 0 (0.0%) |
| 20 to 34 years | 0 (0.0%) | 0 (0.0%) |
| 35 to 50 years | 0 (0.0%) | 0 (0.0%) |
| Total | 0 (0.0%) | 0 (0.0%) |
Fertility by Education in Pioche
| Educational Attainment | Women with Births | Births / 1,000 Women |
| Less than High School | 0 (0.0%) | 0.0 |
| High School Diploma | 0 (0.0%) | 0.0 |
| College or Associate's Degree | 0 (0.0%) | 0.0 |
| Bachelor's Degree | 0 (0.0%) | 0.0 |
| Graduate Degree | 0 (0.0%) | 0.0 |
| Total | 0 (0.0%) | 0.0 |
Fertility by Education by Marriage Status in Pioche
| Educational Attainment | Married | Unmarried |
| Less than High School | 0 (0.0%) | 0 (0.0%) |
| High School Diploma | 0 (0.0%) | 0 (0.0%) |
| College or Associate's Degree | 0 (0.0%) | 0 (0.0%) |
| Bachelor's Degree | 0 (0.0%) | 0 (0.0%) |
| Graduate Degree | 0 (0.0%) | 0 (0.0%) |
| Total | 0 (0.0%) | 0 (0.0%) |
Employment Characteristics in Pioche
Employment by Class of Employer in Pioche
Among the 312 employed individuals in Pioche, private company employees (228 | 73.1%), state government employees (53 | 17.0%), and local government employees (31 | 9.9%) make up the most common classes of employment.
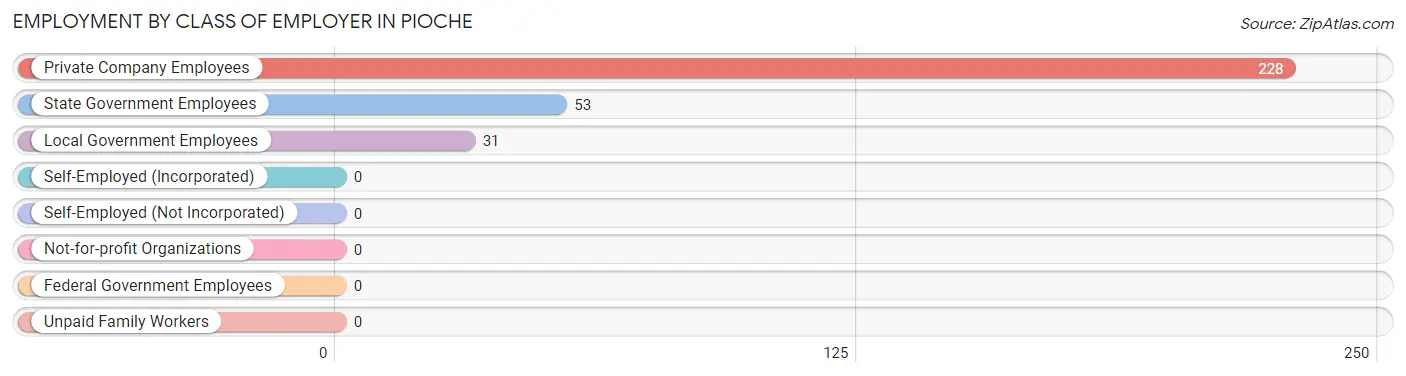
| Employer Class | # Employees | % Employees |
| Private Company Employees | 228 | 73.1% |
| Self-Employed (Incorporated) | 0 | 0.0% |
| Self-Employed (Not Incorporated) | 0 | 0.0% |
| Not-for-profit Organizations | 0 | 0.0% |
| Local Government Employees | 31 | 9.9% |
| State Government Employees | 53 | 17.0% |
| Federal Government Employees | 0 | 0.0% |
| Unpaid Family Workers | 0 | 0.0% |
| Total | 312 | 100.0% |
Employment Status by Age in Pioche
According to the labor force statistics for Pioche, out of the total population over 16 years of age (1,032), 35.6% or 367 individuals are in the labor force, with 15.0% or 55 of them unemployed. The age group with the highest labor force participation rate is 60 to 64 years, with 66.3% or 55 individuals in the labor force. Within the labor force, the 60 to 64 years age range has the highest percentage of unemployed individuals, with 54.5% or 30 of them being unemployed.
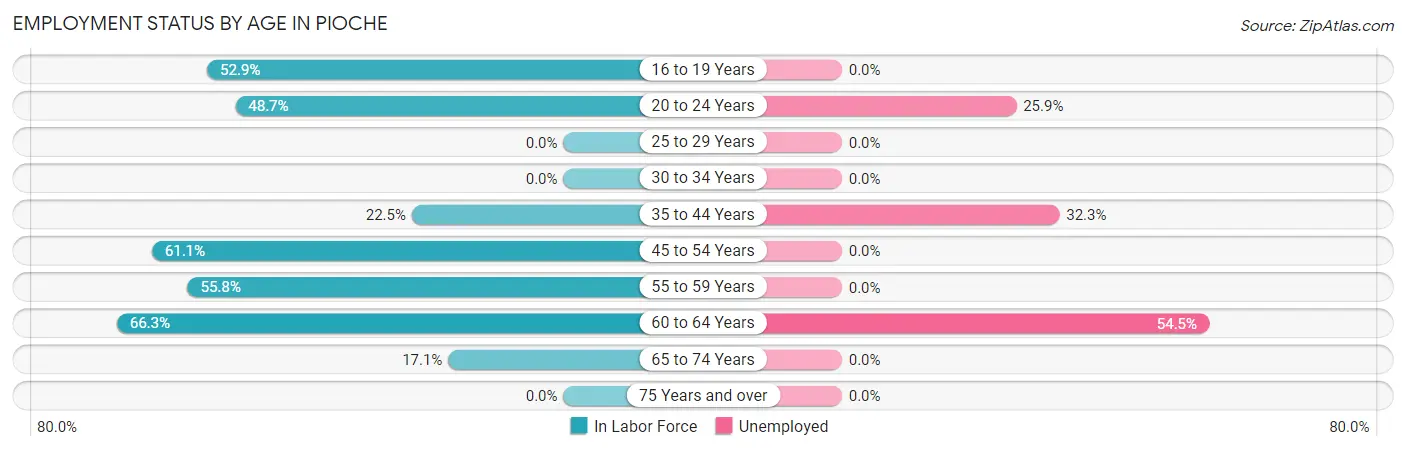
| Age Bracket | In Labor Force | Unemployed |
| 16 to 19 Years | 18 (52.9%) | 0 (0.0%) |
| 20 to 24 Years | 58 (48.7%) | 15 (25.9%) |
| 25 to 29 Years | 0 (0.0%) | 0 (0.0%) |
| 30 to 34 Years | 0 (0.0%) | 0 (0.0%) |
| 35 to 44 Years | 31 (22.5%) | 10 (32.3%) |
| 45 to 54 Years | 77 (61.1%) | 0 (0.0%) |
| 55 to 59 Years | 106 (55.8%) | 0 (0.0%) |
| 60 to 64 Years | 55 (66.3%) | 30 (54.5%) |
| 65 to 74 Years | 22 (17.1%) | 0 (0.0%) |
| 75 Years and over | 0 (0.0%) | 0 (0.0%) |
| Total | 367 (35.6%) | 55 (15.0%) |
Employment Status by Educational Attainment in Pioche
According to labor force statistics for Pioche, 38.7% of individuals (269) out of the total population between 25 and 64 years of age (695) are in the labor force, with 14.9% or 40 of them being unemployed. The group with the highest labor force participation rate are those with the educational attainment of bachelor's degree or higher, with 68.8% or 33 individuals in the labor force. Within the labor force, individuals with high school diploma education have the highest percentage of unemployment, with 38.0% or 30 of them being unemployed.
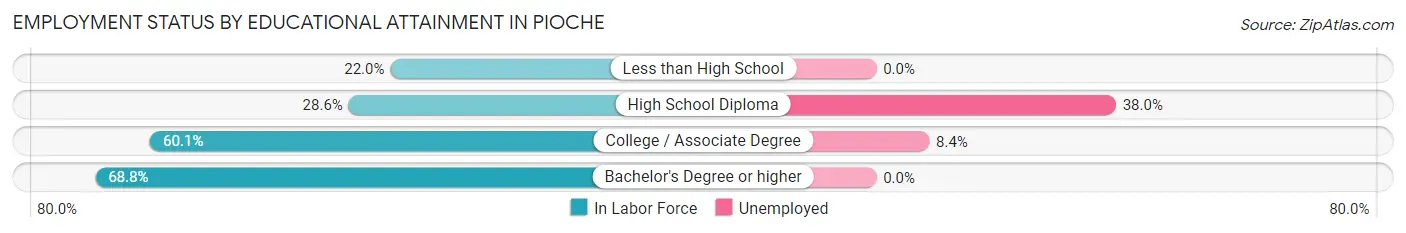
| Educational Attainment | In Labor Force | Unemployed |
| Less than High School | 38 (22.0%) | 0 (0.0%) |
| High School Diploma | 79 (28.6%) | 105 (38.0%) |
| College / Associate Degree | 119 (60.1%) | 17 (8.4%) |
| Bachelor's Degree or higher | 33 (68.8%) | 0 (0.0%) |
| Total | 269 (38.7%) | 104 (14.9%) |
Employment Occupations by Sex in Pioche
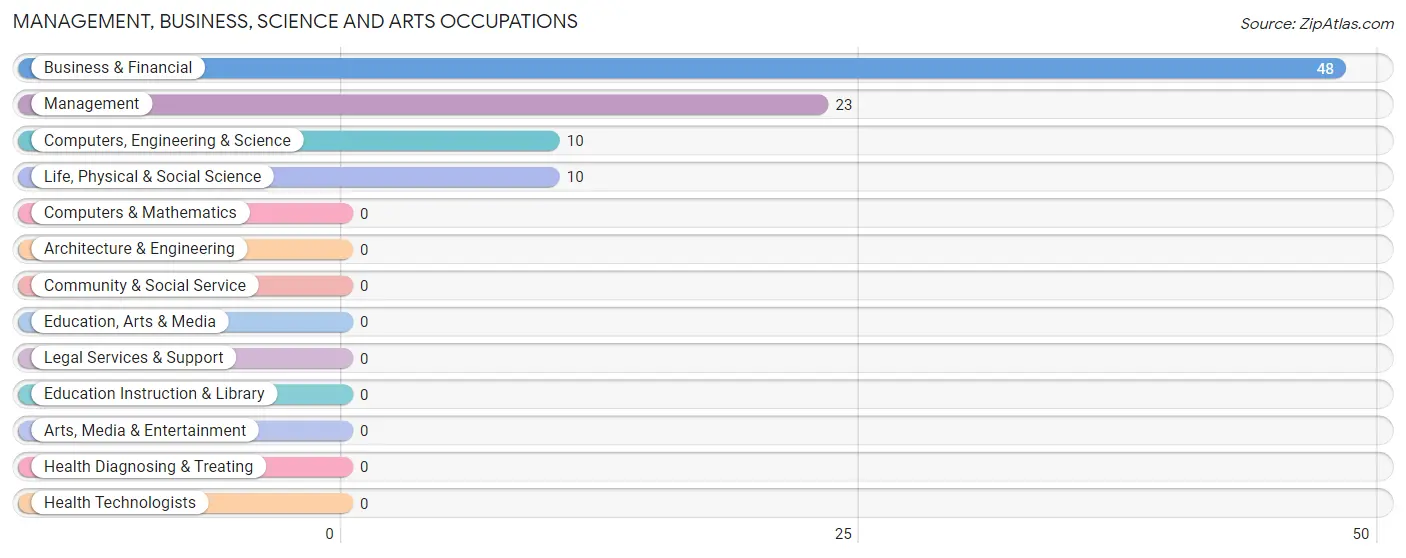
Management, Business, Science and Arts Occupations
The most common Management, Business, Science and Arts occupations in Pioche are Business & Financial (48 | 15.4%), Management (23 | 7.4%), Computers, Engineering & Science (10 | 3.2%), and Life, Physical & Social Science (10 | 3.2%).
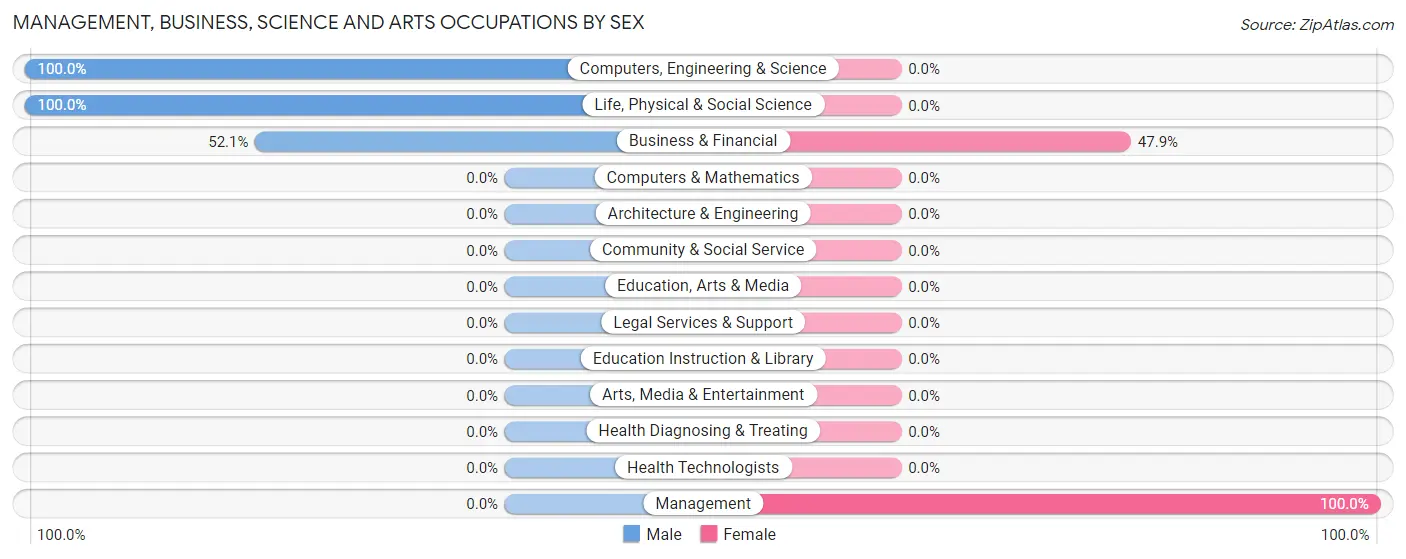
Management, Business, Science and Arts Occupations by Sex
Within the Management, Business, Science and Arts occupations in Pioche, the most male-oriented occupations are Computers, Engineering & Science (100.0%), Life, Physical & Social Science (100.0%), and Business & Financial (52.1%), while the most female-oriented occupations are Management (100.0%), and Business & Financial (47.9%).
| Occupation | Male | Female |
| Management | 0 (0.0%) | 23 (100.0%) |
| Business & Financial | 25 (52.1%) | 23 (47.9%) |
| Computers, Engineering & Science | 10 (100.0%) | 0 (0.0%) |
| Computers & Mathematics | 0 (0.0%) | 0 (0.0%) |
| Architecture & Engineering | 0 (0.0%) | 0 (0.0%) |
| Life, Physical & Social Science | 10 (100.0%) | 0 (0.0%) |
| Community & Social Service | 0 (0.0%) | 0 (0.0%) |
| Education, Arts & Media | 0 (0.0%) | 0 (0.0%) |
| Legal Services & Support | 0 (0.0%) | 0 (0.0%) |
| Education Instruction & Library | 0 (0.0%) | 0 (0.0%) |
| Arts, Media & Entertainment | 0 (0.0%) | 0 (0.0%) |
| Health Diagnosing & Treating | 0 (0.0%) | 0 (0.0%) |
| Health Technologists | 0 (0.0%) | 0 (0.0%) |
| Total (Category) | 35 (43.2%) | 46 (56.8%) |
| Total (Overall) | 255 (81.7%) | 57 (18.3%) |
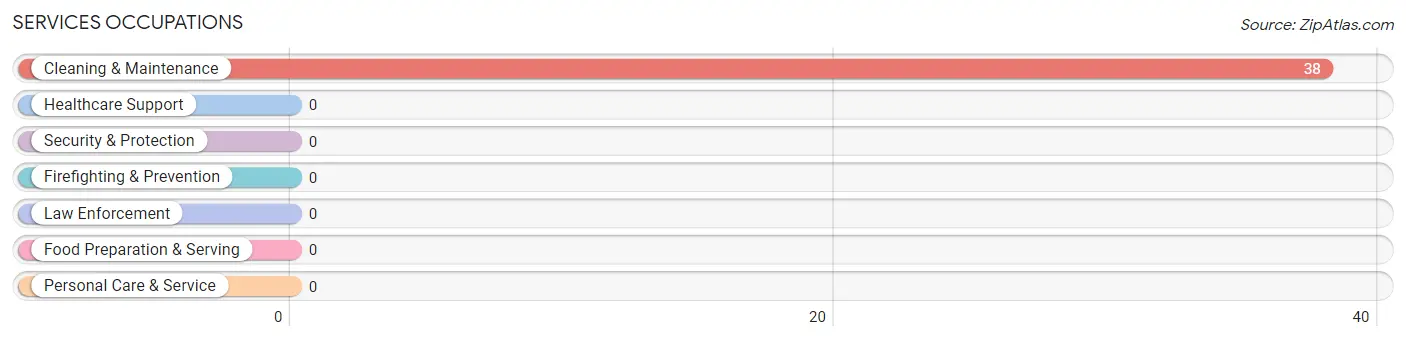
Services Occupations
The most common Services occupations in Pioche are , and Cleaning & Maintenance (38 | 12.2%).
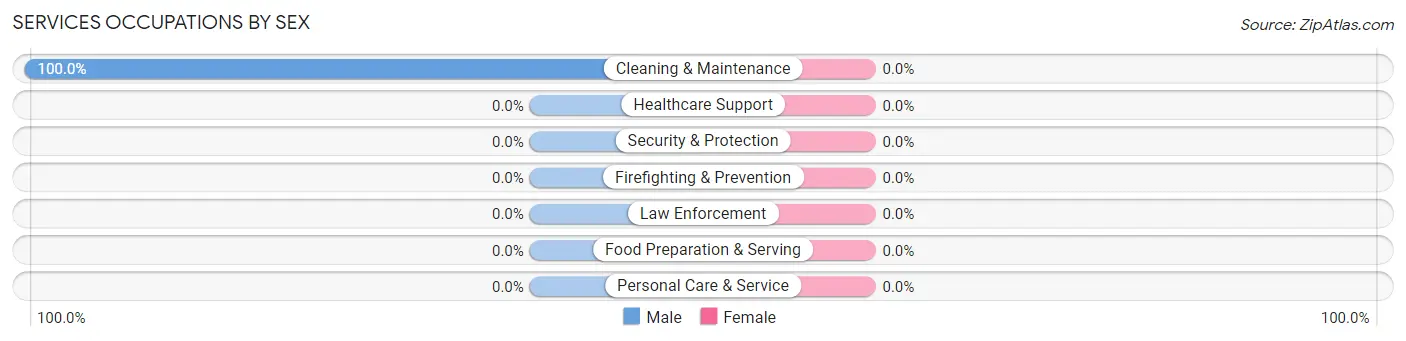
Services Occupations by Sex
| Occupation | Male | Female |
| Healthcare Support | 0 (0.0%) | 0 (0.0%) |
| Security & Protection | 0 (0.0%) | 0 (0.0%) |
| Firefighting & Prevention | 0 (0.0%) | 0 (0.0%) |
| Law Enforcement | 0 (0.0%) | 0 (0.0%) |
| Food Preparation & Serving | 0 (0.0%) | 0 (0.0%) |
| Cleaning & Maintenance | 38 (100.0%) | 0 (0.0%) |
| Personal Care & Service | 0 (0.0%) | 0 (0.0%) |
| Total (Category) | 38 (100.0%) | 0 (0.0%) |
| Total (Overall) | 255 (81.7%) | 57 (18.3%) |
Sales and Office Occupations
The most common Sales and Office occupations in Pioche are Sales & Related (38 | 12.2%), and Office & Administration (11 | 3.5%).
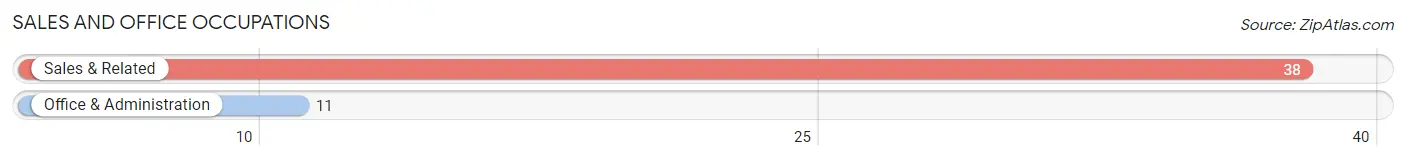
Sales and Office Occupations by Sex

| Occupation | Male | Female |
| Sales & Related | 38 (100.0%) | 0 (0.0%) |
| Office & Administration | 0 (0.0%) | 11 (100.0%) |
| Total (Category) | 38 (77.5%) | 11 (22.5%) |
| Total (Overall) | 255 (81.7%) | 57 (18.3%) |
Natural Resources, Construction and Maintenance Occupations
The most common Natural Resources, Construction and Maintenance occupations in Pioche are Installation, Maintenance & Repair (65 | 20.8%), Construction & Extraction (30 | 9.6%), and Farming, Fishing & Forestry (18 | 5.8%).
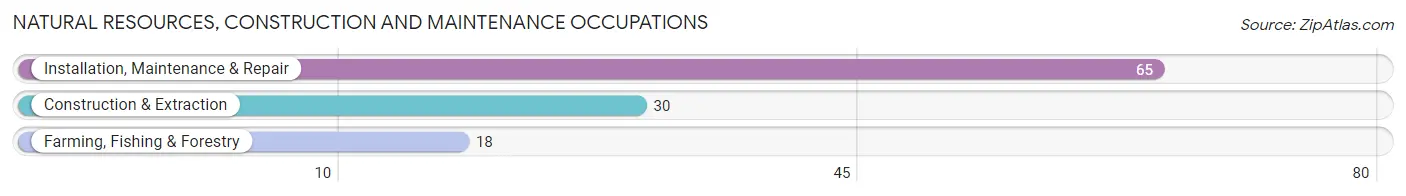
Natural Resources, Construction and Maintenance Occupations by Sex

| Occupation | Male | Female |
| Farming, Fishing & Forestry | 18 (100.0%) | 0 (0.0%) |
| Construction & Extraction | 30 (100.0%) | 0 (0.0%) |
| Installation, Maintenance & Repair | 65 (100.0%) | 0 (0.0%) |
| Total (Category) | 113 (100.0%) | 0 (0.0%) |
| Total (Overall) | 255 (81.7%) | 57 (18.3%) |
Production, Transportation and Moving Occupations
The most common Production, Transportation and Moving occupations in Pioche are , and Production (31 | 9.9%).
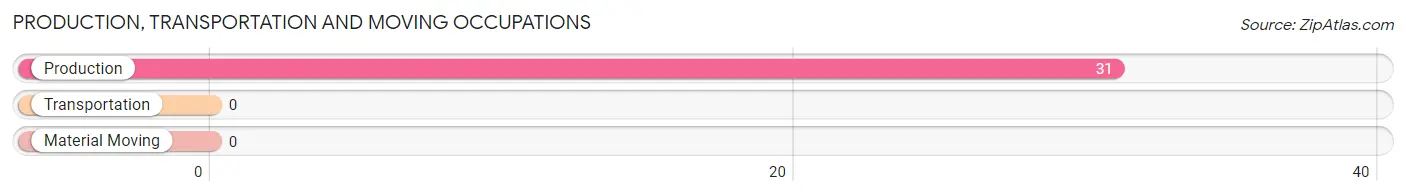
Production, Transportation and Moving Occupations by Sex
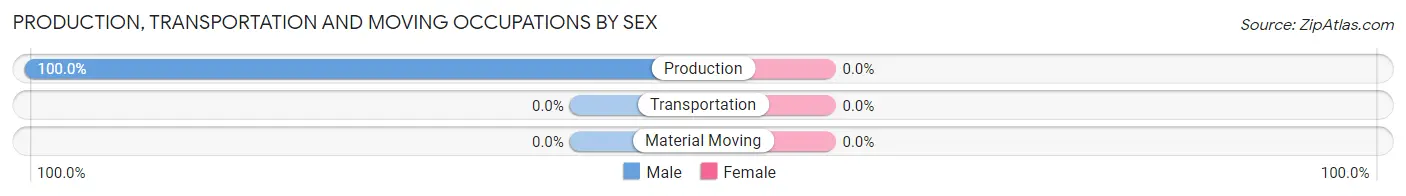
| Occupation | Male | Female |
| Production | 31 (100.0%) | 0 (0.0%) |
| Transportation | 0 (0.0%) | 0 (0.0%) |
| Material Moving | 0 (0.0%) | 0 (0.0%) |
| Total (Category) | 31 (100.0%) | 0 (0.0%) |
| Total (Overall) | 255 (81.7%) | 57 (18.3%) |
Employment Industries by Sex in Pioche
Employment Industries in Pioche
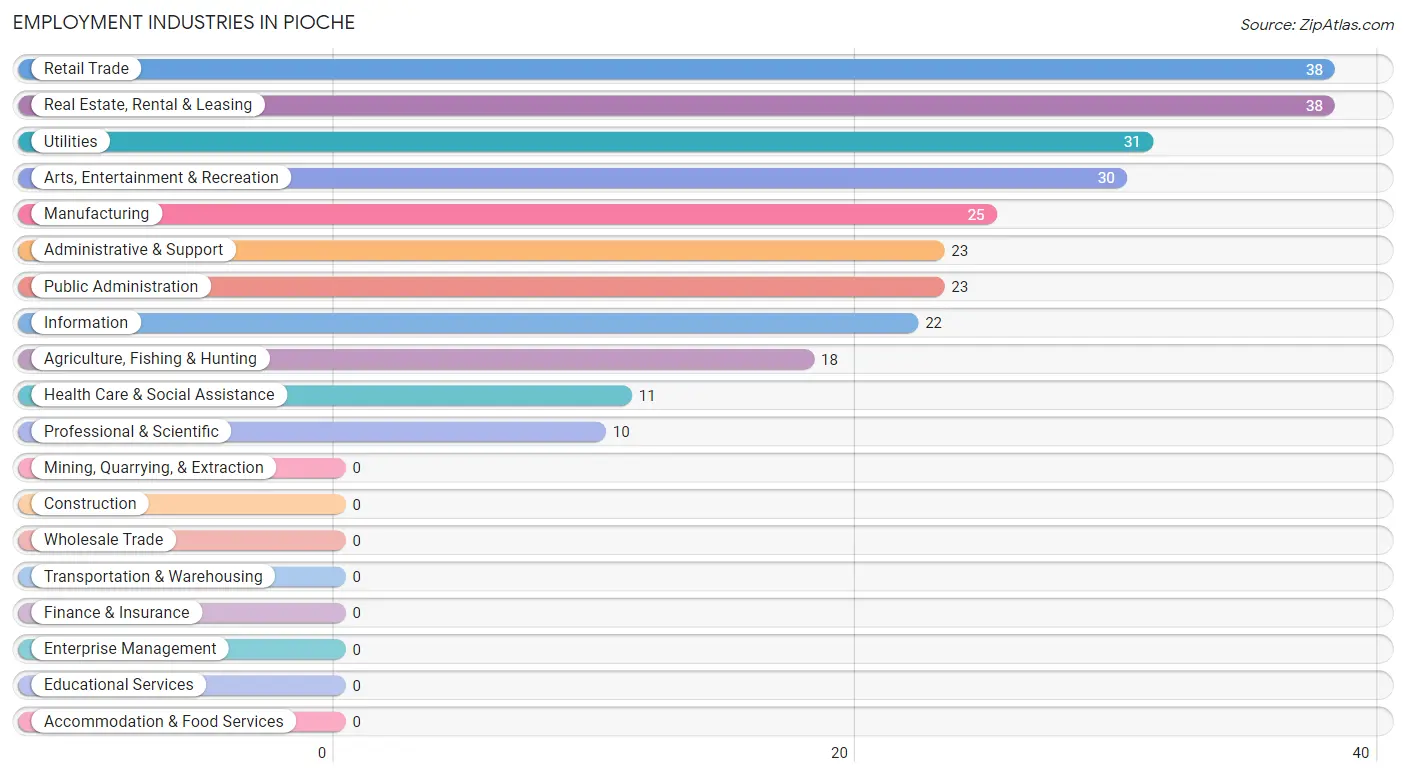
The major employment industries in Pioche include Retail Trade (38 | 12.2%), Real Estate, Rental & Leasing (38 | 12.2%), Utilities (31 | 9.9%), Arts, Entertainment & Recreation (30 | 9.6%), and Manufacturing (25 | 8.0%).
Employment Industries by Sex in Pioche
The Pioche industries that see more men than women are Agriculture, Fishing & Hunting (100.0%), Manufacturing (100.0%), and Retail Trade (100.0%), whereas the industries that tend to have a higher number of women are Administrative & Support (100.0%), Health Care & Social Assistance (100.0%), and Public Administration (100.0%).
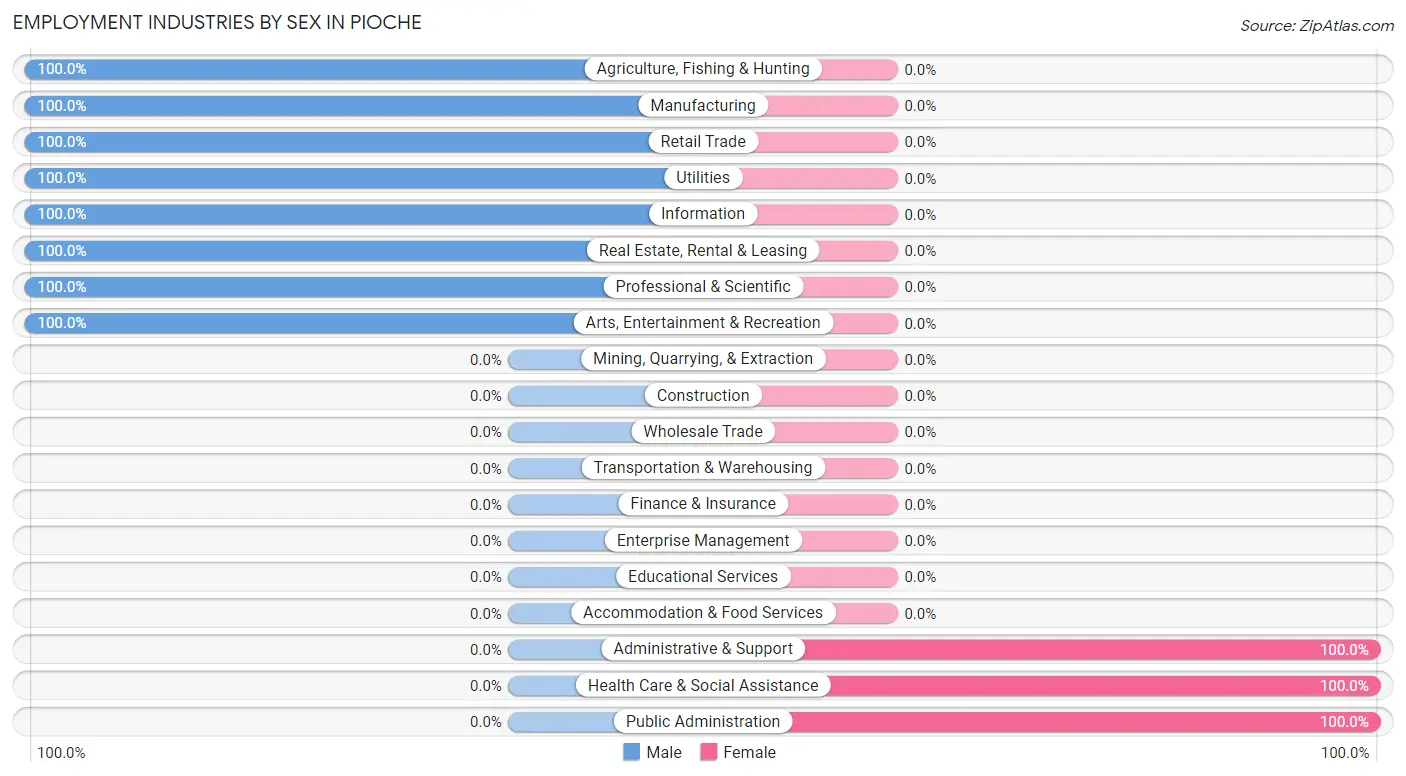
| Industry | Male | Female |
| Agriculture, Fishing & Hunting | 18 (100.0%) | 0 (0.0%) |
| Mining, Quarrying, & Extraction | 0 (0.0%) | 0 (0.0%) |
| Construction | 0 (0.0%) | 0 (0.0%) |
| Manufacturing | 25 (100.0%) | 0 (0.0%) |
| Wholesale Trade | 0 (0.0%) | 0 (0.0%) |
| Retail Trade | 38 (100.0%) | 0 (0.0%) |
| Transportation & Warehousing | 0 (0.0%) | 0 (0.0%) |
| Utilities | 31 (100.0%) | 0 (0.0%) |
| Information | 22 (100.0%) | 0 (0.0%) |
| Finance & Insurance | 0 (0.0%) | 0 (0.0%) |
| Real Estate, Rental & Leasing | 38 (100.0%) | 0 (0.0%) |
| Professional & Scientific | 10 (100.0%) | 0 (0.0%) |
| Enterprise Management | 0 (0.0%) | 0 (0.0%) |
| Administrative & Support | 0 (0.0%) | 23 (100.0%) |
| Educational Services | 0 (0.0%) | 0 (0.0%) |
| Health Care & Social Assistance | 0 (0.0%) | 11 (100.0%) |
| Arts, Entertainment & Recreation | 30 (100.0%) | 0 (0.0%) |
| Accommodation & Food Services | 0 (0.0%) | 0 (0.0%) |
| Public Administration | 0 (0.0%) | 23 (100.0%) |
| Total | 255 (81.7%) | 57 (18.3%) |
Education in Pioche
School Enrollment in Pioche
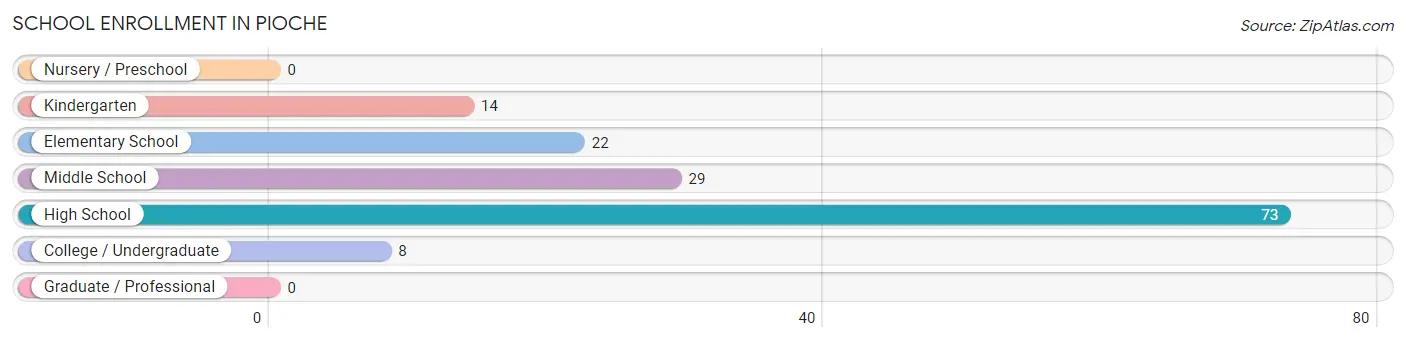
The most common levels of schooling among the 146 students in Pioche are high school (73 | 50.0%), middle school (29 | 19.9%), and elementary school (22 | 15.1%).
| School Level | # Students | % Students |
| Nursery / Preschool | 0 | 0.0% |
| Kindergarten | 14 | 9.6% |
| Elementary School | 22 | 15.1% |
| Middle School | 29 | 19.9% |
| High School | 73 | 50.0% |
| College / Undergraduate | 8 | 5.5% |
| Graduate / Professional | 0 | 0.0% |
| Total | 146 | 100.0% |
School Enrollment by Age by Funding Source in Pioche
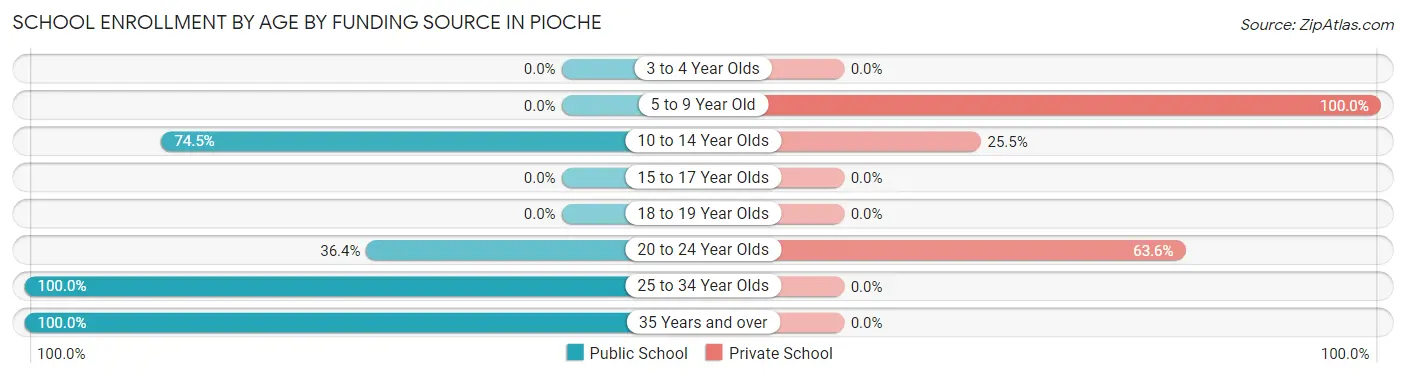
Out of a total of 146 students who are enrolled in schools in Pioche, 41 (28.1%) attend a private institution, while the remaining 105 (71.9%) are enrolled in public schools. The age group of 5 to 9 year old has the highest likelihood of being enrolled in private schools, with 14 (100.0% in the age bracket) enrolled. Conversely, the age group of 25 to 34 year olds has the lowest likelihood of being enrolled in a private school, with 20 (100.0% in the age bracket) attending a public institution.
| Age Bracket | Public School | Private School |
| 3 to 4 Year Olds | 0 (0.0%) | 0 (0.0%) |
| 5 to 9 Year Old | 0 (0.0%) | 14 (100.0%) |
| 10 to 14 Year Olds | 38 (74.5%) | 13 (25.5%) |
| 15 to 17 Year Olds | 0 (0.0%) | 0 (0.0%) |
| 18 to 19 Year Olds | 0 (0.0%) | 0 (0.0%) |
| 20 to 24 Year Olds | 8 (36.4%) | 14 (63.6%) |
| 25 to 34 Year Olds | 20 (100.0%) | 0 (0.0%) |
| 35 Years and over | 39 (100.0%) | 0 (0.0%) |
| Total | 105 (71.9%) | 41 (28.1%) |
Educational Attainment by Field of Study in Pioche
Business (23 | 32.9%), arts & humanities (22 | 31.4%), science & technology (13 | 18.6%), physical & health sciences (10 | 14.3%), and liberal arts & history (2 | 2.9%) are the most common fields of study among 70 individuals in Pioche who have obtained a bachelor's degree or higher.
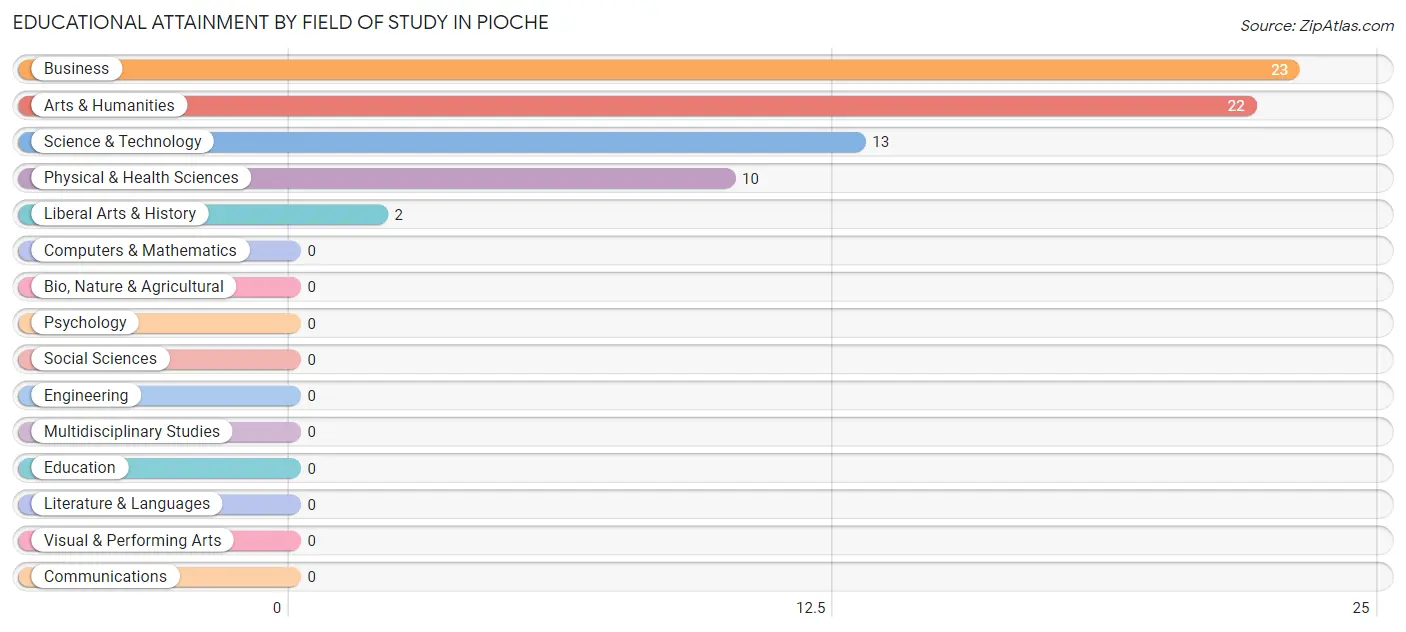
| Field of Study | # Graduates | % Graduates |
| Computers & Mathematics | 0 | 0.0% |
| Bio, Nature & Agricultural | 0 | 0.0% |
| Physical & Health Sciences | 10 | 14.3% |
| Psychology | 0 | 0.0% |
| Social Sciences | 0 | 0.0% |
| Engineering | 0 | 0.0% |
| Multidisciplinary Studies | 0 | 0.0% |
| Science & Technology | 13 | 18.6% |
| Business | 23 | 32.9% |
| Education | 0 | 0.0% |
| Literature & Languages | 0 | 0.0% |
| Liberal Arts & History | 2 | 2.9% |
| Visual & Performing Arts | 0 | 0.0% |
| Communications | 0 | 0.0% |
| Arts & Humanities | 22 | 31.4% |
| Total | 70 | 100.0% |
Transportation & Commute in Pioche
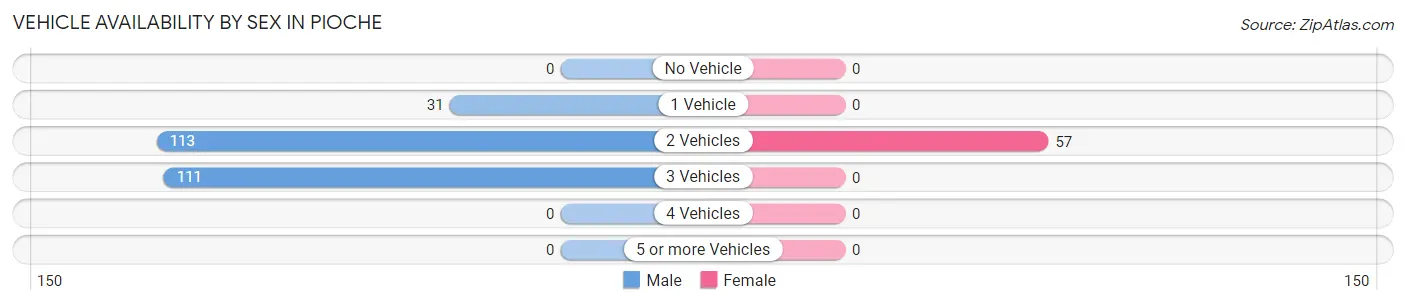
Vehicle Availability by Sex in Pioche
The most prevalent vehicle ownership categories in Pioche are males with 2 vehicles (113, accounting for 44.3%) and females with 2 vehicles (57, making up 198.2%).
| Vehicles Available | Male | Female |
| No Vehicle | 0 (0.0%) | 0 (0.0%) |
| 1 Vehicle | 31 (12.2%) | 0 (0.0%) |
| 2 Vehicles | 113 (44.3%) | 57 (100.0%) |
| 3 Vehicles | 111 (43.5%) | 0 (0.0%) |
| 4 Vehicles | 0 (0.0%) | 0 (0.0%) |
| 5 or more Vehicles | 0 (0.0%) | 0 (0.0%) |
| Total | 255 (100.0%) | 57 (100.0%) |
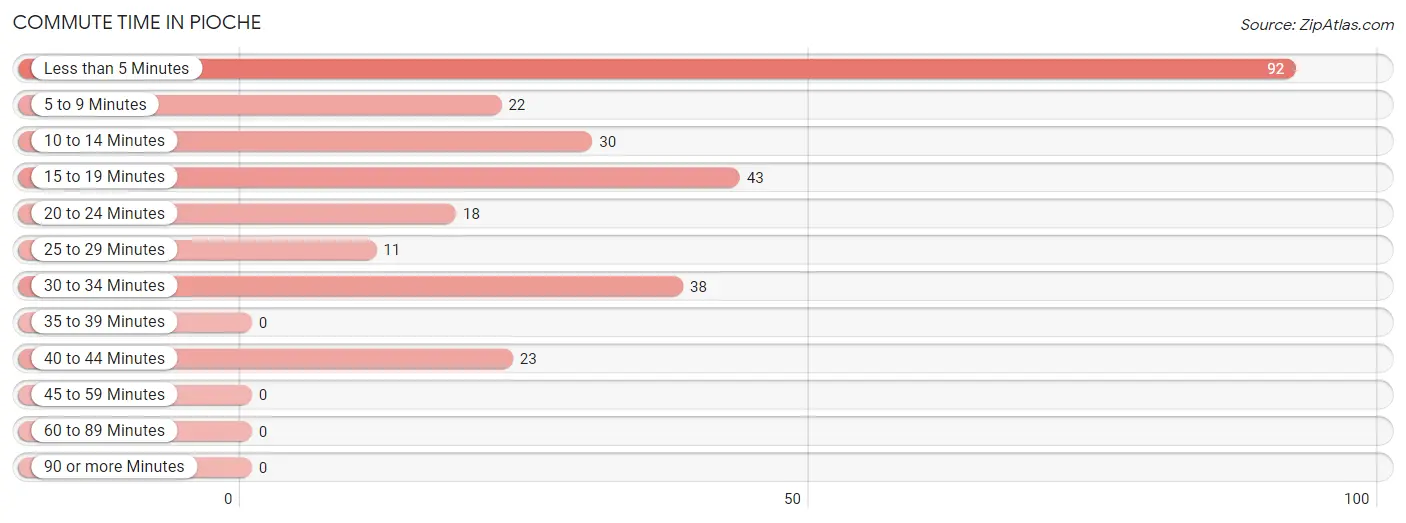
Commute Time in Pioche
The most frequently occuring commute durations in Pioche are less than 5 minutes (92 commuters, 33.2%), 15 to 19 minutes (43 commuters, 15.5%), and 30 to 34 minutes (38 commuters, 13.7%).
| Commute Time | # Commuters | % Commuters |
| Less than 5 Minutes | 92 | 33.2% |
| 5 to 9 Minutes | 22 | 7.9% |
| 10 to 14 Minutes | 30 | 10.8% |
| 15 to 19 Minutes | 43 | 15.5% |
| 20 to 24 Minutes | 18 | 6.5% |
| 25 to 29 Minutes | 11 | 4.0% |
| 30 to 34 Minutes | 38 | 13.7% |
| 35 to 39 Minutes | 0 | 0.0% |
| 40 to 44 Minutes | 23 | 8.3% |
| 45 to 59 Minutes | 0 | 0.0% |
| 60 to 89 Minutes | 0 | 0.0% |
| 90 or more Minutes | 0 | 0.0% |
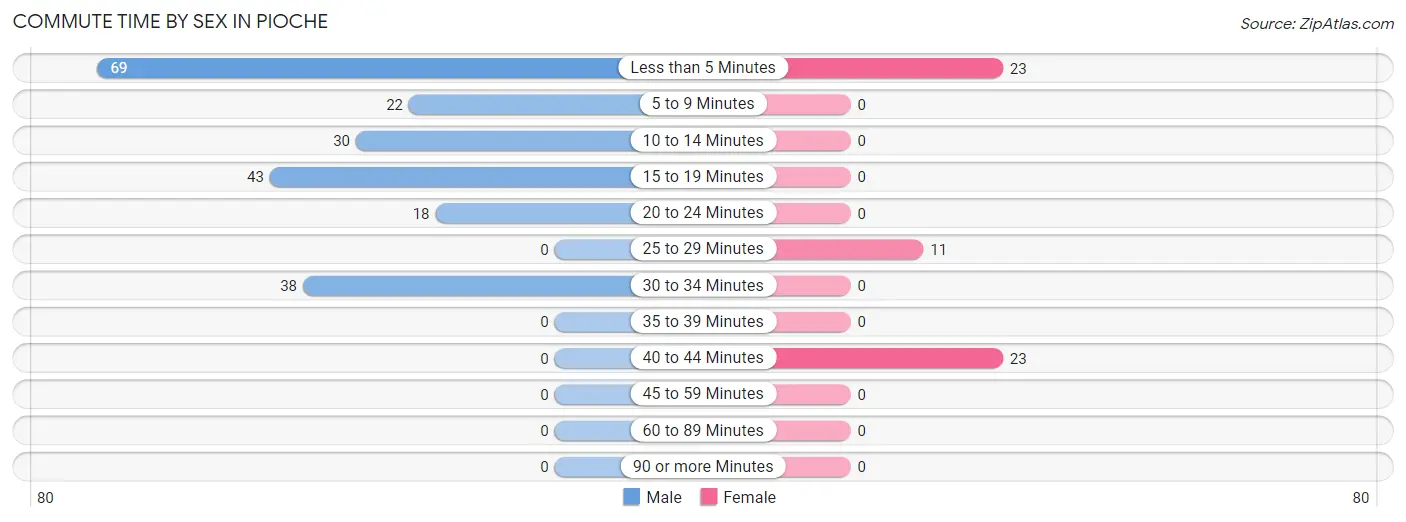
Commute Time by Sex in Pioche
The most common commute times in Pioche are less than 5 minutes (69 commuters, 31.4%) for males and less than 5 minutes (23 commuters, 40.4%) for females.
| Commute Time | Male | Female |
| Less than 5 Minutes | 69 (31.4%) | 23 (40.4%) |
| 5 to 9 Minutes | 22 (10.0%) | 0 (0.0%) |
| 10 to 14 Minutes | 30 (13.6%) | 0 (0.0%) |
| 15 to 19 Minutes | 43 (19.6%) | 0 (0.0%) |
| 20 to 24 Minutes | 18 (8.2%) | 0 (0.0%) |
| 25 to 29 Minutes | 0 (0.0%) | 11 (19.3%) |
| 30 to 34 Minutes | 38 (17.3%) | 0 (0.0%) |
| 35 to 39 Minutes | 0 (0.0%) | 0 (0.0%) |
| 40 to 44 Minutes | 0 (0.0%) | 23 (40.4%) |
| 45 to 59 Minutes | 0 (0.0%) | 0 (0.0%) |
| 60 to 89 Minutes | 0 (0.0%) | 0 (0.0%) |
| 90 or more Minutes | 0 (0.0%) | 0 (0.0%) |
Time of Departure to Work by Sex in Pioche
The most frequent times of departure to work in Pioche are 8:00 AM to 8:29 AM (81, 36.8%) for males and 7:00 AM to 7:29 AM (46, 80.7%) for females.
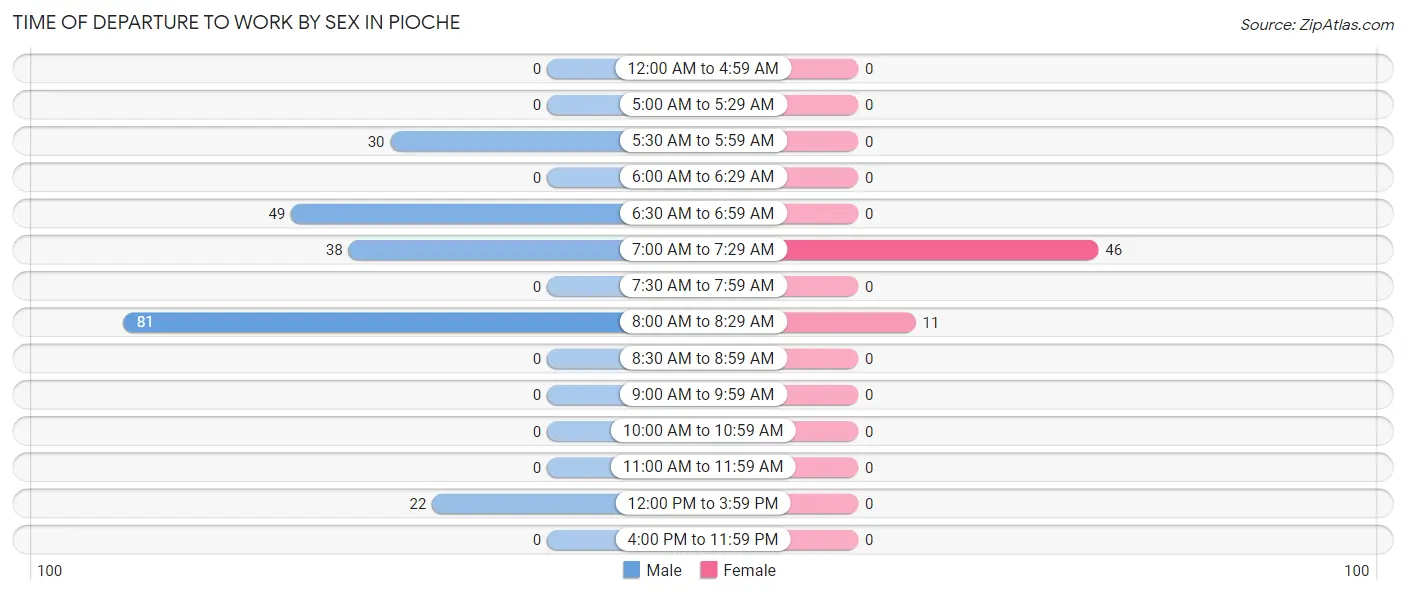
| Time of Departure | Male | Female |
| 12:00 AM to 4:59 AM | 0 (0.0%) | 0 (0.0%) |
| 5:00 AM to 5:29 AM | 0 (0.0%) | 0 (0.0%) |
| 5:30 AM to 5:59 AM | 30 (13.6%) | 0 (0.0%) |
| 6:00 AM to 6:29 AM | 0 (0.0%) | 0 (0.0%) |
| 6:30 AM to 6:59 AM | 49 (22.3%) | 0 (0.0%) |
| 7:00 AM to 7:29 AM | 38 (17.3%) | 46 (80.7%) |
| 7:30 AM to 7:59 AM | 0 (0.0%) | 0 (0.0%) |
| 8:00 AM to 8:29 AM | 81 (36.8%) | 11 (19.3%) |
| 8:30 AM to 8:59 AM | 0 (0.0%) | 0 (0.0%) |
| 9:00 AM to 9:59 AM | 0 (0.0%) | 0 (0.0%) |
| 10:00 AM to 10:59 AM | 0 (0.0%) | 0 (0.0%) |
| 11:00 AM to 11:59 AM | 0 (0.0%) | 0 (0.0%) |
| 12:00 PM to 3:59 PM | 22 (10.0%) | 0 (0.0%) |
| 4:00 PM to 11:59 PM | 0 (0.0%) | 0 (0.0%) |
| Total | 220 (100.0%) | 57 (100.0%) |
Housing Occupancy in Pioche
Occupancy by Ownership in Pioche
Of the total 317 dwellings in Pioche, owner-occupied units account for 287 (90.5%), while renter-occupied units make up 30 (9.5%).
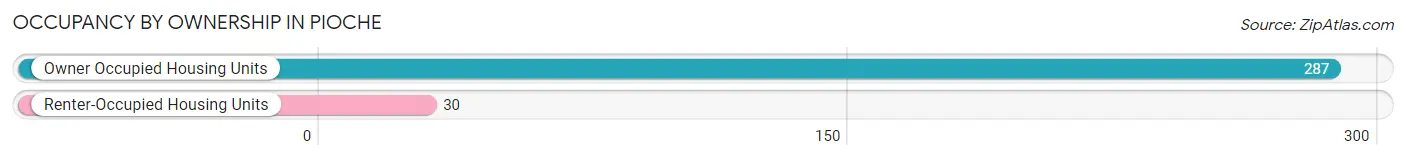
| Occupancy | # Housing Units | % Housing Units |
| Owner Occupied Housing Units | 287 | 90.5% |
| Renter-Occupied Housing Units | 30 | 9.5% |
| Total Occupied Housing Units | 317 | 100.0% |
Occupancy by Household Size in Pioche
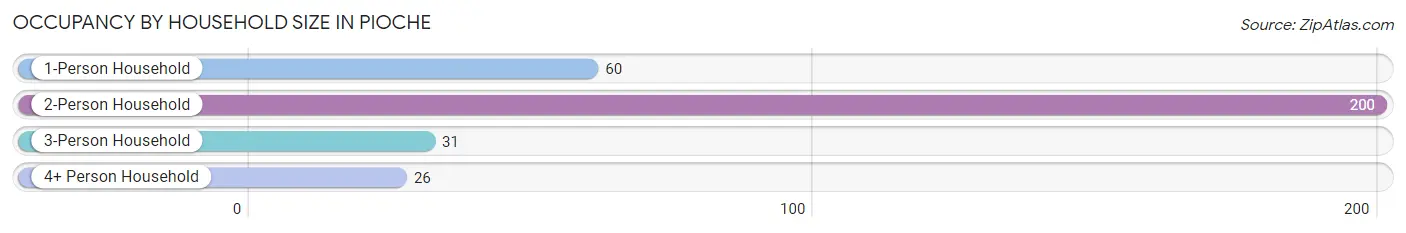
| Household Size | # Housing Units | % Housing Units |
| 1-Person Household | 60 | 18.9% |
| 2-Person Household | 200 | 63.1% |
| 3-Person Household | 31 | 9.8% |
| 4+ Person Household | 26 | 8.2% |
| Total Housing Units | 317 | 100.0% |
Occupancy by Ownership by Household Size in Pioche
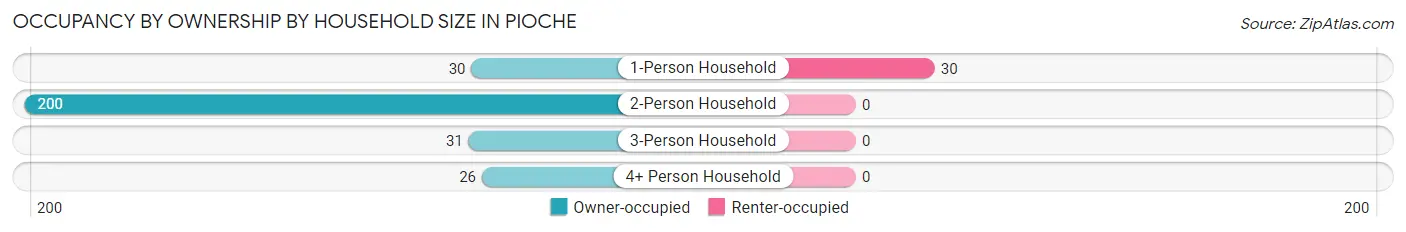
| Household Size | Owner-occupied | Renter-occupied |
| 1-Person Household | 30 (50.0%) | 30 (50.0%) |
| 2-Person Household | 200 (100.0%) | 0 (0.0%) |
| 3-Person Household | 31 (100.0%) | 0 (0.0%) |
| 4+ Person Household | 26 (100.0%) | 0 (0.0%) |
| Total Housing Units | 287 (90.5%) | 30 (9.5%) |
Occupancy by Educational Attainment in Pioche
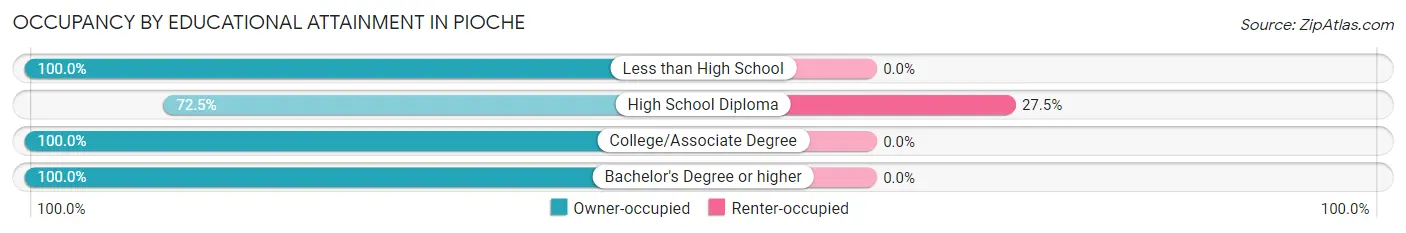
| Household Size | Owner-occupied | Renter-occupied |
| Less than High School | 19 (100.0%) | 0 (0.0%) |
| High School Diploma | 79 (72.5%) | 30 (27.5%) |
| College/Associate Degree | 156 (100.0%) | 0 (0.0%) |
| Bachelor's Degree or higher | 33 (100.0%) | 0 (0.0%) |
Occupancy by Age of Householder in Pioche

| Age Bracket | # Households | % Households |
| Under 35 Years | 0 | 0.0% |
| 35 to 44 Years | 20 | 6.3% |
| 45 to 54 Years | 54 | 17.0% |
| 55 to 64 Years | 148 | 46.7% |
| 65 to 74 Years | 95 | 30.0% |
| 75 to 84 Years | 0 | 0.0% |
| 85 Years and Over | 0 | 0.0% |
| Total | 317 | 100.0% |
Housing Finances in Pioche
Median Income by Occupancy in Pioche
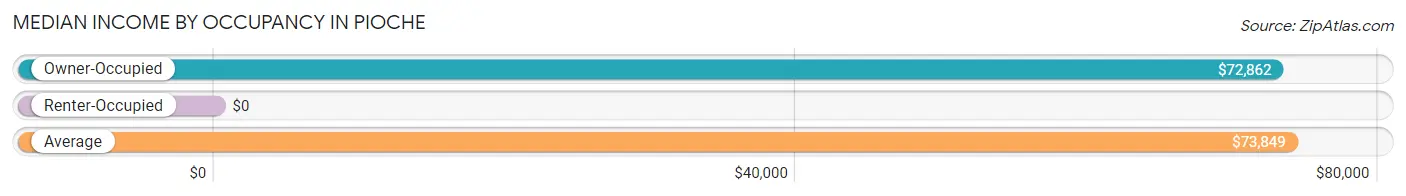
| Occupancy Type | # Households | Median Income |
| Owner-Occupied | 287 (90.5%) | $72,862 |
| Renter-Occupied | 30 (9.5%) | $0 |
| Average | 317 (100.0%) | $73,849 |
Occupancy by Householder Income Bracket in Pioche
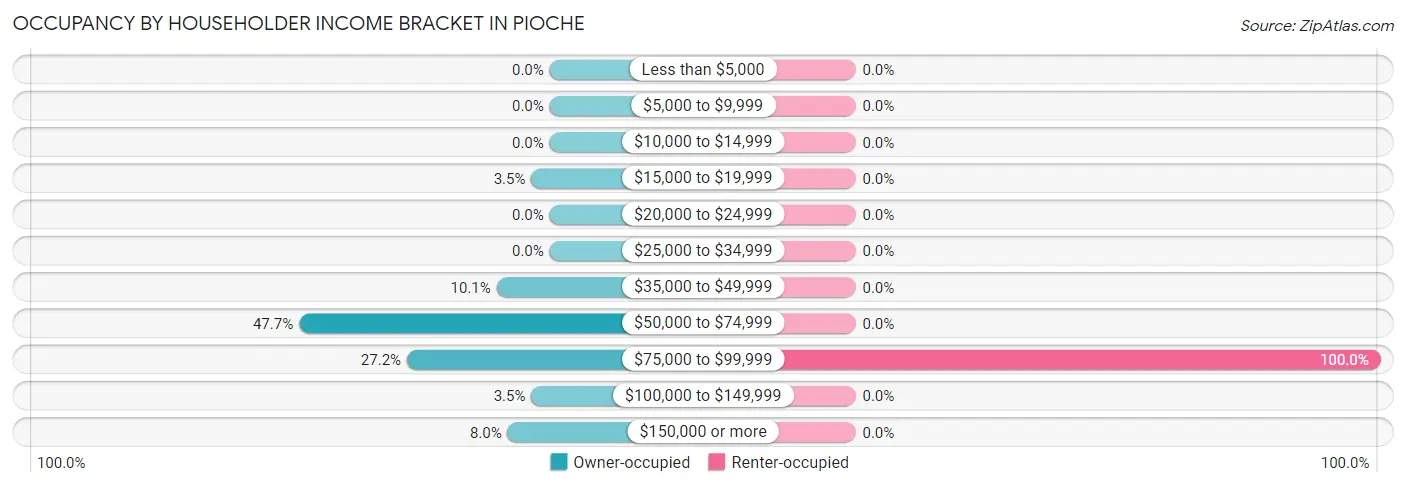
| Income Bracket | Owner-occupied | Renter-occupied |
| Less than $5,000 | 0 (0.0%) | 0 (0.0%) |
| $5,000 to $9,999 | 0 (0.0%) | 0 (0.0%) |
| $10,000 to $14,999 | 0 (0.0%) | 0 (0.0%) |
| $15,000 to $19,999 | 10 (3.5%) | 0 (0.0%) |
| $20,000 to $24,999 | 0 (0.0%) | 0 (0.0%) |
| $25,000 to $34,999 | 0 (0.0%) | 0 (0.0%) |
| $35,000 to $49,999 | 29 (10.1%) | 0 (0.0%) |
| $50,000 to $74,999 | 137 (47.7%) | 0 (0.0%) |
| $75,000 to $99,999 | 78 (27.2%) | 30 (100.0%) |
| $100,000 to $149,999 | 10 (3.5%) | 0 (0.0%) |
| $150,000 or more | 23 (8.0%) | 0 (0.0%) |
| Total | 287 (100.0%) | 30 (100.0%) |
Monthly Housing Cost Tiers in Pioche
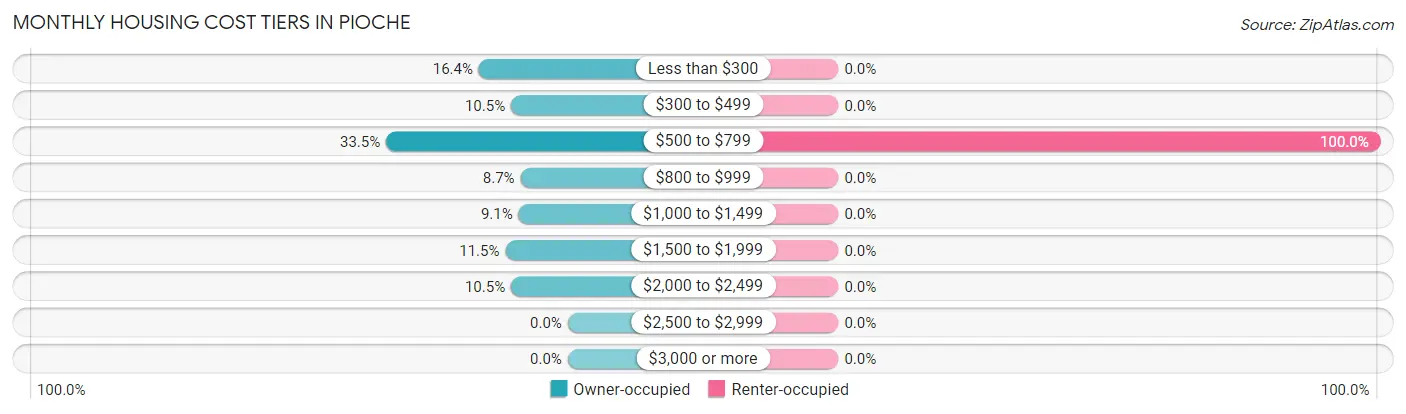
| Monthly Cost | Owner-occupied | Renter-occupied |
| Less than $300 | 47 (16.4%) | 0 (0.0%) |
| $300 to $499 | 30 (10.4%) | 0 (0.0%) |
| $500 to $799 | 96 (33.5%) | 30 (100.0%) |
| $800 to $999 | 25 (8.7%) | 0 (0.0%) |
| $1,000 to $1,499 | 26 (9.1%) | 0 (0.0%) |
| $1,500 to $1,999 | 33 (11.5%) | 0 (0.0%) |
| $2,000 to $2,499 | 30 (10.4%) | 0 (0.0%) |
| $2,500 to $2,999 | 0 (0.0%) | 0 (0.0%) |
| $3,000 or more | 0 (0.0%) | 0 (0.0%) |
| Total | 287 (100.0%) | 30 (100.0%) |
Physical Housing Characteristics in Pioche
Housing Structures in Pioche
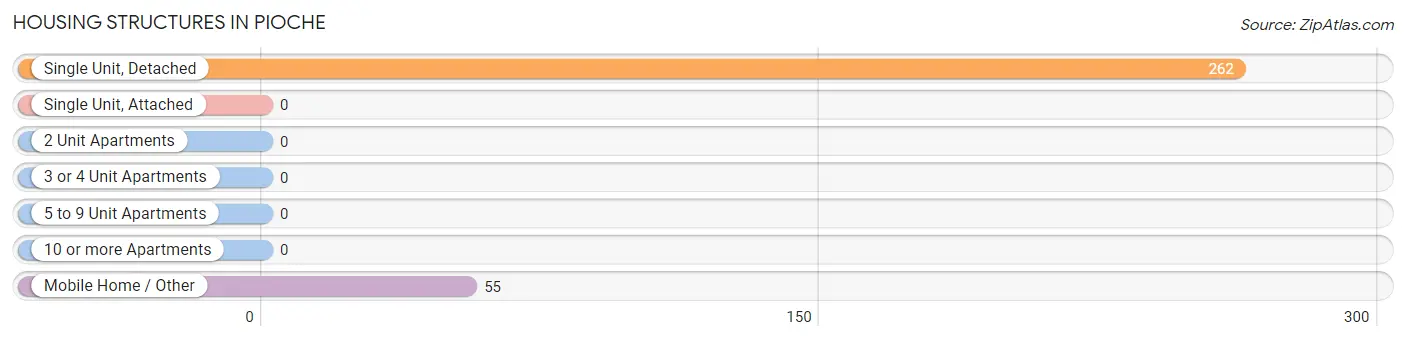
| Structure Type | # Housing Units | % Housing Units |
| Single Unit, Detached | 262 | 82.7% |
| Single Unit, Attached | 0 | 0.0% |
| 2 Unit Apartments | 0 | 0.0% |
| 3 or 4 Unit Apartments | 0 | 0.0% |
| 5 to 9 Unit Apartments | 0 | 0.0% |
| 10 or more Apartments | 0 | 0.0% |
| Mobile Home / Other | 55 | 17.3% |
| Total | 317 | 100.0% |
Housing Structures by Occupancy in Pioche
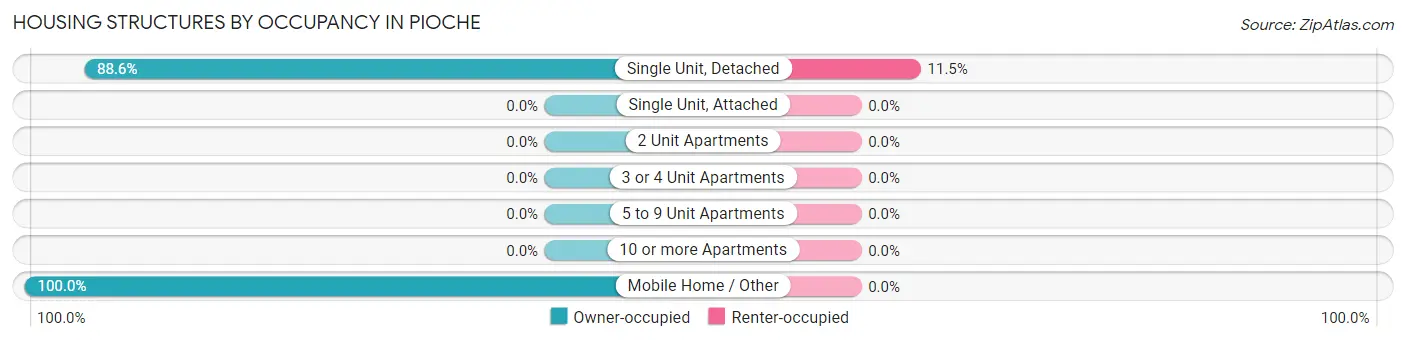
| Structure Type | Owner-occupied | Renter-occupied |
| Single Unit, Detached | 232 (88.5%) | 30 (11.5%) |
| Single Unit, Attached | 0 (0.0%) | 0 (0.0%) |
| 2 Unit Apartments | 0 (0.0%) | 0 (0.0%) |
| 3 or 4 Unit Apartments | 0 (0.0%) | 0 (0.0%) |
| 5 to 9 Unit Apartments | 0 (0.0%) | 0 (0.0%) |
| 10 or more Apartments | 0 (0.0%) | 0 (0.0%) |
| Mobile Home / Other | 55 (100.0%) | 0 (0.0%) |
| Total | 287 (90.5%) | 30 (9.5%) |
Housing Structures by Number of Rooms in Pioche
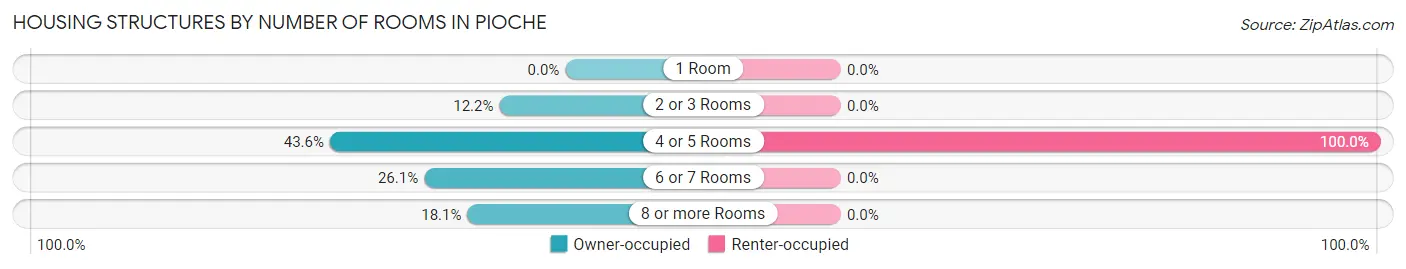
| Number of Rooms | Owner-occupied | Renter-occupied |
| 1 Room | 0 (0.0%) | 0 (0.0%) |
| 2 or 3 Rooms | 35 (12.2%) | 0 (0.0%) |
| 4 or 5 Rooms | 125 (43.5%) | 30 (100.0%) |
| 6 or 7 Rooms | 75 (26.1%) | 0 (0.0%) |
| 8 or more Rooms | 52 (18.1%) | 0 (0.0%) |
| Total | 287 (100.0%) | 30 (100.0%) |
Housing Structure by Heating Type in Pioche
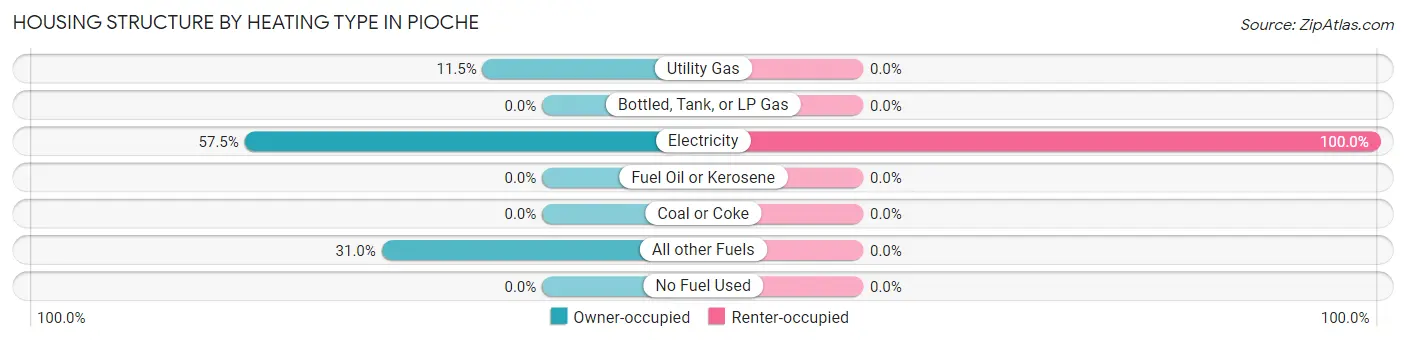
| Heating Type | Owner-occupied | Renter-occupied |
| Utility Gas | 33 (11.5%) | 0 (0.0%) |
| Bottled, Tank, or LP Gas | 0 (0.0%) | 0 (0.0%) |
| Electricity | 165 (57.5%) | 30 (100.0%) |
| Fuel Oil or Kerosene | 0 (0.0%) | 0 (0.0%) |
| Coal or Coke | 0 (0.0%) | 0 (0.0%) |
| All other Fuels | 89 (31.0%) | 0 (0.0%) |
| No Fuel Used | 0 (0.0%) | 0 (0.0%) |
| Total | 287 (100.0%) | 30 (100.0%) |
Household Vehicle Usage in Pioche
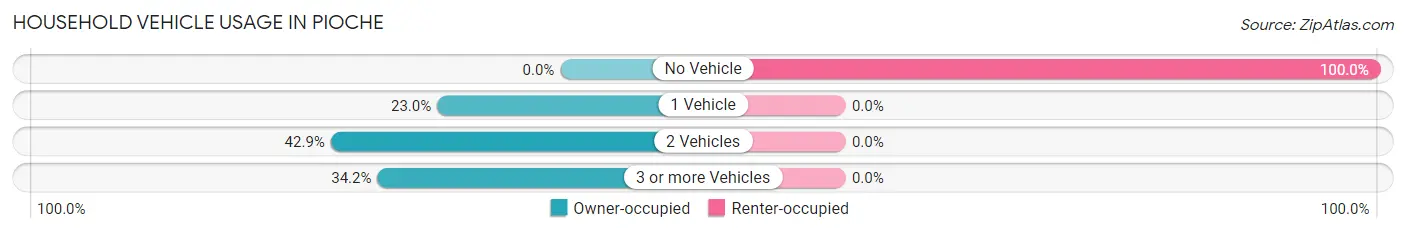
| Vehicles per Household | Owner-occupied | Renter-occupied |
| No Vehicle | 0 (0.0%) | 30 (100.0%) |
| 1 Vehicle | 66 (23.0%) | 0 (0.0%) |
| 2 Vehicles | 123 (42.9%) | 0 (0.0%) |
| 3 or more Vehicles | 98 (34.2%) | 0 (0.0%) |
| Total | 287 (100.0%) | 30 (100.0%) |
Real Estate & Mortgages in Pioche
Real Estate and Mortgage Overview in Pioche
| Characteristic | Without Mortgage | With Mortgage |
| Housing Units | 124 | 163 |
| Median Property Value | $160,800 | $205,200 |
| Median Household Income | $67,300 | $23 |
| Monthly Housing Costs | $421 | $0 |
| Real Estate Taxes | $709 | $10 |
Property Value by Mortgage Status in Pioche
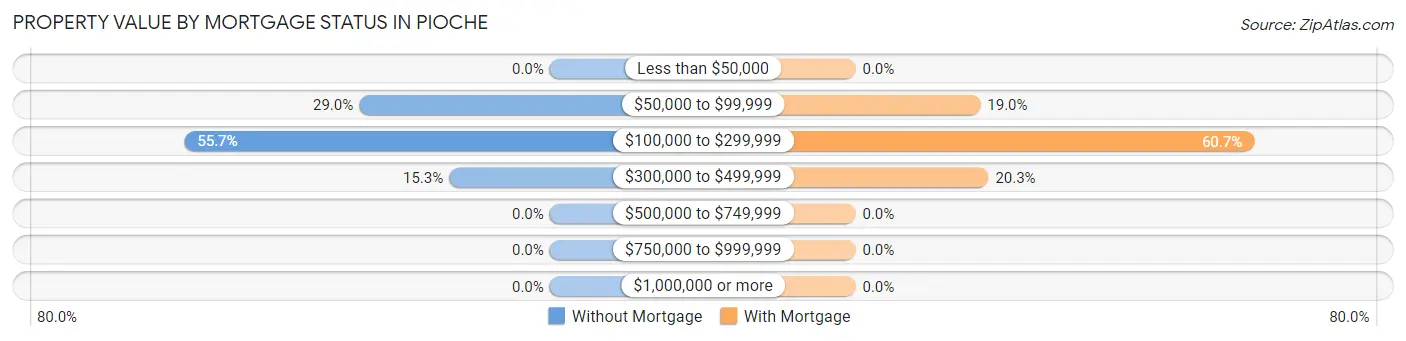
| Property Value | Without Mortgage | With Mortgage |
| Less than $50,000 | 0 (0.0%) | 0 (0.0%) |
| $50,000 to $99,999 | 36 (29.0%) | 31 (19.0%) |
| $100,000 to $299,999 | 69 (55.6%) | 99 (60.7%) |
| $300,000 to $499,999 | 19 (15.3%) | 33 (20.3%) |
| $500,000 to $749,999 | 0 (0.0%) | 0 (0.0%) |
| $750,000 to $999,999 | 0 (0.0%) | 0 (0.0%) |
| $1,000,000 or more | 0 (0.0%) | 0 (0.0%) |
| Total | 124 (100.0%) | 163 (100.0%) |
Household Income by Mortgage Status in Pioche
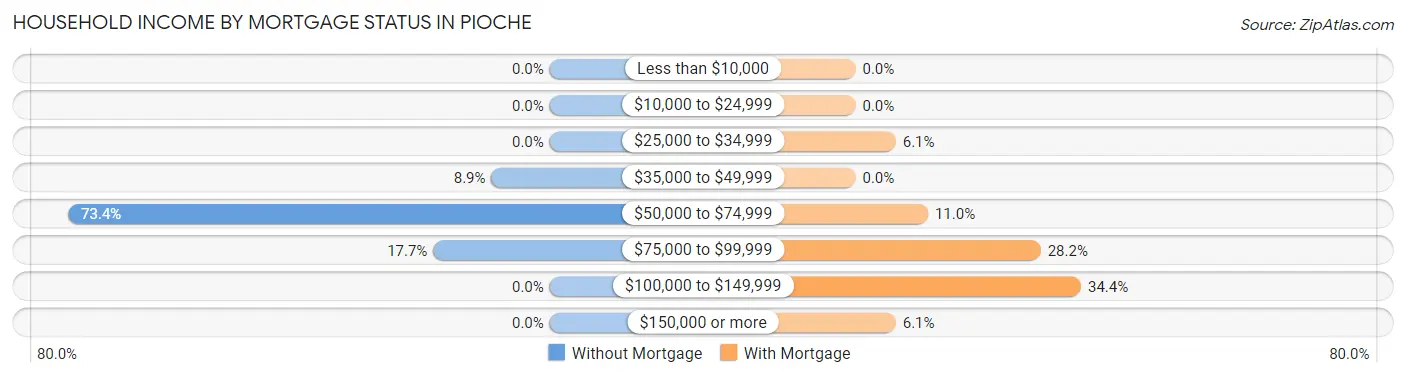
| Household Income | Without Mortgage | With Mortgage |
| Less than $10,000 | 0 (0.0%) | 0 (0.0%) |
| $10,000 to $24,999 | 0 (0.0%) | 0 (0.0%) |
| $25,000 to $34,999 | 0 (0.0%) | 10 (6.1%) |
| $35,000 to $49,999 | 11 (8.9%) | 0 (0.0%) |
| $50,000 to $74,999 | 91 (73.4%) | 18 (11.0%) |
| $75,000 to $99,999 | 22 (17.7%) | 46 (28.2%) |
| $100,000 to $149,999 | 0 (0.0%) | 56 (34.4%) |
| $150,000 or more | 0 (0.0%) | 10 (6.1%) |
| Total | 124 (100.0%) | 163 (100.0%) |
Property Value to Household Income Ratio in Pioche
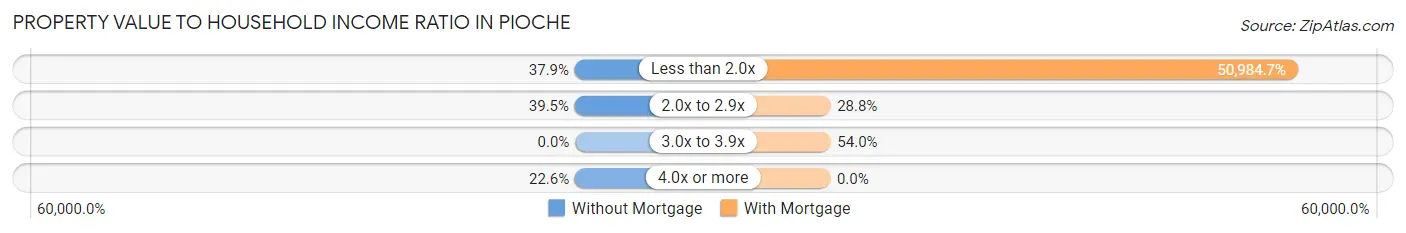
| Value-to-Income Ratio | Without Mortgage | With Mortgage |
| Less than 2.0x | 47 (37.9%) | 83,105 (50,984.7%) |
| 2.0x to 2.9x | 49 (39.5%) | 47 (28.8%) |
| 3.0x to 3.9x | 0 (0.0%) | 88 (54.0%) |
| 4.0x or more | 28 (22.6%) | 0 (0.0%) |
| Total | 124 (100.0%) | 163 (100.0%) |
Real Estate Taxes by Mortgage Status in Pioche
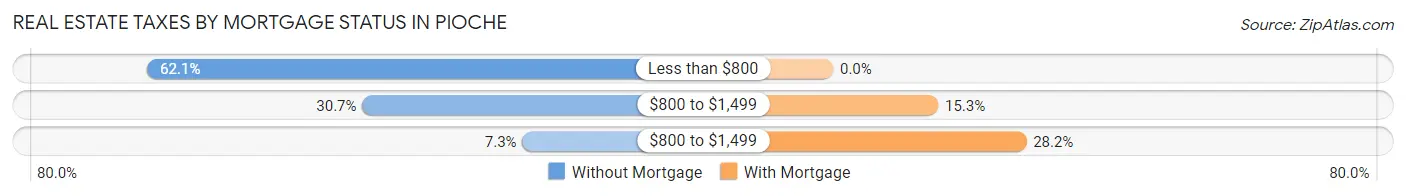
| Property Taxes | Without Mortgage | With Mortgage |
| Less than $800 | 77 (62.1%) | 0 (0.0%) |
| $800 to $1,499 | 38 (30.6%) | 25 (15.3%) |
| $800 to $1,499 | 9 (7.3%) | 46 (28.2%) |
| Total | 124 (100.0%) | 163 (100.0%) |
Health & Disability in Pioche
Health Insurance Coverage by Age in Pioche
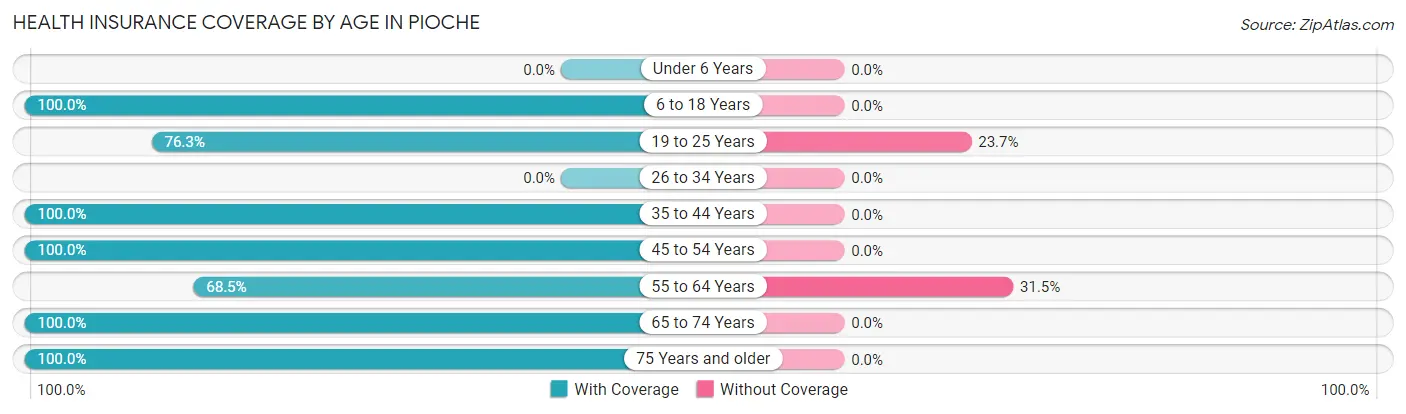
| Age Bracket | With Coverage | Without Coverage |
| Under 6 Years | 0 (0.0%) | 0 (0.0%) |
| 6 to 18 Years | 79 (100.0%) | 0 (0.0%) |
| 19 to 25 Years | 58 (76.3%) | 18 (23.7%) |
| 26 to 34 Years | 0 (0.0%) | 0 (0.0%) |
| 35 to 44 Years | 44 (100.0%) | 0 (0.0%) |
| 45 to 54 Years | 95 (100.0%) | 0 (0.0%) |
| 55 to 64 Years | 148 (68.5%) | 68 (31.5%) |
| 65 to 74 Years | 121 (100.0%) | 0 (0.0%) |
| 75 Years and older | 55 (100.0%) | 0 (0.0%) |
| Total | 600 (87.5%) | 86 (12.5%) |
Health Insurance Coverage by Citizenship Status in Pioche
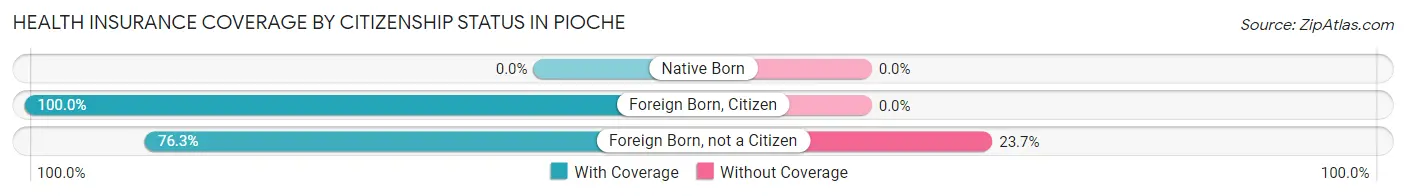
| Citizenship Status | With Coverage | Without Coverage |
| Native Born | 0 (0.0%) | 0 (0.0%) |
| Foreign Born, Citizen | 79 (100.0%) | 0 (0.0%) |
| Foreign Born, not a Citizen | 58 (76.3%) | 18 (23.7%) |
Health Insurance Coverage by Household Income in Pioche
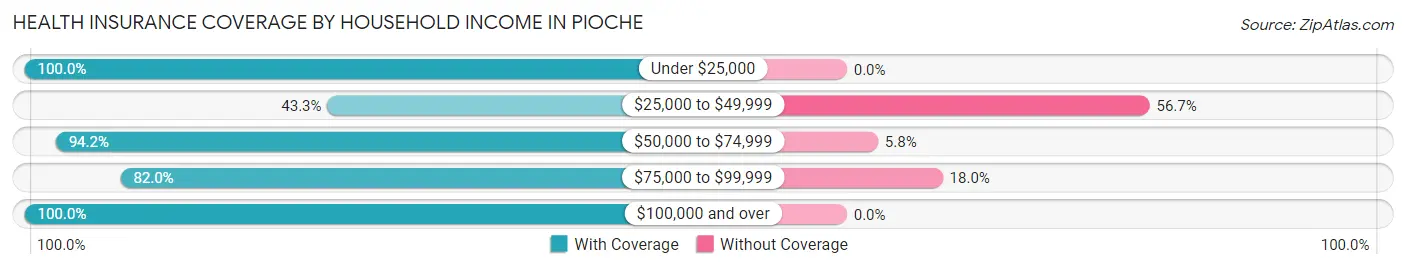
| Household Income | With Coverage | Without Coverage |
| Under $25,000 | 74 (100.0%) | 0 (0.0%) |
| $25,000 to $49,999 | 29 (43.3%) | 38 (56.7%) |
| $50,000 to $74,999 | 291 (94.2%) | 18 (5.8%) |
| $75,000 to $99,999 | 137 (82.0%) | 30 (18.0%) |
| $100,000 and over | 69 (100.0%) | 0 (0.0%) |
Public vs Private Health Insurance Coverage by Age in Pioche
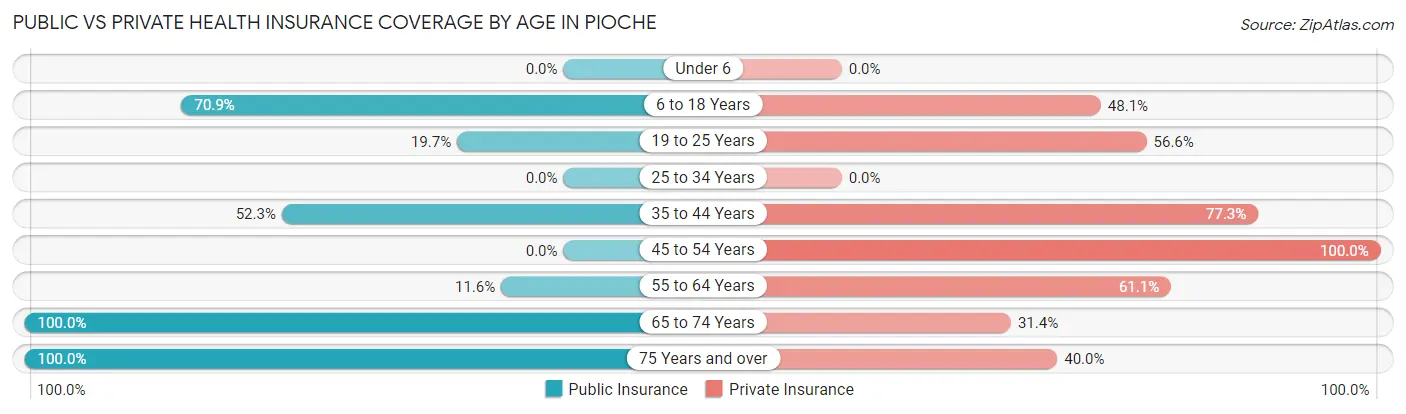
| Age Bracket | Public Insurance | Private Insurance |
| Under 6 | 0 (0.0%) | 0 (0.0%) |
| 6 to 18 Years | 56 (70.9%) | 38 (48.1%) |
| 19 to 25 Years | 15 (19.7%) | 43 (56.6%) |
| 25 to 34 Years | 0 (0.0%) | 0 (0.0%) |
| 35 to 44 Years | 23 (52.3%) | 34 (77.3%) |
| 45 to 54 Years | 0 (0.0%) | 95 (100.0%) |
| 55 to 64 Years | 25 (11.6%) | 132 (61.1%) |
| 65 to 74 Years | 121 (100.0%) | 38 (31.4%) |
| 75 Years and over | 55 (100.0%) | 22 (40.0%) |
| Total | 295 (43.0%) | 402 (58.6%) |
Disability Status by Sex by Age in Pioche
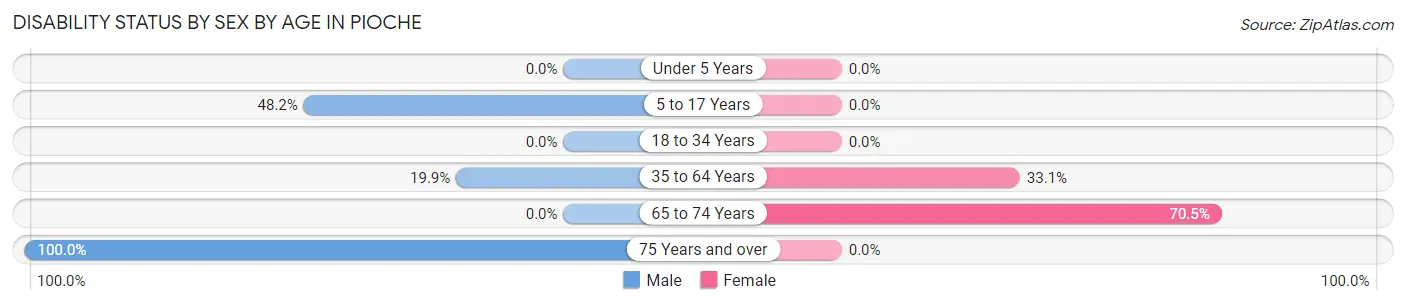
| Age Bracket | Male | Female |
| Under 5 Years | 0 (0.0%) | 0 (0.0%) |
| 5 to 17 Years | 27 (48.2%) | 0 (0.0%) |
| 18 to 34 Years | 0 (0.0%) | 0 (0.0%) |
| 35 to 64 Years | 46 (19.9%) | 41 (33.1%) |
| 65 to 74 Years | 0 (0.0%) | 43 (70.5%) |
| 75 Years and over | 55 (100.0%) | 0 (0.0%) |
Disability Class by Sex by Age in Pioche
Disability Class: Hearing Difficulty
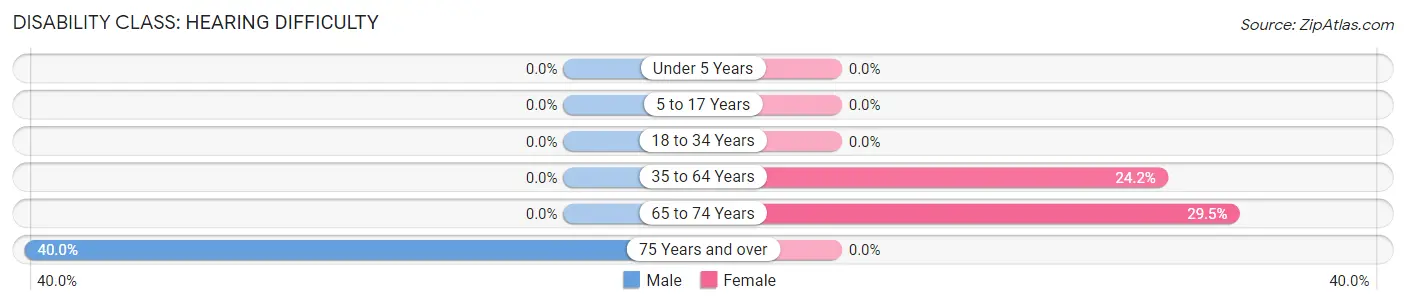
| Age Bracket | Male | Female |
| Under 5 Years | 0 (0.0%) | 0 (0.0%) |
| 5 to 17 Years | 0 (0.0%) | 0 (0.0%) |
| 18 to 34 Years | 0 (0.0%) | 0 (0.0%) |
| 35 to 64 Years | 0 (0.0%) | 30 (24.2%) |
| 65 to 74 Years | 0 (0.0%) | 18 (29.5%) |
| 75 Years and over | 22 (40.0%) | 0 (0.0%) |
Disability Class: Vision Difficulty
| Age Bracket | Male | Female |
| Under 5 Years | 0 (0.0%) | 0 (0.0%) |
| 5 to 17 Years | 0 (0.0%) | 0 (0.0%) |
| 18 to 34 Years | 0 (0.0%) | 0 (0.0%) |
| 35 to 64 Years | 0 (0.0%) | 0 (0.0%) |
| 65 to 74 Years | 0 (0.0%) | 0 (0.0%) |
| 75 Years and over | 0 (0.0%) | 0 (0.0%) |
Disability Class: Cognitive Difficulty
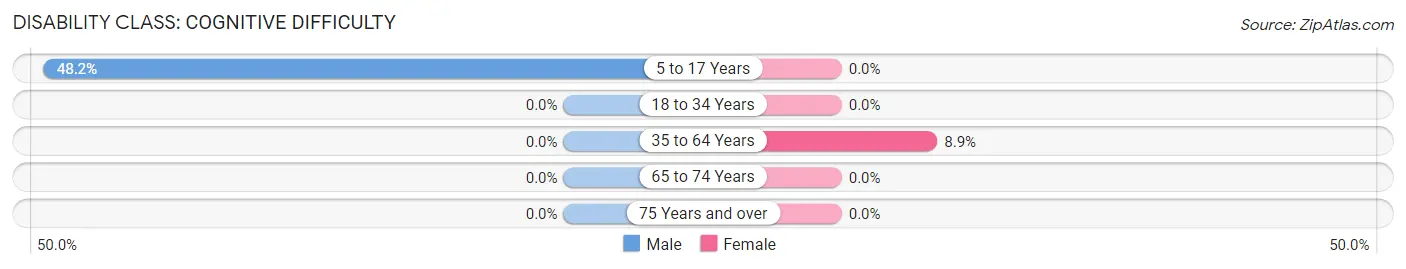
| Age Bracket | Male | Female |
| 5 to 17 Years | 27 (48.2%) | 0 (0.0%) |
| 18 to 34 Years | 0 (0.0%) | 0 (0.0%) |
| 35 to 64 Years | 0 (0.0%) | 11 (8.9%) |
| 65 to 74 Years | 0 (0.0%) | 0 (0.0%) |
| 75 Years and over | 0 (0.0%) | 0 (0.0%) |
Disability Class: Ambulatory Difficulty
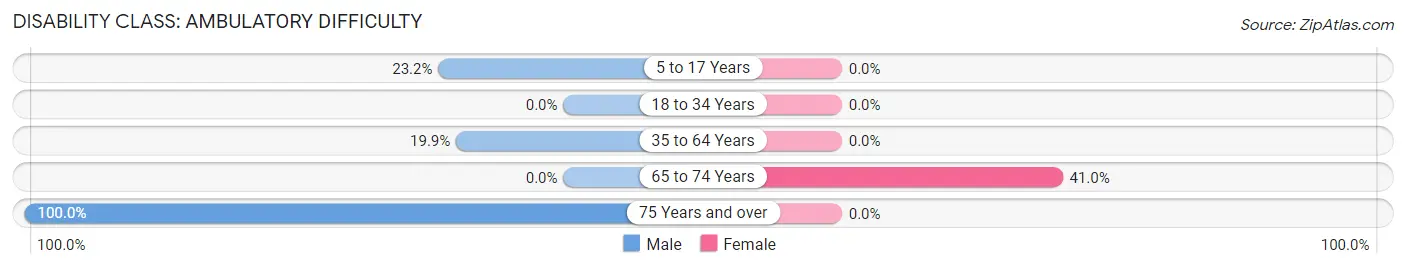
| Age Bracket | Male | Female |
| 5 to 17 Years | 13 (23.2%) | 0 (0.0%) |
| 18 to 34 Years | 0 (0.0%) | 0 (0.0%) |
| 35 to 64 Years | 46 (19.9%) | 0 (0.0%) |
| 65 to 74 Years | 0 (0.0%) | 25 (41.0%) |
| 75 Years and over | 55 (100.0%) | 0 (0.0%) |
Disability Class: Self-Care Difficulty
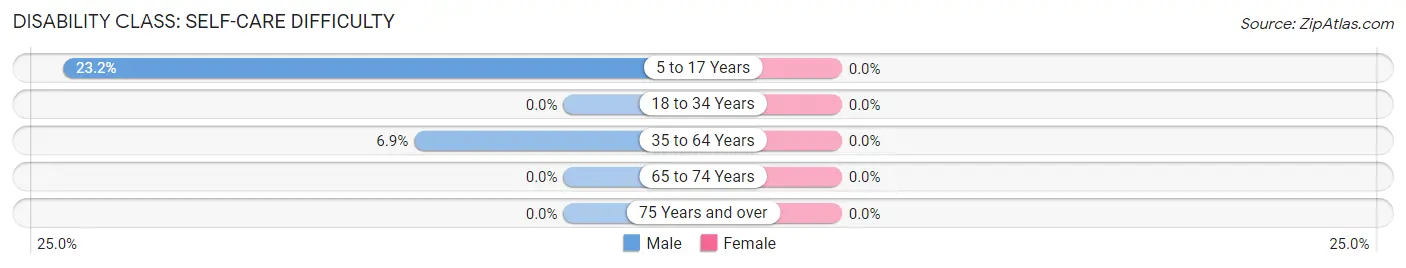
| Age Bracket | Male | Female |
| 5 to 17 Years | 13 (23.2%) | 0 (0.0%) |
| 18 to 34 Years | 0 (0.0%) | 0 (0.0%) |
| 35 to 64 Years | 16 (6.9%) | 0 (0.0%) |
| 65 to 74 Years | 0 (0.0%) | 0 (0.0%) |
| 75 Years and over | 0 (0.0%) | 0 (0.0%) |
Technology Access in Pioche
Computing Device Access in Pioche
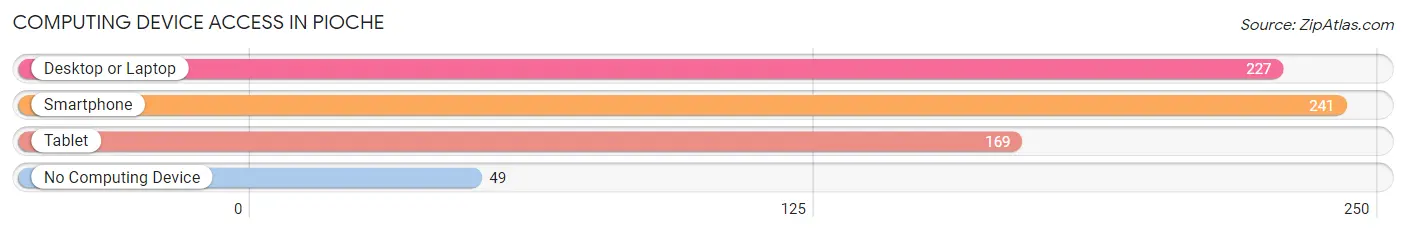
| Device Type | # Households | % Households |
| Desktop or Laptop | 227 | 71.6% |
| Smartphone | 241 | 76.0% |
| Tablet | 169 | 53.3% |
| No Computing Device | 49 | 15.5% |
| Total | 317 | 100.0% |
Internet Access in Pioche
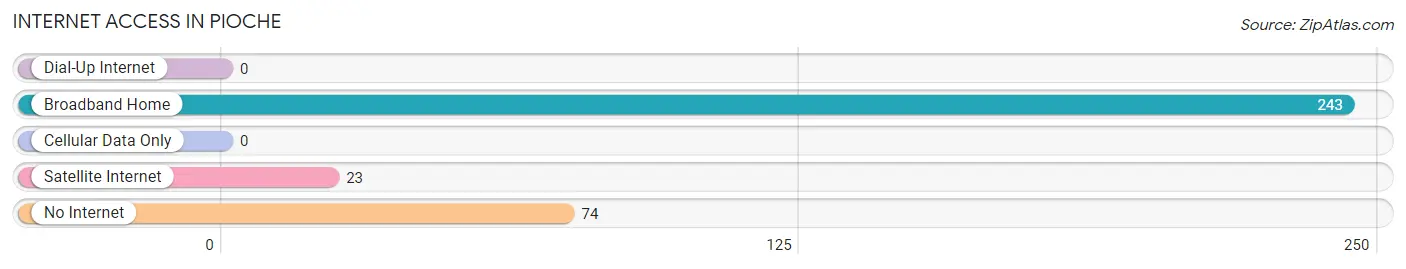
| Internet Type | # Households | % Households |
| Dial-Up Internet | 0 | 0.0% |
| Broadband Home | 243 | 76.7% |
| Cellular Data Only | 0 | 0.0% |
| Satellite Internet | 23 | 7.3% |
| No Internet | 74 | 23.3% |
| Total | 317 | 100.0% |
Pioche Summary
Pioche, Nevada is a small town located in Lincoln County, Nevada. It is situated in the eastern part of the state, approximately 90 miles northeast of Las Vegas. The town is located in a valley surrounded by mountains, and is known for its rich mining history.
History
The area around Pioche was first inhabited by the Southern Paiute people, who lived in the area for centuries before the arrival of European settlers. The first Europeans to arrive in the area were Spanish explorers in the late 1700s. The area was later explored by fur trappers and traders in the early 1800s.
In 1864, a group of prospectors discovered silver in the area and established the town of Pioche. The town quickly grew as miners flocked to the area in search of wealth. The town was named after a French mining engineer, Francois Pioche, who was instrumental in the development of the area.
The town quickly grew to become one of the most important mining towns in the state. By the late 1800s, Pioche was home to over 10,000 people and had a bustling economy. The town was home to several large mines, including the famous Bullionville Mine, which produced over $20 million in silver and gold.
The town experienced a decline in the early 1900s as the mining industry began to decline. By the 1950s, the population had dropped to just over 1,000 people. The town has since experienced a resurgence in recent years, with the population now estimated to be around 1,500 people.
Geography
Pioche is located in the eastern part of Nevada, approximately 90 miles northeast of Las Vegas. The town is situated in a valley surrounded by mountains, including the Toiyabe Range to the east and the Schell Creek Range to the west. The town is located at an elevation of 5,890 feet.
The climate in Pioche is semi-arid, with hot summers and cold winters. The average high temperature in the summer is around 90 degrees Fahrenheit, while the average low temperature in the winter is around 20 degrees Fahrenheit. The town receives an average of 8 inches of precipitation per year.
Economy
The economy of Pioche is largely based on tourism and mining. The town is home to several tourist attractions, including the historic Pioche Mining District, which is listed on the National Register of Historic Places. The town is also home to several small businesses, including restaurants, shops, and hotels.
The town is also home to several active mines, including the Bullionville Mine, which produces gold and silver. The town is also home to several small-scale mining operations, which produce a variety of minerals, including copper, lead, and zinc.
Demographics
As of the 2010 census, the population of Pioche was 1,502 people. The racial makeup of the town was 94.3% White, 0.7% African American, 0.7% Native American, 0.3% Asian, 0.1% Pacific Islander, and 3.0% from other races. The median household income in the town was $37,500, and the median age was 44.7 years.
Common Questions
What is Per Capita Income in Pioche?
Per Capita income in Pioche is $27,412.
What is the Median Family Income in Pioche?
Median Family Income in Pioche is $74,441.
What is the Median Household income in Pioche?
Median Household Income in Pioche is $73,849.
What is Inequality or Gini Index in Pioche?
Inequality or Gini Index in Pioche is 0.22.
What is the Total Population of Pioche?
Total Population of Pioche is 1,111.
What is the Total Male Population of Pioche?
Total Male Population of Pioche is 903.
What is the Total Female Population of Pioche?
Total Female Population of Pioche is 208.
What is the Ratio of Males per 100 Females in Pioche?
There are 434.13 Males per 100 Females in Pioche.
What is the Ratio of Females per 100 Males in Pioche?
There are 23.03 Females per 100 Males in Pioche.
What is the Median Population Age in Pioche?
Median Population Age in Pioche is 45.5 Years.
What is the Average Family Size in Pioche
Average Family Size in Pioche is 2.4 People.
What is the Average Household Size in Pioche
Average Household Size in Pioche is 2.2 People.
How Large is the Labor Force in Pioche?
There are 367 People in the Labor Forcein in Pioche.
What is the Percentage of People in the Labor Force in Pioche?
35.6% of People are in the Labor Force in Pioche.
What is the Unemployment Rate in Pioche?
Unemployment Rate in Pioche is 15.0%.