Eureka, NV Map & Demographics
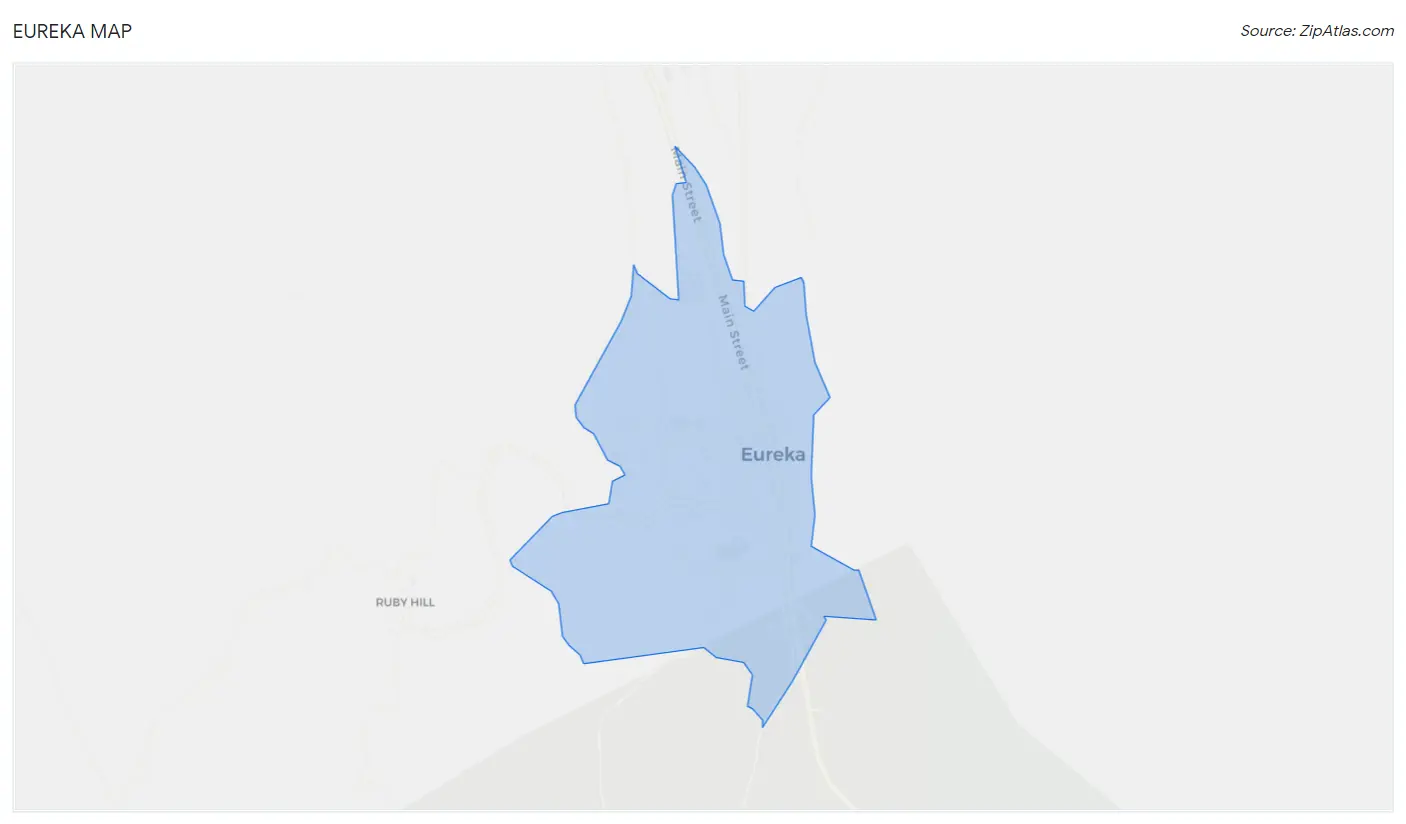
Eureka Map
Eureka Overview
$39,158
PER CAPITA INCOME
$97,891
AVG FAMILY INCOME
$72,113
AVG HOUSEHOLD INCOME
0.31
INEQUALITY / GINI INDEX
315
TOTAL POPULATION
134
MALE POPULATION
181
FEMALE POPULATION
74.03
MALES / 100 FEMALES
135.07
FEMALES / 100 MALES
61.6
MEDIAN AGE
2.2
AVG FAMILY SIZE
2.0
AVG HOUSEHOLD SIZE
163
LABOR FORCE [ PEOPLE ]
58.6%
PERCENT IN LABOR FORCE
Eureka Zip Codes
Eureka Area Codes
Income in Eureka
Income Overview in Eureka
Per Capita Income in Eureka is $39,158, while median incomes of families and households are $97,891 and $72,113 respectively.
| Characteristic | Number | Measure |
| Per Capita Income | 315 | $39,158 |
| Median Family Income | 127 | $97,891 |
| Mean Family Income | 127 | $91,212 |
| Median Household Income | 151 | $72,113 |
| Mean Household Income | 151 | $84,653 |
| Income Deficit | 127 | $0 |
| Wage / Income Gap (%) | 315 | 0.00% |
| Wage / Income Gap ($) | 315 | 100.00¢ per $1 |
| Gini / Inequality Index | 315 | 0.31 |
Earnings by Sex in Eureka
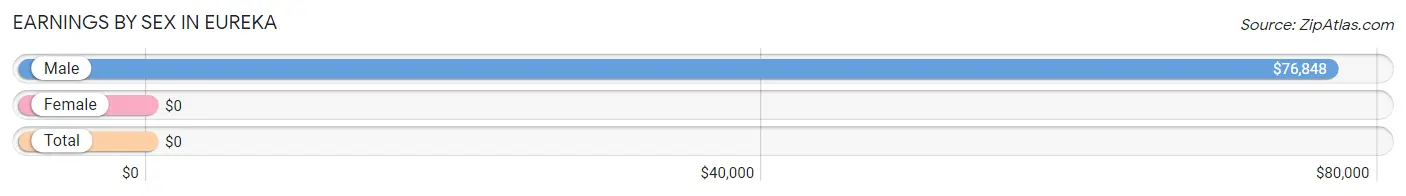
| Sex | Number | Average Earnings |
| Male | 80 (48.8%) | $76,848 |
| Female | 84 (51.2%) | $0 |
| Total | 164 (100.0%) | $0 |
Earnings by Sex by Income Bracket in Eureka
The most common earnings brackets in Eureka are $75,000 to $99,999 for men (54 | 67.5%) and $5,000 to $7,499 for women (27 | 32.1%).
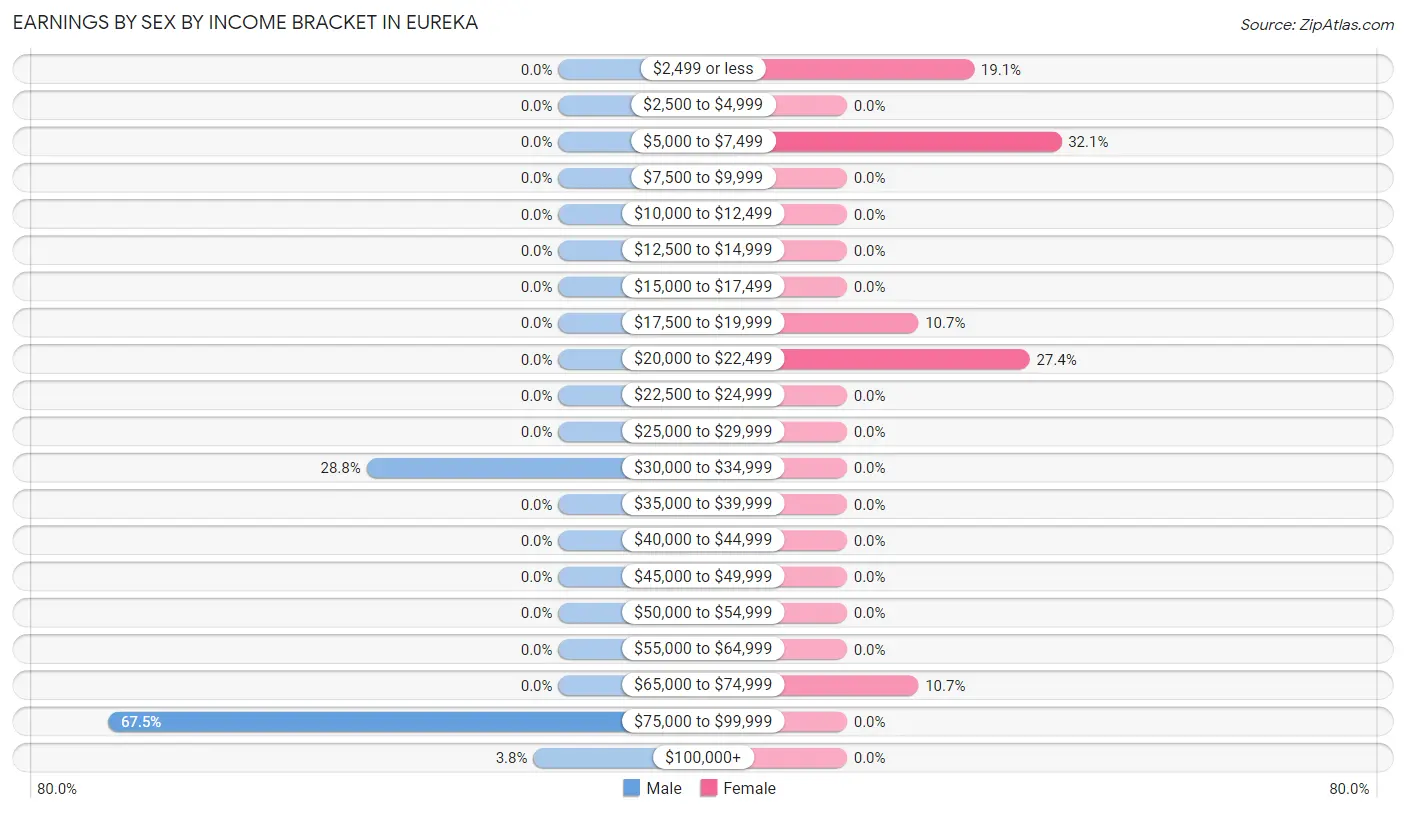
| Income | Male | Female |
| $2,499 or less | 0 (0.0%) | 16 (19.1%) |
| $2,500 to $4,999 | 0 (0.0%) | 0 (0.0%) |
| $5,000 to $7,499 | 0 (0.0%) | 27 (32.1%) |
| $7,500 to $9,999 | 0 (0.0%) | 0 (0.0%) |
| $10,000 to $12,499 | 0 (0.0%) | 0 (0.0%) |
| $12,500 to $14,999 | 0 (0.0%) | 0 (0.0%) |
| $15,000 to $17,499 | 0 (0.0%) | 0 (0.0%) |
| $17,500 to $19,999 | 0 (0.0%) | 9 (10.7%) |
| $20,000 to $22,499 | 0 (0.0%) | 23 (27.4%) |
| $22,500 to $24,999 | 0 (0.0%) | 0 (0.0%) |
| $25,000 to $29,999 | 0 (0.0%) | 0 (0.0%) |
| $30,000 to $34,999 | 23 (28.7%) | 0 (0.0%) |
| $35,000 to $39,999 | 0 (0.0%) | 0 (0.0%) |
| $40,000 to $44,999 | 0 (0.0%) | 0 (0.0%) |
| $45,000 to $49,999 | 0 (0.0%) | 0 (0.0%) |
| $50,000 to $54,999 | 0 (0.0%) | 0 (0.0%) |
| $55,000 to $64,999 | 0 (0.0%) | 0 (0.0%) |
| $65,000 to $74,999 | 0 (0.0%) | 9 (10.7%) |
| $75,000 to $99,999 | 54 (67.5%) | 0 (0.0%) |
| $100,000+ | 3 (3.7%) | 0 (0.0%) |
| Total | 80 (100.0%) | 84 (100.0%) |
Earnings by Sex by Educational Attainment in Eureka
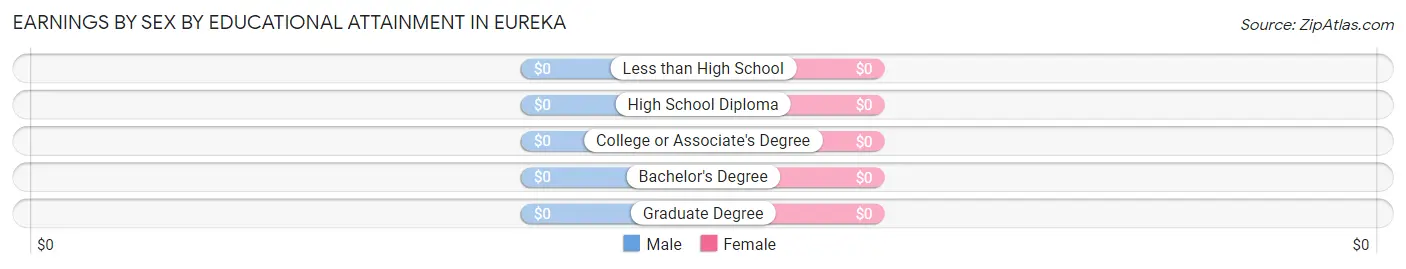
| Educational Attainment | Male Income | Female Income |
| Less than High School | - | - |
| High School Diploma | - | - |
| College or Associate's Degree | - | - |
| Bachelor's Degree | - | - |
| Graduate Degree | - | - |
| Total | $76,902 | $20,380 |
Family Income in Eureka
Family Income Brackets in Eureka
According to the Eureka family income data, there are 42 families falling into the $50,000 to $74,999 income range, which is the most common income bracket and makes up 33.1% of all families.
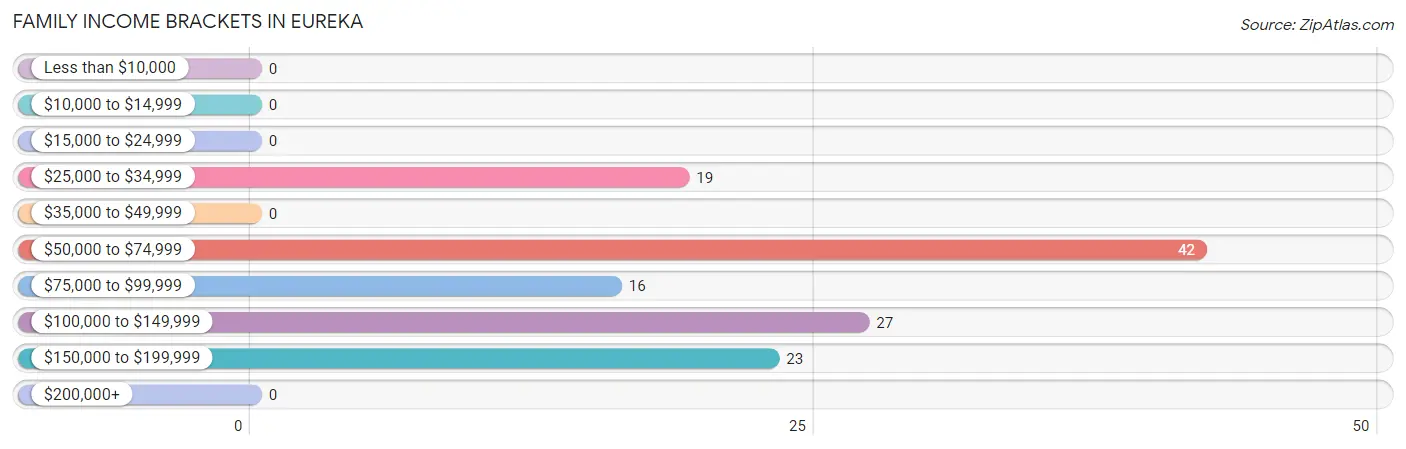
| Income Bracket | # Families | % Families |
| Less than $10,000 | 0 | 0.0% |
| $10,000 to $14,999 | 0 | 0.0% |
| $15,000 to $24,999 | 0 | 0.0% |
| $25,000 to $34,999 | 19 | 15.0% |
| $35,000 to $49,999 | 0 | 0.0% |
| $50,000 to $74,999 | 42 | 33.1% |
| $75,000 to $99,999 | 16 | 12.6% |
| $100,000 to $149,999 | 27 | 21.3% |
| $150,000 to $199,999 | 23 | 18.1% |
| $200,000+ | 0 | 0.0% |
Family Income by Famaliy Size in Eureka
2-person families (100 | 78.7%) account for the highest median family income in Eureka with $71,845 per family, while 2-person families (100 | 78.7%) have the highest median income of $35,922 per family member.
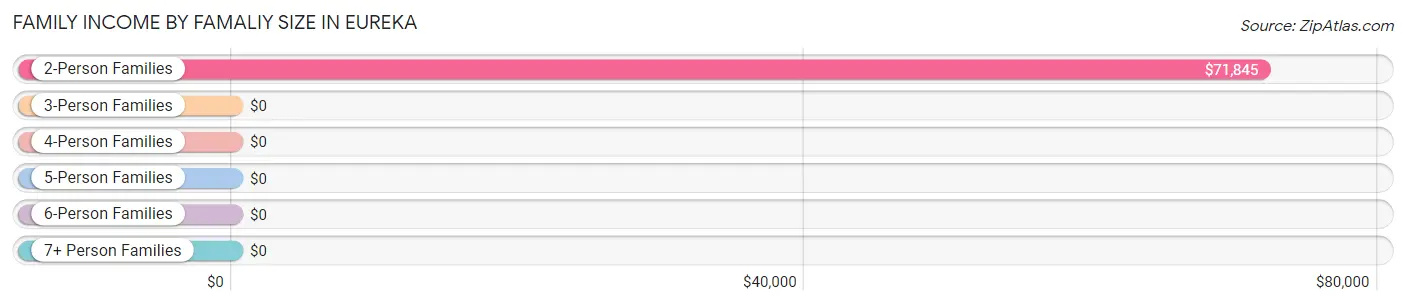
| Income Bracket | # Families | Median Income |
| 2-Person Families | 100 (78.7%) | $71,845 |
| 3-Person Families | 0 (0.0%) | $0 |
| 4-Person Families | 27 (21.3%) | $0 |
| 5-Person Families | 0 (0.0%) | $0 |
| 6-Person Families | 0 (0.0%) | $0 |
| 7+ Person Families | 0 (0.0%) | $0 |
| Total | 127 (100.0%) | $97,891 |
Family Income by Number of Earners in Eureka
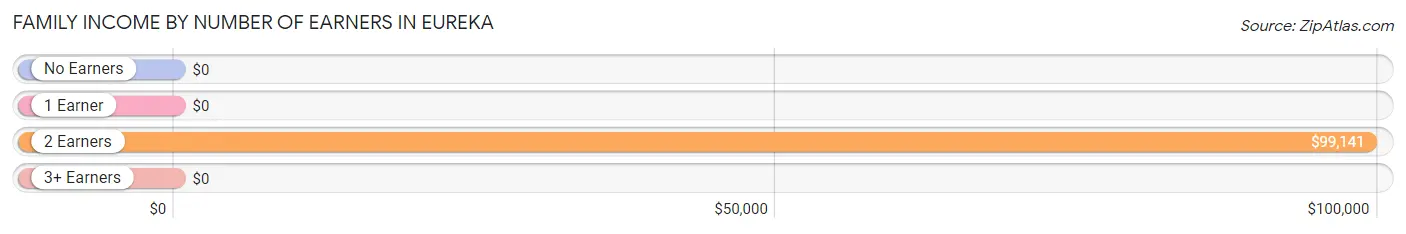
| Number of Earners | # Families | Median Income |
| No Earners | 39 (30.7%) | $0 |
| 1 Earner | 23 (18.1%) | $0 |
| 2 Earners | 65 (51.2%) | $99,141 |
| 3+ Earners | 0 (0.0%) | $0 |
| Total | 127 (100.0%) | $97,891 |
Household Income in Eureka
Household Income Brackets in Eureka
With 42 households falling in the category, the $50,000 to $74,999 income range is the most frequent in Eureka, accounting for 27.8% of all households.
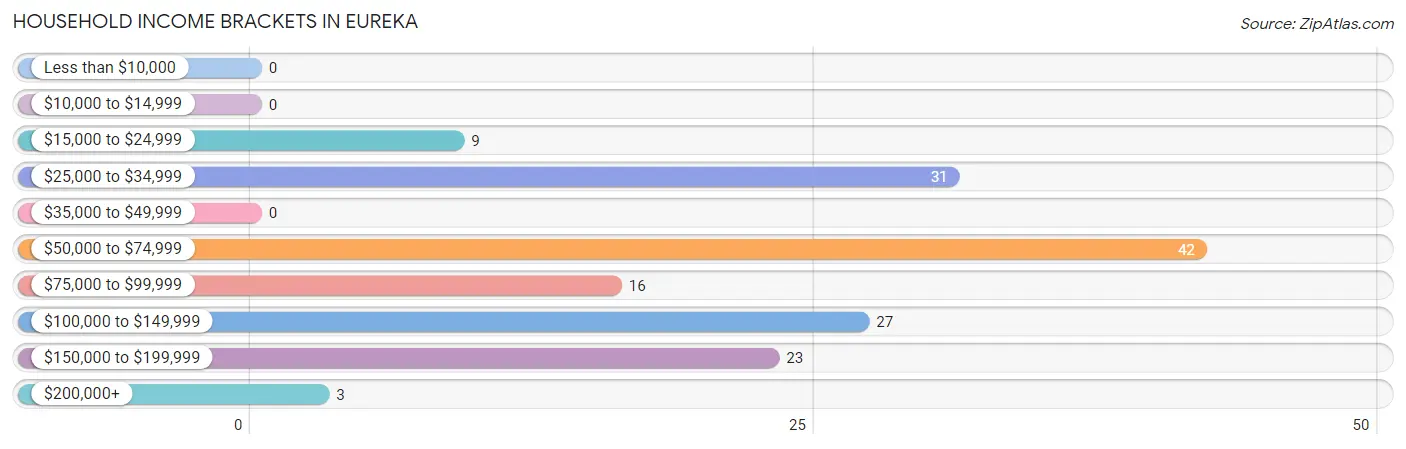
| Income Bracket | # Households | % Households |
| Less than $10,000 | 0 | 0.0% |
| $10,000 to $14,999 | 0 | 0.0% |
| $15,000 to $24,999 | 9 | 6.0% |
| $25,000 to $34,999 | 31 | 20.5% |
| $35,000 to $49,999 | 0 | 0.0% |
| $50,000 to $74,999 | 42 | 27.8% |
| $75,000 to $99,999 | 16 | 10.6% |
| $100,000 to $149,999 | 27 | 17.9% |
| $150,000 to $199,999 | 23 | 15.2% |
| $200,000+ | 3 | 2.0% |
Household Income by Householder Age in Eureka
The median household income in Eureka is $72,113, with the highest median household income of $71,080 found in the 45 to 64 years age bracket for the primary householder. A total of 57 households (37.8%) fall into this category. Meanwhile, the 15 to 24 years age bracket for the primary householder has the lowest median household income of $0, with 27 households (17.9%) in this group.
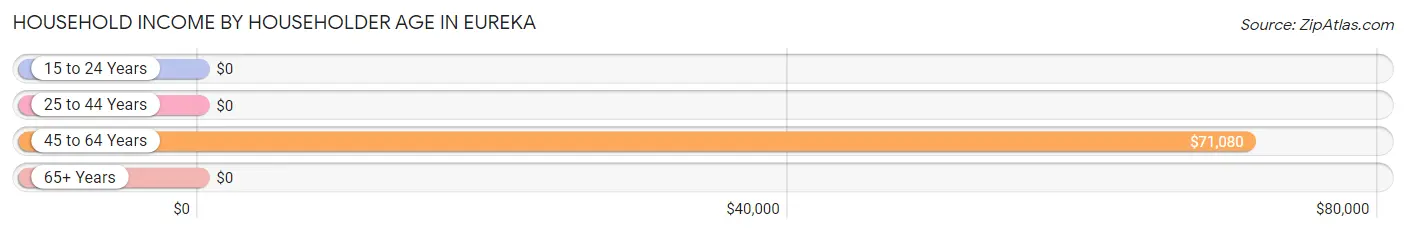
| Income Bracket | # Households | Median Income |
| 15 to 24 Years | 27 (17.9%) | $0 |
| 25 to 44 Years | 12 (8.0%) | $0 |
| 45 to 64 Years | 57 (37.8%) | $71,080 |
| 65+ Years | 55 (36.4%) | $0 |
| Total | 151 (100.0%) | $72,113 |
Poverty in Eureka
Income Below Poverty by Sex and Age in Eureka
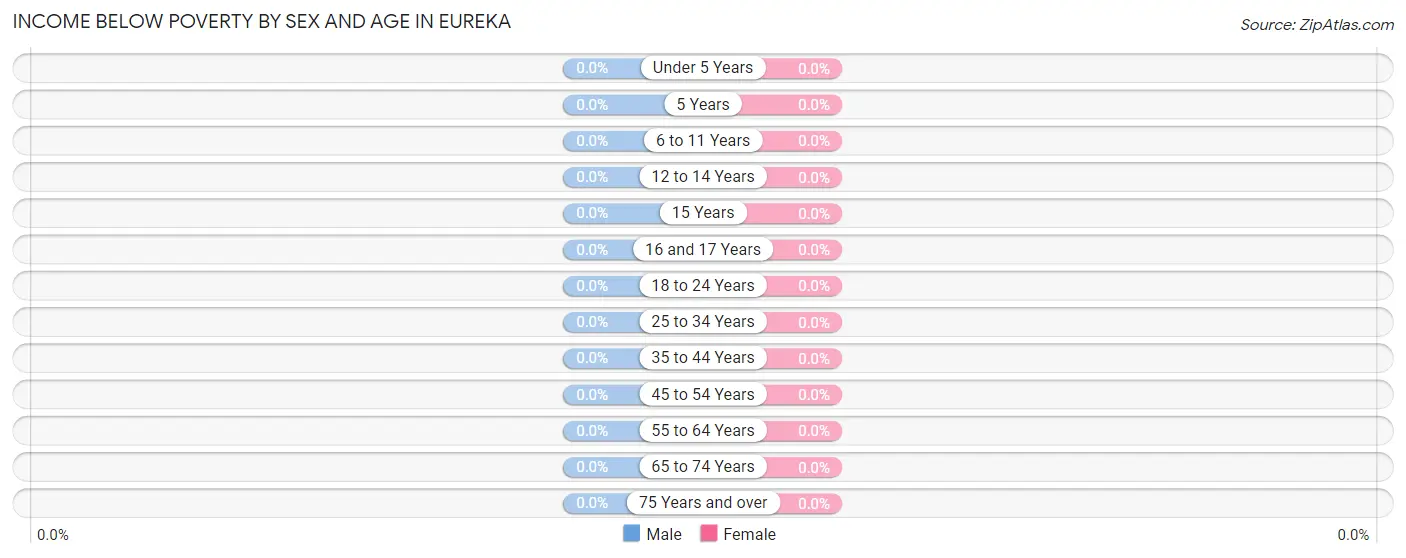
| Age Bracket | Male | Female |
| Under 5 Years | 0 (0.0%) | 0 (0.0%) |
| 5 Years | 0 (0.0%) | 0 (0.0%) |
| 6 to 11 Years | 0 (0.0%) | 0 (0.0%) |
| 12 to 14 Years | 0 (0.0%) | 0 (0.0%) |
| 15 Years | 0 (0.0%) | 0 (0.0%) |
| 16 and 17 Years | 0 (0.0%) | 0 (0.0%) |
| 18 to 24 Years | 0 (0.0%) | 0 (0.0%) |
| 25 to 34 Years | 0 (0.0%) | 0 (0.0%) |
| 35 to 44 Years | 0 (0.0%) | 0 (0.0%) |
| 45 to 54 Years | 0 (0.0%) | 0 (0.0%) |
| 55 to 64 Years | 0 (0.0%) | 0 (0.0%) |
| 65 to 74 Years | 0 (0.0%) | 0 (0.0%) |
| 75 Years and over | 0 (0.0%) | 0 (0.0%) |
| Total | 0 (0.0%) | 0 (0.0%) |
Income Above Poverty by Sex and Age in Eureka
According to the poverty statistics in Eureka, males aged 25 to 34 years and females aged under 5 years are the age groups that are most secure financially, with 100.0% of males and 100.0% of females in these age groups living above the poverty line.
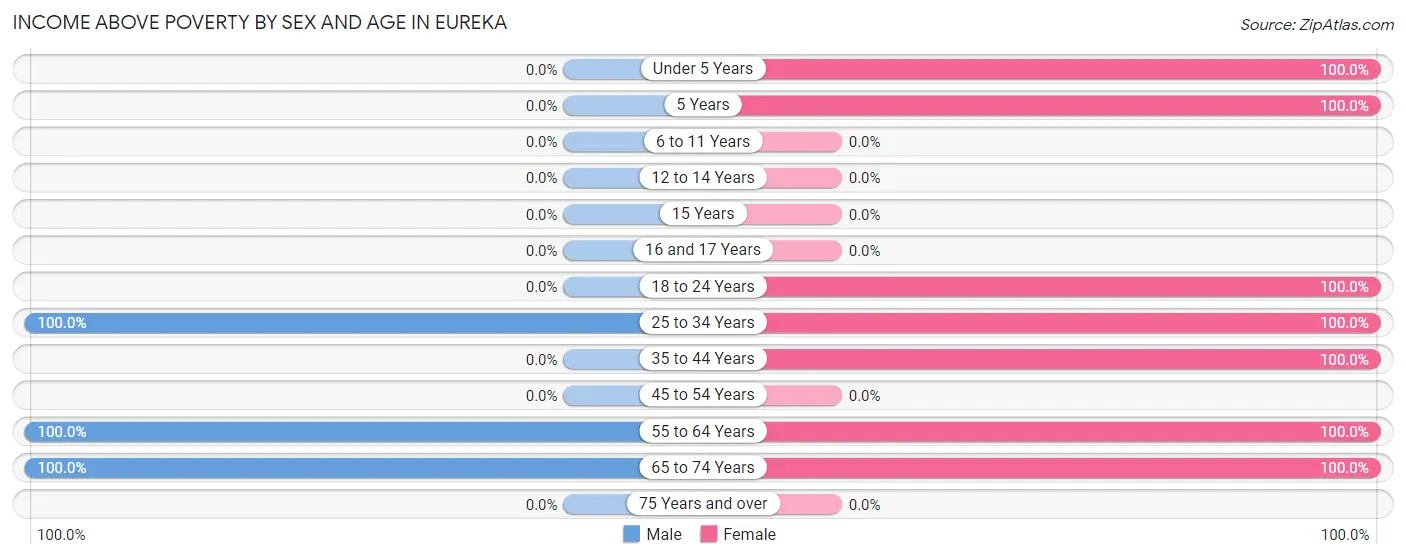
| Age Bracket | Male | Female |
| Under 5 Years | 0 (0.0%) | 16 (100.0%) |
| 5 Years | 0 (0.0%) | 21 (100.0%) |
| 6 to 11 Years | 0 (0.0%) | 0 (0.0%) |
| 12 to 14 Years | 0 (0.0%) | 0 (0.0%) |
| 15 Years | 0 (0.0%) | 0 (0.0%) |
| 16 and 17 Years | 0 (0.0%) | 0 (0.0%) |
| 18 to 24 Years | 0 (0.0%) | 27 (100.0%) |
| 25 to 34 Years | 20 (100.0%) | 9 (100.0%) |
| 35 to 44 Years | 0 (0.0%) | 9 (100.0%) |
| 45 to 54 Years | 0 (0.0%) | 0 (0.0%) |
| 55 to 64 Years | 39 (100.0%) | 83 (100.0%) |
| 65 to 74 Years | 69 (100.0%) | 16 (100.0%) |
| 75 Years and over | 0 (0.0%) | 0 (0.0%) |
| Total | 128 (100.0%) | 181 (100.0%) |
Income Below Poverty Among Married-Couple Families in Eureka
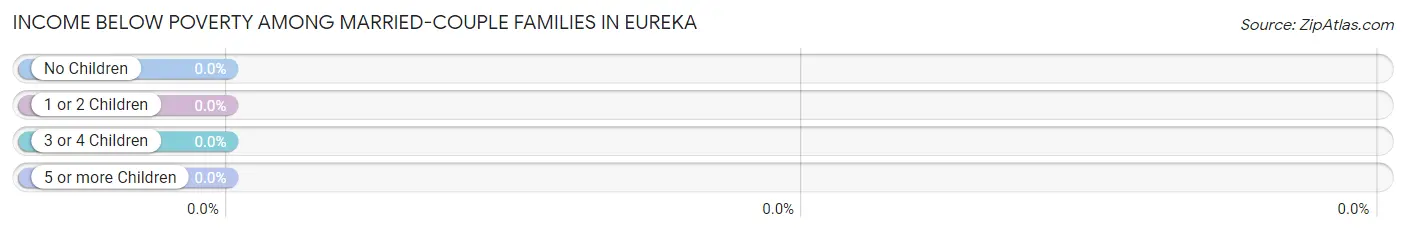
| Children | Above Poverty | Below Poverty |
| No Children | 100 (100.0%) | 0 (0.0%) |
| 1 or 2 Children | 27 (100.0%) | 0 (0.0%) |
| 3 or 4 Children | 0 (0.0%) | 0 (0.0%) |
| 5 or more Children | 0 (0.0%) | 0 (0.0%) |
| Total | 127 (100.0%) | 0 (0.0%) |
Income Below Poverty Among Single-Parent Households in Eureka
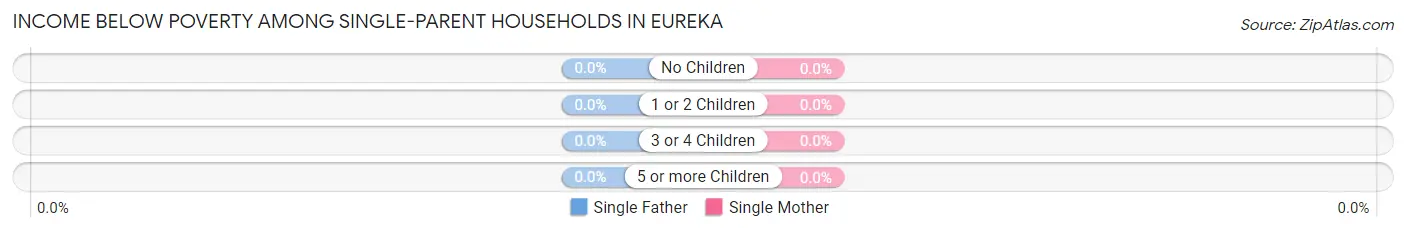
| Children | Single Father | Single Mother |
| No Children | 0 (0.0%) | 0 (0.0%) |
| 1 or 2 Children | 0 (0.0%) | 0 (0.0%) |
| 3 or 4 Children | 0 (0.0%) | 0 (0.0%) |
| 5 or more Children | 0 (0.0%) | 0 (0.0%) |
| Total | 0 (0.0%) | 0 (0.0%) |
Income Below Poverty Among Married-Couple vs Single-Parent Households in Eureka
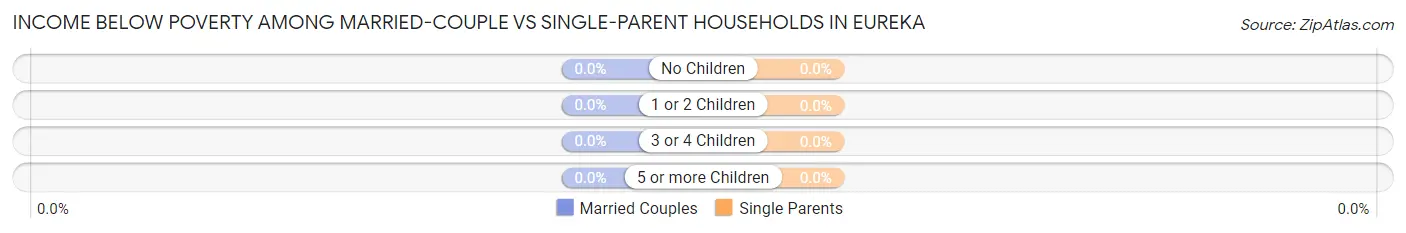
| Children | Married-Couple Families | Single-Parent Households |
| No Children | 0 (0.0%) | 0 (0.0%) |
| 1 or 2 Children | 0 (0.0%) | 0 (0.0%) |
| 3 or 4 Children | 0 (0.0%) | 0 (0.0%) |
| 5 or more Children | 0 (0.0%) | 0 (0.0%) |
| Total | 0 (0.0%) | 0 (0.0%) |
Race in Eureka
The most populous races in Eureka are White / Caucasian (304 | 96.5%), Asian (9 | 2.9%), and Hispanic or Latino (3 | 0.9%).
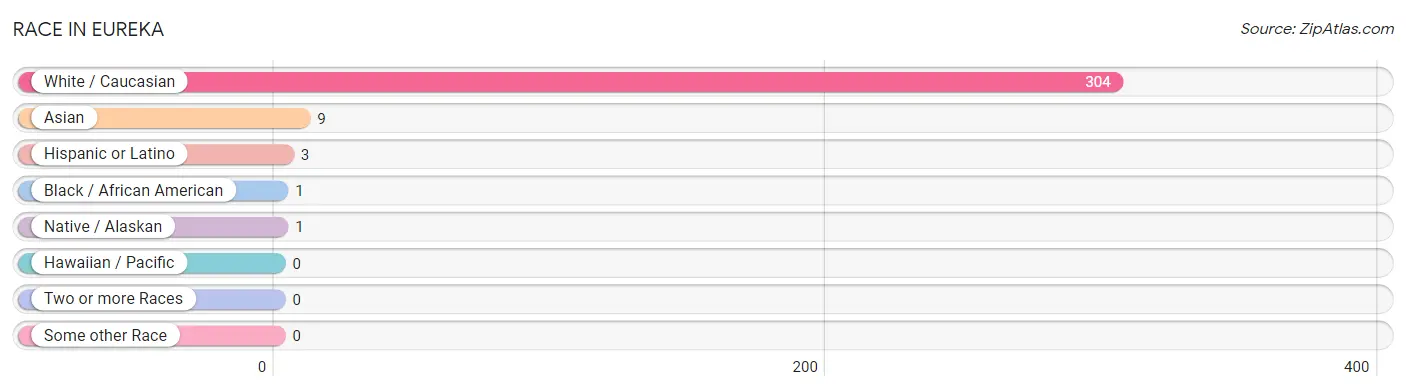
| Race | # Population | % Population |
| Asian | 9 | 2.9% |
| Black / African American | 1 | 0.3% |
| Hawaiian / Pacific | 0 | 0.0% |
| Hispanic or Latino | 3 | 0.9% |
| Native / Alaskan | 1 | 0.3% |
| White / Caucasian | 304 | 96.5% |
| Two or more Races | 0 | 0.0% |
| Some other Race | 0 | 0.0% |
| Total | 315 | 100.0% |
Ancestry in Eureka
The most populous ancestries reported in Eureka are English (114 | 36.2%), German (65 | 20.6%), Danish (48 | 15.2%), Norwegian (48 | 15.2%), and European (45 | 14.3%), together accounting for 101.6% of all Eureka residents.
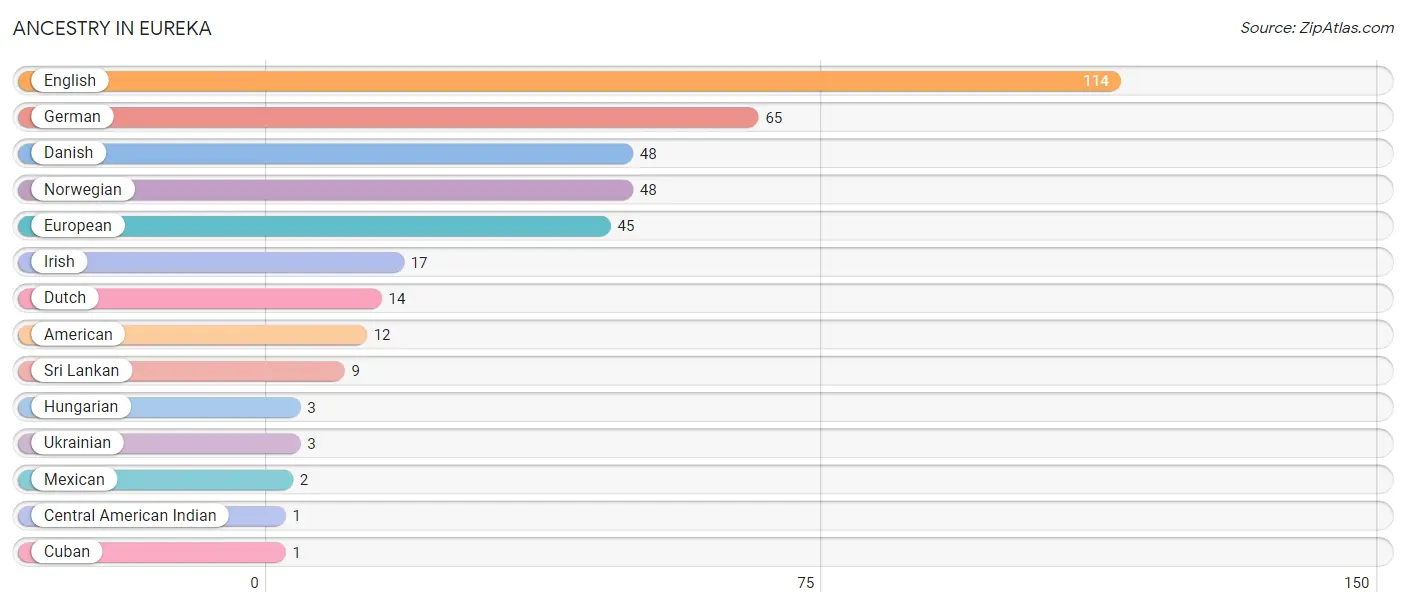
| Ancestry | # Population | % Population |
| American | 12 | 3.8% |
| Central American Indian | 1 | 0.3% |
| Cuban | 1 | 0.3% |
| Danish | 48 | 15.2% |
| Dutch | 14 | 4.4% |
| English | 114 | 36.2% |
| European | 45 | 14.3% |
| German | 65 | 20.6% |
| Hungarian | 3 | 0.9% |
| Irish | 17 | 5.4% |
| Mexican | 2 | 0.6% |
| Norwegian | 48 | 15.2% |
| Sri Lankan | 9 | 2.9% |
| Ukrainian | 3 | 0.9% | View All 14 Rows |
Immigrants in Eureka
The most numerous immigrant groups reported in Eureka came from Asia (9 | 2.9%), South Eastern Asia (9 | 2.9%), Vietnam (9 | 2.9%), Caribbean (1 | 0.3%), and Cuba (1 | 0.3%), together accounting for 9.2% of all Eureka residents.
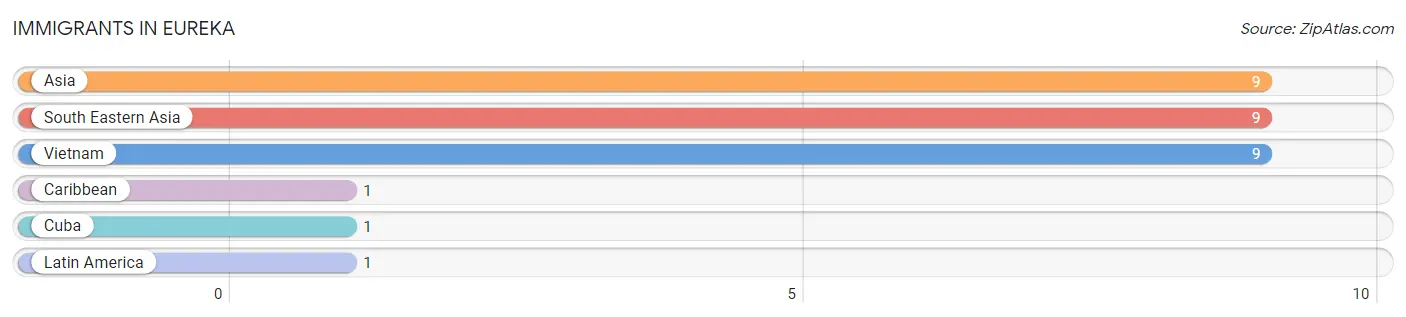
| Immigration Origin | # Population | % Population |
| Asia | 9 | 2.9% |
| Caribbean | 1 | 0.3% |
| Cuba | 1 | 0.3% |
| Latin America | 1 | 0.3% |
| South Eastern Asia | 9 | 2.9% |
| Vietnam | 9 | 2.9% | View All 6 Rows |
Sex and Age in Eureka
Sex and Age in Eureka
The most populous age groups in Eureka are 60 to 64 Years (39 | 29.1%) for men and 60 to 64 Years (83 | 45.9%) for women.
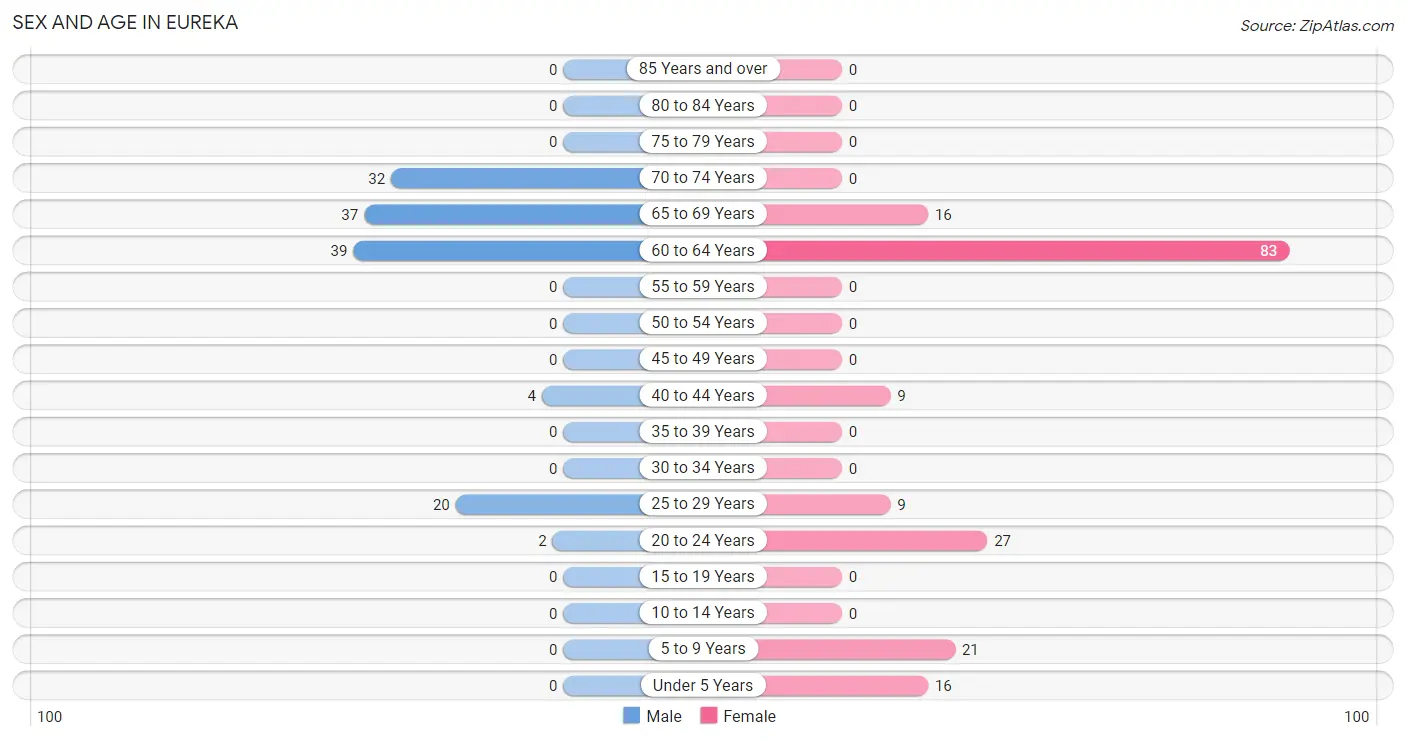
| Age Bracket | Male | Female |
| Under 5 Years | 0 (0.0%) | 16 (8.8%) |
| 5 to 9 Years | 0 (0.0%) | 21 (11.6%) |
| 10 to 14 Years | 0 (0.0%) | 0 (0.0%) |
| 15 to 19 Years | 0 (0.0%) | 0 (0.0%) |
| 20 to 24 Years | 2 (1.5%) | 27 (14.9%) |
| 25 to 29 Years | 20 (14.9%) | 9 (5.0%) |
| 30 to 34 Years | 0 (0.0%) | 0 (0.0%) |
| 35 to 39 Years | 0 (0.0%) | 0 (0.0%) |
| 40 to 44 Years | 4 (3.0%) | 9 (5.0%) |
| 45 to 49 Years | 0 (0.0%) | 0 (0.0%) |
| 50 to 54 Years | 0 (0.0%) | 0 (0.0%) |
| 55 to 59 Years | 0 (0.0%) | 0 (0.0%) |
| 60 to 64 Years | 39 (29.1%) | 83 (45.9%) |
| 65 to 69 Years | 37 (27.6%) | 16 (8.8%) |
| 70 to 74 Years | 32 (23.9%) | 0 (0.0%) |
| 75 to 79 Years | 0 (0.0%) | 0 (0.0%) |
| 80 to 84 Years | 0 (0.0%) | 0 (0.0%) |
| 85 Years and over | 0 (0.0%) | 0 (0.0%) |
| Total | 134 (100.0%) | 181 (100.0%) |
Families and Households in Eureka
Median Family Size in Eureka
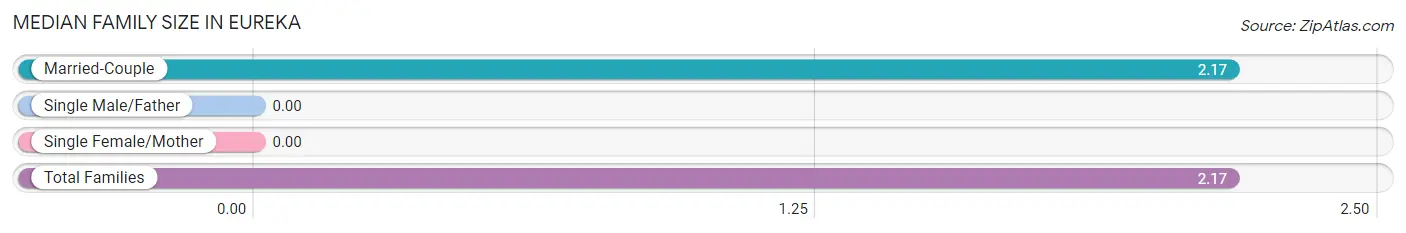
| Family Type | # Families | Family Size |
| Married-Couple | 127 (100.0%) | 2.17 |
| Single Male/Father | 0 (0.0%) | - |
| Single Female/Mother | 0 (0.0%) | - |
| Total Families | 127 (100.0%) | 2.17 |
Median Household Size in Eureka
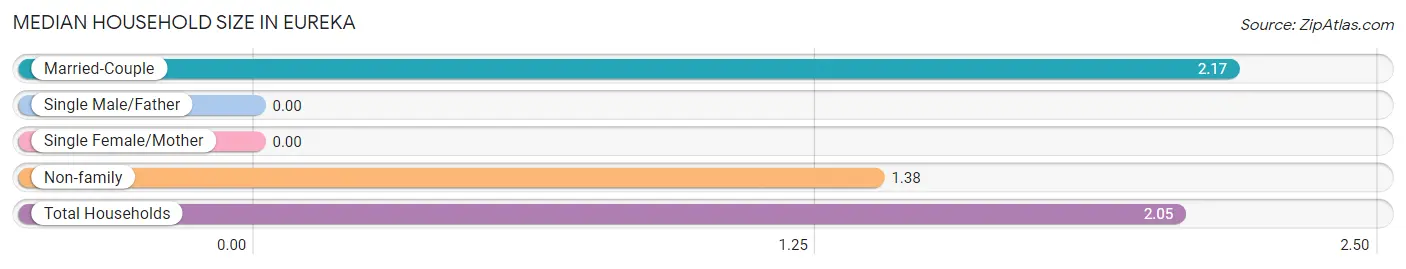
| Household Type | # Households | Household Size |
| Married-Couple | 127 (84.1%) | 2.17 |
| Single Male/Father | 0 (0.0%) | - |
| Single Female/Mother | 0 (0.0%) | - |
| Non-family | 24 (15.9%) | 1.38 |
| Total Households | 151 (100.0%) | 2.05 |
Household Size by Marriage Status in Eureka
Out of a total of 151 households in Eureka, 127 (84.1%) are family households, while 24 (15.9%) are nonfamily households. The most numerous type of family households are 2-person households, comprising 100, and the most common type of nonfamily households are 1-person households, comprising 21.
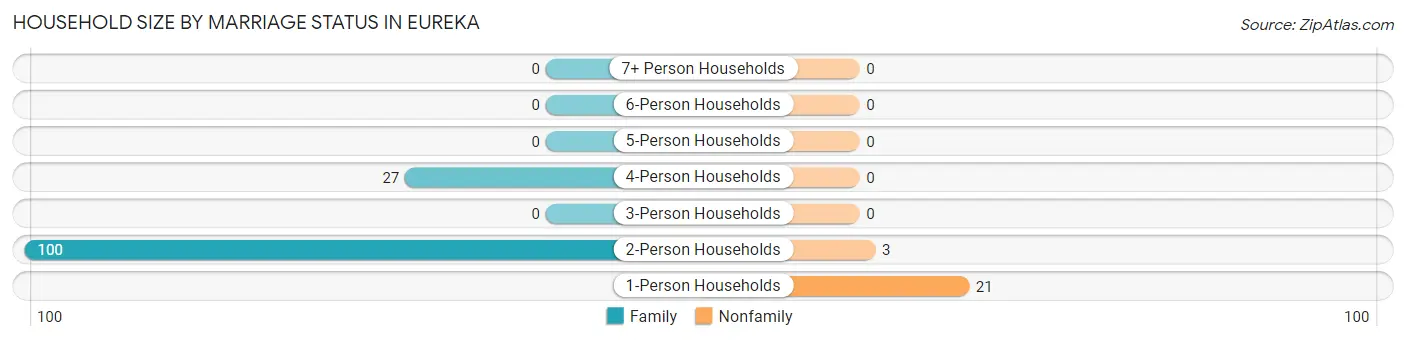
| Household Size | Family Households | Nonfamily Households |
| 1-Person Households | - | 21 (13.9%) |
| 2-Person Households | 100 (66.2%) | 3 (2.0%) |
| 3-Person Households | 0 (0.0%) | 0 (0.0%) |
| 4-Person Households | 27 (17.9%) | 0 (0.0%) |
| 5-Person Households | 0 (0.0%) | 0 (0.0%) |
| 6-Person Households | 0 (0.0%) | 0 (0.0%) |
| 7+ Person Households | 0 (0.0%) | 0 (0.0%) |
| Total | 127 (84.1%) | 24 (15.9%) |
Female Fertility in Eureka
Fertility by Age in Eureka
Average fertility rate in Eureka is 600.0 births per 1,000 women. Women in the age bracket of 20 to 34 years have the highest fertility rate with 750.0 births per 1,000 women. Women in the age bracket of 20 to 34 years acount for 100.0% of all women with births.
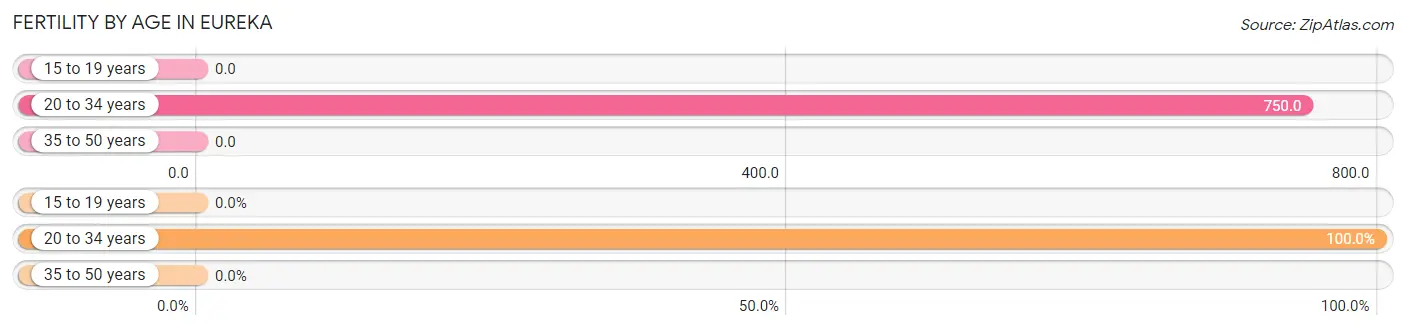
| Age Bracket | Women with Births | Births / 1,000 Women |
| 15 to 19 years | 0 (0.0%) | 0.0 |
| 20 to 34 years | 27 (100.0%) | 750.0 |
| 35 to 50 years | 0 (0.0%) | 0.0 |
| Total | 27 (100.0%) | 600.0 |
Fertility by Age by Marriage Status in Eureka
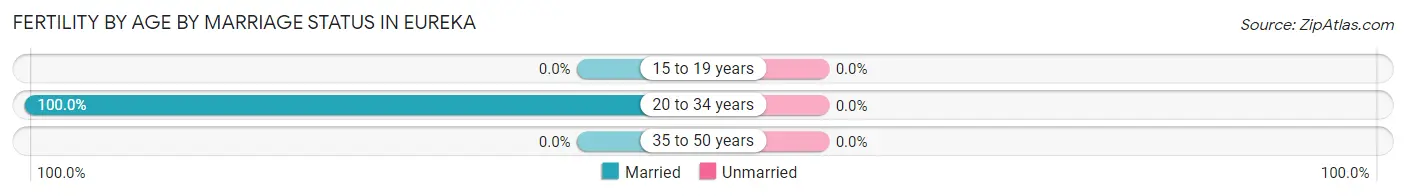
| Age Bracket | Married | Unmarried |
| 15 to 19 years | 0 (0.0%) | 0 (0.0%) |
| 20 to 34 years | 27 (100.0%) | 0 (0.0%) |
| 35 to 50 years | 0 (0.0%) | 0 (0.0%) |
| Total | 27 (100.0%) | 0 (0.0%) |
Fertility by Education in Eureka
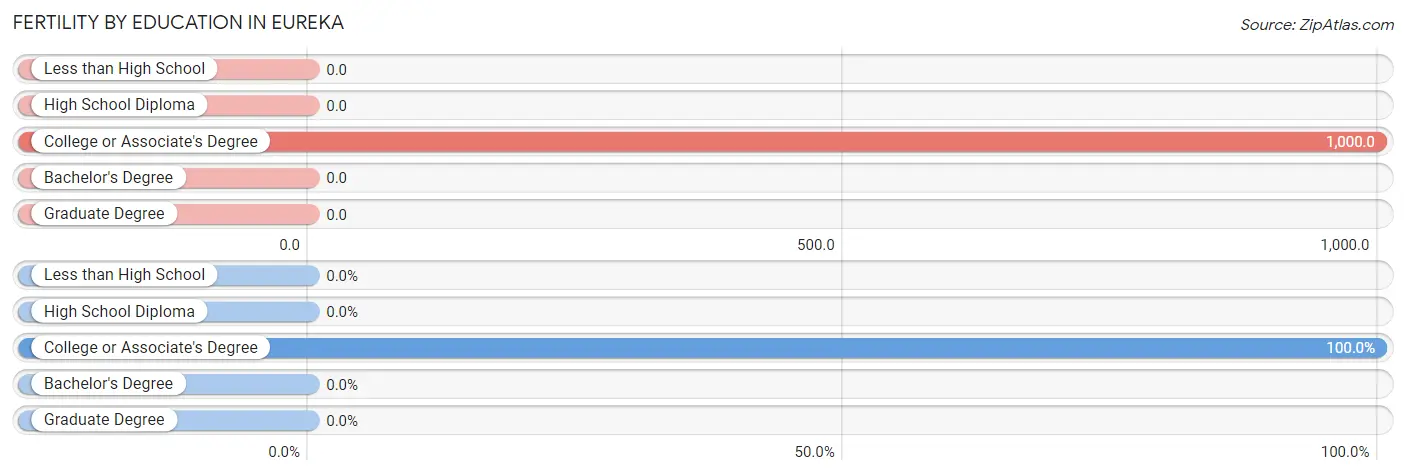
| Educational Attainment | Women with Births | Births / 1,000 Women |
| Less than High School | 0 (0.0%) | 0.0 |
| High School Diploma | 0 (0.0%) | 0.0 |
| College or Associate's Degree | 27 (100.0%) | 1,000.0 |
| Bachelor's Degree | 0 (0.0%) | 0.0 |
| Graduate Degree | 0 (0.0%) | 0.0 |
| Total | 27 (100.0%) | 600.0 |
Fertility by Education by Marriage Status in Eureka
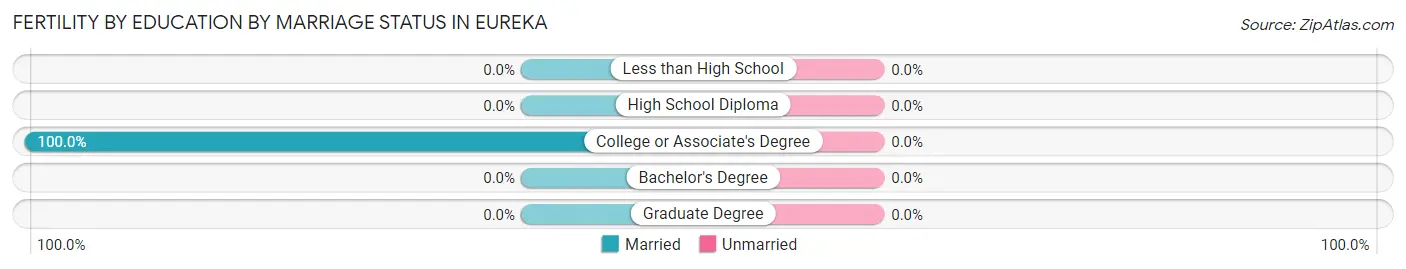
| Educational Attainment | Married | Unmarried |
| Less than High School | 0 (0.0%) | 0 (0.0%) |
| High School Diploma | 0 (0.0%) | 0 (0.0%) |
| College or Associate's Degree | 27 (100.0%) | 0 (0.0%) |
| Bachelor's Degree | 0 (0.0%) | 0 (0.0%) |
| Graduate Degree | 0 (0.0%) | 0 (0.0%) |
| Total | 27 (100.0%) | 0 (0.0%) |
Employment Characteristics in Eureka
Employment by Class of Employer in Eureka
Among the 163 employed individuals in Eureka, private company employees (88 | 54.0%), local government employees (50 | 30.7%), and self-employed (not incorporated) (16 | 9.8%) make up the most common classes of employment.
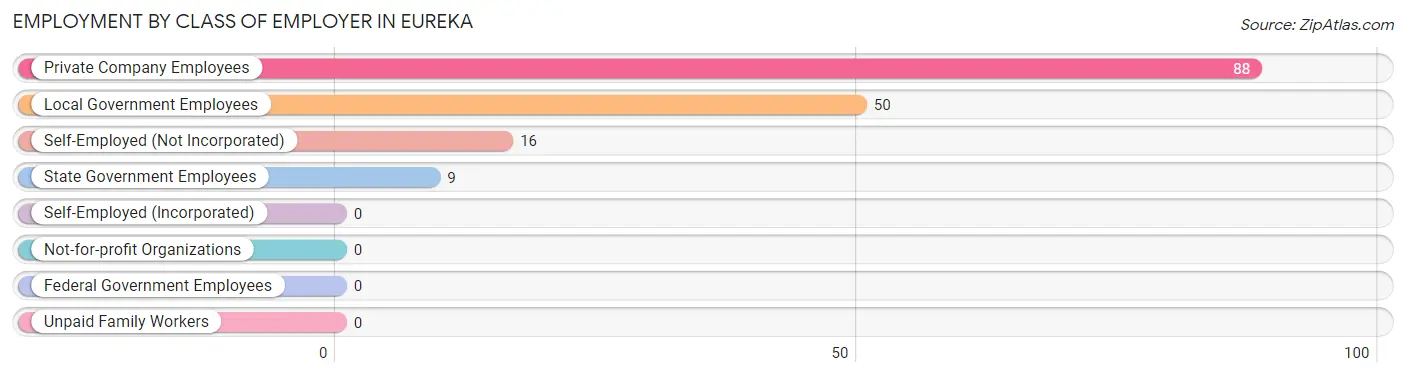
| Employer Class | # Employees | % Employees |
| Private Company Employees | 88 | 54.0% |
| Self-Employed (Incorporated) | 0 | 0.0% |
| Self-Employed (Not Incorporated) | 16 | 9.8% |
| Not-for-profit Organizations | 0 | 0.0% |
| Local Government Employees | 50 | 30.7% |
| State Government Employees | 9 | 5.5% |
| Federal Government Employees | 0 | 0.0% |
| Unpaid Family Workers | 0 | 0.0% |
| Total | 163 | 100.0% |
Employment Status by Age in Eureka
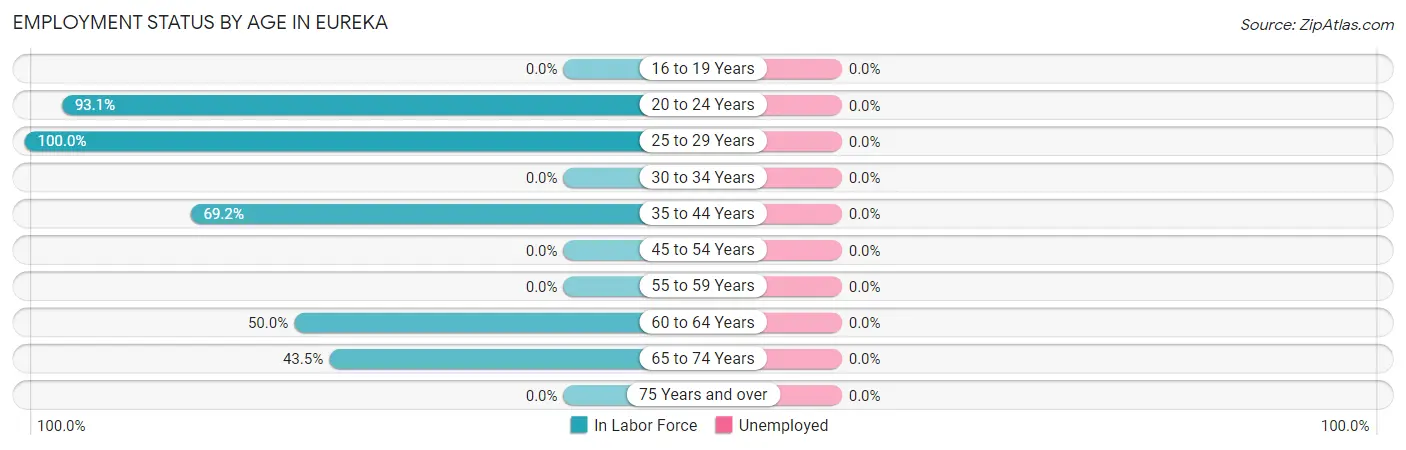
| Age Bracket | In Labor Force | Unemployed |
| 16 to 19 Years | 0 (0.0%) | 0 (0.0%) |
| 20 to 24 Years | 27 (93.1%) | 0 (0.0%) |
| 25 to 29 Years | 29 (100.0%) | 0 (0.0%) |
| 30 to 34 Years | 0 (0.0%) | 0 (0.0%) |
| 35 to 44 Years | 9 (69.2%) | 0 (0.0%) |
| 45 to 54 Years | 0 (0.0%) | 0 (0.0%) |
| 55 to 59 Years | 0 (0.0%) | 0 (0.0%) |
| 60 to 64 Years | 61 (50.0%) | 0 (0.0%) |
| 65 to 74 Years | 37 (43.5%) | 0 (0.0%) |
| 75 Years and over | 0 (0.0%) | 0 (0.0%) |
| Total | 163 (58.6%) | 0 (0.0%) |
Employment Status by Educational Attainment in Eureka
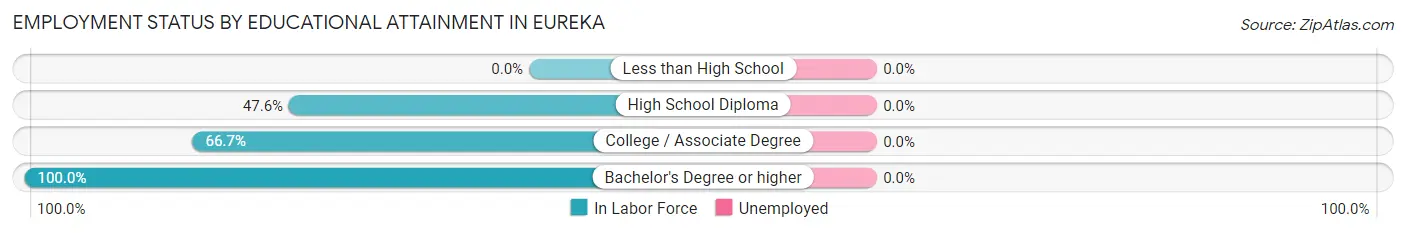
| Educational Attainment | In Labor Force | Unemployed |
| Less than High School | 0 (0.0%) | 0 (0.0%) |
| High School Diploma | 40 (47.6%) | 0 (0.0%) |
| College / Associate Degree | 38 (66.7%) | 0 (0.0%) |
| Bachelor's Degree or higher | 21 (100.0%) | 0 (0.0%) |
| Total | 99 (60.4%) | 0 (0.0%) |
Employment Occupations by Sex in Eureka
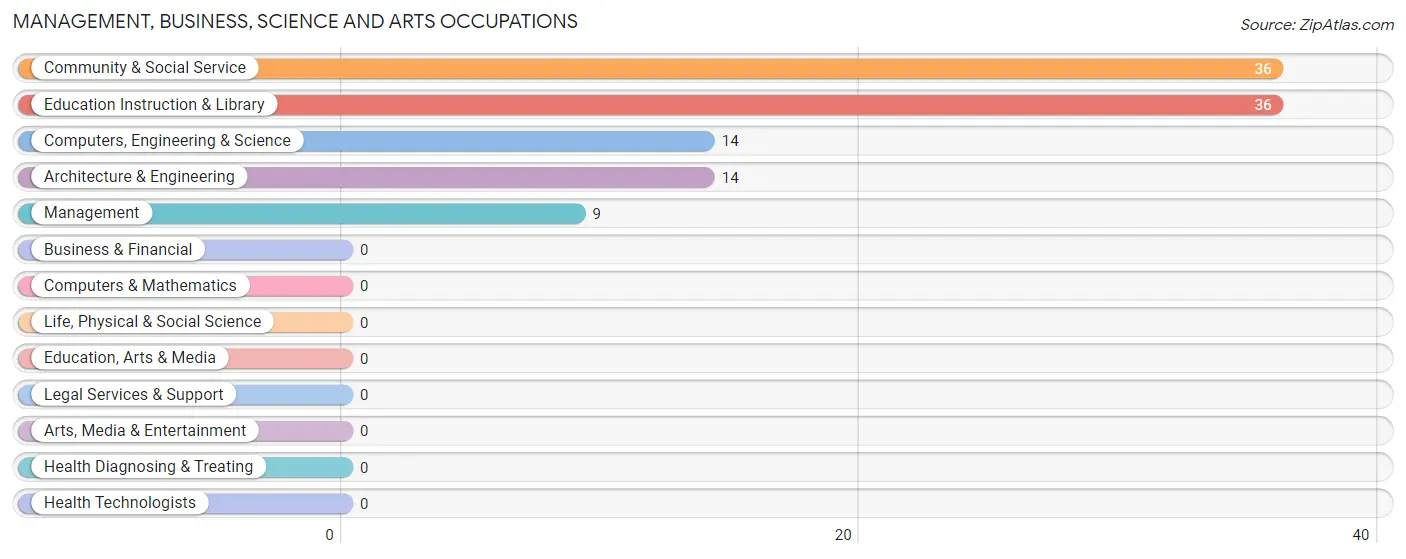
Management, Business, Science and Arts Occupations
The most common Management, Business, Science and Arts occupations in Eureka are Community & Social Service (36 | 22.1%), Education Instruction & Library (36 | 22.1%), Computers, Engineering & Science (14 | 8.6%), Architecture & Engineering (14 | 8.6%), and Management (9 | 5.5%).
Management, Business, Science and Arts Occupations by Sex
Within the Management, Business, Science and Arts occupations in Eureka, the most male-oriented occupations are Computers, Engineering & Science (100.0%), and Architecture & Engineering (100.0%), while the most female-oriented occupations are Management (100.0%), Community & Social Service (100.0%), and Education Instruction & Library (100.0%).
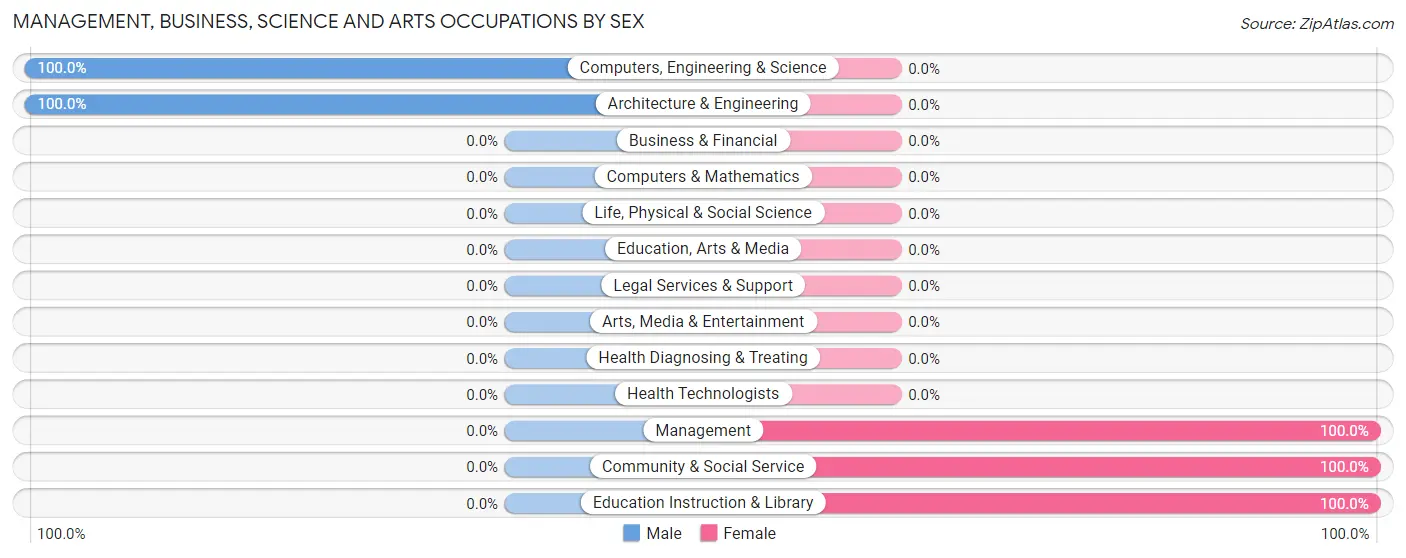
| Occupation | Male | Female |
| Management | 0 (0.0%) | 9 (100.0%) |
| Business & Financial | 0 (0.0%) | 0 (0.0%) |
| Computers, Engineering & Science | 14 (100.0%) | 0 (0.0%) |
| Computers & Mathematics | 0 (0.0%) | 0 (0.0%) |
| Architecture & Engineering | 14 (100.0%) | 0 (0.0%) |
| Life, Physical & Social Science | 0 (0.0%) | 0 (0.0%) |
| Community & Social Service | 0 (0.0%) | 36 (100.0%) |
| Education, Arts & Media | 0 (0.0%) | 0 (0.0%) |
| Legal Services & Support | 0 (0.0%) | 0 (0.0%) |
| Education Instruction & Library | 0 (0.0%) | 36 (100.0%) |
| Arts, Media & Entertainment | 0 (0.0%) | 0 (0.0%) |
| Health Diagnosing & Treating | 0 (0.0%) | 0 (0.0%) |
| Health Technologists | 0 (0.0%) | 0 (0.0%) |
| Total (Category) | 14 (23.7%) | 45 (76.3%) |
| Total (Overall) | 79 (48.5%) | 84 (51.5%) |
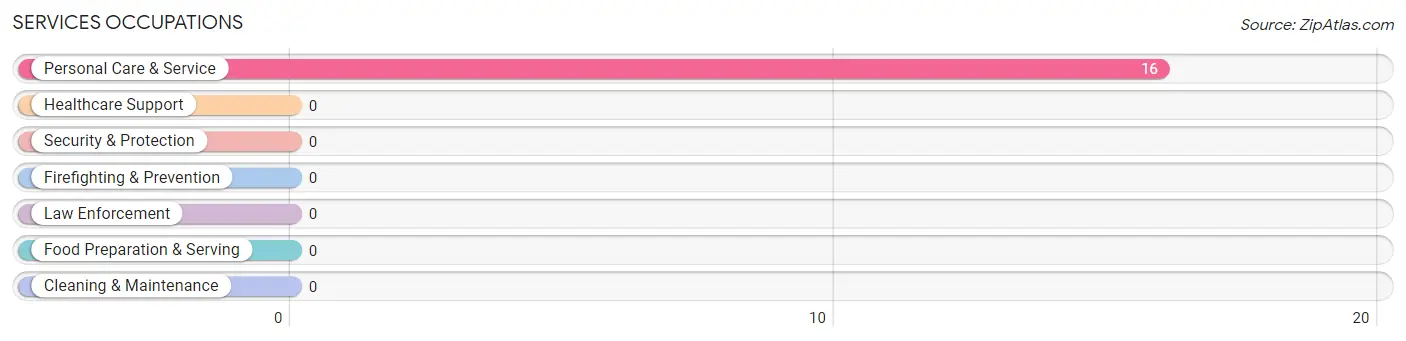
Services Occupations
The most common Services occupations in Eureka are , and Personal Care & Service (16 | 9.8%).
Services Occupations by Sex
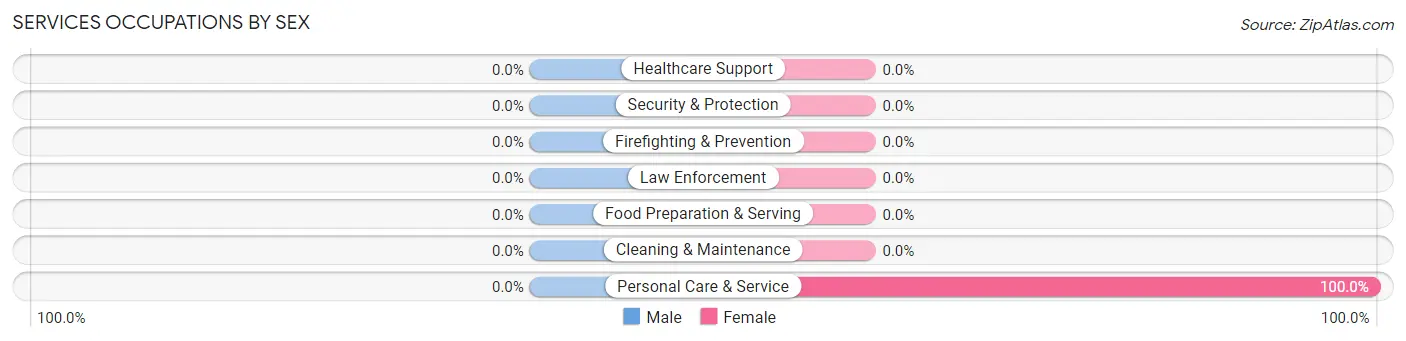
| Occupation | Male | Female |
| Healthcare Support | 0 (0.0%) | 0 (0.0%) |
| Security & Protection | 0 (0.0%) | 0 (0.0%) |
| Firefighting & Prevention | 0 (0.0%) | 0 (0.0%) |
| Law Enforcement | 0 (0.0%) | 0 (0.0%) |
| Food Preparation & Serving | 0 (0.0%) | 0 (0.0%) |
| Cleaning & Maintenance | 0 (0.0%) | 0 (0.0%) |
| Personal Care & Service | 0 (0.0%) | 16 (100.0%) |
| Total (Category) | 0 (0.0%) | 16 (100.0%) |
| Total (Overall) | 79 (48.5%) | 84 (51.5%) |
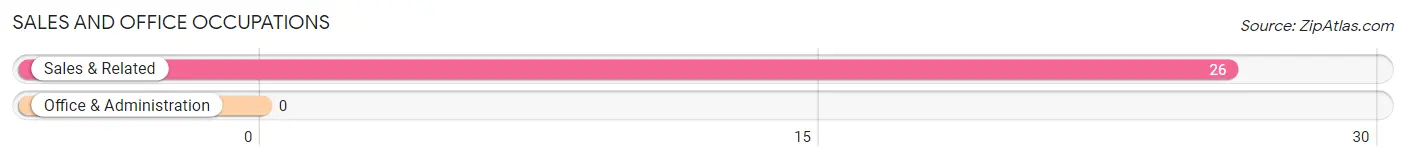
Sales and Office Occupations
The most common Sales and Office occupations in Eureka are , and Sales & Related (26 | 16.0%).
Sales and Office Occupations by Sex
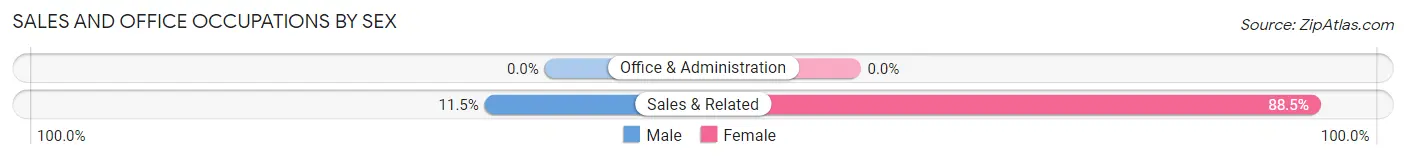
| Occupation | Male | Female |
| Sales & Related | 3 (11.5%) | 23 (88.5%) |
| Office & Administration | 0 (0.0%) | 0 (0.0%) |
| Total (Category) | 3 (11.5%) | 23 (88.5%) |
| Total (Overall) | 79 (48.5%) | 84 (51.5%) |
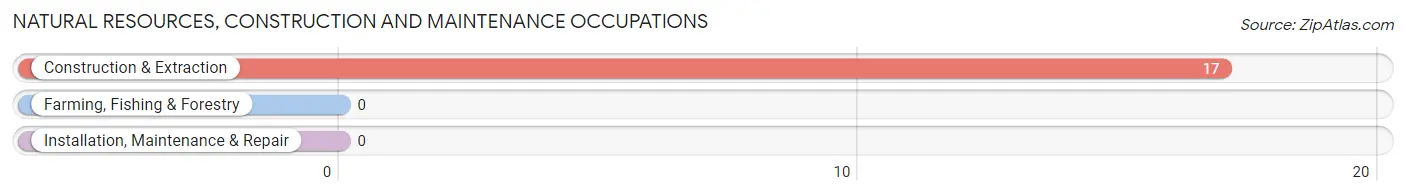
Natural Resources, Construction and Maintenance Occupations
The most common Natural Resources, Construction and Maintenance occupations in Eureka are , and Construction & Extraction (17 | 10.4%).
Natural Resources, Construction and Maintenance Occupations by Sex
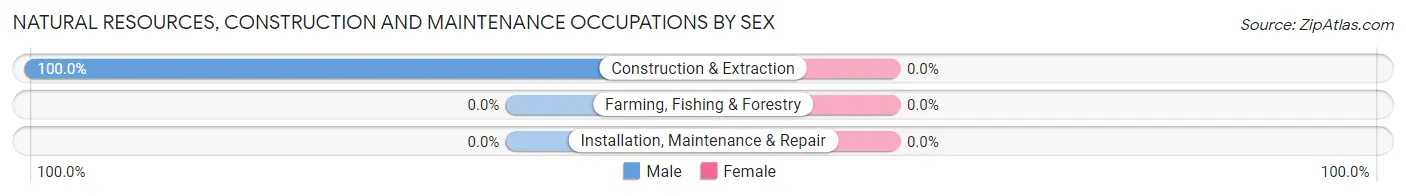
| Occupation | Male | Female |
| Farming, Fishing & Forestry | 0 (0.0%) | 0 (0.0%) |
| Construction & Extraction | 17 (100.0%) | 0 (0.0%) |
| Installation, Maintenance & Repair | 0 (0.0%) | 0 (0.0%) |
| Total (Category) | 17 (100.0%) | 0 (0.0%) |
| Total (Overall) | 79 (48.5%) | 84 (51.5%) |
Production, Transportation and Moving Occupations
The most common Production, Transportation and Moving occupations in Eureka are Transportation (23 | 14.1%), and Production (22 | 13.5%).
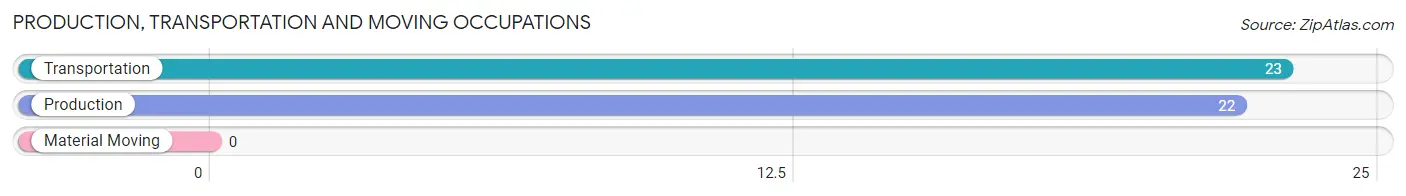
Production, Transportation and Moving Occupations by Sex
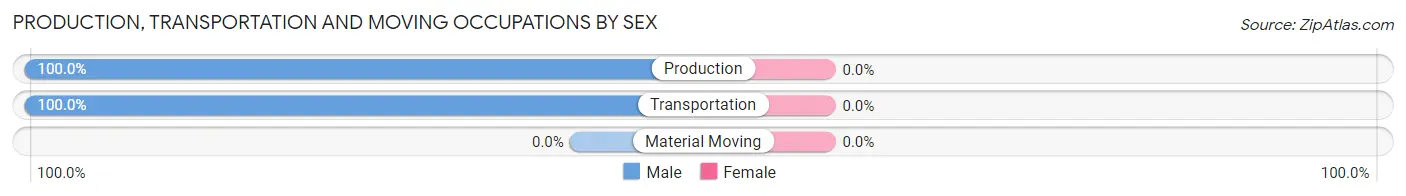
| Occupation | Male | Female |
| Production | 22 (100.0%) | 0 (0.0%) |
| Transportation | 23 (100.0%) | 0 (0.0%) |
| Material Moving | 0 (0.0%) | 0 (0.0%) |
| Total (Category) | 45 (100.0%) | 0 (0.0%) |
| Total (Overall) | 79 (48.5%) | 84 (51.5%) |
Employment Industries by Sex in Eureka
Employment Industries in Eureka
The major employment industries in Eureka include Educational Services (36 | 22.1%), Mining, Quarrying, & Extraction (31 | 19.0%), Construction (23 | 14.1%), Retail Trade (23 | 14.1%), and Agriculture, Fishing & Hunting (22 | 13.5%).
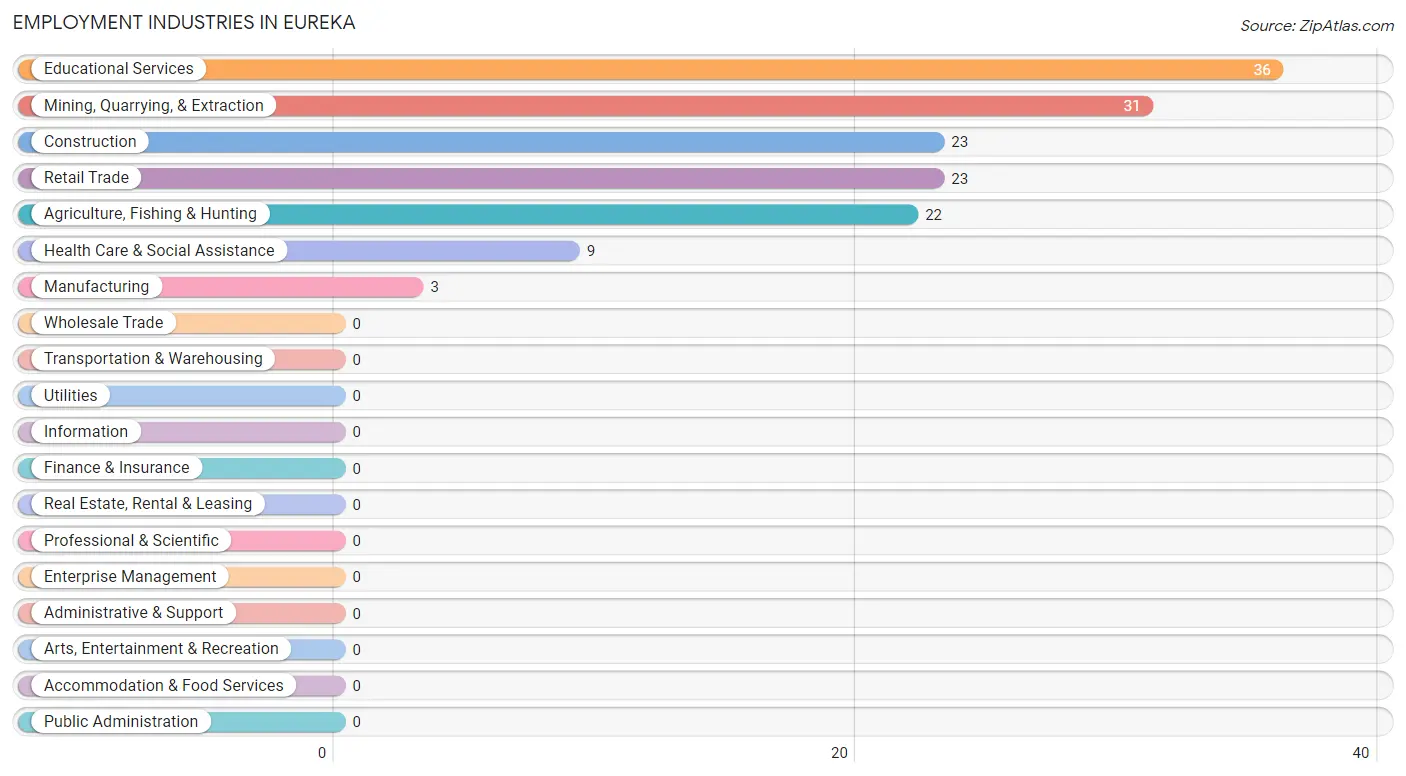
Employment Industries by Sex in Eureka
The Eureka industries that see more men than women are Agriculture, Fishing & Hunting (100.0%), Mining, Quarrying, & Extraction (100.0%), and Construction (100.0%), whereas the industries that tend to have a higher number of women are Retail Trade (100.0%), Educational Services (100.0%), and Health Care & Social Assistance (100.0%).
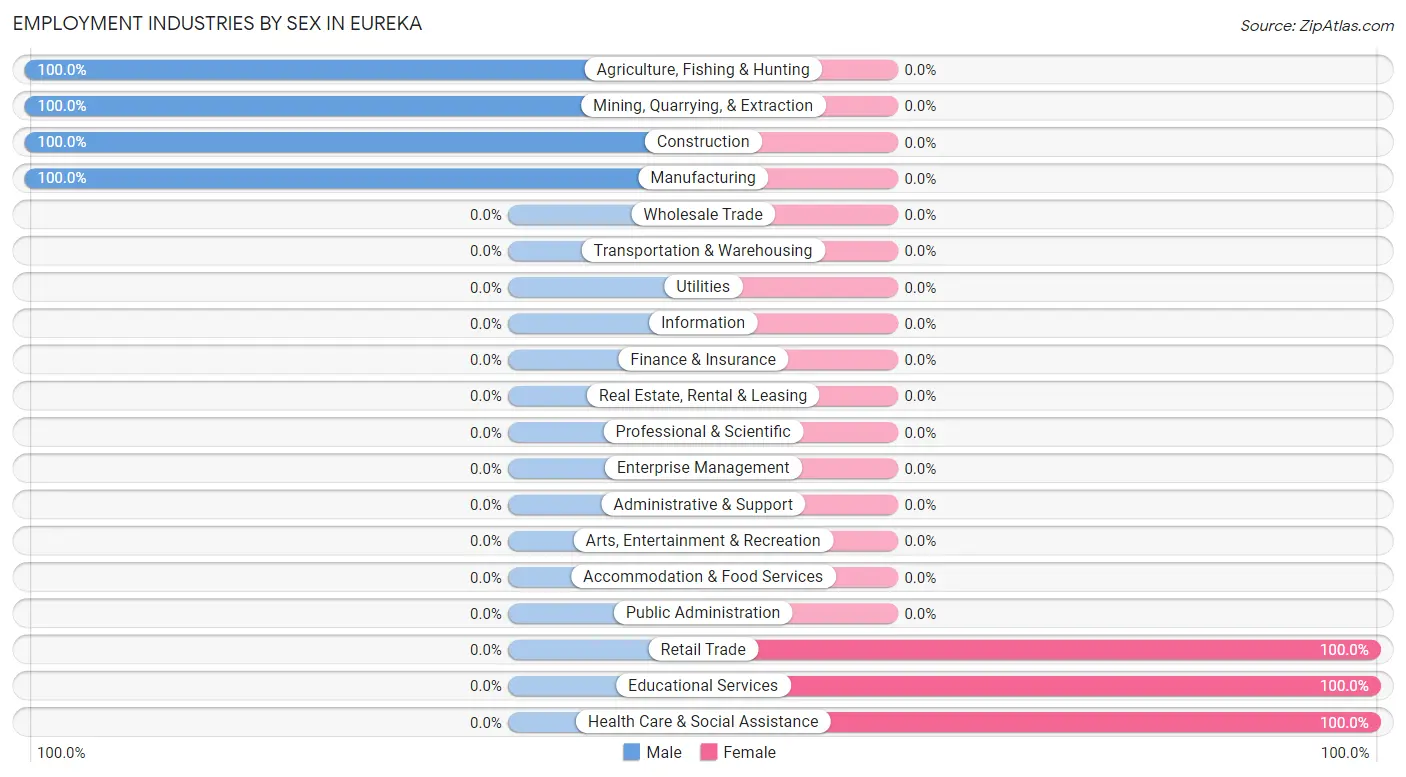
| Industry | Male | Female |
| Agriculture, Fishing & Hunting | 22 (100.0%) | 0 (0.0%) |
| Mining, Quarrying, & Extraction | 31 (100.0%) | 0 (0.0%) |
| Construction | 23 (100.0%) | 0 (0.0%) |
| Manufacturing | 3 (100.0%) | 0 (0.0%) |
| Wholesale Trade | 0 (0.0%) | 0 (0.0%) |
| Retail Trade | 0 (0.0%) | 23 (100.0%) |
| Transportation & Warehousing | 0 (0.0%) | 0 (0.0%) |
| Utilities | 0 (0.0%) | 0 (0.0%) |
| Information | 0 (0.0%) | 0 (0.0%) |
| Finance & Insurance | 0 (0.0%) | 0 (0.0%) |
| Real Estate, Rental & Leasing | 0 (0.0%) | 0 (0.0%) |
| Professional & Scientific | 0 (0.0%) | 0 (0.0%) |
| Enterprise Management | 0 (0.0%) | 0 (0.0%) |
| Administrative & Support | 0 (0.0%) | 0 (0.0%) |
| Educational Services | 0 (0.0%) | 36 (100.0%) |
| Health Care & Social Assistance | 0 (0.0%) | 9 (100.0%) |
| Arts, Entertainment & Recreation | 0 (0.0%) | 0 (0.0%) |
| Accommodation & Food Services | 0 (0.0%) | 0 (0.0%) |
| Public Administration | 0 (0.0%) | 0 (0.0%) |
| Total | 79 (48.5%) | 84 (51.5%) |
Education in Eureka
School Enrollment in Eureka
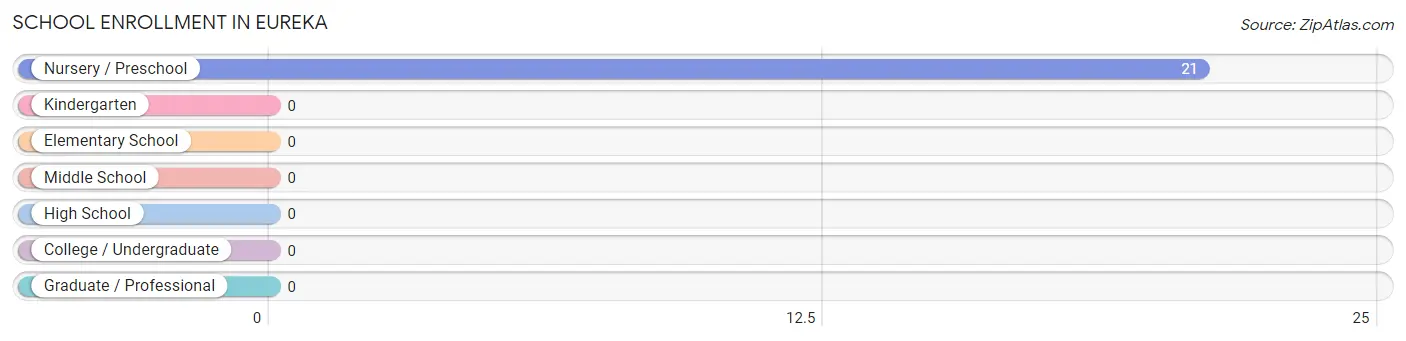
| School Level | # Students | % Students |
| Nursery / Preschool | 21 | 100.0% |
| Kindergarten | 0 | 0.0% |
| Elementary School | 0 | 0.0% |
| Middle School | 0 | 0.0% |
| High School | 0 | 0.0% |
| College / Undergraduate | 0 | 0.0% |
| Graduate / Professional | 0 | 0.0% |
| Total | 21 | 100.0% |
School Enrollment by Age by Funding Source in Eureka
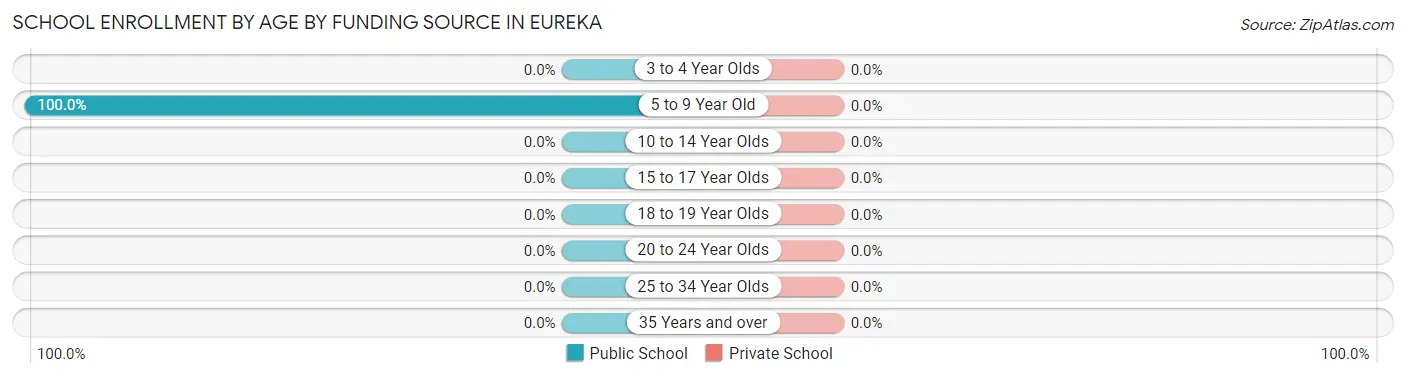
| Age Bracket | Public School | Private School |
| 3 to 4 Year Olds | 0 (0.0%) | 0 (0.0%) |
| 5 to 9 Year Old | 21 (100.0%) | 0 (0.0%) |
| 10 to 14 Year Olds | 0 (0.0%) | 0 (0.0%) |
| 15 to 17 Year Olds | 0 (0.0%) | 0 (0.0%) |
| 18 to 19 Year Olds | 0 (0.0%) | 0 (0.0%) |
| 20 to 24 Year Olds | 0 (0.0%) | 0 (0.0%) |
| 25 to 34 Year Olds | 0 (0.0%) | 0 (0.0%) |
| 35 Years and over | 0 (0.0%) | 0 (0.0%) |
| Total | 21 (100.0%) | 0 (0.0%) |
Educational Attainment by Field of Study in Eureka
Business (9 | 42.9%), education (9 | 42.9%), and engineering (3 | 14.3%) are the most common fields of study among 21 individuals in Eureka who have obtained a bachelor's degree or higher.
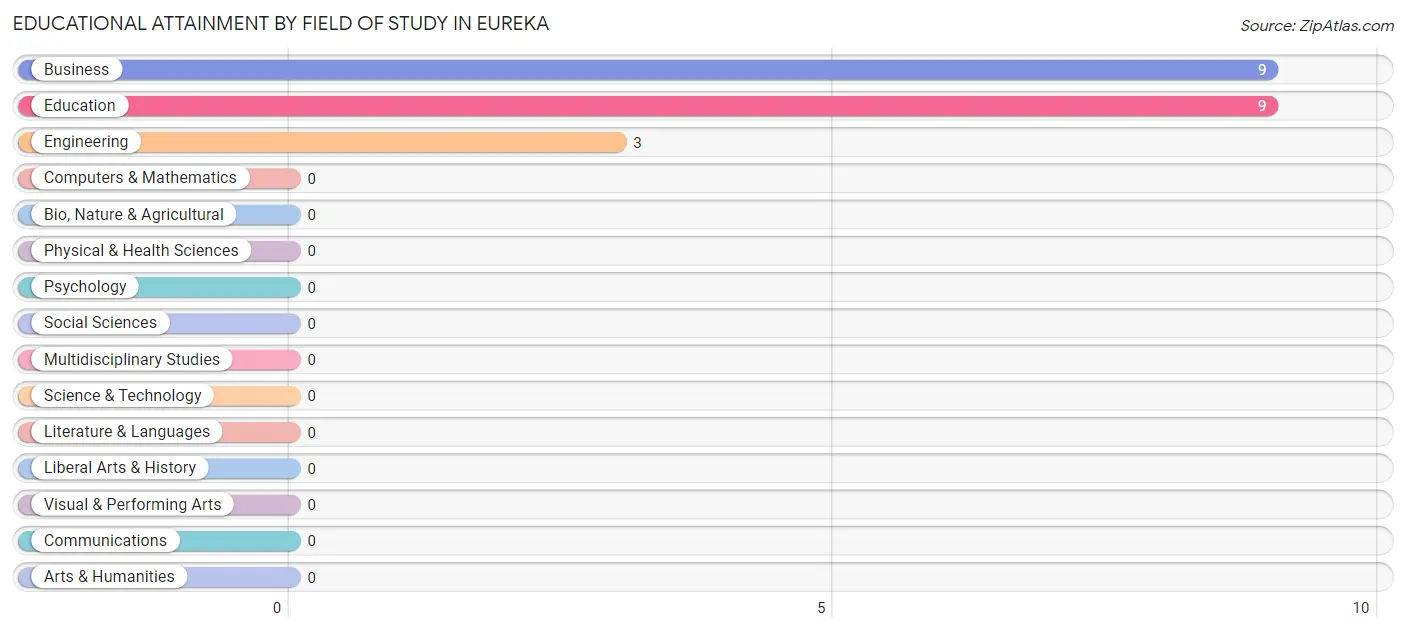
| Field of Study | # Graduates | % Graduates |
| Computers & Mathematics | 0 | 0.0% |
| Bio, Nature & Agricultural | 0 | 0.0% |
| Physical & Health Sciences | 0 | 0.0% |
| Psychology | 0 | 0.0% |
| Social Sciences | 0 | 0.0% |
| Engineering | 3 | 14.3% |
| Multidisciplinary Studies | 0 | 0.0% |
| Science & Technology | 0 | 0.0% |
| Business | 9 | 42.9% |
| Education | 9 | 42.9% |
| Literature & Languages | 0 | 0.0% |
| Liberal Arts & History | 0 | 0.0% |
| Visual & Performing Arts | 0 | 0.0% |
| Communications | 0 | 0.0% |
| Arts & Humanities | 0 | 0.0% |
| Total | 21 | 100.0% |
Transportation & Commute in Eureka
Vehicle Availability by Sex in Eureka
The most prevalent vehicle ownership categories in Eureka are males with 3 vehicles (53, accounting for 67.1%) and females with 3 vehicles (66, making up 63.1%).
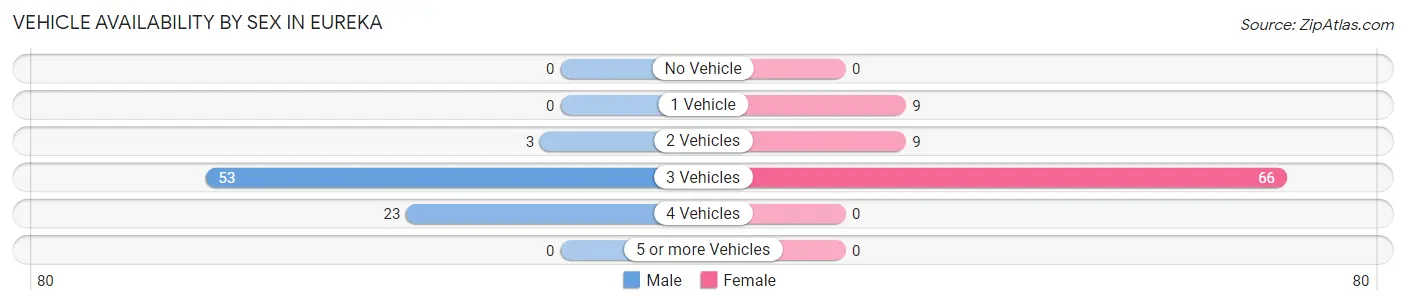
| Vehicles Available | Male | Female |
| No Vehicle | 0 (0.0%) | 0 (0.0%) |
| 1 Vehicle | 0 (0.0%) | 9 (10.7%) |
| 2 Vehicles | 3 (3.8%) | 9 (10.7%) |
| 3 Vehicles | 53 (67.1%) | 66 (78.6%) |
| 4 Vehicles | 23 (29.1%) | 0 (0.0%) |
| 5 or more Vehicles | 0 (0.0%) | 0 (0.0%) |
| Total | 79 (100.0%) | 84 (100.0%) |
Commute Time in Eureka
The most frequently occuring commute durations in Eureka are 5 to 9 minutes (52 commuters, 35.4%), 30 to 34 minutes (37 commuters, 25.2%), and less than 5 minutes (27 commuters, 18.4%).
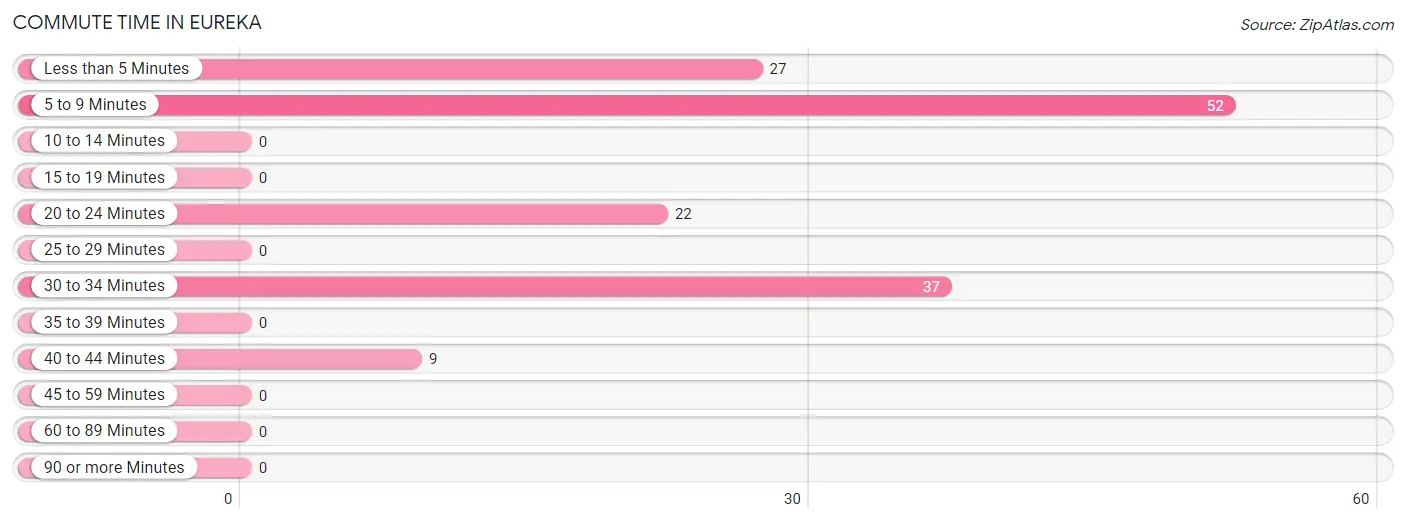
| Commute Time | # Commuters | % Commuters |
| Less than 5 Minutes | 27 | 18.4% |
| 5 to 9 Minutes | 52 | 35.4% |
| 10 to 14 Minutes | 0 | 0.0% |
| 15 to 19 Minutes | 0 | 0.0% |
| 20 to 24 Minutes | 22 | 15.0% |
| 25 to 29 Minutes | 0 | 0.0% |
| 30 to 34 Minutes | 37 | 25.2% |
| 35 to 39 Minutes | 0 | 0.0% |
| 40 to 44 Minutes | 9 | 6.1% |
| 45 to 59 Minutes | 0 | 0.0% |
| 60 to 89 Minutes | 0 | 0.0% |
| 90 or more Minutes | 0 | 0.0% |
Commute Time by Sex in Eureka
The most common commute times in Eureka are 30 to 34 minutes (37 commuters, 46.8%) for males and 5 to 9 minutes (32 commuters, 47.1%) for females.
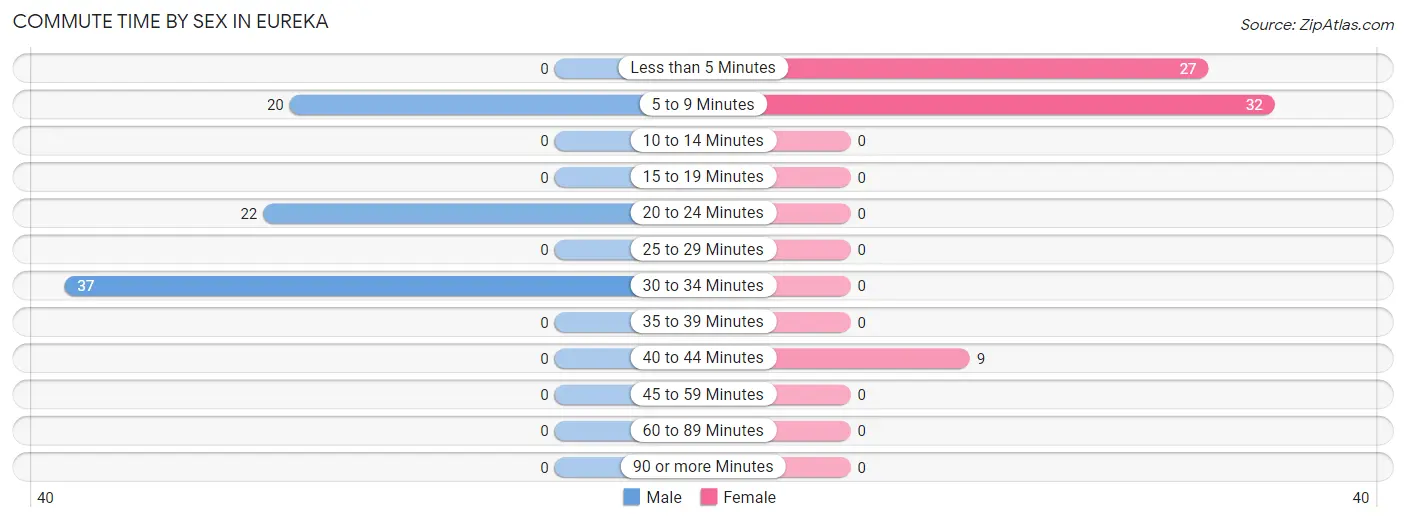
| Commute Time | Male | Female |
| Less than 5 Minutes | 0 (0.0%) | 27 (39.7%) |
| 5 to 9 Minutes | 20 (25.3%) | 32 (47.1%) |
| 10 to 14 Minutes | 0 (0.0%) | 0 (0.0%) |
| 15 to 19 Minutes | 0 (0.0%) | 0 (0.0%) |
| 20 to 24 Minutes | 22 (27.9%) | 0 (0.0%) |
| 25 to 29 Minutes | 0 (0.0%) | 0 (0.0%) |
| 30 to 34 Minutes | 37 (46.8%) | 0 (0.0%) |
| 35 to 39 Minutes | 0 (0.0%) | 0 (0.0%) |
| 40 to 44 Minutes | 0 (0.0%) | 9 (13.2%) |
| 45 to 59 Minutes | 0 (0.0%) | 0 (0.0%) |
| 60 to 89 Minutes | 0 (0.0%) | 0 (0.0%) |
| 90 or more Minutes | 0 (0.0%) | 0 (0.0%) |
Time of Departure to Work by Sex in Eureka
The most frequent times of departure to work in Eureka are 12:00 AM to 4:59 AM (31, 39.2%) for males and 7:00 AM to 7:29 AM (36, 52.9%) for females.
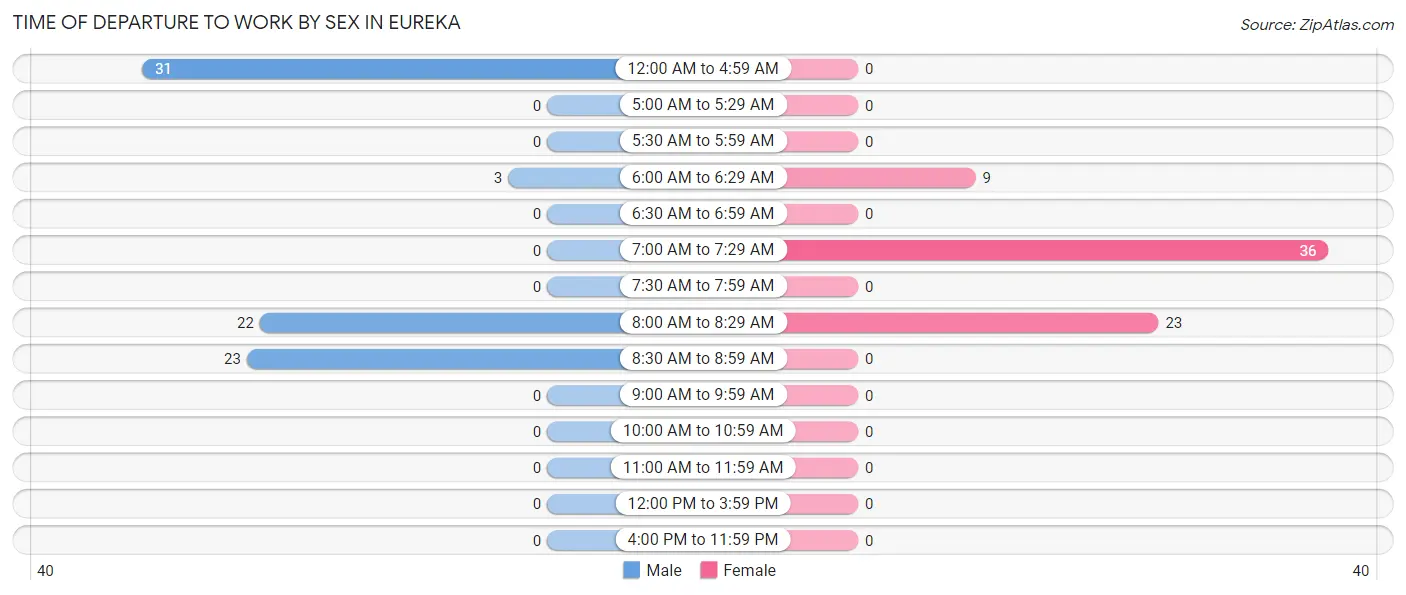
| Time of Departure | Male | Female |
| 12:00 AM to 4:59 AM | 31 (39.2%) | 0 (0.0%) |
| 5:00 AM to 5:29 AM | 0 (0.0%) | 0 (0.0%) |
| 5:30 AM to 5:59 AM | 0 (0.0%) | 0 (0.0%) |
| 6:00 AM to 6:29 AM | 3 (3.8%) | 9 (13.2%) |
| 6:30 AM to 6:59 AM | 0 (0.0%) | 0 (0.0%) |
| 7:00 AM to 7:29 AM | 0 (0.0%) | 36 (52.9%) |
| 7:30 AM to 7:59 AM | 0 (0.0%) | 0 (0.0%) |
| 8:00 AM to 8:29 AM | 22 (27.9%) | 23 (33.8%) |
| 8:30 AM to 8:59 AM | 23 (29.1%) | 0 (0.0%) |
| 9:00 AM to 9:59 AM | 0 (0.0%) | 0 (0.0%) |
| 10:00 AM to 10:59 AM | 0 (0.0%) | 0 (0.0%) |
| 11:00 AM to 11:59 AM | 0 (0.0%) | 0 (0.0%) |
| 12:00 PM to 3:59 PM | 0 (0.0%) | 0 (0.0%) |
| 4:00 PM to 11:59 PM | 0 (0.0%) | 0 (0.0%) |
| Total | 79 (100.0%) | 68 (100.0%) |
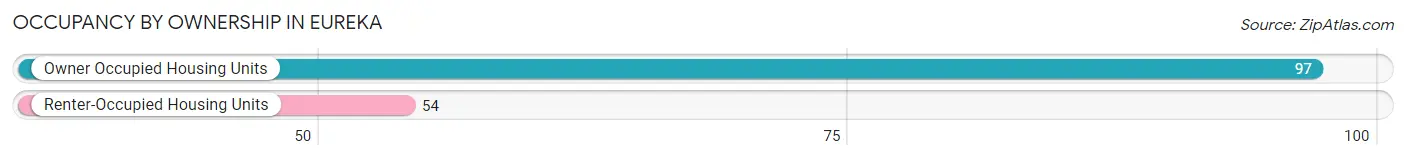
Housing Occupancy in Eureka
Occupancy by Ownership in Eureka
Of the total 151 dwellings in Eureka, owner-occupied units account for 97 (64.2%), while renter-occupied units make up 54 (35.8%).
| Occupancy | # Housing Units | % Housing Units |
| Owner Occupied Housing Units | 97 | 64.2% |
| Renter-Occupied Housing Units | 54 | 35.8% |
| Total Occupied Housing Units | 151 | 100.0% |
Occupancy by Household Size in Eureka
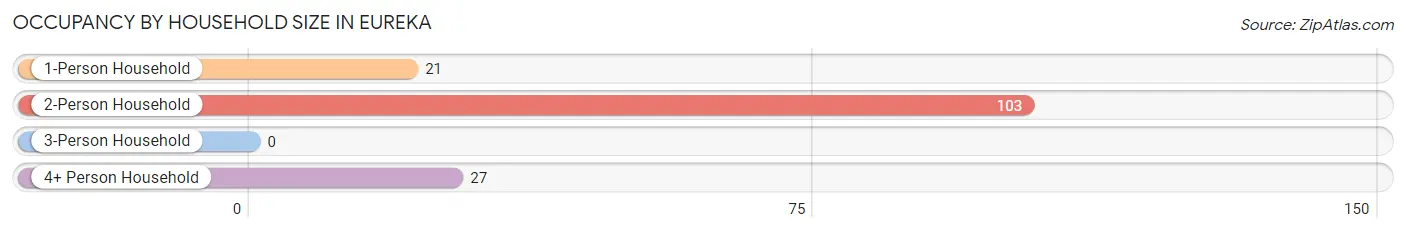
| Household Size | # Housing Units | % Housing Units |
| 1-Person Household | 21 | 13.9% |
| 2-Person Household | 103 | 68.2% |
| 3-Person Household | 0 | 0.0% |
| 4+ Person Household | 27 | 17.9% |
| Total Housing Units | 151 | 100.0% |
Occupancy by Ownership by Household Size in Eureka
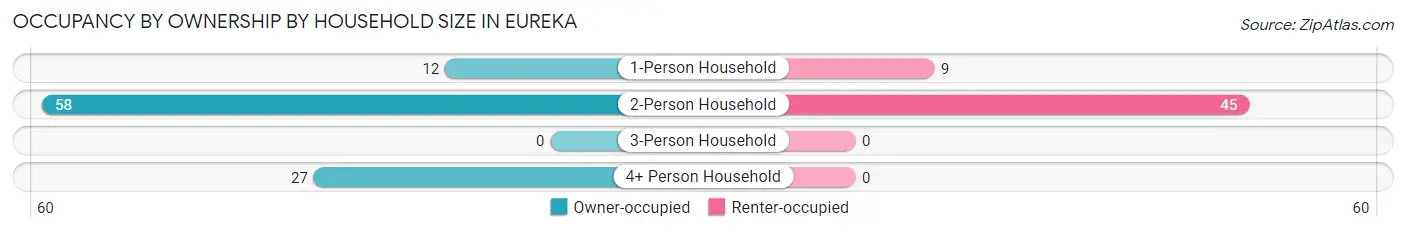
| Household Size | Owner-occupied | Renter-occupied |
| 1-Person Household | 12 (57.1%) | 9 (42.9%) |
| 2-Person Household | 58 (56.3%) | 45 (43.7%) |
| 3-Person Household | 0 (0.0%) | 0 (0.0%) |
| 4+ Person Household | 27 (100.0%) | 0 (0.0%) |
| Total Housing Units | 97 (64.2%) | 54 (35.8%) |
Occupancy by Educational Attainment in Eureka
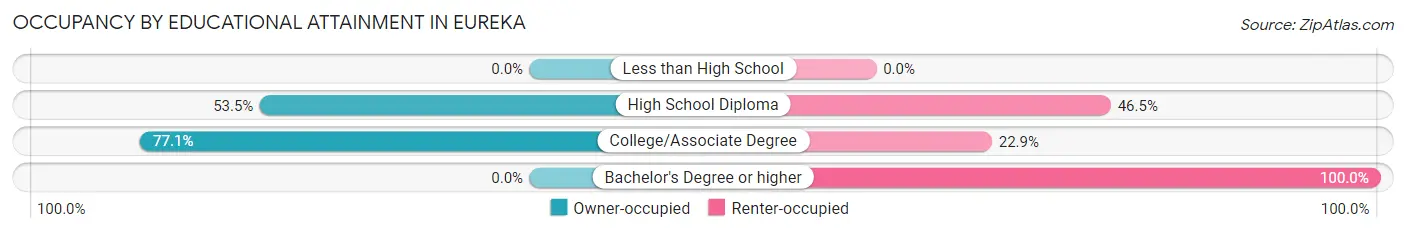
| Household Size | Owner-occupied | Renter-occupied |
| Less than High School | 0 (0.0%) | 0 (0.0%) |
| High School Diploma | 23 (53.5%) | 20 (46.5%) |
| College/Associate Degree | 74 (77.1%) | 22 (22.9%) |
| Bachelor's Degree or higher | 0 (0.0%) | 12 (100.0%) |
Occupancy by Age of Householder in Eureka
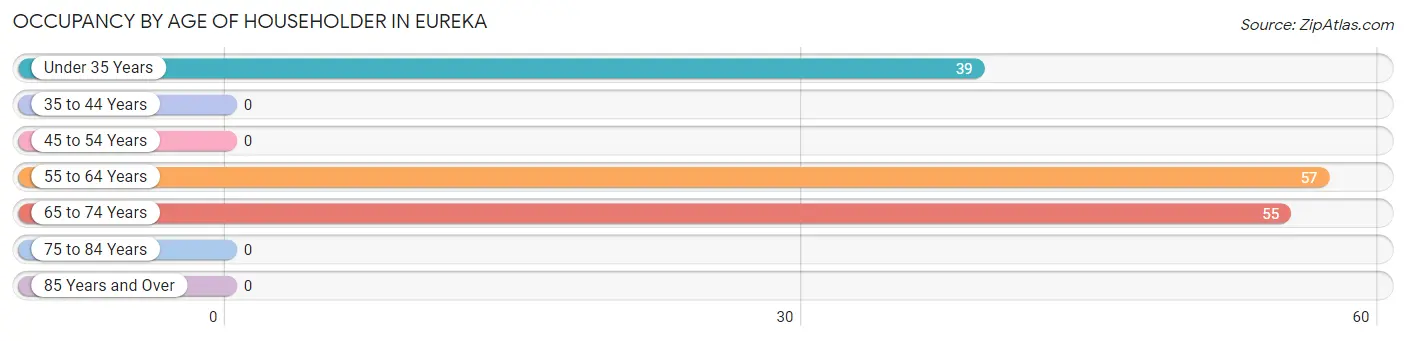
| Age Bracket | # Households | % Households |
| Under 35 Years | 39 | 25.8% |
| 35 to 44 Years | 0 | 0.0% |
| 45 to 54 Years | 0 | 0.0% |
| 55 to 64 Years | 57 | 37.8% |
| 65 to 74 Years | 55 | 36.4% |
| 75 to 84 Years | 0 | 0.0% |
| 85 Years and Over | 0 | 0.0% |
| Total | 151 | 100.0% |
Housing Finances in Eureka
Median Income by Occupancy in Eureka
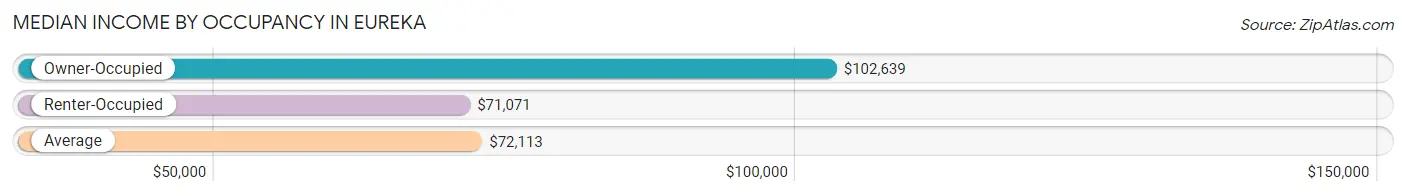
| Occupancy Type | # Households | Median Income |
| Owner-Occupied | 97 (64.2%) | $102,639 |
| Renter-Occupied | 54 (35.8%) | $71,071 |
| Average | 151 (100.0%) | $72,113 |
Occupancy by Householder Income Bracket in Eureka
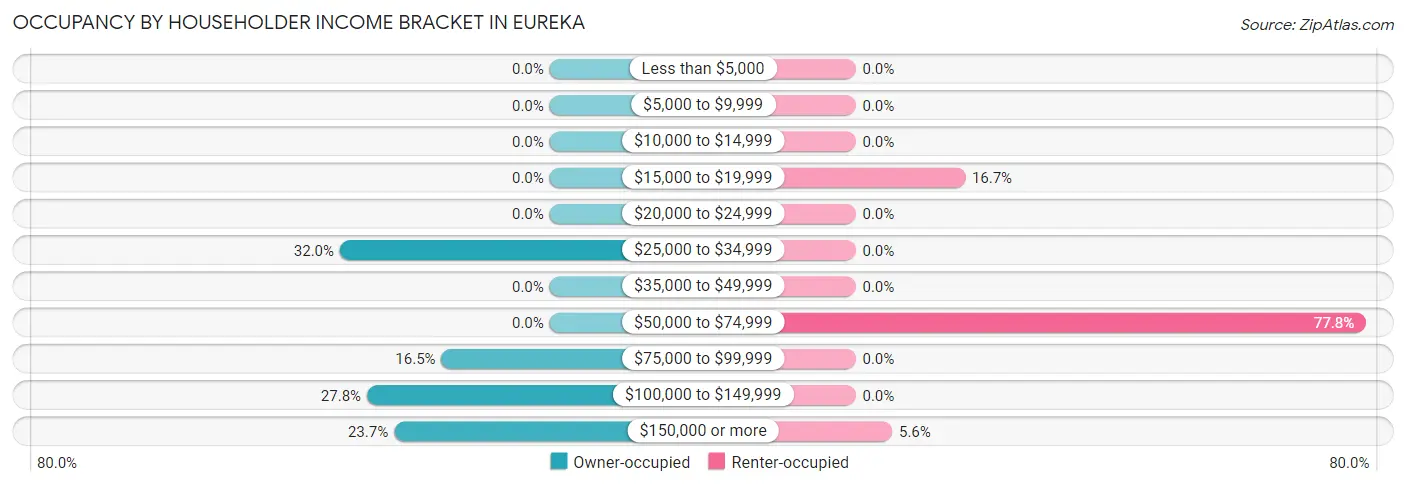
| Income Bracket | Owner-occupied | Renter-occupied |
| Less than $5,000 | 0 (0.0%) | 0 (0.0%) |
| $5,000 to $9,999 | 0 (0.0%) | 0 (0.0%) |
| $10,000 to $14,999 | 0 (0.0%) | 0 (0.0%) |
| $15,000 to $19,999 | 0 (0.0%) | 9 (16.7%) |
| $20,000 to $24,999 | 0 (0.0%) | 0 (0.0%) |
| $25,000 to $34,999 | 31 (32.0%) | 0 (0.0%) |
| $35,000 to $49,999 | 0 (0.0%) | 0 (0.0%) |
| $50,000 to $74,999 | 0 (0.0%) | 42 (77.8%) |
| $75,000 to $99,999 | 16 (16.5%) | 0 (0.0%) |
| $100,000 to $149,999 | 27 (27.8%) | 0 (0.0%) |
| $150,000 or more | 23 (23.7%) | 3 (5.6%) |
| Total | 97 (100.0%) | 54 (100.0%) |
Monthly Housing Cost Tiers in Eureka
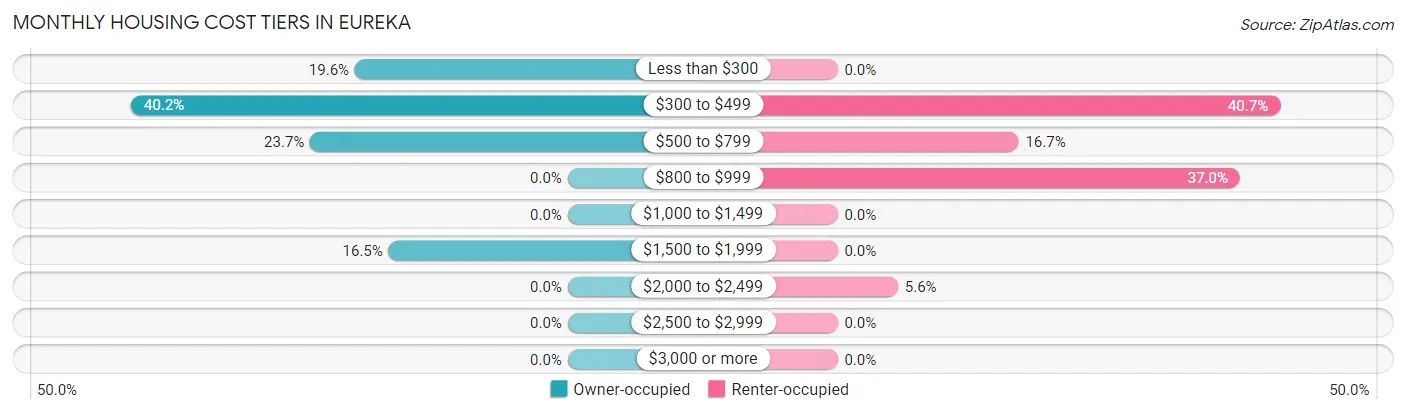
| Monthly Cost | Owner-occupied | Renter-occupied |
| Less than $300 | 19 (19.6%) | 0 (0.0%) |
| $300 to $499 | 39 (40.2%) | 22 (40.7%) |
| $500 to $799 | 23 (23.7%) | 9 (16.7%) |
| $800 to $999 | 0 (0.0%) | 20 (37.0%) |
| $1,000 to $1,499 | 0 (0.0%) | 0 (0.0%) |
| $1,500 to $1,999 | 16 (16.5%) | 0 (0.0%) |
| $2,000 to $2,499 | 0 (0.0%) | 3 (5.6%) |
| $2,500 to $2,999 | 0 (0.0%) | 0 (0.0%) |
| $3,000 or more | 0 (0.0%) | 0 (0.0%) |
| Total | 97 (100.0%) | 54 (100.0%) |
Physical Housing Characteristics in Eureka
Housing Structures in Eureka
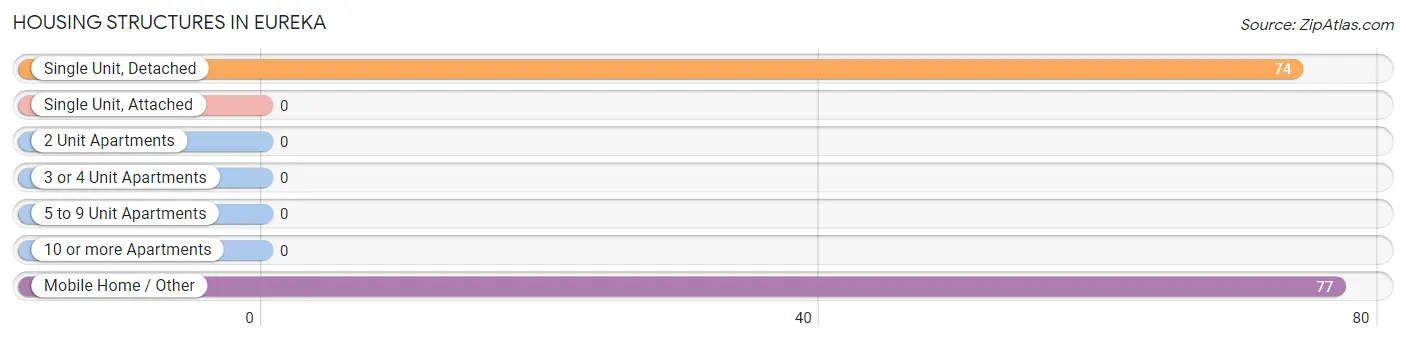
| Structure Type | # Housing Units | % Housing Units |
| Single Unit, Detached | 74 | 49.0% |
| Single Unit, Attached | 0 | 0.0% |
| 2 Unit Apartments | 0 | 0.0% |
| 3 or 4 Unit Apartments | 0 | 0.0% |
| 5 to 9 Unit Apartments | 0 | 0.0% |
| 10 or more Apartments | 0 | 0.0% |
| Mobile Home / Other | 77 | 51.0% |
| Total | 151 | 100.0% |
Housing Structures by Occupancy in Eureka
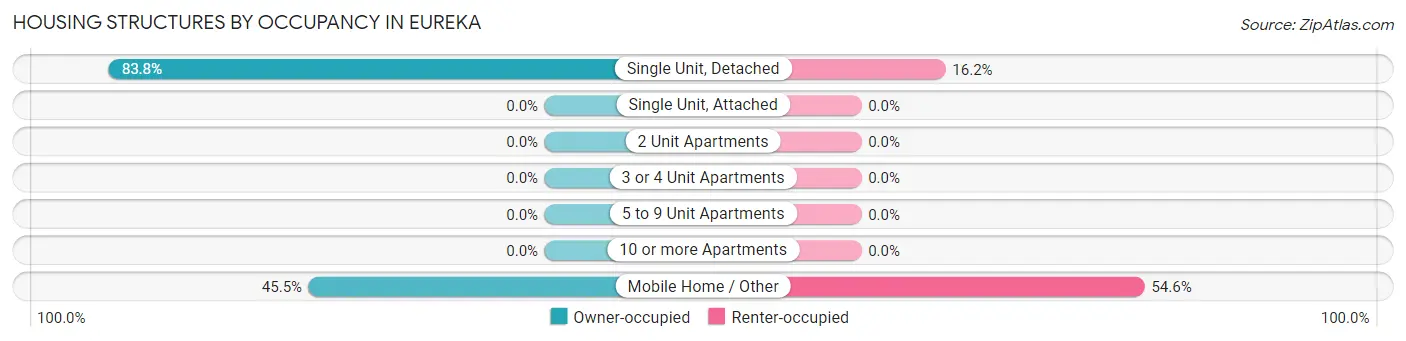
| Structure Type | Owner-occupied | Renter-occupied |
| Single Unit, Detached | 62 (83.8%) | 12 (16.2%) |
| Single Unit, Attached | 0 (0.0%) | 0 (0.0%) |
| 2 Unit Apartments | 0 (0.0%) | 0 (0.0%) |
| 3 or 4 Unit Apartments | 0 (0.0%) | 0 (0.0%) |
| 5 to 9 Unit Apartments | 0 (0.0%) | 0 (0.0%) |
| 10 or more Apartments | 0 (0.0%) | 0 (0.0%) |
| Mobile Home / Other | 35 (45.5%) | 42 (54.5%) |
| Total | 97 (64.2%) | 54 (35.8%) |
Housing Structures by Number of Rooms in Eureka
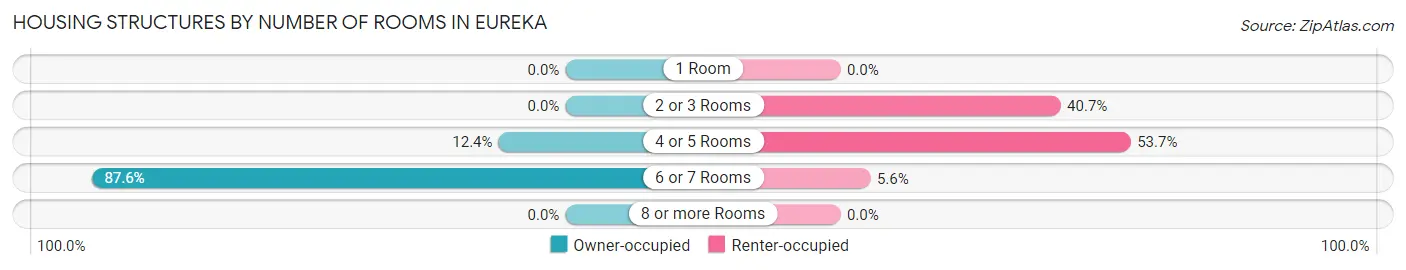
| Number of Rooms | Owner-occupied | Renter-occupied |
| 1 Room | 0 (0.0%) | 0 (0.0%) |
| 2 or 3 Rooms | 0 (0.0%) | 22 (40.7%) |
| 4 or 5 Rooms | 12 (12.4%) | 29 (53.7%) |
| 6 or 7 Rooms | 85 (87.6%) | 3 (5.6%) |
| 8 or more Rooms | 0 (0.0%) | 0 (0.0%) |
| Total | 97 (100.0%) | 54 (100.0%) |
Housing Structure by Heating Type in Eureka
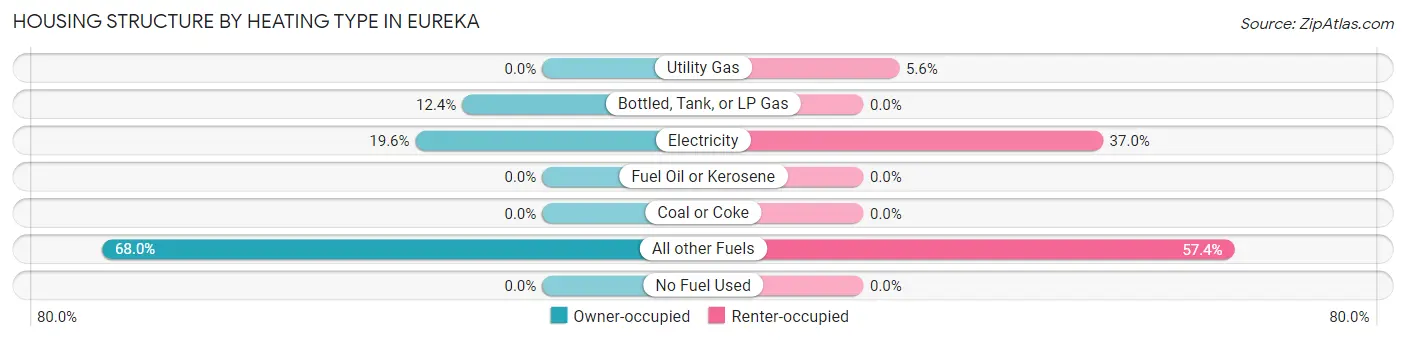
| Heating Type | Owner-occupied | Renter-occupied |
| Utility Gas | 0 (0.0%) | 3 (5.6%) |
| Bottled, Tank, or LP Gas | 12 (12.4%) | 0 (0.0%) |
| Electricity | 19 (19.6%) | 20 (37.0%) |
| Fuel Oil or Kerosene | 0 (0.0%) | 0 (0.0%) |
| Coal or Coke | 0 (0.0%) | 0 (0.0%) |
| All other Fuels | 66 (68.0%) | 31 (57.4%) |
| No Fuel Used | 0 (0.0%) | 0 (0.0%) |
| Total | 97 (100.0%) | 54 (100.0%) |
Household Vehicle Usage in Eureka
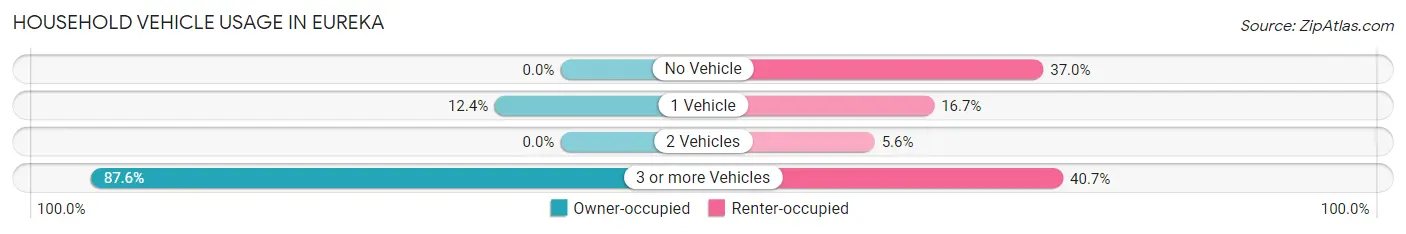
| Vehicles per Household | Owner-occupied | Renter-occupied |
| No Vehicle | 0 (0.0%) | 20 (37.0%) |
| 1 Vehicle | 12 (12.4%) | 9 (16.7%) |
| 2 Vehicles | 0 (0.0%) | 3 (5.6%) |
| 3 or more Vehicles | 85 (87.6%) | 22 (40.7%) |
| Total | 97 (100.0%) | 54 (100.0%) |
Real Estate & Mortgages in Eureka
Real Estate and Mortgage Overview in Eureka
| Characteristic | Without Mortgage | With Mortgage |
| Housing Units | 81 | 16 |
| Median Property Value | $282,400 | $0 |
| Median Household Income | $103,380 | $0 |
| Monthly Housing Costs | $455 | $0 |
| Real Estate Taxes | - | - |
Property Value by Mortgage Status in Eureka
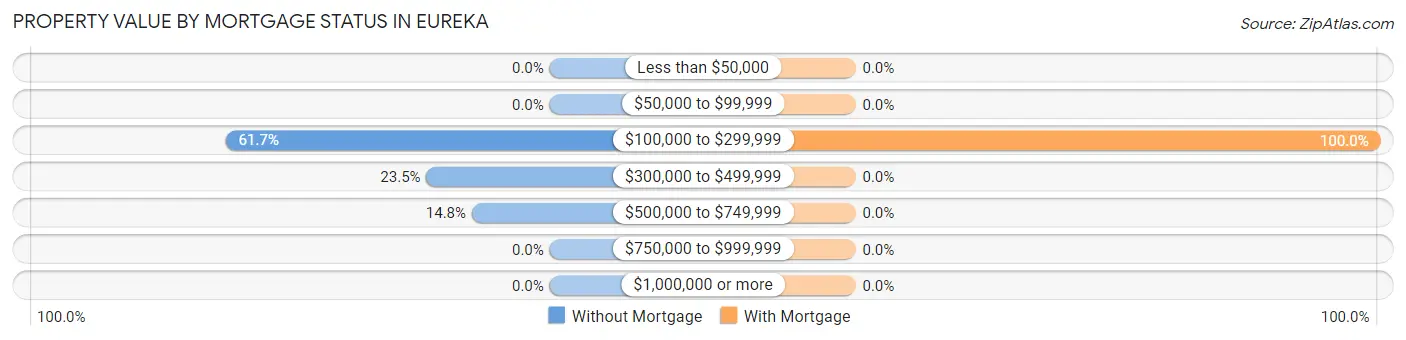
| Property Value | Without Mortgage | With Mortgage |
| Less than $50,000 | 0 (0.0%) | 0 (0.0%) |
| $50,000 to $99,999 | 0 (0.0%) | 0 (0.0%) |
| $100,000 to $299,999 | 50 (61.7%) | 16 (100.0%) |
| $300,000 to $499,999 | 19 (23.5%) | 0 (0.0%) |
| $500,000 to $749,999 | 12 (14.8%) | 0 (0.0%) |
| $750,000 to $999,999 | 0 (0.0%) | 0 (0.0%) |
| $1,000,000 or more | 0 (0.0%) | 0 (0.0%) |
| Total | 81 (100.0%) | 16 (100.0%) |
Household Income by Mortgage Status in Eureka
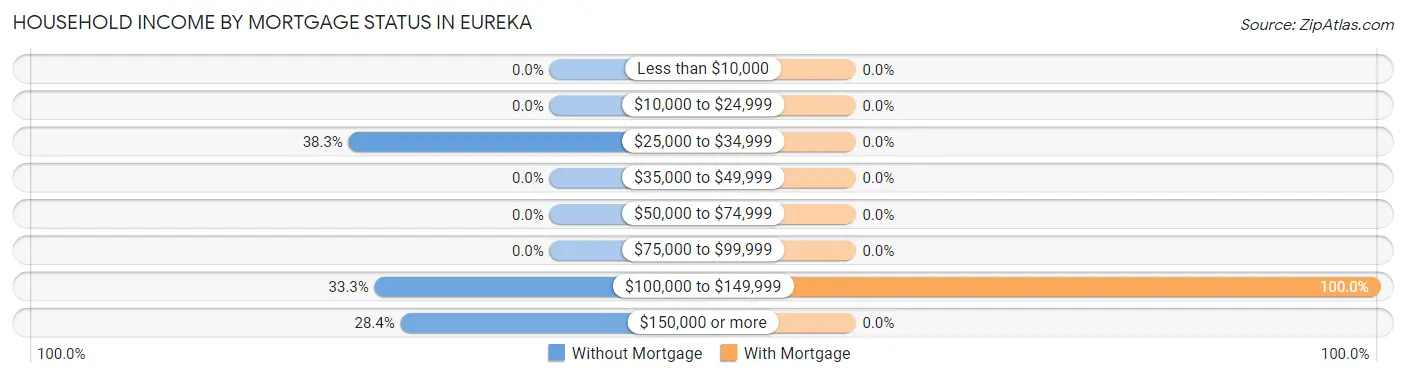
| Household Income | Without Mortgage | With Mortgage |
| Less than $10,000 | 0 (0.0%) | 0 (0.0%) |
| $10,000 to $24,999 | 0 (0.0%) | 0 (0.0%) |
| $25,000 to $34,999 | 31 (38.3%) | 0 (0.0%) |
| $35,000 to $49,999 | 0 (0.0%) | 0 (0.0%) |
| $50,000 to $74,999 | 0 (0.0%) | 0 (0.0%) |
| $75,000 to $99,999 | 0 (0.0%) | 0 (0.0%) |
| $100,000 to $149,999 | 27 (33.3%) | 16 (100.0%) |
| $150,000 or more | 23 (28.4%) | 0 (0.0%) |
| Total | 81 (100.0%) | 16 (100.0%) |
Property Value to Household Income Ratio in Eureka
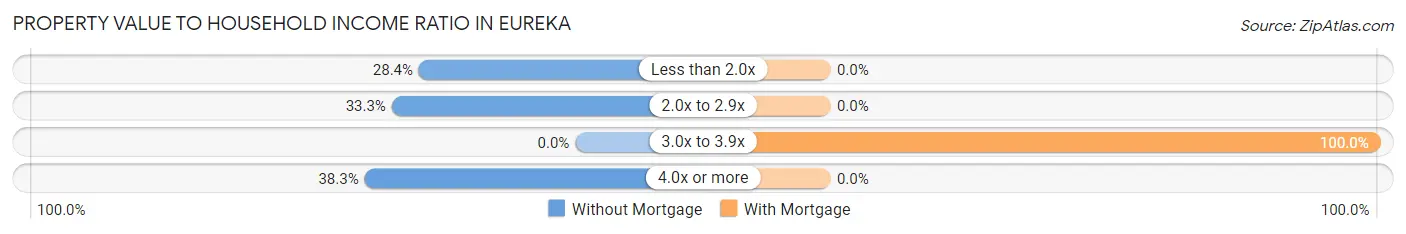
| Value-to-Income Ratio | Without Mortgage | With Mortgage |
| Less than 2.0x | 23 (28.4%) | 0 (0.0%) |
| 2.0x to 2.9x | 27 (33.3%) | 0 (0.0%) |
| 3.0x to 3.9x | 0 (0.0%) | 16 (100.0%) |
| 4.0x or more | 31 (38.3%) | 0 (0.0%) |
| Total | 81 (100.0%) | 16 (100.0%) |
Real Estate Taxes by Mortgage Status in Eureka
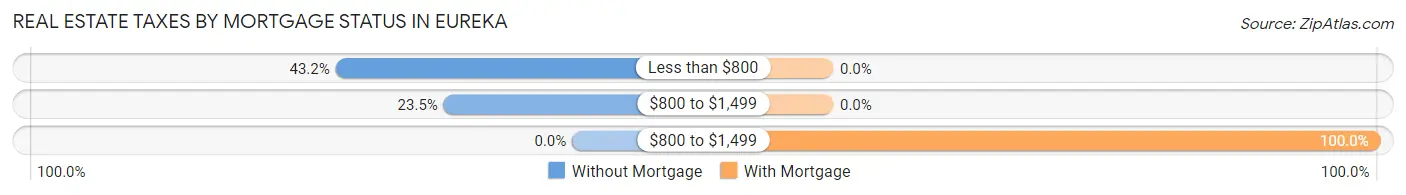
| Property Taxes | Without Mortgage | With Mortgage |
| Less than $800 | 35 (43.2%) | 0 (0.0%) |
| $800 to $1,499 | 19 (23.5%) | 0 (0.0%) |
| $800 to $1,499 | 0 (0.0%) | 16 (100.0%) |
| Total | 81 (100.0%) | 16 (100.0%) |
Health & Disability in Eureka
Health Insurance Coverage by Age in Eureka
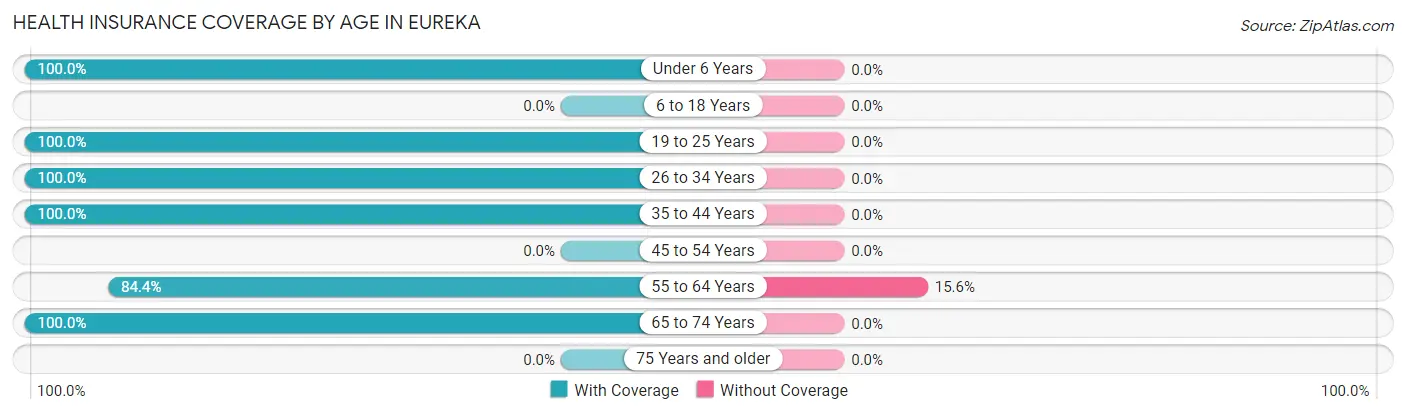
| Age Bracket | With Coverage | Without Coverage |
| Under 6 Years | 37 (100.0%) | 0 (0.0%) |
| 6 to 18 Years | 0 (0.0%) | 0 (0.0%) |
| 19 to 25 Years | 36 (100.0%) | 0 (0.0%) |
| 26 to 34 Years | 20 (100.0%) | 0 (0.0%) |
| 35 to 44 Years | 9 (100.0%) | 0 (0.0%) |
| 45 to 54 Years | 0 (0.0%) | 0 (0.0%) |
| 55 to 64 Years | 103 (84.4%) | 19 (15.6%) |
| 65 to 74 Years | 85 (100.0%) | 0 (0.0%) |
| 75 Years and older | 0 (0.0%) | 0 (0.0%) |
| Total | 290 (93.9%) | 19 (6.1%) |
Health Insurance Coverage by Citizenship Status in Eureka
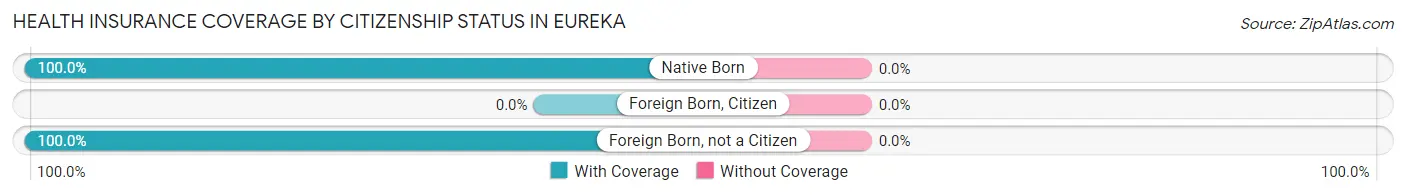
| Citizenship Status | With Coverage | Without Coverage |
| Native Born | 37 (100.0%) | 0 (0.0%) |
| Foreign Born, Citizen | 0 (0.0%) | 0 (0.0%) |
| Foreign Born, not a Citizen | 36 (100.0%) | 0 (0.0%) |
Health Insurance Coverage by Household Income in Eureka
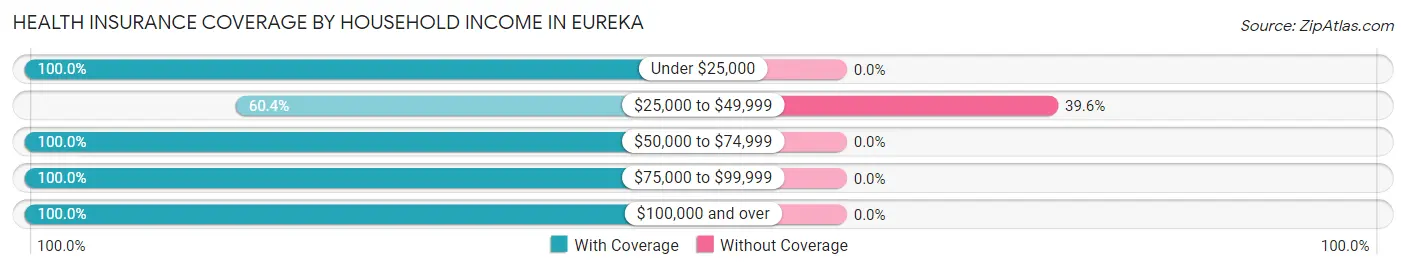
| Household Income | With Coverage | Without Coverage |
| Under $25,000 | 9 (100.0%) | 0 (0.0%) |
| $25,000 to $49,999 | 29 (60.4%) | 19 (39.6%) |
| $50,000 to $74,999 | 81 (100.0%) | 0 (0.0%) |
| $75,000 to $99,999 | 30 (100.0%) | 0 (0.0%) |
| $100,000 and over | 141 (100.0%) | 0 (0.0%) |
Public vs Private Health Insurance Coverage by Age in Eureka
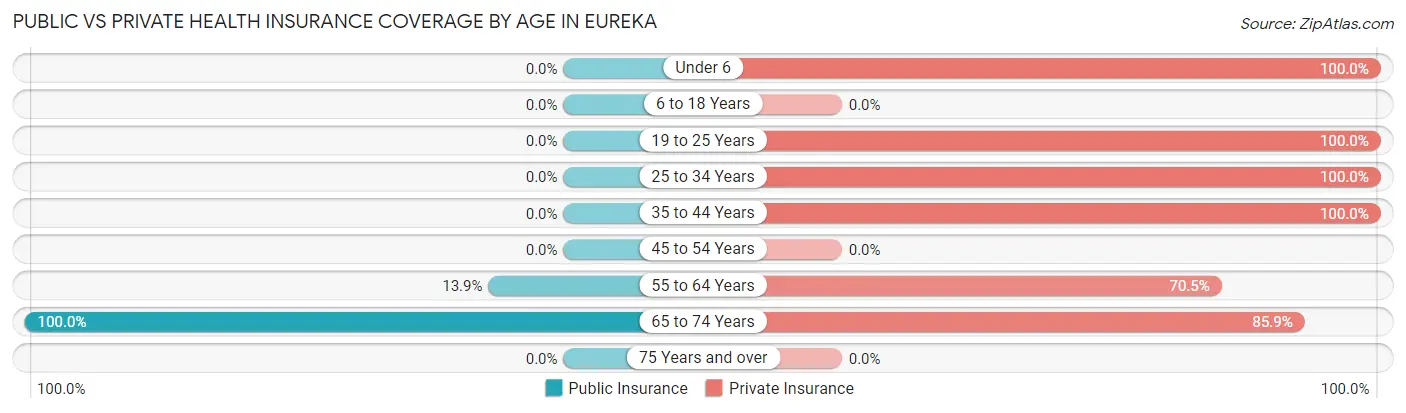
| Age Bracket | Public Insurance | Private Insurance |
| Under 6 | 0 (0.0%) | 37 (100.0%) |
| 6 to 18 Years | 0 (0.0%) | 0 (0.0%) |
| 19 to 25 Years | 0 (0.0%) | 36 (100.0%) |
| 25 to 34 Years | 0 (0.0%) | 20 (100.0%) |
| 35 to 44 Years | 0 (0.0%) | 9 (100.0%) |
| 45 to 54 Years | 0 (0.0%) | 0 (0.0%) |
| 55 to 64 Years | 17 (13.9%) | 86 (70.5%) |
| 65 to 74 Years | 85 (100.0%) | 73 (85.9%) |
| 75 Years and over | 0 (0.0%) | 0 (0.0%) |
| Total | 102 (33.0%) | 261 (84.5%) |
Disability Status by Sex by Age in Eureka
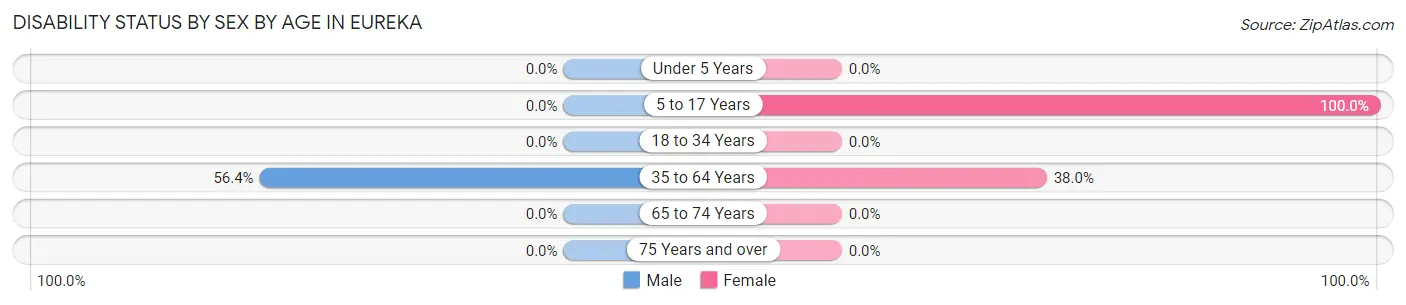
| Age Bracket | Male | Female |
| Under 5 Years | 0 (0.0%) | 0 (0.0%) |
| 5 to 17 Years | 0 (0.0%) | 21 (100.0%) |
| 18 to 34 Years | 0 (0.0%) | 0 (0.0%) |
| 35 to 64 Years | 22 (56.4%) | 35 (38.0%) |
| 65 to 74 Years | 0 (0.0%) | 0 (0.0%) |
| 75 Years and over | 0 (0.0%) | 0 (0.0%) |
Disability Class by Sex by Age in Eureka
Disability Class: Hearing Difficulty
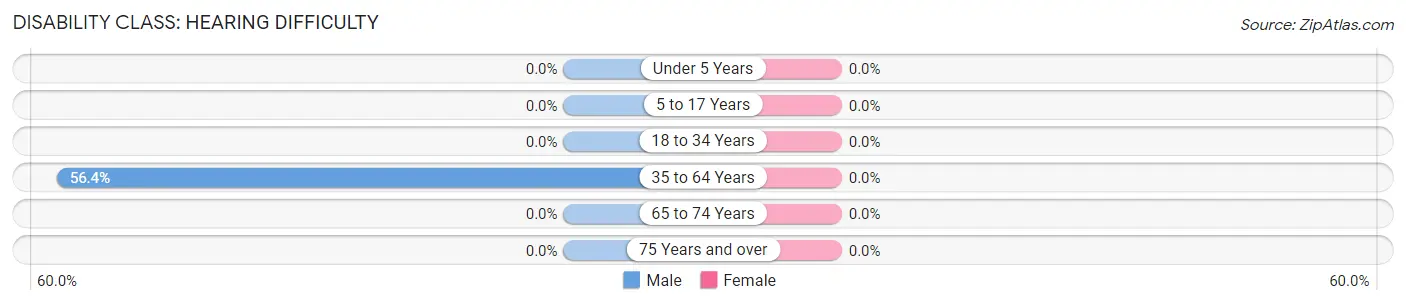
| Age Bracket | Male | Female |
| Under 5 Years | 0 (0.0%) | 0 (0.0%) |
| 5 to 17 Years | 0 (0.0%) | 0 (0.0%) |
| 18 to 34 Years | 0 (0.0%) | 0 (0.0%) |
| 35 to 64 Years | 22 (56.4%) | 0 (0.0%) |
| 65 to 74 Years | 0 (0.0%) | 0 (0.0%) |
| 75 Years and over | 0 (0.0%) | 0 (0.0%) |
Disability Class: Vision Difficulty
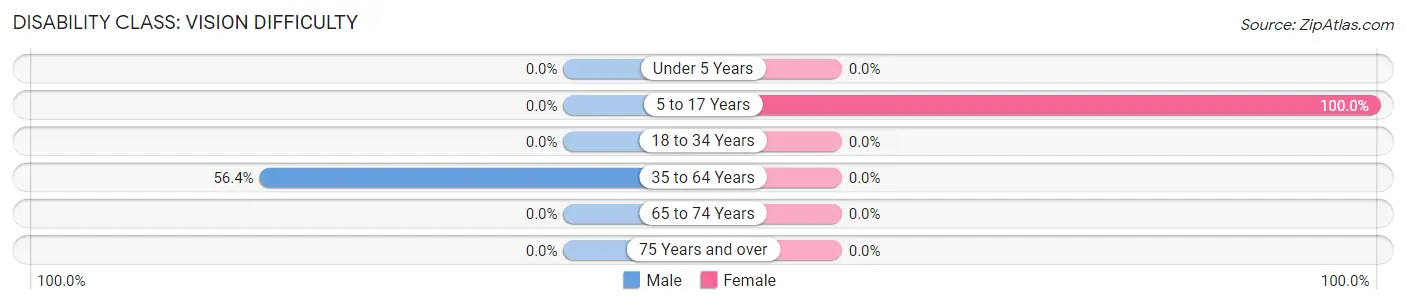
| Age Bracket | Male | Female |
| Under 5 Years | 0 (0.0%) | 0 (0.0%) |
| 5 to 17 Years | 0 (0.0%) | 21 (100.0%) |
| 18 to 34 Years | 0 (0.0%) | 0 (0.0%) |
| 35 to 64 Years | 22 (56.4%) | 0 (0.0%) |
| 65 to 74 Years | 0 (0.0%) | 0 (0.0%) |
| 75 Years and over | 0 (0.0%) | 0 (0.0%) |
Disability Class: Cognitive Difficulty
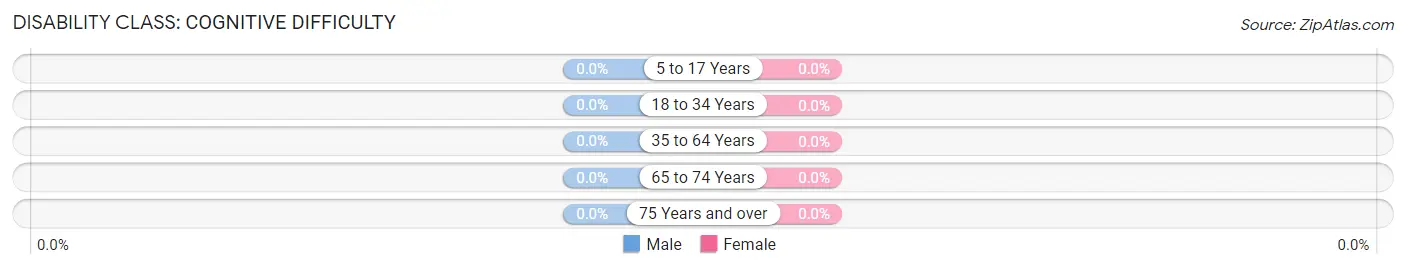
| Age Bracket | Male | Female |
| 5 to 17 Years | 0 (0.0%) | 0 (0.0%) |
| 18 to 34 Years | 0 (0.0%) | 0 (0.0%) |
| 35 to 64 Years | 0 (0.0%) | 0 (0.0%) |
| 65 to 74 Years | 0 (0.0%) | 0 (0.0%) |
| 75 Years and over | 0 (0.0%) | 0 (0.0%) |
Disability Class: Ambulatory Difficulty
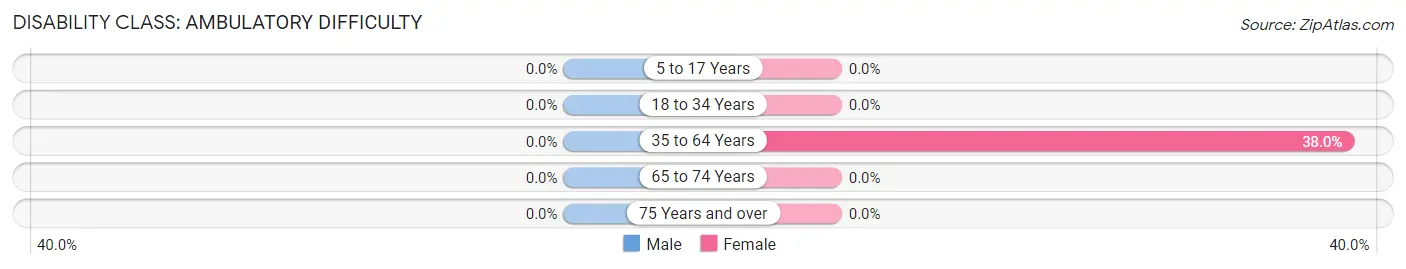
| Age Bracket | Male | Female |
| 5 to 17 Years | 0 (0.0%) | 0 (0.0%) |
| 18 to 34 Years | 0 (0.0%) | 0 (0.0%) |
| 35 to 64 Years | 0 (0.0%) | 35 (38.0%) |
| 65 to 74 Years | 0 (0.0%) | 0 (0.0%) |
| 75 Years and over | 0 (0.0%) | 0 (0.0%) |
Disability Class: Self-Care Difficulty
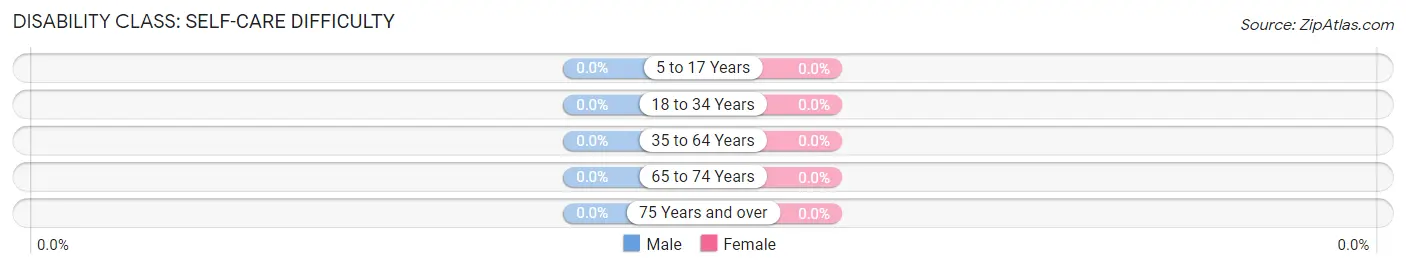
| Age Bracket | Male | Female |
| 5 to 17 Years | 0 (0.0%) | 0 (0.0%) |
| 18 to 34 Years | 0 (0.0%) | 0 (0.0%) |
| 35 to 64 Years | 0 (0.0%) | 0 (0.0%) |
| 65 to 74 Years | 0 (0.0%) | 0 (0.0%) |
| 75 Years and over | 0 (0.0%) | 0 (0.0%) |
Technology Access in Eureka
Computing Device Access in Eureka
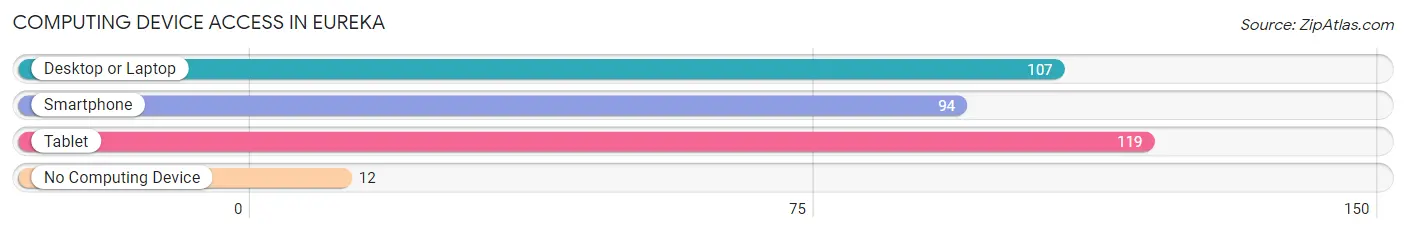
| Device Type | # Households | % Households |
| Desktop or Laptop | 107 | 70.9% |
| Smartphone | 94 | 62.3% |
| Tablet | 119 | 78.8% |
| No Computing Device | 12 | 8.0% |
| Total | 151 | 100.0% |
Internet Access in Eureka
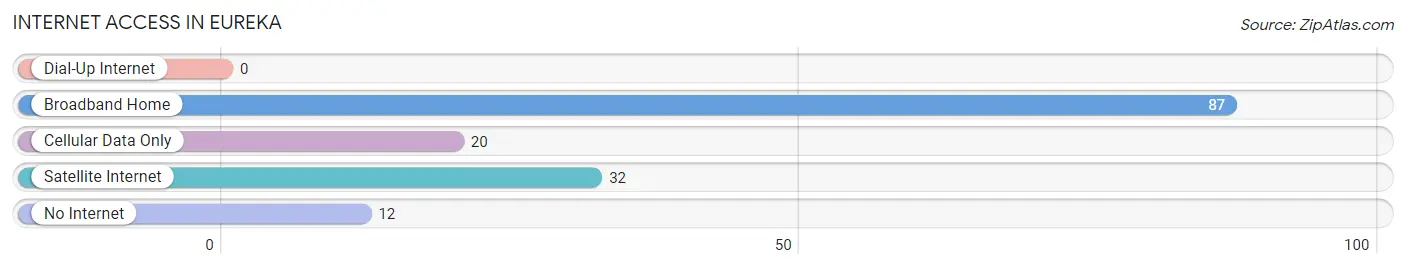
| Internet Type | # Households | % Households |
| Dial-Up Internet | 0 | 0.0% |
| Broadband Home | 87 | 57.6% |
| Cellular Data Only | 20 | 13.3% |
| Satellite Internet | 32 | 21.2% |
| No Internet | 12 | 8.0% |
| Total | 151 | 100.0% |
Eureka Summary
Eureka is a small town located in the state of Nevada, United States. It is the county seat of Eureka County and is located in the northern part of the state, about halfway between Reno and Elko. The town has a population of about 1,000 people and is the largest town in the county.
History
Eureka was founded in 1864 by miners who were searching for silver and gold in the area. The town was named after the Greek word for “discovery”, as the miners believed they had found a great discovery in the area. The town quickly grew and by 1868, it had become the county seat of Eureka County.
In the late 1800s, Eureka was a bustling mining town with a population of over 5,000 people. The town was home to several saloons, hotels, and stores. The town also had a newspaper, a school, and a post office.
In the early 1900s, the mining industry in Eureka began to decline and the population began to decrease. By the 1950s, the population had dropped to just over 1,000 people.
Geography
Eureka is located in the northern part of Nevada, about halfway between Reno and Elko. The town is situated in the Eureka Valley, which is surrounded by the Ruby Mountains to the east and the Toiyabe Range to the west. The town is located at an elevation of 5,945 feet and has a total area of 1.2 square miles.
The climate in Eureka is semi-arid, with hot summers and cold winters. The average high temperature in the summer is around 90 degrees Fahrenheit, while the average low temperature in the winter is around 20 degrees Fahrenheit.
Economy
The economy of Eureka is largely based on tourism and mining. The town is home to several tourist attractions, including the Eureka Opera House, the Eureka County Museum, and the Eureka Valley Railroad. The town is also home to several mining operations, including gold, silver, and copper mines.
The town also has several businesses, including restaurants, hotels, and stores. The town is also home to several small manufacturing companies, including a furniture factory and a woodworking shop.
Demographics
As of the 2010 census, the population of Eureka was 1,018. The racial makeup of the town was 95.3% White, 0.7% African American, 0.3% Native American, 0.2% Asian, 0.1% Pacific Islander, 1.2% from other races, and 2.4% from two or more races. Hispanic or Latino of any race were 4.2% of the population.
The median income for a household in Eureka was $37,500, and the median income for a family was $41,250. The per capita income for the town was $17,845. About 11.2% of families and 14.2% of the population were below the poverty line, including 17.2% of those under age 18 and 8.3% of those age 65 or over.
Common Questions
What is Per Capita Income in Eureka?
Per Capita income in Eureka is $39,158.
What is the Median Family Income in Eureka?
Median Family Income in Eureka is $97,891.
What is the Median Household income in Eureka?
Median Household Income in Eureka is $72,113.
What is Inequality or Gini Index in Eureka?
Inequality or Gini Index in Eureka is 0.31.
What is the Total Population of Eureka?
Total Population of Eureka is 315.
What is the Total Male Population of Eureka?
Total Male Population of Eureka is 134.
What is the Total Female Population of Eureka?
Total Female Population of Eureka is 181.
What is the Ratio of Males per 100 Females in Eureka?
There are 74.03 Males per 100 Females in Eureka.
What is the Ratio of Females per 100 Males in Eureka?
There are 135.07 Females per 100 Males in Eureka.
What is the Median Population Age in Eureka?
Median Population Age in Eureka is 61.6 Years.
What is the Average Family Size in Eureka
Average Family Size in Eureka is 2.2 People.
What is the Average Household Size in Eureka
Average Household Size in Eureka is 2.0 People.
How Large is the Labor Force in Eureka?
There are 163 People in the Labor Forcein in Eureka.
What is the Percentage of People in the Labor Force in Eureka?
58.6% of People are in the Labor Force in Eureka.