Dyer, NV Map & Demographics
Dyer Map
Dyer Overview
$26,022
PER CAPITA INCOME
$70,739
AVG FAMILY INCOME
$39,837
AVG HOUSEHOLD INCOME
0.36
INEQUALITY / GINI INDEX
343
TOTAL POPULATION
180
MALE POPULATION
163
FEMALE POPULATION
110.43
MALES / 100 FEMALES
90.56
FEMALES / 100 MALES
44.8
MEDIAN AGE
3.0
AVG FAMILY SIZE
2.4
AVG HOUSEHOLD SIZE
144
LABOR FORCE [ PEOPLE ]
52.9%
PERCENT IN LABOR FORCE
Dyer Zip Codes
Dyer Area Codes
Income in Dyer
Income Overview in Dyer
Per Capita Income in Dyer is $26,022, while median incomes of families and households are $70,739 and $39,837 respectively.
| Characteristic | Number | Measure |
| Per Capita Income | 343 | $26,022 |
| Median Family Income | 99 | $70,739 |
| Mean Family Income | 99 | $76,430 |
| Median Household Income | 143 | $39,837 |
| Mean Household Income | 143 | $61,194 |
| Income Deficit | 99 | $0 |
| Wage / Income Gap (%) | 343 | 0.00% |
| Wage / Income Gap ($) | 343 | 100.00¢ per $1 |
| Gini / Inequality Index | 343 | 0.36 |
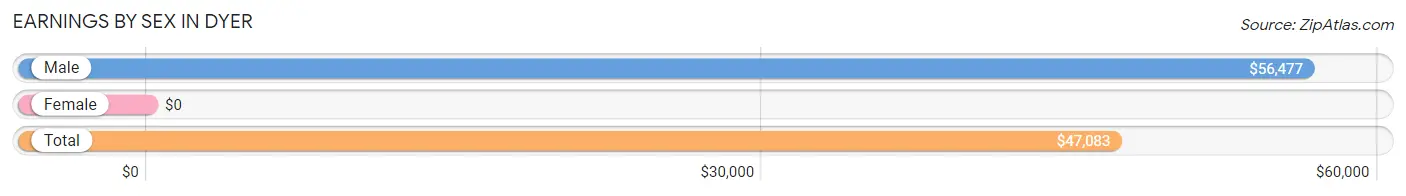
Earnings by Sex in Dyer
| Sex | Number | Average Earnings |
| Male | 90 (62.5%) | $56,477 |
| Female | 54 (37.5%) | $0 |
| Total | 144 (100.0%) | $47,083 |
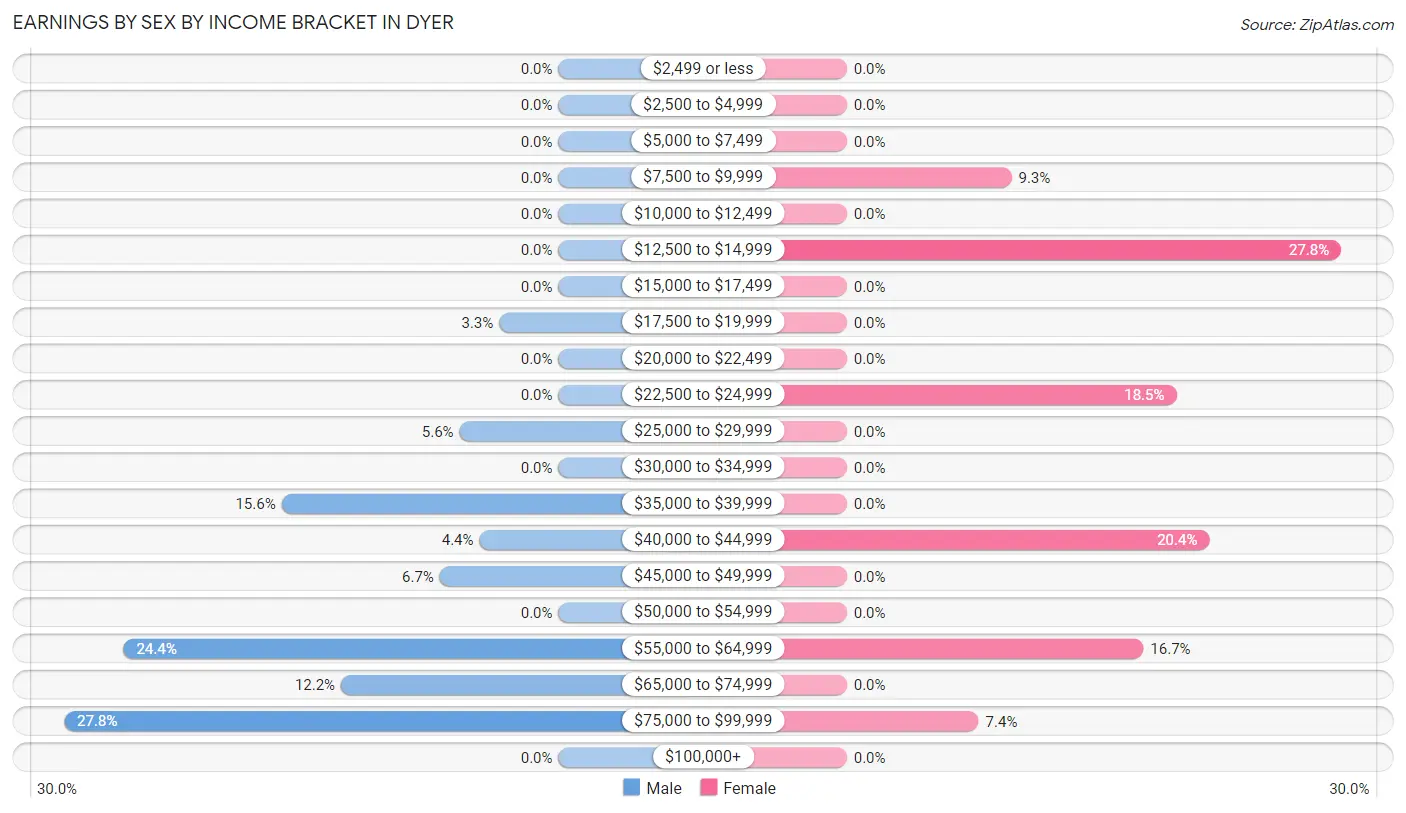
Earnings by Sex by Income Bracket in Dyer
The most common earnings brackets in Dyer are $75,000 to $99,999 for men (25 | 27.8%) and $12,500 to $14,999 for women (15 | 27.8%).
| Income | Male | Female |
| $2,499 or less | 0 (0.0%) | 0 (0.0%) |
| $2,500 to $4,999 | 0 (0.0%) | 0 (0.0%) |
| $5,000 to $7,499 | 0 (0.0%) | 0 (0.0%) |
| $7,500 to $9,999 | 0 (0.0%) | 5 (9.3%) |
| $10,000 to $12,499 | 0 (0.0%) | 0 (0.0%) |
| $12,500 to $14,999 | 0 (0.0%) | 15 (27.8%) |
| $15,000 to $17,499 | 0 (0.0%) | 0 (0.0%) |
| $17,500 to $19,999 | 3 (3.3%) | 0 (0.0%) |
| $20,000 to $22,499 | 0 (0.0%) | 0 (0.0%) |
| $22,500 to $24,999 | 0 (0.0%) | 10 (18.5%) |
| $25,000 to $29,999 | 5 (5.6%) | 0 (0.0%) |
| $30,000 to $34,999 | 0 (0.0%) | 0 (0.0%) |
| $35,000 to $39,999 | 14 (15.6%) | 0 (0.0%) |
| $40,000 to $44,999 | 4 (4.4%) | 11 (20.4%) |
| $45,000 to $49,999 | 6 (6.7%) | 0 (0.0%) |
| $50,000 to $54,999 | 0 (0.0%) | 0 (0.0%) |
| $55,000 to $64,999 | 22 (24.4%) | 9 (16.7%) |
| $65,000 to $74,999 | 11 (12.2%) | 0 (0.0%) |
| $75,000 to $99,999 | 25 (27.8%) | 4 (7.4%) |
| $100,000+ | 0 (0.0%) | 0 (0.0%) |
| Total | 90 (100.0%) | 54 (100.0%) |
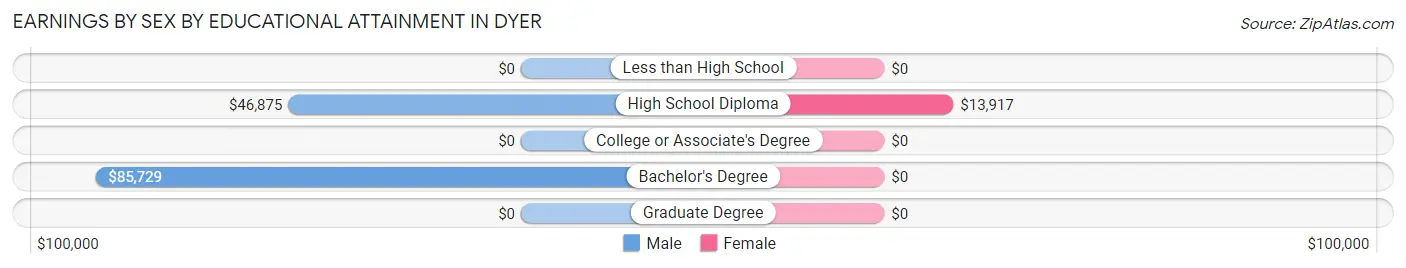
Earnings by Sex by Educational Attainment in Dyer
| Educational Attainment | Male Income | Female Income |
| Less than High School | - | - |
| High School Diploma | $46,875 | $13,917 |
| College or Associate's Degree | - | - |
| Bachelor's Degree | $85,729 | $0 |
| Graduate Degree | - | - |
| Total | $56,477 | $0 |
Family Income in Dyer
Family Income Brackets in Dyer
According to the Dyer family income data, there are 26 families falling into the $50,000 to $74,999 income range, which is the most common income bracket and makes up 26.3% of all families.
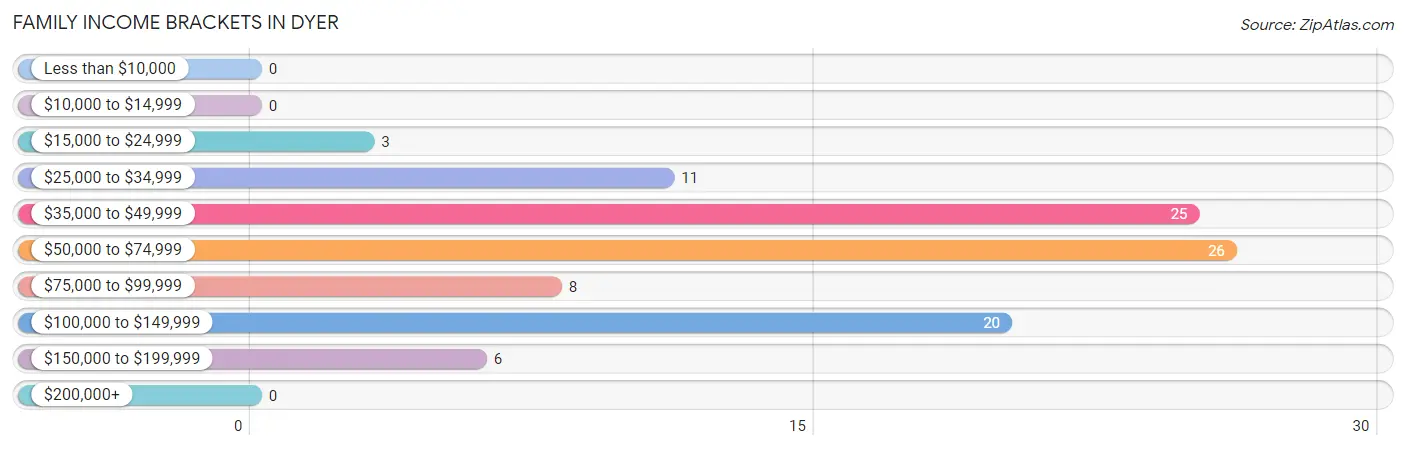
| Income Bracket | # Families | % Families |
| Less than $10,000 | 0 | 0.0% |
| $10,000 to $14,999 | 0 | 0.0% |
| $15,000 to $24,999 | 3 | 3.0% |
| $25,000 to $34,999 | 11 | 11.1% |
| $35,000 to $49,999 | 25 | 25.3% |
| $50,000 to $74,999 | 26 | 26.3% |
| $75,000 to $99,999 | 8 | 8.1% |
| $100,000 to $149,999 | 20 | 20.2% |
| $150,000 to $199,999 | 6 | 6.1% |
| $200,000+ | 0 | 0.0% |
Family Income by Famaliy Size in Dyer
2-person families (65 | 65.7%) account for the highest median family income in Dyer with $70,625 per family, while 2-person families (65 | 65.7%) have the highest median income of $35,312 per family member.
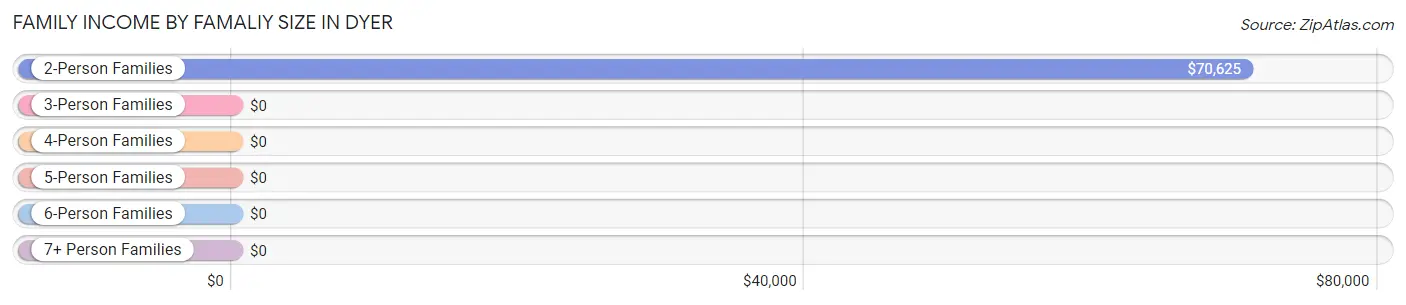
| Income Bracket | # Families | Median Income |
| 2-Person Families | 65 (65.7%) | $70,625 |
| 3-Person Families | 3 (3.0%) | $0 |
| 4-Person Families | 0 (0.0%) | $0 |
| 5-Person Families | 31 (31.3%) | $0 |
| 6-Person Families | 0 (0.0%) | $0 |
| 7+ Person Families | 0 (0.0%) | $0 |
| Total | 99 (100.0%) | $70,739 |
Family Income by Number of Earners in Dyer
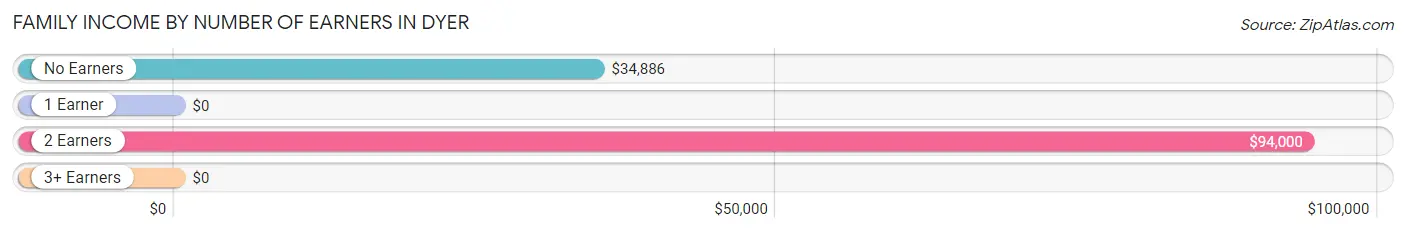
| Number of Earners | # Families | Median Income |
| No Earners | 27 (27.3%) | $34,886 |
| 1 Earner | 16 (16.2%) | $0 |
| 2 Earners | 56 (56.6%) | $94,000 |
| 3+ Earners | 0 (0.0%) | $0 |
| Total | 99 (100.0%) | $70,739 |
Household Income in Dyer
Household Income Brackets in Dyer
With 33 households falling in the category, the $35,000 to $49,999 income range is the most frequent in Dyer, accounting for 23.1% of all households.
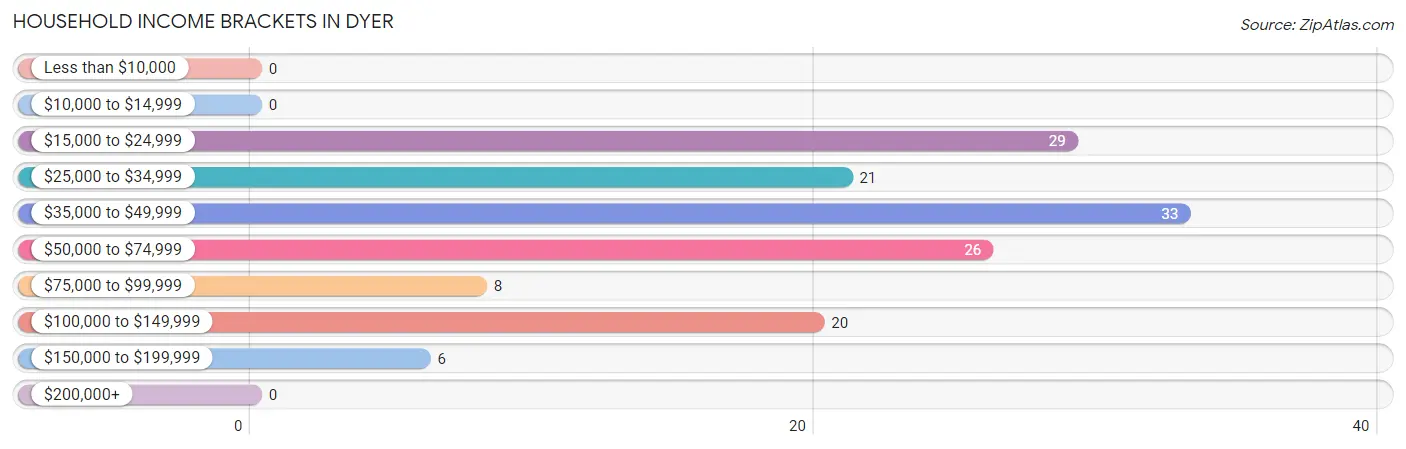
| Income Bracket | # Households | % Households |
| Less than $10,000 | 0 | 0.0% |
| $10,000 to $14,999 | 0 | 0.0% |
| $15,000 to $24,999 | 29 | 20.3% |
| $25,000 to $34,999 | 21 | 14.7% |
| $35,000 to $49,999 | 33 | 23.1% |
| $50,000 to $74,999 | 26 | 18.2% |
| $75,000 to $99,999 | 8 | 5.6% |
| $100,000 to $149,999 | 20 | 14.0% |
| $150,000 to $199,999 | 6 | 4.2% |
| $200,000+ | 0 | 0.0% |
Household Income by Householder Age in Dyer
The median household income in Dyer is $39,837, with the highest median household income of $71,307 found in the 45 to 64 years age bracket for the primary householder. A total of 53 households (37.1%) fall into this category.
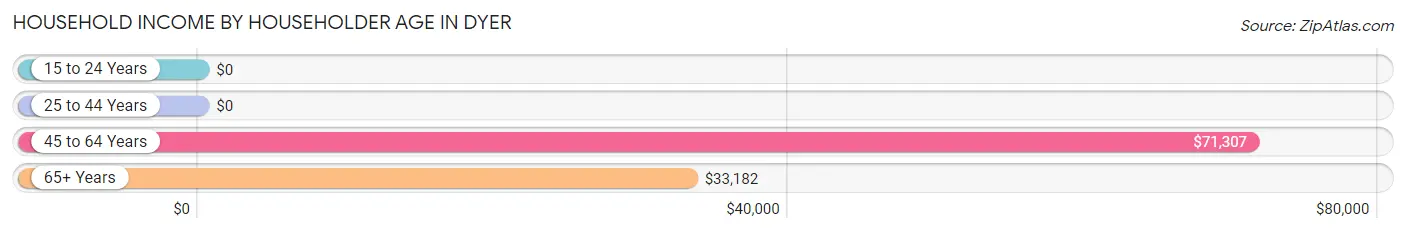
| Income Bracket | # Households | Median Income |
| 15 to 24 Years | 0 (0.0%) | $0 |
| 25 to 44 Years | 42 (29.4%) | $0 |
| 45 to 64 Years | 53 (37.1%) | $71,307 |
| 65+ Years | 48 (33.6%) | $33,182 |
| Total | 143 (100.0%) | $39,837 |
Poverty in Dyer
Income Below Poverty by Sex and Age in Dyer
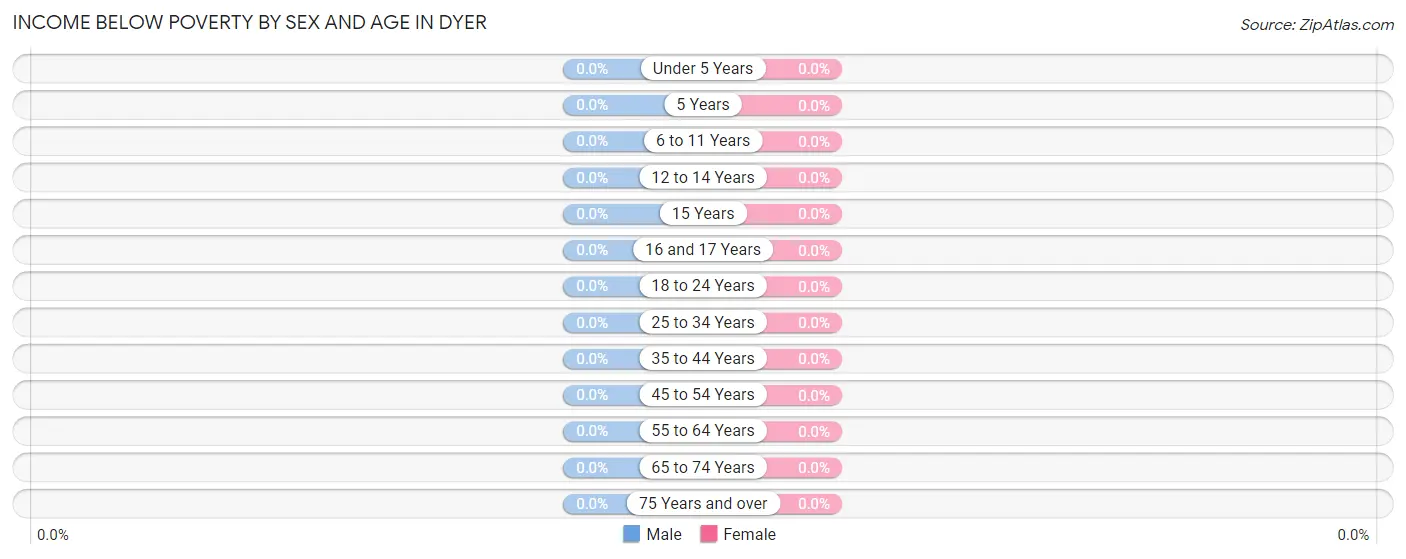
| Age Bracket | Male | Female |
| Under 5 Years | 0 (0.0%) | 0 (0.0%) |
| 5 Years | 0 (0.0%) | 0 (0.0%) |
| 6 to 11 Years | 0 (0.0%) | 0 (0.0%) |
| 12 to 14 Years | 0 (0.0%) | 0 (0.0%) |
| 15 Years | 0 (0.0%) | 0 (0.0%) |
| 16 and 17 Years | 0 (0.0%) | 0 (0.0%) |
| 18 to 24 Years | 0 (0.0%) | 0 (0.0%) |
| 25 to 34 Years | 0 (0.0%) | 0 (0.0%) |
| 35 to 44 Years | 0 (0.0%) | 0 (0.0%) |
| 45 to 54 Years | 0 (0.0%) | 0 (0.0%) |
| 55 to 64 Years | 0 (0.0%) | 0 (0.0%) |
| 65 to 74 Years | 0 (0.0%) | 0 (0.0%) |
| 75 Years and over | 0 (0.0%) | 0 (0.0%) |
| Total | 0 (0.0%) | 0 (0.0%) |
Income Above Poverty by Sex and Age in Dyer
According to the poverty statistics in Dyer, males aged under 5 years and females aged under 5 years are the age groups that are most secure financially, with 100.0% of males and 100.0% of females in these age groups living above the poverty line.
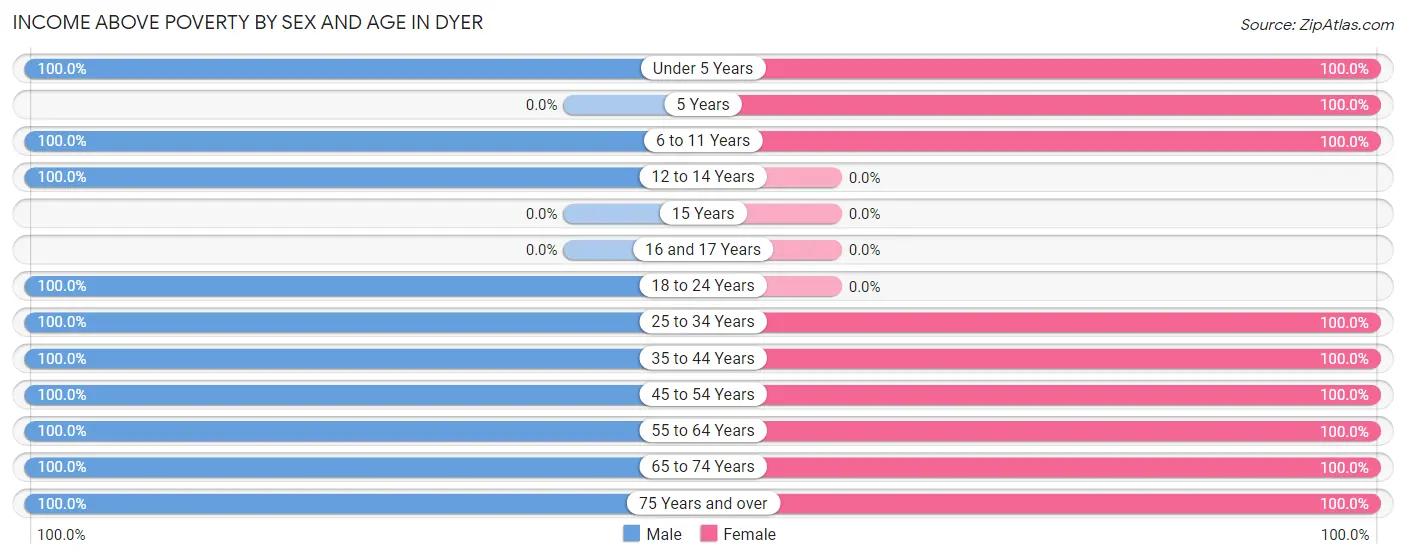
| Age Bracket | Male | Female |
| Under 5 Years | 9 (100.0%) | 11 (100.0%) |
| 5 Years | 0 (0.0%) | 6 (100.0%) |
| 6 to 11 Years | 18 (100.0%) | 19 (100.0%) |
| 12 to 14 Years | 8 (100.0%) | 0 (0.0%) |
| 15 Years | 0 (0.0%) | 0 (0.0%) |
| 16 and 17 Years | 0 (0.0%) | 0 (0.0%) |
| 18 to 24 Years | 10 (100.0%) | 0 (0.0%) |
| 25 to 34 Years | 10 (100.0%) | 28 (100.0%) |
| 35 to 44 Years | 16 (100.0%) | 38 (100.0%) |
| 45 to 54 Years | 38 (100.0%) | 31 (100.0%) |
| 55 to 64 Years | 29 (100.0%) | 3 (100.0%) |
| 65 to 74 Years | 29 (100.0%) | 16 (100.0%) |
| 75 Years and over | 13 (100.0%) | 11 (100.0%) |
| Total | 180 (100.0%) | 163 (100.0%) |
Income Below Poverty Among Married-Couple Families in Dyer
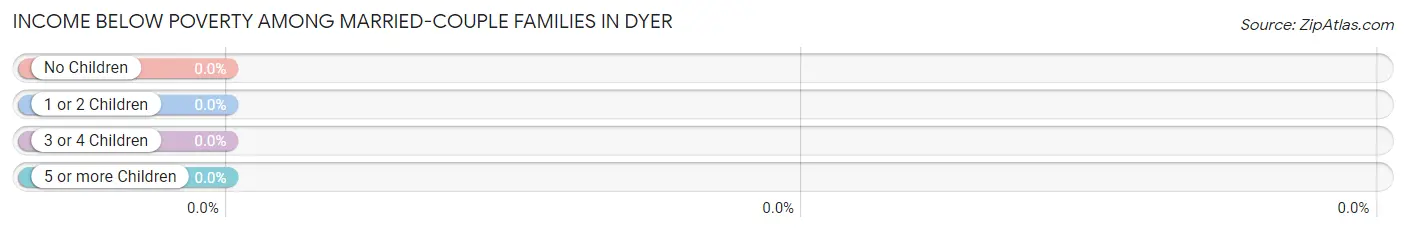
| Children | Above Poverty | Below Poverty |
| No Children | 56 (100.0%) | 0 (0.0%) |
| 1 or 2 Children | 9 (100.0%) | 0 (0.0%) |
| 3 or 4 Children | 22 (100.0%) | 0 (0.0%) |
| 5 or more Children | 0 (0.0%) | 0 (0.0%) |
| Total | 87 (100.0%) | 0 (0.0%) |
Income Below Poverty Among Single-Parent Households in Dyer
| Children | Single Father | Single Mother |
| No Children | 0 (0.0%) | 0 (0.0%) |
| 1 or 2 Children | 0 (0.0%) | 0 (0.0%) |
| 3 or 4 Children | 0 (0.0%) | 0 (0.0%) |
| 5 or more Children | 0 (0.0%) | 0 (0.0%) |
| Total | 0 (0.0%) | 0 (0.0%) |
Income Below Poverty Among Married-Couple vs Single-Parent Households in Dyer
| Children | Married-Couple Families | Single-Parent Households |
| No Children | 0 (0.0%) | 0 (0.0%) |
| 1 or 2 Children | 0 (0.0%) | 0 (0.0%) |
| 3 or 4 Children | 0 (0.0%) | 0 (0.0%) |
| 5 or more Children | 0 (0.0%) | 0 (0.0%) |
| Total | 0 (0.0%) | 0 (0.0%) |
Race in Dyer
The most populous races in Dyer are White / Caucasian (295 | 86.0%), Hispanic or Latino (164 | 47.8%), and Two or more Races (44 | 12.8%).
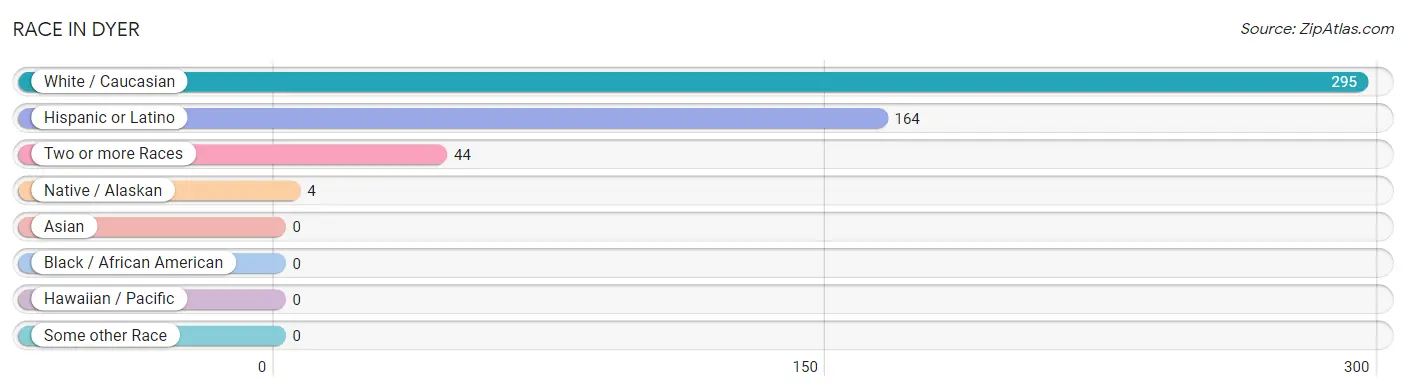
| Race | # Population | % Population |
| Asian | 0 | 0.0% |
| Black / African American | 0 | 0.0% |
| Hawaiian / Pacific | 0 | 0.0% |
| Hispanic or Latino | 164 | 47.8% |
| Native / Alaskan | 4 | 1.2% |
| White / Caucasian | 295 | 86.0% |
| Two or more Races | 44 | 12.8% |
| Some other Race | 0 | 0.0% |
| Total | 343 | 100.0% |
Ancestry in Dyer
The most populous ancestries reported in Dyer are Mexican (164 | 47.8%), Irish (40 | 11.7%), English (39 | 11.4%), Finnish (37 | 10.8%), and Russian (27 | 7.9%), together accounting for 89.5% of all Dyer residents.
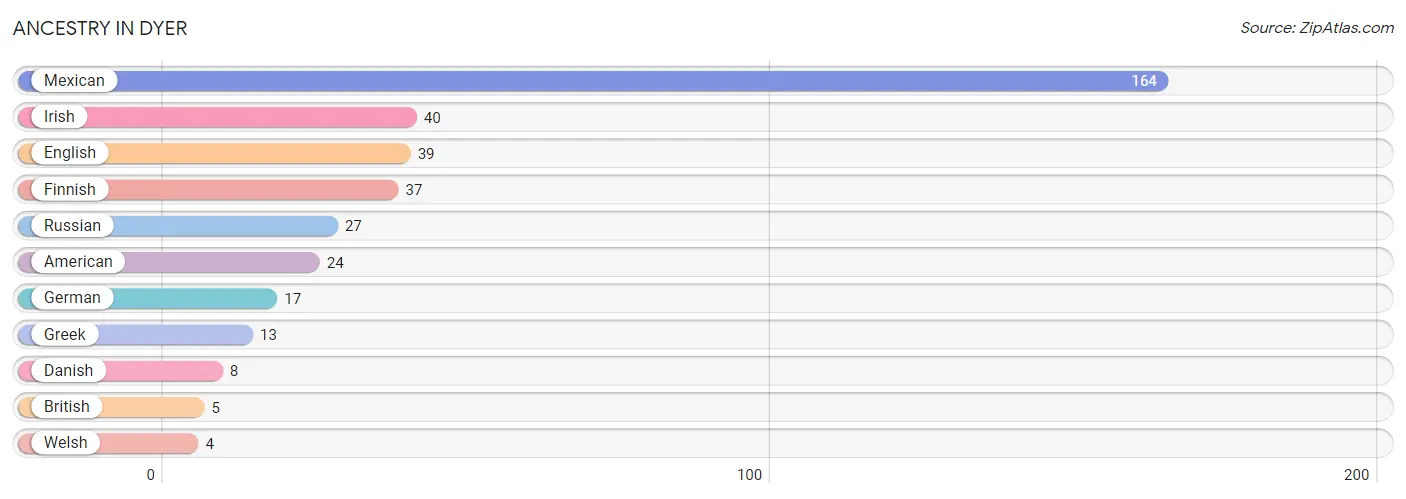
| Ancestry | # Population | % Population |
| American | 24 | 7.0% |
| British | 5 | 1.5% |
| Danish | 8 | 2.3% |
| English | 39 | 11.4% |
| Finnish | 37 | 10.8% |
| German | 17 | 5.0% |
| Greek | 13 | 3.8% |
| Irish | 40 | 11.7% |
| Mexican | 164 | 47.8% |
| Russian | 27 | 7.9% |
| Welsh | 4 | 1.2% | View All 11 Rows |
Immigrants in Dyer
The most numerous immigrant groups reported in Dyer came from Central America (85 | 24.8%), Latin America (85 | 24.8%), and Mexico (85 | 24.8%), together accounting for 74.3% of all Dyer residents.
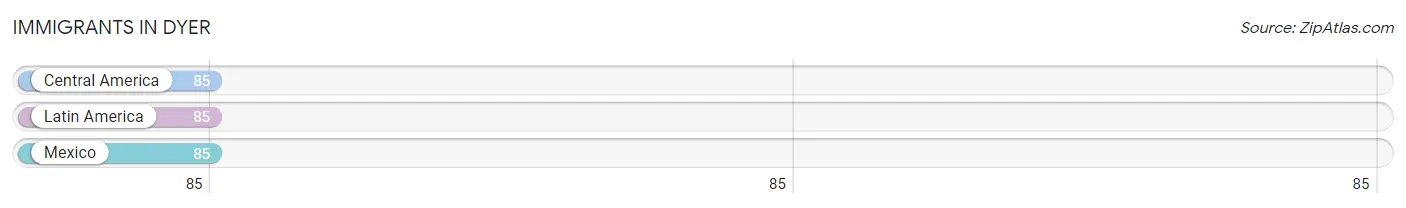
| Immigration Origin | # Population | % Population |
| Central America | 85 | 24.8% |
| Latin America | 85 | 24.8% |
| Mexico | 85 | 24.8% | View All 3 Rows |
Sex and Age in Dyer
Sex and Age in Dyer
The most populous age groups in Dyer are 70 to 74 Years (29 | 16.1%) for men and 50 to 54 Years (31 | 19.0%) for women.
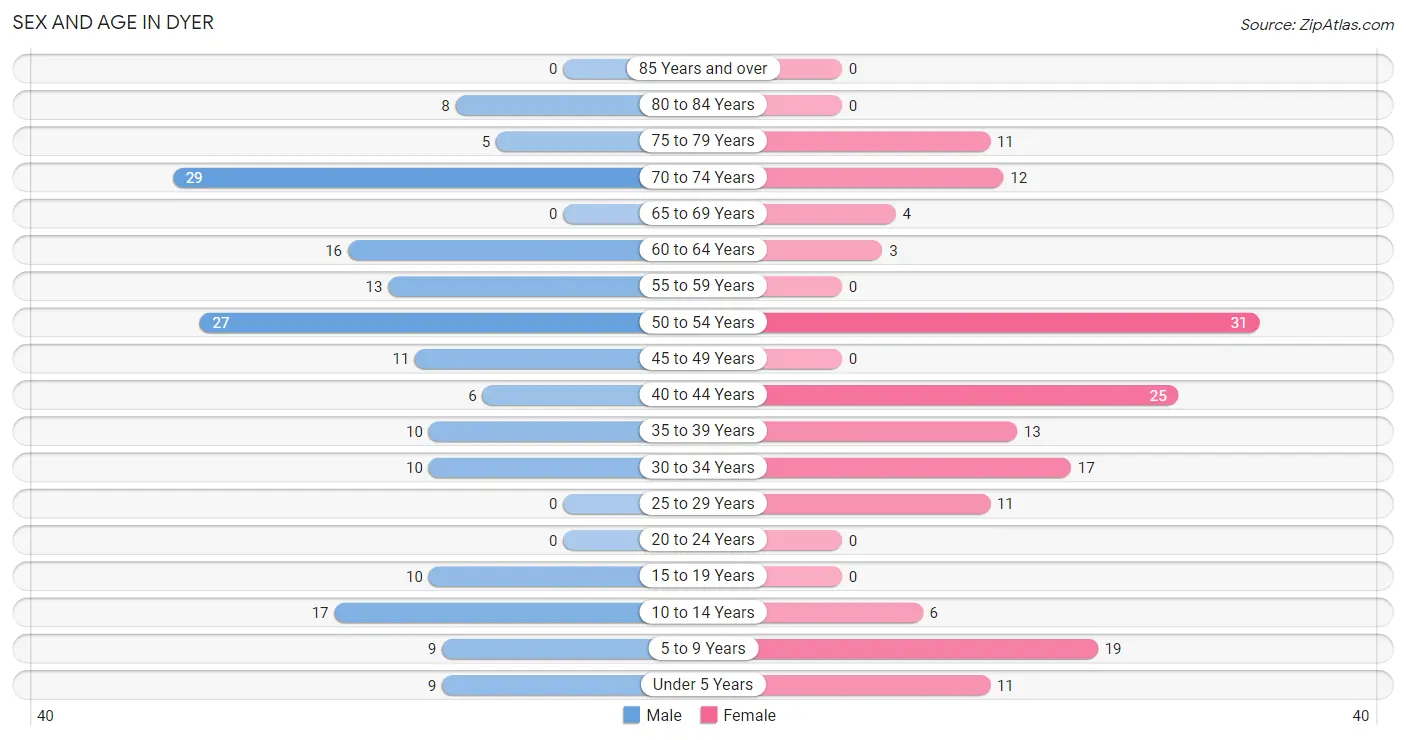
| Age Bracket | Male | Female |
| Under 5 Years | 9 (5.0%) | 11 (6.8%) |
| 5 to 9 Years | 9 (5.0%) | 19 (11.7%) |
| 10 to 14 Years | 17 (9.4%) | 6 (3.7%) |
| 15 to 19 Years | 10 (5.6%) | 0 (0.0%) |
| 20 to 24 Years | 0 (0.0%) | 0 (0.0%) |
| 25 to 29 Years | 0 (0.0%) | 11 (6.8%) |
| 30 to 34 Years | 10 (5.6%) | 17 (10.4%) |
| 35 to 39 Years | 10 (5.6%) | 13 (8.0%) |
| 40 to 44 Years | 6 (3.3%) | 25 (15.3%) |
| 45 to 49 Years | 11 (6.1%) | 0 (0.0%) |
| 50 to 54 Years | 27 (15.0%) | 31 (19.0%) |
| 55 to 59 Years | 13 (7.2%) | 0 (0.0%) |
| 60 to 64 Years | 16 (8.9%) | 3 (1.8%) |
| 65 to 69 Years | 0 (0.0%) | 4 (2.5%) |
| 70 to 74 Years | 29 (16.1%) | 12 (7.4%) |
| 75 to 79 Years | 5 (2.8%) | 11 (6.8%) |
| 80 to 84 Years | 8 (4.4%) | 0 (0.0%) |
| 85 Years and over | 0 (0.0%) | 0 (0.0%) |
| Total | 180 (100.0%) | 163 (100.0%) |
Families and Households in Dyer
Median Family Size in Dyer
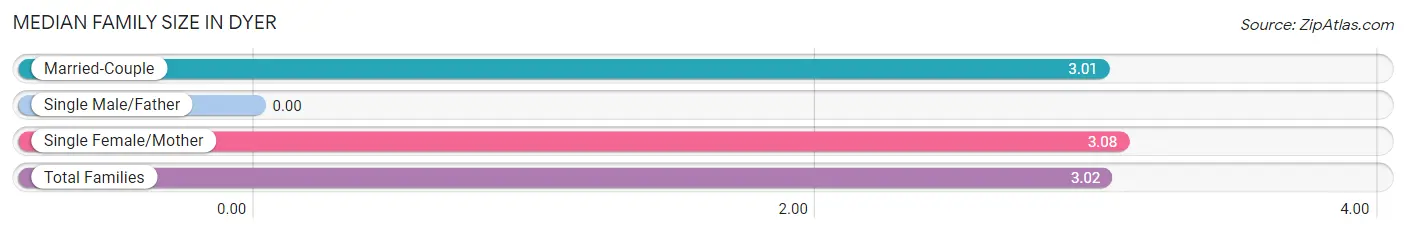
| Family Type | # Families | Family Size |
| Married-Couple | 87 (87.9%) | 3.01 |
| Single Male/Father | 0 (0.0%) | - |
| Single Female/Mother | 12 (12.1%) | 3.08 |
| Total Families | 99 (100.0%) | 3.02 |
Median Household Size in Dyer
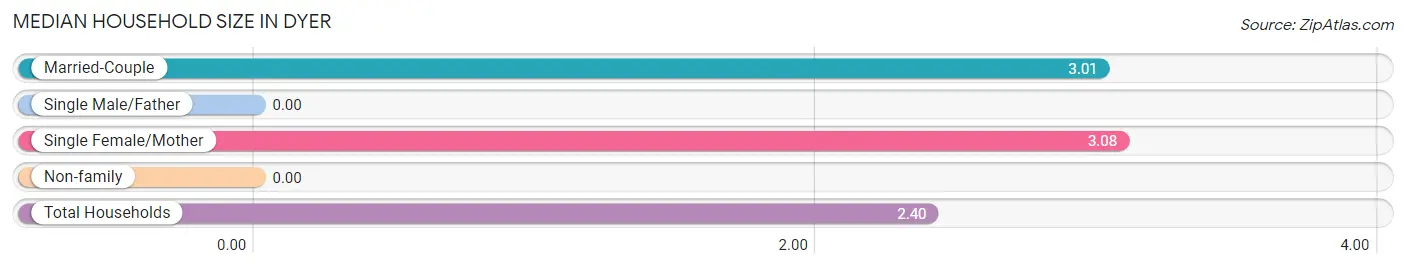
| Household Type | # Households | Household Size |
| Married-Couple | 87 (60.8%) | 3.01 |
| Single Male/Father | 0 (0.0%) | - |
| Single Female/Mother | 12 (8.4%) | 3.08 |
| Non-family | 44 (30.8%) | - |
| Total Households | 143 (100.0%) | 2.40 |
Household Size by Marriage Status in Dyer
Out of a total of 143 households in Dyer, 99 (69.2%) are family households, while 44 (30.8%) are nonfamily households. The most numerous type of family households are 2-person households, comprising 65, and the most common type of nonfamily households are 1-person households, comprising 44.
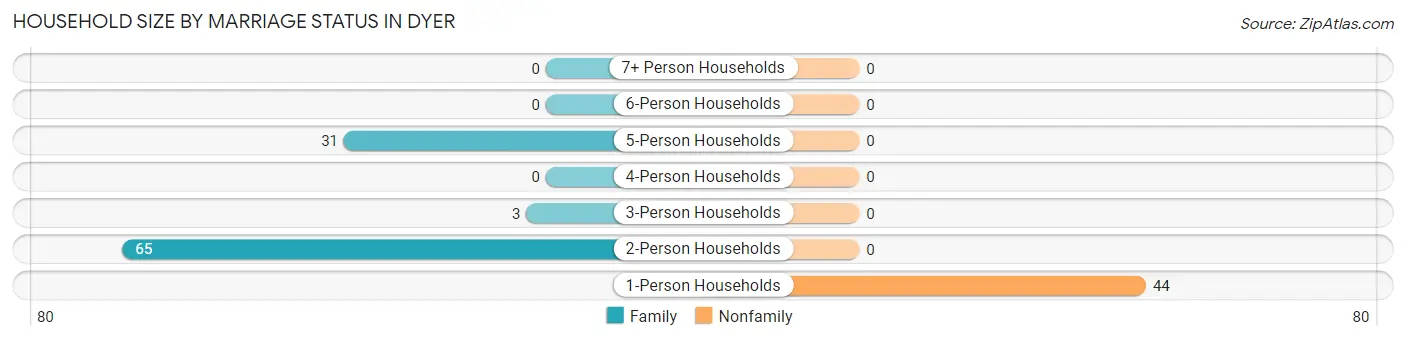
| Household Size | Family Households | Nonfamily Households |
| 1-Person Households | - | 44 (30.8%) |
| 2-Person Households | 65 (45.5%) | 0 (0.0%) |
| 3-Person Households | 3 (2.1%) | 0 (0.0%) |
| 4-Person Households | 0 (0.0%) | 0 (0.0%) |
| 5-Person Households | 31 (21.7%) | 0 (0.0%) |
| 6-Person Households | 0 (0.0%) | 0 (0.0%) |
| 7+ Person Households | 0 (0.0%) | 0 (0.0%) |
| Total | 99 (69.2%) | 44 (30.8%) |
Female Fertility in Dyer
Fertility by Age in Dyer
| Age Bracket | Women with Births | Births / 1,000 Women |
| 15 to 19 years | 0 (0.0%) | 0.0 |
| 20 to 34 years | 0 (0.0%) | 0.0 |
| 35 to 50 years | 0 (0.0%) | 0.0 |
| Total | 0 (0.0%) | 0.0 |
Fertility by Age by Marriage Status in Dyer
| Age Bracket | Married | Unmarried |
| 15 to 19 years | 0 (0.0%) | 0 (0.0%) |
| 20 to 34 years | 0 (0.0%) | 0 (0.0%) |
| 35 to 50 years | 0 (0.0%) | 0 (0.0%) |
| Total | 0 (0.0%) | 0 (0.0%) |
Fertility by Education in Dyer
| Educational Attainment | Women with Births | Births / 1,000 Women |
| Less than High School | 0 (0.0%) | 0.0 |
| High School Diploma | 0 (0.0%) | 0.0 |
| College or Associate's Degree | 0 (0.0%) | 0.0 |
| Bachelor's Degree | 0 (0.0%) | 0.0 |
| Graduate Degree | 0 (0.0%) | 0.0 |
| Total | 0 (0.0%) | 0.0 |
Fertility by Education by Marriage Status in Dyer
| Educational Attainment | Married | Unmarried |
| Less than High School | 0 (0.0%) | 0 (0.0%) |
| High School Diploma | 0 (0.0%) | 0 (0.0%) |
| College or Associate's Degree | 0 (0.0%) | 0 (0.0%) |
| Bachelor's Degree | 0 (0.0%) | 0 (0.0%) |
| Graduate Degree | 0 (0.0%) | 0 (0.0%) |
| Total | 0 (0.0%) | 0 (0.0%) |
Employment Characteristics in Dyer
Employment by Class of Employer in Dyer
Among the 135 employed individuals in Dyer, private company employees (92 | 68.1%), local government employees (22 | 16.3%), and self-employed (not incorporated) (15 | 11.1%) make up the most common classes of employment.
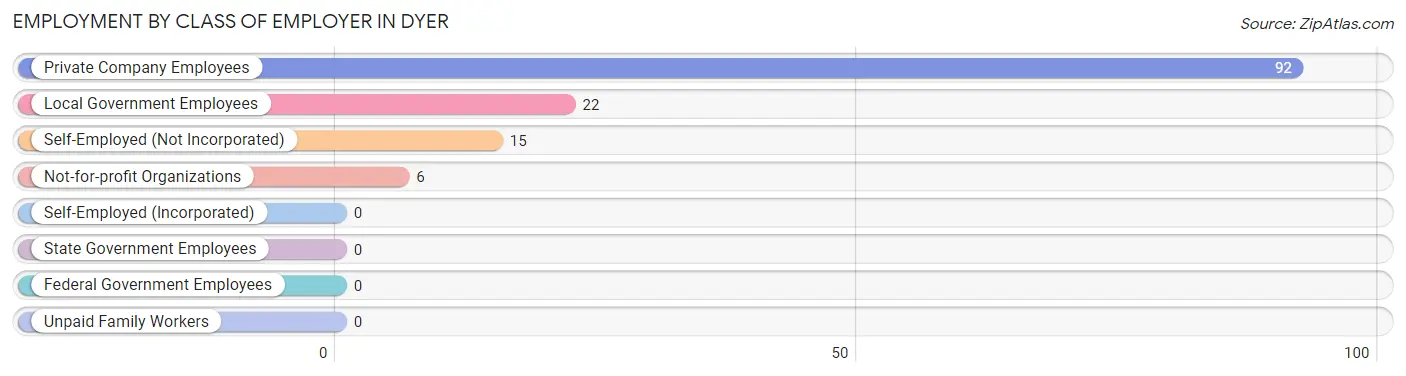
| Employer Class | # Employees | % Employees |
| Private Company Employees | 92 | 68.1% |
| Self-Employed (Incorporated) | 0 | 0.0% |
| Self-Employed (Not Incorporated) | 15 | 11.1% |
| Not-for-profit Organizations | 6 | 4.4% |
| Local Government Employees | 22 | 16.3% |
| State Government Employees | 0 | 0.0% |
| Federal Government Employees | 0 | 0.0% |
| Unpaid Family Workers | 0 | 0.0% |
| Total | 135 | 100.0% |
Employment Status by Age in Dyer
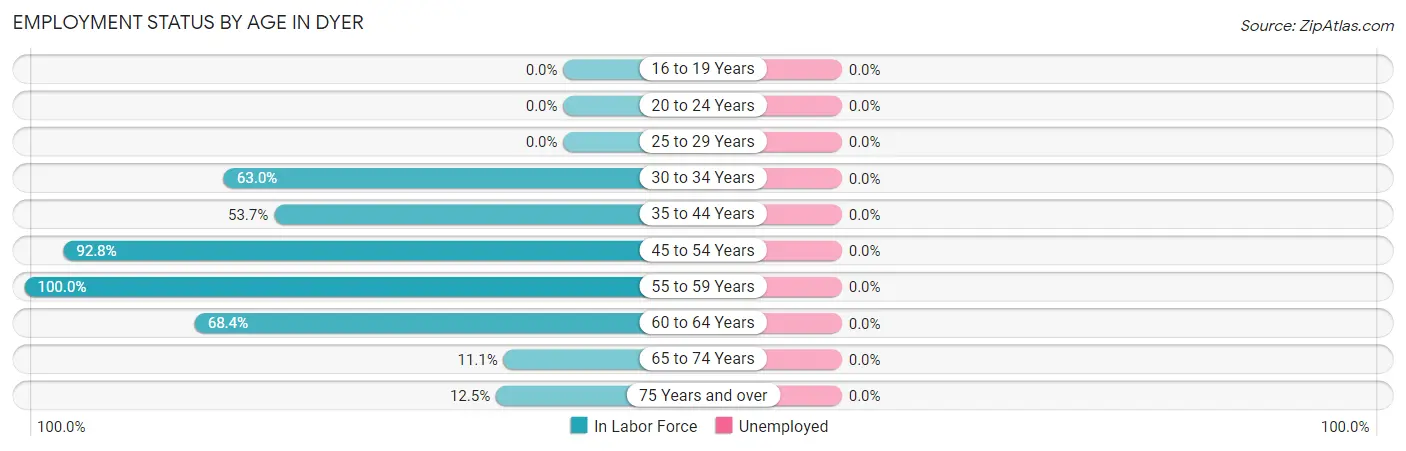
| Age Bracket | In Labor Force | Unemployed |
| 16 to 19 Years | 0 (0.0%) | 0 (0.0%) |
| 20 to 24 Years | 0 (0.0%) | 0 (0.0%) |
| 25 to 29 Years | 0 (0.0%) | 0 (0.0%) |
| 30 to 34 Years | 17 (63.0%) | 0 (0.0%) |
| 35 to 44 Years | 29 (53.7%) | 0 (0.0%) |
| 45 to 54 Years | 64 (92.8%) | 0 (0.0%) |
| 55 to 59 Years | 13 (100.0%) | 0 (0.0%) |
| 60 to 64 Years | 13 (68.4%) | 0 (0.0%) |
| 65 to 74 Years | 5 (11.1%) | 0 (0.0%) |
| 75 Years and over | 3 (12.5%) | 0 (0.0%) |
| Total | 144 (52.9%) | 0 (0.0%) |
Employment Status by Educational Attainment in Dyer
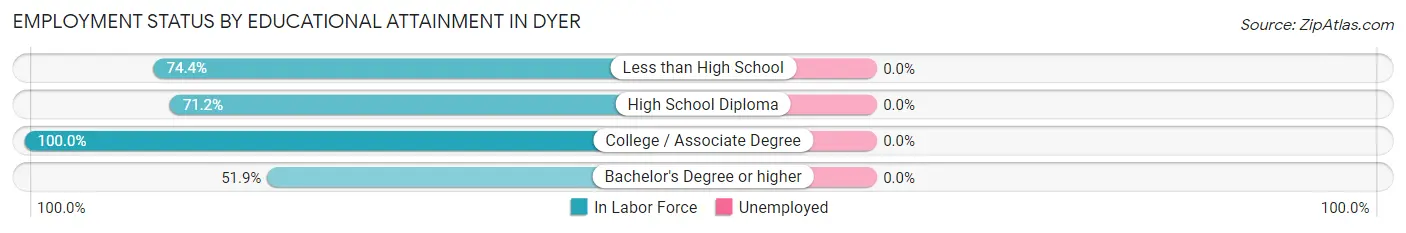
| Educational Attainment | In Labor Force | Unemployed |
| Less than High School | 32 (74.4%) | 0 (0.0%) |
| High School Diploma | 52 (71.2%) | 0 (0.0%) |
| College / Associate Degree | 25 (100.0%) | 0 (0.0%) |
| Bachelor's Degree or higher | 27 (51.9%) | 0 (0.0%) |
| Total | 136 (70.5%) | 0 (0.0%) |
Employment Occupations by Sex in Dyer
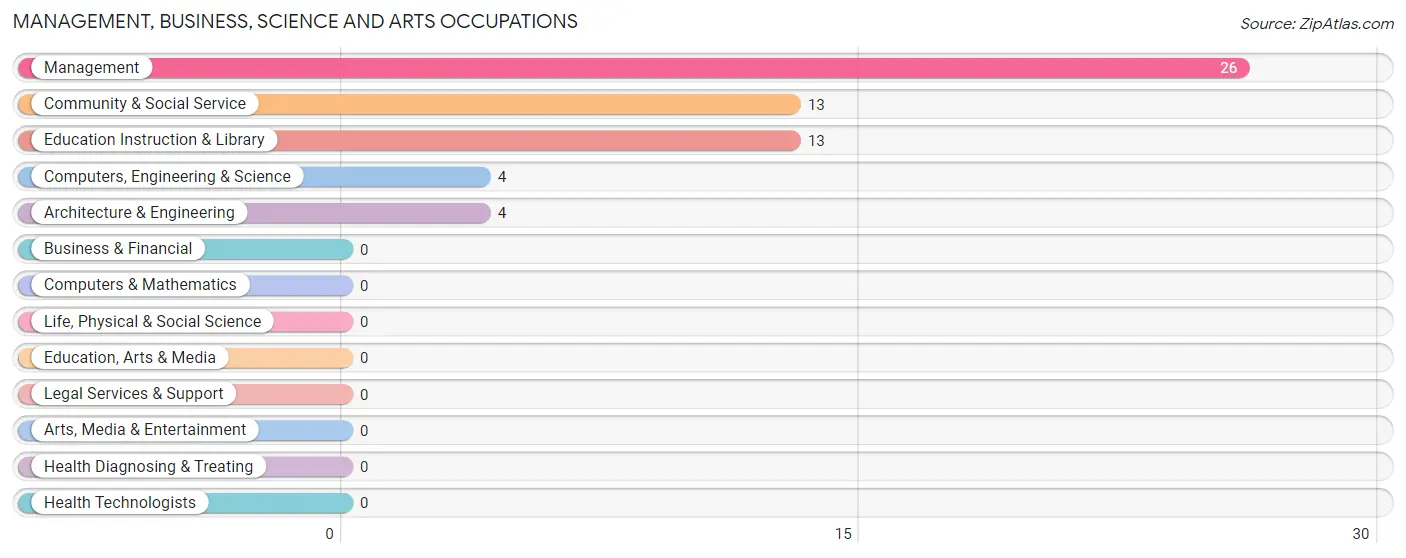
Management, Business, Science and Arts Occupations
The most common Management, Business, Science and Arts occupations in Dyer are Management (26 | 18.1%), Community & Social Service (13 | 9.0%), Education Instruction & Library (13 | 9.0%), Computers, Engineering & Science (4 | 2.8%), and Architecture & Engineering (4 | 2.8%).
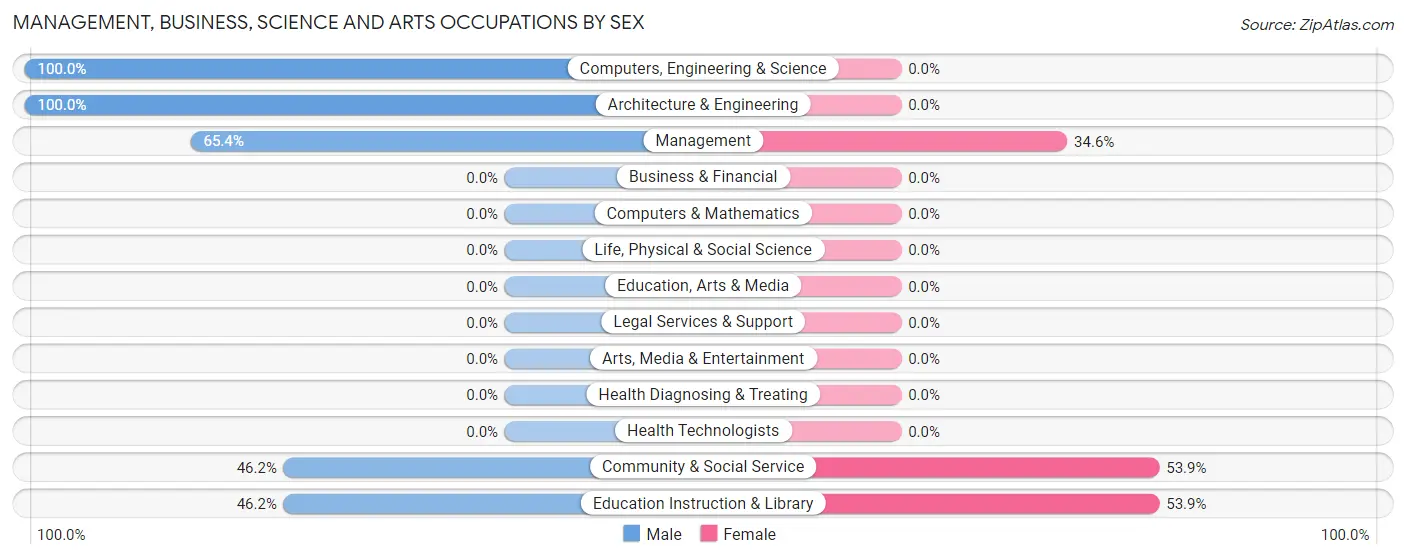
Management, Business, Science and Arts Occupations by Sex
Within the Management, Business, Science and Arts occupations in Dyer, the most male-oriented occupations are Computers, Engineering & Science (100.0%), Architecture & Engineering (100.0%), and Management (65.4%), while the most female-oriented occupations are Community & Social Service (53.8%), Education Instruction & Library (53.8%), and Management (34.6%).
| Occupation | Male | Female |
| Management | 17 (65.4%) | 9 (34.6%) |
| Business & Financial | 0 (0.0%) | 0 (0.0%) |
| Computers, Engineering & Science | 4 (100.0%) | 0 (0.0%) |
| Computers & Mathematics | 0 (0.0%) | 0 (0.0%) |
| Architecture & Engineering | 4 (100.0%) | 0 (0.0%) |
| Life, Physical & Social Science | 0 (0.0%) | 0 (0.0%) |
| Community & Social Service | 6 (46.2%) | 7 (53.8%) |
| Education, Arts & Media | 0 (0.0%) | 0 (0.0%) |
| Legal Services & Support | 0 (0.0%) | 0 (0.0%) |
| Education Instruction & Library | 6 (46.2%) | 7 (53.8%) |
| Arts, Media & Entertainment | 0 (0.0%) | 0 (0.0%) |
| Health Diagnosing & Treating | 0 (0.0%) | 0 (0.0%) |
| Health Technologists | 0 (0.0%) | 0 (0.0%) |
| Total (Category) | 27 (62.8%) | 16 (37.2%) |
| Total (Overall) | 90 (62.5%) | 54 (37.5%) |
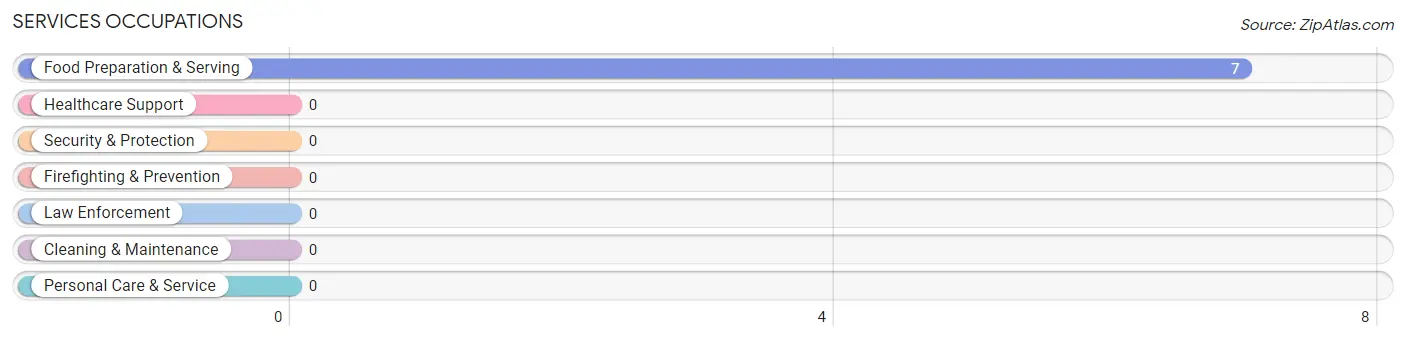
Services Occupations
The most common Services occupations in Dyer are , and Food Preparation & Serving (7 | 4.9%).
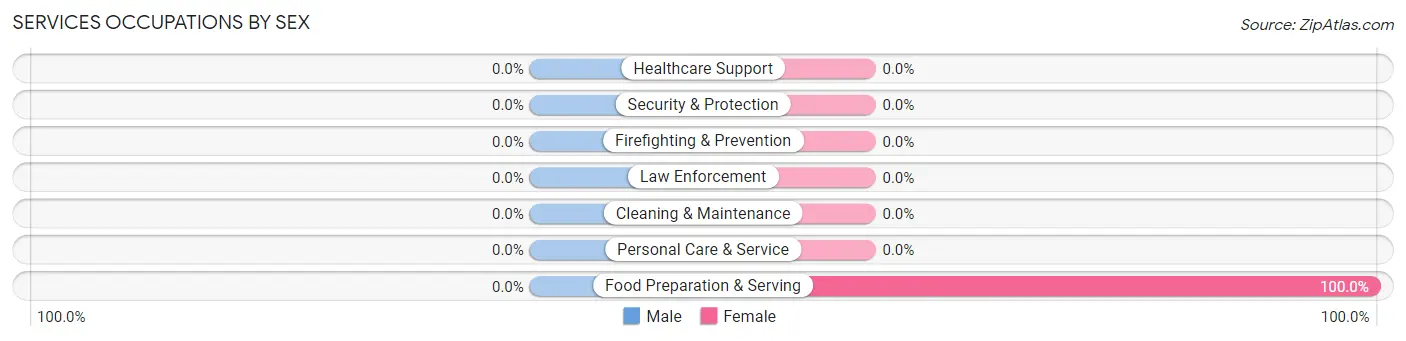
Services Occupations by Sex
| Occupation | Male | Female |
| Healthcare Support | 0 (0.0%) | 0 (0.0%) |
| Security & Protection | 0 (0.0%) | 0 (0.0%) |
| Firefighting & Prevention | 0 (0.0%) | 0 (0.0%) |
| Law Enforcement | 0 (0.0%) | 0 (0.0%) |
| Food Preparation & Serving | 0 (0.0%) | 7 (100.0%) |
| Cleaning & Maintenance | 0 (0.0%) | 0 (0.0%) |
| Personal Care & Service | 0 (0.0%) | 0 (0.0%) |
| Total (Category) | 0 (0.0%) | 7 (100.0%) |
| Total (Overall) | 90 (62.5%) | 54 (37.5%) |
Sales and Office Occupations
The most common Sales and Office occupations in Dyer are , and Office & Administration (3 | 2.1%).
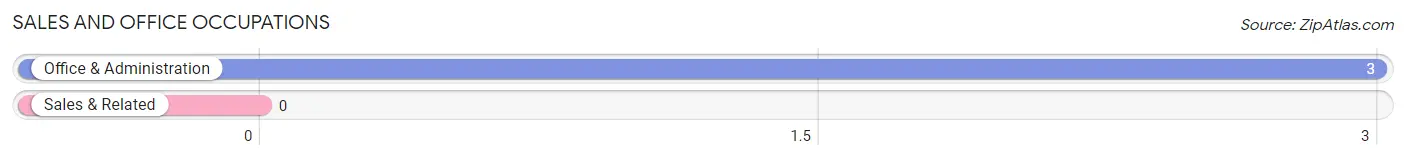
Sales and Office Occupations by Sex
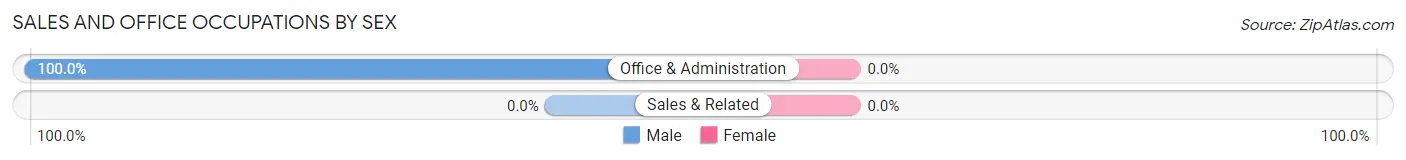
| Occupation | Male | Female |
| Sales & Related | 0 (0.0%) | 0 (0.0%) |
| Office & Administration | 3 (100.0%) | 0 (0.0%) |
| Total (Category) | 3 (100.0%) | 0 (0.0%) |
| Total (Overall) | 90 (62.5%) | 54 (37.5%) |
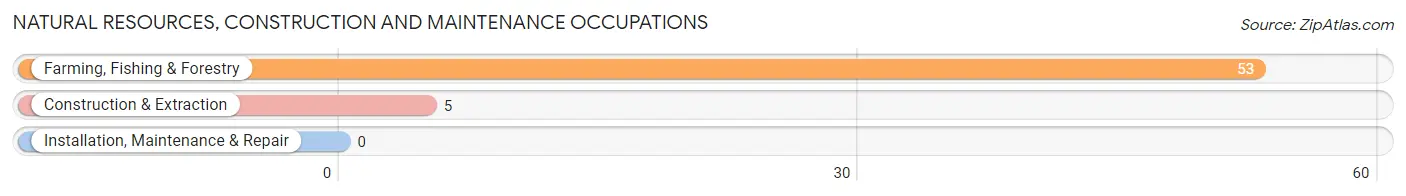
Natural Resources, Construction and Maintenance Occupations
The most common Natural Resources, Construction and Maintenance occupations in Dyer are Farming, Fishing & Forestry (53 | 36.8%), and Construction & Extraction (5 | 3.5%).
Natural Resources, Construction and Maintenance Occupations by Sex
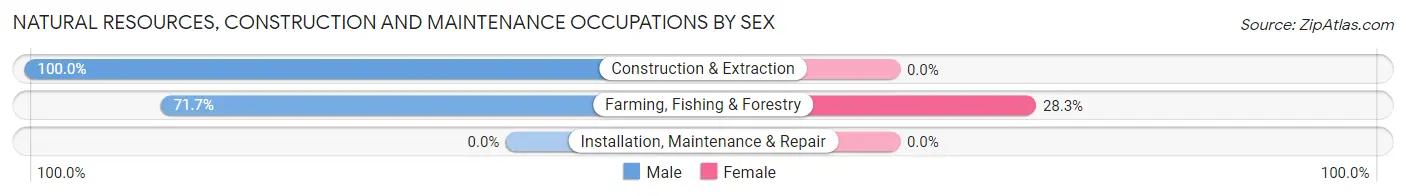
| Occupation | Male | Female |
| Farming, Fishing & Forestry | 38 (71.7%) | 15 (28.3%) |
| Construction & Extraction | 5 (100.0%) | 0 (0.0%) |
| Installation, Maintenance & Repair | 0 (0.0%) | 0 (0.0%) |
| Total (Category) | 43 (74.1%) | 15 (25.9%) |
| Total (Overall) | 90 (62.5%) | 54 (37.5%) |
Production, Transportation and Moving Occupations
The most common Production, Transportation and Moving occupations in Dyer are , and Production (33 | 22.9%).
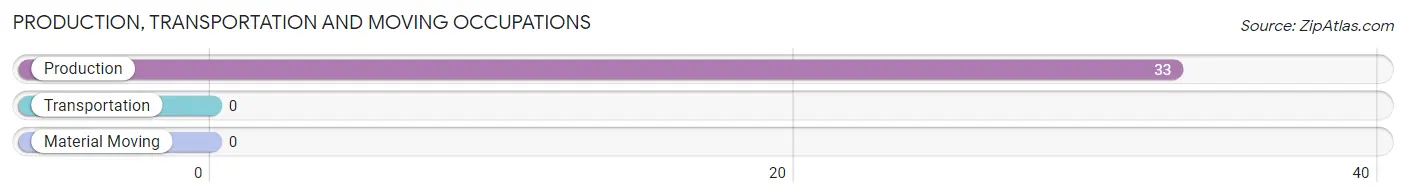
Production, Transportation and Moving Occupations by Sex
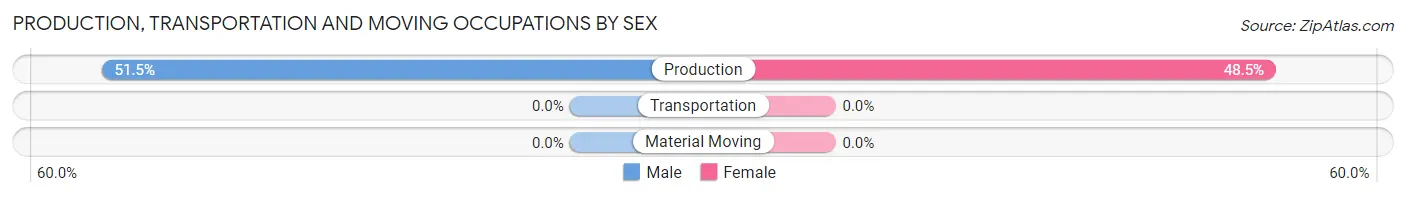
| Occupation | Male | Female |
| Production | 17 (51.5%) | 16 (48.5%) |
| Transportation | 0 (0.0%) | 0 (0.0%) |
| Material Moving | 0 (0.0%) | 0 (0.0%) |
| Total (Category) | 17 (51.5%) | 16 (48.5%) |
| Total (Overall) | 90 (62.5%) | 54 (37.5%) |
Employment Industries by Sex in Dyer
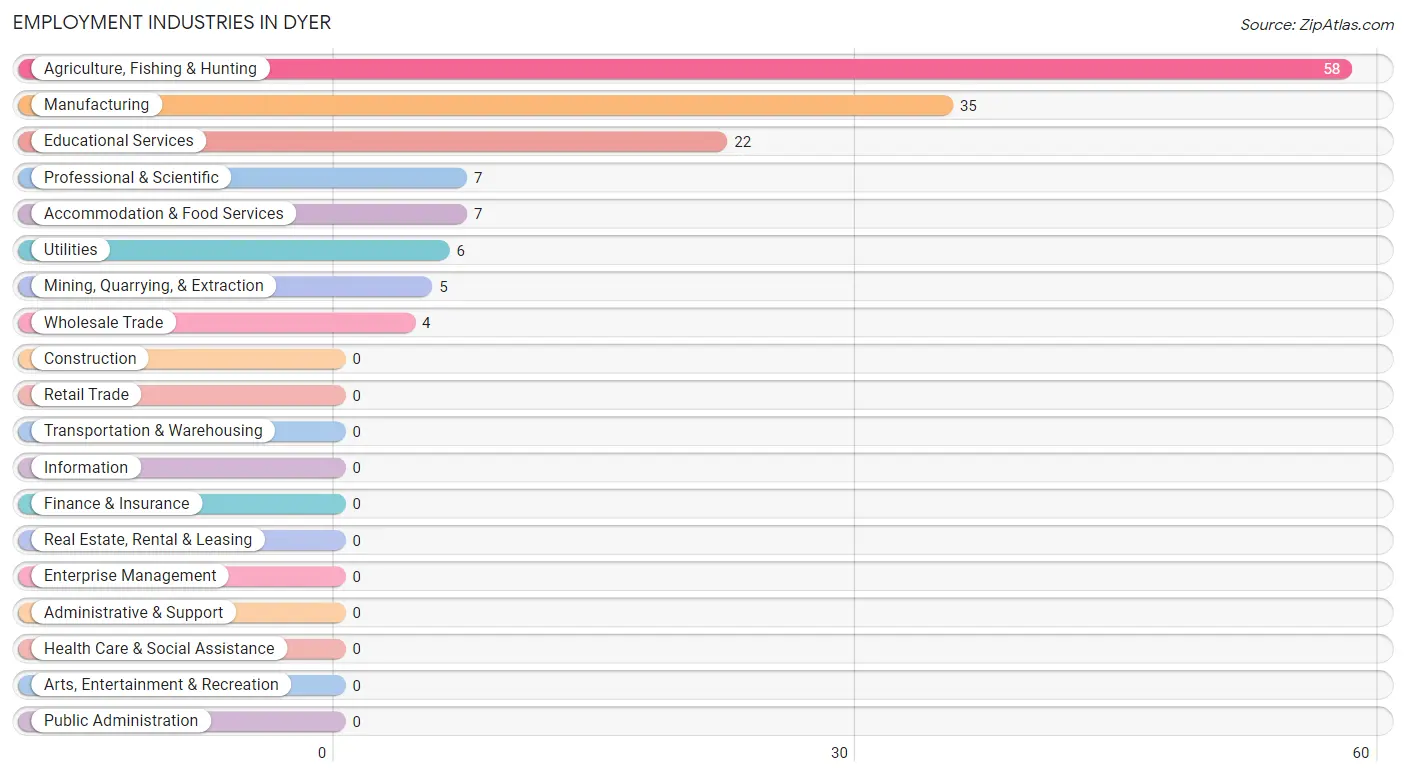
Employment Industries in Dyer
The major employment industries in Dyer include Agriculture, Fishing & Hunting (58 | 40.3%), Manufacturing (35 | 24.3%), Educational Services (22 | 15.3%), Professional & Scientific (7 | 4.9%), and Accommodation & Food Services (7 | 4.9%).
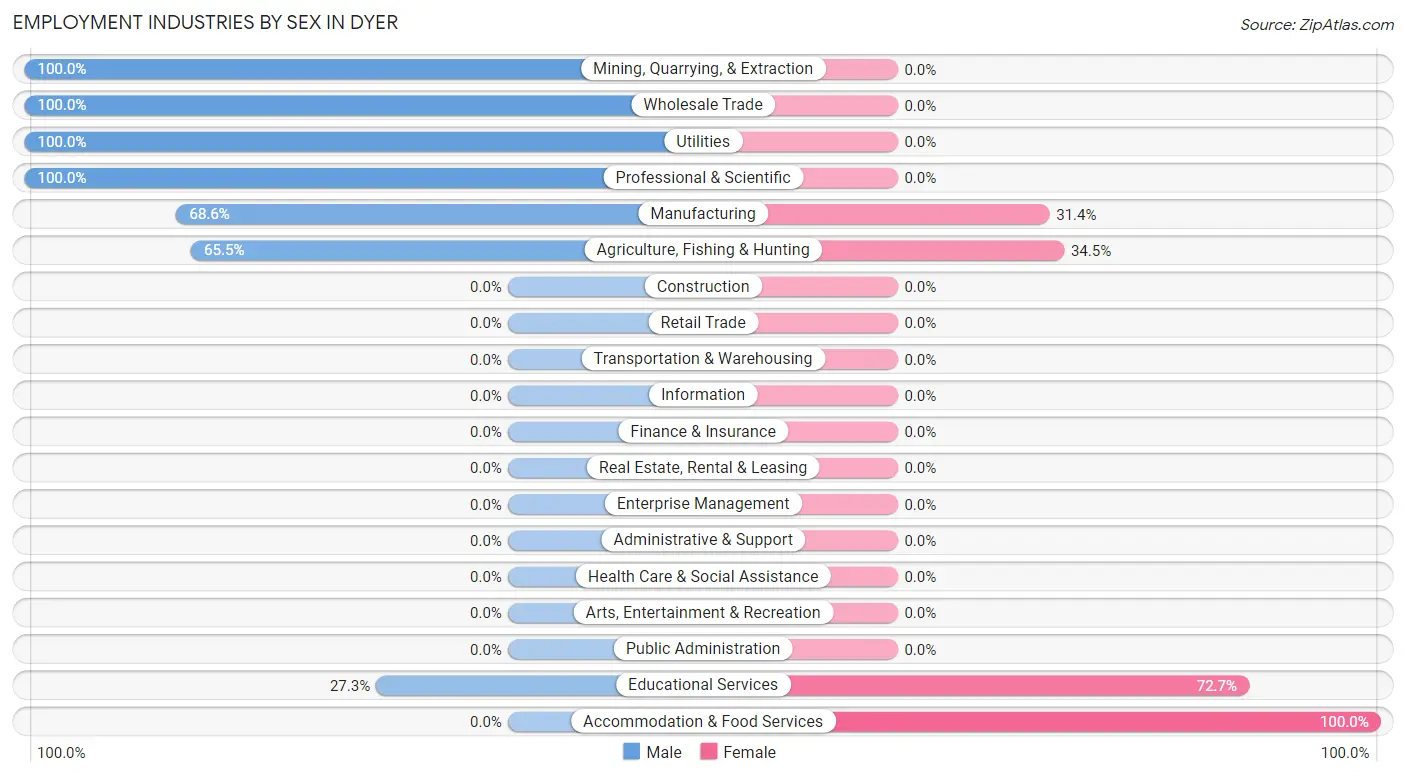
Employment Industries by Sex in Dyer
The Dyer industries that see more men than women are Mining, Quarrying, & Extraction (100.0%), Wholesale Trade (100.0%), and Utilities (100.0%), whereas the industries that tend to have a higher number of women are Accommodation & Food Services (100.0%), Educational Services (72.7%), and Agriculture, Fishing & Hunting (34.5%).
| Industry | Male | Female |
| Agriculture, Fishing & Hunting | 38 (65.5%) | 20 (34.5%) |
| Mining, Quarrying, & Extraction | 5 (100.0%) | 0 (0.0%) |
| Construction | 0 (0.0%) | 0 (0.0%) |
| Manufacturing | 24 (68.6%) | 11 (31.4%) |
| Wholesale Trade | 4 (100.0%) | 0 (0.0%) |
| Retail Trade | 0 (0.0%) | 0 (0.0%) |
| Transportation & Warehousing | 0 (0.0%) | 0 (0.0%) |
| Utilities | 6 (100.0%) | 0 (0.0%) |
| Information | 0 (0.0%) | 0 (0.0%) |
| Finance & Insurance | 0 (0.0%) | 0 (0.0%) |
| Real Estate, Rental & Leasing | 0 (0.0%) | 0 (0.0%) |
| Professional & Scientific | 7 (100.0%) | 0 (0.0%) |
| Enterprise Management | 0 (0.0%) | 0 (0.0%) |
| Administrative & Support | 0 (0.0%) | 0 (0.0%) |
| Educational Services | 6 (27.3%) | 16 (72.7%) |
| Health Care & Social Assistance | 0 (0.0%) | 0 (0.0%) |
| Arts, Entertainment & Recreation | 0 (0.0%) | 0 (0.0%) |
| Accommodation & Food Services | 0 (0.0%) | 7 (100.0%) |
| Public Administration | 0 (0.0%) | 0 (0.0%) |
| Total | 90 (62.5%) | 54 (37.5%) |
Education in Dyer
School Enrollment in Dyer
The most common levels of schooling among the 73 students in Dyer are elementary school (24 | 32.9%), college / undergraduate (19 | 26.0%), and middle school (17 | 23.3%).
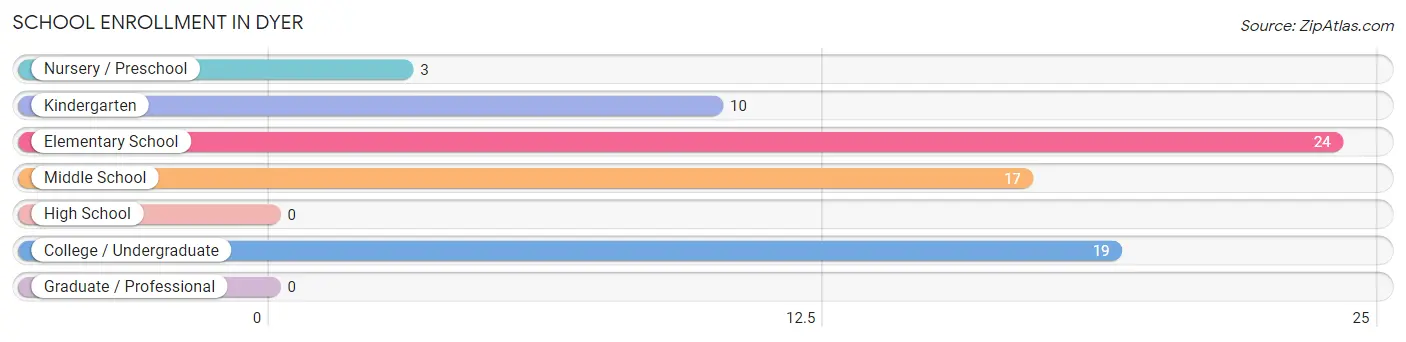
| School Level | # Students | % Students |
| Nursery / Preschool | 3 | 4.1% |
| Kindergarten | 10 | 13.7% |
| Elementary School | 24 | 32.9% |
| Middle School | 17 | 23.3% |
| High School | 0 | 0.0% |
| College / Undergraduate | 19 | 26.0% |
| Graduate / Professional | 0 | 0.0% |
| Total | 73 | 100.0% |
School Enrollment by Age by Funding Source in Dyer
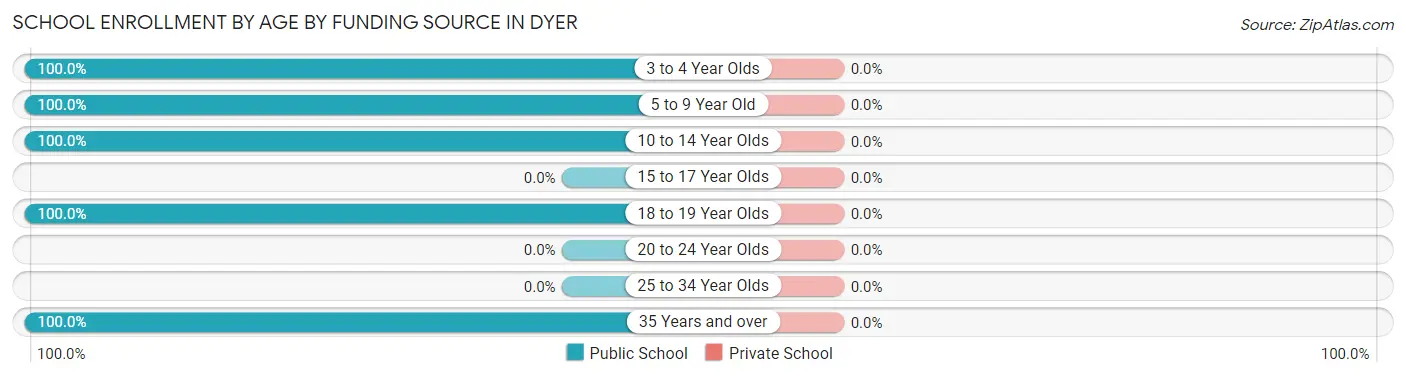
| Age Bracket | Public School | Private School |
| 3 to 4 Year Olds | 3 (100.0%) | 0 (0.0%) |
| 5 to 9 Year Old | 28 (100.0%) | 0 (0.0%) |
| 10 to 14 Year Olds | 23 (100.0%) | 0 (0.0%) |
| 15 to 17 Year Olds | 0 (0.0%) | 0 (0.0%) |
| 18 to 19 Year Olds | 10 (100.0%) | 0 (0.0%) |
| 20 to 24 Year Olds | 0 (0.0%) | 0 (0.0%) |
| 25 to 34 Year Olds | 0 (0.0%) | 0 (0.0%) |
| 35 Years and over | 9 (100.0%) | 0 (0.0%) |
| Total | 73 (100.0%) | 0 (0.0%) |
Educational Attainment by Field of Study in Dyer
Social sciences (37 | 53.6%), business (11 | 15.9%), education (10 | 14.5%), engineering (6 | 8.7%), and visual & performing arts (5 | 7.2%) are the most common fields of study among 69 individuals in Dyer who have obtained a bachelor's degree or higher.
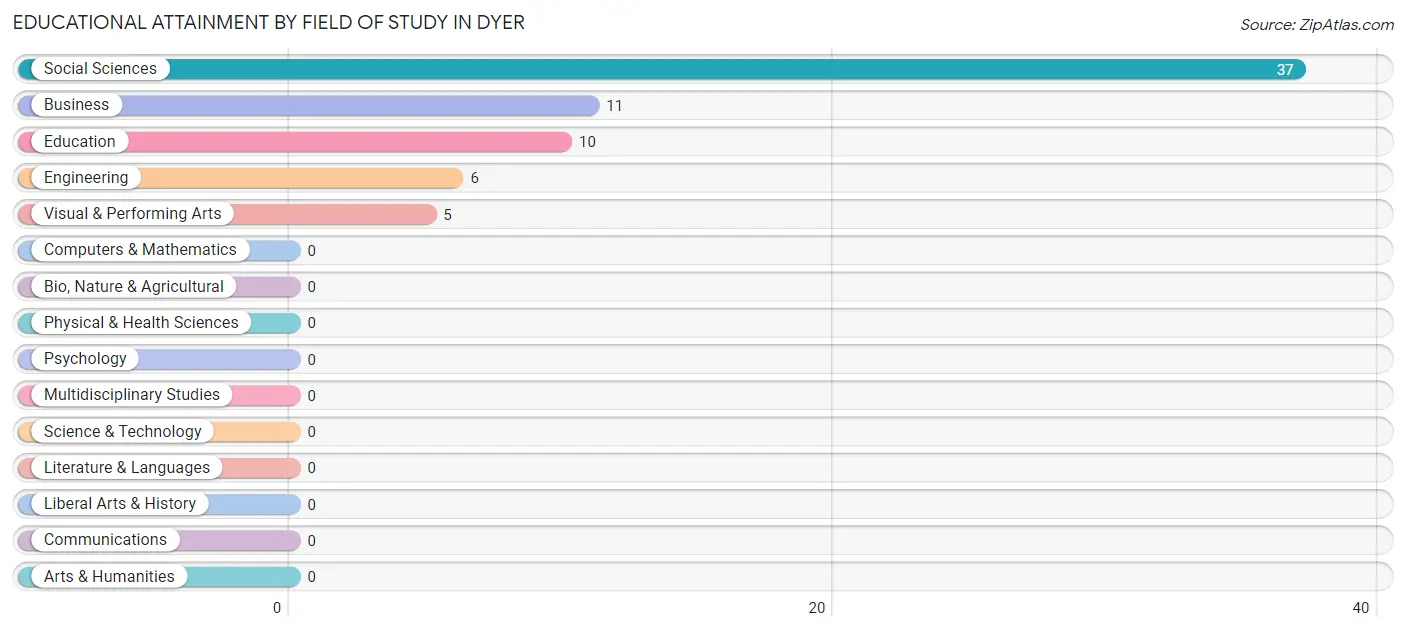
| Field of Study | # Graduates | % Graduates |
| Computers & Mathematics | 0 | 0.0% |
| Bio, Nature & Agricultural | 0 | 0.0% |
| Physical & Health Sciences | 0 | 0.0% |
| Psychology | 0 | 0.0% |
| Social Sciences | 37 | 53.6% |
| Engineering | 6 | 8.7% |
| Multidisciplinary Studies | 0 | 0.0% |
| Science & Technology | 0 | 0.0% |
| Business | 11 | 15.9% |
| Education | 10 | 14.5% |
| Literature & Languages | 0 | 0.0% |
| Liberal Arts & History | 0 | 0.0% |
| Visual & Performing Arts | 5 | 7.2% |
| Communications | 0 | 0.0% |
| Arts & Humanities | 0 | 0.0% |
| Total | 69 | 100.0% |
Transportation & Commute in Dyer
Vehicle Availability by Sex in Dyer
The most prevalent vehicle ownership categories in Dyer are males with 1 vehicle (32, accounting for 37.2%) and females with 1 vehicle (26, making up 65.3%).
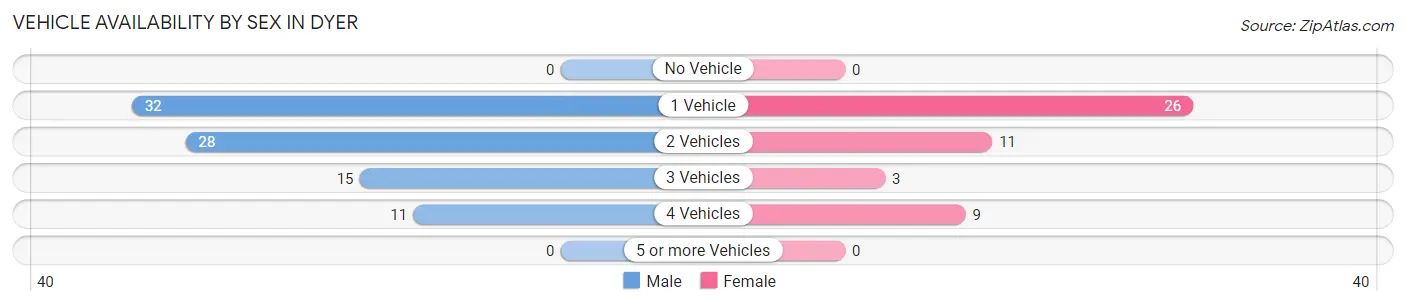
| Vehicles Available | Male | Female |
| No Vehicle | 0 (0.0%) | 0 (0.0%) |
| 1 Vehicle | 32 (37.2%) | 26 (53.1%) |
| 2 Vehicles | 28 (32.6%) | 11 (22.5%) |
| 3 Vehicles | 15 (17.4%) | 3 (6.1%) |
| 4 Vehicles | 11 (12.8%) | 9 (18.4%) |
| 5 or more Vehicles | 0 (0.0%) | 0 (0.0%) |
| Total | 86 (100.0%) | 49 (100.0%) |
Commute Time in Dyer
The most frequently occuring commute durations in Dyer are less than 5 minutes (25 commuters, 29.1%), 5 to 9 minutes (25 commuters, 29.1%), and 20 to 24 minutes (16 commuters, 18.6%).
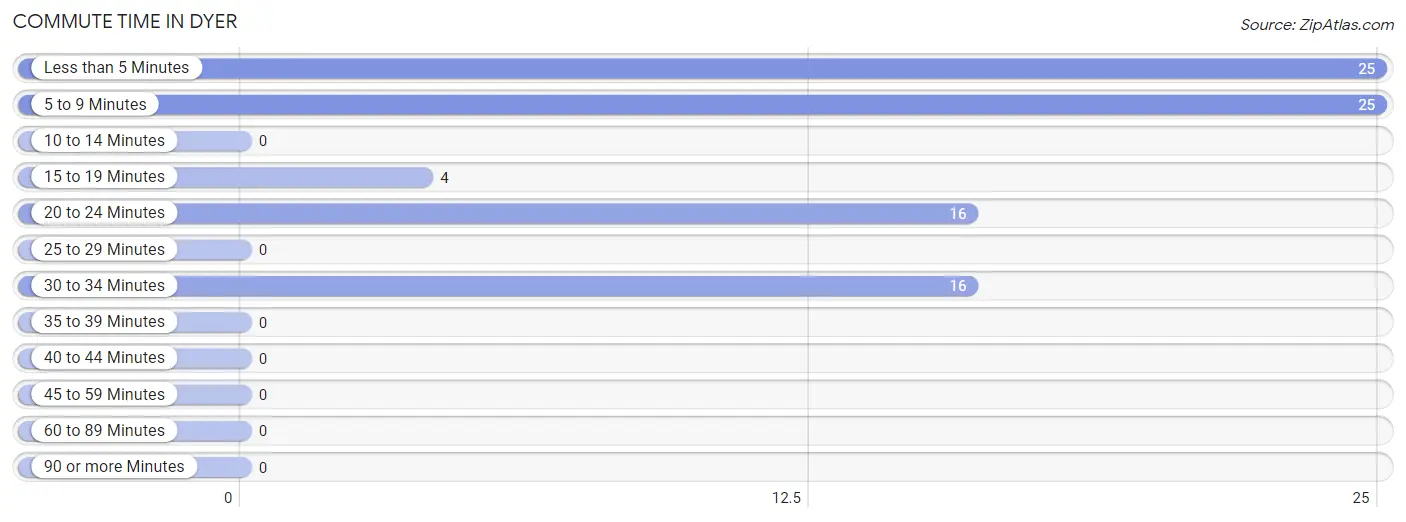
| Commute Time | # Commuters | % Commuters |
| Less than 5 Minutes | 25 | 29.1% |
| 5 to 9 Minutes | 25 | 29.1% |
| 10 to 14 Minutes | 0 | 0.0% |
| 15 to 19 Minutes | 4 | 4.6% |
| 20 to 24 Minutes | 16 | 18.6% |
| 25 to 29 Minutes | 0 | 0.0% |
| 30 to 34 Minutes | 16 | 18.6% |
| 35 to 39 Minutes | 0 | 0.0% |
| 40 to 44 Minutes | 0 | 0.0% |
| 45 to 59 Minutes | 0 | 0.0% |
| 60 to 89 Minutes | 0 | 0.0% |
| 90 or more Minutes | 0 | 0.0% |
Commute Time by Sex in Dyer
The most common commute times in Dyer are 20 to 24 minutes (16 commuters, 33.3%) for males and 5 to 9 minutes (25 commuters, 65.8%) for females.
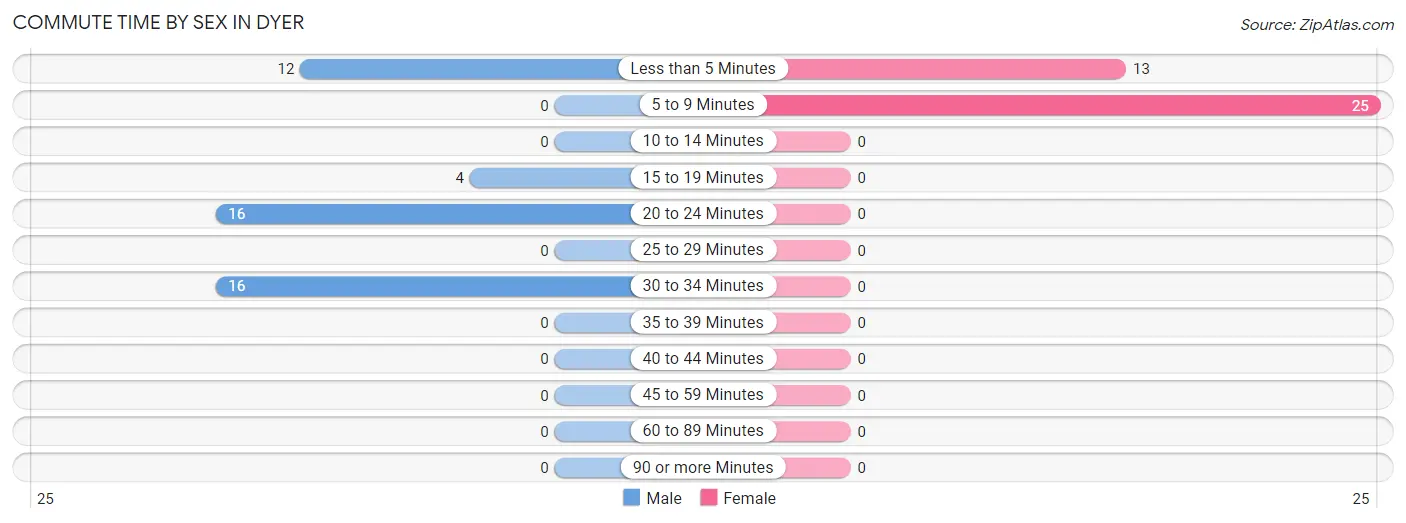
| Commute Time | Male | Female |
| Less than 5 Minutes | 12 (25.0%) | 13 (34.2%) |
| 5 to 9 Minutes | 0 (0.0%) | 25 (65.8%) |
| 10 to 14 Minutes | 0 (0.0%) | 0 (0.0%) |
| 15 to 19 Minutes | 4 (8.3%) | 0 (0.0%) |
| 20 to 24 Minutes | 16 (33.3%) | 0 (0.0%) |
| 25 to 29 Minutes | 0 (0.0%) | 0 (0.0%) |
| 30 to 34 Minutes | 16 (33.3%) | 0 (0.0%) |
| 35 to 39 Minutes | 0 (0.0%) | 0 (0.0%) |
| 40 to 44 Minutes | 0 (0.0%) | 0 (0.0%) |
| 45 to 59 Minutes | 0 (0.0%) | 0 (0.0%) |
| 60 to 89 Minutes | 0 (0.0%) | 0 (0.0%) |
| 90 or more Minutes | 0 (0.0%) | 0 (0.0%) |
Time of Departure to Work by Sex in Dyer
The most frequent times of departure to work in Dyer are 6:00 AM to 6:29 AM (22, 45.8%) for males and 7:30 AM to 7:59 AM (27, 71.1%) for females.
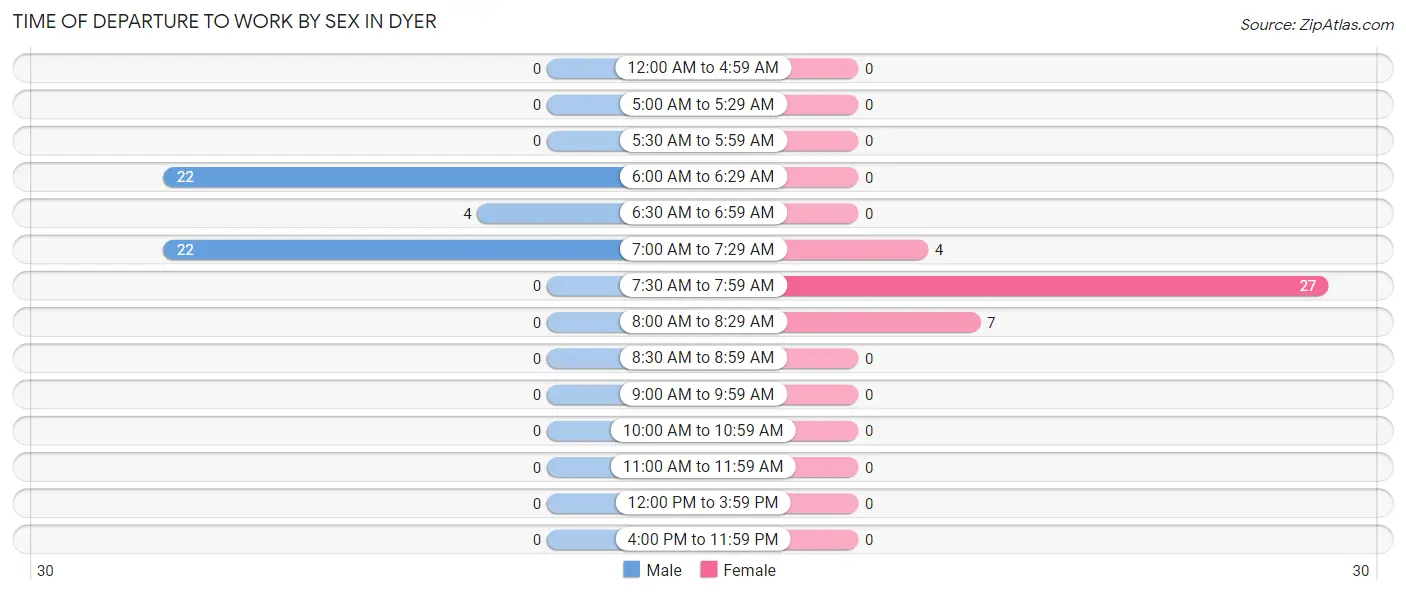
| Time of Departure | Male | Female |
| 12:00 AM to 4:59 AM | 0 (0.0%) | 0 (0.0%) |
| 5:00 AM to 5:29 AM | 0 (0.0%) | 0 (0.0%) |
| 5:30 AM to 5:59 AM | 0 (0.0%) | 0 (0.0%) |
| 6:00 AM to 6:29 AM | 22 (45.8%) | 0 (0.0%) |
| 6:30 AM to 6:59 AM | 4 (8.3%) | 0 (0.0%) |
| 7:00 AM to 7:29 AM | 22 (45.8%) | 4 (10.5%) |
| 7:30 AM to 7:59 AM | 0 (0.0%) | 27 (71.1%) |
| 8:00 AM to 8:29 AM | 0 (0.0%) | 7 (18.4%) |
| 8:30 AM to 8:59 AM | 0 (0.0%) | 0 (0.0%) |
| 9:00 AM to 9:59 AM | 0 (0.0%) | 0 (0.0%) |
| 10:00 AM to 10:59 AM | 0 (0.0%) | 0 (0.0%) |
| 11:00 AM to 11:59 AM | 0 (0.0%) | 0 (0.0%) |
| 12:00 PM to 3:59 PM | 0 (0.0%) | 0 (0.0%) |
| 4:00 PM to 11:59 PM | 0 (0.0%) | 0 (0.0%) |
| Total | 48 (100.0%) | 38 (100.0%) |
Housing Occupancy in Dyer
Occupancy by Ownership in Dyer
Of the total 143 dwellings in Dyer, owner-occupied units account for 83 (58.0%), while renter-occupied units make up 60 (42.0%).
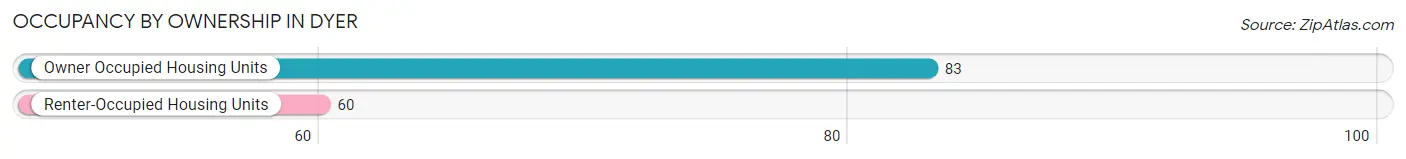
| Occupancy | # Housing Units | % Housing Units |
| Owner Occupied Housing Units | 83 | 58.0% |
| Renter-Occupied Housing Units | 60 | 42.0% |
| Total Occupied Housing Units | 143 | 100.0% |
Occupancy by Household Size in Dyer
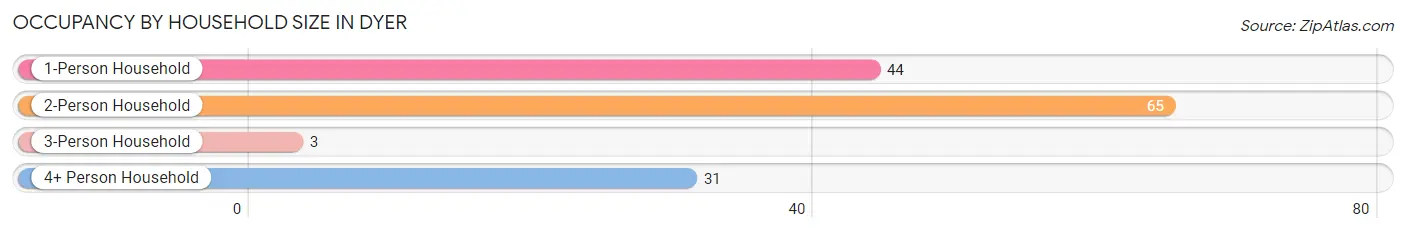
| Household Size | # Housing Units | % Housing Units |
| 1-Person Household | 44 | 30.8% |
| 2-Person Household | 65 | 45.5% |
| 3-Person Household | 3 | 2.1% |
| 4+ Person Household | 31 | 21.7% |
| Total Housing Units | 143 | 100.0% |
Occupancy by Ownership by Household Size in Dyer
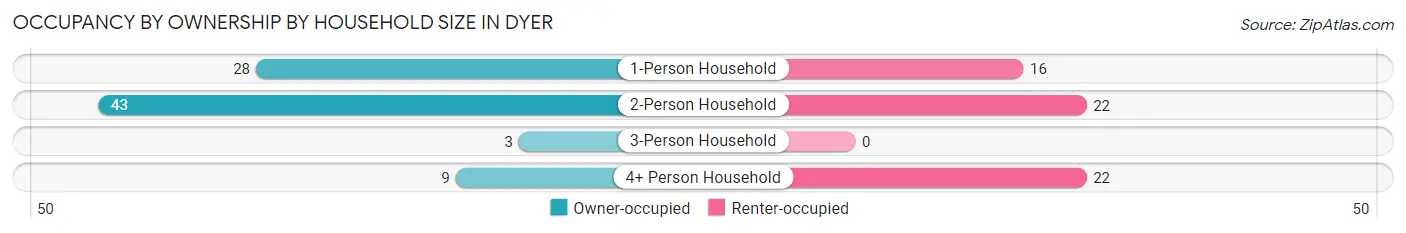
| Household Size | Owner-occupied | Renter-occupied |
| 1-Person Household | 28 (63.6%) | 16 (36.4%) |
| 2-Person Household | 43 (66.1%) | 22 (33.9%) |
| 3-Person Household | 3 (100.0%) | 0 (0.0%) |
| 4+ Person Household | 9 (29.0%) | 22 (71.0%) |
| Total Housing Units | 83 (58.0%) | 60 (42.0%) |
Occupancy by Educational Attainment in Dyer
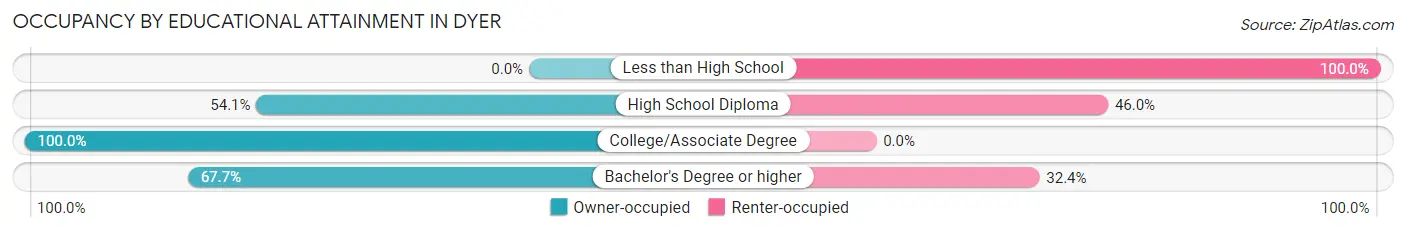
| Household Size | Owner-occupied | Renter-occupied |
| Less than High School | 0 (0.0%) | 32 (100.0%) |
| High School Diploma | 20 (54.0%) | 17 (46.0%) |
| College/Associate Degree | 40 (100.0%) | 0 (0.0%) |
| Bachelor's Degree or higher | 23 (67.6%) | 11 (32.4%) |
Occupancy by Age of Householder in Dyer
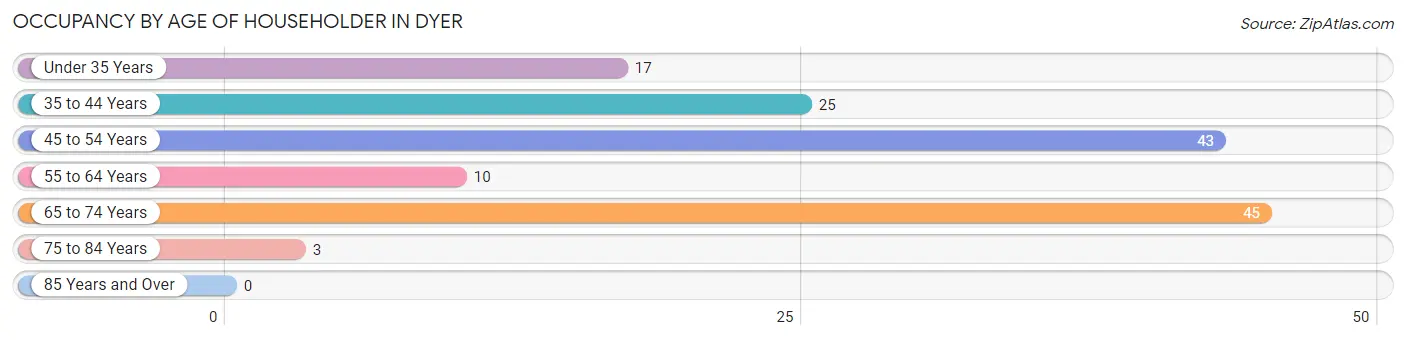
| Age Bracket | # Households | % Households |
| Under 35 Years | 17 | 11.9% |
| 35 to 44 Years | 25 | 17.5% |
| 45 to 54 Years | 43 | 30.1% |
| 55 to 64 Years | 10 | 7.0% |
| 65 to 74 Years | 45 | 31.5% |
| 75 to 84 Years | 3 | 2.1% |
| 85 Years and Over | 0 | 0.0% |
| Total | 143 | 100.0% |
Housing Finances in Dyer
Median Income by Occupancy in Dyer
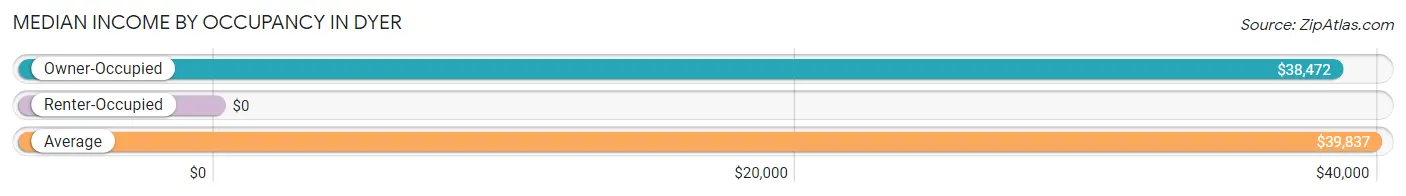
| Occupancy Type | # Households | Median Income |
| Owner-Occupied | 83 (58.0%) | $38,472 |
| Renter-Occupied | 60 (42.0%) | $0 |
| Average | 143 (100.0%) | $39,837 |
Occupancy by Householder Income Bracket in Dyer
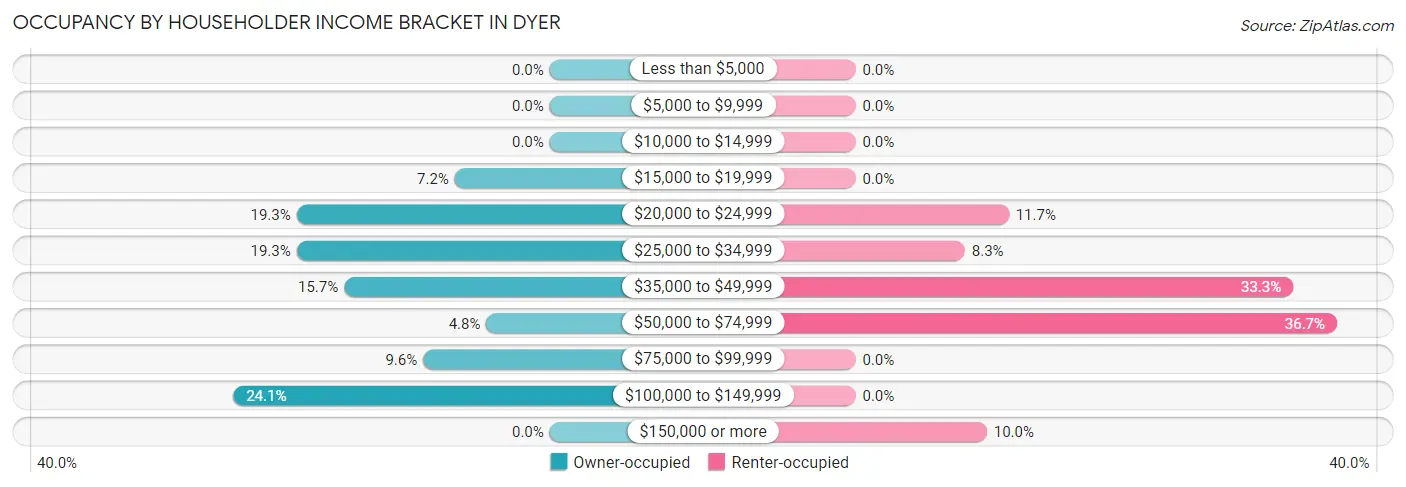
| Income Bracket | Owner-occupied | Renter-occupied |
| Less than $5,000 | 0 (0.0%) | 0 (0.0%) |
| $5,000 to $9,999 | 0 (0.0%) | 0 (0.0%) |
| $10,000 to $14,999 | 0 (0.0%) | 0 (0.0%) |
| $15,000 to $19,999 | 6 (7.2%) | 0 (0.0%) |
| $20,000 to $24,999 | 16 (19.3%) | 7 (11.7%) |
| $25,000 to $34,999 | 16 (19.3%) | 5 (8.3%) |
| $35,000 to $49,999 | 13 (15.7%) | 20 (33.3%) |
| $50,000 to $74,999 | 4 (4.8%) | 22 (36.7%) |
| $75,000 to $99,999 | 8 (9.6%) | 0 (0.0%) |
| $100,000 to $149,999 | 20 (24.1%) | 0 (0.0%) |
| $150,000 or more | 0 (0.0%) | 6 (10.0%) |
| Total | 83 (100.0%) | 60 (100.0%) |
Monthly Housing Cost Tiers in Dyer
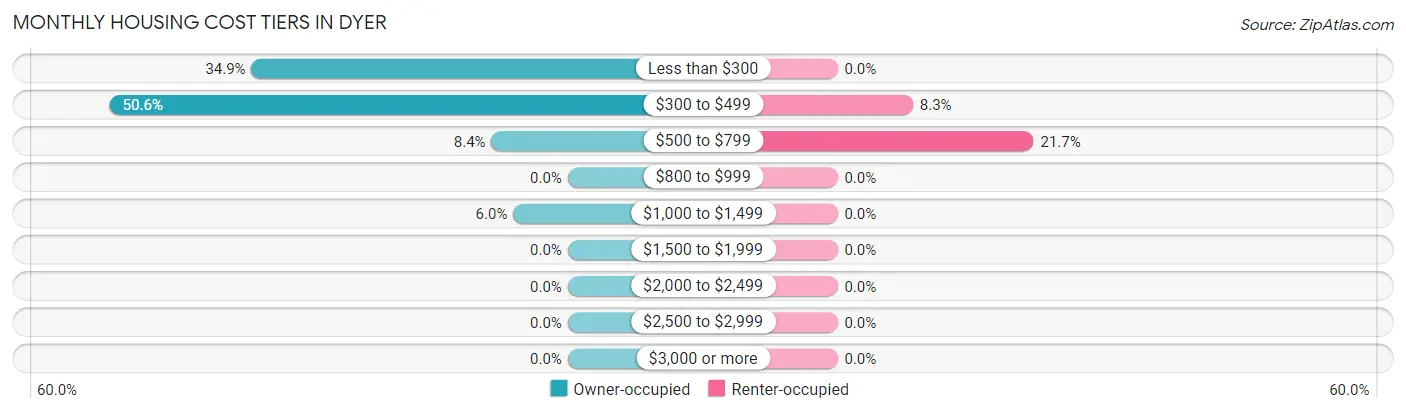
| Monthly Cost | Owner-occupied | Renter-occupied |
| Less than $300 | 29 (34.9%) | 0 (0.0%) |
| $300 to $499 | 42 (50.6%) | 5 (8.3%) |
| $500 to $799 | 7 (8.4%) | 13 (21.7%) |
| $800 to $999 | 0 (0.0%) | 0 (0.0%) |
| $1,000 to $1,499 | 5 (6.0%) | 0 (0.0%) |
| $1,500 to $1,999 | 0 (0.0%) | 0 (0.0%) |
| $2,000 to $2,499 | 0 (0.0%) | 0 (0.0%) |
| $2,500 to $2,999 | 0 (0.0%) | 0 (0.0%) |
| $3,000 or more | 0 (0.0%) | 0 (0.0%) |
| Total | 83 (100.0%) | 60 (100.0%) |
Physical Housing Characteristics in Dyer
Housing Structures in Dyer
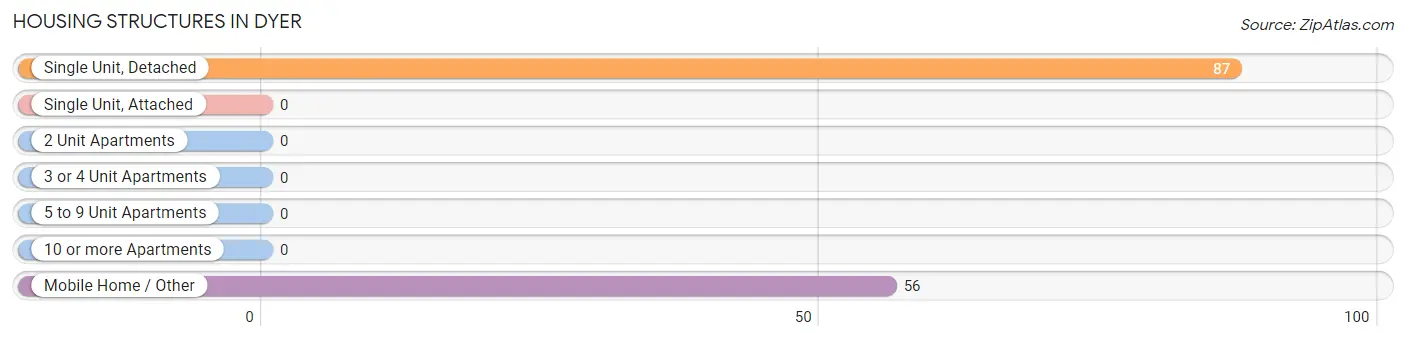
| Structure Type | # Housing Units | % Housing Units |
| Single Unit, Detached | 87 | 60.8% |
| Single Unit, Attached | 0 | 0.0% |
| 2 Unit Apartments | 0 | 0.0% |
| 3 or 4 Unit Apartments | 0 | 0.0% |
| 5 to 9 Unit Apartments | 0 | 0.0% |
| 10 or more Apartments | 0 | 0.0% |
| Mobile Home / Other | 56 | 39.2% |
| Total | 143 | 100.0% |
Housing Structures by Occupancy in Dyer
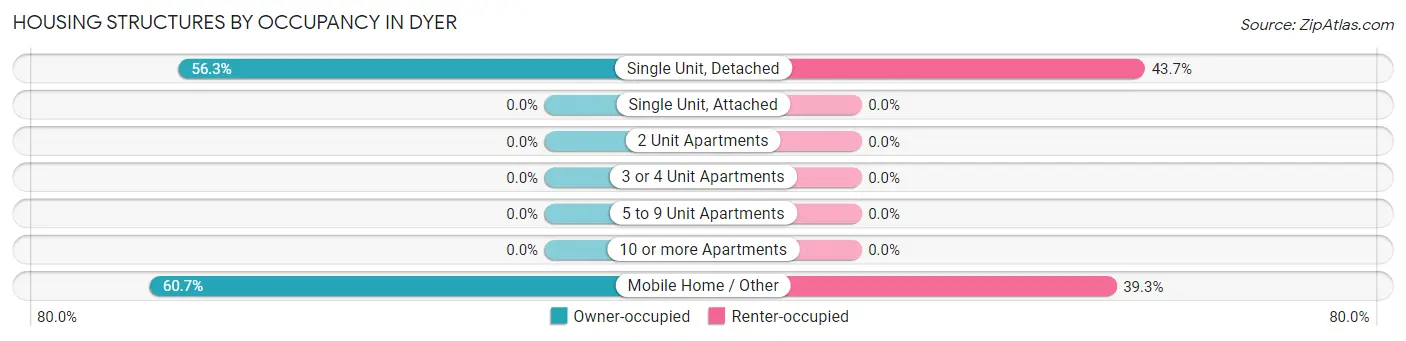
| Structure Type | Owner-occupied | Renter-occupied |
| Single Unit, Detached | 49 (56.3%) | 38 (43.7%) |
| Single Unit, Attached | 0 (0.0%) | 0 (0.0%) |
| 2 Unit Apartments | 0 (0.0%) | 0 (0.0%) |
| 3 or 4 Unit Apartments | 0 (0.0%) | 0 (0.0%) |
| 5 to 9 Unit Apartments | 0 (0.0%) | 0 (0.0%) |
| 10 or more Apartments | 0 (0.0%) | 0 (0.0%) |
| Mobile Home / Other | 34 (60.7%) | 22 (39.3%) |
| Total | 83 (58.0%) | 60 (42.0%) |
Housing Structures by Number of Rooms in Dyer
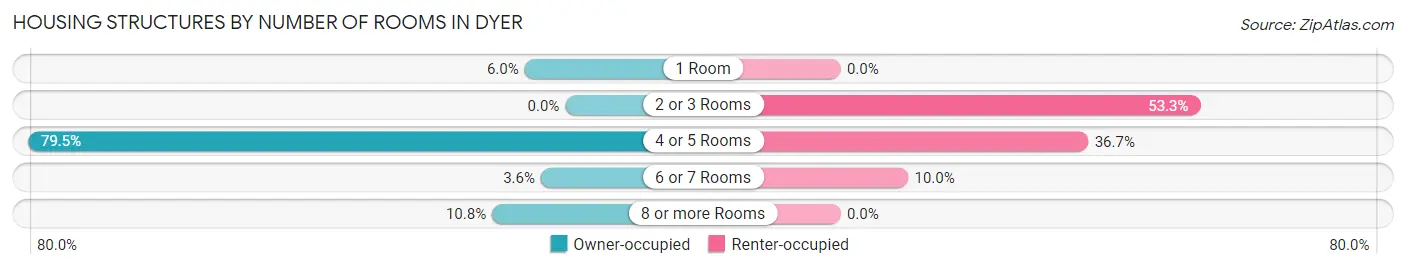
| Number of Rooms | Owner-occupied | Renter-occupied |
| 1 Room | 5 (6.0%) | 0 (0.0%) |
| 2 or 3 Rooms | 0 (0.0%) | 32 (53.3%) |
| 4 or 5 Rooms | 66 (79.5%) | 22 (36.7%) |
| 6 or 7 Rooms | 3 (3.6%) | 6 (10.0%) |
| 8 or more Rooms | 9 (10.8%) | 0 (0.0%) |
| Total | 83 (100.0%) | 60 (100.0%) |
Housing Structure by Heating Type in Dyer
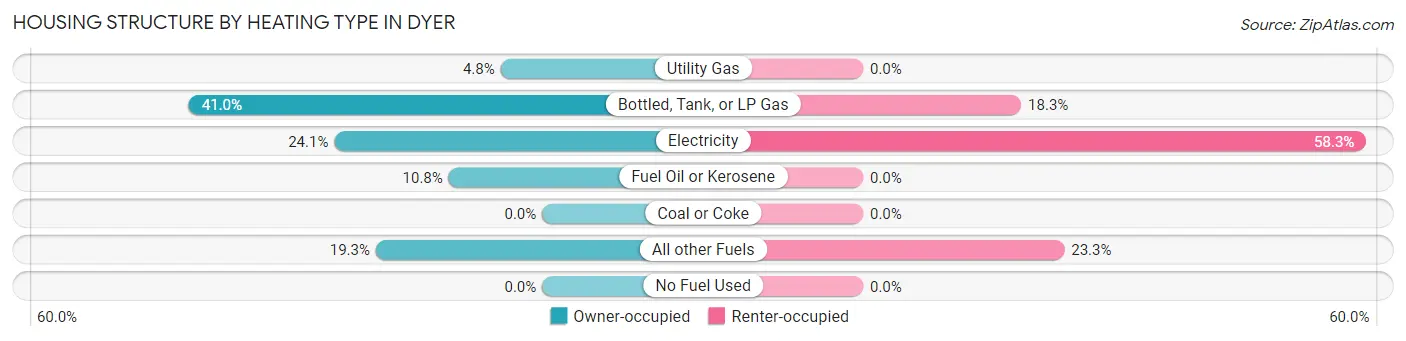
| Heating Type | Owner-occupied | Renter-occupied |
| Utility Gas | 4 (4.8%) | 0 (0.0%) |
| Bottled, Tank, or LP Gas | 34 (41.0%) | 11 (18.3%) |
| Electricity | 20 (24.1%) | 35 (58.3%) |
| Fuel Oil or Kerosene | 9 (10.8%) | 0 (0.0%) |
| Coal or Coke | 0 (0.0%) | 0 (0.0%) |
| All other Fuels | 16 (19.3%) | 14 (23.3%) |
| No Fuel Used | 0 (0.0%) | 0 (0.0%) |
| Total | 83 (100.0%) | 60 (100.0%) |
Household Vehicle Usage in Dyer
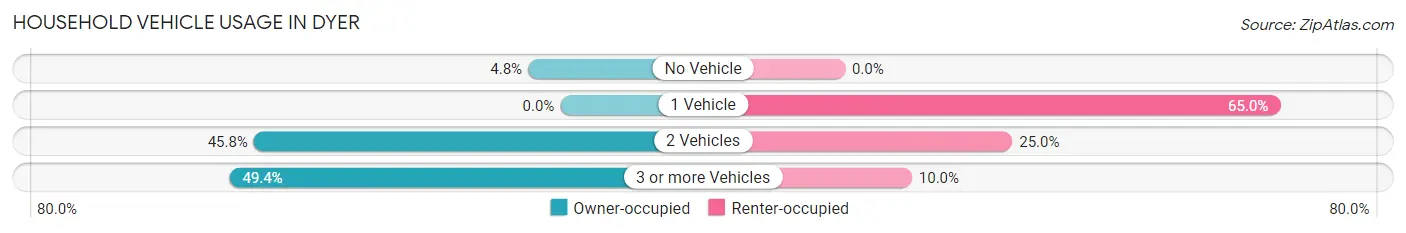
| Vehicles per Household | Owner-occupied | Renter-occupied |
| No Vehicle | 4 (4.8%) | 0 (0.0%) |
| 1 Vehicle | 0 (0.0%) | 39 (65.0%) |
| 2 Vehicles | 38 (45.8%) | 15 (25.0%) |
| 3 or more Vehicles | 41 (49.4%) | 6 (10.0%) |
| Total | 83 (100.0%) | 60 (100.0%) |
Real Estate & Mortgages in Dyer
Real Estate and Mortgage Overview in Dyer
| Characteristic | Without Mortgage | With Mortgage |
| Housing Units | 78 | 5 |
| Median Property Value | $102,600 | $0 |
| Median Household Income | $37,778 | $0 |
| Monthly Housing Costs | $359 | $0 |
| Real Estate Taxes | $585 | $0 |
Property Value by Mortgage Status in Dyer
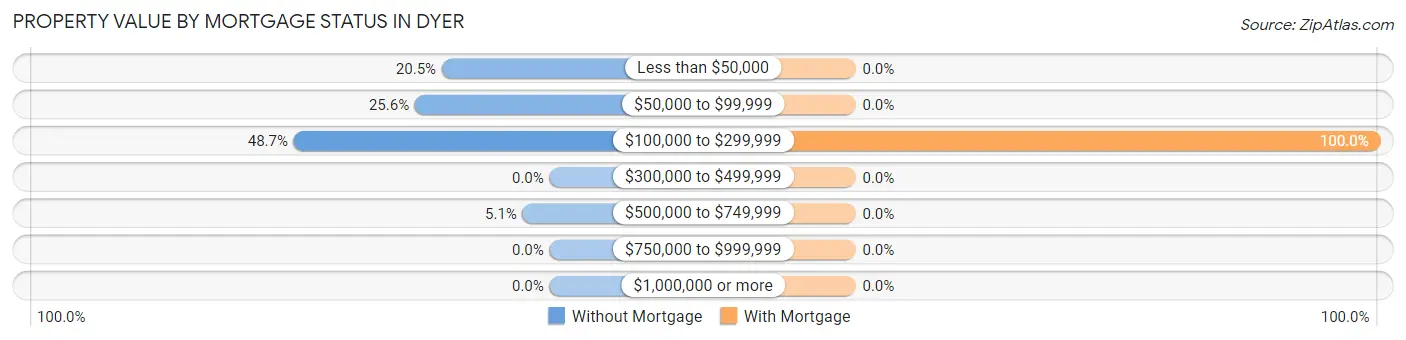
| Property Value | Without Mortgage | With Mortgage |
| Less than $50,000 | 16 (20.5%) | 0 (0.0%) |
| $50,000 to $99,999 | 20 (25.6%) | 0 (0.0%) |
| $100,000 to $299,999 | 38 (48.7%) | 5 (100.0%) |
| $300,000 to $499,999 | 0 (0.0%) | 0 (0.0%) |
| $500,000 to $749,999 | 4 (5.1%) | 0 (0.0%) |
| $750,000 to $999,999 | 0 (0.0%) | 0 (0.0%) |
| $1,000,000 or more | 0 (0.0%) | 0 (0.0%) |
| Total | 78 (100.0%) | 5 (100.0%) |
Household Income by Mortgage Status in Dyer
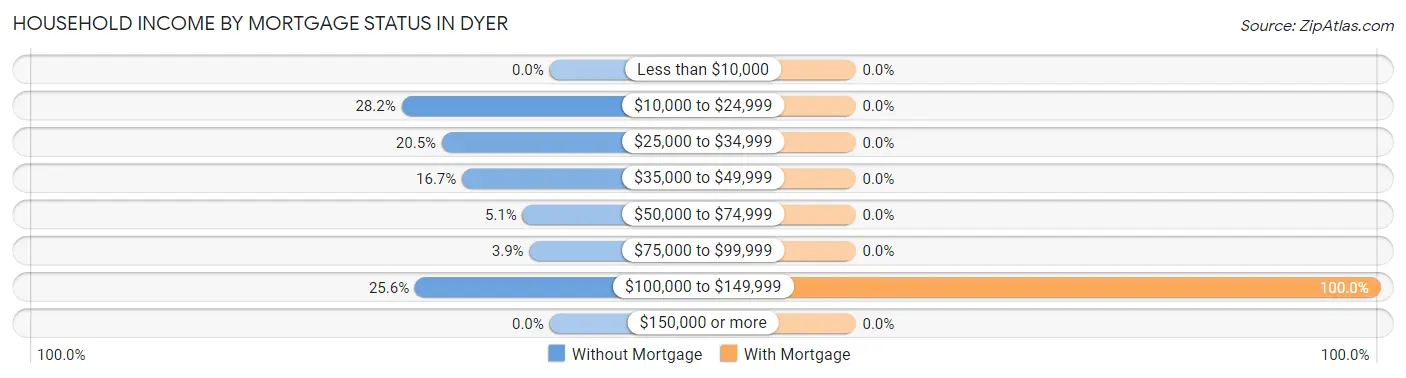
| Household Income | Without Mortgage | With Mortgage |
| Less than $10,000 | 0 (0.0%) | 0 (0.0%) |
| $10,000 to $24,999 | 22 (28.2%) | 0 (0.0%) |
| $25,000 to $34,999 | 16 (20.5%) | 0 (0.0%) |
| $35,000 to $49,999 | 13 (16.7%) | 0 (0.0%) |
| $50,000 to $74,999 | 4 (5.1%) | 0 (0.0%) |
| $75,000 to $99,999 | 3 (3.8%) | 0 (0.0%) |
| $100,000 to $149,999 | 20 (25.6%) | 5 (100.0%) |
| $150,000 or more | 0 (0.0%) | 0 (0.0%) |
| Total | 78 (100.0%) | 5 (100.0%) |
Property Value to Household Income Ratio in Dyer
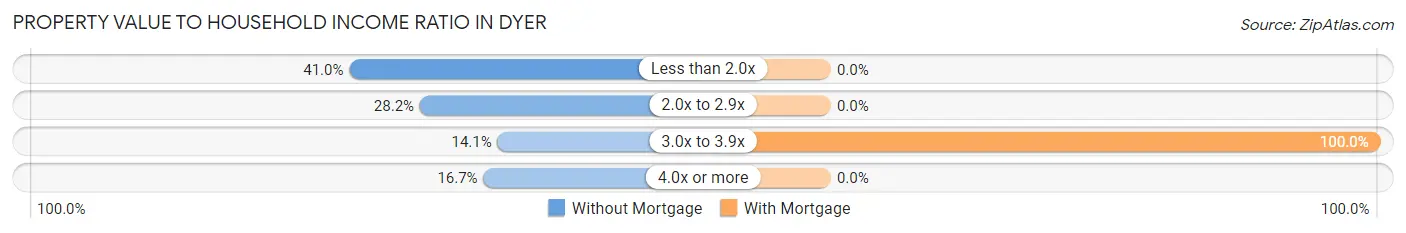
| Value-to-Income Ratio | Without Mortgage | With Mortgage |
| Less than 2.0x | 32 (41.0%) | 0 (0.0%) |
| 2.0x to 2.9x | 22 (28.2%) | 0 (0.0%) |
| 3.0x to 3.9x | 11 (14.1%) | 5 (100.0%) |
| 4.0x or more | 13 (16.7%) | 0 (0.0%) |
| Total | 78 (100.0%) | 5 (100.0%) |
Real Estate Taxes by Mortgage Status in Dyer
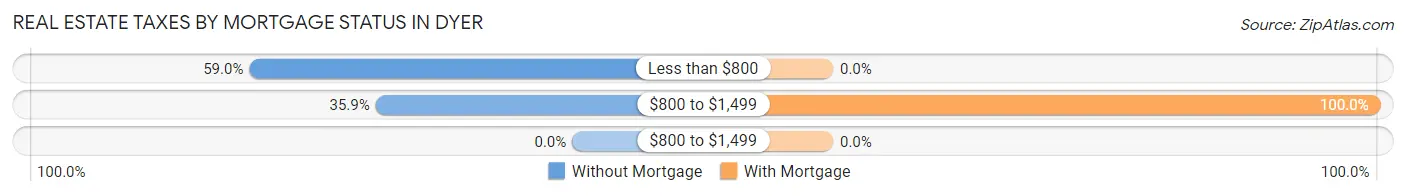
| Property Taxes | Without Mortgage | With Mortgage |
| Less than $800 | 46 (59.0%) | 0 (0.0%) |
| $800 to $1,499 | 28 (35.9%) | 5 (100.0%) |
| $800 to $1,499 | 0 (0.0%) | 0 (0.0%) |
| Total | 78 (100.0%) | 5 (100.0%) |
Health & Disability in Dyer
Health Insurance Coverage by Age in Dyer
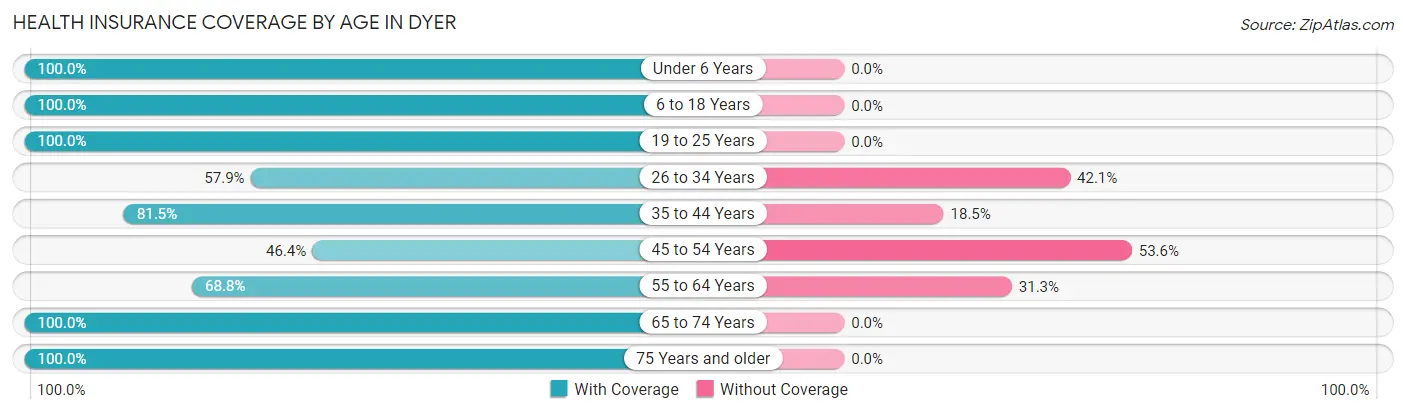
| Age Bracket | With Coverage | Without Coverage |
| Under 6 Years | 26 (100.0%) | 0 (0.0%) |
| 6 to 18 Years | 45 (100.0%) | 0 (0.0%) |
| 19 to 25 Years | 10 (100.0%) | 0 (0.0%) |
| 26 to 34 Years | 22 (57.9%) | 16 (42.1%) |
| 35 to 44 Years | 44 (81.5%) | 10 (18.5%) |
| 45 to 54 Years | 32 (46.4%) | 37 (53.6%) |
| 55 to 64 Years | 22 (68.8%) | 10 (31.2%) |
| 65 to 74 Years | 45 (100.0%) | 0 (0.0%) |
| 75 Years and older | 24 (100.0%) | 0 (0.0%) |
| Total | 270 (78.7%) | 73 (21.3%) |
Health Insurance Coverage by Citizenship Status in Dyer
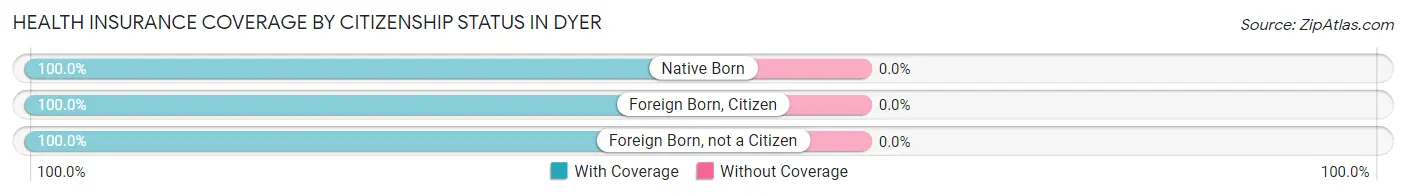
| Citizenship Status | With Coverage | Without Coverage |
| Native Born | 26 (100.0%) | 0 (0.0%) |
| Foreign Born, Citizen | 45 (100.0%) | 0 (0.0%) |
| Foreign Born, not a Citizen | 10 (100.0%) | 0 (0.0%) |
Health Insurance Coverage by Household Income in Dyer
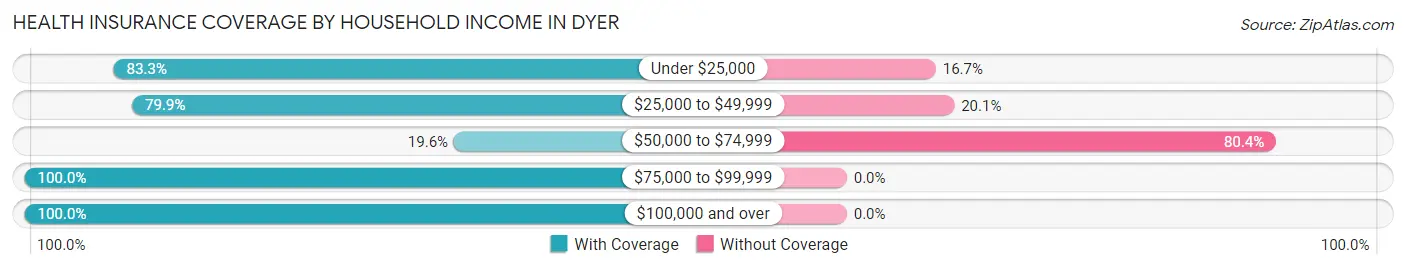
| Household Income | With Coverage | Without Coverage |
| Under $25,000 | 30 (83.3%) | 6 (16.7%) |
| $25,000 to $49,999 | 119 (79.9%) | 30 (20.1%) |
| $50,000 to $74,999 | 9 (19.6%) | 37 (80.4%) |
| $75,000 to $99,999 | 22 (100.0%) | 0 (0.0%) |
| $100,000 and over | 90 (100.0%) | 0 (0.0%) |
Public vs Private Health Insurance Coverage by Age in Dyer
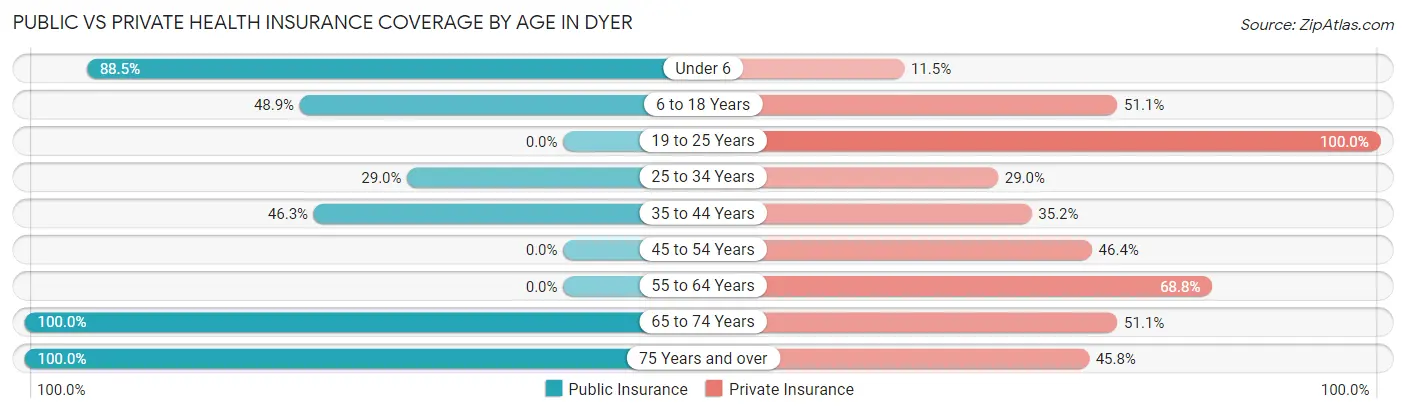
| Age Bracket | Public Insurance | Private Insurance |
| Under 6 | 23 (88.5%) | 3 (11.5%) |
| 6 to 18 Years | 22 (48.9%) | 23 (51.1%) |
| 19 to 25 Years | 0 (0.0%) | 10 (100.0%) |
| 25 to 34 Years | 11 (28.9%) | 11 (28.9%) |
| 35 to 44 Years | 25 (46.3%) | 19 (35.2%) |
| 45 to 54 Years | 0 (0.0%) | 32 (46.4%) |
| 55 to 64 Years | 0 (0.0%) | 22 (68.8%) |
| 65 to 74 Years | 45 (100.0%) | 23 (51.1%) |
| 75 Years and over | 24 (100.0%) | 11 (45.8%) |
| Total | 150 (43.7%) | 154 (44.9%) |
Disability Status by Sex by Age in Dyer
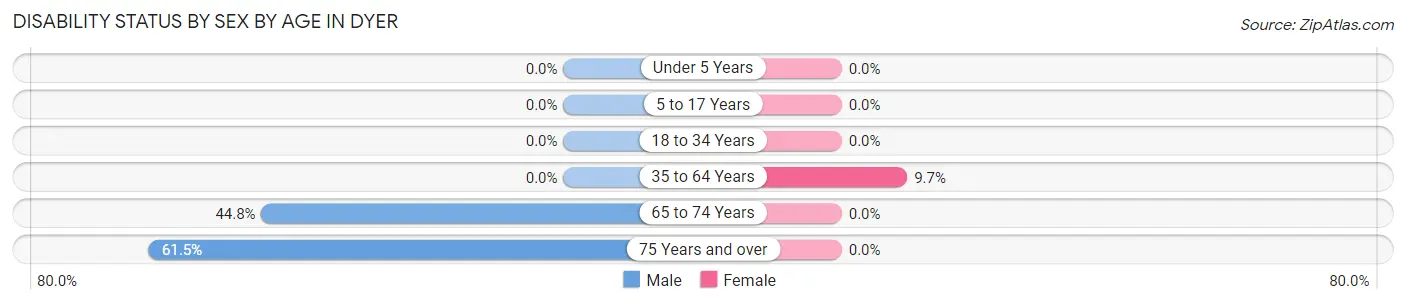
| Age Bracket | Male | Female |
| Under 5 Years | 0 (0.0%) | 0 (0.0%) |
| 5 to 17 Years | 0 (0.0%) | 0 (0.0%) |
| 18 to 34 Years | 0 (0.0%) | 0 (0.0%) |
| 35 to 64 Years | 0 (0.0%) | 7 (9.7%) |
| 65 to 74 Years | 13 (44.8%) | 0 (0.0%) |
| 75 Years and over | 8 (61.5%) | 0 (0.0%) |
Disability Class by Sex by Age in Dyer
Disability Class: Hearing Difficulty
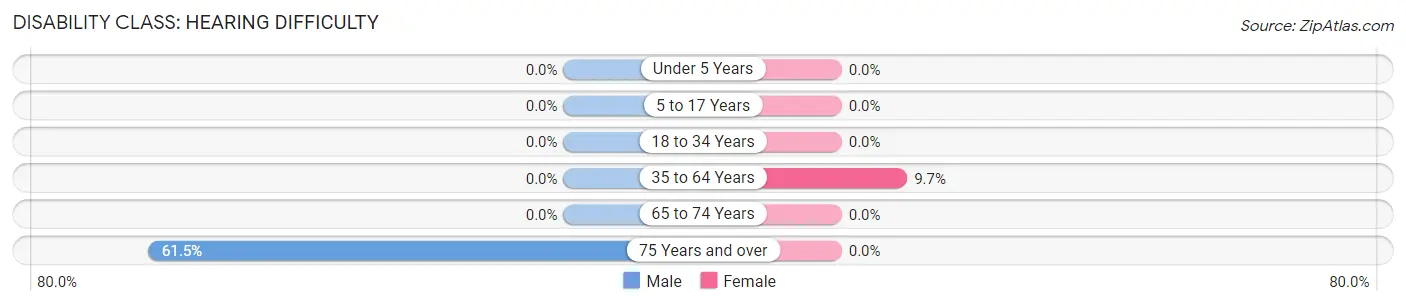
| Age Bracket | Male | Female |
| Under 5 Years | 0 (0.0%) | 0 (0.0%) |
| 5 to 17 Years | 0 (0.0%) | 0 (0.0%) |
| 18 to 34 Years | 0 (0.0%) | 0 (0.0%) |
| 35 to 64 Years | 0 (0.0%) | 7 (9.7%) |
| 65 to 74 Years | 0 (0.0%) | 0 (0.0%) |
| 75 Years and over | 8 (61.5%) | 0 (0.0%) |
Disability Class: Vision Difficulty
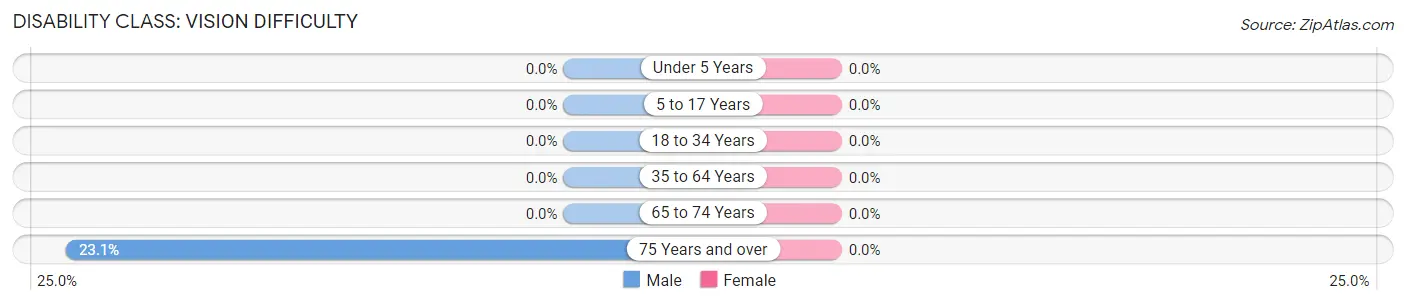
| Age Bracket | Male | Female |
| Under 5 Years | 0 (0.0%) | 0 (0.0%) |
| 5 to 17 Years | 0 (0.0%) | 0 (0.0%) |
| 18 to 34 Years | 0 (0.0%) | 0 (0.0%) |
| 35 to 64 Years | 0 (0.0%) | 0 (0.0%) |
| 65 to 74 Years | 0 (0.0%) | 0 (0.0%) |
| 75 Years and over | 3 (23.1%) | 0 (0.0%) |
Disability Class: Cognitive Difficulty
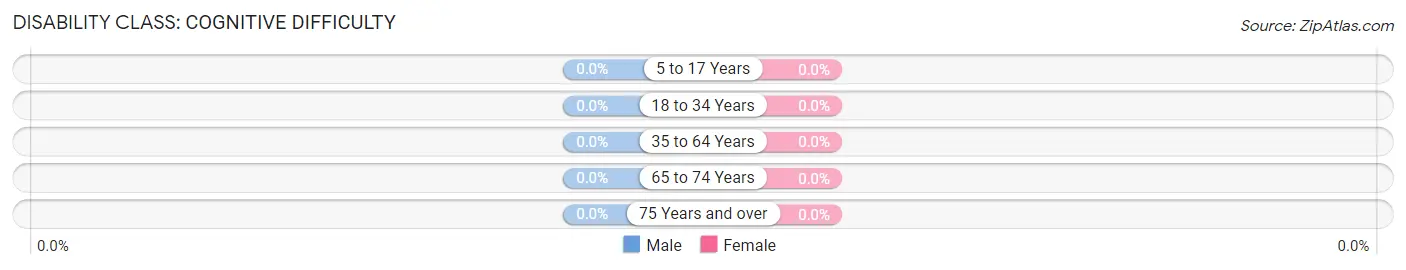
| Age Bracket | Male | Female |
| 5 to 17 Years | 0 (0.0%) | 0 (0.0%) |
| 18 to 34 Years | 0 (0.0%) | 0 (0.0%) |
| 35 to 64 Years | 0 (0.0%) | 0 (0.0%) |
| 65 to 74 Years | 0 (0.0%) | 0 (0.0%) |
| 75 Years and over | 0 (0.0%) | 0 (0.0%) |
Disability Class: Ambulatory Difficulty
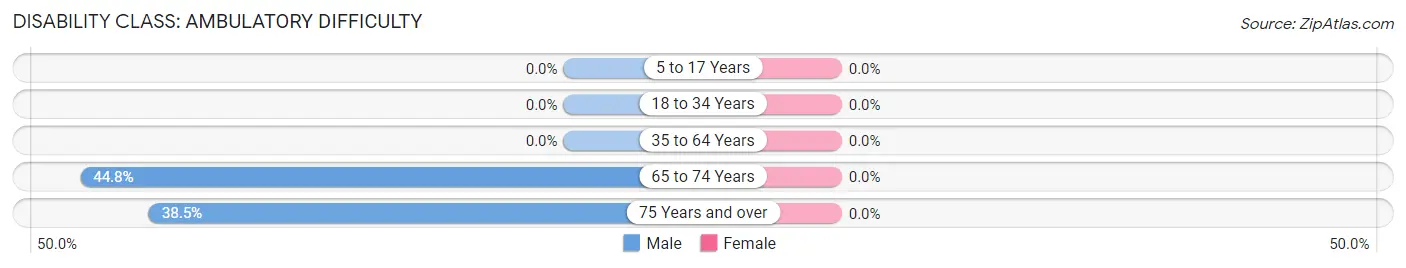
| Age Bracket | Male | Female |
| 5 to 17 Years | 0 (0.0%) | 0 (0.0%) |
| 18 to 34 Years | 0 (0.0%) | 0 (0.0%) |
| 35 to 64 Years | 0 (0.0%) | 0 (0.0%) |
| 65 to 74 Years | 13 (44.8%) | 0 (0.0%) |
| 75 Years and over | 5 (38.5%) | 0 (0.0%) |
Disability Class: Self-Care Difficulty
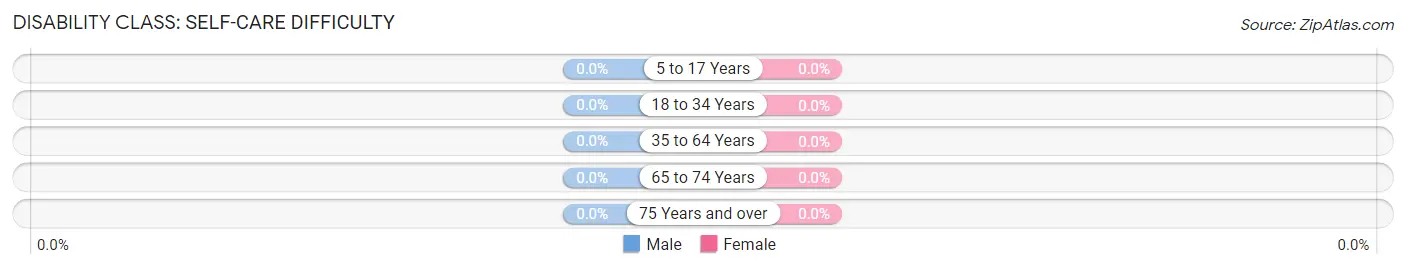
| Age Bracket | Male | Female |
| 5 to 17 Years | 0 (0.0%) | 0 (0.0%) |
| 18 to 34 Years | 0 (0.0%) | 0 (0.0%) |
| 35 to 64 Years | 0 (0.0%) | 0 (0.0%) |
| 65 to 74 Years | 0 (0.0%) | 0 (0.0%) |
| 75 Years and over | 0 (0.0%) | 0 (0.0%) |
Technology Access in Dyer
Computing Device Access in Dyer
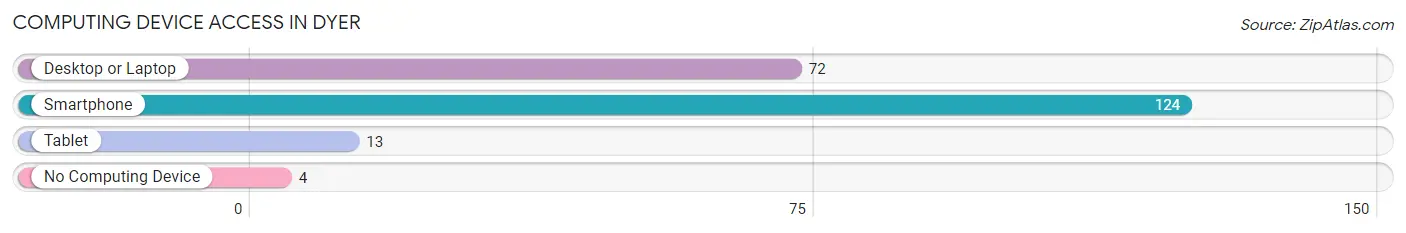
| Device Type | # Households | % Households |
| Desktop or Laptop | 72 | 50.3% |
| Smartphone | 124 | 86.7% |
| Tablet | 13 | 9.1% |
| No Computing Device | 4 | 2.8% |
| Total | 143 | 100.0% |
Internet Access in Dyer
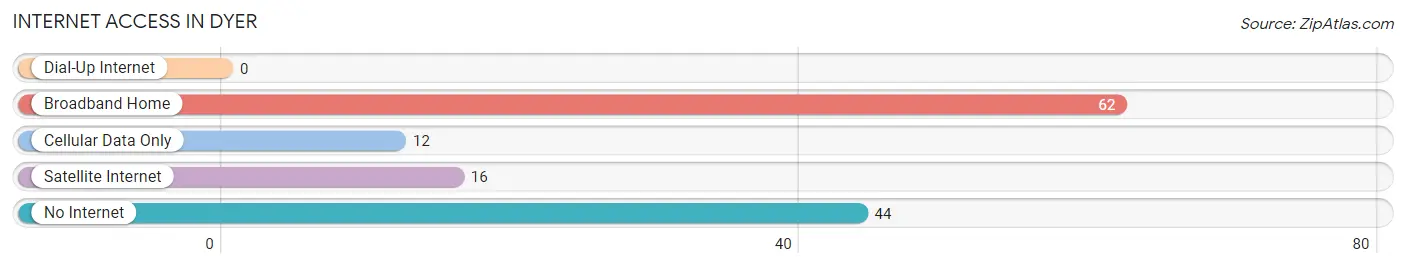
| Internet Type | # Households | % Households |
| Dial-Up Internet | 0 | 0.0% |
| Broadband Home | 62 | 43.4% |
| Cellular Data Only | 12 | 8.4% |
| Satellite Internet | 16 | 11.2% |
| No Internet | 44 | 30.8% |
| Total | 143 | 100.0% |
Dyer Summary
Dyer is an unincorporated town located in Nye County, Nevada, United States. It is situated in the northern part of the state, approximately 80 miles northwest of Las Vegas. The town was founded in 1883 and is named after the first postmaster, William Dyer. The population of Dyer was estimated to be around 200 in 2020.
Geography
Dyer is located in the northern part of Nye County, Nevada, approximately 80 miles northwest of Las Vegas. The town is situated in a desert valley surrounded by mountains. The nearest major city is Tonopah, which is located about 40 miles to the south. The town is located at an elevation of 4,890 feet above sea level.
The climate in Dyer is generally dry and hot, with temperatures ranging from the mid-90s in the summer to the mid-30s in the winter. The area receives an average of 8 inches of precipitation per year, with most of it falling in the form of snow in the winter months.
Economy
The economy of Dyer is largely based on tourism and mining. The town is home to several tourist attractions, including the Dyer Mine, which is a former gold mine that is now open to the public for tours. The town also has a few restaurants, bars, and other businesses that cater to tourists.
The town is also home to several mining operations, including the Dyer Mine, which is a gold mine that is still in operation. The mine is owned by the Dyer Mining Company, which is a subsidiary of the Newmont Mining Corporation. The mine produces gold, silver, and copper.
Demographics
The population of Dyer was estimated to be around 200 in 2020. The town is predominantly white, with the majority of the population being of European descent. The town also has a small Hispanic population, as well as a few Native American residents.
The median household income in Dyer is $37,500, which is slightly lower than the national average. The median home value is $125,000, which is also lower than the national average. The town has a high poverty rate, with nearly 25% of the population living below the poverty line.
History
Dyer was founded in 1883 and was named after the first postmaster, William Dyer. The town was originally a mining camp, and the Dyer Mine was one of the first gold mines in the area. The mine was in operation until the early 1900s, when it was closed due to a lack of ore.
The town experienced a brief period of growth in the early 1900s, when it became a stop on the Tonopah and Tidewater Railroad. The railroad was eventually abandoned in the 1940s, and the town's population began to decline.
In recent years, the town has seen a resurgence in tourism due to its proximity to Las Vegas. The town is home to several tourist attractions, including the Dyer Mine, which is open to the public for tours. The town also has a few restaurants, bars, and other businesses that cater to tourists.
Common Questions
What is Per Capita Income in Dyer?
Per Capita income in Dyer is $26,022.
What is the Median Family Income in Dyer?
Median Family Income in Dyer is $70,739.
What is the Median Household income in Dyer?
Median Household Income in Dyer is $39,837.
What is Inequality or Gini Index in Dyer?
Inequality or Gini Index in Dyer is 0.36.
What is the Total Population of Dyer?
Total Population of Dyer is 343.
What is the Total Male Population of Dyer?
Total Male Population of Dyer is 180.
What is the Total Female Population of Dyer?
Total Female Population of Dyer is 163.
What is the Ratio of Males per 100 Females in Dyer?
There are 110.43 Males per 100 Females in Dyer.
What is the Ratio of Females per 100 Males in Dyer?
There are 90.56 Females per 100 Males in Dyer.
What is the Median Population Age in Dyer?
Median Population Age in Dyer is 44.8 Years.
What is the Average Family Size in Dyer
Average Family Size in Dyer is 3.0 People.
What is the Average Household Size in Dyer
Average Household Size in Dyer is 2.4 People.
How Large is the Labor Force in Dyer?
There are 144 People in the Labor Forcein in Dyer.
What is the Percentage of People in the Labor Force in Dyer?
52.9% of People are in the Labor Force in Dyer.