Alamo, NV Map & Demographics
Alamo Map
Alamo Overview
$30,120
PER CAPITA INCOME
$62,778
AVG FAMILY INCOME
$65,083
AVG HOUSEHOLD INCOME
60.2%
WAGE / INCOME GAP [ % ]
39.8¢/ $1
WAGE / INCOME GAP [ $ ]
0.26
INEQUALITY / GINI INDEX
1,019
TOTAL POPULATION
596
MALE POPULATION
423
FEMALE POPULATION
140.90
MALES / 100 FEMALES
70.97
FEMALES / 100 MALES
31.1
MEDIAN AGE
3.2
AVG FAMILY SIZE
2.7
AVG HOUSEHOLD SIZE
433
LABOR FORCE [ PEOPLE ]
61.1%
PERCENT IN LABOR FORCE
Alamo Zip Codes
Alamo Area Codes
Income in Alamo
Income Overview in Alamo
Per Capita Income in Alamo is $30,120, while median incomes of families and households are $62,778 and $65,083 respectively.
| Characteristic | Number | Measure |
| Per Capita Income | 1,019 | $30,120 |
| Median Family Income | 260 | $62,778 |
| Mean Family Income | 260 | $75,568 |
| Median Household Income | 378 | $65,083 |
| Mean Household Income | 378 | $72,428 |
| Income Deficit | 260 | $0 |
| Wage / Income Gap (%) | 1,019 | 60.16% |
| Wage / Income Gap ($) | 1,019 | 39.84¢ per $1 |
| Gini / Inequality Index | 1,019 | 0.26 |
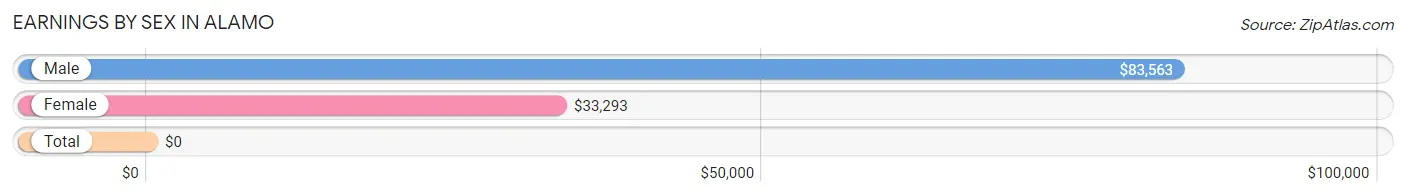
Earnings by Sex in Alamo
| Sex | Number | Average Earnings |
| Male | 202 (46.7%) | $83,563 |
| Female | 231 (53.3%) | $33,293 |
| Total | 433 (100.0%) | $0 |
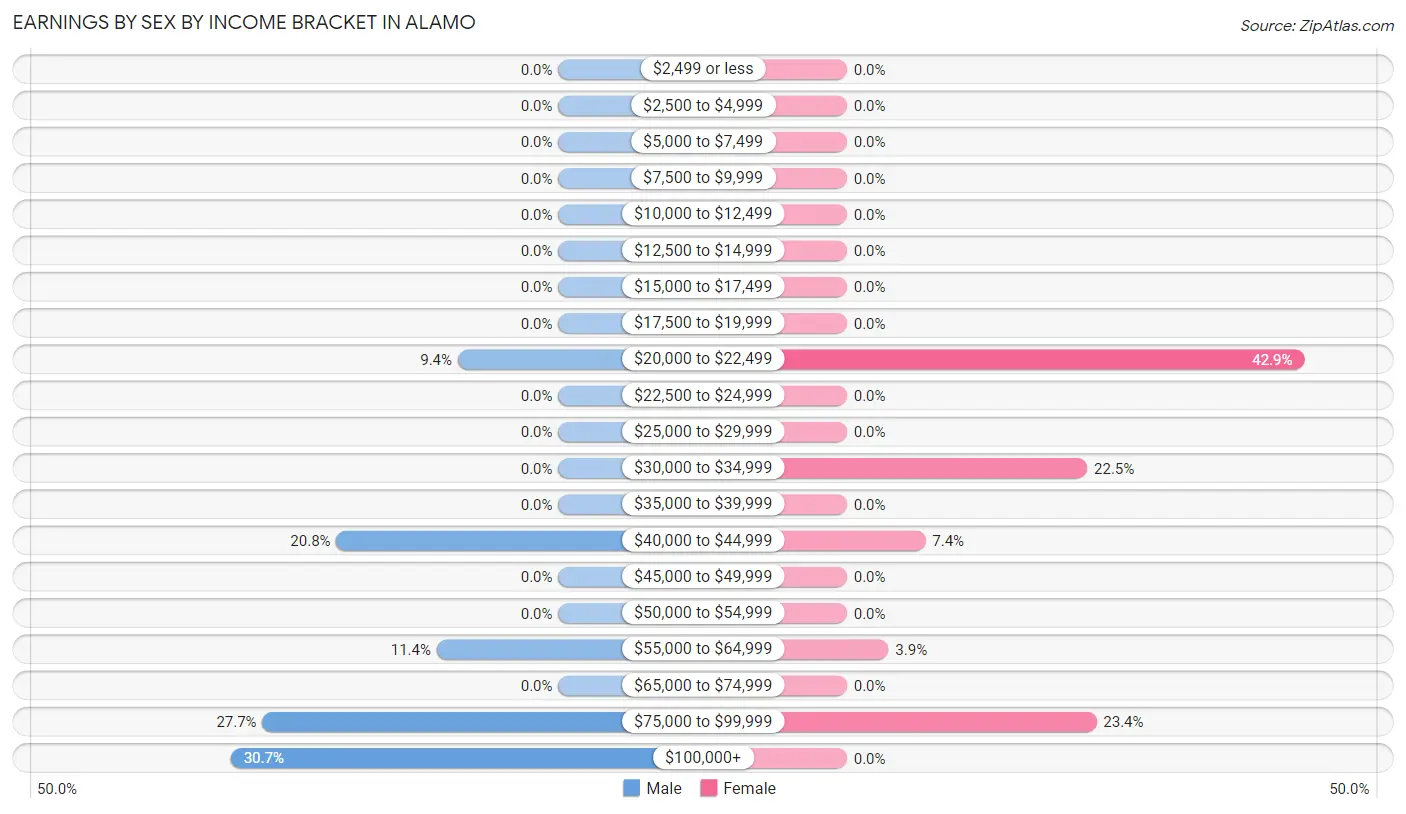
Earnings by Sex by Income Bracket in Alamo
The most common earnings brackets in Alamo are $100,000+ for men (62 | 30.7%) and $20,000 to $22,499 for women (99 | 42.9%).
| Income | Male | Female |
| $2,499 or less | 0 (0.0%) | 0 (0.0%) |
| $2,500 to $4,999 | 0 (0.0%) | 0 (0.0%) |
| $5,000 to $7,499 | 0 (0.0%) | 0 (0.0%) |
| $7,500 to $9,999 | 0 (0.0%) | 0 (0.0%) |
| $10,000 to $12,499 | 0 (0.0%) | 0 (0.0%) |
| $12,500 to $14,999 | 0 (0.0%) | 0 (0.0%) |
| $15,000 to $17,499 | 0 (0.0%) | 0 (0.0%) |
| $17,500 to $19,999 | 0 (0.0%) | 0 (0.0%) |
| $20,000 to $22,499 | 19 (9.4%) | 99 (42.9%) |
| $22,500 to $24,999 | 0 (0.0%) | 0 (0.0%) |
| $25,000 to $29,999 | 0 (0.0%) | 0 (0.0%) |
| $30,000 to $34,999 | 0 (0.0%) | 52 (22.5%) |
| $35,000 to $39,999 | 0 (0.0%) | 0 (0.0%) |
| $40,000 to $44,999 | 42 (20.8%) | 17 (7.4%) |
| $45,000 to $49,999 | 0 (0.0%) | 0 (0.0%) |
| $50,000 to $54,999 | 0 (0.0%) | 0 (0.0%) |
| $55,000 to $64,999 | 23 (11.4%) | 9 (3.9%) |
| $65,000 to $74,999 | 0 (0.0%) | 0 (0.0%) |
| $75,000 to $99,999 | 56 (27.7%) | 54 (23.4%) |
| $100,000+ | 62 (30.7%) | 0 (0.0%) |
| Total | 202 (100.0%) | 231 (100.0%) |
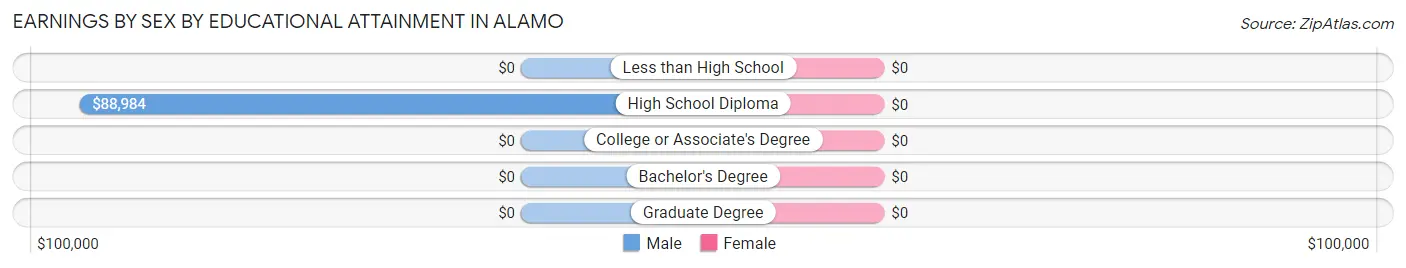
Earnings by Sex by Educational Attainment in Alamo
| Educational Attainment | Male Income | Female Income |
| Less than High School | - | - |
| High School Diploma | $88,984 | $0 |
| College or Associate's Degree | - | - |
| Bachelor's Degree | - | - |
| Graduate Degree | - | - |
| Total | $84,156 | $34,014 |
Family Income in Alamo
Family Income Brackets in Alamo
According to the Alamo family income data, there are 127 families falling into the $35,000 to $49,999 income range, which is the most common income bracket and makes up 48.8% of all families.
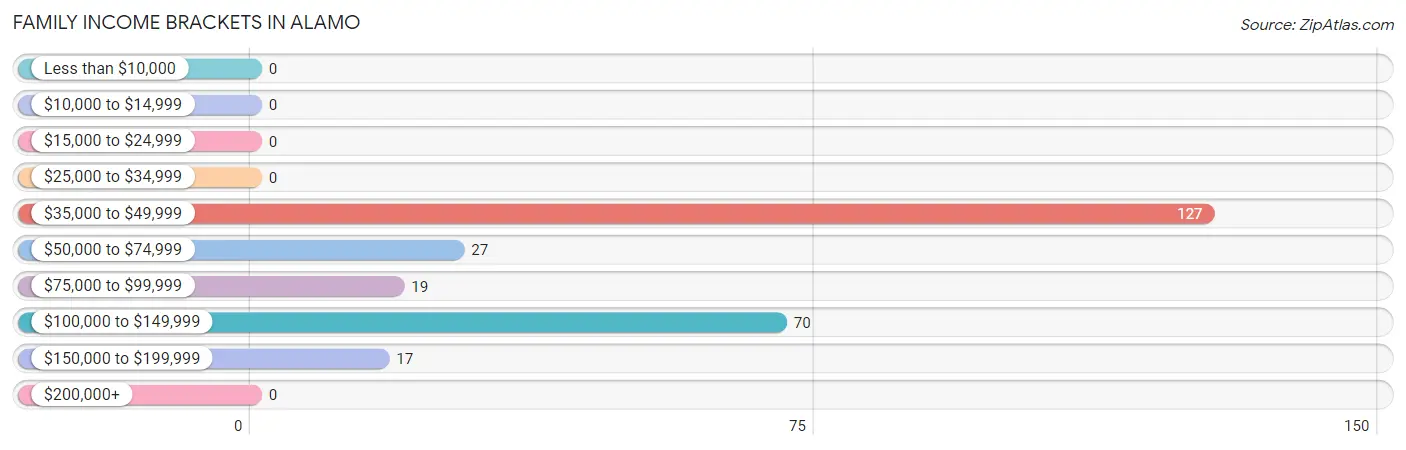
| Income Bracket | # Families | % Families |
| Less than $10,000 | 0 | 0.0% |
| $10,000 to $14,999 | 0 | 0.0% |
| $15,000 to $24,999 | 0 | 0.0% |
| $25,000 to $34,999 | 0 | 0.0% |
| $35,000 to $49,999 | 127 | 48.8% |
| $50,000 to $74,999 | 27 | 10.4% |
| $75,000 to $99,999 | 19 | 7.3% |
| $100,000 to $149,999 | 70 | 26.9% |
| $150,000 to $199,999 | 17 | 6.5% |
| $200,000+ | 0 | 0.0% |
Family Income by Famaliy Size in Alamo
| Income Bracket | # Families | Median Income |
| 2-Person Families | 69 (26.5%) | $0 |
| 3-Person Families | 131 (50.4%) | $0 |
| 4-Person Families | 60 (23.1%) | $0 |
| 5-Person Families | 0 (0.0%) | $0 |
| 6-Person Families | 0 (0.0%) | $0 |
| 7+ Person Families | 0 (0.0%) | $0 |
| Total | 260 (100.0%) | $62,778 |
Family Income by Number of Earners in Alamo
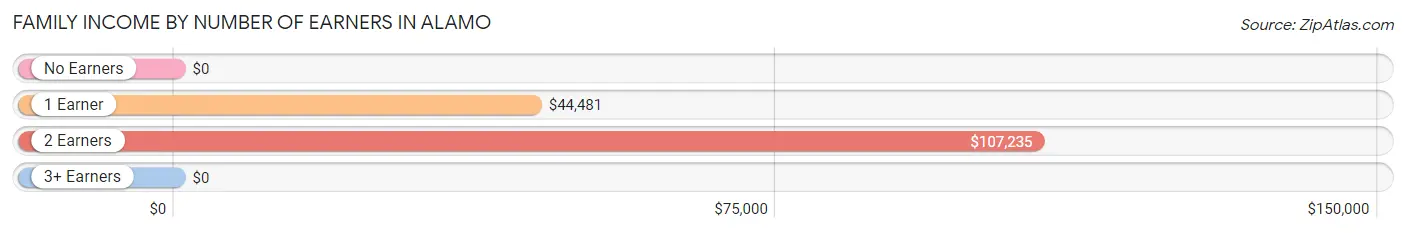
| Number of Earners | # Families | Median Income |
| No Earners | 52 (20.0%) | $0 |
| 1 Earner | 149 (57.3%) | $44,481 |
| 2 Earners | 59 (22.7%) | $107,235 |
| 3+ Earners | 0 (0.0%) | $0 |
| Total | 260 (100.0%) | $62,778 |
Household Income in Alamo
Household Income Brackets in Alamo
With 148 households falling in the category, the $35,000 to $49,999 income range is the most frequent in Alamo, accounting for 39.2% of all households.
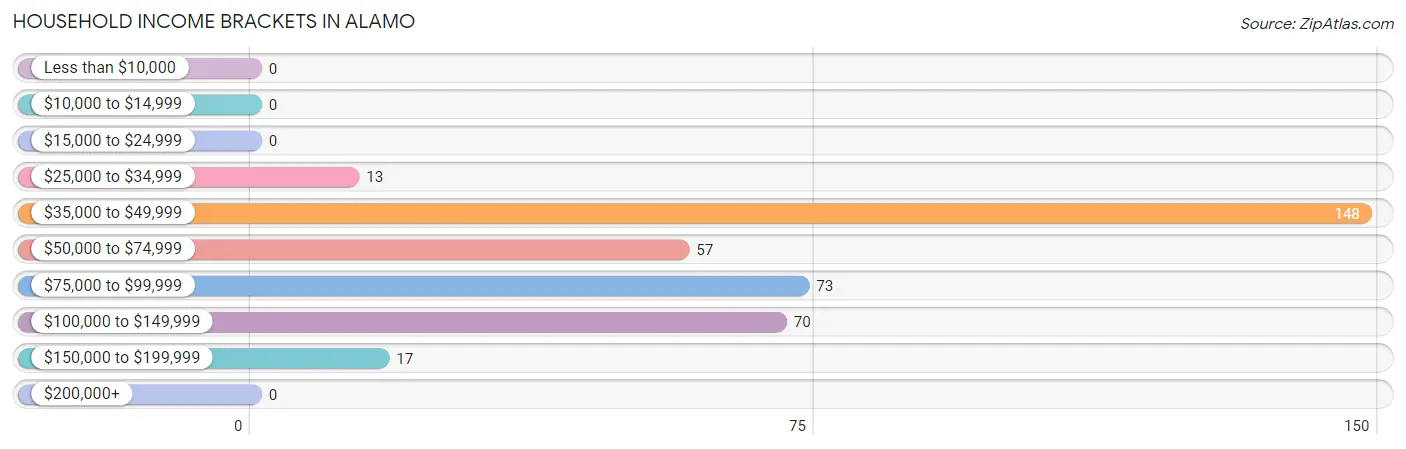
| Income Bracket | # Households | % Households |
| Less than $10,000 | 0 | 0.0% |
| $10,000 to $14,999 | 0 | 0.0% |
| $15,000 to $24,999 | 0 | 0.0% |
| $25,000 to $34,999 | 13 | 3.4% |
| $35,000 to $49,999 | 148 | 39.2% |
| $50,000 to $74,999 | 57 | 15.1% |
| $75,000 to $99,999 | 73 | 19.3% |
| $100,000 to $149,999 | 70 | 18.5% |
| $150,000 to $199,999 | 17 | 4.5% |
| $200,000+ | 0 | 0.0% |
Household Income by Householder Age in Alamo
| Income Bracket | # Households | Median Income |
| 15 to 24 Years | 30 (7.9%) | $0 |
| 25 to 44 Years | 149 (39.4%) | $0 |
| 45 to 64 Years | 134 (35.4%) | $0 |
| 65+ Years | 65 (17.2%) | $0 |
| Total | 378 (100.0%) | $65,083 |
Poverty in Alamo
Income Below Poverty by Sex and Age in Alamo
| Age Bracket | Male | Female |
| Under 5 Years | 0 (0.0%) | 0 (0.0%) |
| 5 Years | 0 (0.0%) | 0 (0.0%) |
| 6 to 11 Years | 0 (0.0%) | 0 (0.0%) |
| 12 to 14 Years | 0 (0.0%) | 0 (0.0%) |
| 15 Years | 0 (0.0%) | 0 (0.0%) |
| 16 and 17 Years | 0 (0.0%) | 0 (0.0%) |
| 18 to 24 Years | 0 (0.0%) | 0 (0.0%) |
| 25 to 34 Years | 0 (0.0%) | 0 (0.0%) |
| 35 to 44 Years | 0 (0.0%) | 0 (0.0%) |
| 45 to 54 Years | 0 (0.0%) | 0 (0.0%) |
| 55 to 64 Years | 0 (0.0%) | 0 (0.0%) |
| 65 to 74 Years | 0 (0.0%) | 0 (0.0%) |
| 75 Years and over | 0 (0.0%) | 0 (0.0%) |
| Total | 0 (0.0%) | 0 (0.0%) |
Income Above Poverty by Sex and Age in Alamo
According to the poverty statistics in Alamo, males aged under 5 years and females aged under 5 years are the age groups that are most secure financially, with 100.0% of males and 100.0% of females in these age groups living above the poverty line.
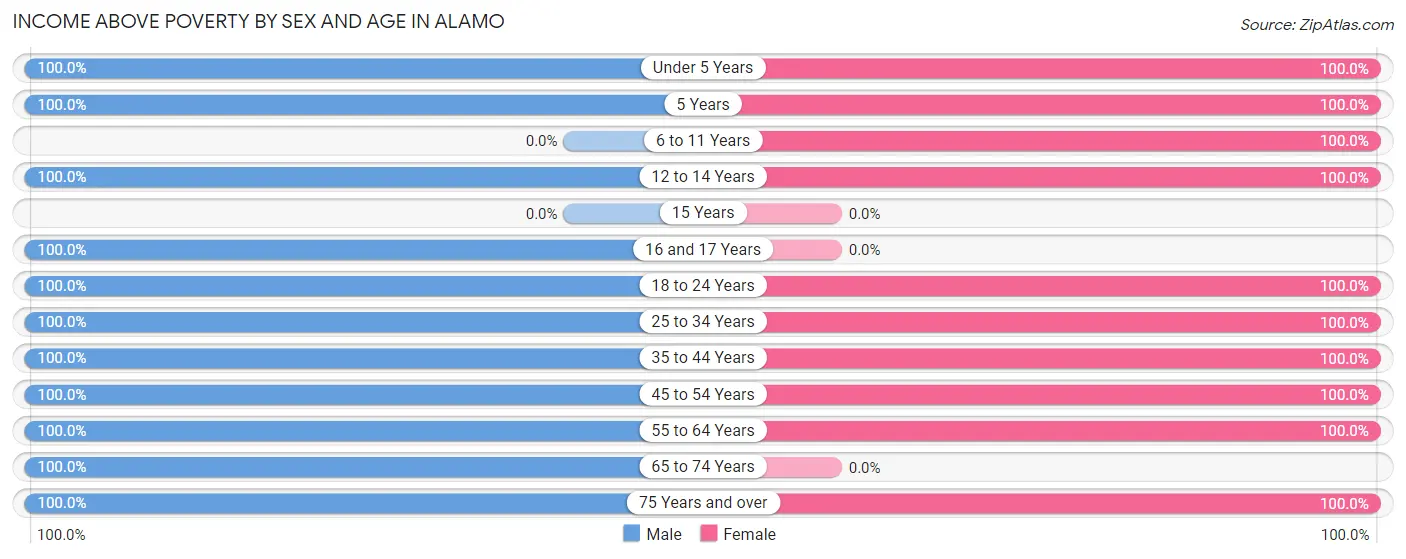
| Age Bracket | Male | Female |
| Under 5 Years | 33 (100.0%) | 22 (100.0%) |
| 5 Years | 33 (100.0%) | 23 (100.0%) |
| 6 to 11 Years | 0 (0.0%) | 27 (100.0%) |
| 12 to 14 Years | 153 (100.0%) | 19 (100.0%) |
| 15 Years | 0 (0.0%) | 0 (0.0%) |
| 16 and 17 Years | 29 (100.0%) | 0 (0.0%) |
| 18 to 24 Years | 19 (100.0%) | 30 (100.0%) |
| 25 to 34 Years | 59 (100.0%) | 112 (100.0%) |
| 35 to 44 Years | 56 (100.0%) | 37 (100.0%) |
| 45 to 54 Years | 108 (100.0%) | 36 (100.0%) |
| 55 to 64 Years | 17 (100.0%) | 71 (100.0%) |
| 65 to 74 Years | 39 (100.0%) | 0 (0.0%) |
| 75 Years and over | 50 (100.0%) | 46 (100.0%) |
| Total | 596 (100.0%) | 423 (100.0%) |
Income Below Poverty Among Married-Couple Families in Alamo
| Children | Above Poverty | Below Poverty |
| No Children | 50 (100.0%) | 0 (0.0%) |
| 1 or 2 Children | 97 (100.0%) | 0 (0.0%) |
| 3 or 4 Children | 0 (0.0%) | 0 (0.0%) |
| 5 or more Children | 0 (0.0%) | 0 (0.0%) |
| Total | 147 (100.0%) | 0 (0.0%) |
Income Below Poverty Among Single-Parent Households in Alamo
| Children | Single Father | Single Mother |
| No Children | 0 (0.0%) | 0 (0.0%) |
| 1 or 2 Children | 0 (0.0%) | 0 (0.0%) |
| 3 or 4 Children | 0 (0.0%) | 0 (0.0%) |
| 5 or more Children | 0 (0.0%) | 0 (0.0%) |
| Total | 0 (0.0%) | 0 (0.0%) |
Income Below Poverty Among Married-Couple vs Single-Parent Households in Alamo
| Children | Married-Couple Families | Single-Parent Households |
| No Children | 0 (0.0%) | 0 (0.0%) |
| 1 or 2 Children | 0 (0.0%) | 0 (0.0%) |
| 3 or 4 Children | 0 (0.0%) | 0 (0.0%) |
| 5 or more Children | 0 (0.0%) | 0 (0.0%) |
| Total | 0 (0.0%) | 0 (0.0%) |
Race in Alamo
The most populous races in Alamo are White / Caucasian (839 | 82.3%), Hispanic or Latino (167 | 16.4%), and Two or more Races (167 | 16.4%).
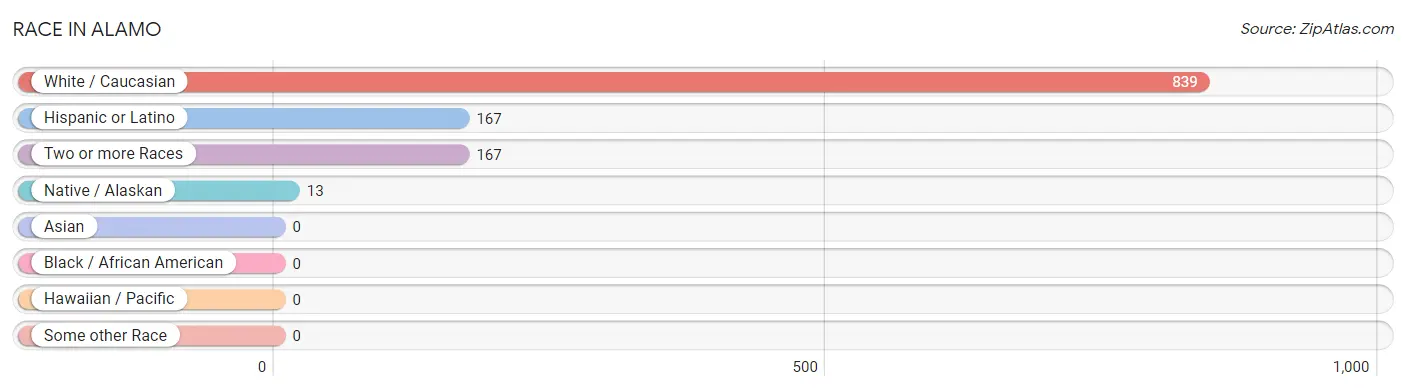
| Race | # Population | % Population |
| Asian | 0 | 0.0% |
| Black / African American | 0 | 0.0% |
| Hawaiian / Pacific | 0 | 0.0% |
| Hispanic or Latino | 167 | 16.4% |
| Native / Alaskan | 13 | 1.3% |
| White / Caucasian | 839 | 82.3% |
| Two or more Races | 167 | 16.4% |
| Some other Race | 0 | 0.0% |
| Total | 1,019 | 100.0% |
Ancestry in Alamo
The most populous ancestries reported in Alamo are Scottish (174 | 17.1%), German (168 | 16.5%), Mexican (167 | 16.4%), English (146 | 14.3%), and Irish (98 | 9.6%), together accounting for 73.9% of all Alamo residents.
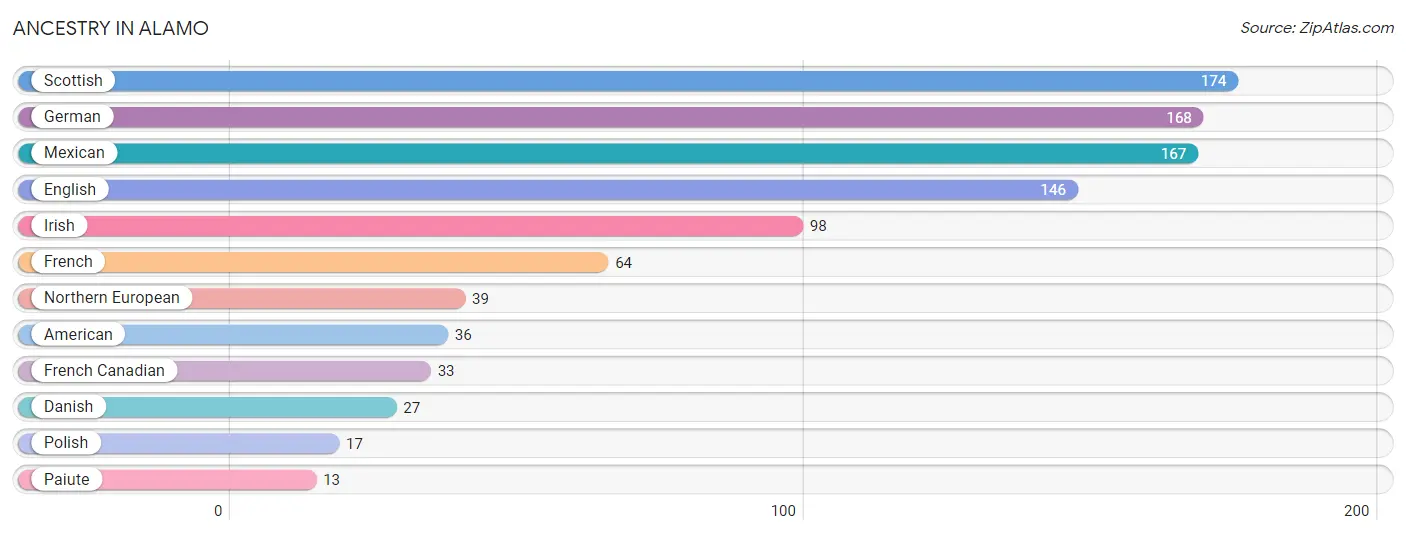
| Ancestry | # Population | % Population |
| American | 36 | 3.5% |
| Danish | 27 | 2.6% |
| English | 146 | 14.3% |
| French | 64 | 6.3% |
| French Canadian | 33 | 3.2% |
| German | 168 | 16.5% |
| Irish | 98 | 9.6% |
| Mexican | 167 | 16.4% |
| Northern European | 39 | 3.8% |
| Paiute | 13 | 1.3% |
| Polish | 17 | 1.7% |
| Scottish | 174 | 17.1% | View All 12 Rows |
Immigrants in Alamo

| Immigration Origin | # Population | % Population | View All 0 Rows |
Sex and Age in Alamo
Sex and Age in Alamo
The most populous age groups in Alamo are 10 to 14 Years (153 | 25.7%) for men and 60 to 64 Years (71 | 16.8%) for women.
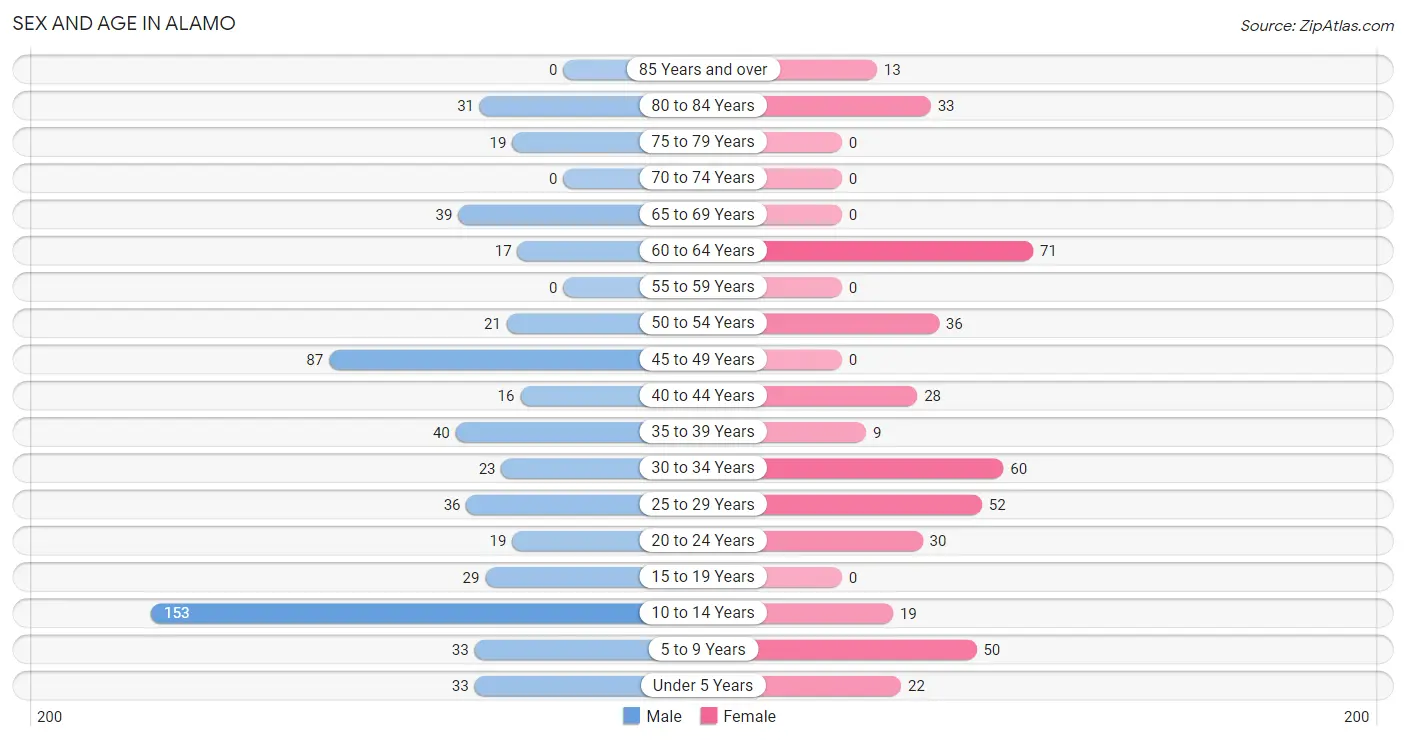
| Age Bracket | Male | Female |
| Under 5 Years | 33 (5.5%) | 22 (5.2%) |
| 5 to 9 Years | 33 (5.5%) | 50 (11.8%) |
| 10 to 14 Years | 153 (25.7%) | 19 (4.5%) |
| 15 to 19 Years | 29 (4.9%) | 0 (0.0%) |
| 20 to 24 Years | 19 (3.2%) | 30 (7.1%) |
| 25 to 29 Years | 36 (6.0%) | 52 (12.3%) |
| 30 to 34 Years | 23 (3.9%) | 60 (14.2%) |
| 35 to 39 Years | 40 (6.7%) | 9 (2.1%) |
| 40 to 44 Years | 16 (2.7%) | 28 (6.6%) |
| 45 to 49 Years | 87 (14.6%) | 0 (0.0%) |
| 50 to 54 Years | 21 (3.5%) | 36 (8.5%) |
| 55 to 59 Years | 0 (0.0%) | 0 (0.0%) |
| 60 to 64 Years | 17 (2.9%) | 71 (16.8%) |
| 65 to 69 Years | 39 (6.5%) | 0 (0.0%) |
| 70 to 74 Years | 0 (0.0%) | 0 (0.0%) |
| 75 to 79 Years | 19 (3.2%) | 0 (0.0%) |
| 80 to 84 Years | 31 (5.2%) | 33 (7.8%) |
| 85 Years and over | 0 (0.0%) | 13 (3.1%) |
| Total | 596 (100.0%) | 423 (100.0%) |
Families and Households in Alamo
Median Family Size in Alamo
The median family size in Alamo is 3.25 persons per family, with single female/mother families (52 | 20.0%) accounting for the largest median family size of 4.21 persons per family. On the other hand, single male/father families (61 | 23.5%) represent the smallest median family size with 2.70 persons per family.
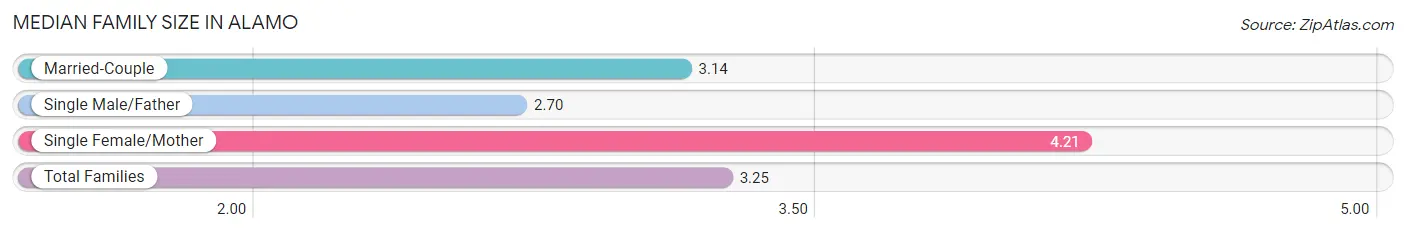
| Family Type | # Families | Family Size |
| Married-Couple | 147 (56.5%) | 3.14 |
| Single Male/Father | 61 (23.5%) | 2.70 |
| Single Female/Mother | 52 (20.0%) | 4.21 |
| Total Families | 260 (100.0%) | 3.25 |
Median Household Size in Alamo
The median household size in Alamo is 2.70 persons per household, with single female/mother households (52 | 13.8%) accounting for the largest median household size of 4.21 persons per household. non-family households (118 | 31.2%) represent the smallest median household size with 1.47 persons per household.
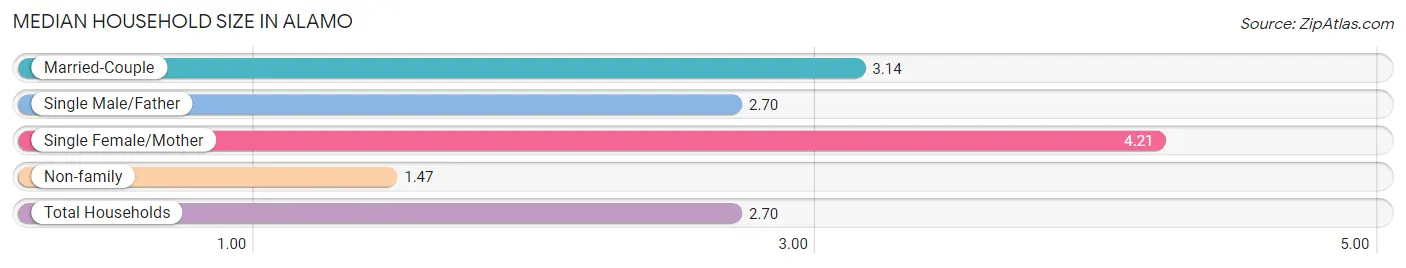
| Household Type | # Households | Household Size |
| Married-Couple | 147 (38.9%) | 3.14 |
| Single Male/Father | 61 (16.1%) | 2.70 |
| Single Female/Mother | 52 (13.8%) | 4.21 |
| Non-family | 118 (31.2%) | 1.47 |
| Total Households | 378 (100.0%) | 2.70 |
Household Size by Marriage Status in Alamo
Out of a total of 378 households in Alamo, 260 (68.8%) are family households, while 118 (31.2%) are nonfamily households. The most numerous type of family households are 3-person households, comprising 131, and the most common type of nonfamily households are 1-person households, comprising 88.
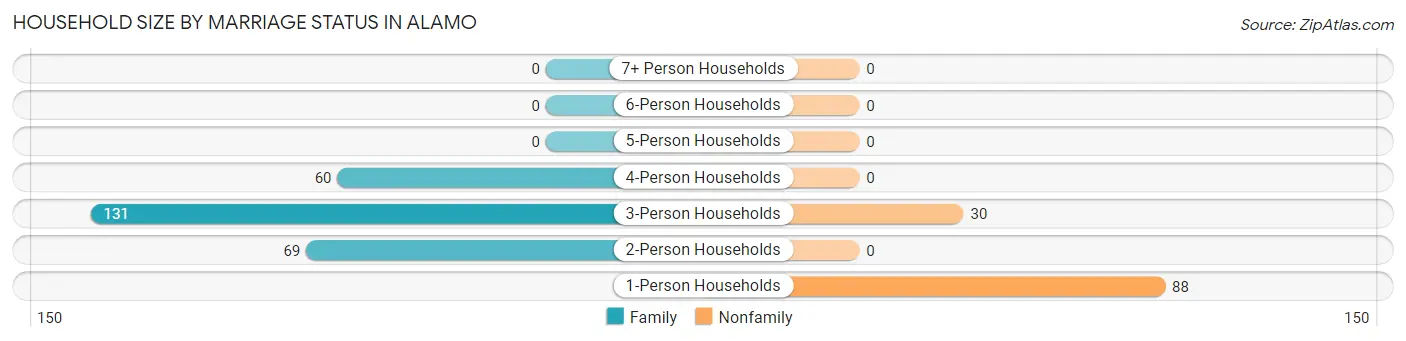
| Household Size | Family Households | Nonfamily Households |
| 1-Person Households | - | 88 (23.3%) |
| 2-Person Households | 69 (18.2%) | 0 (0.0%) |
| 3-Person Households | 131 (34.7%) | 30 (7.9%) |
| 4-Person Households | 60 (15.9%) | 0 (0.0%) |
| 5-Person Households | 0 (0.0%) | 0 (0.0%) |
| 6-Person Households | 0 (0.0%) | 0 (0.0%) |
| 7+ Person Households | 0 (0.0%) | 0 (0.0%) |
| Total | 260 (68.8%) | 118 (31.2%) |
Female Fertility in Alamo
Fertility by Age in Alamo
| Age Bracket | Women with Births | Births / 1,000 Women |
| 15 to 19 years | 0 (0.0%) | 0.0 |
| 20 to 34 years | 0 (0.0%) | 0.0 |
| 35 to 50 years | 0 (0.0%) | 0.0 |
| Total | 0 (0.0%) | 0.0 |
Fertility by Age by Marriage Status in Alamo
| Age Bracket | Married | Unmarried |
| 15 to 19 years | 0 (0.0%) | 0 (0.0%) |
| 20 to 34 years | 0 (0.0%) | 0 (0.0%) |
| 35 to 50 years | 0 (0.0%) | 0 (0.0%) |
| Total | 0 (0.0%) | 0 (0.0%) |
Fertility by Education in Alamo
| Educational Attainment | Women with Births | Births / 1,000 Women |
| Less than High School | 0 (0.0%) | 0.0 |
| High School Diploma | 0 (0.0%) | 0.0 |
| College or Associate's Degree | 0 (0.0%) | 0.0 |
| Bachelor's Degree | 0 (0.0%) | 0.0 |
| Graduate Degree | 0 (0.0%) | 0.0 |
| Total | 0 (0.0%) | 0.0 |
Fertility by Education by Marriage Status in Alamo
| Educational Attainment | Married | Unmarried |
| Less than High School | 0 (0.0%) | 0 (0.0%) |
| High School Diploma | 0 (0.0%) | 0 (0.0%) |
| College or Associate's Degree | 0 (0.0%) | 0 (0.0%) |
| Bachelor's Degree | 0 (0.0%) | 0 (0.0%) |
| Graduate Degree | 0 (0.0%) | 0 (0.0%) |
| Total | 0 (0.0%) | 0 (0.0%) |
Employment Characteristics in Alamo
Employment by Class of Employer in Alamo
Among the 433 employed individuals in Alamo, private company employees (347 | 80.1%), and local government employees (86 | 19.9%) make up the most common classes of employment.
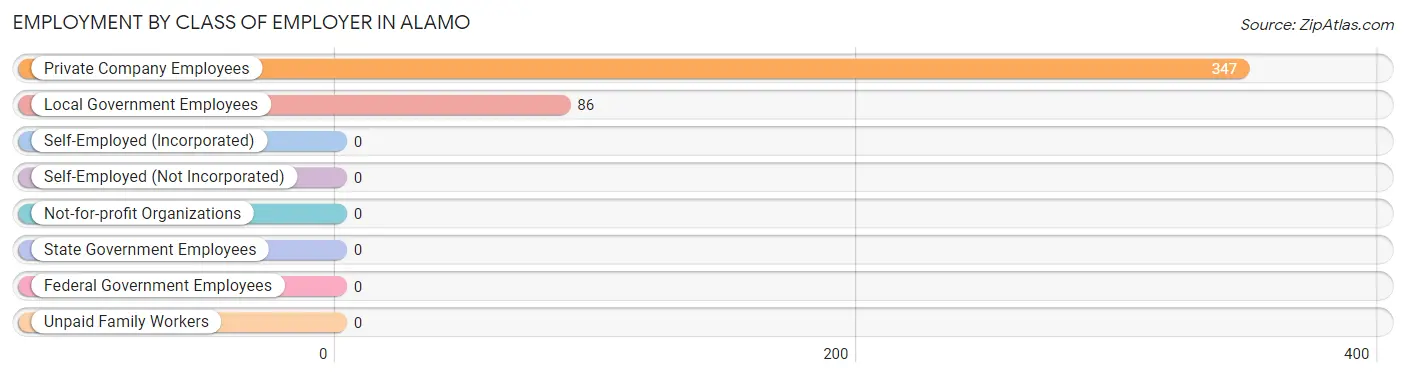
| Employer Class | # Employees | % Employees |
| Private Company Employees | 347 | 80.1% |
| Self-Employed (Incorporated) | 0 | 0.0% |
| Self-Employed (Not Incorporated) | 0 | 0.0% |
| Not-for-profit Organizations | 0 | 0.0% |
| Local Government Employees | 86 | 19.9% |
| State Government Employees | 0 | 0.0% |
| Federal Government Employees | 0 | 0.0% |
| Unpaid Family Workers | 0 | 0.0% |
| Total | 433 | 100.0% |
Employment Status by Age in Alamo
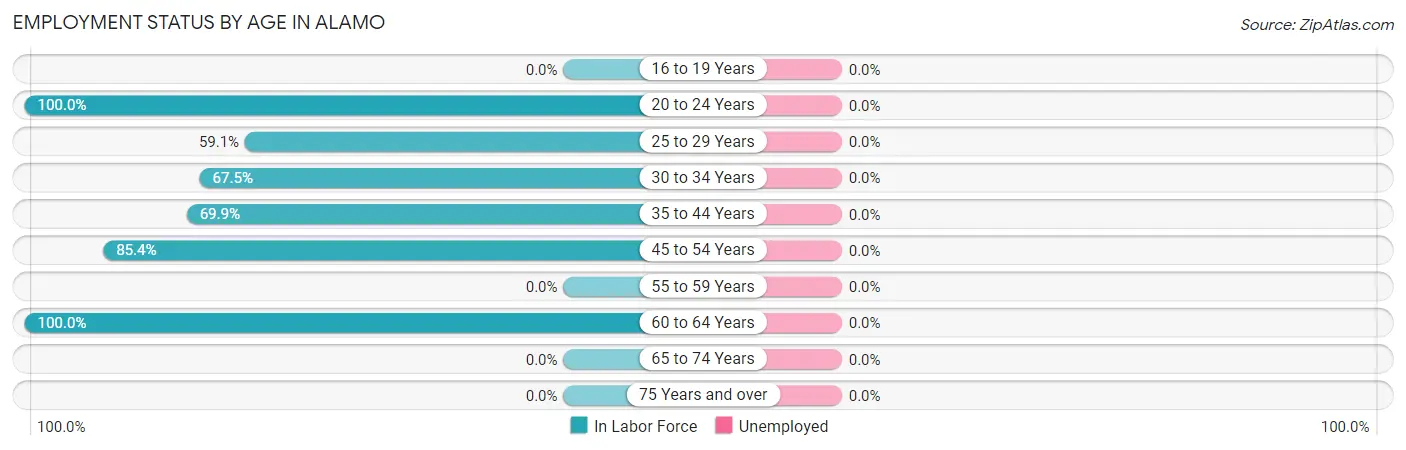
| Age Bracket | In Labor Force | Unemployed |
| 16 to 19 Years | 0 (0.0%) | 0 (0.0%) |
| 20 to 24 Years | 49 (100.0%) | 0 (0.0%) |
| 25 to 29 Years | 52 (59.1%) | 0 (0.0%) |
| 30 to 34 Years | 56 (67.5%) | 0 (0.0%) |
| 35 to 44 Years | 65 (69.9%) | 0 (0.0%) |
| 45 to 54 Years | 123 (85.4%) | 0 (0.0%) |
| 55 to 59 Years | 0 (0.0%) | 0 (0.0%) |
| 60 to 64 Years | 88 (100.0%) | 0 (0.0%) |
| 65 to 74 Years | 0 (0.0%) | 0 (0.0%) |
| 75 Years and over | 0 (0.0%) | 0 (0.0%) |
| Total | 433 (61.1%) | 0 (0.0%) |
Employment Status by Educational Attainment in Alamo
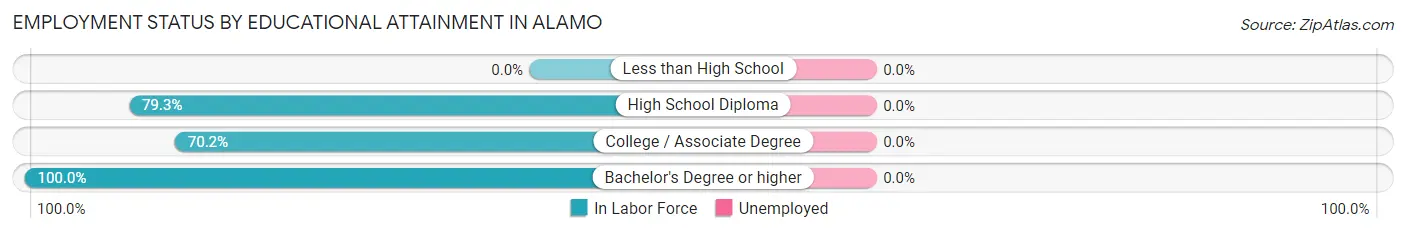
| Educational Attainment | In Labor Force | Unemployed |
| Less than High School | 0 (0.0%) | 0 (0.0%) |
| High School Diploma | 245 (79.3%) | 0 (0.0%) |
| College / Associate Degree | 113 (70.2%) | 0 (0.0%) |
| Bachelor's Degree or higher | 26 (100.0%) | 0 (0.0%) |
| Total | 384 (77.4%) | 0 (0.0%) |
Employment Occupations by Sex in Alamo
Management, Business, Science and Arts Occupations
The most common Management, Business, Science and Arts occupations in Alamo are Computers, Engineering & Science (17 | 3.9%), and Life, Physical & Social Science (17 | 3.9%).
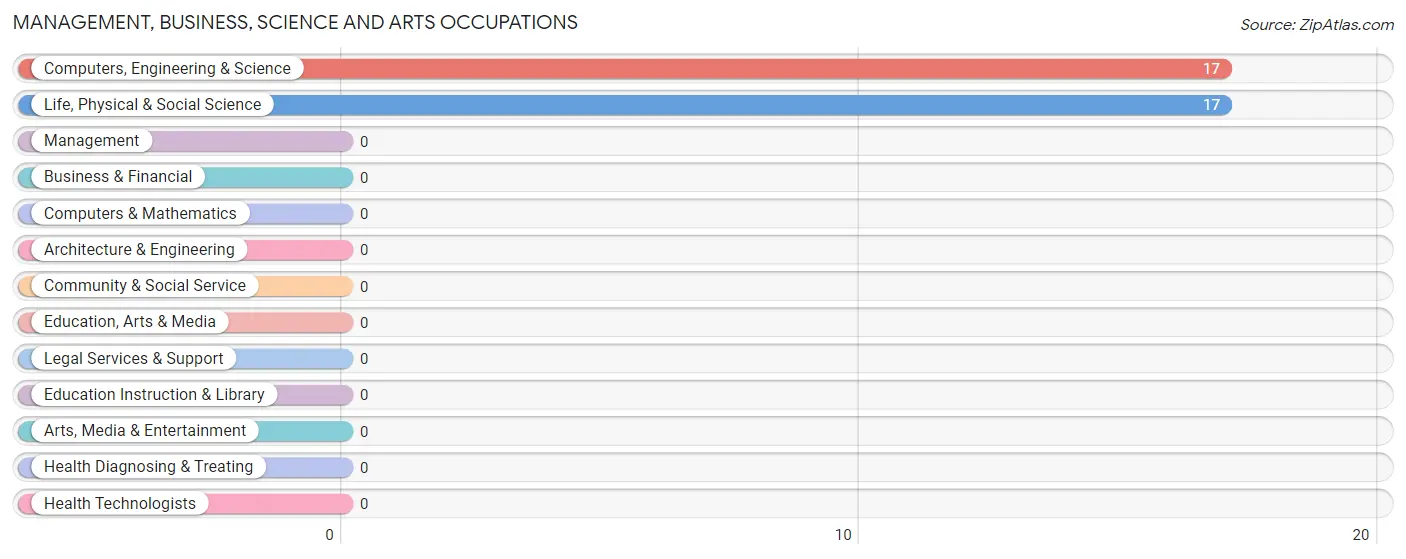
Management, Business, Science and Arts Occupations by Sex
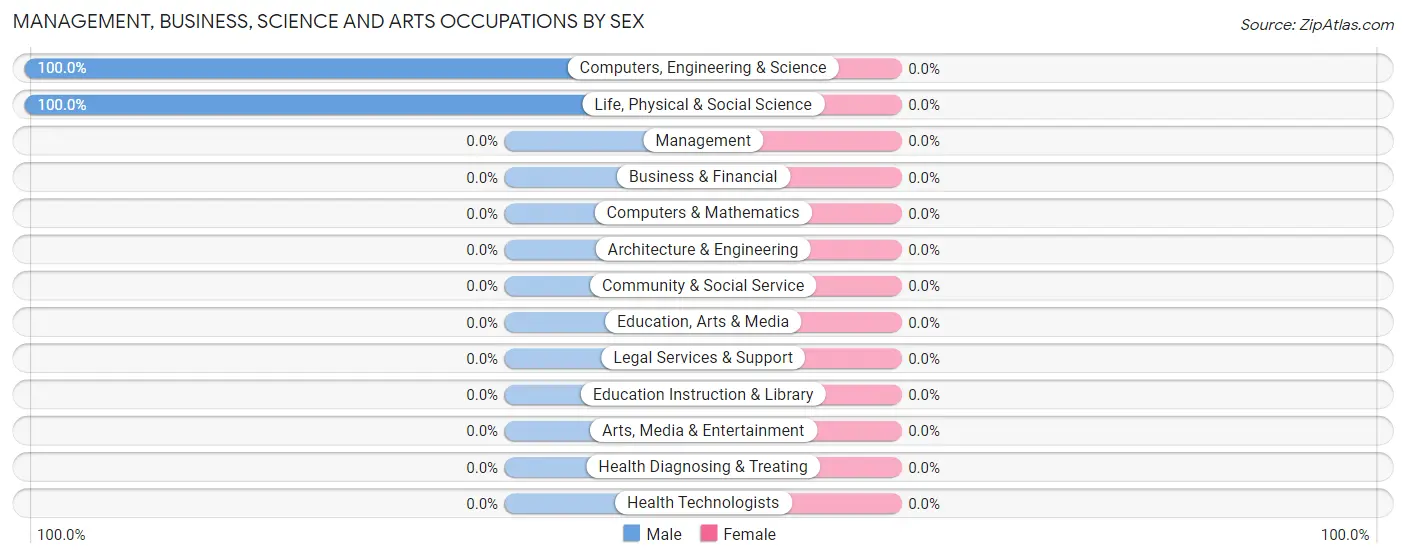
| Occupation | Male | Female |
| Management | 0 (0.0%) | 0 (0.0%) |
| Business & Financial | 0 (0.0%) | 0 (0.0%) |
| Computers, Engineering & Science | 17 (100.0%) | 0 (0.0%) |
| Computers & Mathematics | 0 (0.0%) | 0 (0.0%) |
| Architecture & Engineering | 0 (0.0%) | 0 (0.0%) |
| Life, Physical & Social Science | 17 (100.0%) | 0 (0.0%) |
| Community & Social Service | 0 (0.0%) | 0 (0.0%) |
| Education, Arts & Media | 0 (0.0%) | 0 (0.0%) |
| Legal Services & Support | 0 (0.0%) | 0 (0.0%) |
| Education Instruction & Library | 0 (0.0%) | 0 (0.0%) |
| Arts, Media & Entertainment | 0 (0.0%) | 0 (0.0%) |
| Health Diagnosing & Treating | 0 (0.0%) | 0 (0.0%) |
| Health Technologists | 0 (0.0%) | 0 (0.0%) |
| Total (Category) | 17 (100.0%) | 0 (0.0%) |
| Total (Overall) | 202 (46.7%) | 231 (53.3%) |
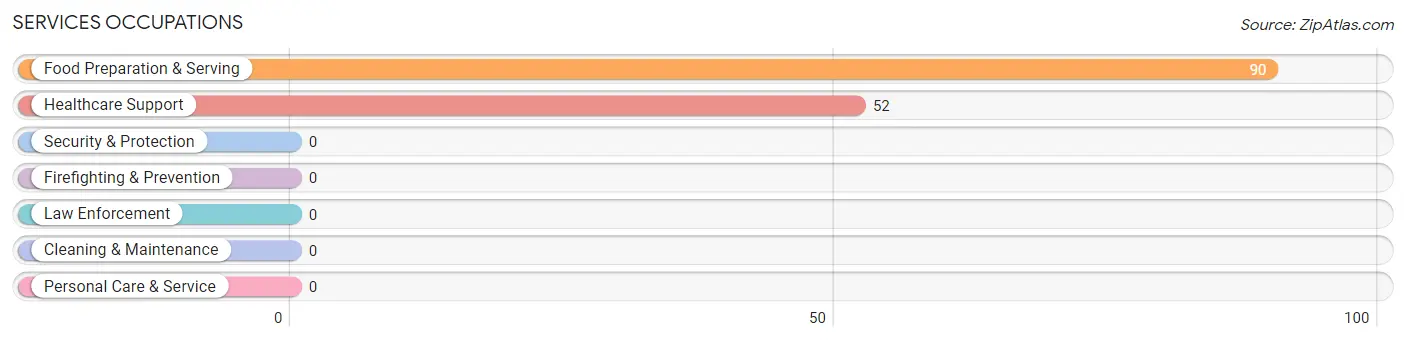
Services Occupations
The most common Services occupations in Alamo are Food Preparation & Serving (90 | 20.8%), and Healthcare Support (52 | 12.0%).
Services Occupations by Sex
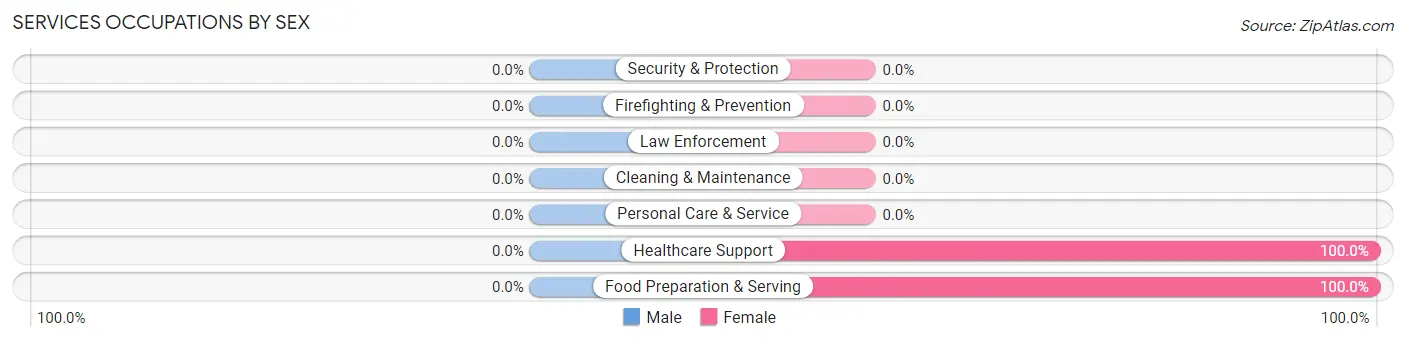
| Occupation | Male | Female |
| Healthcare Support | 0 (0.0%) | 52 (100.0%) |
| Security & Protection | 0 (0.0%) | 0 (0.0%) |
| Firefighting & Prevention | 0 (0.0%) | 0 (0.0%) |
| Law Enforcement | 0 (0.0%) | 0 (0.0%) |
| Food Preparation & Serving | 0 (0.0%) | 90 (100.0%) |
| Cleaning & Maintenance | 0 (0.0%) | 0 (0.0%) |
| Personal Care & Service | 0 (0.0%) | 0 (0.0%) |
| Total (Category) | 0 (0.0%) | 142 (100.0%) |
| Total (Overall) | 202 (46.7%) | 231 (53.3%) |
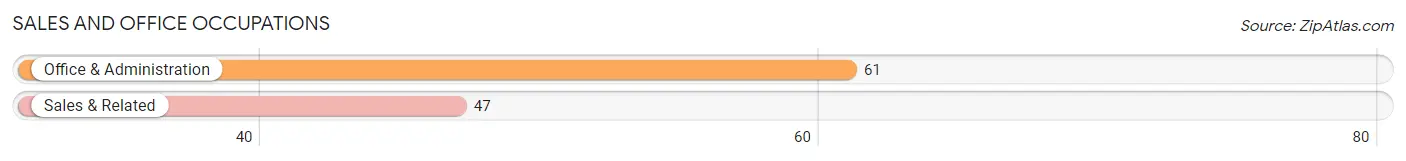
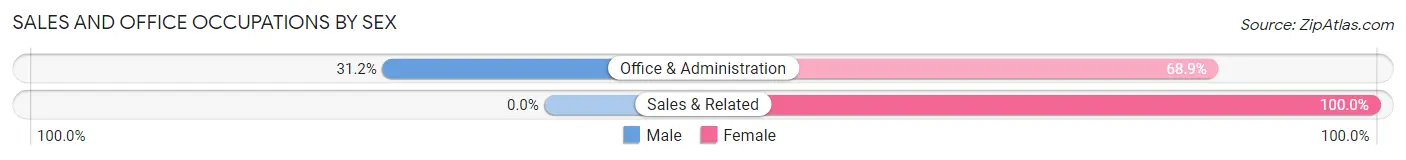
Sales and Office Occupations
The most common Sales and Office occupations in Alamo are Office & Administration (61 | 14.1%), and Sales & Related (47 | 10.8%).
Sales and Office Occupations by Sex
| Occupation | Male | Female |
| Sales & Related | 0 (0.0%) | 47 (100.0%) |
| Office & Administration | 19 (31.1%) | 42 (68.9%) |
| Total (Category) | 19 (17.6%) | 89 (82.4%) |
| Total (Overall) | 202 (46.7%) | 231 (53.3%) |
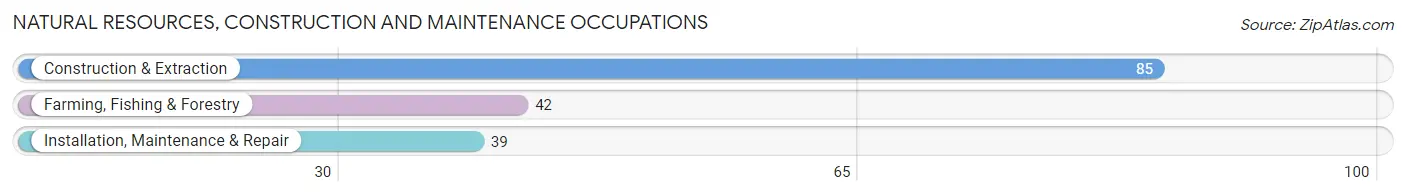
Natural Resources, Construction and Maintenance Occupations
The most common Natural Resources, Construction and Maintenance occupations in Alamo are Construction & Extraction (85 | 19.6%), Farming, Fishing & Forestry (42 | 9.7%), and Installation, Maintenance & Repair (39 | 9.0%).
Natural Resources, Construction and Maintenance Occupations by Sex
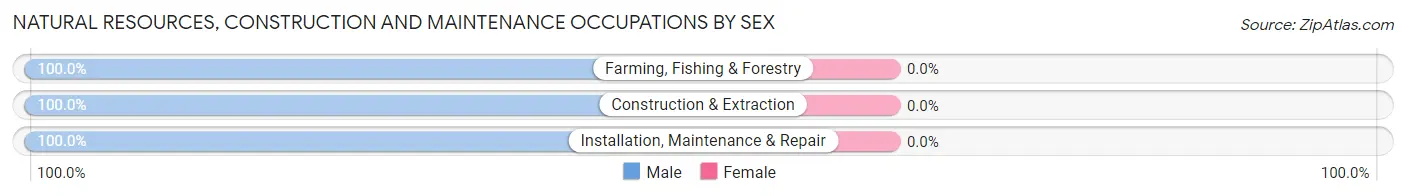
| Occupation | Male | Female |
| Farming, Fishing & Forestry | 42 (100.0%) | 0 (0.0%) |
| Construction & Extraction | 85 (100.0%) | 0 (0.0%) |
| Installation, Maintenance & Repair | 39 (100.0%) | 0 (0.0%) |
| Total (Category) | 166 (100.0%) | 0 (0.0%) |
| Total (Overall) | 202 (46.7%) | 231 (53.3%) |
Production, Transportation and Moving Occupations
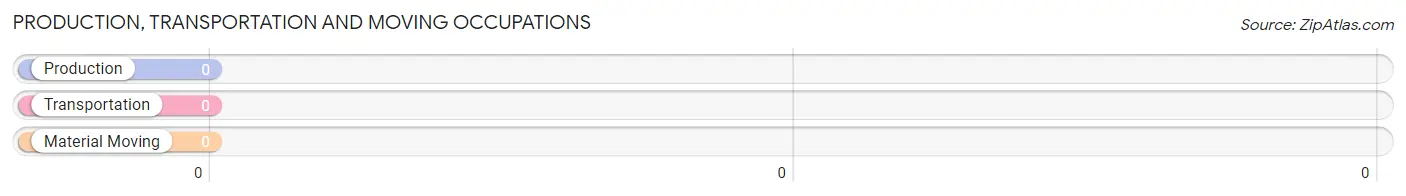
Production, Transportation and Moving Occupations by Sex
| Occupation | Male | Female |
| Production | 0 (0.0%) | 0 (0.0%) |
| Transportation | 0 (0.0%) | 0 (0.0%) |
| Material Moving | 0 (0.0%) | 0 (0.0%) |
| Total (Category) | 0 (0.0%) | 0 (0.0%) |
| Total (Overall) | 202 (46.7%) | 231 (53.3%) |
Employment Industries by Sex in Alamo
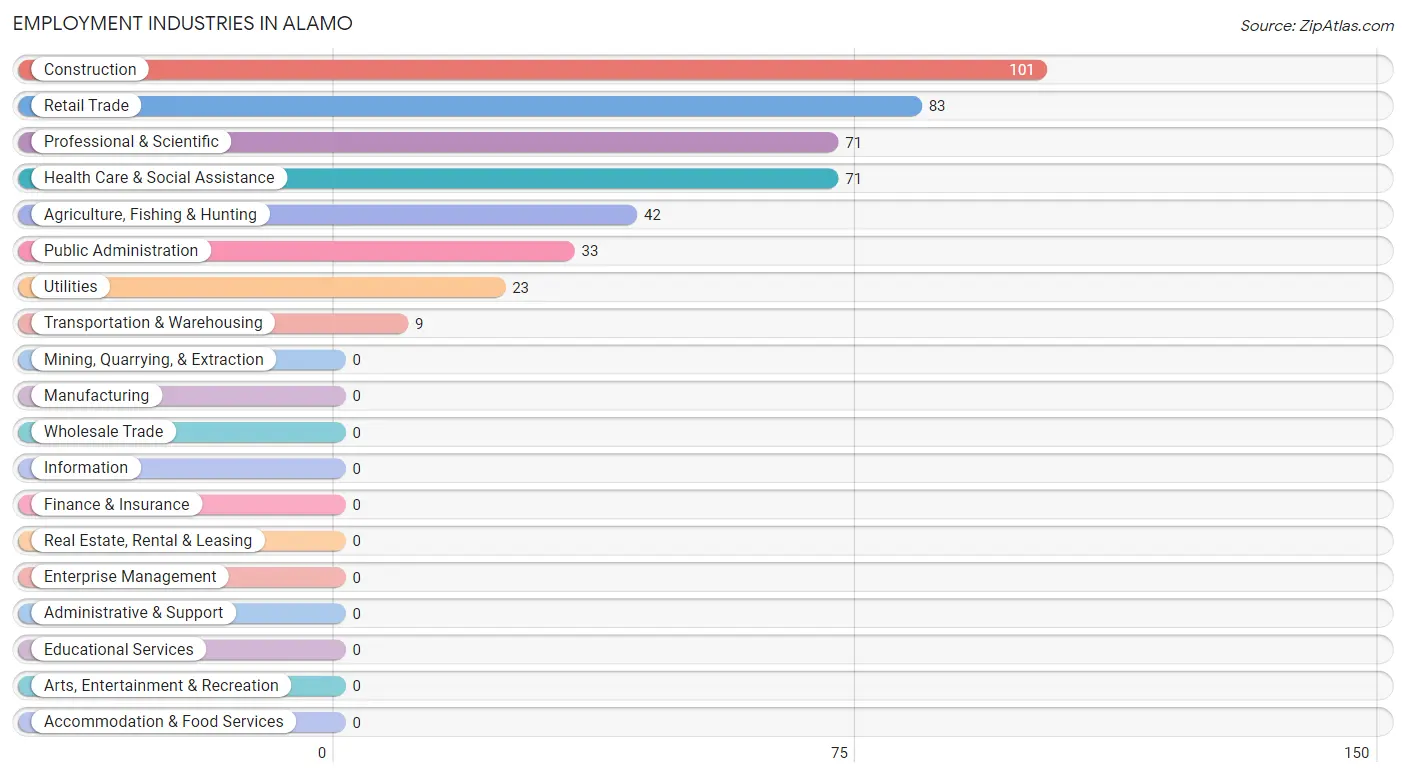
Employment Industries in Alamo
The major employment industries in Alamo include Construction (101 | 23.3%), Retail Trade (83 | 19.2%), Professional & Scientific (71 | 16.4%), Health Care & Social Assistance (71 | 16.4%), and Agriculture, Fishing & Hunting (42 | 9.7%).
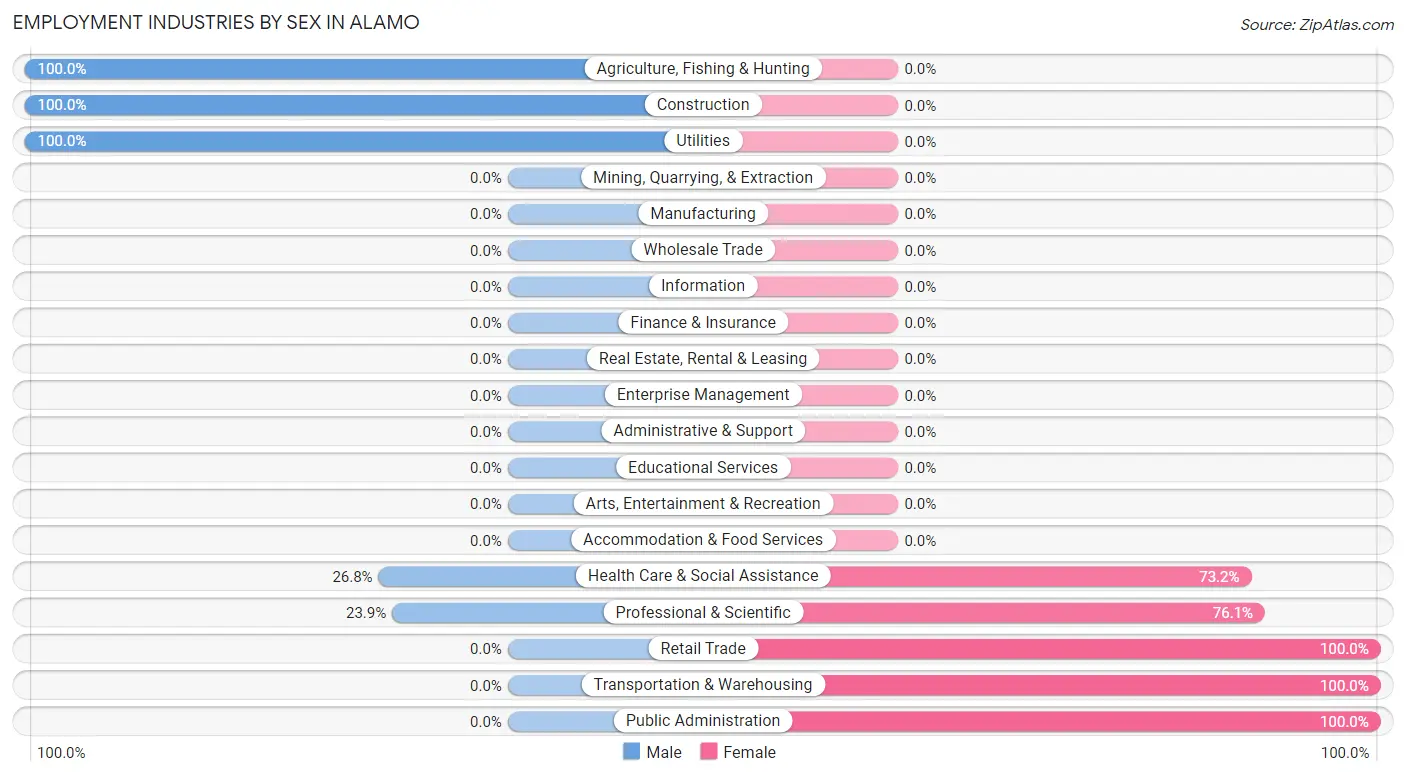
Employment Industries by Sex in Alamo
The Alamo industries that see more men than women are Agriculture, Fishing & Hunting (100.0%), Construction (100.0%), and Utilities (100.0%), whereas the industries that tend to have a higher number of women are Retail Trade (100.0%), Transportation & Warehousing (100.0%), and Public Administration (100.0%).
| Industry | Male | Female |
| Agriculture, Fishing & Hunting | 42 (100.0%) | 0 (0.0%) |
| Mining, Quarrying, & Extraction | 0 (0.0%) | 0 (0.0%) |
| Construction | 101 (100.0%) | 0 (0.0%) |
| Manufacturing | 0 (0.0%) | 0 (0.0%) |
| Wholesale Trade | 0 (0.0%) | 0 (0.0%) |
| Retail Trade | 0 (0.0%) | 83 (100.0%) |
| Transportation & Warehousing | 0 (0.0%) | 9 (100.0%) |
| Utilities | 23 (100.0%) | 0 (0.0%) |
| Information | 0 (0.0%) | 0 (0.0%) |
| Finance & Insurance | 0 (0.0%) | 0 (0.0%) |
| Real Estate, Rental & Leasing | 0 (0.0%) | 0 (0.0%) |
| Professional & Scientific | 17 (23.9%) | 54 (76.1%) |
| Enterprise Management | 0 (0.0%) | 0 (0.0%) |
| Administrative & Support | 0 (0.0%) | 0 (0.0%) |
| Educational Services | 0 (0.0%) | 0 (0.0%) |
| Health Care & Social Assistance | 19 (26.8%) | 52 (73.2%) |
| Arts, Entertainment & Recreation | 0 (0.0%) | 0 (0.0%) |
| Accommodation & Food Services | 0 (0.0%) | 0 (0.0%) |
| Public Administration | 0 (0.0%) | 33 (100.0%) |
| Total | 202 (46.7%) | 231 (53.3%) |
Education in Alamo
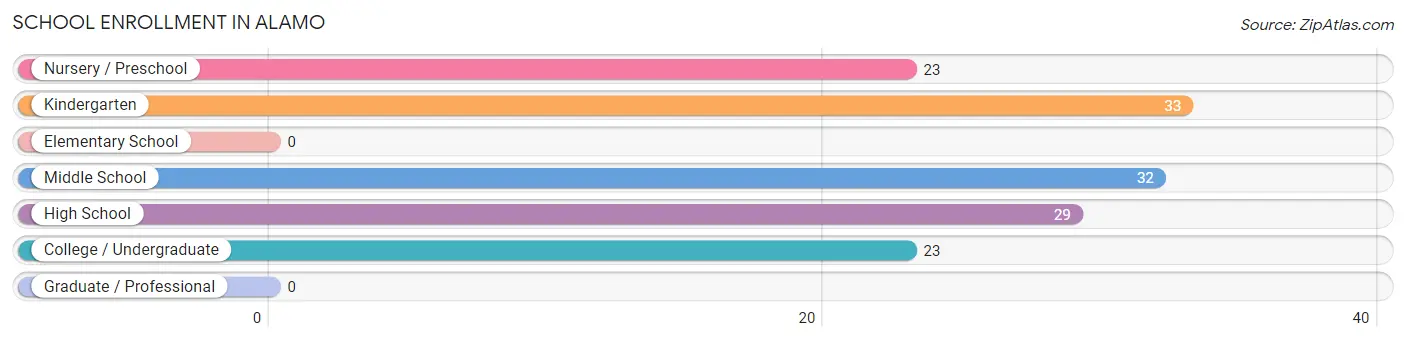
School Enrollment in Alamo
The most common levels of schooling among the 140 students in Alamo are kindergarten (33 | 23.6%), middle school (32 | 22.9%), and high school (29 | 20.7%).
| School Level | # Students | % Students |
| Nursery / Preschool | 23 | 16.4% |
| Kindergarten | 33 | 23.6% |
| Elementary School | 0 | 0.0% |
| Middle School | 32 | 22.9% |
| High School | 29 | 20.7% |
| College / Undergraduate | 23 | 16.4% |
| Graduate / Professional | 0 | 0.0% |
| Total | 140 | 100.0% |
School Enrollment by Age by Funding Source in Alamo
Out of a total of 140 students who are enrolled in schools in Alamo, 23 (16.4%) attend a private institution, while the remaining 117 (83.6%) are enrolled in public schools. The age group of 5 to 9 year old has the highest likelihood of being enrolled in private schools, with 23 (41.1% in the age bracket) enrolled. Conversely, the age group of 10 to 14 year olds has the lowest likelihood of being enrolled in a private school, with 32 (100.0% in the age bracket) attending a public institution.
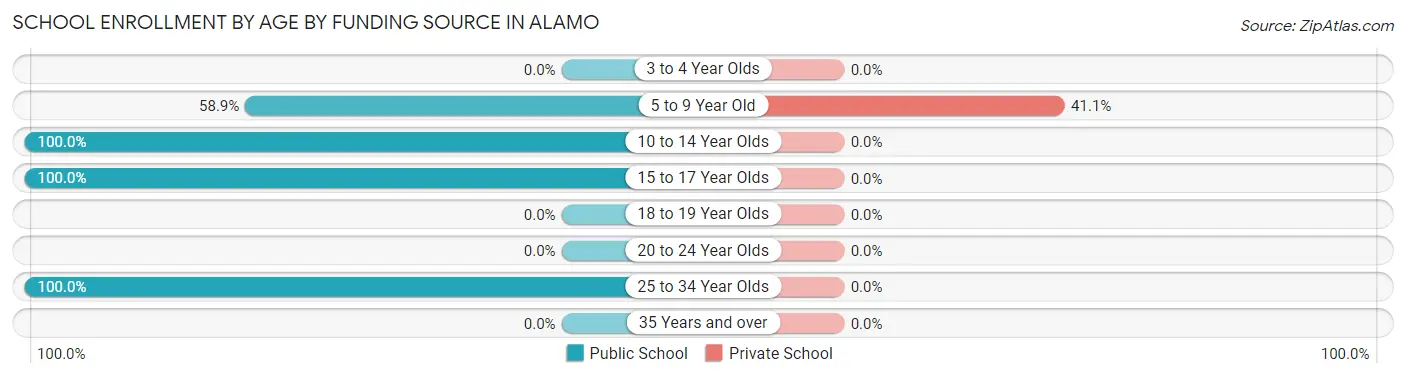
| Age Bracket | Public School | Private School |
| 3 to 4 Year Olds | 0 (0.0%) | 0 (0.0%) |
| 5 to 9 Year Old | 33 (58.9%) | 23 (41.1%) |
| 10 to 14 Year Olds | 32 (100.0%) | 0 (0.0%) |
| 15 to 17 Year Olds | 29 (100.0%) | 0 (0.0%) |
| 18 to 19 Year Olds | 0 (0.0%) | 0 (0.0%) |
| 20 to 24 Year Olds | 0 (0.0%) | 0 (0.0%) |
| 25 to 34 Year Olds | 23 (100.0%) | 0 (0.0%) |
| 35 Years and over | 0 (0.0%) | 0 (0.0%) |
| Total | 117 (83.6%) | 23 (16.4%) |
Educational Attainment by Field of Study in Alamo
Education (19 | 35.2%), physical & health sciences (17 | 31.5%), psychology (9 | 16.7%), and social sciences (9 | 16.7%) are the most common fields of study among 54 individuals in Alamo who have obtained a bachelor's degree or higher.
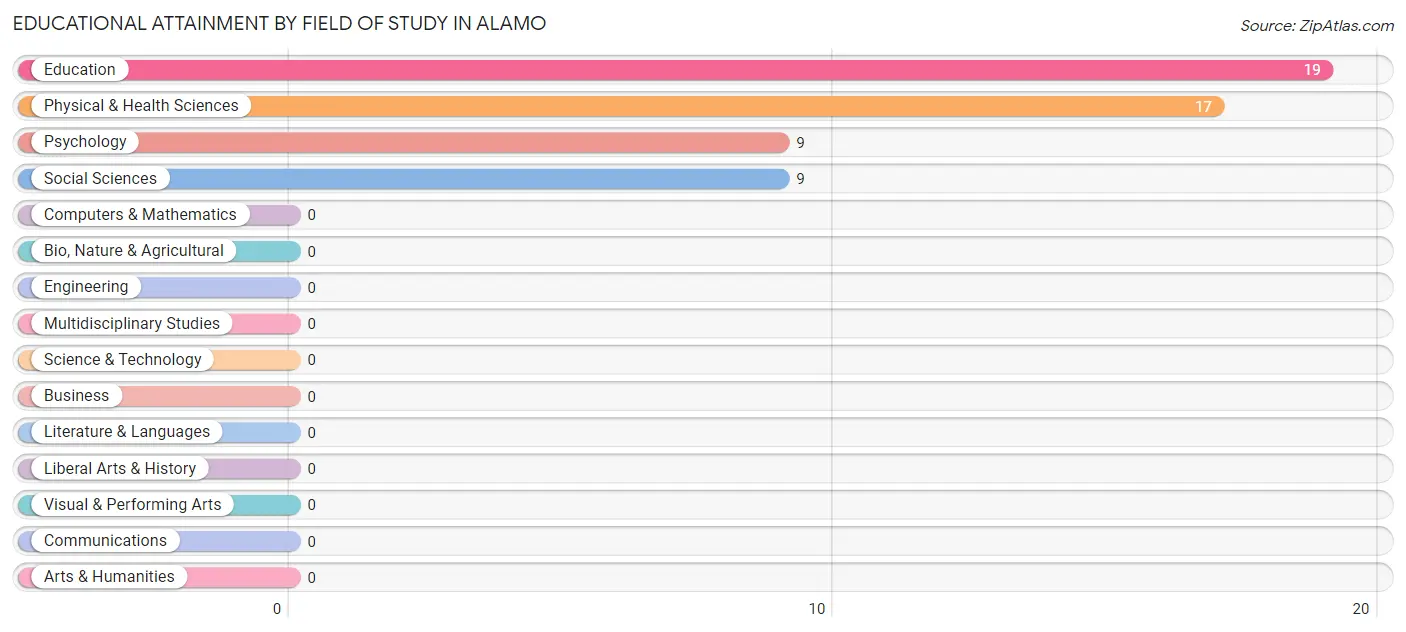
| Field of Study | # Graduates | % Graduates |
| Computers & Mathematics | 0 | 0.0% |
| Bio, Nature & Agricultural | 0 | 0.0% |
| Physical & Health Sciences | 17 | 31.5% |
| Psychology | 9 | 16.7% |
| Social Sciences | 9 | 16.7% |
| Engineering | 0 | 0.0% |
| Multidisciplinary Studies | 0 | 0.0% |
| Science & Technology | 0 | 0.0% |
| Business | 0 | 0.0% |
| Education | 19 | 35.2% |
| Literature & Languages | 0 | 0.0% |
| Liberal Arts & History | 0 | 0.0% |
| Visual & Performing Arts | 0 | 0.0% |
| Communications | 0 | 0.0% |
| Arts & Humanities | 0 | 0.0% |
| Total | 54 | 100.0% |
Transportation & Commute in Alamo
Vehicle Availability by Sex in Alamo
The most prevalent vehicle ownership categories in Alamo are males with 2 vehicles (63, accounting for 31.2%) and females with 2 vehicles (33, making up 27.3%).
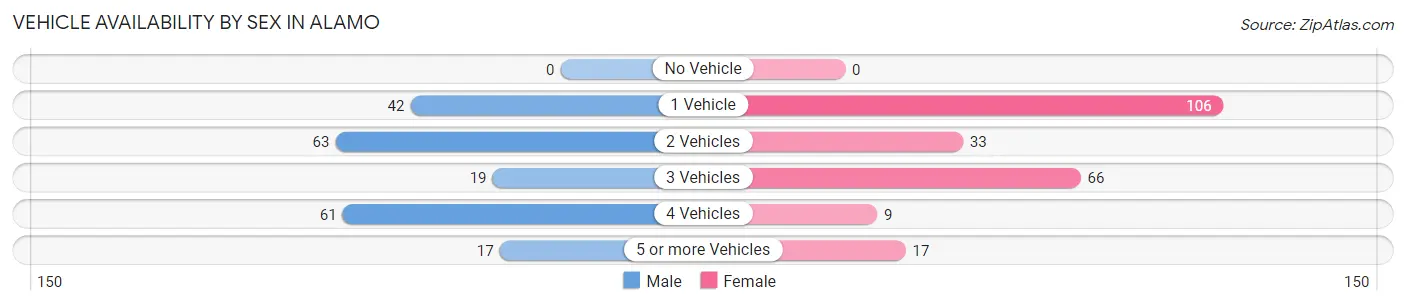
| Vehicles Available | Male | Female |
| No Vehicle | 0 (0.0%) | 0 (0.0%) |
| 1 Vehicle | 42 (20.8%) | 106 (45.9%) |
| 2 Vehicles | 63 (31.2%) | 33 (14.3%) |
| 3 Vehicles | 19 (9.4%) | 66 (28.6%) |
| 4 Vehicles | 61 (30.2%) | 9 (3.9%) |
| 5 or more Vehicles | 17 (8.4%) | 17 (7.4%) |
| Total | 202 (100.0%) | 231 (100.0%) |
Commute Time in Alamo
The most frequently occuring commute durations in Alamo are 10 to 14 minutes (139 commuters, 32.1%), less than 5 minutes (138 commuters, 31.9%), and 60 to 89 minutes (62 commuters, 14.3%).
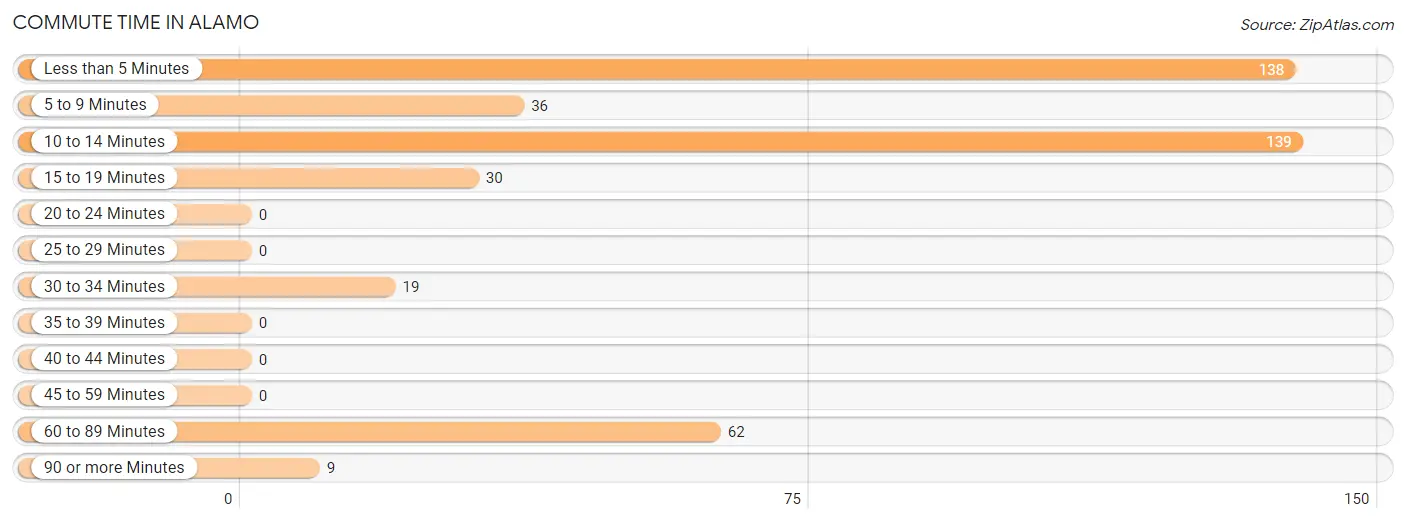
| Commute Time | # Commuters | % Commuters |
| Less than 5 Minutes | 138 | 31.9% |
| 5 to 9 Minutes | 36 | 8.3% |
| 10 to 14 Minutes | 139 | 32.1% |
| 15 to 19 Minutes | 30 | 6.9% |
| 20 to 24 Minutes | 0 | 0.0% |
| 25 to 29 Minutes | 0 | 0.0% |
| 30 to 34 Minutes | 19 | 4.4% |
| 35 to 39 Minutes | 0 | 0.0% |
| 40 to 44 Minutes | 0 | 0.0% |
| 45 to 59 Minutes | 0 | 0.0% |
| 60 to 89 Minutes | 62 | 14.3% |
| 90 or more Minutes | 9 | 2.1% |
Commute Time by Sex in Alamo
The most common commute times in Alamo are less than 5 minutes (105 commuters, 52.0%) for males and 10 to 14 minutes (123 commuters, 53.2%) for females.
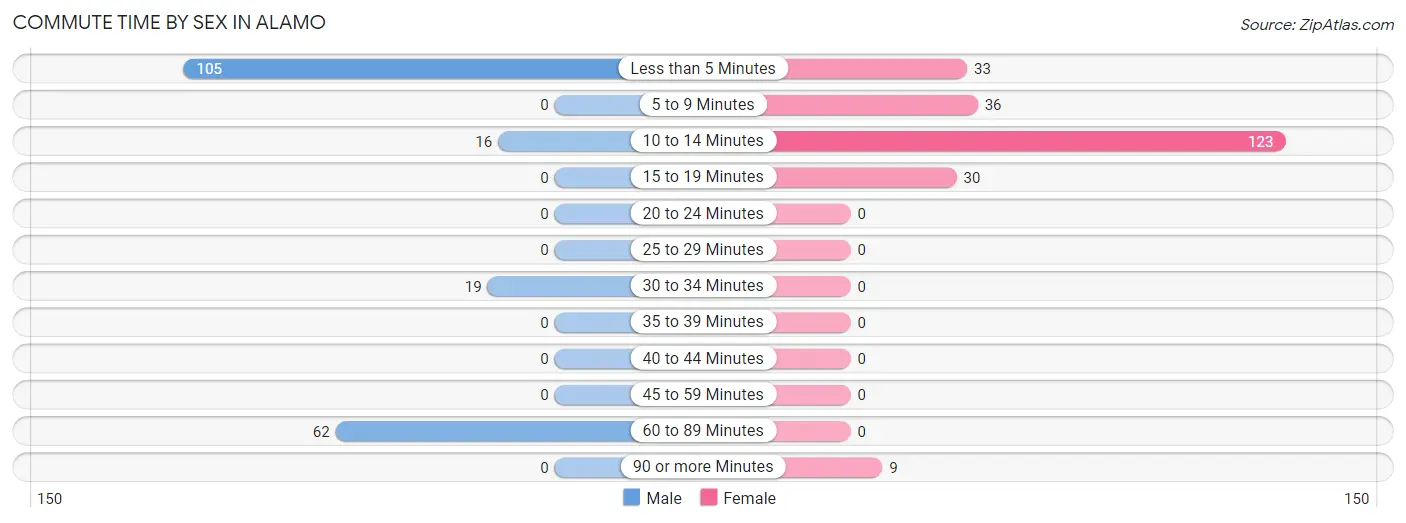
| Commute Time | Male | Female |
| Less than 5 Minutes | 105 (52.0%) | 33 (14.3%) |
| 5 to 9 Minutes | 0 (0.0%) | 36 (15.6%) |
| 10 to 14 Minutes | 16 (7.9%) | 123 (53.2%) |
| 15 to 19 Minutes | 0 (0.0%) | 30 (13.0%) |
| 20 to 24 Minutes | 0 (0.0%) | 0 (0.0%) |
| 25 to 29 Minutes | 0 (0.0%) | 0 (0.0%) |
| 30 to 34 Minutes | 19 (9.4%) | 0 (0.0%) |
| 35 to 39 Minutes | 0 (0.0%) | 0 (0.0%) |
| 40 to 44 Minutes | 0 (0.0%) | 0 (0.0%) |
| 45 to 59 Minutes | 0 (0.0%) | 0 (0.0%) |
| 60 to 89 Minutes | 62 (30.7%) | 0 (0.0%) |
| 90 or more Minutes | 0 (0.0%) | 9 (3.9%) |
Time of Departure to Work by Sex in Alamo
The most frequent times of departure to work in Alamo are 7:30 AM to 7:59 AM (61, 30.2%) for males and 12:00 PM to 3:59 PM (85, 36.8%) for females.
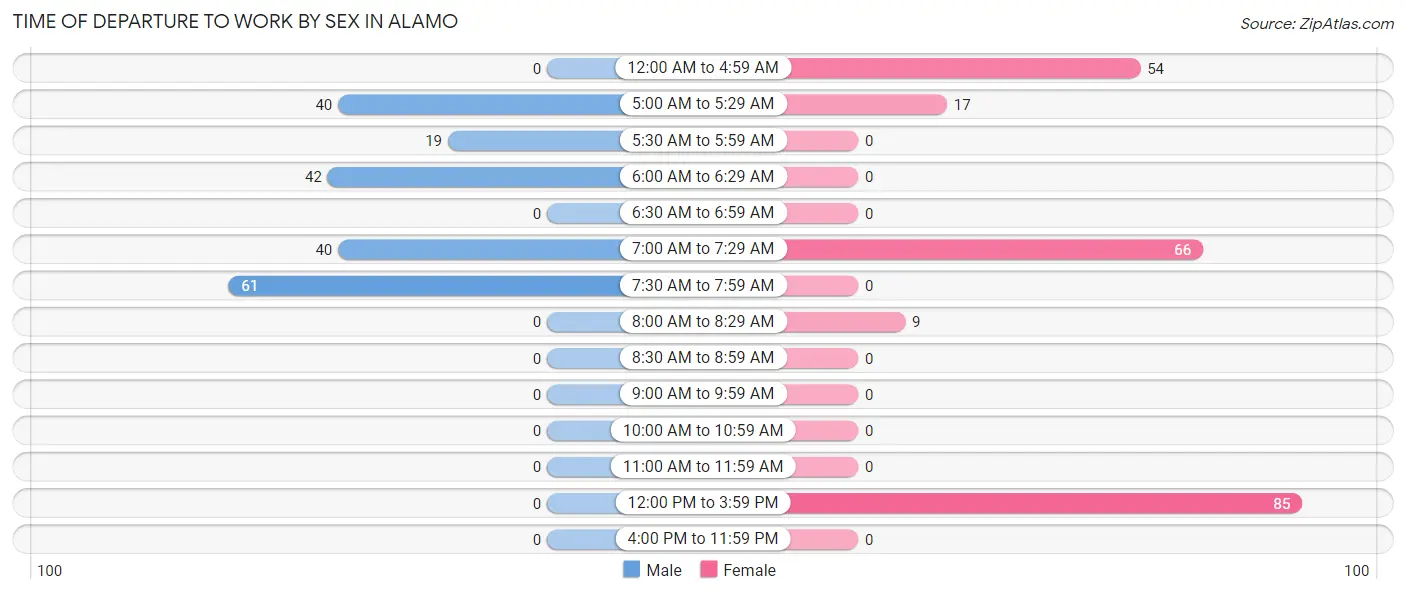
| Time of Departure | Male | Female |
| 12:00 AM to 4:59 AM | 0 (0.0%) | 54 (23.4%) |
| 5:00 AM to 5:29 AM | 40 (19.8%) | 17 (7.4%) |
| 5:30 AM to 5:59 AM | 19 (9.4%) | 0 (0.0%) |
| 6:00 AM to 6:29 AM | 42 (20.8%) | 0 (0.0%) |
| 6:30 AM to 6:59 AM | 0 (0.0%) | 0 (0.0%) |
| 7:00 AM to 7:29 AM | 40 (19.8%) | 66 (28.6%) |
| 7:30 AM to 7:59 AM | 61 (30.2%) | 0 (0.0%) |
| 8:00 AM to 8:29 AM | 0 (0.0%) | 9 (3.9%) |
| 8:30 AM to 8:59 AM | 0 (0.0%) | 0 (0.0%) |
| 9:00 AM to 9:59 AM | 0 (0.0%) | 0 (0.0%) |
| 10:00 AM to 10:59 AM | 0 (0.0%) | 0 (0.0%) |
| 11:00 AM to 11:59 AM | 0 (0.0%) | 0 (0.0%) |
| 12:00 PM to 3:59 PM | 0 (0.0%) | 85 (36.8%) |
| 4:00 PM to 11:59 PM | 0 (0.0%) | 0 (0.0%) |
| Total | 202 (100.0%) | 231 (100.0%) |
Housing Occupancy in Alamo
Occupancy by Ownership in Alamo
Of the total 378 dwellings in Alamo, owner-occupied units account for 259 (68.5%), while renter-occupied units make up 119 (31.5%).
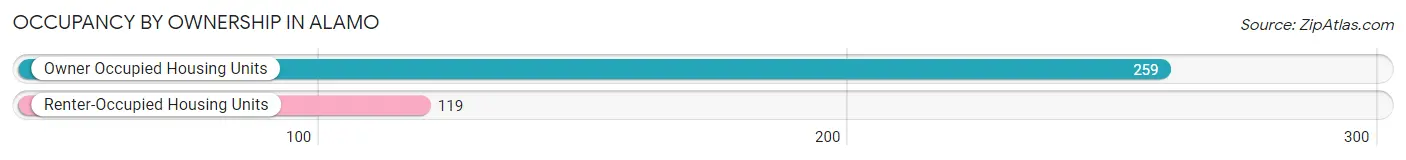
| Occupancy | # Housing Units | % Housing Units |
| Owner Occupied Housing Units | 259 | 68.5% |
| Renter-Occupied Housing Units | 119 | 31.5% |
| Total Occupied Housing Units | 378 | 100.0% |
Occupancy by Household Size in Alamo
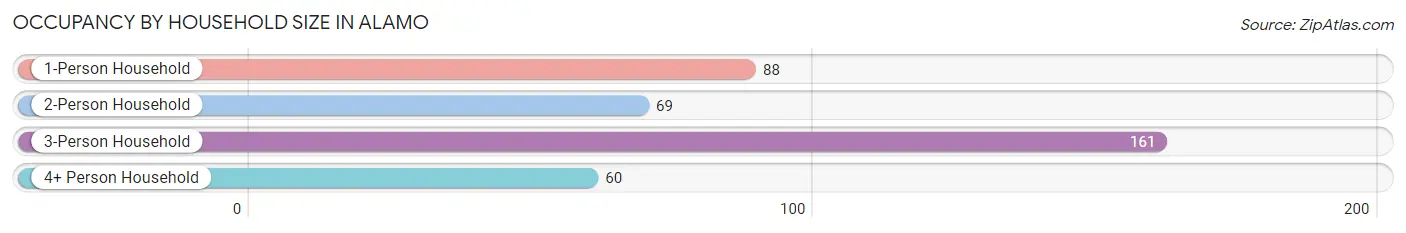
| Household Size | # Housing Units | % Housing Units |
| 1-Person Household | 88 | 23.3% |
| 2-Person Household | 69 | 18.2% |
| 3-Person Household | 161 | 42.6% |
| 4+ Person Household | 60 | 15.9% |
| Total Housing Units | 378 | 100.0% |
Occupancy by Ownership by Household Size in Alamo
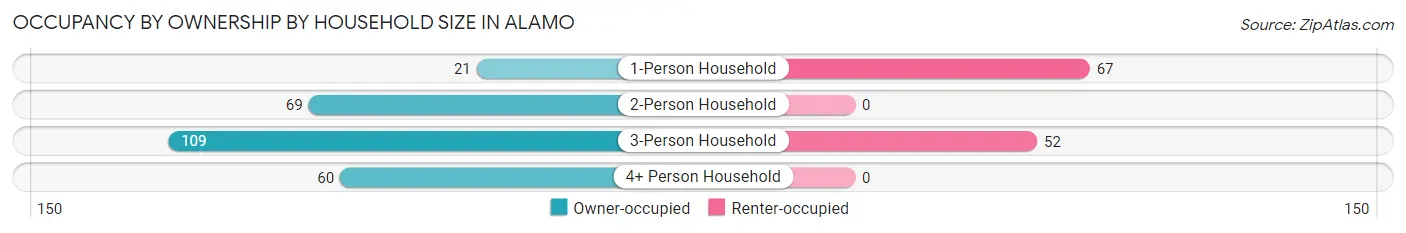
| Household Size | Owner-occupied | Renter-occupied |
| 1-Person Household | 21 (23.9%) | 67 (76.1%) |
| 2-Person Household | 69 (100.0%) | 0 (0.0%) |
| 3-Person Household | 109 (67.7%) | 52 (32.3%) |
| 4+ Person Household | 60 (100.0%) | 0 (0.0%) |
| Total Housing Units | 259 (68.5%) | 119 (31.5%) |
Occupancy by Educational Attainment in Alamo
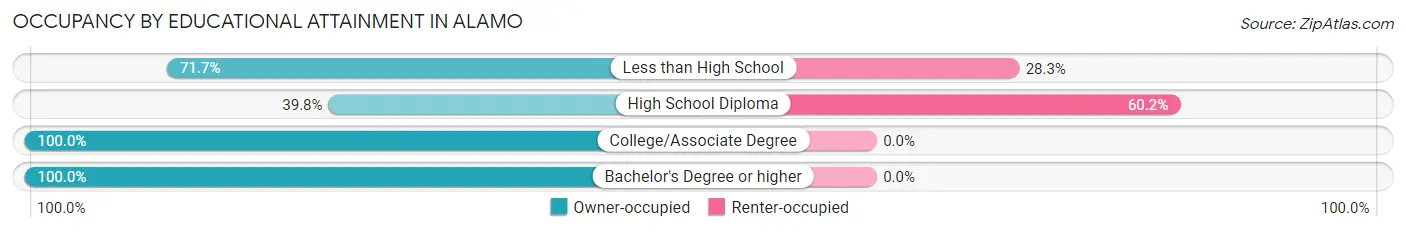
| Household Size | Owner-occupied | Renter-occupied |
| Less than High School | 33 (71.7%) | 13 (28.3%) |
| High School Diploma | 70 (39.8%) | 106 (60.2%) |
| College/Associate Degree | 111 (100.0%) | 0 (0.0%) |
| Bachelor's Degree or higher | 45 (100.0%) | 0 (0.0%) |
Occupancy by Age of Householder in Alamo
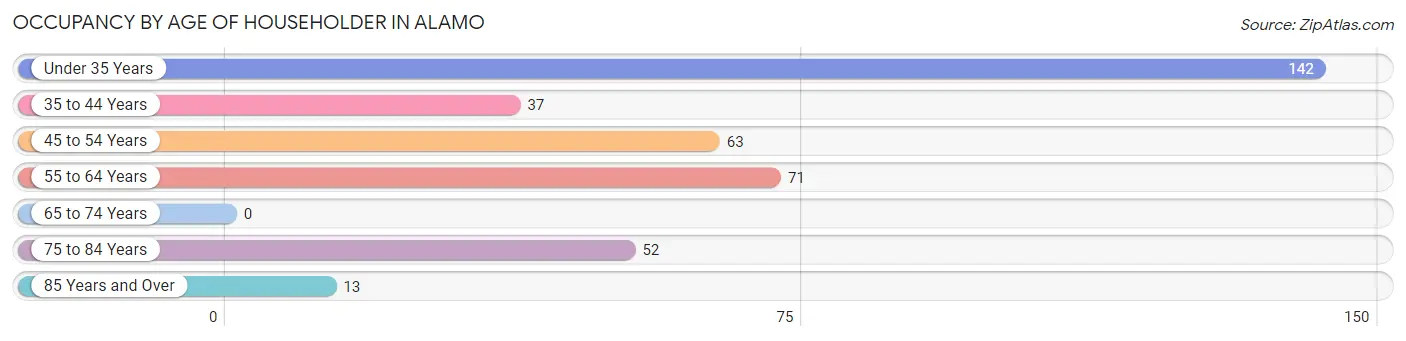
| Age Bracket | # Households | % Households |
| Under 35 Years | 142 | 37.6% |
| 35 to 44 Years | 37 | 9.8% |
| 45 to 54 Years | 63 | 16.7% |
| 55 to 64 Years | 71 | 18.8% |
| 65 to 74 Years | 0 | 0.0% |
| 75 to 84 Years | 52 | 13.8% |
| 85 Years and Over | 13 | 3.4% |
| Total | 378 | 100.0% |
Housing Finances in Alamo
Median Income by Occupancy in Alamo
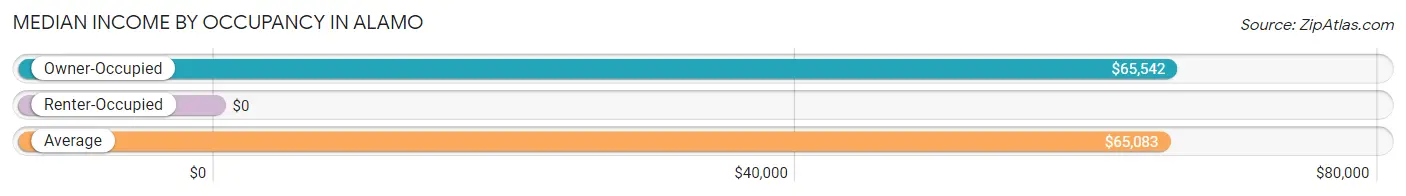
| Occupancy Type | # Households | Median Income |
| Owner-Occupied | 259 (68.5%) | $65,542 |
| Renter-Occupied | 119 (31.5%) | $0 |
| Average | 378 (100.0%) | $65,083 |
Occupancy by Householder Income Bracket in Alamo
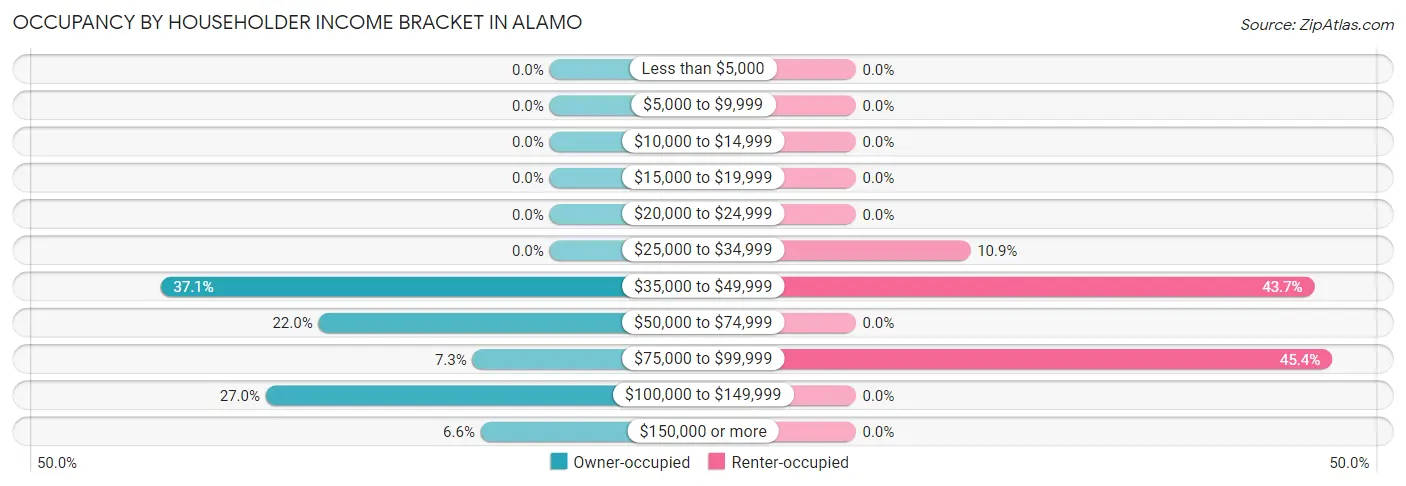
| Income Bracket | Owner-occupied | Renter-occupied |
| Less than $5,000 | 0 (0.0%) | 0 (0.0%) |
| $5,000 to $9,999 | 0 (0.0%) | 0 (0.0%) |
| $10,000 to $14,999 | 0 (0.0%) | 0 (0.0%) |
| $15,000 to $19,999 | 0 (0.0%) | 0 (0.0%) |
| $20,000 to $24,999 | 0 (0.0%) | 0 (0.0%) |
| $25,000 to $34,999 | 0 (0.0%) | 13 (10.9%) |
| $35,000 to $49,999 | 96 (37.1%) | 52 (43.7%) |
| $50,000 to $74,999 | 57 (22.0%) | 0 (0.0%) |
| $75,000 to $99,999 | 19 (7.3%) | 54 (45.4%) |
| $100,000 to $149,999 | 70 (27.0%) | 0 (0.0%) |
| $150,000 or more | 17 (6.6%) | 0 (0.0%) |
| Total | 259 (100.0%) | 119 (100.0%) |
Monthly Housing Cost Tiers in Alamo
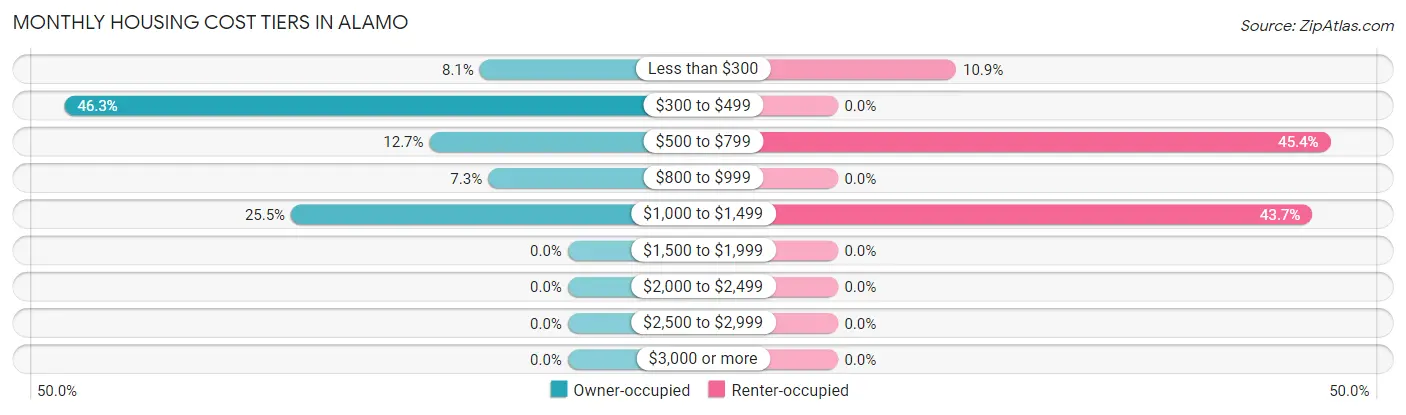
| Monthly Cost | Owner-occupied | Renter-occupied |
| Less than $300 | 21 (8.1%) | 13 (10.9%) |
| $300 to $499 | 120 (46.3%) | 0 (0.0%) |
| $500 to $799 | 33 (12.7%) | 54 (45.4%) |
| $800 to $999 | 19 (7.3%) | 0 (0.0%) |
| $1,000 to $1,499 | 66 (25.5%) | 52 (43.7%) |
| $1,500 to $1,999 | 0 (0.0%) | 0 (0.0%) |
| $2,000 to $2,499 | 0 (0.0%) | 0 (0.0%) |
| $2,500 to $2,999 | 0 (0.0%) | 0 (0.0%) |
| $3,000 or more | 0 (0.0%) | 0 (0.0%) |
| Total | 259 (100.0%) | 119 (100.0%) |
Physical Housing Characteristics in Alamo
Housing Structures in Alamo
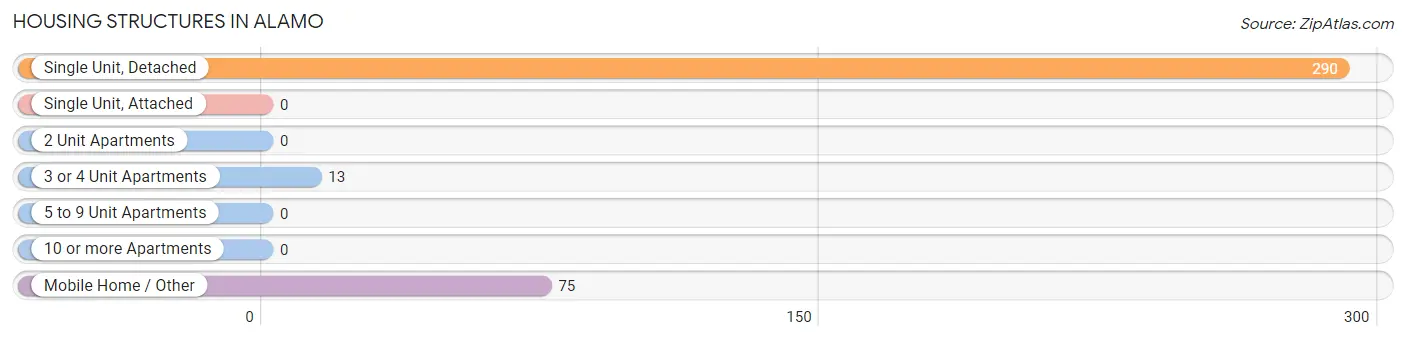
| Structure Type | # Housing Units | % Housing Units |
| Single Unit, Detached | 290 | 76.7% |
| Single Unit, Attached | 0 | 0.0% |
| 2 Unit Apartments | 0 | 0.0% |
| 3 or 4 Unit Apartments | 13 | 3.4% |
| 5 to 9 Unit Apartments | 0 | 0.0% |
| 10 or more Apartments | 0 | 0.0% |
| Mobile Home / Other | 75 | 19.8% |
| Total | 378 | 100.0% |
Housing Structures by Occupancy in Alamo
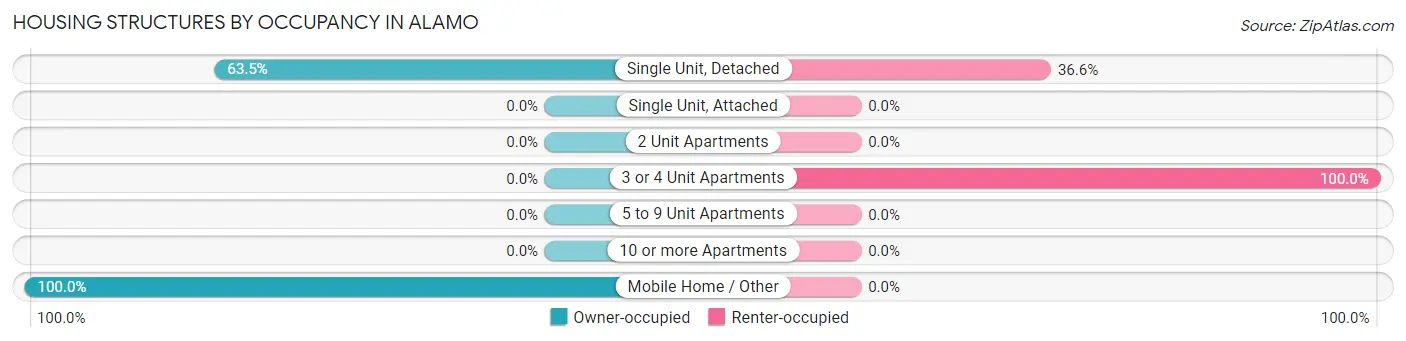
| Structure Type | Owner-occupied | Renter-occupied |
| Single Unit, Detached | 184 (63.4%) | 106 (36.5%) |
| Single Unit, Attached | 0 (0.0%) | 0 (0.0%) |
| 2 Unit Apartments | 0 (0.0%) | 0 (0.0%) |
| 3 or 4 Unit Apartments | 0 (0.0%) | 13 (100.0%) |
| 5 to 9 Unit Apartments | 0 (0.0%) | 0 (0.0%) |
| 10 or more Apartments | 0 (0.0%) | 0 (0.0%) |
| Mobile Home / Other | 75 (100.0%) | 0 (0.0%) |
| Total | 259 (68.5%) | 119 (31.5%) |
Housing Structures by Number of Rooms in Alamo
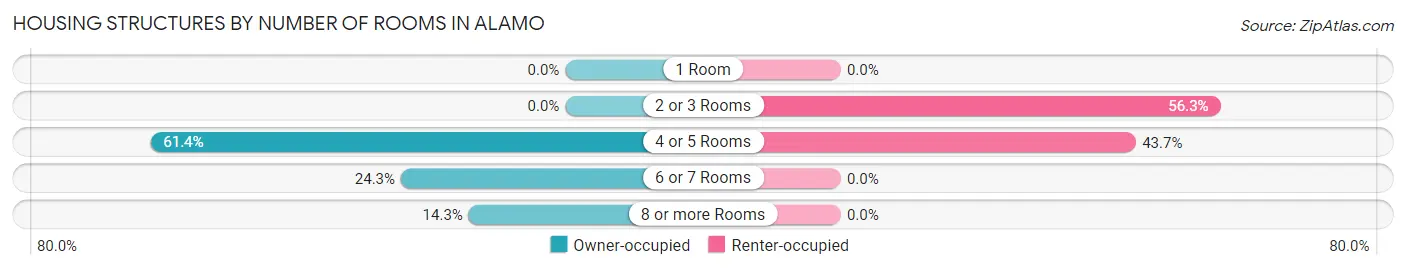
| Number of Rooms | Owner-occupied | Renter-occupied |
| 1 Room | 0 (0.0%) | 0 (0.0%) |
| 2 or 3 Rooms | 0 (0.0%) | 67 (56.3%) |
| 4 or 5 Rooms | 159 (61.4%) | 52 (43.7%) |
| 6 or 7 Rooms | 63 (24.3%) | 0 (0.0%) |
| 8 or more Rooms | 37 (14.3%) | 0 (0.0%) |
| Total | 259 (100.0%) | 119 (100.0%) |
Housing Structure by Heating Type in Alamo
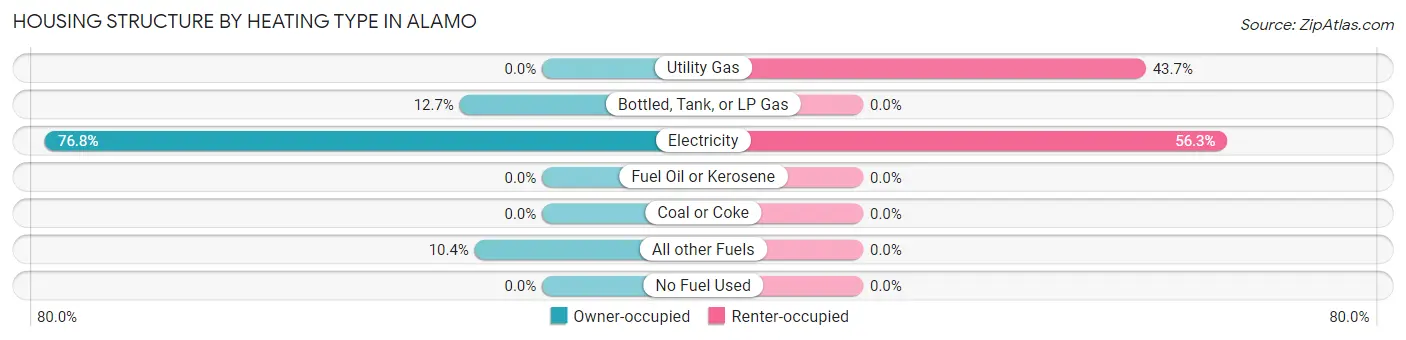
| Heating Type | Owner-occupied | Renter-occupied |
| Utility Gas | 0 (0.0%) | 52 (43.7%) |
| Bottled, Tank, or LP Gas | 33 (12.7%) | 0 (0.0%) |
| Electricity | 199 (76.8%) | 67 (56.3%) |
| Fuel Oil or Kerosene | 0 (0.0%) | 0 (0.0%) |
| Coal or Coke | 0 (0.0%) | 0 (0.0%) |
| All other Fuels | 27 (10.4%) | 0 (0.0%) |
| No Fuel Used | 0 (0.0%) | 0 (0.0%) |
| Total | 259 (100.0%) | 119 (100.0%) |
Household Vehicle Usage in Alamo
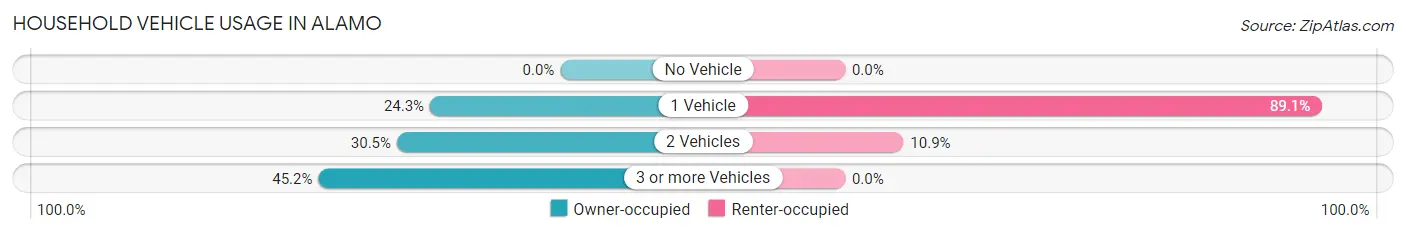
| Vehicles per Household | Owner-occupied | Renter-occupied |
| No Vehicle | 0 (0.0%) | 0 (0.0%) |
| 1 Vehicle | 63 (24.3%) | 106 (89.1%) |
| 2 Vehicles | 79 (30.5%) | 13 (10.9%) |
| 3 or more Vehicles | 117 (45.2%) | 0 (0.0%) |
| Total | 259 (100.0%) | 119 (100.0%) |
Real Estate & Mortgages in Alamo
Real Estate and Mortgage Overview in Alamo
| Characteristic | Without Mortgage | With Mortgage |
| Housing Units | 174 | 85 |
| Median Property Value | $77,900 | $173,100 |
| Median Household Income | - | - |
| Monthly Housing Costs | $431 | $0 |
| Real Estate Taxes | $771 | $0 |
Property Value by Mortgage Status in Alamo
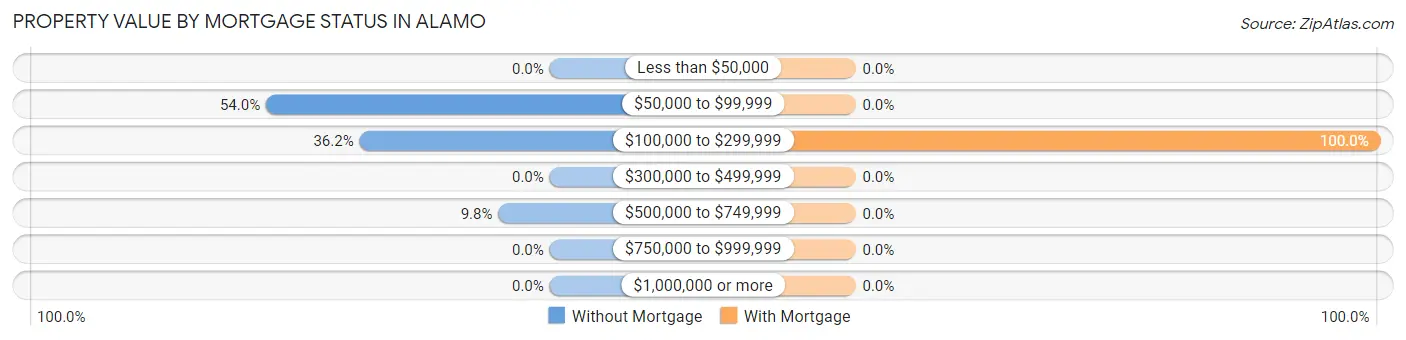
| Property Value | Without Mortgage | With Mortgage |
| Less than $50,000 | 0 (0.0%) | 0 (0.0%) |
| $50,000 to $99,999 | 94 (54.0%) | 0 (0.0%) |
| $100,000 to $299,999 | 63 (36.2%) | 85 (100.0%) |
| $300,000 to $499,999 | 0 (0.0%) | 0 (0.0%) |
| $500,000 to $749,999 | 17 (9.8%) | 0 (0.0%) |
| $750,000 to $999,999 | 0 (0.0%) | 0 (0.0%) |
| $1,000,000 or more | 0 (0.0%) | 0 (0.0%) |
| Total | 174 (100.0%) | 85 (100.0%) |
Household Income by Mortgage Status in Alamo
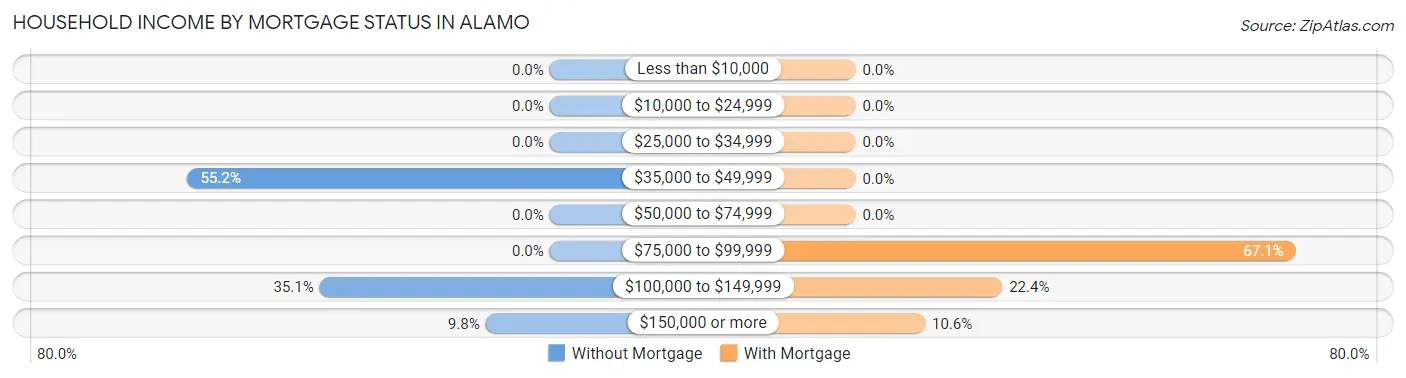
| Household Income | Without Mortgage | With Mortgage |
| Less than $10,000 | 0 (0.0%) | 0 (0.0%) |
| $10,000 to $24,999 | 0 (0.0%) | 0 (0.0%) |
| $25,000 to $34,999 | 0 (0.0%) | 0 (0.0%) |
| $35,000 to $49,999 | 96 (55.2%) | 0 (0.0%) |
| $50,000 to $74,999 | 0 (0.0%) | 0 (0.0%) |
| $75,000 to $99,999 | 0 (0.0%) | 57 (67.1%) |
| $100,000 to $149,999 | 61 (35.1%) | 19 (22.4%) |
| $150,000 or more | 17 (9.8%) | 9 (10.6%) |
| Total | 174 (100.0%) | 85 (100.0%) |
Property Value to Household Income Ratio in Alamo
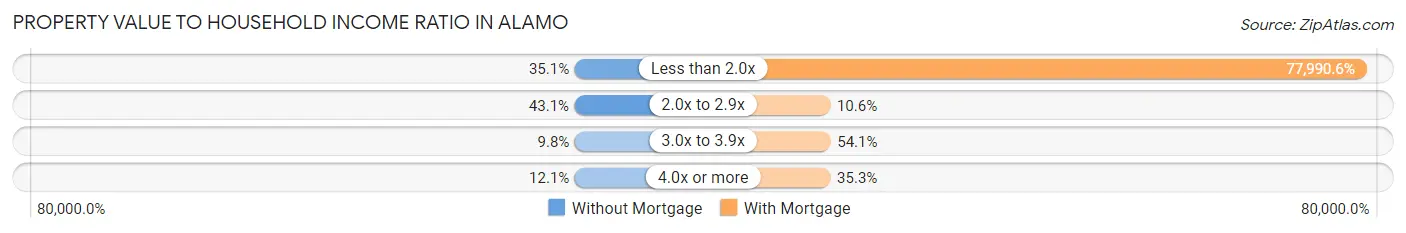
| Value-to-Income Ratio | Without Mortgage | With Mortgage |
| Less than 2.0x | 61 (35.1%) | 66,292 (77,990.6%) |
| 2.0x to 2.9x | 75 (43.1%) | 9 (10.6%) |
| 3.0x to 3.9x | 17 (9.8%) | 46 (54.1%) |
| 4.0x or more | 21 (12.1%) | 30 (35.3%) |
| Total | 174 (100.0%) | 85 (100.0%) |
Real Estate Taxes by Mortgage Status in Alamo
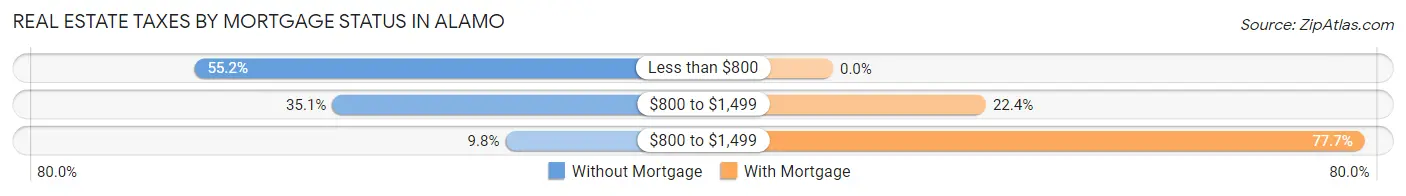
| Property Taxes | Without Mortgage | With Mortgage |
| Less than $800 | 96 (55.2%) | 0 (0.0%) |
| $800 to $1,499 | 61 (35.1%) | 19 (22.4%) |
| $800 to $1,499 | 17 (9.8%) | 66 (77.6%) |
| Total | 174 (100.0%) | 85 (100.0%) |
Health & Disability in Alamo
Health Insurance Coverage by Age in Alamo
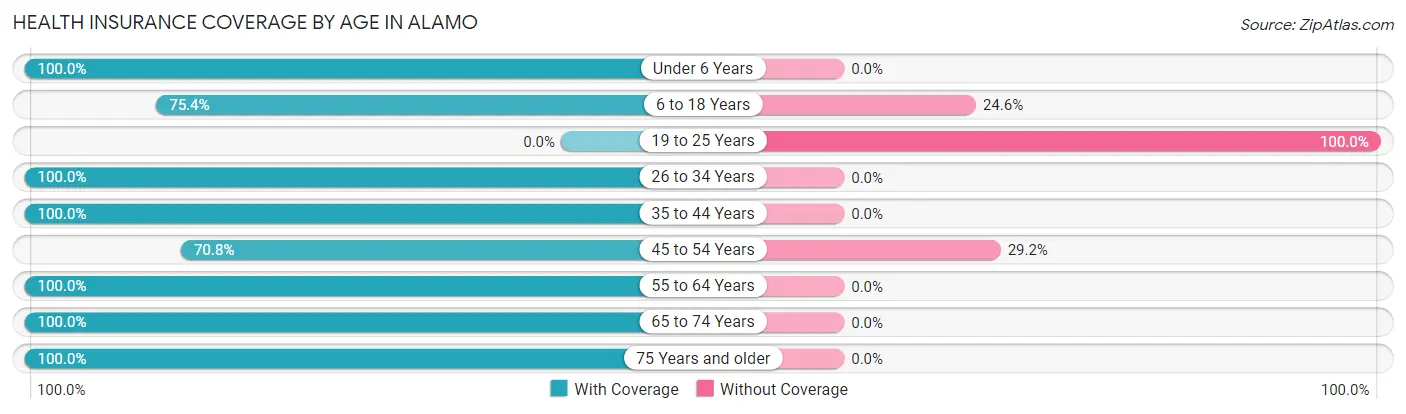
| Age Bracket | With Coverage | Without Coverage |
| Under 6 Years | 111 (100.0%) | 0 (0.0%) |
| 6 to 18 Years | 172 (75.4%) | 56 (24.6%) |
| 19 to 25 Years | 0 (0.0%) | 85 (100.0%) |
| 26 to 34 Years | 135 (100.0%) | 0 (0.0%) |
| 35 to 44 Years | 93 (100.0%) | 0 (0.0%) |
| 45 to 54 Years | 102 (70.8%) | 42 (29.2%) |
| 55 to 64 Years | 88 (100.0%) | 0 (0.0%) |
| 65 to 74 Years | 39 (100.0%) | 0 (0.0%) |
| 75 Years and older | 96 (100.0%) | 0 (0.0%) |
| Total | 836 (82.0%) | 183 (18.0%) |
Health Insurance Coverage by Citizenship Status in Alamo
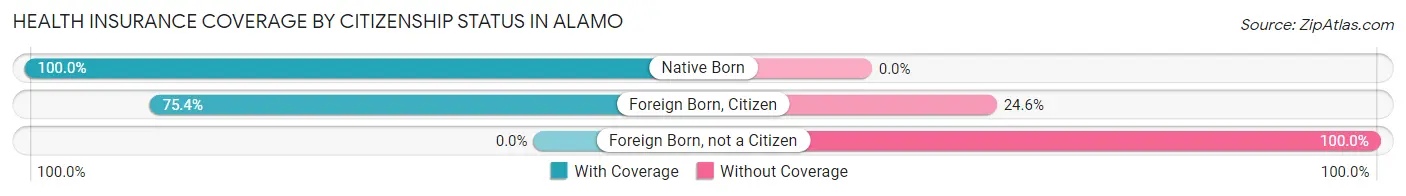
| Citizenship Status | With Coverage | Without Coverage |
| Native Born | 111 (100.0%) | 0 (0.0%) |
| Foreign Born, Citizen | 172 (75.4%) | 56 (24.6%) |
| Foreign Born, not a Citizen | 0 (0.0%) | 85 (100.0%) |
Health Insurance Coverage by Household Income in Alamo
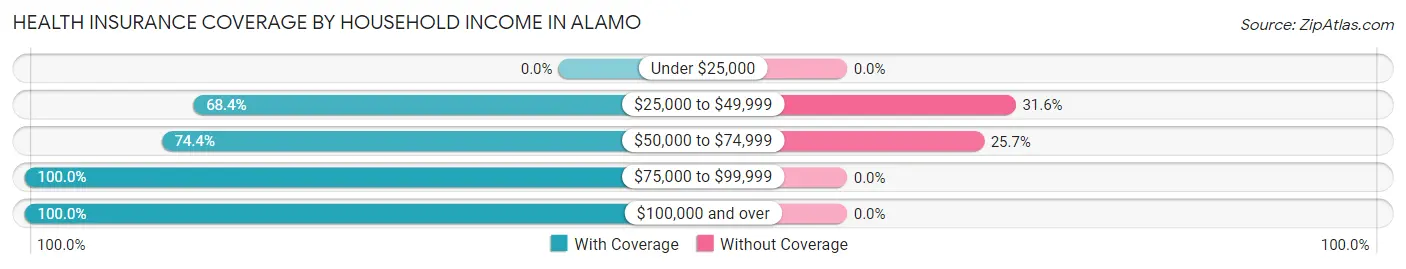
| Household Income | With Coverage | Without Coverage |
| Under $25,000 | 0 (0.0%) | 0 (0.0%) |
| $25,000 to $49,999 | 290 (68.4%) | 134 (31.6%) |
| $50,000 to $74,999 | 142 (74.4%) | 49 (25.7%) |
| $75,000 to $99,999 | 112 (100.0%) | 0 (0.0%) |
| $100,000 and over | 292 (100.0%) | 0 (0.0%) |
Public vs Private Health Insurance Coverage by Age in Alamo
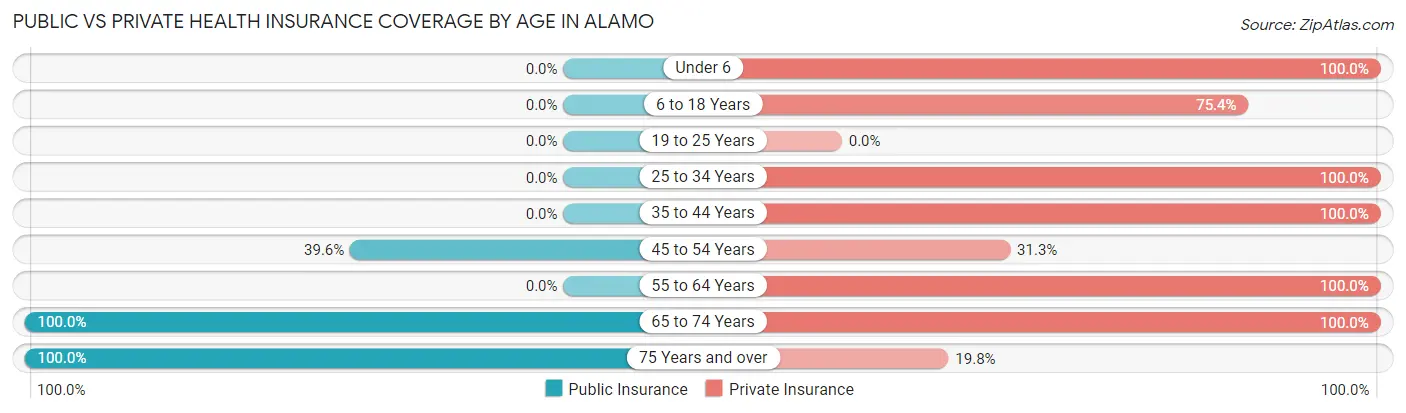
| Age Bracket | Public Insurance | Private Insurance |
| Under 6 | 0 (0.0%) | 111 (100.0%) |
| 6 to 18 Years | 0 (0.0%) | 172 (75.4%) |
| 19 to 25 Years | 0 (0.0%) | 0 (0.0%) |
| 25 to 34 Years | 0 (0.0%) | 135 (100.0%) |
| 35 to 44 Years | 0 (0.0%) | 93 (100.0%) |
| 45 to 54 Years | 57 (39.6%) | 45 (31.2%) |
| 55 to 64 Years | 0 (0.0%) | 88 (100.0%) |
| 65 to 74 Years | 39 (100.0%) | 39 (100.0%) |
| 75 Years and over | 96 (100.0%) | 19 (19.8%) |
| Total | 192 (18.8%) | 702 (68.9%) |
Disability Status by Sex by Age in Alamo
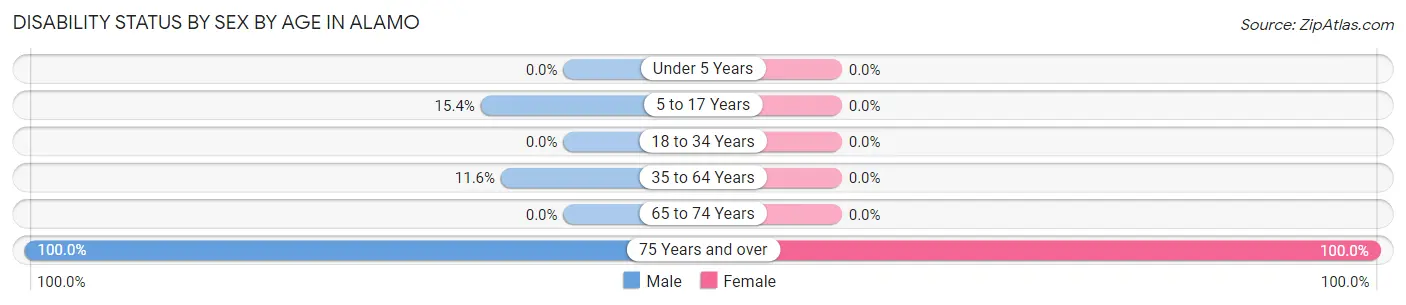
| Age Bracket | Male | Female |
| Under 5 Years | 0 (0.0%) | 0 (0.0%) |
| 5 to 17 Years | 33 (15.3%) | 0 (0.0%) |
| 18 to 34 Years | 0 (0.0%) | 0 (0.0%) |
| 35 to 64 Years | 21 (11.6%) | 0 (0.0%) |
| 65 to 74 Years | 0 (0.0%) | 0 (0.0%) |
| 75 Years and over | 50 (100.0%) | 46 (100.0%) |
Disability Class by Sex by Age in Alamo
Disability Class: Hearing Difficulty
| Age Bracket | Male | Female |
| Under 5 Years | 0 (0.0%) | 0 (0.0%) |
| 5 to 17 Years | 0 (0.0%) | 0 (0.0%) |
| 18 to 34 Years | 0 (0.0%) | 0 (0.0%) |
| 35 to 64 Years | 0 (0.0%) | 0 (0.0%) |
| 65 to 74 Years | 0 (0.0%) | 0 (0.0%) |
| 75 Years and over | 0 (0.0%) | 0 (0.0%) |
Disability Class: Vision Difficulty
| Age Bracket | Male | Female |
| Under 5 Years | 0 (0.0%) | 0 (0.0%) |
| 5 to 17 Years | 0 (0.0%) | 0 (0.0%) |
| 18 to 34 Years | 0 (0.0%) | 0 (0.0%) |
| 35 to 64 Years | 0 (0.0%) | 0 (0.0%) |
| 65 to 74 Years | 0 (0.0%) | 0 (0.0%) |
| 75 Years and over | 0 (0.0%) | 0 (0.0%) |
Disability Class: Cognitive Difficulty
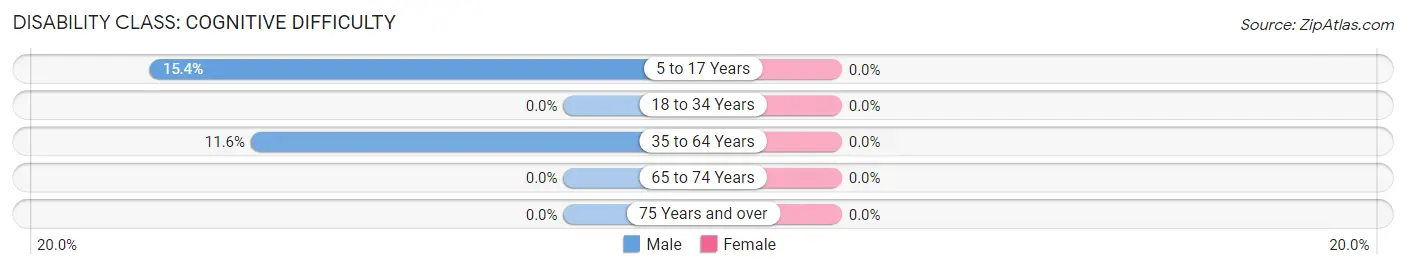
| Age Bracket | Male | Female |
| 5 to 17 Years | 33 (15.3%) | 0 (0.0%) |
| 18 to 34 Years | 0 (0.0%) | 0 (0.0%) |
| 35 to 64 Years | 21 (11.6%) | 0 (0.0%) |
| 65 to 74 Years | 0 (0.0%) | 0 (0.0%) |
| 75 Years and over | 0 (0.0%) | 0 (0.0%) |
Disability Class: Ambulatory Difficulty
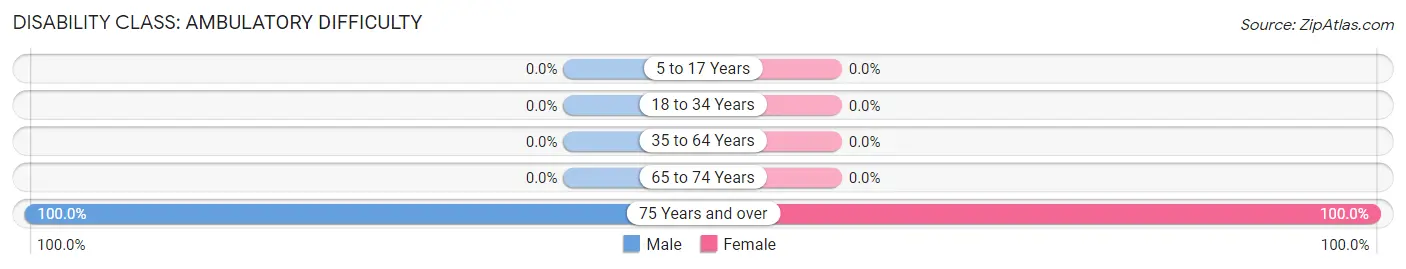
| Age Bracket | Male | Female |
| 5 to 17 Years | 0 (0.0%) | 0 (0.0%) |
| 18 to 34 Years | 0 (0.0%) | 0 (0.0%) |
| 35 to 64 Years | 0 (0.0%) | 0 (0.0%) |
| 65 to 74 Years | 0 (0.0%) | 0 (0.0%) |
| 75 Years and over | 50 (100.0%) | 46 (100.0%) |
Disability Class: Self-Care Difficulty
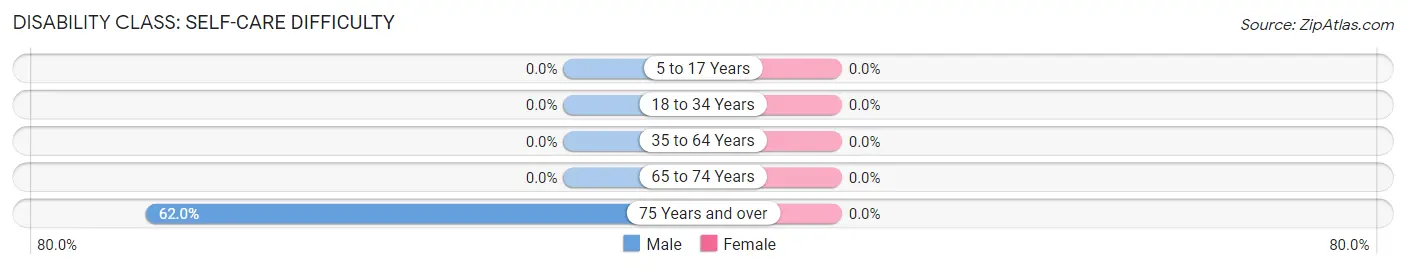
| Age Bracket | Male | Female |
| 5 to 17 Years | 0 (0.0%) | 0 (0.0%) |
| 18 to 34 Years | 0 (0.0%) | 0 (0.0%) |
| 35 to 64 Years | 0 (0.0%) | 0 (0.0%) |
| 65 to 74 Years | 0 (0.0%) | 0 (0.0%) |
| 75 Years and over | 31 (62.0%) | 0 (0.0%) |
Technology Access in Alamo
Computing Device Access in Alamo
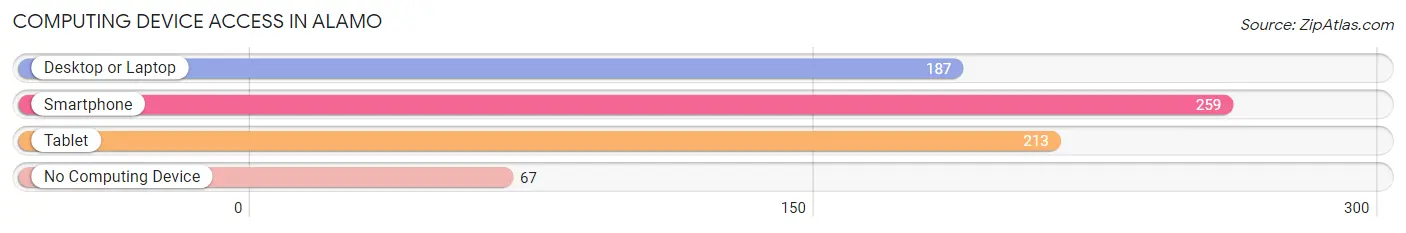
| Device Type | # Households | % Households |
| Desktop or Laptop | 187 | 49.5% |
| Smartphone | 259 | 68.5% |
| Tablet | 213 | 56.4% |
| No Computing Device | 67 | 17.7% |
| Total | 378 | 100.0% |
Internet Access in Alamo
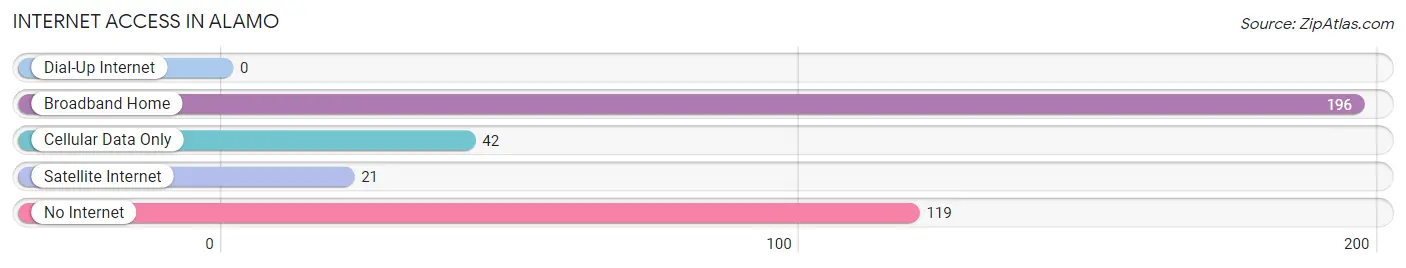
| Internet Type | # Households | % Households |
| Dial-Up Internet | 0 | 0.0% |
| Broadband Home | 196 | 51.8% |
| Cellular Data Only | 42 | 11.1% |
| Satellite Internet | 21 | 5.6% |
| No Internet | 119 | 31.5% |
| Total | 378 | 100.0% |
Alamo Summary
Alamo is a small town located in Lincoln County, Nevada, United States. It is situated in the northeastern part of the state, approximately 90 miles north of Las Vegas. The town was founded in 1876 and was named after the Alamo, a famous battle in the Texas Revolution. As of the 2010 census, the population of Alamo was 1,080.
Geography
Alamo is located in the northeastern part of Nevada, approximately 90 miles north of Las Vegas. It is situated in the Pahranagat Valley, which is surrounded by the Pahranagat Mountains to the east and the Spring Mountains to the west. The town is located at an elevation of 3,845 feet above sea level. The climate in Alamo is semi-arid, with hot summers and mild winters.
Economy
The economy of Alamo is largely based on agriculture and tourism. The town is home to several farms and ranches, which produce a variety of crops, including alfalfa, hay, and wheat. The town is also a popular destination for tourists, who come to enjoy the area’s natural beauty and outdoor activities.
Demographics
As of the 2010 census, the population of Alamo was 1,080. The racial makeup of the town was 94.2% White, 0.7% African American, 0.7% Native American, 0.3% Asian, 0.1% Pacific Islander, 2.2% from other races, and 1.7% from two or more races. Hispanic or Latino of any race were 5.2% of the population.
The median income for a household in Alamo was $37,500, and the median income for a family was $41,250. The per capita income for the town was $17,845. About 11.2% of families and 13.2% of the population were below the poverty line, including 16.7% of those under age 18 and 8.3% of those age 65 or over.
Conclusion
Alamo is a small town located in Lincoln County, Nevada, United States. It is situated in the northeastern part of the state, approximately 90 miles north of Las Vegas. The town was founded in 1876 and was named after the Alamo, a famous battle in the Texas Revolution. As of the 2010 census, the population of Alamo was 1,080. The economy of Alamo is largely based on agriculture and tourism. The racial makeup of the town was 94.2% White, 0.7% African American, 0.7% Native American, 0.3% Asian, 0.1% Pacific Islander, 2.2% from other races, and 1.7% from two or more races. The median income for a household in Alamo was $37,500, and the median income for a family was $41,250. Alamo is a small but vibrant town with a rich history and culture.
Common Questions
What is Per Capita Income in Alamo?
Per Capita income in Alamo is $30,120.
What is the Median Family Income in Alamo?
Median Family Income in Alamo is $62,778.
What is the Median Household income in Alamo?
Median Household Income in Alamo is $65,083.
What is Income or Wage Gap in Alamo?
Income or Wage Gap in Alamo is 60.2%.
Women in Alamo earn 39.8 cents for every dollar earned by a man.
What is Inequality or Gini Index in Alamo?
Inequality or Gini Index in Alamo is 0.26.
What is the Total Population of Alamo?
Total Population of Alamo is 1,019.
What is the Total Male Population of Alamo?
Total Male Population of Alamo is 596.
What is the Total Female Population of Alamo?
Total Female Population of Alamo is 423.
What is the Ratio of Males per 100 Females in Alamo?
There are 140.90 Males per 100 Females in Alamo.
What is the Ratio of Females per 100 Males in Alamo?
There are 70.97 Females per 100 Males in Alamo.
What is the Median Population Age in Alamo?
Median Population Age in Alamo is 31.1 Years.
What is the Average Family Size in Alamo
Average Family Size in Alamo is 3.2 People.
What is the Average Household Size in Alamo
Average Household Size in Alamo is 2.7 People.
How Large is the Labor Force in Alamo?
There are 433 People in the Labor Forcein in Alamo.
What is the Percentage of People in the Labor Force in Alamo?
61.1% of People are in the Labor Force in Alamo.