Zip Codes with the Highest Percentage of Population Employed in Agriculture, Fishing & Hunting in Grand Island, NE
RELATED REPORTS & OPTIONS
Agriculture, Fishing & Hunting
Grand Island
Compare Zip Codes
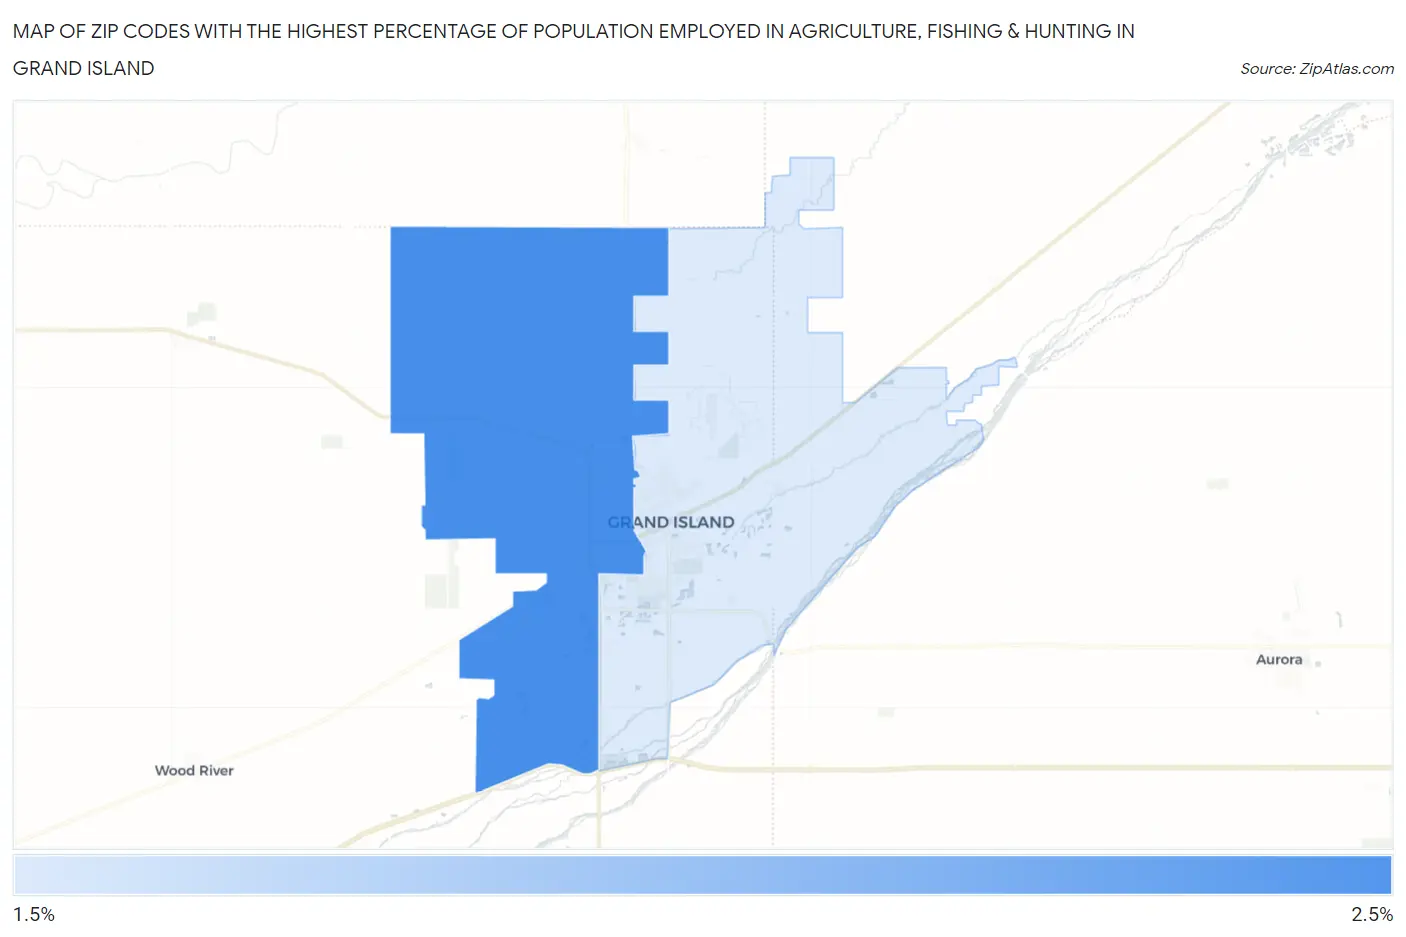
Map of Zip Codes with the Highest Percentage of Population Employed in Agriculture, Fishing & Hunting in Grand Island
0.0%
2.5%
Zip Codes with the Highest Percentage of Population Employed in Agriculture, Fishing & Hunting in Grand Island, NE
| Zip Code | % Employed | vs State | vs National | |
| 1. | 68803 | 2.1% | 4.1%(-2.06)#476 | 1.2%(+0.881)#12,550 |
| 2. | 68801 | 2.0% | 4.1%(-2.17)#481 | 1.2%(+0.771)#12,844 |
1
Common Questions
What are the Top Zip Codes with the Highest Percentage of Population Employed in Agriculture, Fishing & Hunting in Grand Island, NE?
Top Zip Codes with the Highest Percentage of Population Employed in Agriculture, Fishing & Hunting in Grand Island, NE are:
What zip code has the Highest Percentage of Population Employed in Agriculture, Fishing & Hunting in Grand Island, NE?
68803 has the Highest Percentage of Population Employed in Agriculture, Fishing & Hunting in Grand Island, NE with 2.1%.
What is the Percentage of Population Employed in Agriculture, Fishing & Hunting in Grand Island, NE?
Percentage of Population Employed in Agriculture, Fishing & Hunting in Grand Island is 1.7%.
What is the Percentage of Population Employed in Agriculture, Fishing & Hunting in Nebraska?
Percentage of Population Employed in Agriculture, Fishing & Hunting in Nebraska is 4.1%.
What is the Percentage of Population Employed in Agriculture, Fishing & Hunting in the United States?
Percentage of Population Employed in Agriculture, Fishing & Hunting in the United States is 1.2%.