Walcott, ND Map & Demographics
Walcott Map
Walcott Overview
$35,297
PER CAPITA INCOME
$96,250
AVG FAMILY INCOME
$89,375
AVG HOUSEHOLD INCOME
26.0%
WAGE / INCOME GAP [ % ]
74.0¢/ $1
WAGE / INCOME GAP [ $ ]
0.31
INEQUALITY / GINI INDEX
316
TOTAL POPULATION
161
MALE POPULATION
155
FEMALE POPULATION
103.87
MALES / 100 FEMALES
96.27
FEMALES / 100 MALES
34.9
MEDIAN AGE
2.9
AVG FAMILY SIZE
2.5
AVG HOUSEHOLD SIZE
162
LABOR FORCE [ PEOPLE ]
69.5%
PERCENT IN LABOR FORCE
2.5%
UNEMPLOYMENT RATE
Walcott Zip Codes
Walcott Area Codes
Income in Walcott
Income Overview in Walcott
Per Capita Income in Walcott is $35,297, while median incomes of families and households are $96,250 and $89,375 respectively.
| Characteristic | Number | Measure |
| Per Capita Income | 316 | $35,297 |
| Median Family Income | 91 | $96,250 |
| Mean Family Income | 91 | $100,445 |
| Median Household Income | 129 | $89,375 |
| Mean Household Income | 129 | $88,577 |
| Income Deficit | 91 | $0 |
| Wage / Income Gap (%) | 316 | 26.03% |
| Wage / Income Gap ($) | 316 | 73.97¢ per $1 |
| Gini / Inequality Index | 316 | 0.31 |
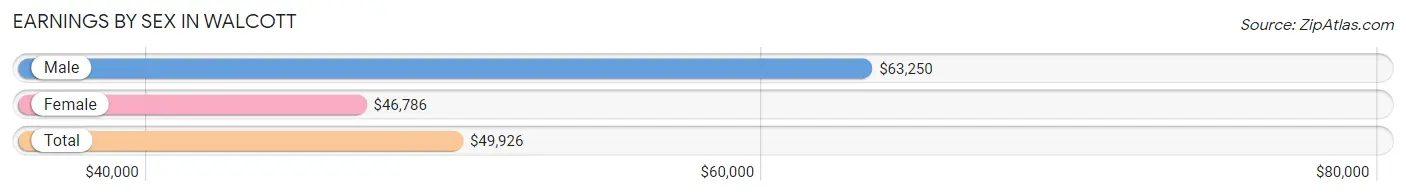
Earnings by Sex in Walcott
Average Earnings in Walcott are $49,926, $63,250 for men and $46,786 for women, a difference of 26.0%.
| Sex | Number | Average Earnings |
| Male | 83 (47.4%) | $63,250 |
| Female | 92 (52.6%) | $46,786 |
| Total | 175 (100.0%) | $49,926 |
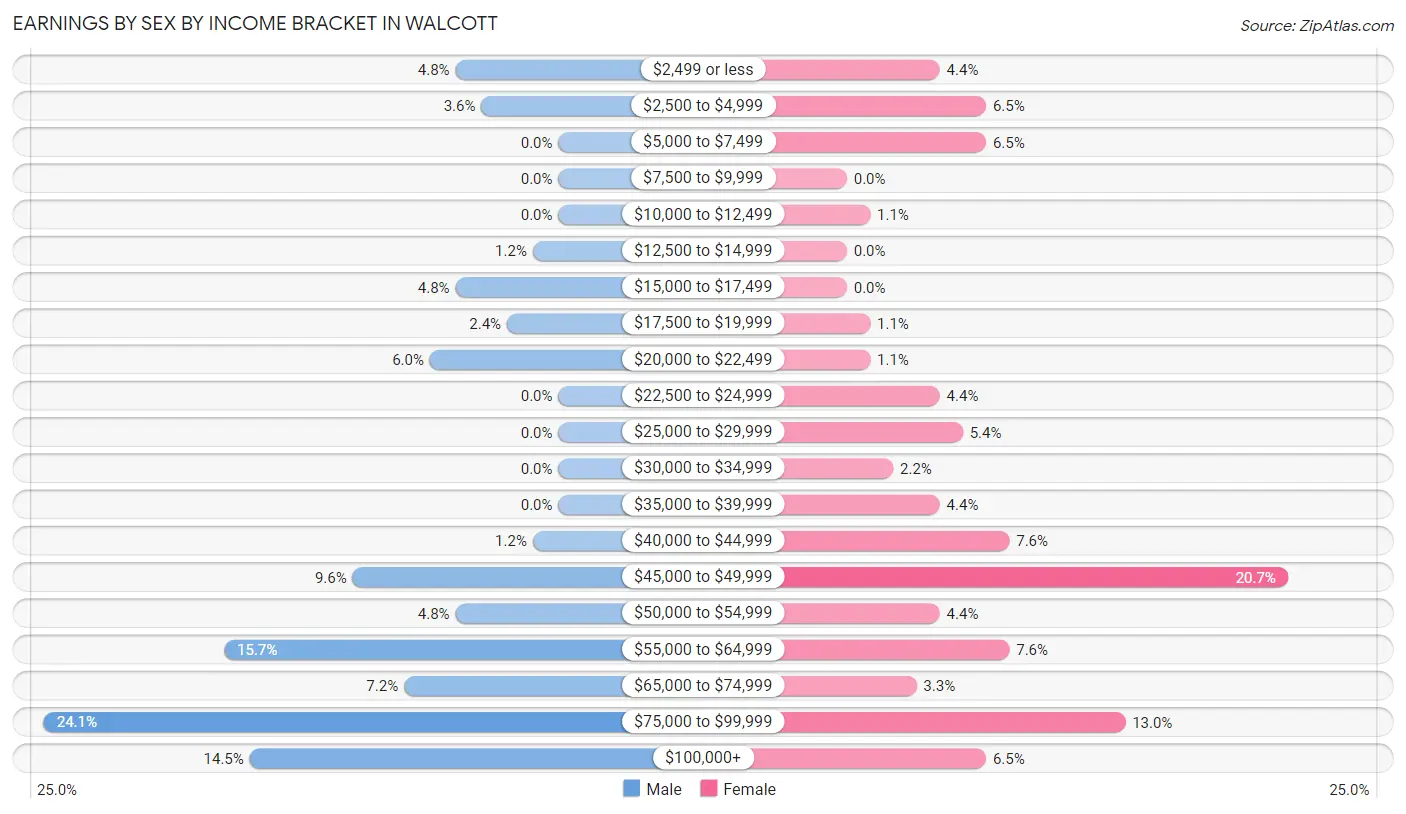
Earnings by Sex by Income Bracket in Walcott
The most common earnings brackets in Walcott are $75,000 to $99,999 for men (20 | 24.1%) and $45,000 to $49,999 for women (19 | 20.6%).
| Income | Male | Female |
| $2,499 or less | 4 (4.8%) | 4 (4.3%) |
| $2,500 to $4,999 | 3 (3.6%) | 6 (6.5%) |
| $5,000 to $7,499 | 0 (0.0%) | 6 (6.5%) |
| $7,500 to $9,999 | 0 (0.0%) | 0 (0.0%) |
| $10,000 to $12,499 | 0 (0.0%) | 1 (1.1%) |
| $12,500 to $14,999 | 1 (1.2%) | 0 (0.0%) |
| $15,000 to $17,499 | 4 (4.8%) | 0 (0.0%) |
| $17,500 to $19,999 | 2 (2.4%) | 1 (1.1%) |
| $20,000 to $22,499 | 5 (6.0%) | 1 (1.1%) |
| $22,500 to $24,999 | 0 (0.0%) | 4 (4.3%) |
| $25,000 to $29,999 | 0 (0.0%) | 5 (5.4%) |
| $30,000 to $34,999 | 0 (0.0%) | 2 (2.2%) |
| $35,000 to $39,999 | 0 (0.0%) | 4 (4.3%) |
| $40,000 to $44,999 | 1 (1.2%) | 7 (7.6%) |
| $45,000 to $49,999 | 8 (9.6%) | 19 (20.6%) |
| $50,000 to $54,999 | 4 (4.8%) | 4 (4.3%) |
| $55,000 to $64,999 | 13 (15.7%) | 7 (7.6%) |
| $65,000 to $74,999 | 6 (7.2%) | 3 (3.3%) |
| $75,000 to $99,999 | 20 (24.1%) | 12 (13.0%) |
| $100,000+ | 12 (14.5%) | 6 (6.5%) |
| Total | 83 (100.0%) | 92 (100.0%) |
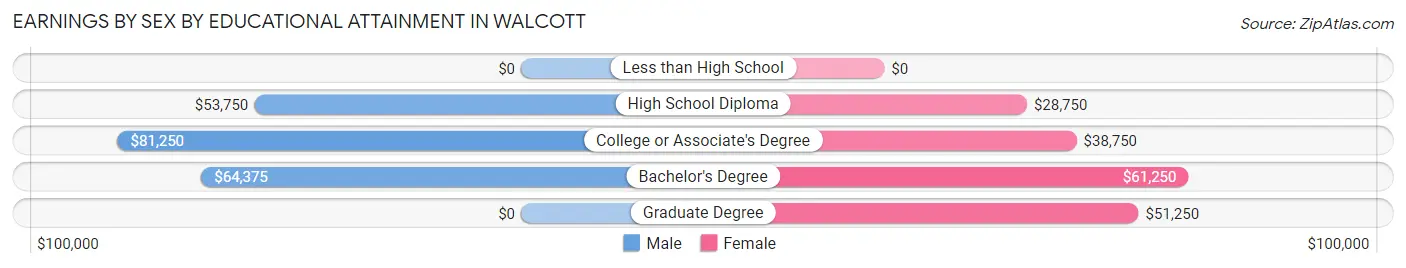
Earnings by Sex by Educational Attainment in Walcott
Average earnings in Walcott are $65,625 for men and $47,321 for women, a difference of 27.9%. Men with an educational attainment of college or associate's degree enjoy the highest average annual earnings of $81,250, while those with high school diploma education earn the least with $53,750. Women with an educational attainment of bachelor's degree earn the most with the average annual earnings of $61,250, while those with high school diploma education have the smallest earnings of $28,750.
| Educational Attainment | Male Income | Female Income |
| Less than High School | - | - |
| High School Diploma | $53,750 | $28,750 |
| College or Associate's Degree | $81,250 | $38,750 |
| Bachelor's Degree | $64,375 | $61,250 |
| Graduate Degree | - | - |
| Total | $65,625 | $47,321 |
Family Income in Walcott
Family Income Brackets in Walcott
According to the Walcott family income data, there are 22 families falling into the $100,000 to $149,999 income range, which is the most common income bracket and makes up 24.2% of all families.
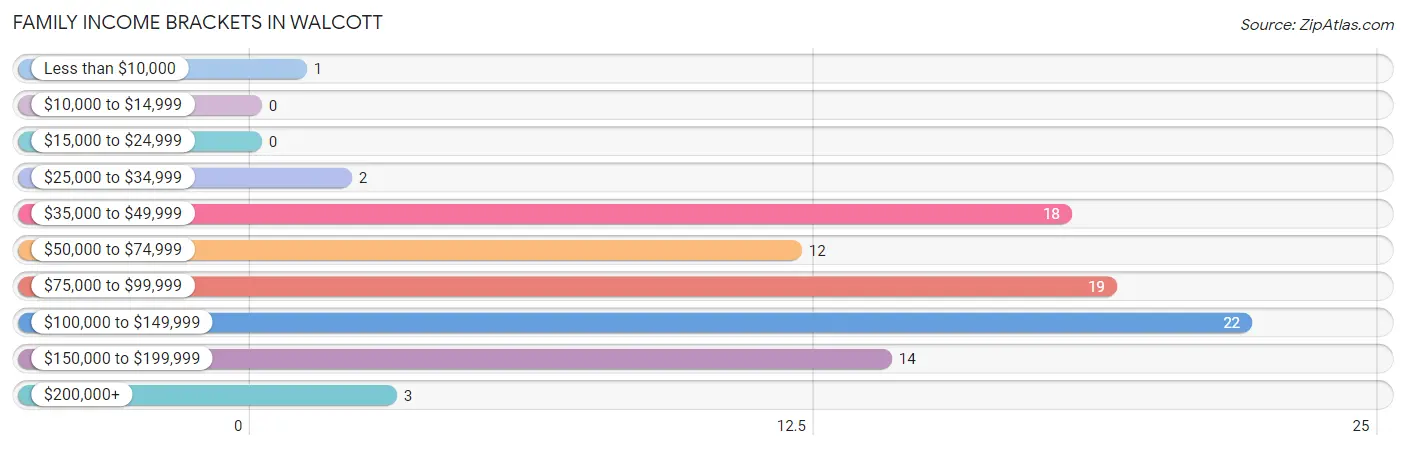
| Income Bracket | # Families | % Families |
| Less than $10,000 | 1 | 1.1% |
| $10,000 to $14,999 | 0 | 0.0% |
| $15,000 to $24,999 | 0 | 0.0% |
| $25,000 to $34,999 | 2 | 2.2% |
| $35,000 to $49,999 | 18 | 19.8% |
| $50,000 to $74,999 | 12 | 13.2% |
| $75,000 to $99,999 | 19 | 20.9% |
| $100,000 to $149,999 | 22 | 24.2% |
| $150,000 to $199,999 | 14 | 15.4% |
| $200,000+ | 3 | 3.3% |
Family Income by Famaliy Size in Walcott
4-person families (23 | 25.3%) account for the highest median family income in Walcott with $108,750 per family, while 2-person families (53 | 58.2%) have the highest median income of $48,660 per family member.
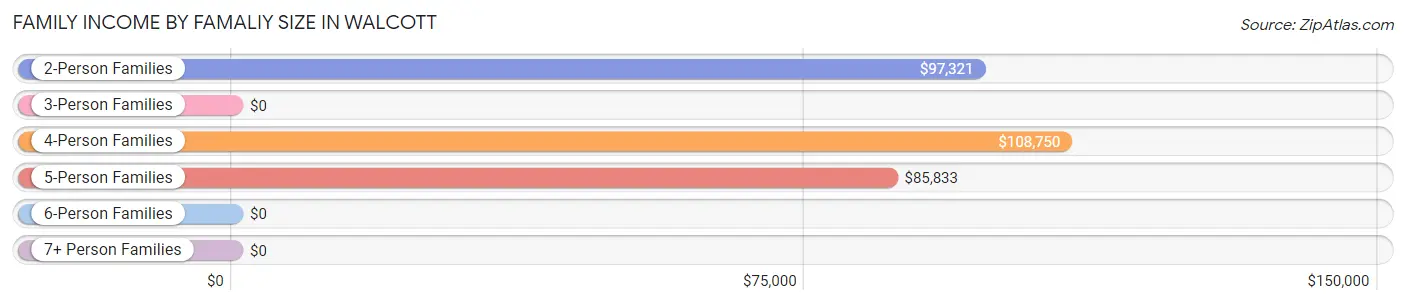
| Income Bracket | # Families | Median Income |
| 2-Person Families | 53 (58.2%) | $97,321 |
| 3-Person Families | 7 (7.7%) | $0 |
| 4-Person Families | 23 (25.3%) | $108,750 |
| 5-Person Families | 6 (6.6%) | $85,833 |
| 6-Person Families | 2 (2.2%) | $0 |
| 7+ Person Families | 0 (0.0%) | $0 |
| Total | 91 (100.0%) | $96,250 |
Family Income by Number of Earners in Walcott
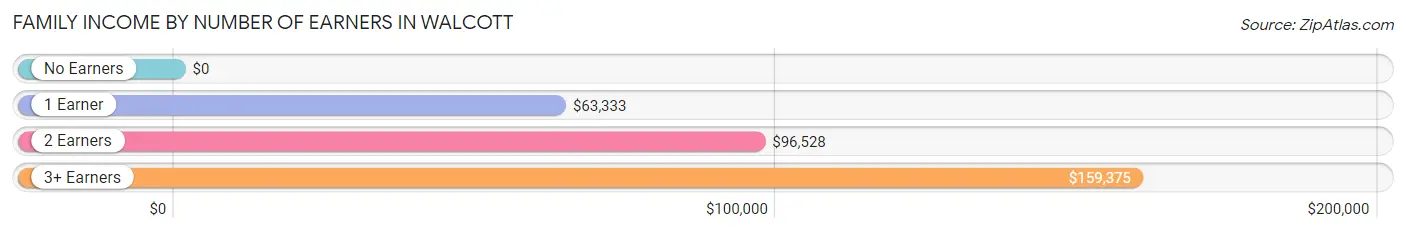
| Number of Earners | # Families | Median Income |
| No Earners | 5 (5.5%) | $0 |
| 1 Earner | 34 (37.4%) | $63,333 |
| 2 Earners | 45 (49.4%) | $96,528 |
| 3+ Earners | 7 (7.7%) | $159,375 |
| Total | 91 (100.0%) | $96,250 |
Household Income in Walcott
Household Income Brackets in Walcott
With 31 households falling in the category, the $75,000 to $99,999 income range is the most frequent in Walcott, accounting for 24.0% of all households.
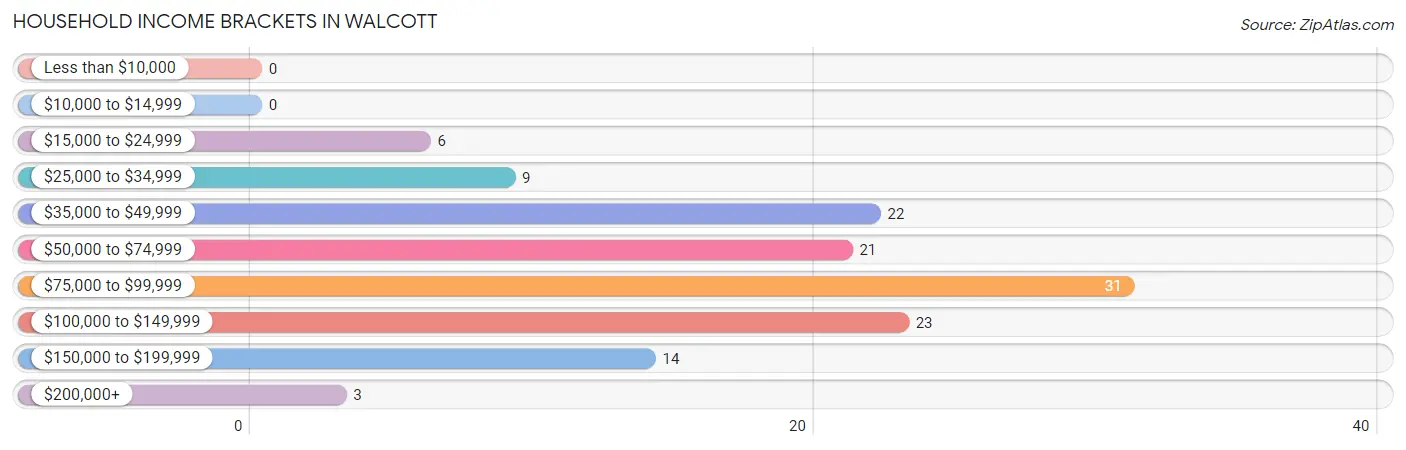
| Income Bracket | # Households | % Households |
| Less than $10,000 | 0 | 0.0% |
| $10,000 to $14,999 | 0 | 0.0% |
| $15,000 to $24,999 | 6 | 4.7% |
| $25,000 to $34,999 | 9 | 7.0% |
| $35,000 to $49,999 | 22 | 17.1% |
| $50,000 to $74,999 | 21 | 16.3% |
| $75,000 to $99,999 | 31 | 24.0% |
| $100,000 to $149,999 | 23 | 17.8% |
| $150,000 to $199,999 | 14 | 10.9% |
| $200,000+ | 3 | 2.3% |
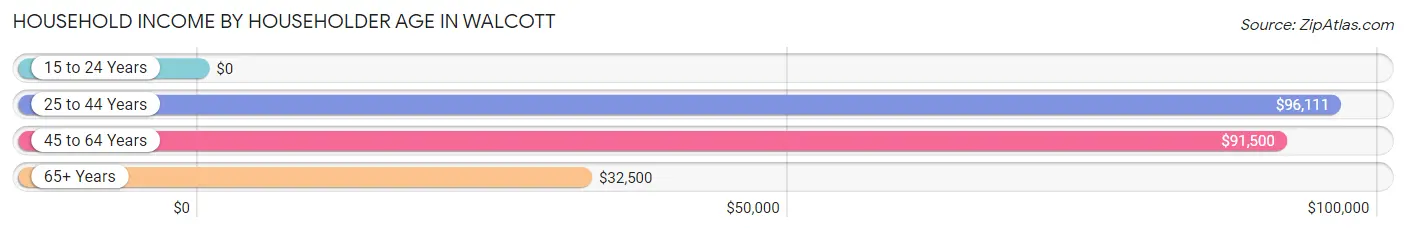
Household Income by Householder Age in Walcott
The median household income in Walcott is $89,375, with the highest median household income of $96,111 found in the 25 to 44 years age bracket for the primary householder. A total of 52 households (40.3%) fall into this category. Meanwhile, the 15 to 24 years age bracket for the primary householder has the lowest median household income of $0, with 3 households (2.3%) in this group.
| Income Bracket | # Households | Median Income |
| 15 to 24 Years | 3 (2.3%) | $0 |
| 25 to 44 Years | 52 (40.3%) | $96,111 |
| 45 to 64 Years | 48 (37.2%) | $91,500 |
| 65+ Years | 26 (20.2%) | $32,500 |
| Total | 129 (100.0%) | $89,375 |
Poverty in Walcott
Income Below Poverty by Sex and Age in Walcott
With 5.0% poverty level for males and 5.8% for females among the residents of Walcott, under 5 year old males and 18 to 24 year old females are the most vulnerable to poverty, with 4 males (28.6%) and 3 females (42.9%) in their respective age groups living below the poverty level.
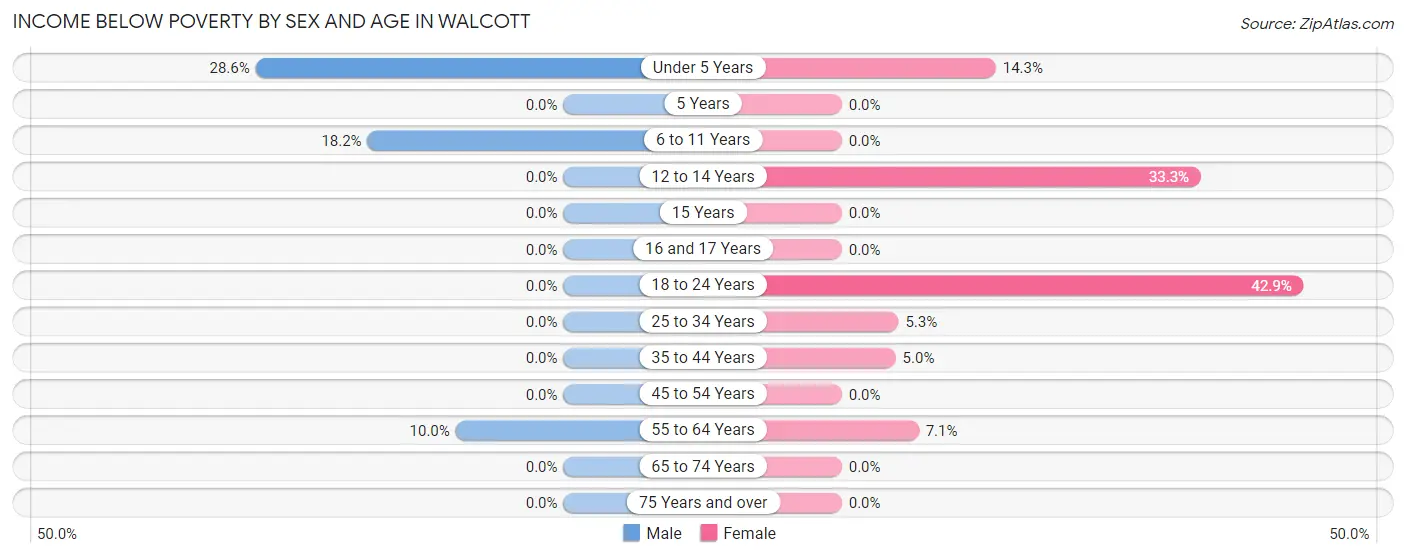
| Age Bracket | Male | Female |
| Under 5 Years | 4 (28.6%) | 1 (14.3%) |
| 5 Years | 0 (0.0%) | 0 (0.0%) |
| 6 to 11 Years | 2 (18.2%) | 0 (0.0%) |
| 12 to 14 Years | 0 (0.0%) | 1 (33.3%) |
| 15 Years | 0 (0.0%) | 0 (0.0%) |
| 16 and 17 Years | 0 (0.0%) | 0 (0.0%) |
| 18 to 24 Years | 0 (0.0%) | 3 (42.9%) |
| 25 to 34 Years | 0 (0.0%) | 2 (5.3%) |
| 35 to 44 Years | 0 (0.0%) | 1 (5.0%) |
| 45 to 54 Years | 0 (0.0%) | 0 (0.0%) |
| 55 to 64 Years | 2 (10.0%) | 1 (7.1%) |
| 65 to 74 Years | 0 (0.0%) | 0 (0.0%) |
| 75 Years and over | 0 (0.0%) | 0 (0.0%) |
| Total | 8 (5.0%) | 9 (5.8%) |
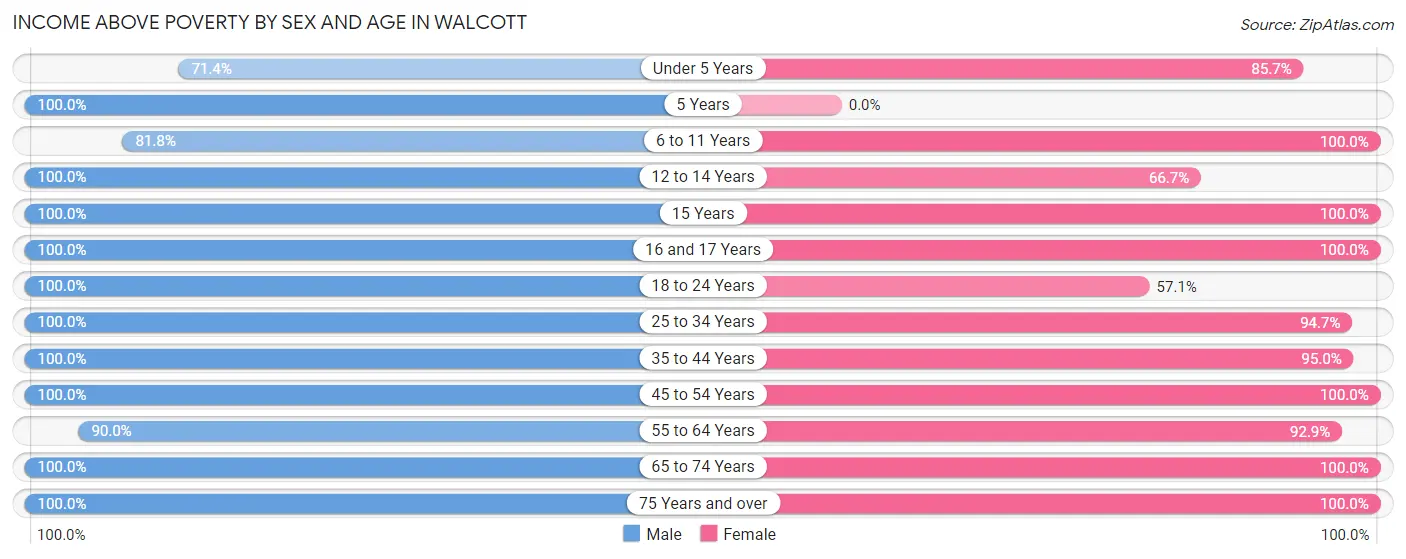
Income Above Poverty by Sex and Age in Walcott
According to the poverty statistics in Walcott, males aged 5 years and females aged 6 to 11 years are the age groups that are most secure financially, with 100.0% of males and 100.0% of females in these age groups living above the poverty line.
| Age Bracket | Male | Female |
| Under 5 Years | 10 (71.4%) | 6 (85.7%) |
| 5 Years | 3 (100.0%) | 0 (0.0%) |
| 6 to 11 Years | 9 (81.8%) | 26 (100.0%) |
| 12 to 14 Years | 14 (100.0%) | 2 (66.7%) |
| 15 Years | 2 (100.0%) | 1 (100.0%) |
| 16 and 17 Years | 7 (100.0%) | 3 (100.0%) |
| 18 to 24 Years | 1 (100.0%) | 4 (57.1%) |
| 25 to 34 Years | 20 (100.0%) | 36 (94.7%) |
| 35 to 44 Years | 25 (100.0%) | 19 (95.0%) |
| 45 to 54 Years | 25 (100.0%) | 18 (100.0%) |
| 55 to 64 Years | 18 (90.0%) | 13 (92.9%) |
| 65 to 74 Years | 8 (100.0%) | 10 (100.0%) |
| 75 Years and over | 10 (100.0%) | 7 (100.0%) |
| Total | 152 (95.0%) | 145 (94.2%) |
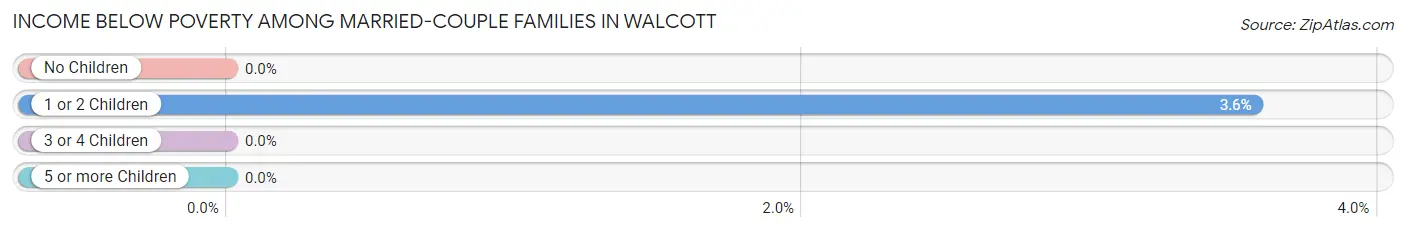
Income Below Poverty Among Married-Couple Families in Walcott
The poverty statistics for married-couple families in Walcott show that 1.4% or 1 of the total 72 families live below the poverty line. Families with 1 or 2 children have the highest poverty rate of 3.6%, comprising of 1 families. On the other hand, families with no children have the lowest poverty rate of 0.0%, which includes 0 families.
| Children | Above Poverty | Below Poverty |
| No Children | 40 (100.0%) | 0 (0.0%) |
| 1 or 2 Children | 27 (96.4%) | 1 (3.6%) |
| 3 or 4 Children | 4 (100.0%) | 0 (0.0%) |
| 5 or more Children | 0 (0.0%) | 0 (0.0%) |
| Total | 71 (98.6%) | 1 (1.4%) |
Income Below Poverty Among Single-Parent Households in Walcott
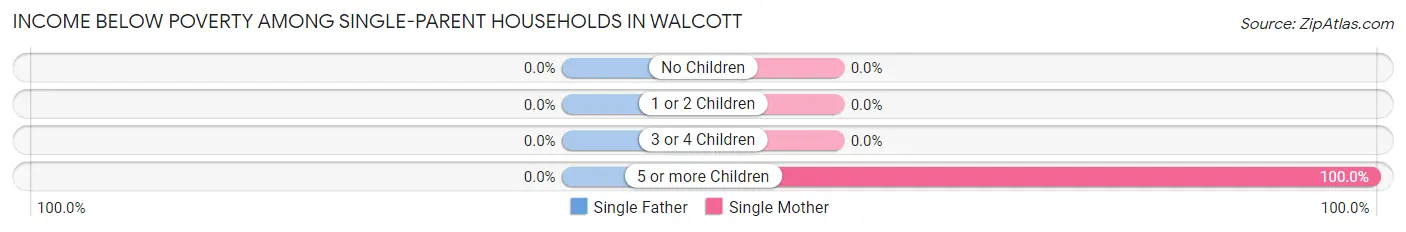
| Children | Single Father | Single Mother |
| No Children | 0 (0.0%) | 0 (0.0%) |
| 1 or 2 Children | 0 (0.0%) | 0 (0.0%) |
| 3 or 4 Children | 0 (0.0%) | 0 (0.0%) |
| 5 or more Children | 0 (0.0%) | 1 (100.0%) |
| Total | 0 (0.0%) | 1 (8.3%) |
Income Below Poverty Among Married-Couple vs Single-Parent Households in Walcott
The poverty data for Walcott shows that 1 of the married-couple family households (1.4%) and 1 of the single-parent households (5.3%) are living below the poverty level. Within the married-couple family households, those with 1 or 2 children have the highest poverty rate, with 1 households (3.6%) falling below the poverty line. Among the single-parent households, those with 5 or more children have the highest poverty rate, with 1 household (100.0%) living below poverty.
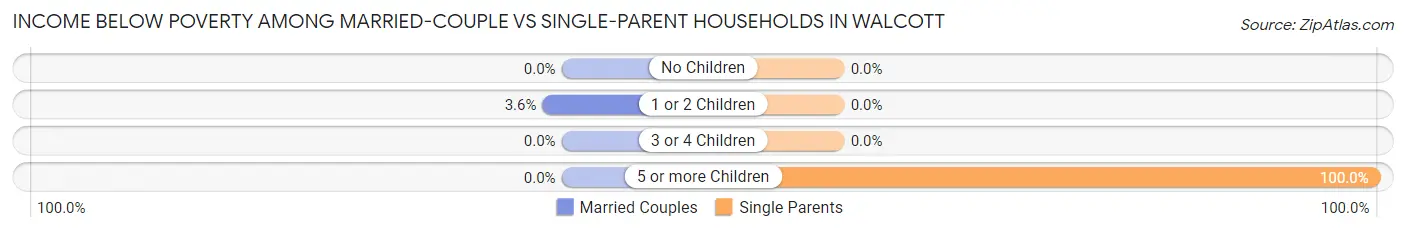
| Children | Married-Couple Families | Single-Parent Households |
| No Children | 0 (0.0%) | 0 (0.0%) |
| 1 or 2 Children | 1 (3.6%) | 0 (0.0%) |
| 3 or 4 Children | 0 (0.0%) | 0 (0.0%) |
| 5 or more Children | 0 (0.0%) | 1 (100.0%) |
| Total | 1 (1.4%) | 1 (5.3%) |
Race in Walcott
The most populous races in Walcott are White / Caucasian (296 | 93.7%), Two or more Races (15 | 4.8%), and Black / African American (5 | 1.6%).
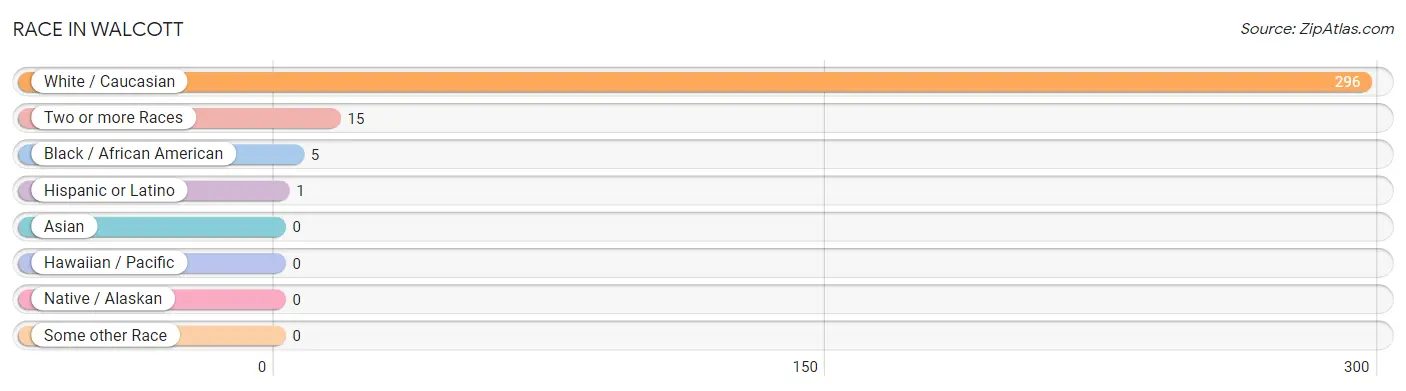
| Race | # Population | % Population |
| Asian | 0 | 0.0% |
| Black / African American | 5 | 1.6% |
| Hawaiian / Pacific | 0 | 0.0% |
| Hispanic or Latino | 1 | 0.3% |
| Native / Alaskan | 0 | 0.0% |
| White / Caucasian | 296 | 93.7% |
| Two or more Races | 15 | 4.8% |
| Some other Race | 0 | 0.0% |
| Total | 316 | 100.0% |
Ancestry in Walcott
The most populous ancestries reported in Walcott are Norwegian (97 | 30.7%), German (83 | 26.3%), English (25 | 7.9%), Irish (24 | 7.6%), and European (21 | 6.7%), together accounting for 79.1% of all Walcott residents.
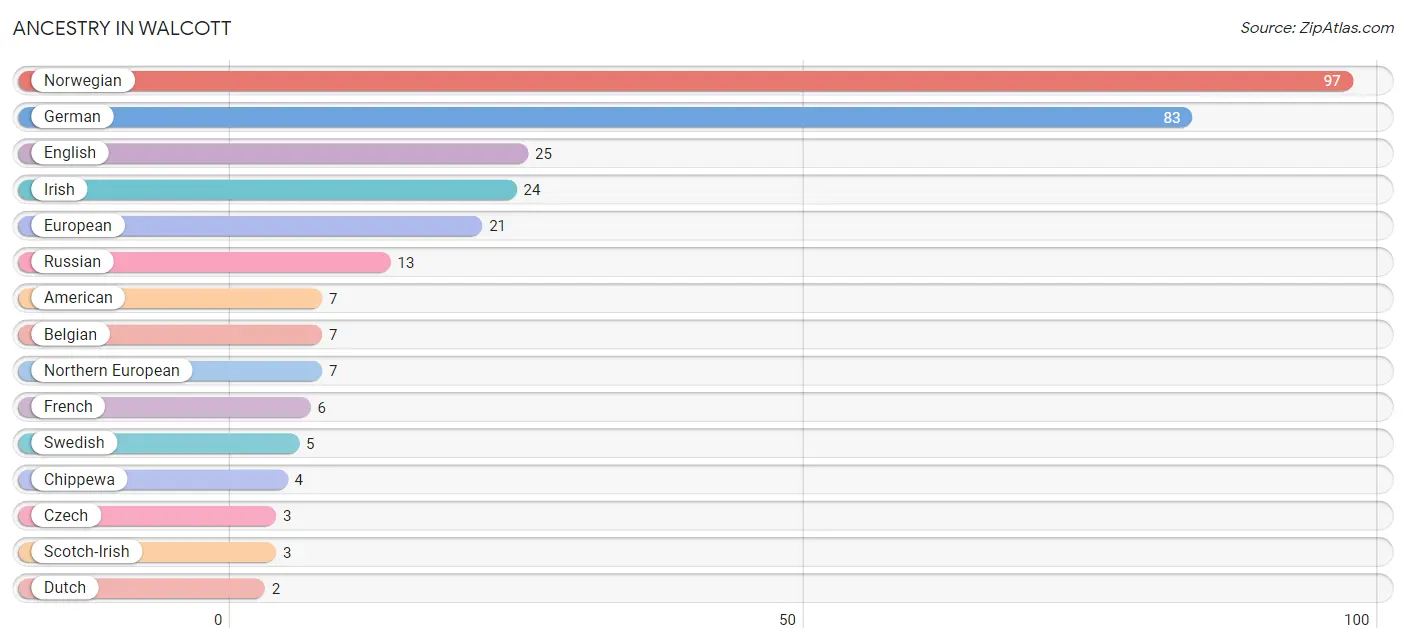
| Ancestry | # Population | % Population |
| American | 7 | 2.2% |
| Belgian | 7 | 2.2% |
| British | 1 | 0.3% |
| Chippewa | 4 | 1.3% |
| Czech | 3 | 0.9% |
| Czechoslovakian | 1 | 0.3% |
| Dutch | 2 | 0.6% |
| English | 25 | 7.9% |
| European | 21 | 6.7% |
| Finnish | 2 | 0.6% |
| French | 6 | 1.9% |
| German | 83 | 26.3% |
| Irish | 24 | 7.6% |
| Mexican | 1 | 0.3% |
| Northern European | 7 | 2.2% |
| Norwegian | 97 | 30.7% |
| Polish | 2 | 0.6% |
| Russian | 13 | 4.1% |
| Scandinavian | 2 | 0.6% |
| Scotch-Irish | 3 | 0.9% |
| Swedish | 5 | 1.6% |
| Welsh | 2 | 0.6% | View All 22 Rows |
Immigrants in Walcott
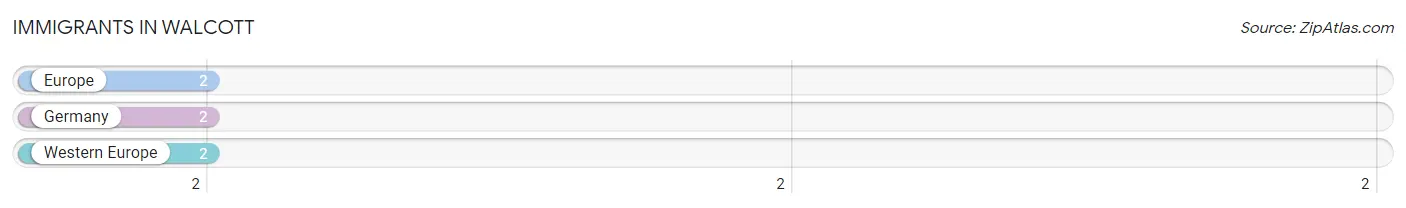
The most numerous immigrant groups reported in Walcott came from Europe (2 | 0.6%), Germany (2 | 0.6%), and Western Europe (2 | 0.6%), together accounting for 1.9% of all Walcott residents.
| Immigration Origin | # Population | % Population |
| Europe | 2 | 0.6% |
| Germany | 2 | 0.6% |
| Western Europe | 2 | 0.6% | View All 3 Rows |
Sex and Age in Walcott
Sex and Age in Walcott
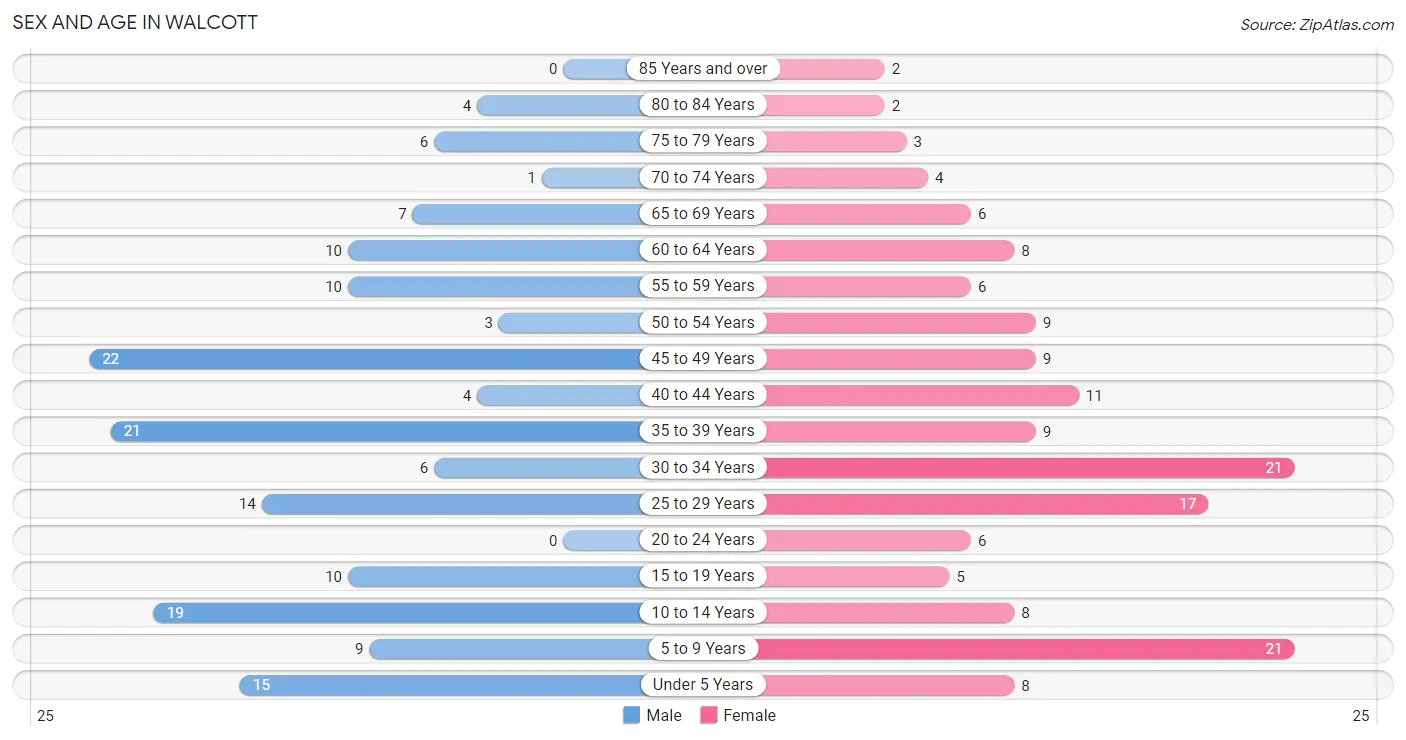
The most populous age groups in Walcott are 45 to 49 Years (22 | 13.7%) for men and 5 to 9 Years (21 | 13.6%) for women.
| Age Bracket | Male | Female |
| Under 5 Years | 15 (9.3%) | 8 (5.2%) |
| 5 to 9 Years | 9 (5.6%) | 21 (13.6%) |
| 10 to 14 Years | 19 (11.8%) | 8 (5.2%) |
| 15 to 19 Years | 10 (6.2%) | 5 (3.2%) |
| 20 to 24 Years | 0 (0.0%) | 6 (3.9%) |
| 25 to 29 Years | 14 (8.7%) | 17 (11.0%) |
| 30 to 34 Years | 6 (3.7%) | 21 (13.6%) |
| 35 to 39 Years | 21 (13.0%) | 9 (5.8%) |
| 40 to 44 Years | 4 (2.5%) | 11 (7.1%) |
| 45 to 49 Years | 22 (13.7%) | 9 (5.8%) |
| 50 to 54 Years | 3 (1.9%) | 9 (5.8%) |
| 55 to 59 Years | 10 (6.2%) | 6 (3.9%) |
| 60 to 64 Years | 10 (6.2%) | 8 (5.2%) |
| 65 to 69 Years | 7 (4.3%) | 6 (3.9%) |
| 70 to 74 Years | 1 (0.6%) | 4 (2.6%) |
| 75 to 79 Years | 6 (3.7%) | 3 (1.9%) |
| 80 to 84 Years | 4 (2.5%) | 2 (1.3%) |
| 85 Years and over | 0 (0.0%) | 2 (1.3%) |
| Total | 161 (100.0%) | 155 (100.0%) |
Families and Households in Walcott
Median Family Size in Walcott
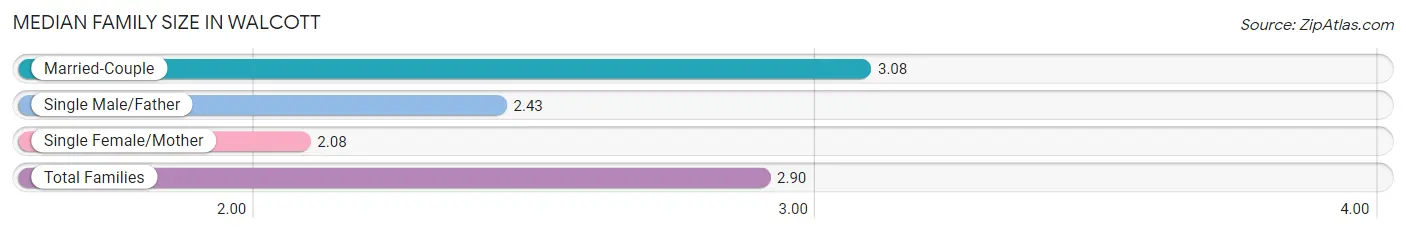
The median family size in Walcott is 2.90 persons per family, with married-couple families (72 | 79.1%) accounting for the largest median family size of 3.08 persons per family. On the other hand, single female/mother families (12 | 13.2%) represent the smallest median family size with 2.08 persons per family.
| Family Type | # Families | Family Size |
| Married-Couple | 72 (79.1%) | 3.08 |
| Single Male/Father | 7 (7.7%) | 2.43 |
| Single Female/Mother | 12 (13.2%) | 2.08 |
| Total Families | 91 (100.0%) | 2.90 |
Median Household Size in Walcott
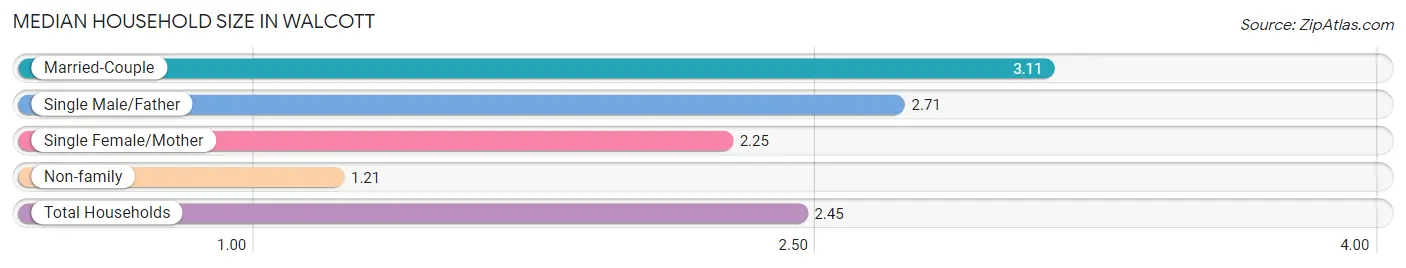
The median household size in Walcott is 2.45 persons per household, with married-couple households (72 | 55.8%) accounting for the largest median household size of 3.11 persons per household. non-family households (38 | 29.5%) represent the smallest median household size with 1.21 persons per household.
| Household Type | # Households | Household Size |
| Married-Couple | 72 (55.8%) | 3.11 |
| Single Male/Father | 7 (5.4%) | 2.71 |
| Single Female/Mother | 12 (9.3%) | 2.25 |
| Non-family | 38 (29.5%) | 1.21 |
| Total Households | 129 (100.0%) | 2.45 |
Household Size by Marriage Status in Walcott
Out of a total of 129 households in Walcott, 91 (70.5%) are family households, while 38 (29.5%) are nonfamily households. The most numerous type of family households are 2-person households, comprising 49, and the most common type of nonfamily households are 1-person households, comprising 34.
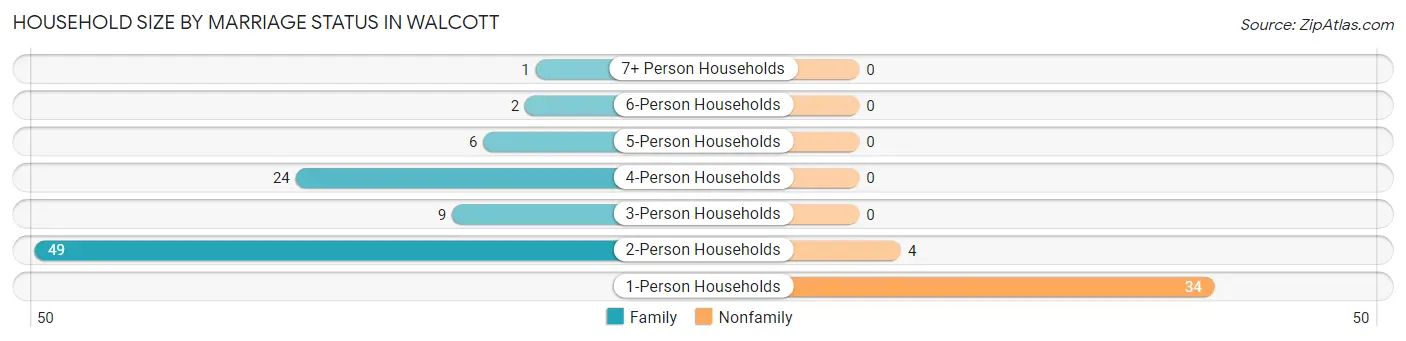
| Household Size | Family Households | Nonfamily Households |
| 1-Person Households | - | 34 (26.4%) |
| 2-Person Households | 49 (38.0%) | 4 (3.1%) |
| 3-Person Households | 9 (7.0%) | 0 (0.0%) |
| 4-Person Households | 24 (18.6%) | 0 (0.0%) |
| 5-Person Households | 6 (4.6%) | 0 (0.0%) |
| 6-Person Households | 2 (1.5%) | 0 (0.0%) |
| 7+ Person Households | 1 (0.8%) | 0 (0.0%) |
| Total | 91 (70.5%) | 38 (29.5%) |
Female Fertility in Walcott
Fertility by Age in Walcott
Average fertility rate in Walcott is 62.0 births per 1,000 women. Women in the age bracket of 20 to 34 years have the highest fertility rate with 114.0 births per 1,000 women. Women in the age bracket of 20 to 34 years acount for 100.0% of all women with births.
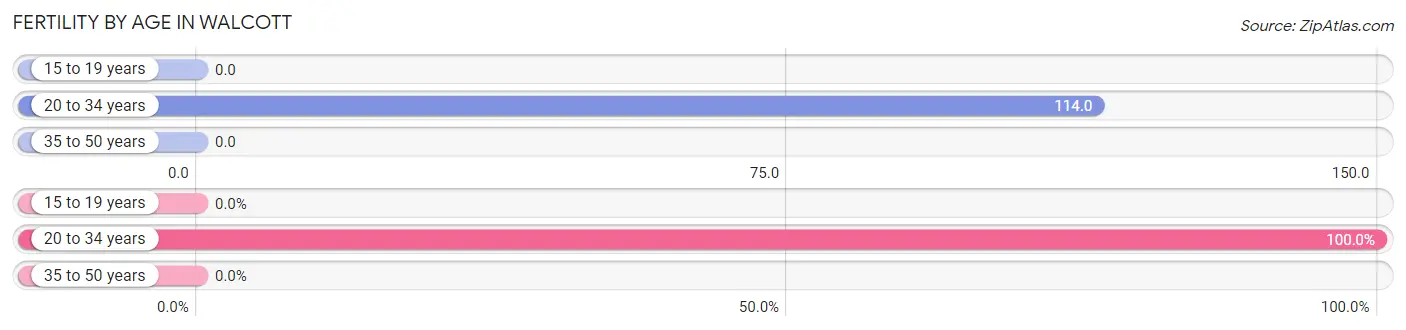
| Age Bracket | Women with Births | Births / 1,000 Women |
| 15 to 19 years | 0 (0.0%) | 0.0 |
| 20 to 34 years | 5 (100.0%) | 114.0 |
| 35 to 50 years | 0 (0.0%) | 0.0 |
| Total | 5 (100.0%) | 62.0 |
Fertility by Age by Marriage Status in Walcott
60.0% of women with births (5) in Walcott are married. The highest percentage of unmarried women with births falls into 20 to 34 years age bracket with 40.0% of them unmarried at the time of birth, while the lowest percentage of unmarried women with births belong to 20 to 34 years age bracket with 40.0% of them unmarried.
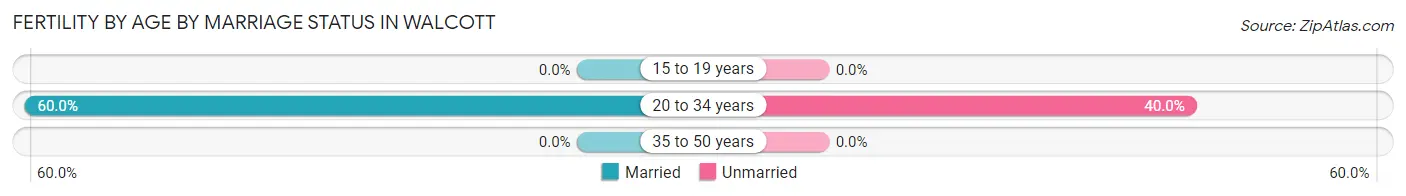
| Age Bracket | Married | Unmarried |
| 15 to 19 years | 0 (0.0%) | 0 (0.0%) |
| 20 to 34 years | 3 (60.0%) | 2 (40.0%) |
| 35 to 50 years | 0 (0.0%) | 0 (0.0%) |
| Total | 3 (60.0%) | 2 (40.0%) |
Fertility by Education in Walcott
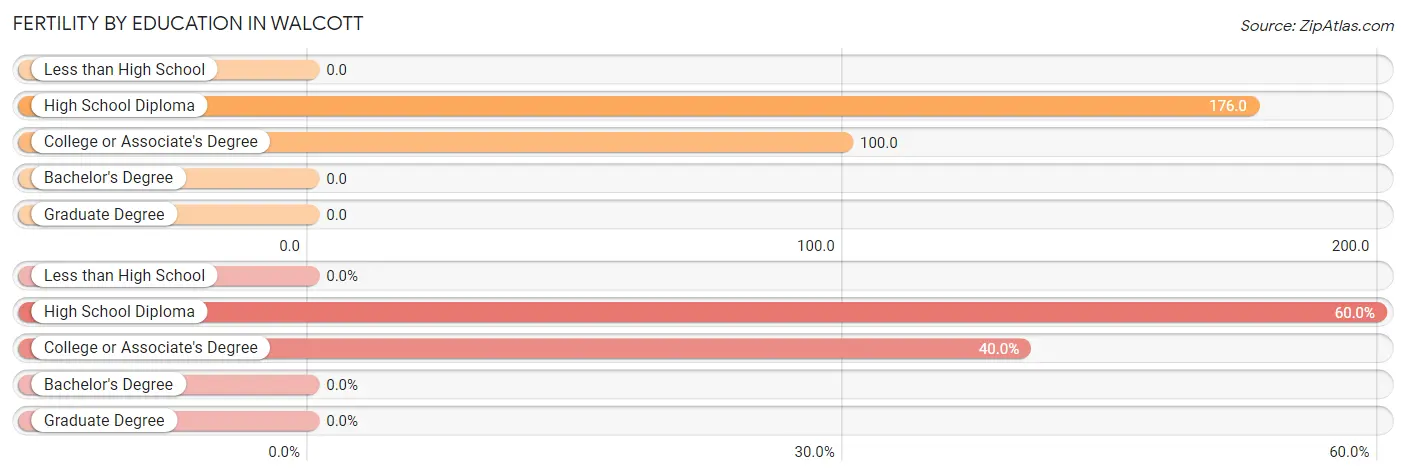
| Educational Attainment | Women with Births | Births / 1,000 Women |
| Less than High School | 0 (0.0%) | 0.0 |
| High School Diploma | 3 (60.0%) | 176.0 |
| College or Associate's Degree | 2 (40.0%) | 100.0 |
| Bachelor's Degree | 0 (0.0%) | 0.0 |
| Graduate Degree | 0 (0.0%) | 0.0 |
| Total | 5 (100.0%) | 62.0 |
Fertility by Education by Marriage Status in Walcott
40.0% of women with births in Walcott are unmarried. Women with the educational attainment of high school diploma are most likely to be married with 100.0% of them married at childbirth, while women with the educational attainment of college or associate's degree are least likely to be married with 100.0% of them unmarried at childbirth.
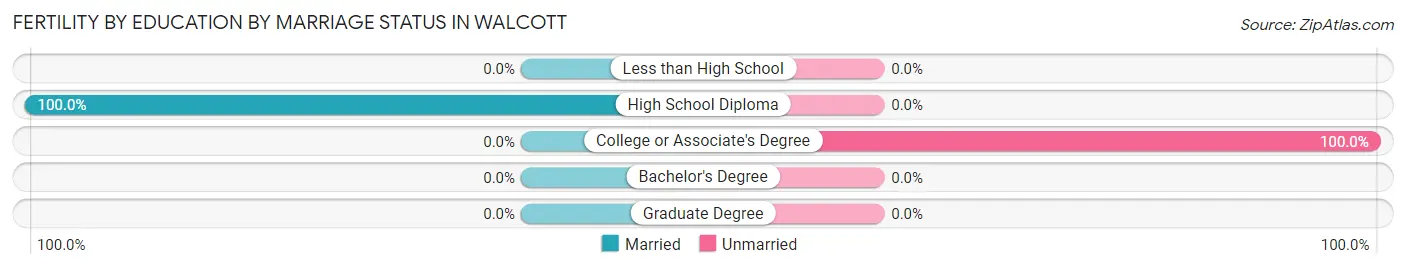
| Educational Attainment | Married | Unmarried |
| Less than High School | 0 (0.0%) | 0 (0.0%) |
| High School Diploma | 3 (100.0%) | 0 (0.0%) |
| College or Associate's Degree | 0 (0.0%) | 2 (100.0%) |
| Bachelor's Degree | 0 (0.0%) | 0 (0.0%) |
| Graduate Degree | 0 (0.0%) | 0 (0.0%) |
| Total | 3 (60.0%) | 2 (40.0%) |
Employment Characteristics in Walcott
Employment by Class of Employer in Walcott
Among the 155 employed individuals in Walcott, private company employees (88 | 56.8%), local government employees (25 | 16.1%), and state government employees (12 | 7.7%) make up the most common classes of employment.
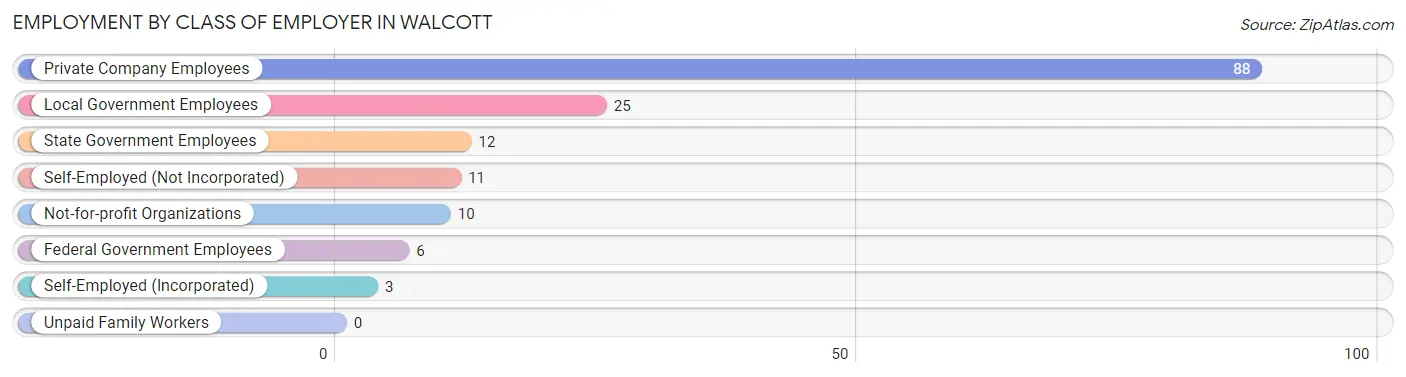
| Employer Class | # Employees | % Employees |
| Private Company Employees | 88 | 56.8% |
| Self-Employed (Incorporated) | 3 | 1.9% |
| Self-Employed (Not Incorporated) | 11 | 7.1% |
| Not-for-profit Organizations | 10 | 6.5% |
| Local Government Employees | 25 | 16.1% |
| State Government Employees | 12 | 7.7% |
| Federal Government Employees | 6 | 3.9% |
| Unpaid Family Workers | 0 | 0.0% |
| Total | 155 | 100.0% |
Employment Status by Age in Walcott
According to the labor force statistics for Walcott, out of the total population over 16 years of age (233), 69.5% or 162 individuals are in the labor force, with 2.5% or 4 of them unemployed. The age group with the highest labor force participation rate is 20 to 24 years, with 100.0% or 6 individuals in the labor force. Within the labor force, the 60 to 64 years age range has the highest percentage of unemployed individuals, with 30.8% or 4 of them being unemployed.
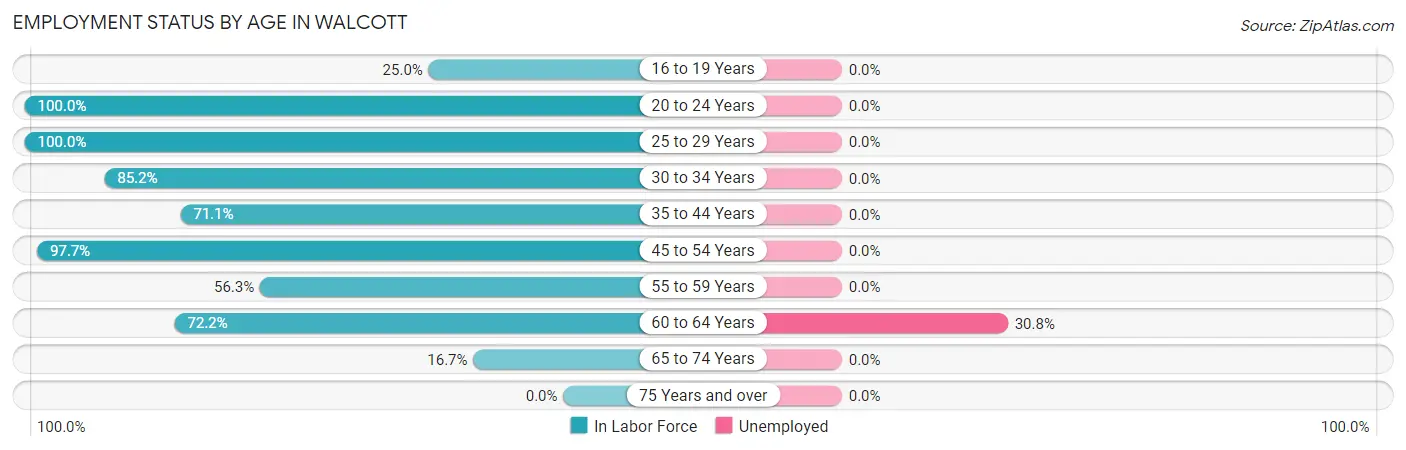
| Age Bracket | In Labor Force | Unemployed |
| 16 to 19 Years | 3 (25.0%) | 0 (0.0%) |
| 20 to 24 Years | 6 (100.0%) | 0 (0.0%) |
| 25 to 29 Years | 31 (100.0%) | 0 (0.0%) |
| 30 to 34 Years | 23 (85.2%) | 0 (0.0%) |
| 35 to 44 Years | 32 (71.1%) | 0 (0.0%) |
| 45 to 54 Years | 42 (97.7%) | 0 (0.0%) |
| 55 to 59 Years | 9 (56.3%) | 0 (0.0%) |
| 60 to 64 Years | 13 (72.2%) | 4 (30.8%) |
| 65 to 74 Years | 3 (16.7%) | 0 (0.0%) |
| 75 Years and over | 0 (0.0%) | 0 (0.0%) |
| Total | 162 (69.5%) | 4 (2.5%) |
Employment Status by Educational Attainment in Walcott
According to labor force statistics for Walcott, 83.3% of individuals (150) out of the total population between 25 and 64 years of age (180) are in the labor force, with 2.7% or 4 of them being unemployed. The group with the highest labor force participation rate are those with the educational attainment of bachelor's degree or higher, with 95.4% or 62 individuals in the labor force. Within the labor force, individuals with college / associate degree education have the highest percentage of unemployment, with 7.0% or 4 of them being unemployed.
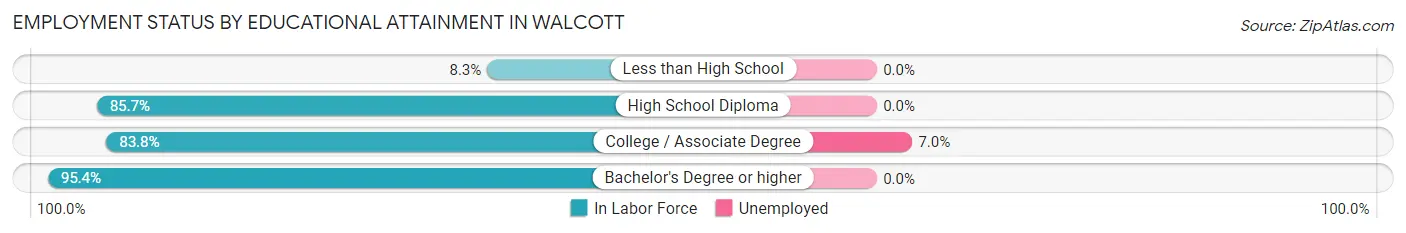
| Educational Attainment | In Labor Force | Unemployed |
| Less than High School | 1 (8.3%) | 0 (0.0%) |
| High School Diploma | 30 (85.7%) | 0 (0.0%) |
| College / Associate Degree | 57 (83.8%) | 5 (7.0%) |
| Bachelor's Degree or higher | 62 (95.4%) | 0 (0.0%) |
| Total | 150 (83.3%) | 5 (2.7%) |
Employment Occupations by Sex in Walcott
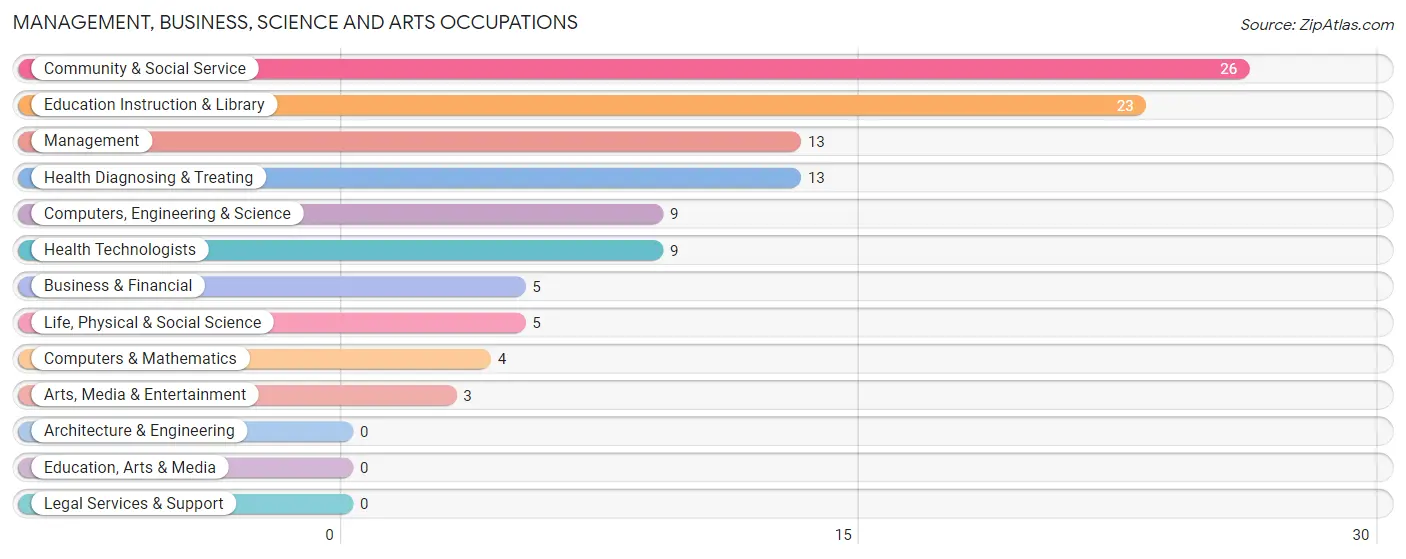
Management, Business, Science and Arts Occupations
The most common Management, Business, Science and Arts occupations in Walcott are Community & Social Service (26 | 16.8%), Education Instruction & Library (23 | 14.8%), Management (13 | 8.4%), Health Diagnosing & Treating (13 | 8.4%), and Computers, Engineering & Science (9 | 5.8%).
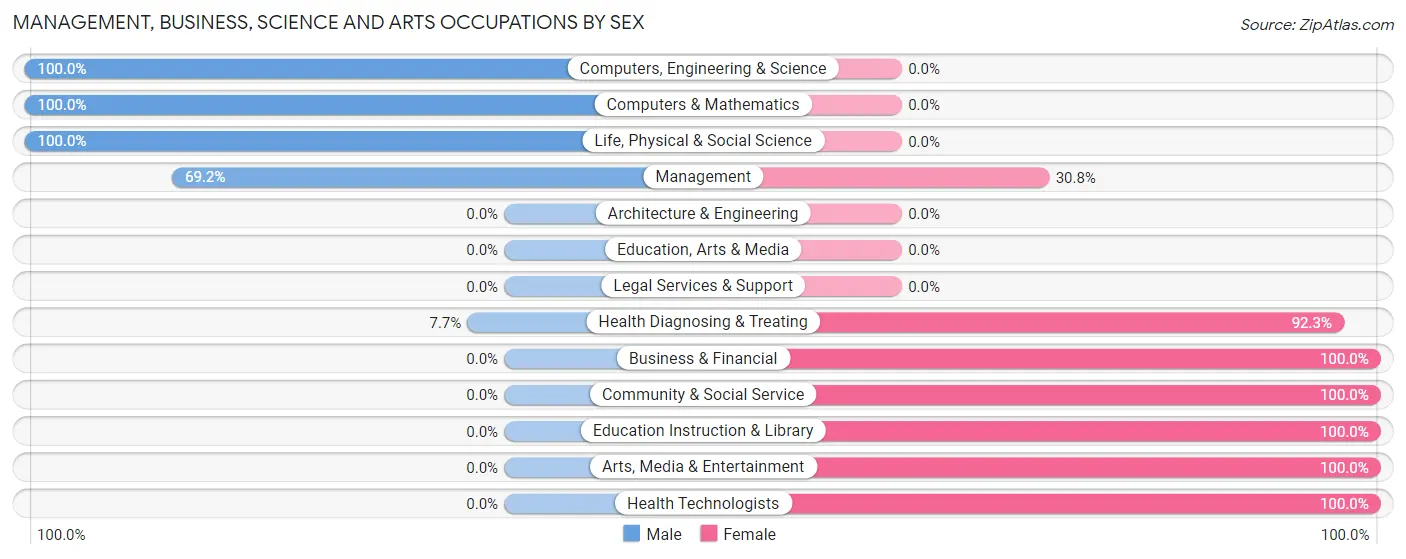
Management, Business, Science and Arts Occupations by Sex
Within the Management, Business, Science and Arts occupations in Walcott, the most male-oriented occupations are Computers, Engineering & Science (100.0%), Computers & Mathematics (100.0%), and Life, Physical & Social Science (100.0%), while the most female-oriented occupations are Business & Financial (100.0%), Community & Social Service (100.0%), and Education Instruction & Library (100.0%).
| Occupation | Male | Female |
| Management | 9 (69.2%) | 4 (30.8%) |
| Business & Financial | 0 (0.0%) | 5 (100.0%) |
| Computers, Engineering & Science | 9 (100.0%) | 0 (0.0%) |
| Computers & Mathematics | 4 (100.0%) | 0 (0.0%) |
| Architecture & Engineering | 0 (0.0%) | 0 (0.0%) |
| Life, Physical & Social Science | 5 (100.0%) | 0 (0.0%) |
| Community & Social Service | 0 (0.0%) | 26 (100.0%) |
| Education, Arts & Media | 0 (0.0%) | 0 (0.0%) |
| Legal Services & Support | 0 (0.0%) | 0 (0.0%) |
| Education Instruction & Library | 0 (0.0%) | 23 (100.0%) |
| Arts, Media & Entertainment | 0 (0.0%) | 3 (100.0%) |
| Health Diagnosing & Treating | 1 (7.7%) | 12 (92.3%) |
| Health Technologists | 0 (0.0%) | 9 (100.0%) |
| Total (Category) | 19 (28.8%) | 47 (71.2%) |
| Total (Overall) | 72 (46.5%) | 83 (53.5%) |
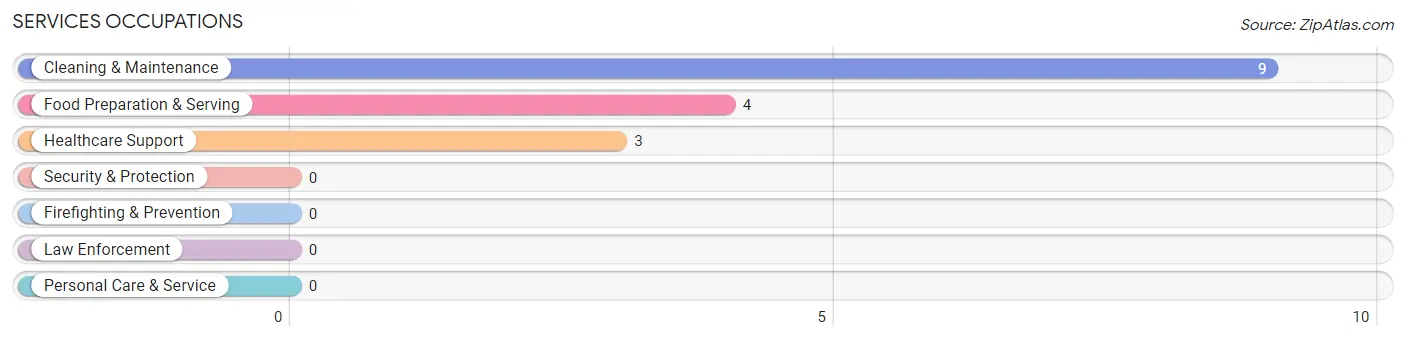
Services Occupations
The most common Services occupations in Walcott are Cleaning & Maintenance (9 | 5.8%), Food Preparation & Serving (4 | 2.6%), and Healthcare Support (3 | 1.9%).
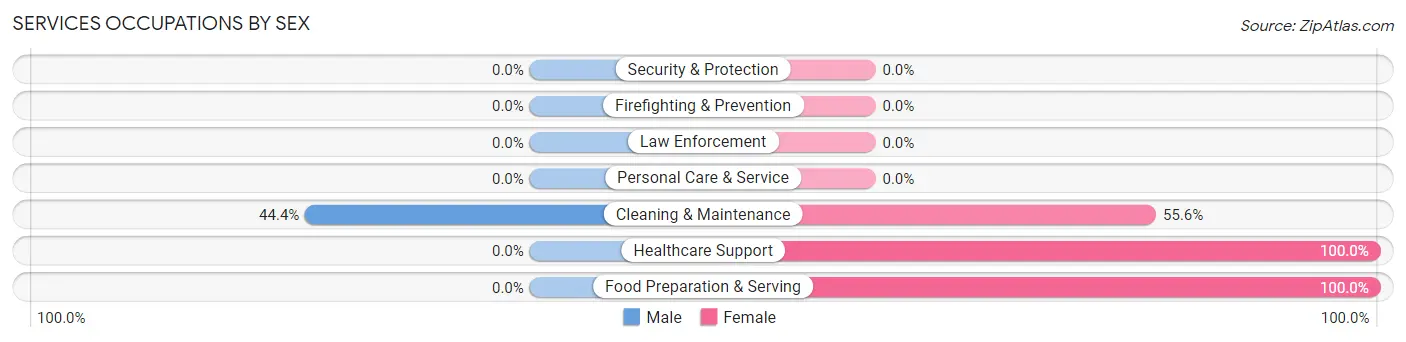
Services Occupations by Sex
| Occupation | Male | Female |
| Healthcare Support | 0 (0.0%) | 3 (100.0%) |
| Security & Protection | 0 (0.0%) | 0 (0.0%) |
| Firefighting & Prevention | 0 (0.0%) | 0 (0.0%) |
| Law Enforcement | 0 (0.0%) | 0 (0.0%) |
| Food Preparation & Serving | 0 (0.0%) | 4 (100.0%) |
| Cleaning & Maintenance | 4 (44.4%) | 5 (55.6%) |
| Personal Care & Service | 0 (0.0%) | 0 (0.0%) |
| Total (Category) | 4 (25.0%) | 12 (75.0%) |
| Total (Overall) | 72 (46.5%) | 83 (53.5%) |
Sales and Office Occupations
The most common Sales and Office occupations in Walcott are Office & Administration (29 | 18.7%), and Sales & Related (11 | 7.1%).
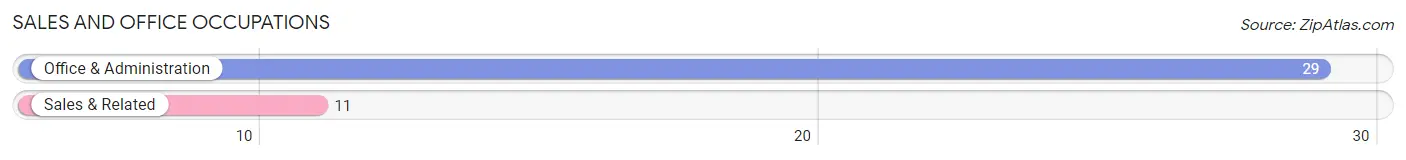
Sales and Office Occupations by Sex
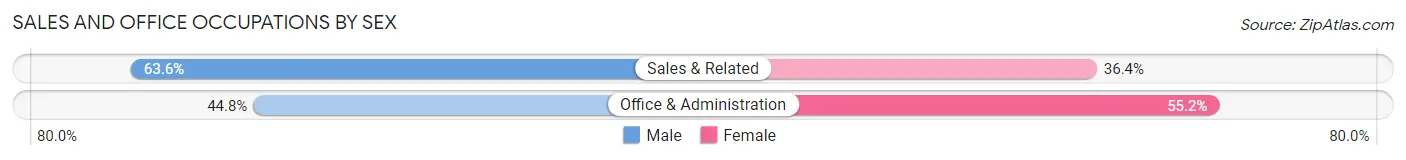
| Occupation | Male | Female |
| Sales & Related | 7 (63.6%) | 4 (36.4%) |
| Office & Administration | 13 (44.8%) | 16 (55.2%) |
| Total (Category) | 20 (50.0%) | 20 (50.0%) |
| Total (Overall) | 72 (46.5%) | 83 (53.5%) |
Natural Resources, Construction and Maintenance Occupations
The most common Natural Resources, Construction and Maintenance occupations in Walcott are Installation, Maintenance & Repair (6 | 3.9%), Farming, Fishing & Forestry (5 | 3.2%), and Construction & Extraction (4 | 2.6%).
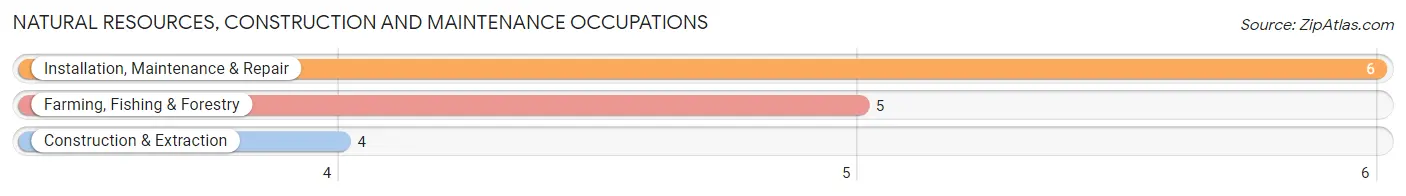
Natural Resources, Construction and Maintenance Occupations by Sex
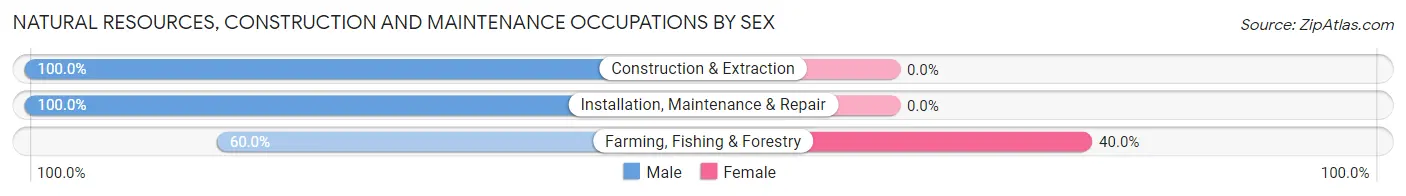
| Occupation | Male | Female |
| Farming, Fishing & Forestry | 3 (60.0%) | 2 (40.0%) |
| Construction & Extraction | 4 (100.0%) | 0 (0.0%) |
| Installation, Maintenance & Repair | 6 (100.0%) | 0 (0.0%) |
| Total (Category) | 13 (86.7%) | 2 (13.3%) |
| Total (Overall) | 72 (46.5%) | 83 (53.5%) |
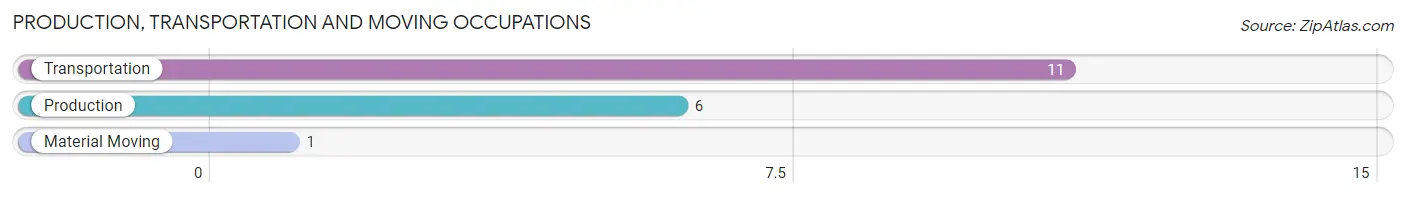
Production, Transportation and Moving Occupations
The most common Production, Transportation and Moving occupations in Walcott are Transportation (11 | 7.1%), Production (6 | 3.9%), and Material Moving (1 | 0.6%).
Production, Transportation and Moving Occupations by Sex
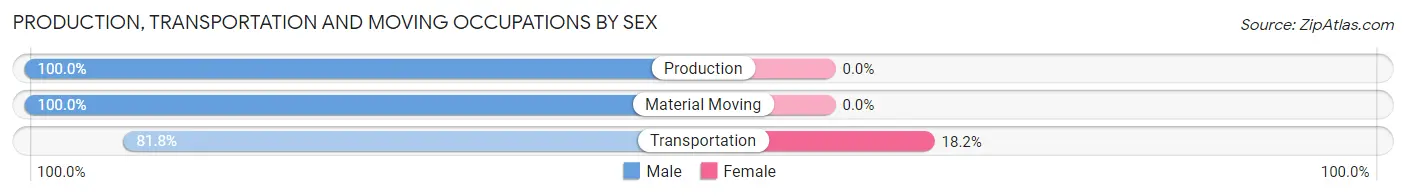
| Occupation | Male | Female |
| Production | 6 (100.0%) | 0 (0.0%) |
| Transportation | 9 (81.8%) | 2 (18.2%) |
| Material Moving | 1 (100.0%) | 0 (0.0%) |
| Total (Category) | 16 (88.9%) | 2 (11.1%) |
| Total (Overall) | 72 (46.5%) | 83 (53.5%) |
Employment Industries by Sex in Walcott
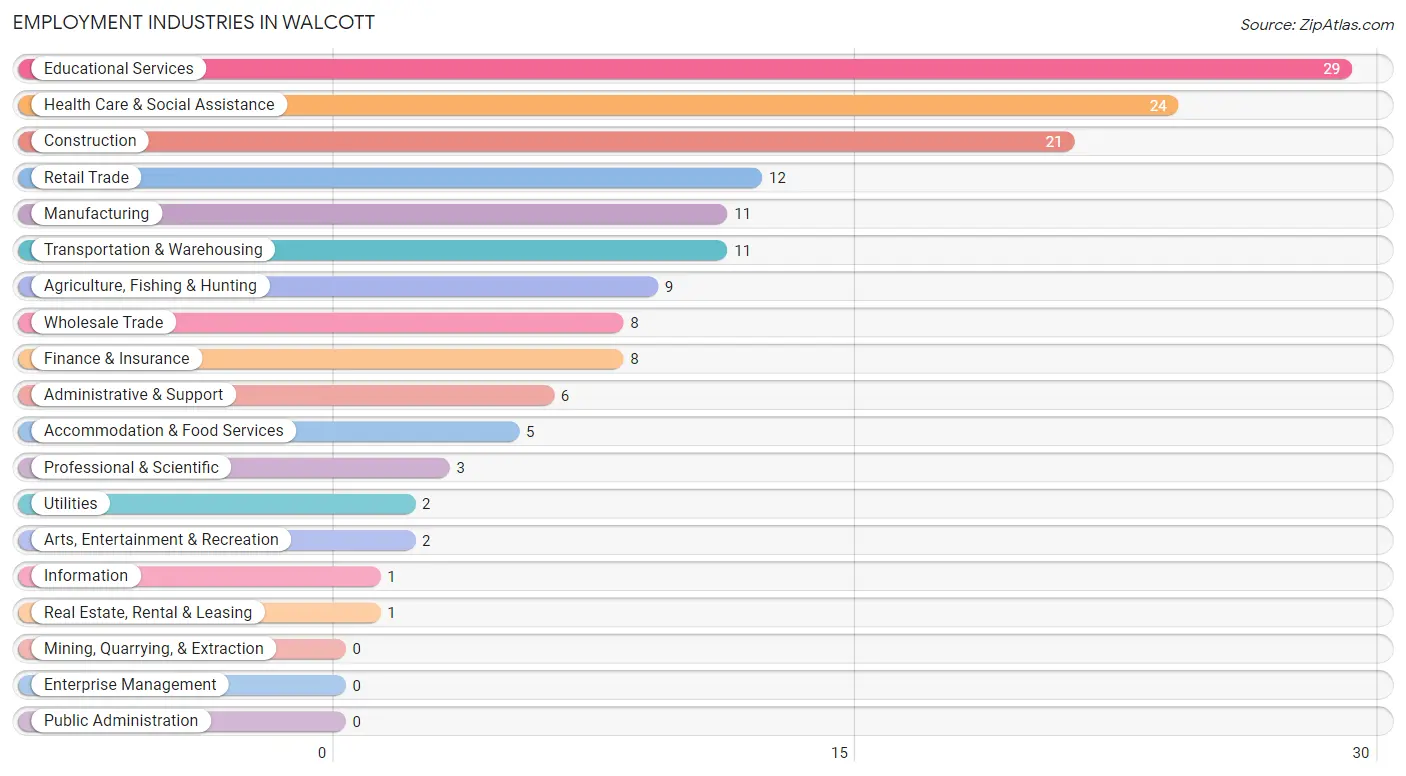
Employment Industries in Walcott
The major employment industries in Walcott include Educational Services (29 | 18.7%), Health Care & Social Assistance (24 | 15.5%), Construction (21 | 13.6%), Retail Trade (12 | 7.7%), and Manufacturing (11 | 7.1%).
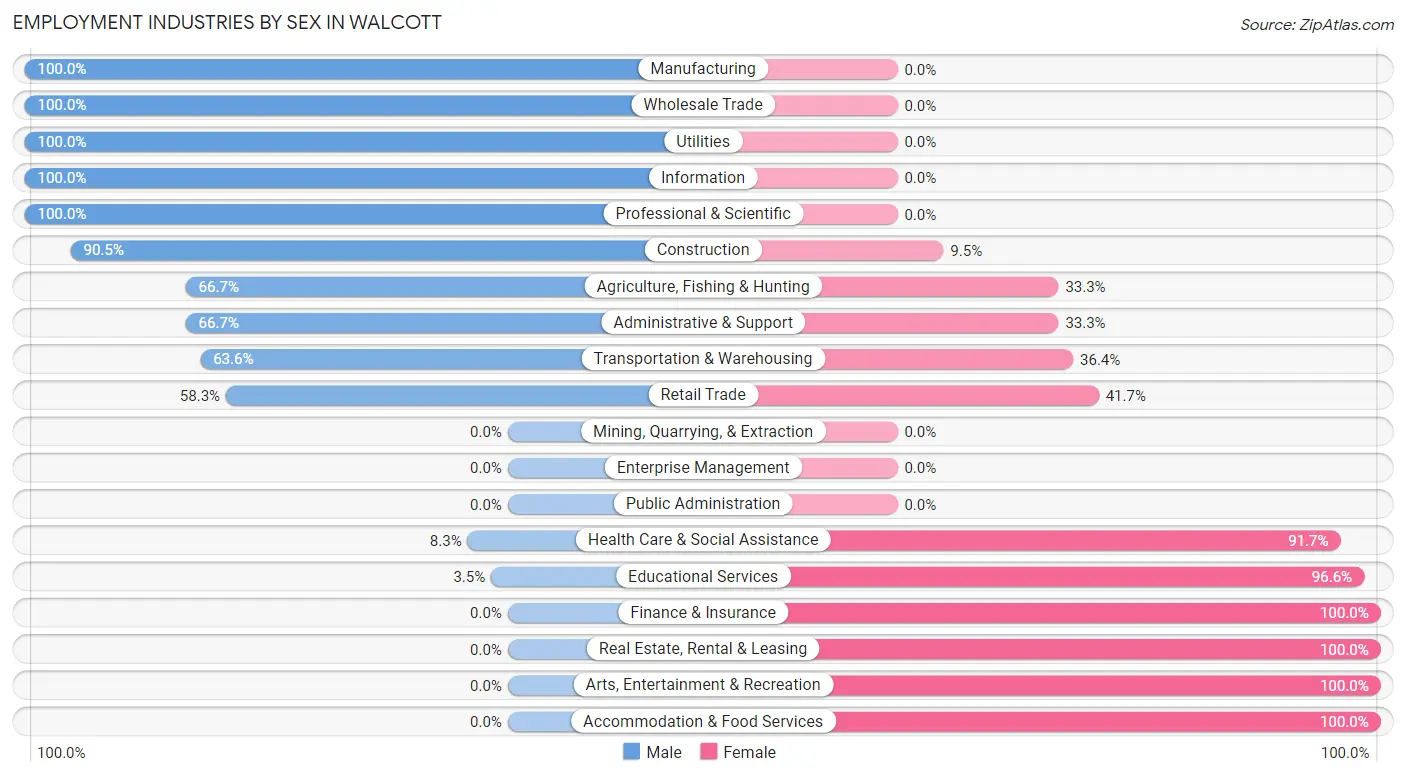
Employment Industries by Sex in Walcott
The Walcott industries that see more men than women are Manufacturing (100.0%), Wholesale Trade (100.0%), and Utilities (100.0%), whereas the industries that tend to have a higher number of women are Finance & Insurance (100.0%), Real Estate, Rental & Leasing (100.0%), and Arts, Entertainment & Recreation (100.0%).
| Industry | Male | Female |
| Agriculture, Fishing & Hunting | 6 (66.7%) | 3 (33.3%) |
| Mining, Quarrying, & Extraction | 0 (0.0%) | 0 (0.0%) |
| Construction | 19 (90.5%) | 2 (9.5%) |
| Manufacturing | 11 (100.0%) | 0 (0.0%) |
| Wholesale Trade | 8 (100.0%) | 0 (0.0%) |
| Retail Trade | 7 (58.3%) | 5 (41.7%) |
| Transportation & Warehousing | 7 (63.6%) | 4 (36.4%) |
| Utilities | 2 (100.0%) | 0 (0.0%) |
| Information | 1 (100.0%) | 0 (0.0%) |
| Finance & Insurance | 0 (0.0%) | 8 (100.0%) |
| Real Estate, Rental & Leasing | 0 (0.0%) | 1 (100.0%) |
| Professional & Scientific | 3 (100.0%) | 0 (0.0%) |
| Enterprise Management | 0 (0.0%) | 0 (0.0%) |
| Administrative & Support | 4 (66.7%) | 2 (33.3%) |
| Educational Services | 1 (3.5%) | 28 (96.6%) |
| Health Care & Social Assistance | 2 (8.3%) | 22 (91.7%) |
| Arts, Entertainment & Recreation | 0 (0.0%) | 2 (100.0%) |
| Accommodation & Food Services | 0 (0.0%) | 5 (100.0%) |
| Public Administration | 0 (0.0%) | 0 (0.0%) |
| Total | 72 (46.5%) | 83 (53.5%) |
Education in Walcott
School Enrollment in Walcott
The most common levels of schooling among the 66 students in Walcott are middle school (26 | 39.4%), elementary school (22 | 33.3%), and high school (13 | 19.7%).
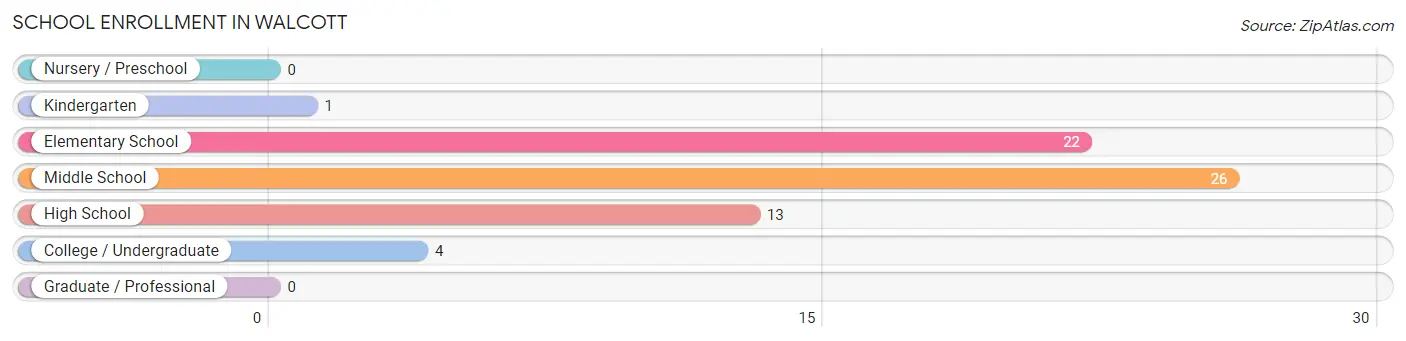
| School Level | # Students | % Students |
| Nursery / Preschool | 0 | 0.0% |
| Kindergarten | 1 | 1.5% |
| Elementary School | 22 | 33.3% |
| Middle School | 26 | 39.4% |
| High School | 13 | 19.7% |
| College / Undergraduate | 4 | 6.1% |
| Graduate / Professional | 0 | 0.0% |
| Total | 66 | 100.0% |
School Enrollment by Age by Funding Source in Walcott
Out of a total of 66 students who are enrolled in schools in Walcott, 3 (4.5%) attend a private institution, while the remaining 63 (95.5%) are enrolled in public schools. The age group of 15 to 17 year olds has the highest likelihood of being enrolled in private schools, with 3 (23.1% in the age bracket) enrolled. Conversely, the age group of 5 to 9 year old has the lowest likelihood of being enrolled in a private school, with 22 (100.0% in the age bracket) attending a public institution.
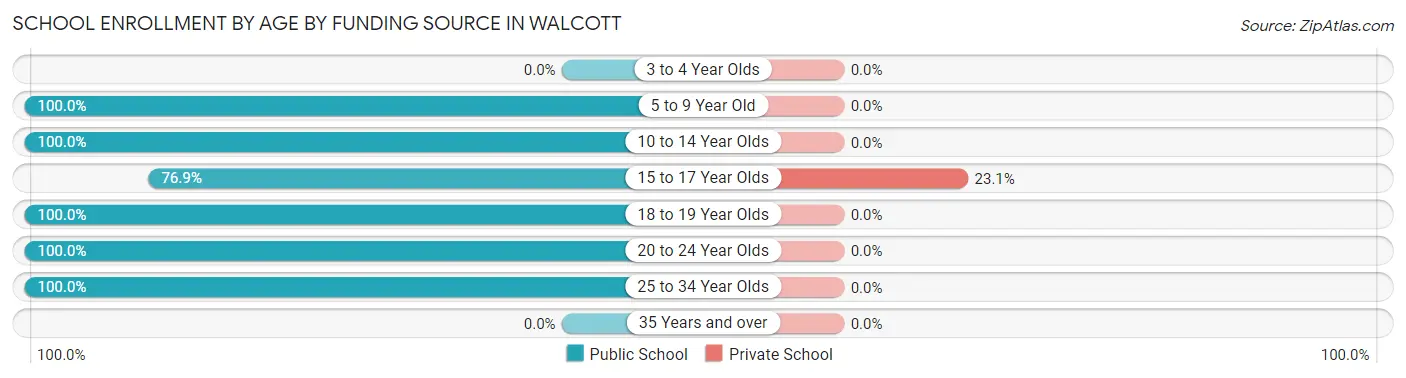
| Age Bracket | Public School | Private School |
| 3 to 4 Year Olds | 0 (0.0%) | 0 (0.0%) |
| 5 to 9 Year Old | 22 (100.0%) | 0 (0.0%) |
| 10 to 14 Year Olds | 26 (100.0%) | 0 (0.0%) |
| 15 to 17 Year Olds | 10 (76.9%) | 3 (23.1%) |
| 18 to 19 Year Olds | 1 (100.0%) | 0 (0.0%) |
| 20 to 24 Year Olds | 3 (100.0%) | 0 (0.0%) |
| 25 to 34 Year Olds | 1 (100.0%) | 0 (0.0%) |
| 35 Years and over | 0 (0.0%) | 0 (0.0%) |
| Total | 63 (95.5%) | 3 (4.5%) |
Educational Attainment by Field of Study in Walcott
Science & technology (16 | 20.0%), business (15 | 18.8%), education (15 | 18.8%), visual & performing arts (9 | 11.3%), and bio, nature & agricultural (7 | 8.7%) are the most common fields of study among 80 individuals in Walcott who have obtained a bachelor's degree or higher.
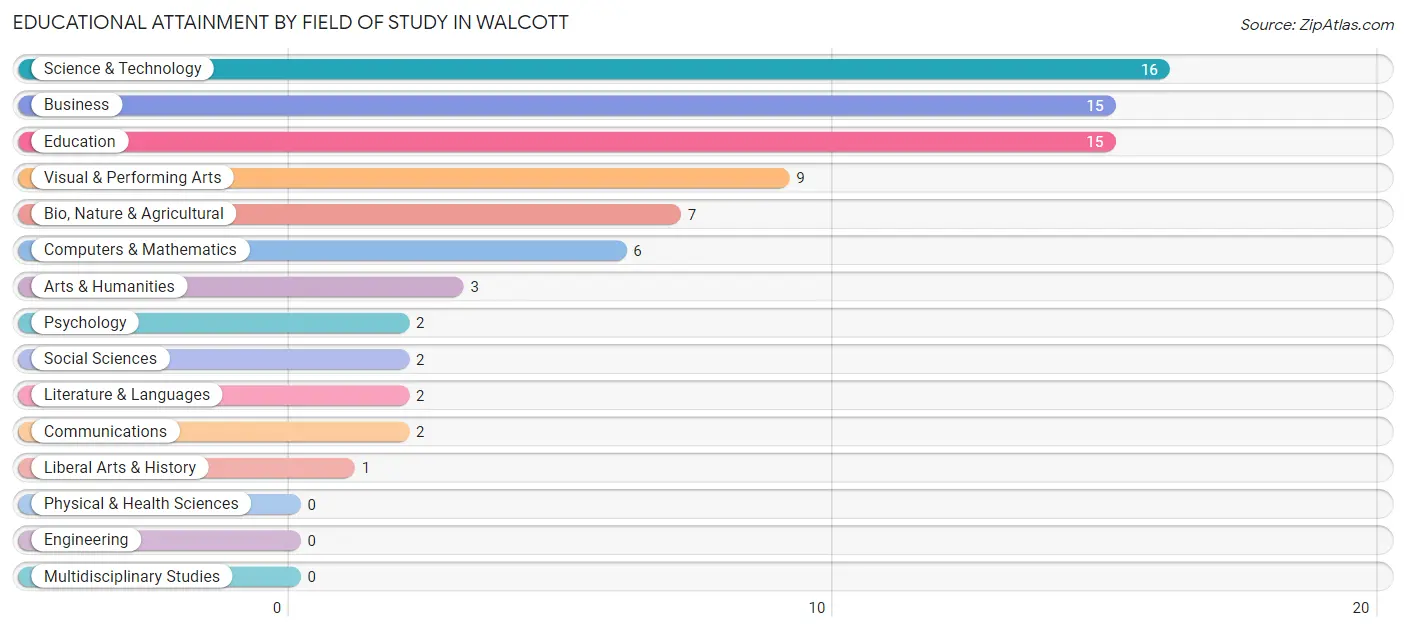
| Field of Study | # Graduates | % Graduates |
| Computers & Mathematics | 6 | 7.5% |
| Bio, Nature & Agricultural | 7 | 8.7% |
| Physical & Health Sciences | 0 | 0.0% |
| Psychology | 2 | 2.5% |
| Social Sciences | 2 | 2.5% |
| Engineering | 0 | 0.0% |
| Multidisciplinary Studies | 0 | 0.0% |
| Science & Technology | 16 | 20.0% |
| Business | 15 | 18.8% |
| Education | 15 | 18.8% |
| Literature & Languages | 2 | 2.5% |
| Liberal Arts & History | 1 | 1.3% |
| Visual & Performing Arts | 9 | 11.3% |
| Communications | 2 | 2.5% |
| Arts & Humanities | 3 | 3.7% |
| Total | 80 | 100.0% |
Transportation & Commute in Walcott
Vehicle Availability by Sex in Walcott
The most prevalent vehicle ownership categories in Walcott are males with 2 vehicles (22, accounting for 30.6%) and females with 2 vehicles (18, making up 26.5%).
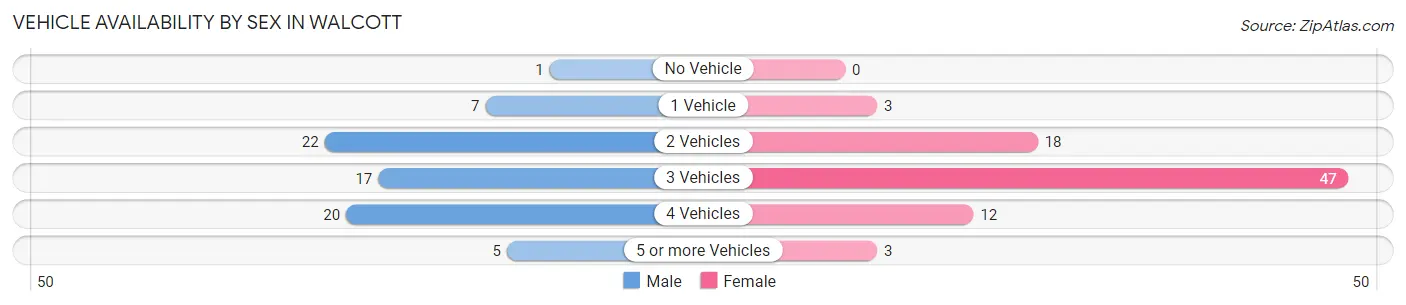
| Vehicles Available | Male | Female |
| No Vehicle | 1 (1.4%) | 0 (0.0%) |
| 1 Vehicle | 7 (9.7%) | 3 (3.6%) |
| 2 Vehicles | 22 (30.6%) | 18 (21.7%) |
| 3 Vehicles | 17 (23.6%) | 47 (56.6%) |
| 4 Vehicles | 20 (27.8%) | 12 (14.5%) |
| 5 or more Vehicles | 5 (6.9%) | 3 (3.6%) |
| Total | 72 (100.0%) | 83 (100.0%) |
Commute Time in Walcott
The most frequently occuring commute durations in Walcott are 30 to 34 minutes (66 commuters, 46.2%), 25 to 29 minutes (26 commuters, 18.2%), and 35 to 39 minutes (15 commuters, 10.5%).
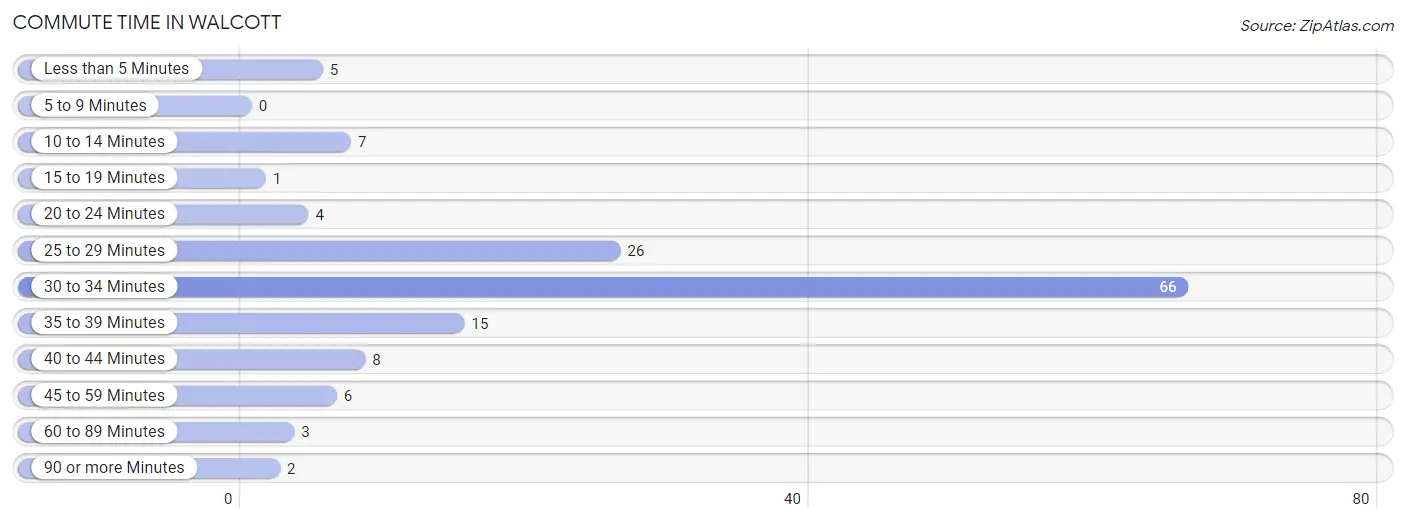
| Commute Time | # Commuters | % Commuters |
| Less than 5 Minutes | 5 | 3.5% |
| 5 to 9 Minutes | 0 | 0.0% |
| 10 to 14 Minutes | 7 | 4.9% |
| 15 to 19 Minutes | 1 | 0.7% |
| 20 to 24 Minutes | 4 | 2.8% |
| 25 to 29 Minutes | 26 | 18.2% |
| 30 to 34 Minutes | 66 | 46.2% |
| 35 to 39 Minutes | 15 | 10.5% |
| 40 to 44 Minutes | 8 | 5.6% |
| 45 to 59 Minutes | 6 | 4.2% |
| 60 to 89 Minutes | 3 | 2.1% |
| 90 or more Minutes | 2 | 1.4% |
Commute Time by Sex in Walcott
The most common commute times in Walcott are 30 to 34 minutes (29 commuters, 40.8%) for males and 30 to 34 minutes (37 commuters, 51.4%) for females.
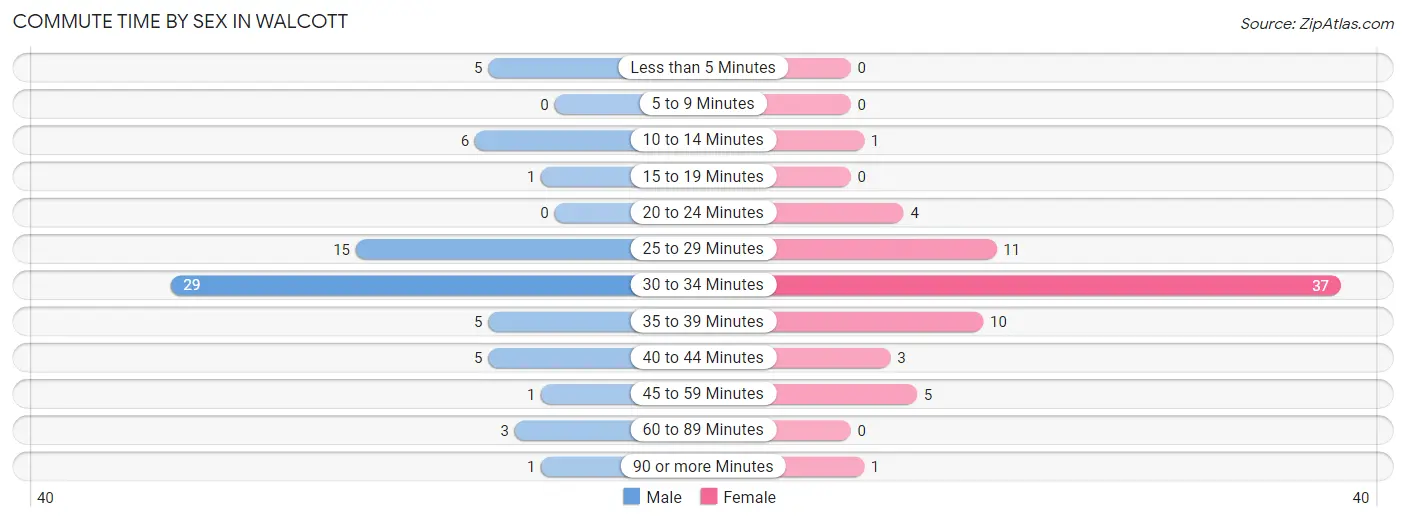
| Commute Time | Male | Female |
| Less than 5 Minutes | 5 (7.0%) | 0 (0.0%) |
| 5 to 9 Minutes | 0 (0.0%) | 0 (0.0%) |
| 10 to 14 Minutes | 6 (8.5%) | 1 (1.4%) |
| 15 to 19 Minutes | 1 (1.4%) | 0 (0.0%) |
| 20 to 24 Minutes | 0 (0.0%) | 4 (5.6%) |
| 25 to 29 Minutes | 15 (21.1%) | 11 (15.3%) |
| 30 to 34 Minutes | 29 (40.8%) | 37 (51.4%) |
| 35 to 39 Minutes | 5 (7.0%) | 10 (13.9%) |
| 40 to 44 Minutes | 5 (7.0%) | 3 (4.2%) |
| 45 to 59 Minutes | 1 (1.4%) | 5 (6.9%) |
| 60 to 89 Minutes | 3 (4.2%) | 0 (0.0%) |
| 90 or more Minutes | 1 (1.4%) | 1 (1.4%) |
Time of Departure to Work by Sex in Walcott
The most frequent times of departure to work in Walcott are 7:00 AM to 7:29 AM (27, 38.0%) for males and 6:30 AM to 6:59 AM (26, 36.1%) for females.
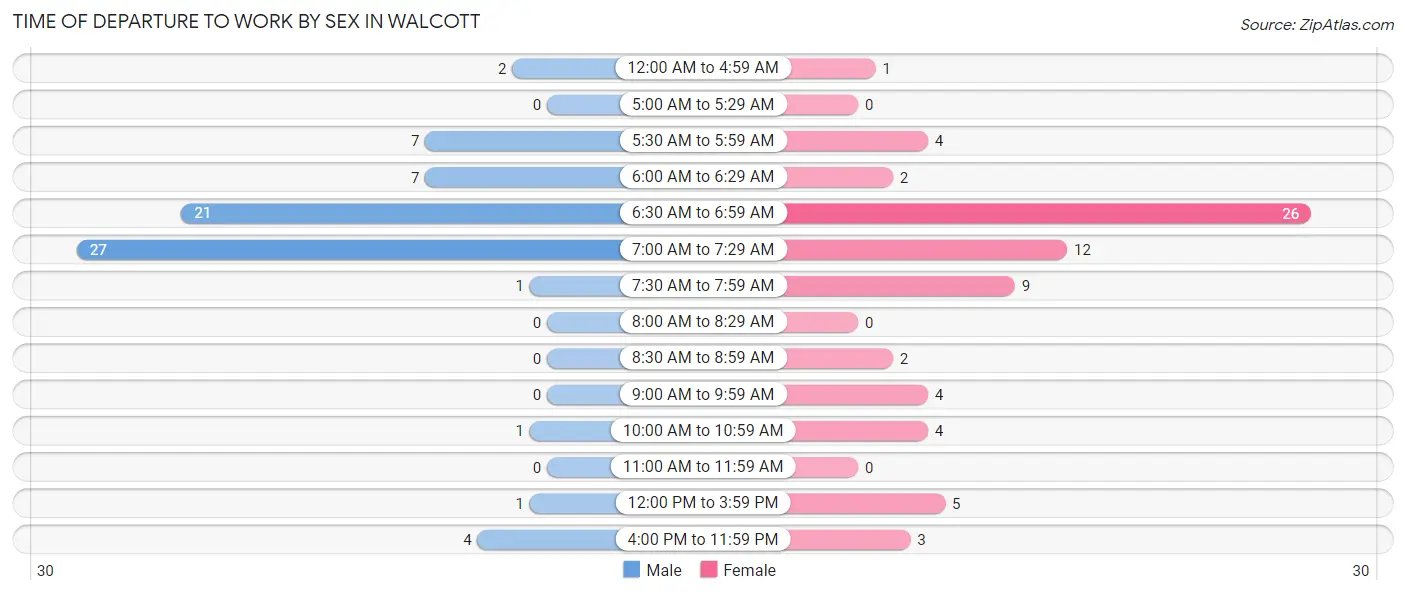
| Time of Departure | Male | Female |
| 12:00 AM to 4:59 AM | 2 (2.8%) | 1 (1.4%) |
| 5:00 AM to 5:29 AM | 0 (0.0%) | 0 (0.0%) |
| 5:30 AM to 5:59 AM | 7 (9.9%) | 4 (5.6%) |
| 6:00 AM to 6:29 AM | 7 (9.9%) | 2 (2.8%) |
| 6:30 AM to 6:59 AM | 21 (29.6%) | 26 (36.1%) |
| 7:00 AM to 7:29 AM | 27 (38.0%) | 12 (16.7%) |
| 7:30 AM to 7:59 AM | 1 (1.4%) | 9 (12.5%) |
| 8:00 AM to 8:29 AM | 0 (0.0%) | 0 (0.0%) |
| 8:30 AM to 8:59 AM | 0 (0.0%) | 2 (2.8%) |
| 9:00 AM to 9:59 AM | 0 (0.0%) | 4 (5.6%) |
| 10:00 AM to 10:59 AM | 1 (1.4%) | 4 (5.6%) |
| 11:00 AM to 11:59 AM | 0 (0.0%) | 0 (0.0%) |
| 12:00 PM to 3:59 PM | 1 (1.4%) | 5 (6.9%) |
| 4:00 PM to 11:59 PM | 4 (5.6%) | 3 (4.2%) |
| Total | 71 (100.0%) | 72 (100.0%) |
Housing Occupancy in Walcott
Occupancy by Ownership in Walcott
Of the total 129 dwellings in Walcott, owner-occupied units account for 109 (84.5%), while renter-occupied units make up 20 (15.5%).
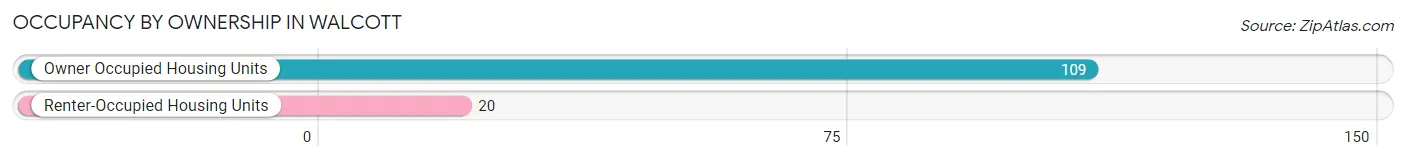
| Occupancy | # Housing Units | % Housing Units |
| Owner Occupied Housing Units | 109 | 84.5% |
| Renter-Occupied Housing Units | 20 | 15.5% |
| Total Occupied Housing Units | 129 | 100.0% |
Occupancy by Household Size in Walcott
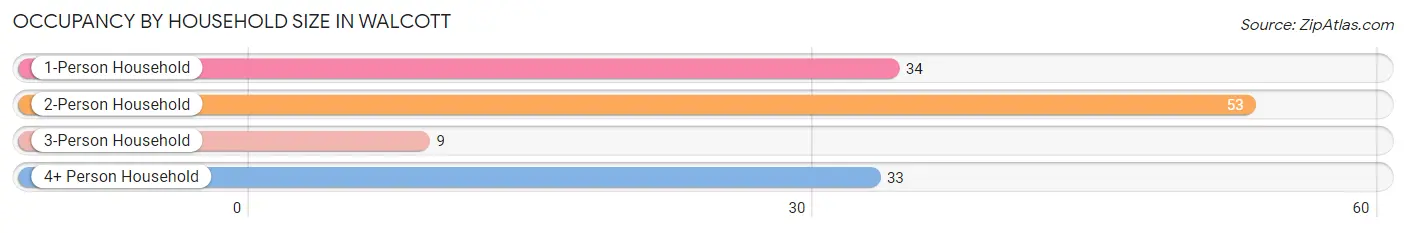
| Household Size | # Housing Units | % Housing Units |
| 1-Person Household | 34 | 26.4% |
| 2-Person Household | 53 | 41.1% |
| 3-Person Household | 9 | 7.0% |
| 4+ Person Household | 33 | 25.6% |
| Total Housing Units | 129 | 100.0% |
Occupancy by Ownership by Household Size in Walcott
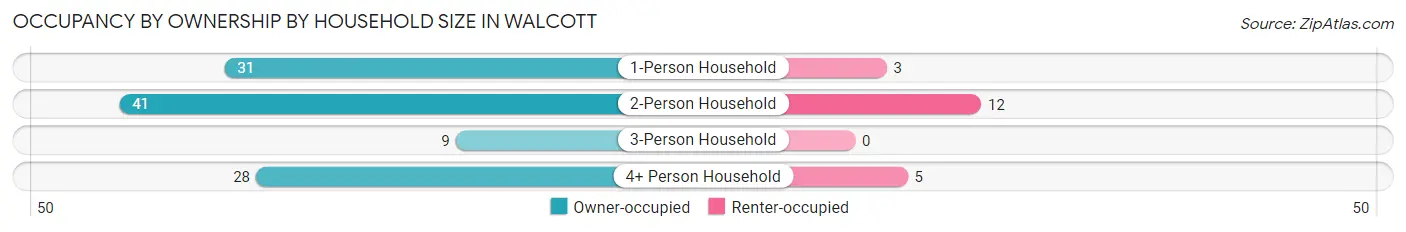
| Household Size | Owner-occupied | Renter-occupied |
| 1-Person Household | 31 (91.2%) | 3 (8.8%) |
| 2-Person Household | 41 (77.4%) | 12 (22.6%) |
| 3-Person Household | 9 (100.0%) | 0 (0.0%) |
| 4+ Person Household | 28 (84.9%) | 5 (15.1%) |
| Total Housing Units | 109 (84.5%) | 20 (15.5%) |
Occupancy by Educational Attainment in Walcott
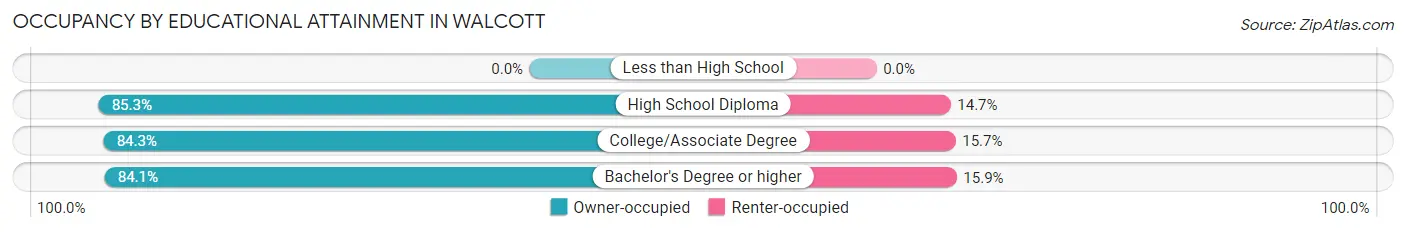
| Household Size | Owner-occupied | Renter-occupied |
| Less than High School | 0 (0.0%) | 0 (0.0%) |
| High School Diploma | 29 (85.3%) | 5 (14.7%) |
| College/Associate Degree | 43 (84.3%) | 8 (15.7%) |
| Bachelor's Degree or higher | 37 (84.1%) | 7 (15.9%) |
Occupancy by Age of Householder in Walcott
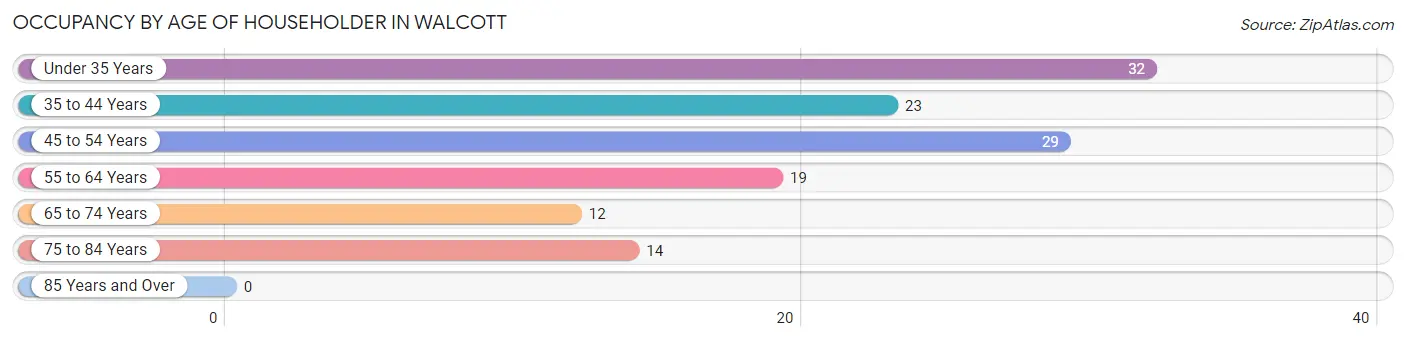
| Age Bracket | # Households | % Households |
| Under 35 Years | 32 | 24.8% |
| 35 to 44 Years | 23 | 17.8% |
| 45 to 54 Years | 29 | 22.5% |
| 55 to 64 Years | 19 | 14.7% |
| 65 to 74 Years | 12 | 9.3% |
| 75 to 84 Years | 14 | 10.8% |
| 85 Years and Over | 0 | 0.0% |
| Total | 129 | 100.0% |
Housing Finances in Walcott
Median Income by Occupancy in Walcott
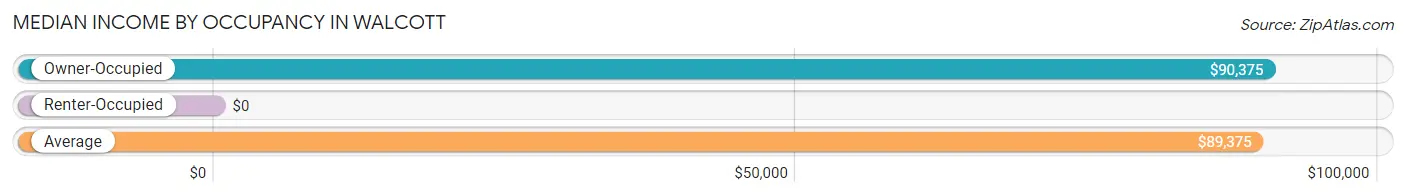
| Occupancy Type | # Households | Median Income |
| Owner-Occupied | 109 (84.5%) | $90,375 |
| Renter-Occupied | 20 (15.5%) | $0 |
| Average | 129 (100.0%) | $89,375 |
Occupancy by Householder Income Bracket in Walcott
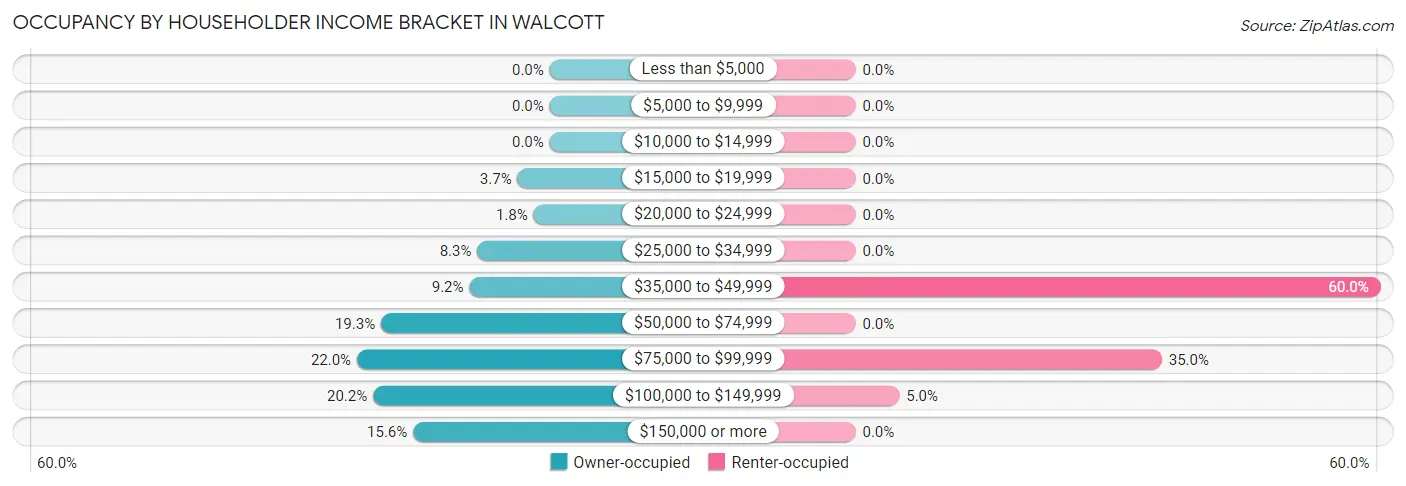
| Income Bracket | Owner-occupied | Renter-occupied |
| Less than $5,000 | 0 (0.0%) | 0 (0.0%) |
| $5,000 to $9,999 | 0 (0.0%) | 0 (0.0%) |
| $10,000 to $14,999 | 0 (0.0%) | 0 (0.0%) |
| $15,000 to $19,999 | 4 (3.7%) | 0 (0.0%) |
| $20,000 to $24,999 | 2 (1.8%) | 0 (0.0%) |
| $25,000 to $34,999 | 9 (8.3%) | 0 (0.0%) |
| $35,000 to $49,999 | 10 (9.2%) | 12 (60.0%) |
| $50,000 to $74,999 | 21 (19.3%) | 0 (0.0%) |
| $75,000 to $99,999 | 24 (22.0%) | 7 (35.0%) |
| $100,000 to $149,999 | 22 (20.2%) | 1 (5.0%) |
| $150,000 or more | 17 (15.6%) | 0 (0.0%) |
| Total | 109 (100.0%) | 20 (100.0%) |
Monthly Housing Cost Tiers in Walcott
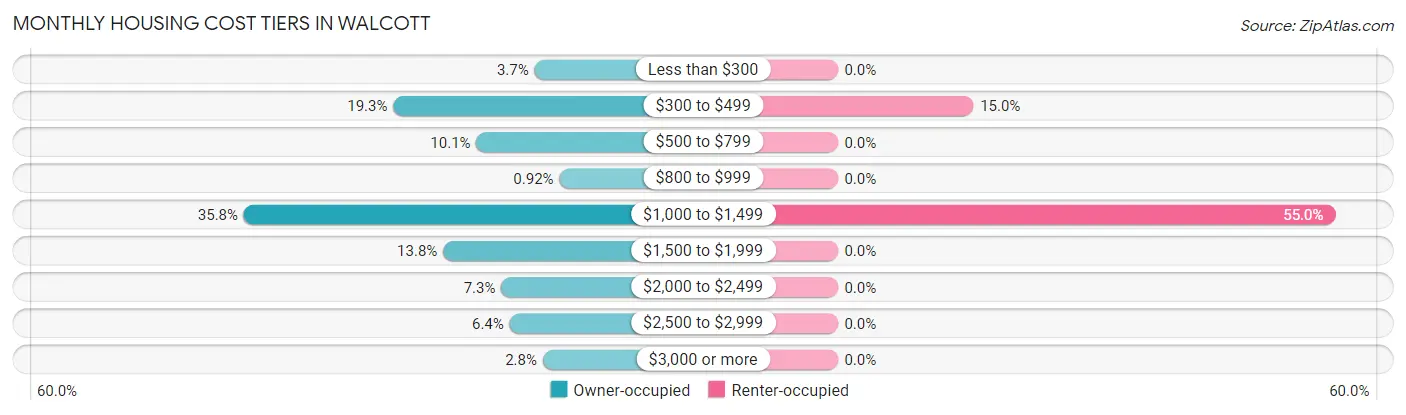
| Monthly Cost | Owner-occupied | Renter-occupied |
| Less than $300 | 4 (3.7%) | 0 (0.0%) |
| $300 to $499 | 21 (19.3%) | 3 (15.0%) |
| $500 to $799 | 11 (10.1%) | 0 (0.0%) |
| $800 to $999 | 1 (0.9%) | 0 (0.0%) |
| $1,000 to $1,499 | 39 (35.8%) | 11 (55.0%) |
| $1,500 to $1,999 | 15 (13.8%) | 0 (0.0%) |
| $2,000 to $2,499 | 8 (7.3%) | 0 (0.0%) |
| $2,500 to $2,999 | 7 (6.4%) | 0 (0.0%) |
| $3,000 or more | 3 (2.8%) | 0 (0.0%) |
| Total | 109 (100.0%) | 20 (100.0%) |
Physical Housing Characteristics in Walcott
Housing Structures in Walcott
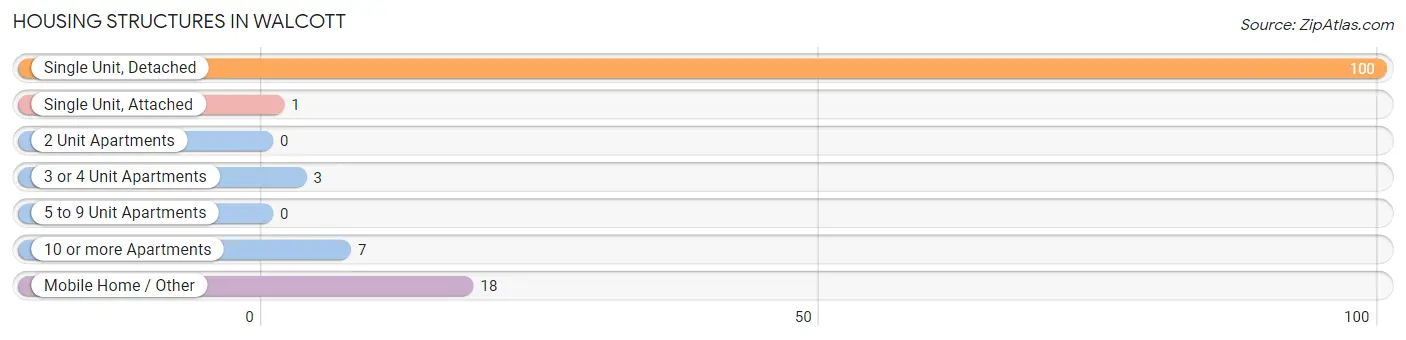
| Structure Type | # Housing Units | % Housing Units |
| Single Unit, Detached | 100 | 77.5% |
| Single Unit, Attached | 1 | 0.8% |
| 2 Unit Apartments | 0 | 0.0% |
| 3 or 4 Unit Apartments | 3 | 2.3% |
| 5 to 9 Unit Apartments | 0 | 0.0% |
| 10 or more Apartments | 7 | 5.4% |
| Mobile Home / Other | 18 | 14.0% |
| Total | 129 | 100.0% |
Housing Structures by Occupancy in Walcott
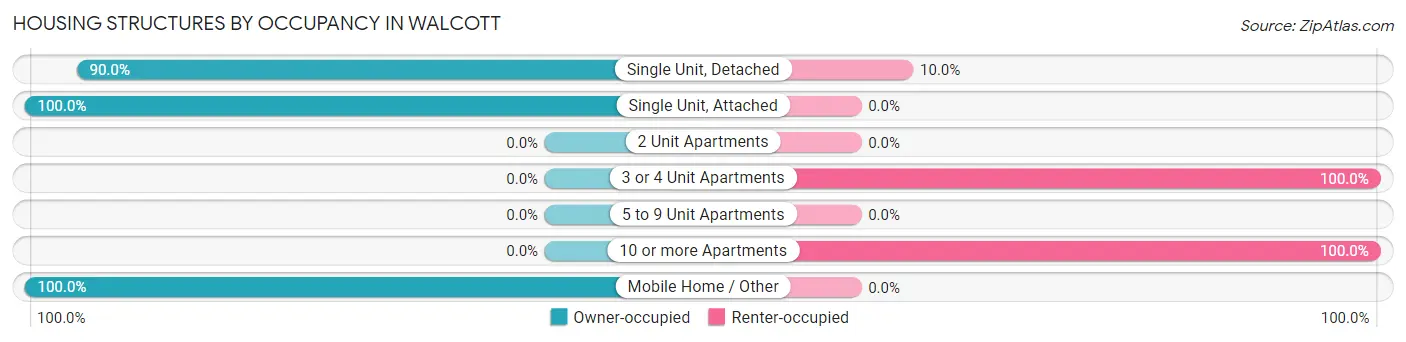
| Structure Type | Owner-occupied | Renter-occupied |
| Single Unit, Detached | 90 (90.0%) | 10 (10.0%) |
| Single Unit, Attached | 1 (100.0%) | 0 (0.0%) |
| 2 Unit Apartments | 0 (0.0%) | 0 (0.0%) |
| 3 or 4 Unit Apartments | 0 (0.0%) | 3 (100.0%) |
| 5 to 9 Unit Apartments | 0 (0.0%) | 0 (0.0%) |
| 10 or more Apartments | 0 (0.0%) | 7 (100.0%) |
| Mobile Home / Other | 18 (100.0%) | 0 (0.0%) |
| Total | 109 (84.5%) | 20 (15.5%) |
Housing Structures by Number of Rooms in Walcott
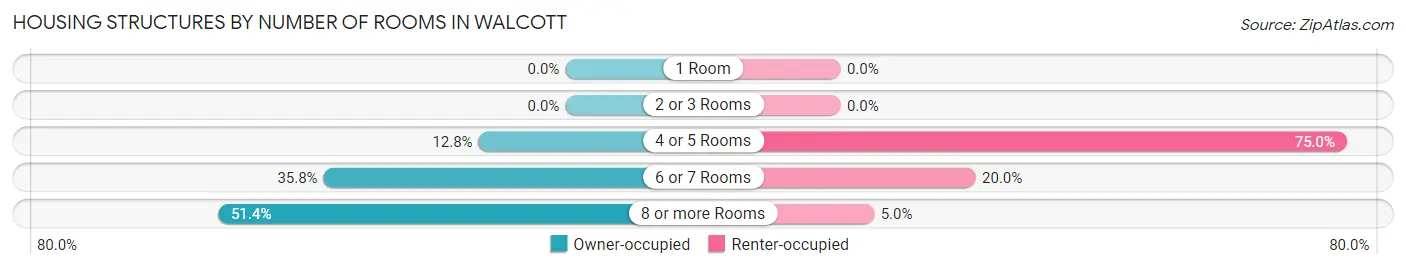
| Number of Rooms | Owner-occupied | Renter-occupied |
| 1 Room | 0 (0.0%) | 0 (0.0%) |
| 2 or 3 Rooms | 0 (0.0%) | 0 (0.0%) |
| 4 or 5 Rooms | 14 (12.8%) | 15 (75.0%) |
| 6 or 7 Rooms | 39 (35.8%) | 4 (20.0%) |
| 8 or more Rooms | 56 (51.4%) | 1 (5.0%) |
| Total | 109 (100.0%) | 20 (100.0%) |
Housing Structure by Heating Type in Walcott
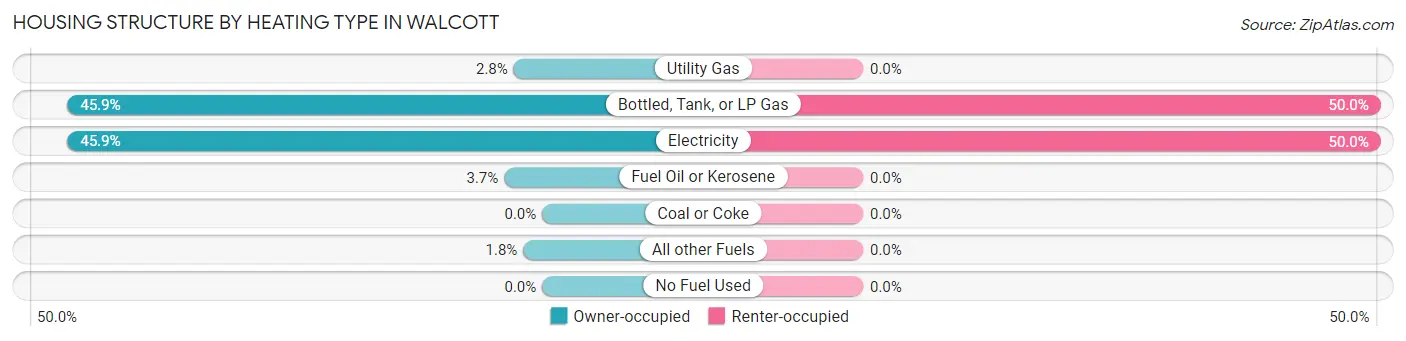
| Heating Type | Owner-occupied | Renter-occupied |
| Utility Gas | 3 (2.8%) | 0 (0.0%) |
| Bottled, Tank, or LP Gas | 50 (45.9%) | 10 (50.0%) |
| Electricity | 50 (45.9%) | 10 (50.0%) |
| Fuel Oil or Kerosene | 4 (3.7%) | 0 (0.0%) |
| Coal or Coke | 0 (0.0%) | 0 (0.0%) |
| All other Fuels | 2 (1.8%) | 0 (0.0%) |
| No Fuel Used | 0 (0.0%) | 0 (0.0%) |
| Total | 109 (100.0%) | 20 (100.0%) |
Household Vehicle Usage in Walcott
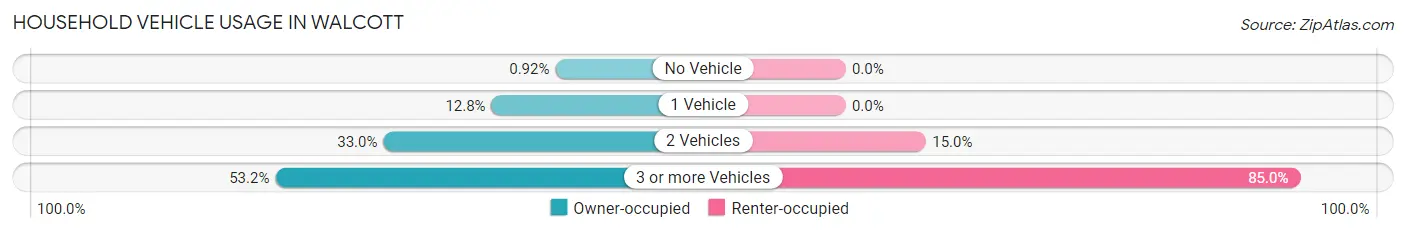
| Vehicles per Household | Owner-occupied | Renter-occupied |
| No Vehicle | 1 (0.9%) | 0 (0.0%) |
| 1 Vehicle | 14 (12.8%) | 0 (0.0%) |
| 2 Vehicles | 36 (33.0%) | 3 (15.0%) |
| 3 or more Vehicles | 58 (53.2%) | 17 (85.0%) |
| Total | 109 (100.0%) | 20 (100.0%) |
Real Estate & Mortgages in Walcott
Real Estate and Mortgage Overview in Walcott
| Characteristic | Without Mortgage | With Mortgage |
| Housing Units | 35 | 74 |
| Median Property Value | $106,300 | $180,000 |
| Median Household Income | $41,563 | $17 |
| Monthly Housing Costs | $432 | $3 |
| Real Estate Taxes | $950 | $0 |
Property Value by Mortgage Status in Walcott
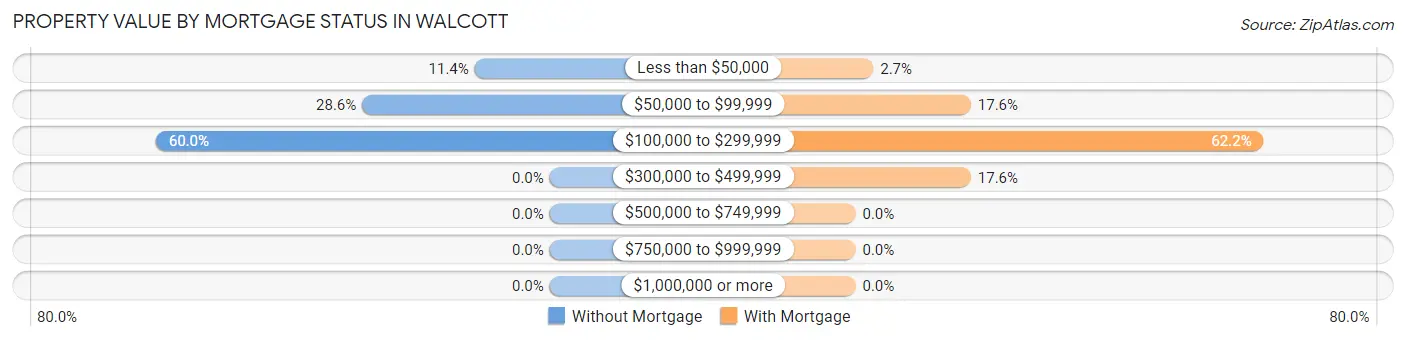
| Property Value | Without Mortgage | With Mortgage |
| Less than $50,000 | 4 (11.4%) | 2 (2.7%) |
| $50,000 to $99,999 | 10 (28.6%) | 13 (17.6%) |
| $100,000 to $299,999 | 21 (60.0%) | 46 (62.2%) |
| $300,000 to $499,999 | 0 (0.0%) | 13 (17.6%) |
| $500,000 to $749,999 | 0 (0.0%) | 0 (0.0%) |
| $750,000 to $999,999 | 0 (0.0%) | 0 (0.0%) |
| $1,000,000 or more | 0 (0.0%) | 0 (0.0%) |
| Total | 35 (100.0%) | 74 (100.0%) |
Household Income by Mortgage Status in Walcott
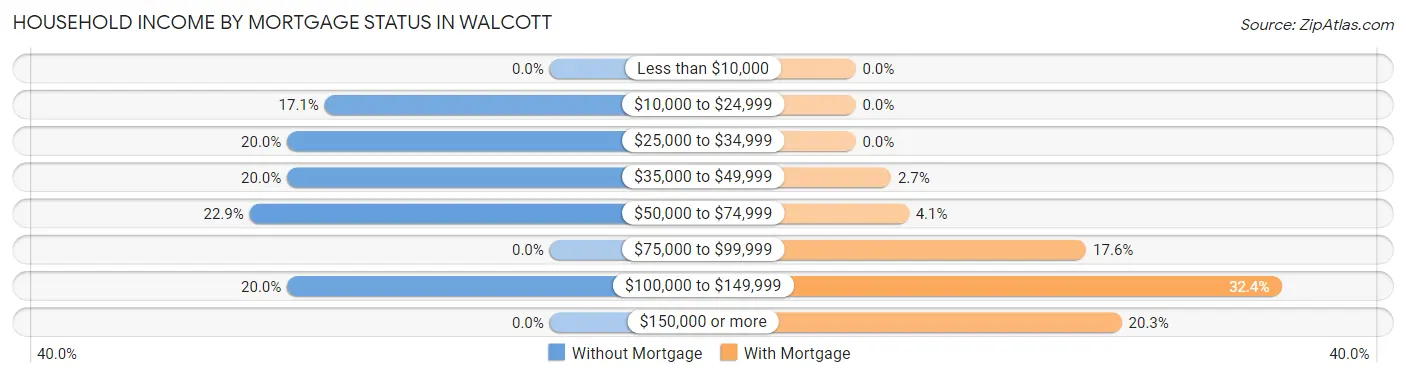
| Household Income | Without Mortgage | With Mortgage |
| Less than $10,000 | 0 (0.0%) | 0 (0.0%) |
| $10,000 to $24,999 | 6 (17.1%) | 0 (0.0%) |
| $25,000 to $34,999 | 7 (20.0%) | 0 (0.0%) |
| $35,000 to $49,999 | 7 (20.0%) | 2 (2.7%) |
| $50,000 to $74,999 | 8 (22.9%) | 3 (4.1%) |
| $75,000 to $99,999 | 0 (0.0%) | 13 (17.6%) |
| $100,000 to $149,999 | 7 (20.0%) | 24 (32.4%) |
| $150,000 or more | 0 (0.0%) | 15 (20.3%) |
| Total | 35 (100.0%) | 74 (100.0%) |
Property Value to Household Income Ratio in Walcott
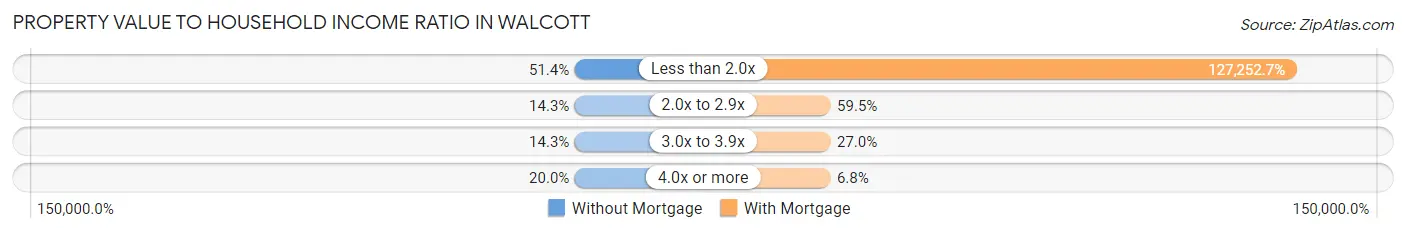
| Value-to-Income Ratio | Without Mortgage | With Mortgage |
| Less than 2.0x | 18 (51.4%) | 94,167 (127,252.7%) |
| 2.0x to 2.9x | 5 (14.3%) | 44 (59.5%) |
| 3.0x to 3.9x | 5 (14.3%) | 20 (27.0%) |
| 4.0x or more | 7 (20.0%) | 5 (6.8%) |
| Total | 35 (100.0%) | 74 (100.0%) |
Real Estate Taxes by Mortgage Status in Walcott
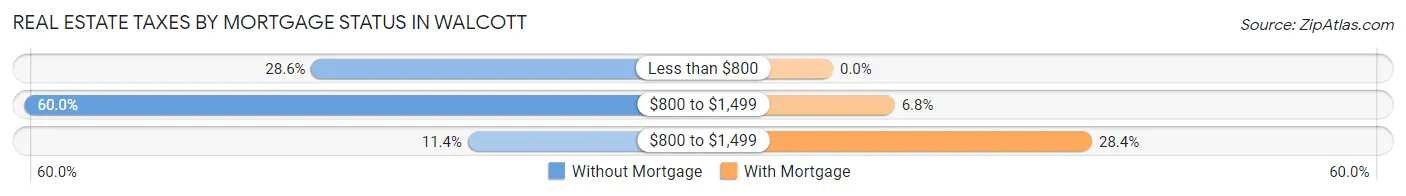
| Property Taxes | Without Mortgage | With Mortgage |
| Less than $800 | 10 (28.6%) | 0 (0.0%) |
| $800 to $1,499 | 21 (60.0%) | 5 (6.8%) |
| $800 to $1,499 | 4 (11.4%) | 21 (28.4%) |
| Total | 35 (100.0%) | 74 (100.0%) |
Health & Disability in Walcott
Health Insurance Coverage by Age in Walcott
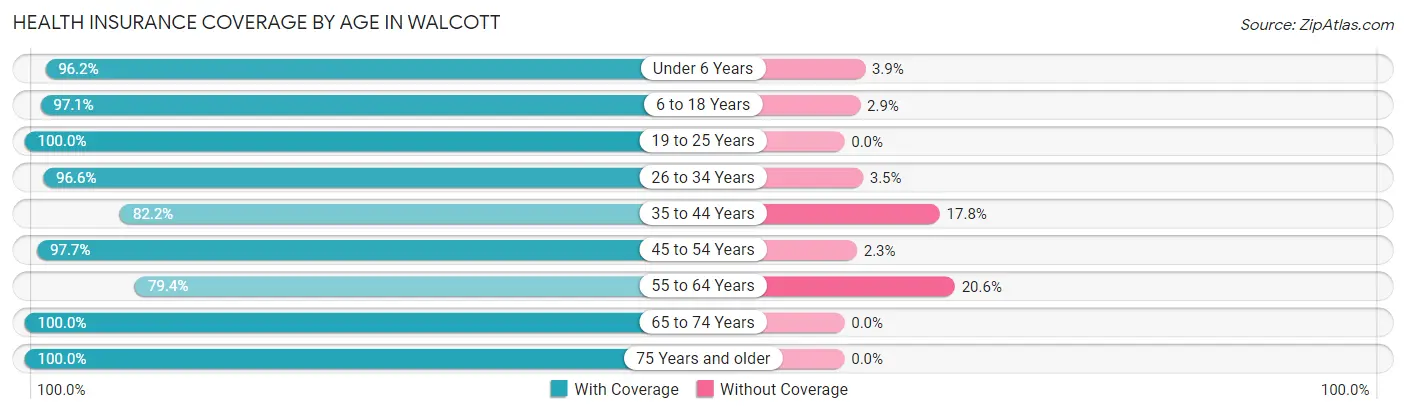
| Age Bracket | With Coverage | Without Coverage |
| Under 6 Years | 25 (96.2%) | 1 (3.8%) |
| 6 to 18 Years | 66 (97.1%) | 2 (2.9%) |
| 19 to 25 Years | 4 (100.0%) | 0 (0.0%) |
| 26 to 34 Years | 56 (96.6%) | 2 (3.5%) |
| 35 to 44 Years | 37 (82.2%) | 8 (17.8%) |
| 45 to 54 Years | 42 (97.7%) | 1 (2.3%) |
| 55 to 64 Years | 27 (79.4%) | 7 (20.6%) |
| 65 to 74 Years | 18 (100.0%) | 0 (0.0%) |
| 75 Years and older | 17 (100.0%) | 0 (0.0%) |
| Total | 292 (93.3%) | 21 (6.7%) |
Health Insurance Coverage by Citizenship Status in Walcott
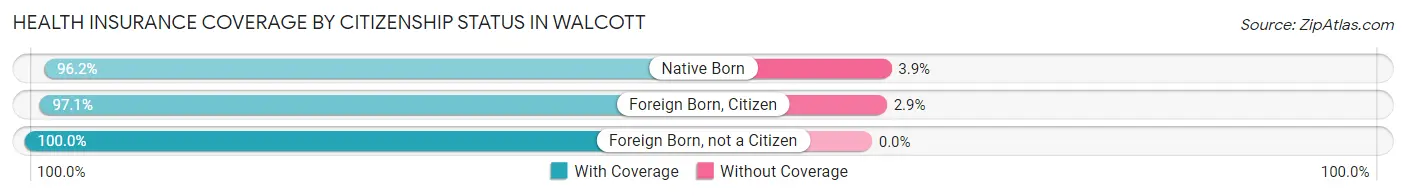
| Citizenship Status | With Coverage | Without Coverage |
| Native Born | 25 (96.2%) | 1 (3.8%) |
| Foreign Born, Citizen | 66 (97.1%) | 2 (2.9%) |
| Foreign Born, not a Citizen | 4 (100.0%) | 0 (0.0%) |
Health Insurance Coverage by Household Income in Walcott
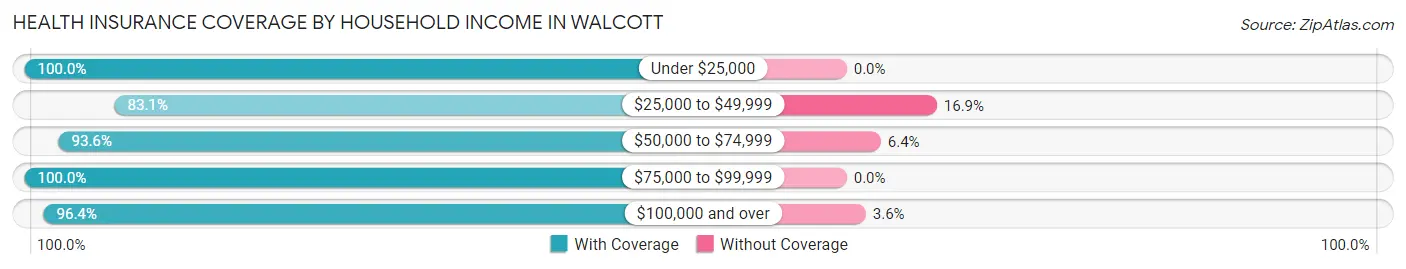
| Household Income | With Coverage | Without Coverage |
| Under $25,000 | 6 (100.0%) | 0 (0.0%) |
| $25,000 to $49,999 | 69 (83.1%) | 14 (16.9%) |
| $50,000 to $74,999 | 44 (93.6%) | 3 (6.4%) |
| $75,000 to $99,999 | 65 (100.0%) | 0 (0.0%) |
| $100,000 and over | 108 (96.4%) | 4 (3.6%) |
Public vs Private Health Insurance Coverage by Age in Walcott
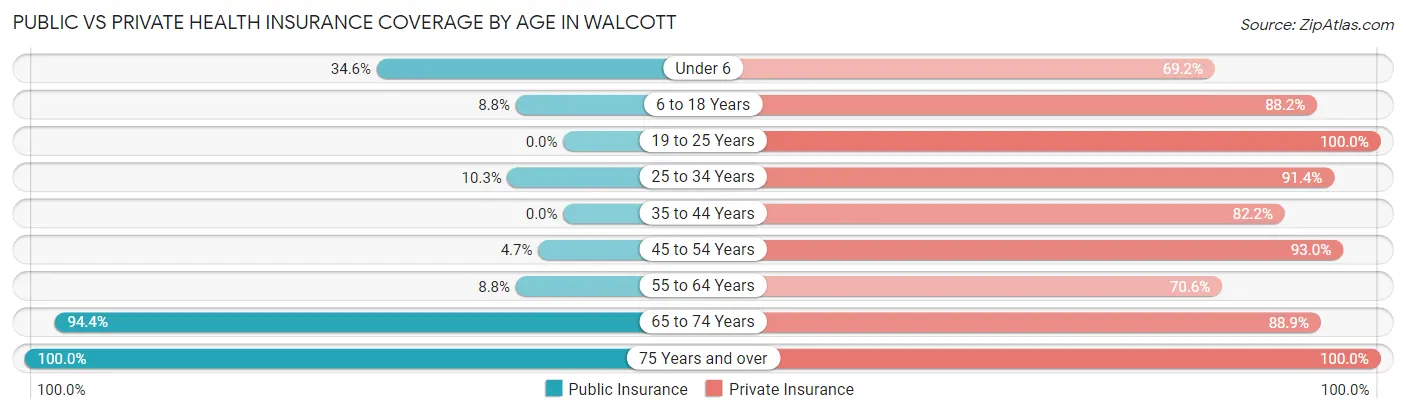
| Age Bracket | Public Insurance | Private Insurance |
| Under 6 | 9 (34.6%) | 18 (69.2%) |
| 6 to 18 Years | 6 (8.8%) | 60 (88.2%) |
| 19 to 25 Years | 0 (0.0%) | 4 (100.0%) |
| 25 to 34 Years | 6 (10.3%) | 53 (91.4%) |
| 35 to 44 Years | 0 (0.0%) | 37 (82.2%) |
| 45 to 54 Years | 2 (4.6%) | 40 (93.0%) |
| 55 to 64 Years | 3 (8.8%) | 24 (70.6%) |
| 65 to 74 Years | 17 (94.4%) | 16 (88.9%) |
| 75 Years and over | 17 (100.0%) | 17 (100.0%) |
| Total | 60 (19.2%) | 269 (85.9%) |
Disability Status by Sex by Age in Walcott
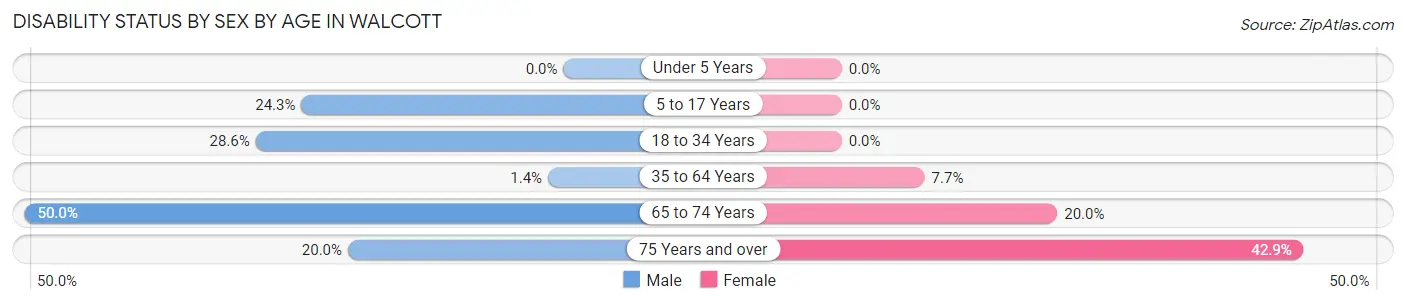
| Age Bracket | Male | Female |
| Under 5 Years | 0 (0.0%) | 0 (0.0%) |
| 5 to 17 Years | 9 (24.3%) | 0 (0.0%) |
| 18 to 34 Years | 6 (28.6%) | 0 (0.0%) |
| 35 to 64 Years | 1 (1.4%) | 4 (7.7%) |
| 65 to 74 Years | 4 (50.0%) | 2 (20.0%) |
| 75 Years and over | 2 (20.0%) | 3 (42.9%) |
Disability Class by Sex by Age in Walcott
Disability Class: Hearing Difficulty
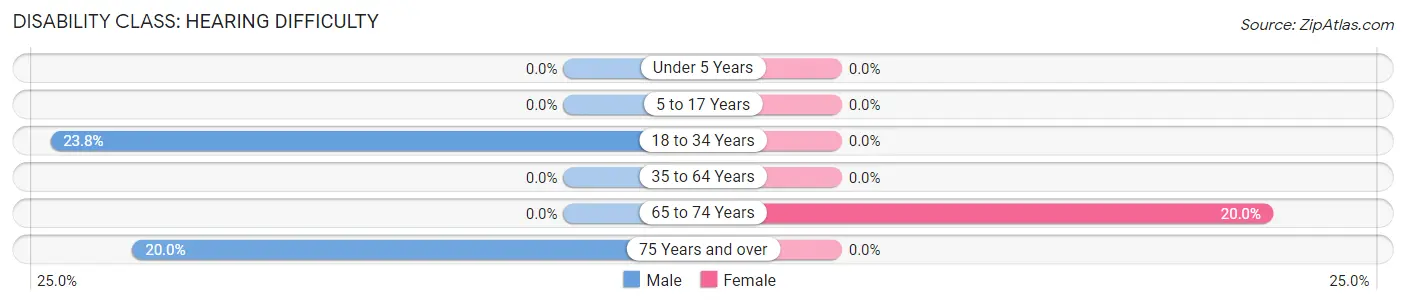
| Age Bracket | Male | Female |
| Under 5 Years | 0 (0.0%) | 0 (0.0%) |
| 5 to 17 Years | 0 (0.0%) | 0 (0.0%) |
| 18 to 34 Years | 5 (23.8%) | 0 (0.0%) |
| 35 to 64 Years | 0 (0.0%) | 0 (0.0%) |
| 65 to 74 Years | 0 (0.0%) | 2 (20.0%) |
| 75 Years and over | 2 (20.0%) | 0 (0.0%) |
Disability Class: Vision Difficulty
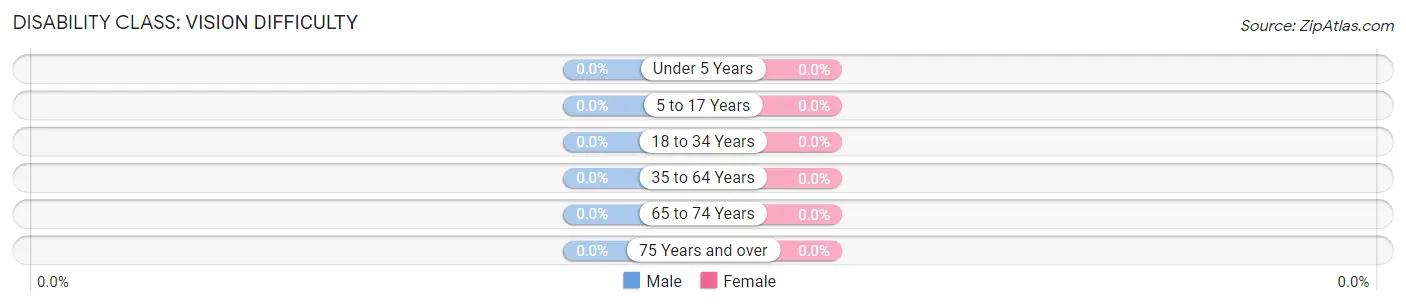
| Age Bracket | Male | Female |
| Under 5 Years | 0 (0.0%) | 0 (0.0%) |
| 5 to 17 Years | 0 (0.0%) | 0 (0.0%) |
| 18 to 34 Years | 0 (0.0%) | 0 (0.0%) |
| 35 to 64 Years | 0 (0.0%) | 0 (0.0%) |
| 65 to 74 Years | 0 (0.0%) | 0 (0.0%) |
| 75 Years and over | 0 (0.0%) | 0 (0.0%) |
Disability Class: Cognitive Difficulty
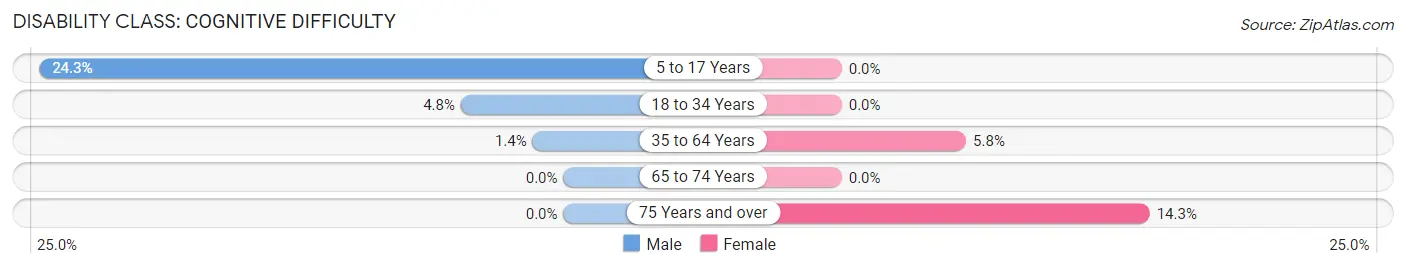
| Age Bracket | Male | Female |
| 5 to 17 Years | 9 (24.3%) | 0 (0.0%) |
| 18 to 34 Years | 1 (4.8%) | 0 (0.0%) |
| 35 to 64 Years | 1 (1.4%) | 3 (5.8%) |
| 65 to 74 Years | 0 (0.0%) | 0 (0.0%) |
| 75 Years and over | 0 (0.0%) | 1 (14.3%) |
Disability Class: Ambulatory Difficulty
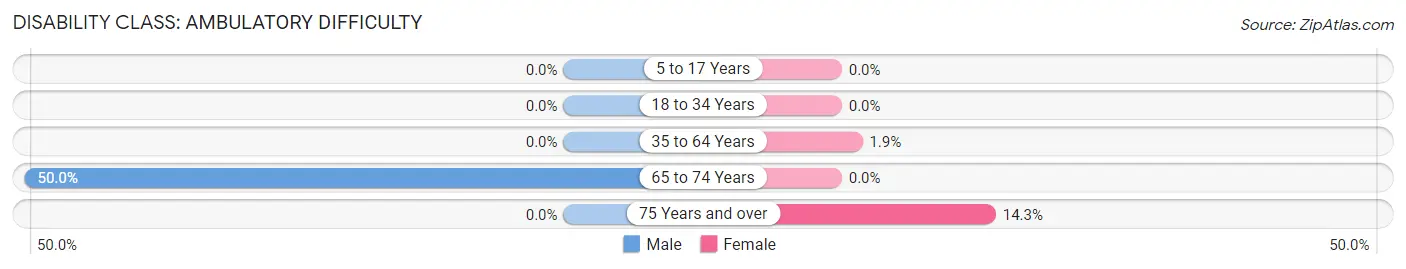
| Age Bracket | Male | Female |
| 5 to 17 Years | 0 (0.0%) | 0 (0.0%) |
| 18 to 34 Years | 0 (0.0%) | 0 (0.0%) |
| 35 to 64 Years | 0 (0.0%) | 1 (1.9%) |
| 65 to 74 Years | 4 (50.0%) | 0 (0.0%) |
| 75 Years and over | 0 (0.0%) | 1 (14.3%) |
Disability Class: Self-Care Difficulty
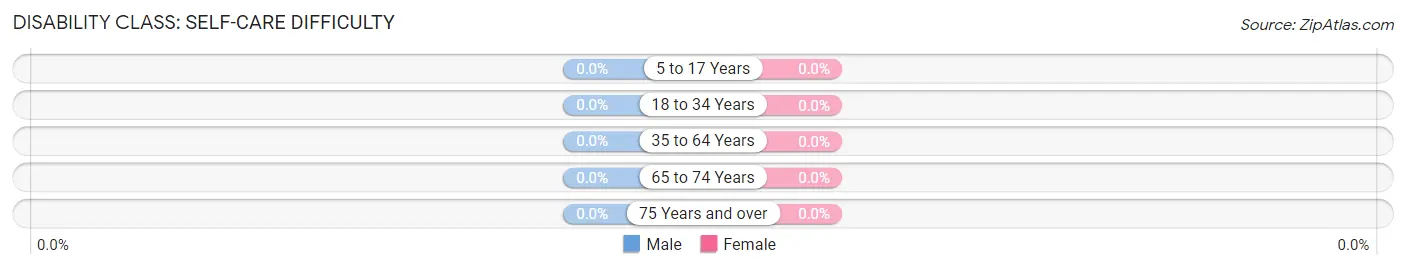
| Age Bracket | Male | Female |
| 5 to 17 Years | 0 (0.0%) | 0 (0.0%) |
| 18 to 34 Years | 0 (0.0%) | 0 (0.0%) |
| 35 to 64 Years | 0 (0.0%) | 0 (0.0%) |
| 65 to 74 Years | 0 (0.0%) | 0 (0.0%) |
| 75 Years and over | 0 (0.0%) | 0 (0.0%) |
Technology Access in Walcott
Computing Device Access in Walcott
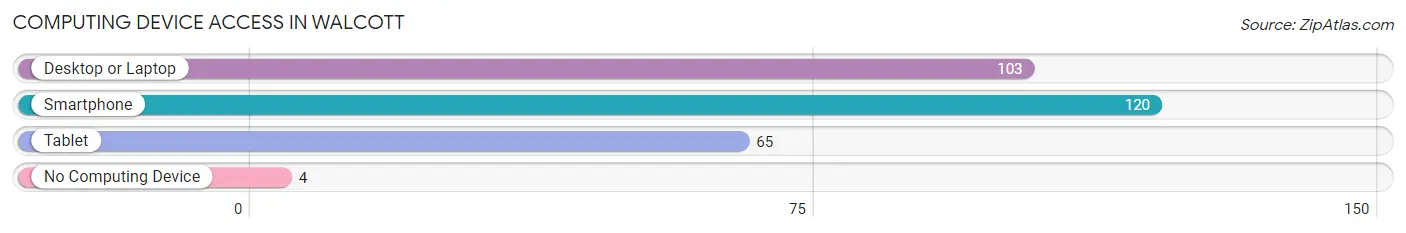
| Device Type | # Households | % Households |
| Desktop or Laptop | 103 | 79.8% |
| Smartphone | 120 | 93.0% |
| Tablet | 65 | 50.4% |
| No Computing Device | 4 | 3.1% |
| Total | 129 | 100.0% |
Internet Access in Walcott
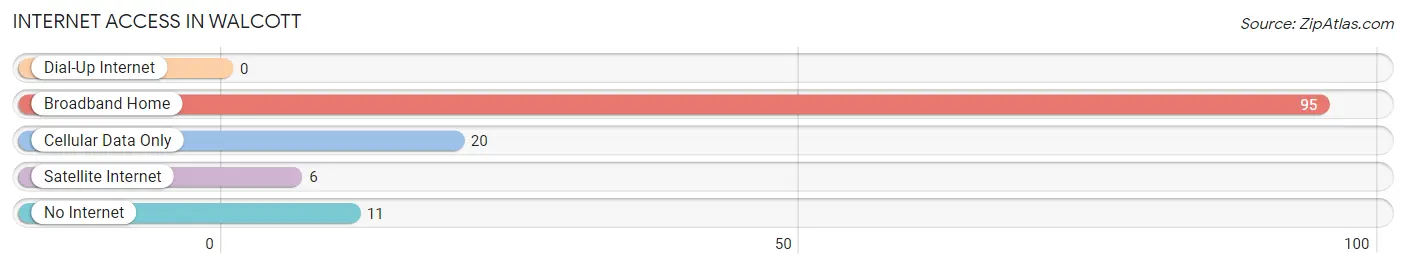
| Internet Type | # Households | % Households |
| Dial-Up Internet | 0 | 0.0% |
| Broadband Home | 95 | 73.6% |
| Cellular Data Only | 20 | 15.5% |
| Satellite Internet | 6 | 4.6% |
| No Internet | 11 | 8.5% |
| Total | 129 | 100.0% |
Walcott Summary
Walcott, North Dakota is a small town located in the southeastern corner of the state. It is situated in the heart of the Red River Valley, a region known for its rich agricultural heritage. The town was founded in 1881 and has a population of just over 500 people.
Geographically, Walcott is located in the Red River Valley, which is a flat, fertile plain that stretches from the Canadian border to the Minnesota border. The valley is bordered by the Red River of the North to the east and the Pembina River to the west. The area is known for its rich soil and abundant rainfall, making it ideal for farming. The town is located in the Pembina County, which is home to a variety of wildlife, including deer, elk, and pheasants.
The economy of Walcott is largely based on agriculture. The town is home to several large farms, which produce a variety of crops, including wheat, corn, soybeans, and sunflowers. The town also has a number of small businesses, including a grocery store, a hardware store, and a few restaurants.
The demographics of Walcott are largely homogeneous. The majority of the population is of German descent, with a small percentage of other European and Native American ancestry. The town is predominantly white, with a small percentage of African Americans and Hispanics. The median household income is around $45,000, and the median age is around 40.
Walcott is a small town with a rich history and a strong sense of community. The town is home to a variety of churches, including Lutheran, Catholic, and Methodist. The town also has a number of parks and recreational areas, including a golf course, a swimming pool, and a skate park. The town is also home to a number of festivals and events, including the Walcott Days Festival, which is held every summer.
Walcott is a small town with a lot to offer. It is a great place to live, work, and raise a family. The town has a strong sense of community and a rich history. The town is home to a variety of businesses, churches, and recreational areas, making it a great place to call home.
Common Questions
What is Per Capita Income in Walcott?
Per Capita income in Walcott is $35,297.
What is the Median Family Income in Walcott?
Median Family Income in Walcott is $96,250.
What is the Median Household income in Walcott?
Median Household Income in Walcott is $89,375.
What is Income or Wage Gap in Walcott?
Income or Wage Gap in Walcott is 26.0%.
Women in Walcott earn 74.0 cents for every dollar earned by a man.
What is Inequality or Gini Index in Walcott?
Inequality or Gini Index in Walcott is 0.31.
What is the Total Population of Walcott?
Total Population of Walcott is 316.
What is the Total Male Population of Walcott?
Total Male Population of Walcott is 161.
What is the Total Female Population of Walcott?
Total Female Population of Walcott is 155.
What is the Ratio of Males per 100 Females in Walcott?
There are 103.87 Males per 100 Females in Walcott.
What is the Ratio of Females per 100 Males in Walcott?
There are 96.27 Females per 100 Males in Walcott.
What is the Median Population Age in Walcott?
Median Population Age in Walcott is 34.9 Years.
What is the Average Family Size in Walcott
Average Family Size in Walcott is 2.9 People.
What is the Average Household Size in Walcott
Average Household Size in Walcott is 2.5 People.
How Large is the Labor Force in Walcott?
There are 162 People in the Labor Forcein in Walcott.
What is the Percentage of People in the Labor Force in Walcott?
69.5% of People are in the Labor Force in Walcott.
What is the Unemployment Rate in Walcott?
Unemployment Rate in Walcott is 2.5%.