Sentinel Butte, ND Map & Demographics
Sentinel Butte Map
Sentinel Butte Overview
$36,673
PER CAPITA INCOME
$36,875
AVG HOUSEHOLD INCOME
0.42
INEQUALITY / GINI INDEX
45
TOTAL POPULATION
20
MALE POPULATION
25
FEMALE POPULATION
80.00
MALES / 100 FEMALES
125.00
FEMALES / 100 MALES
68.9
MEDIAN AGE
2.2
AVG FAMILY SIZE
1.5
AVG HOUSEHOLD SIZE
22
LABOR FORCE [ PEOPLE ]
52.4%
PERCENT IN LABOR FORCE
Sentinel Butte Zip Codes
Sentinel Butte Area Codes
Income in Sentinel Butte
Income Overview in Sentinel Butte
| Characteristic | Number | Measure |
| Per Capita Income | 45 | $36,673 |
| Median Family Income | 12 | $0 |
| Mean Family Income | 12 | $87,308 |
| Median Household Income | 30 | $36,875 |
| Mean Household Income | 30 | $55,383 |
| Income Deficit | 12 | $0 |
| Wage / Income Gap (%) | 45 | 0.00% |
| Wage / Income Gap ($) | 45 | 100.00¢ per $1 |
| Gini / Inequality Index | 45 | 0.42 |
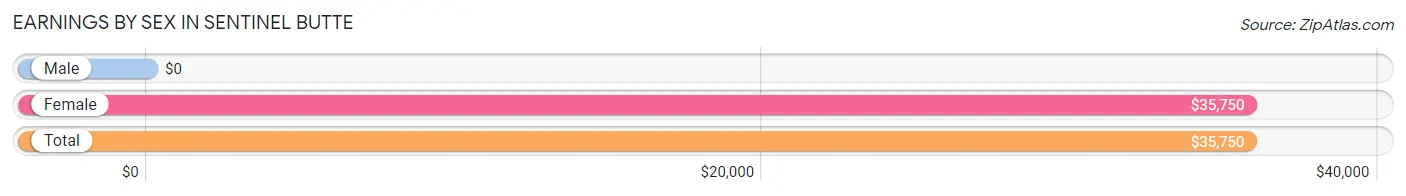
Earnings by Sex in Sentinel Butte
| Sex | Number | Average Earnings |
| Male | 12 (52.2%) | $0 |
| Female | 11 (47.8%) | $35,750 |
| Total | 23 (100.0%) | $35,750 |
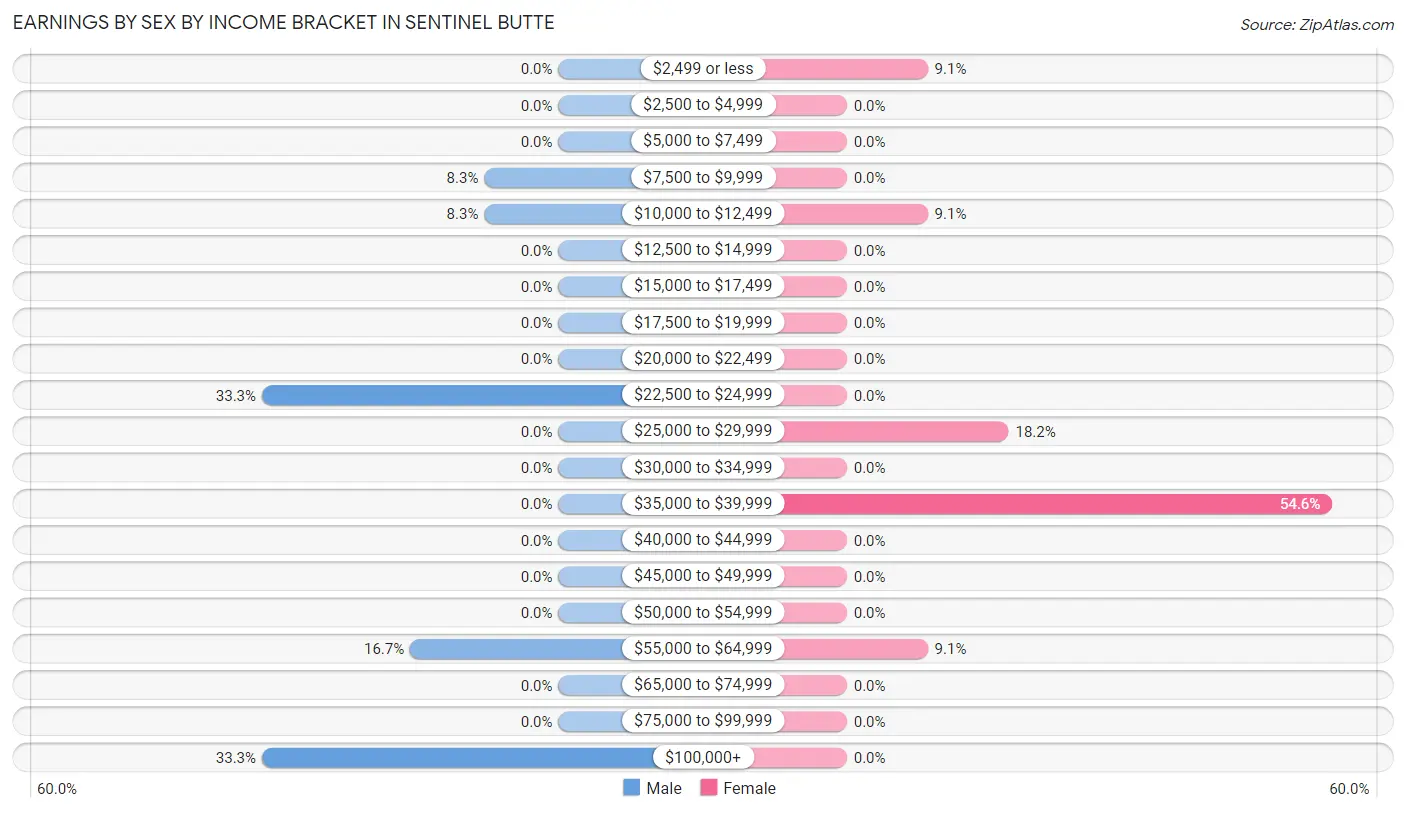
Earnings by Sex by Income Bracket in Sentinel Butte
The most common earnings brackets in Sentinel Butte are $22,500 to $24,999 for men (4 | 33.3%) and $35,000 to $39,999 for women (6 | 54.5%).
| Income | Male | Female |
| $2,499 or less | 0 (0.0%) | 1 (9.1%) |
| $2,500 to $4,999 | 0 (0.0%) | 0 (0.0%) |
| $5,000 to $7,499 | 0 (0.0%) | 0 (0.0%) |
| $7,500 to $9,999 | 1 (8.3%) | 0 (0.0%) |
| $10,000 to $12,499 | 1 (8.3%) | 1 (9.1%) |
| $12,500 to $14,999 | 0 (0.0%) | 0 (0.0%) |
| $15,000 to $17,499 | 0 (0.0%) | 0 (0.0%) |
| $17,500 to $19,999 | 0 (0.0%) | 0 (0.0%) |
| $20,000 to $22,499 | 0 (0.0%) | 0 (0.0%) |
| $22,500 to $24,999 | 4 (33.3%) | 0 (0.0%) |
| $25,000 to $29,999 | 0 (0.0%) | 2 (18.2%) |
| $30,000 to $34,999 | 0 (0.0%) | 0 (0.0%) |
| $35,000 to $39,999 | 0 (0.0%) | 6 (54.5%) |
| $40,000 to $44,999 | 0 (0.0%) | 0 (0.0%) |
| $45,000 to $49,999 | 0 (0.0%) | 0 (0.0%) |
| $50,000 to $54,999 | 0 (0.0%) | 0 (0.0%) |
| $55,000 to $64,999 | 2 (16.7%) | 1 (9.1%) |
| $65,000 to $74,999 | 0 (0.0%) | 0 (0.0%) |
| $75,000 to $99,999 | 0 (0.0%) | 0 (0.0%) |
| $100,000+ | 4 (33.3%) | 0 (0.0%) |
| Total | 12 (100.0%) | 11 (100.0%) |
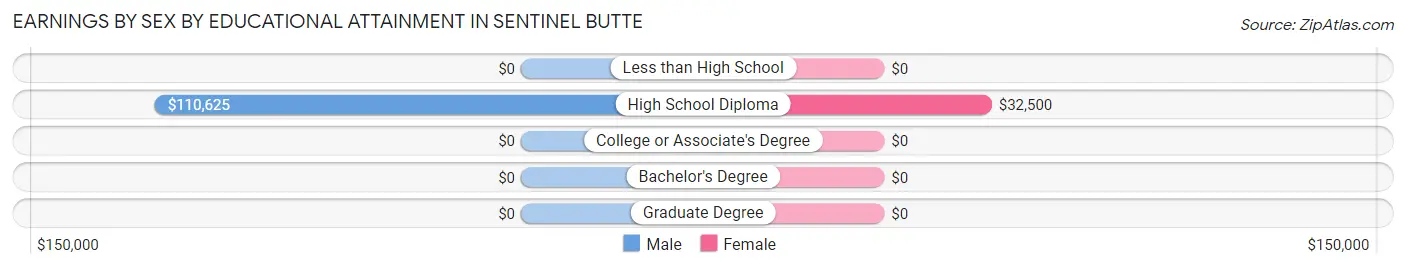
Earnings by Sex by Educational Attainment in Sentinel Butte
| Educational Attainment | Male Income | Female Income |
| Less than High School | - | - |
| High School Diploma | $110,625 | $32,500 |
| College or Associate's Degree | - | - |
| Bachelor's Degree | - | - |
| Graduate Degree | - | - |
| Total | - | - |
Family Income in Sentinel Butte
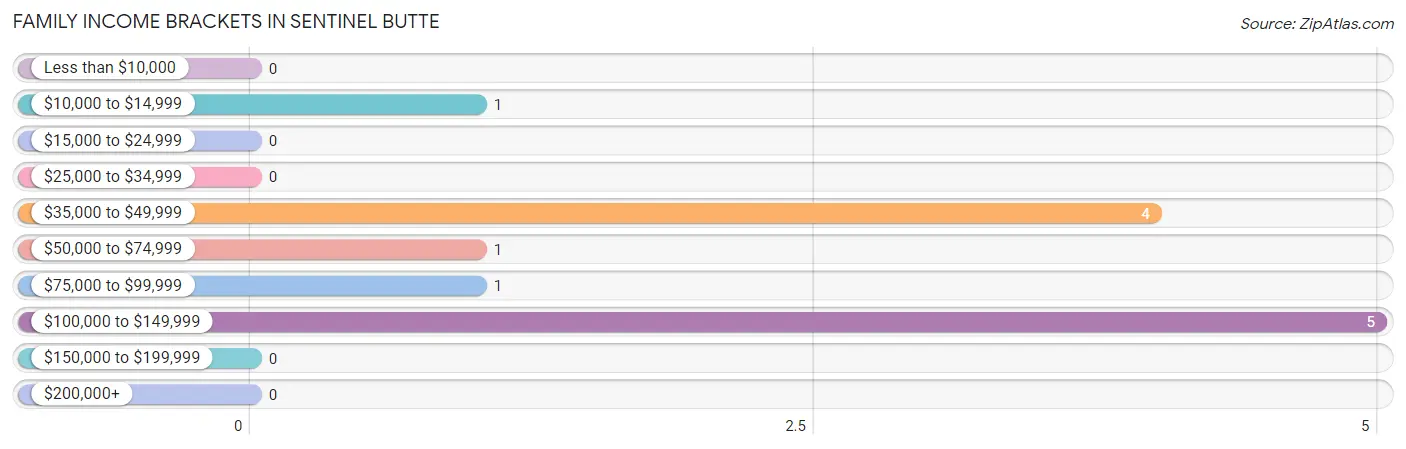
Family Income Brackets in Sentinel Butte
According to the Sentinel Butte family income data, there are 5 families falling into the $100,000 to $149,999 income range, which is the most common income bracket and makes up 41.7% of all families.
| Income Bracket | # Families | % Families |
| Less than $10,000 | 0 | 0.0% |
| $10,000 to $14,999 | 1 | 8.3% |
| $15,000 to $24,999 | 0 | 0.0% |
| $25,000 to $34,999 | 0 | 0.0% |
| $35,000 to $49,999 | 4 | 33.3% |
| $50,000 to $74,999 | 1 | 8.3% |
| $75,000 to $99,999 | 1 | 8.3% |
| $100,000 to $149,999 | 5 | 41.7% |
| $150,000 to $199,999 | 0 | 0.0% |
| $200,000+ | 0 | 0.0% |
Family Income by Famaliy Size in Sentinel Butte
| Income Bracket | # Families | Median Income |
| 2-Person Families | 10 (83.3%) | $0 |
| 3-Person Families | 0 (0.0%) | $0 |
| 4-Person Families | 0 (0.0%) | $0 |
| 5-Person Families | 2 (16.7%) | $0 |
| 6-Person Families | 0 (0.0%) | $0 |
| 7+ Person Families | 0 (0.0%) | $0 |
| Total | 12 (100.0%) | $0 |
Family Income by Number of Earners in Sentinel Butte
| Number of Earners | # Families | Median Income |
| No Earners | 2 (16.7%) | $0 |
| 1 Earner | 5 (41.7%) | $0 |
| 2 Earners | 5 (41.7%) | $0 |
| 3+ Earners | 0 (0.0%) | $0 |
| Total | 12 (100.0%) | $0 |
Household Income in Sentinel Butte
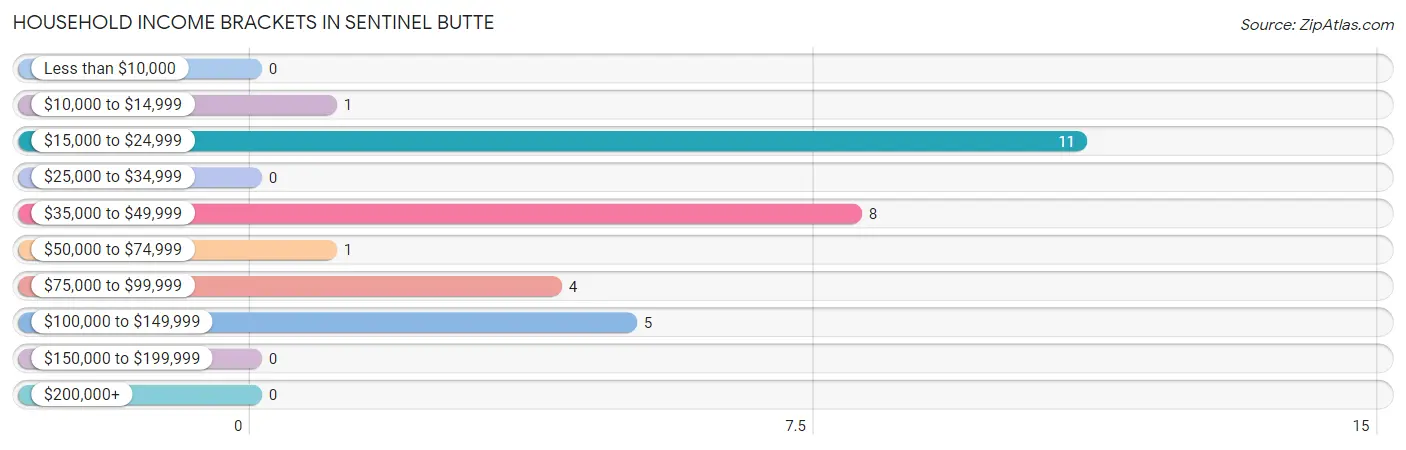
Household Income Brackets in Sentinel Butte
With 11 households falling in the category, the $15,000 to $24,999 income range is the most frequent in Sentinel Butte, accounting for 36.7% of all households.
| Income Bracket | # Households | % Households |
| Less than $10,000 | 0 | 0.0% |
| $10,000 to $14,999 | 1 | 3.3% |
| $15,000 to $24,999 | 11 | 36.7% |
| $25,000 to $34,999 | 0 | 0.0% |
| $35,000 to $49,999 | 8 | 26.7% |
| $50,000 to $74,999 | 1 | 3.3% |
| $75,000 to $99,999 | 4 | 13.3% |
| $100,000 to $149,999 | 5 | 16.7% |
| $150,000 to $199,999 | 0 | 0.0% |
| $200,000+ | 0 | 0.0% |
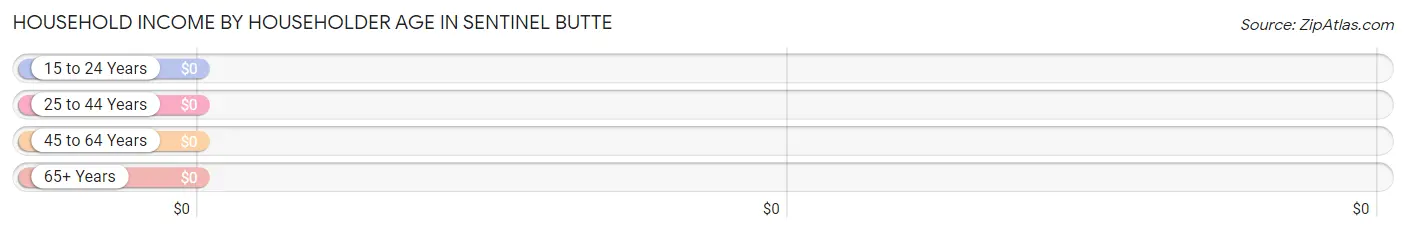
Household Income by Householder Age in Sentinel Butte
| Income Bracket | # Households | Median Income |
| 15 to 24 Years | 0 (0.0%) | $0 |
| 25 to 44 Years | 2 (6.7%) | $0 |
| 45 to 64 Years | 7 (23.3%) | $0 |
| 65+ Years | 21 (70.0%) | $0 |
| Total | 30 (100.0%) | $36,875 |
Poverty in Sentinel Butte
Income Below Poverty by Sex and Age in Sentinel Butte
With 5.0% poverty level for males and 4.0% for females among the residents of Sentinel Butte, 16 and 17 year old males and 55 to 64 year old females are the most vulnerable to poverty, with 1 males (100.0%) and 1 females (33.3%) in their respective age groups living below the poverty level.
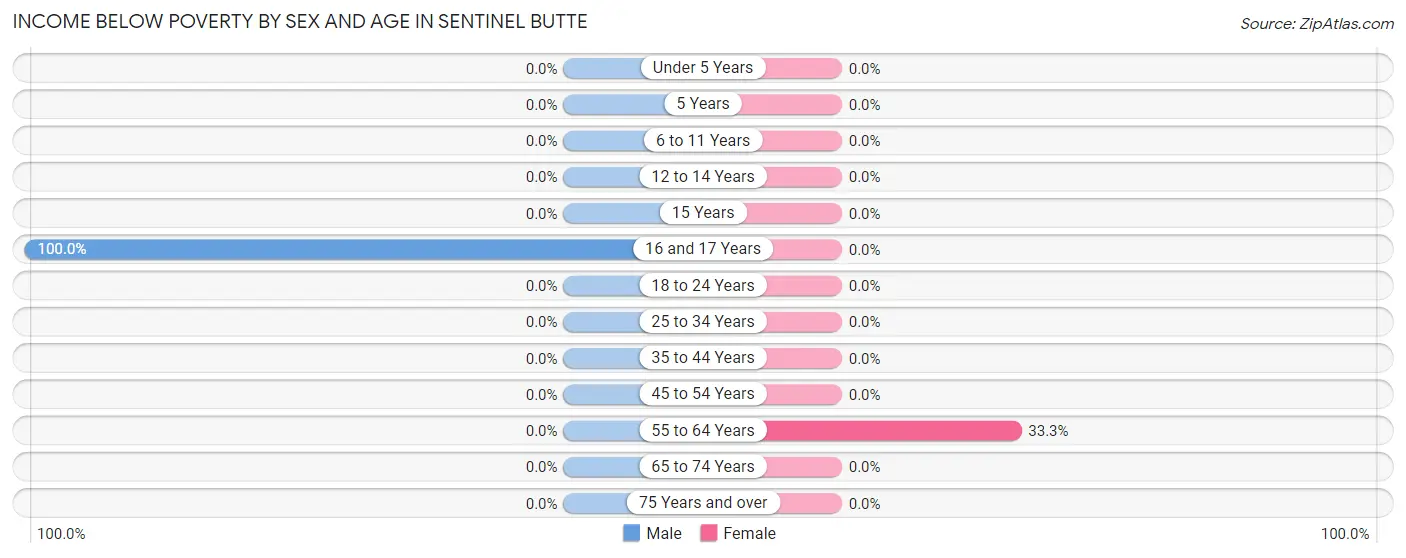
| Age Bracket | Male | Female |
| Under 5 Years | 0 (0.0%) | 0 (0.0%) |
| 5 Years | 0 (0.0%) | 0 (0.0%) |
| 6 to 11 Years | 0 (0.0%) | 0 (0.0%) |
| 12 to 14 Years | 0 (0.0%) | 0 (0.0%) |
| 15 Years | 0 (0.0%) | 0 (0.0%) |
| 16 and 17 Years | 1 (100.0%) | 0 (0.0%) |
| 18 to 24 Years | 0 (0.0%) | 0 (0.0%) |
| 25 to 34 Years | 0 (0.0%) | 0 (0.0%) |
| 35 to 44 Years | 0 (0.0%) | 0 (0.0%) |
| 45 to 54 Years | 0 (0.0%) | 0 (0.0%) |
| 55 to 64 Years | 0 (0.0%) | 1 (33.3%) |
| 65 to 74 Years | 0 (0.0%) | 0 (0.0%) |
| 75 Years and over | 0 (0.0%) | 0 (0.0%) |
| Total | 1 (5.0%) | 1 (4.0%) |
Income Above Poverty by Sex and Age in Sentinel Butte
According to the poverty statistics in Sentinel Butte, males aged 6 to 11 years and females aged 6 to 11 years are the age groups that are most secure financially, with 100.0% of males and 100.0% of females in these age groups living above the poverty line.
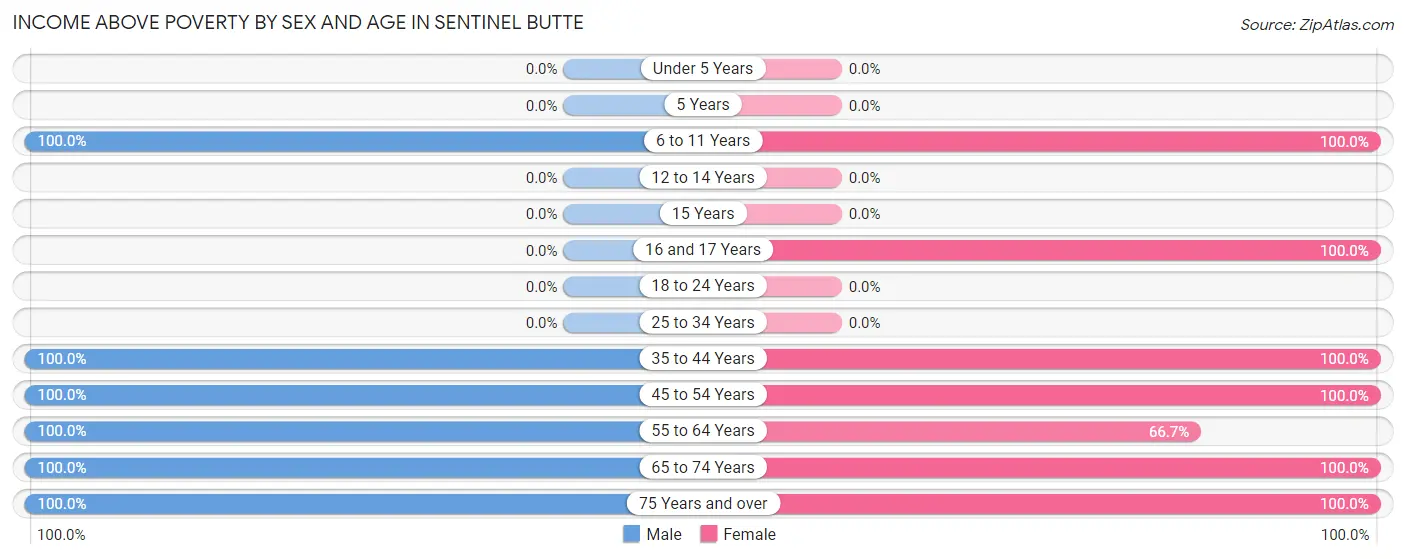
| Age Bracket | Male | Female |
| Under 5 Years | 0 (0.0%) | 0 (0.0%) |
| 5 Years | 0 (0.0%) | 0 (0.0%) |
| 6 to 11 Years | 2 (100.0%) | 1 (100.0%) |
| 12 to 14 Years | 0 (0.0%) | 0 (0.0%) |
| 15 Years | 0 (0.0%) | 0 (0.0%) |
| 16 and 17 Years | 0 (0.0%) | 1 (100.0%) |
| 18 to 24 Years | 0 (0.0%) | 0 (0.0%) |
| 25 to 34 Years | 0 (0.0%) | 0 (0.0%) |
| 35 to 44 Years | 1 (100.0%) | 2 (100.0%) |
| 45 to 54 Years | 1 (100.0%) | 1 (100.0%) |
| 55 to 64 Years | 4 (100.0%) | 2 (66.7%) |
| 65 to 74 Years | 2 (100.0%) | 9 (100.0%) |
| 75 Years and over | 9 (100.0%) | 8 (100.0%) |
| Total | 19 (95.0%) | 24 (96.0%) |
Income Below Poverty Among Married-Couple Families in Sentinel Butte
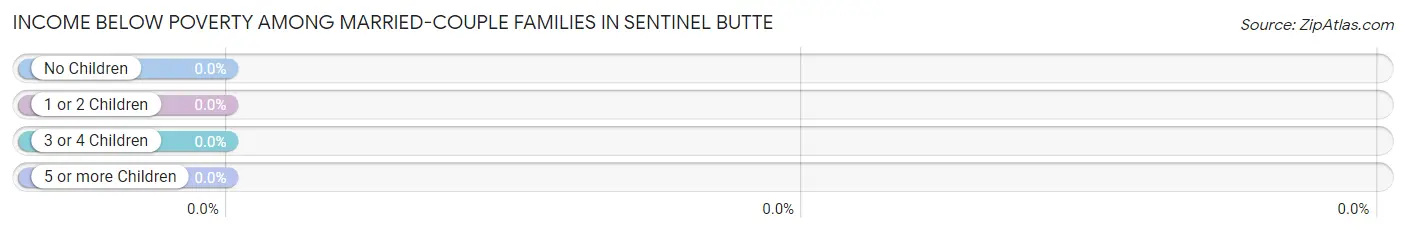
| Children | Above Poverty | Below Poverty |
| No Children | 9 (100.0%) | 0 (0.0%) |
| 1 or 2 Children | 0 (0.0%) | 0 (0.0%) |
| 3 or 4 Children | 2 (100.0%) | 0 (0.0%) |
| 5 or more Children | 0 (0.0%) | 0 (0.0%) |
| Total | 11 (100.0%) | 0 (0.0%) |
Income Below Poverty Among Single-Parent Households in Sentinel Butte
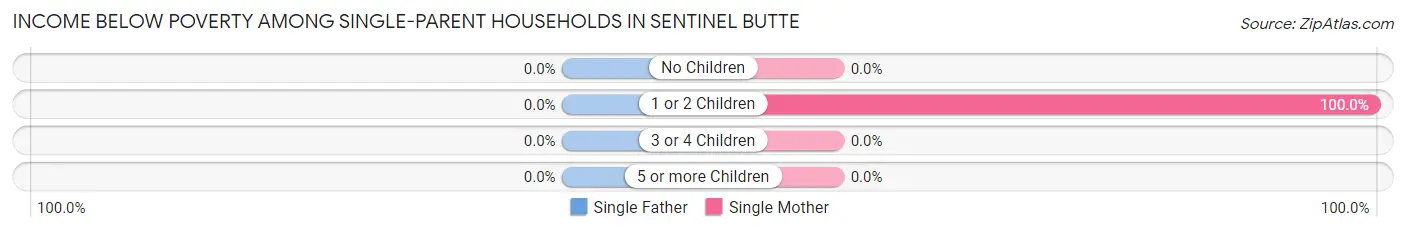
| Children | Single Father | Single Mother |
| No Children | 0 (0.0%) | 0 (0.0%) |
| 1 or 2 Children | 0 (0.0%) | 1 (100.0%) |
| 3 or 4 Children | 0 (0.0%) | 0 (0.0%) |
| 5 or more Children | 0 (0.0%) | 0 (0.0%) |
| Total | 0 (0.0%) | 1 (100.0%) |
Income Below Poverty Among Married-Couple vs Single-Parent Households in Sentinel Butte
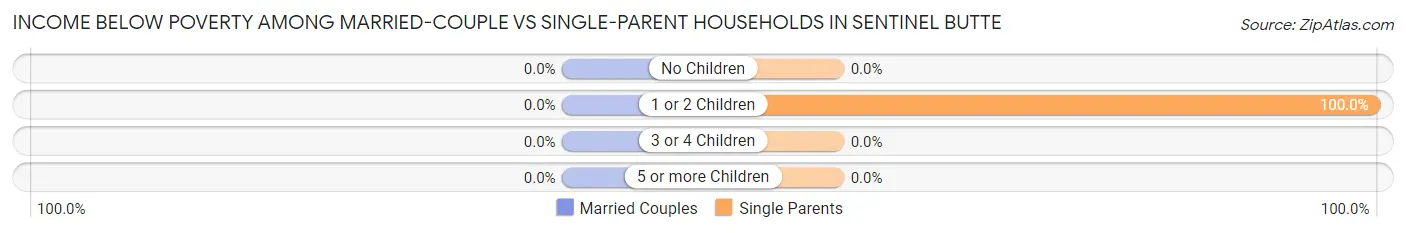
| Children | Married-Couple Families | Single-Parent Households |
| No Children | 0 (0.0%) | 0 (0.0%) |
| 1 or 2 Children | 0 (0.0%) | 1 (100.0%) |
| 3 or 4 Children | 0 (0.0%) | 0 (0.0%) |
| 5 or more Children | 0 (0.0%) | 0 (0.0%) |
| Total | 0 (0.0%) | 1 (100.0%) |
Race in Sentinel Butte
The most populous races in Sentinel Butte are , and White / Caucasian (45 | 100.0%).
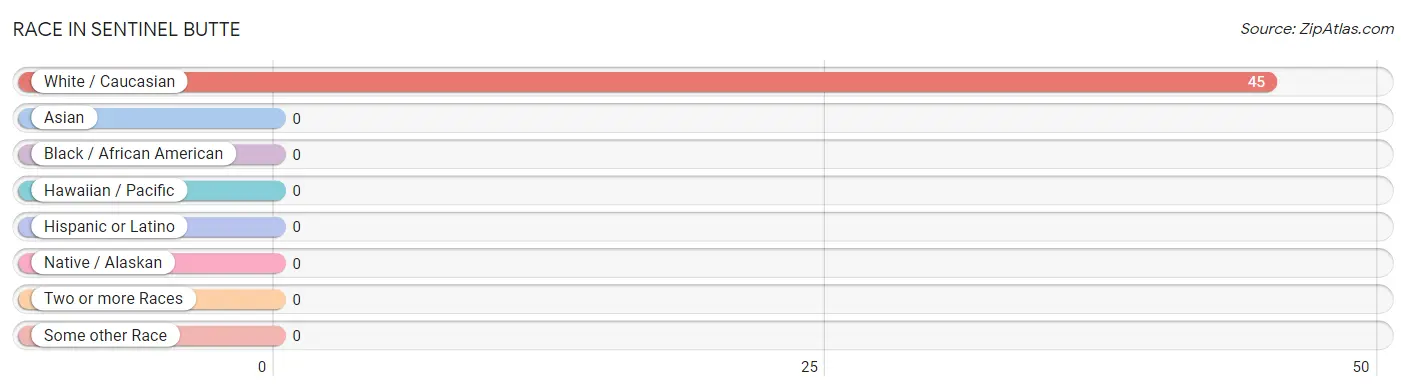
| Race | # Population | % Population |
| Asian | 0 | 0.0% |
| Black / African American | 0 | 0.0% |
| Hawaiian / Pacific | 0 | 0.0% |
| Hispanic or Latino | 0 | 0.0% |
| Native / Alaskan | 0 | 0.0% |
| White / Caucasian | 45 | 100.0% |
| Two or more Races | 0 | 0.0% |
| Some other Race | 0 | 0.0% |
| Total | 45 | 100.0% |
Ancestry in Sentinel Butte
The most populous ancestries reported in Sentinel Butte are German (24 | 53.3%), English (7 | 15.6%), Scottish (4 | 8.9%), Irish (2 | 4.4%), and Polish (2 | 4.4%), together accounting for 86.7% of all Sentinel Butte residents.
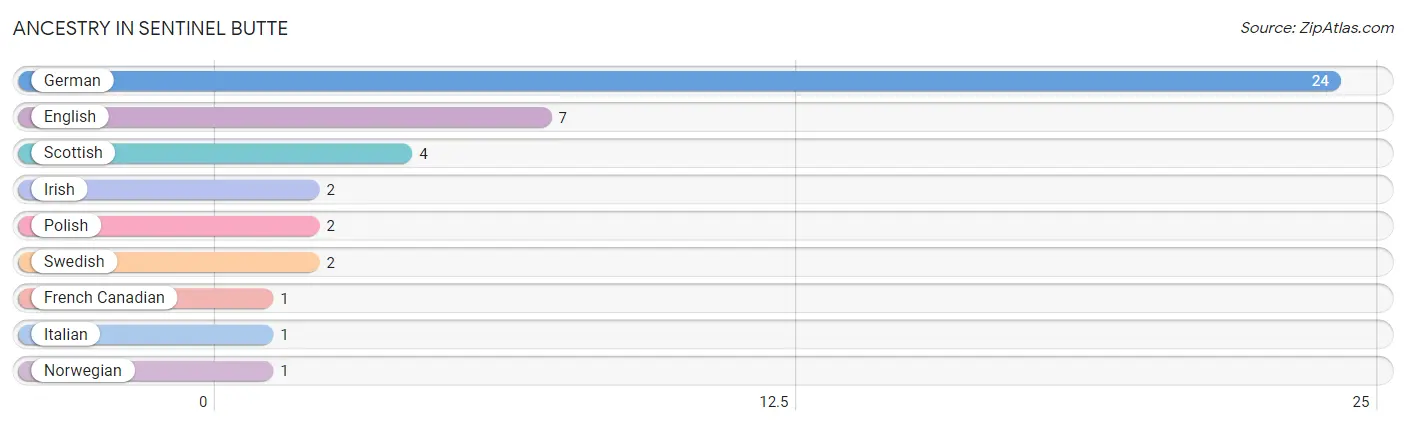
| Ancestry | # Population | % Population |
| English | 7 | 15.6% |
| French Canadian | 1 | 2.2% |
| German | 24 | 53.3% |
| Irish | 2 | 4.4% |
| Italian | 1 | 2.2% |
| Norwegian | 1 | 2.2% |
| Polish | 2 | 4.4% |
| Scottish | 4 | 8.9% |
| Swedish | 2 | 4.4% | View All 9 Rows |
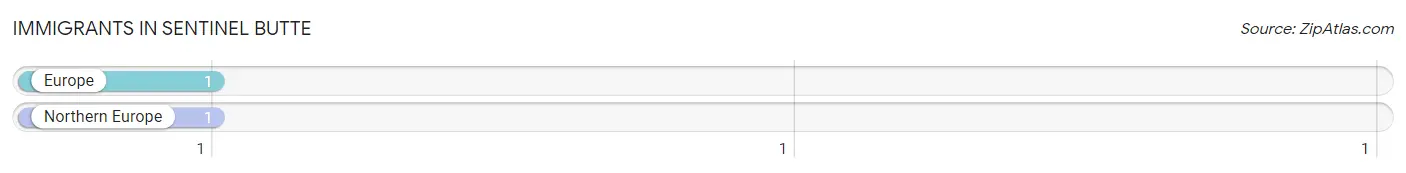
Immigrants in Sentinel Butte
The most numerous immigrant groups reported in Sentinel Butte came from Europe (1 | 2.2%), and Northern Europe (1 | 2.2%), together accounting for 4.4% of all Sentinel Butte residents.
| Immigration Origin | # Population | % Population |
| Europe | 1 | 2.2% |
| Northern Europe | 1 | 2.2% | View All 2 Rows |
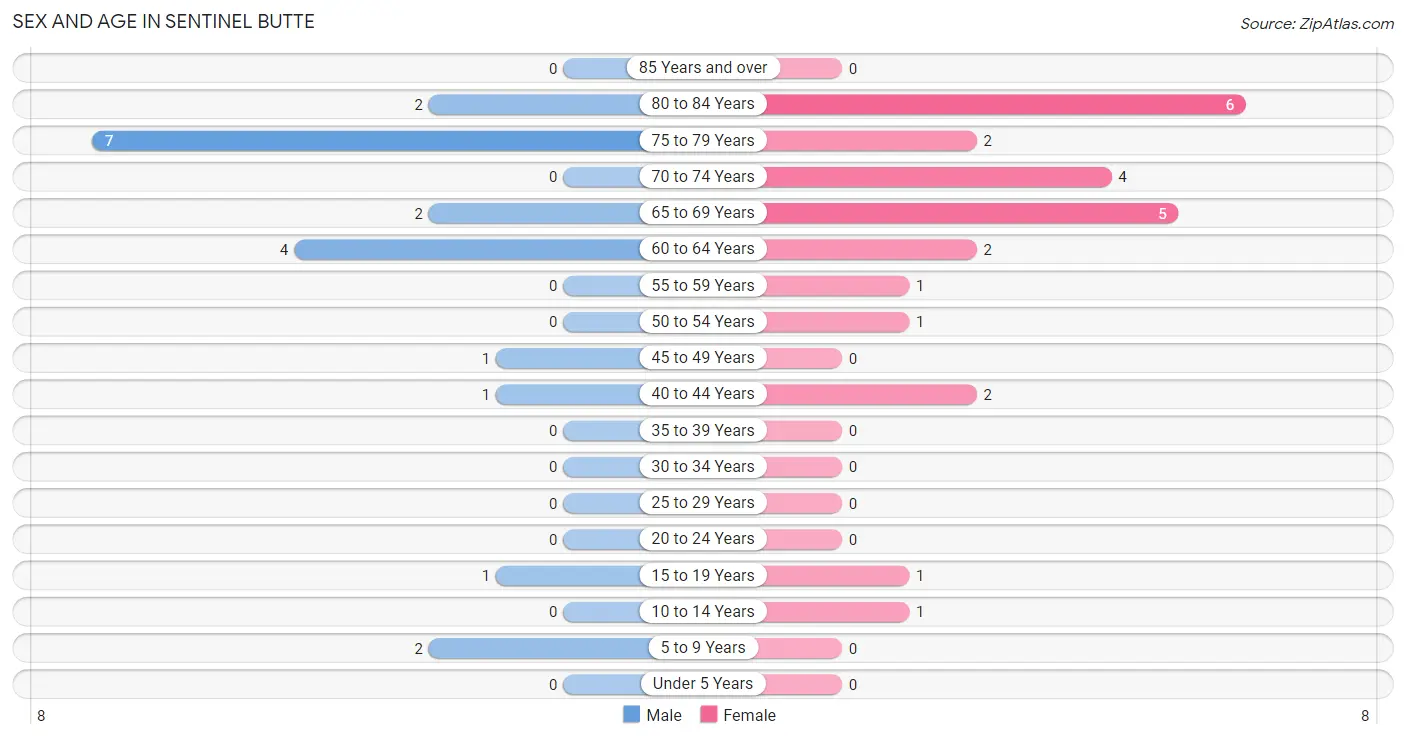
Sex and Age in Sentinel Butte
Sex and Age in Sentinel Butte
The most populous age groups in Sentinel Butte are 75 to 79 Years (7 | 35.0%) for men and 80 to 84 Years (6 | 24.0%) for women.
| Age Bracket | Male | Female |
| Under 5 Years | 0 (0.0%) | 0 (0.0%) |
| 5 to 9 Years | 2 (10.0%) | 0 (0.0%) |
| 10 to 14 Years | 0 (0.0%) | 1 (4.0%) |
| 15 to 19 Years | 1 (5.0%) | 1 (4.0%) |
| 20 to 24 Years | 0 (0.0%) | 0 (0.0%) |
| 25 to 29 Years | 0 (0.0%) | 0 (0.0%) |
| 30 to 34 Years | 0 (0.0%) | 0 (0.0%) |
| 35 to 39 Years | 0 (0.0%) | 0 (0.0%) |
| 40 to 44 Years | 1 (5.0%) | 2 (8.0%) |
| 45 to 49 Years | 1 (5.0%) | 0 (0.0%) |
| 50 to 54 Years | 0 (0.0%) | 1 (4.0%) |
| 55 to 59 Years | 0 (0.0%) | 1 (4.0%) |
| 60 to 64 Years | 4 (20.0%) | 2 (8.0%) |
| 65 to 69 Years | 2 (10.0%) | 5 (20.0%) |
| 70 to 74 Years | 0 (0.0%) | 4 (16.0%) |
| 75 to 79 Years | 7 (35.0%) | 2 (8.0%) |
| 80 to 84 Years | 2 (10.0%) | 6 (24.0%) |
| 85 Years and over | 0 (0.0%) | 0 (0.0%) |
| Total | 20 (100.0%) | 25 (100.0%) |
Families and Households in Sentinel Butte
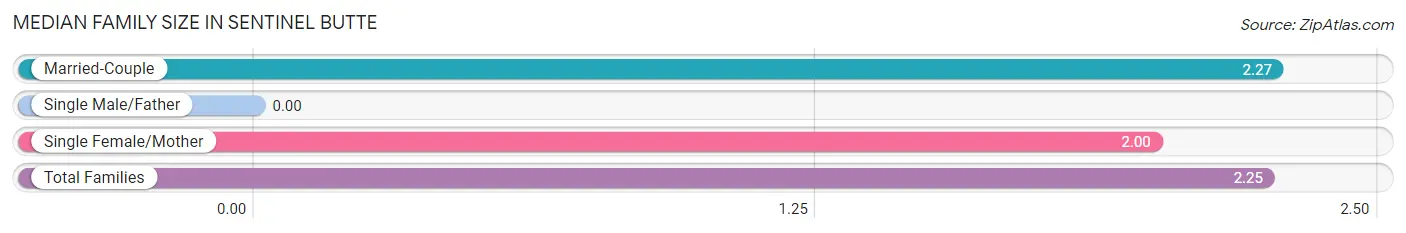
Median Family Size in Sentinel Butte
| Family Type | # Families | Family Size |
| Married-Couple | 11 (91.7%) | 2.27 |
| Single Male/Father | 0 (0.0%) | - |
| Single Female/Mother | 1 (8.3%) | 2.00 |
| Total Families | 12 (100.0%) | 2.25 |
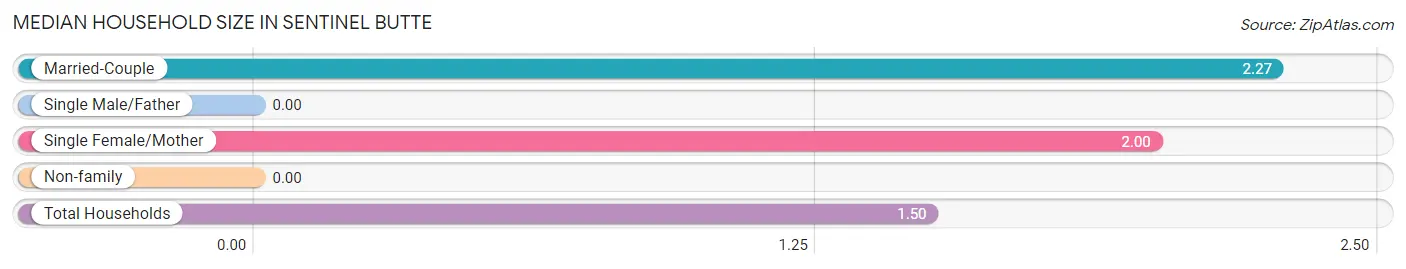
Median Household Size in Sentinel Butte
| Household Type | # Households | Household Size |
| Married-Couple | 11 (36.7%) | 2.27 |
| Single Male/Father | 0 (0.0%) | - |
| Single Female/Mother | 1 (3.3%) | 2.00 |
| Non-family | 18 (60.0%) | - |
| Total Households | 30 (100.0%) | 1.50 |
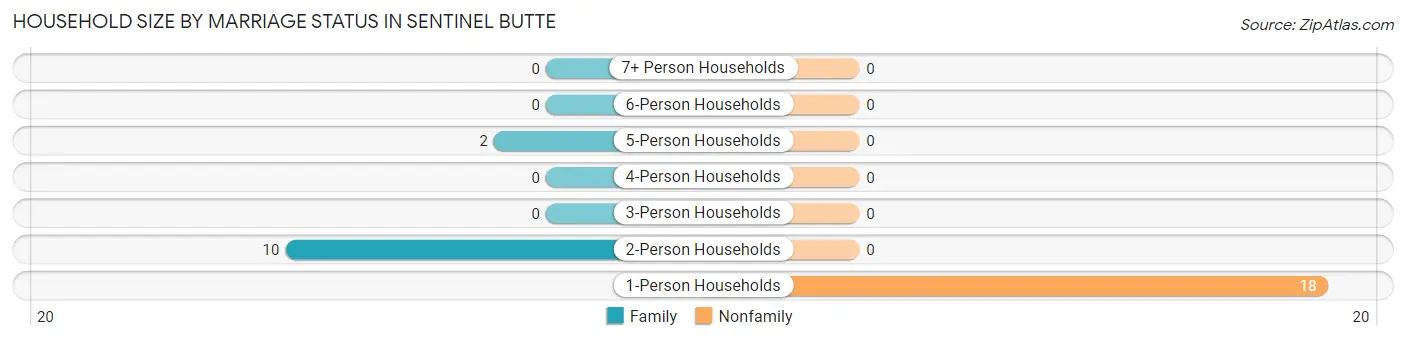
Household Size by Marriage Status in Sentinel Butte
Out of a total of 30 households in Sentinel Butte, 12 (40.0%) are family households, while 18 (60.0%) are nonfamily households. The most numerous type of family households are 2-person households, comprising 10, and the most common type of nonfamily households are 1-person households, comprising 18.
| Household Size | Family Households | Nonfamily Households |
| 1-Person Households | - | 18 (60.0%) |
| 2-Person Households | 10 (33.3%) | 0 (0.0%) |
| 3-Person Households | 0 (0.0%) | 0 (0.0%) |
| 4-Person Households | 0 (0.0%) | 0 (0.0%) |
| 5-Person Households | 2 (6.7%) | 0 (0.0%) |
| 6-Person Households | 0 (0.0%) | 0 (0.0%) |
| 7+ Person Households | 0 (0.0%) | 0 (0.0%) |
| Total | 12 (40.0%) | 18 (60.0%) |
Female Fertility in Sentinel Butte
Fertility by Age in Sentinel Butte
| Age Bracket | Women with Births | Births / 1,000 Women |
| 15 to 19 years | 0 (0.0%) | 0.0 |
| 20 to 34 years | 0 (0.0%) | 0.0 |
| 35 to 50 years | 0 (0.0%) | 0.0 |
| Total | 0 (0.0%) | 0.0 |
Fertility by Age by Marriage Status in Sentinel Butte
| Age Bracket | Married | Unmarried |
| 15 to 19 years | 0 (0.0%) | 0 (0.0%) |
| 20 to 34 years | 0 (0.0%) | 0 (0.0%) |
| 35 to 50 years | 0 (0.0%) | 0 (0.0%) |
| Total | 0 (0.0%) | 0 (0.0%) |
Fertility by Education in Sentinel Butte
| Educational Attainment | Women with Births | Births / 1,000 Women |
| Less than High School | 0 (0.0%) | 0.0 |
| High School Diploma | 0 (0.0%) | 0.0 |
| College or Associate's Degree | 0 (0.0%) | 0.0 |
| Bachelor's Degree | 0 (0.0%) | 0.0 |
| Graduate Degree | 0 (0.0%) | 0.0 |
| Total | 0 (0.0%) | 0.0 |
Fertility by Education by Marriage Status in Sentinel Butte
| Educational Attainment | Married | Unmarried |
| Less than High School | 0 (0.0%) | 0 (0.0%) |
| High School Diploma | 0 (0.0%) | 0 (0.0%) |
| College or Associate's Degree | 0 (0.0%) | 0 (0.0%) |
| Bachelor's Degree | 0 (0.0%) | 0 (0.0%) |
| Graduate Degree | 0 (0.0%) | 0 (0.0%) |
| Total | 0 (0.0%) | 0 (0.0%) |
Employment Characteristics in Sentinel Butte
Employment by Class of Employer in Sentinel Butte
Among the 22 employed individuals in Sentinel Butte, private company employees (12 | 54.5%), not-for-profit organizations (5 | 22.7%), and local government employees (4 | 18.2%) make up the most common classes of employment.
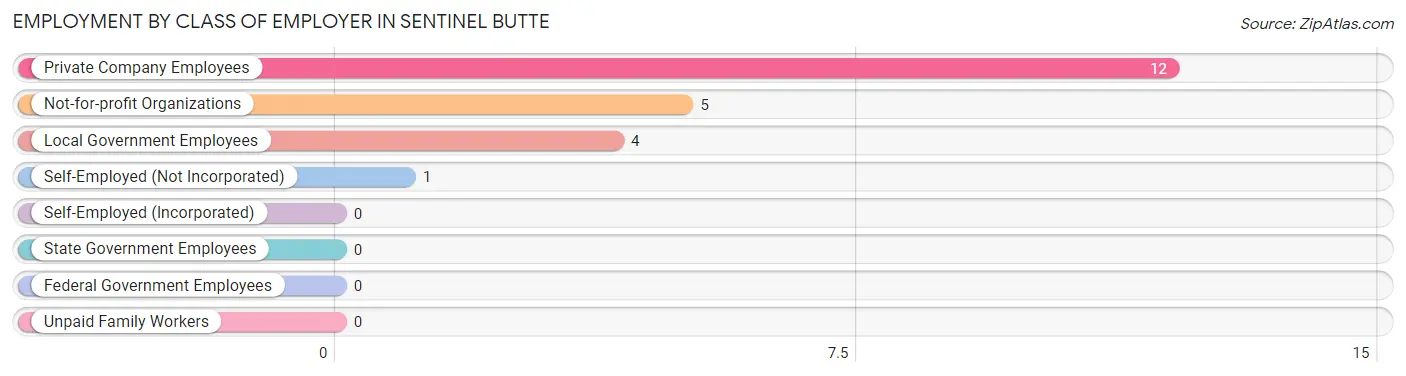
| Employer Class | # Employees | % Employees |
| Private Company Employees | 12 | 54.5% |
| Self-Employed (Incorporated) | 0 | 0.0% |
| Self-Employed (Not Incorporated) | 1 | 4.5% |
| Not-for-profit Organizations | 5 | 22.7% |
| Local Government Employees | 4 | 18.2% |
| State Government Employees | 0 | 0.0% |
| Federal Government Employees | 0 | 0.0% |
| Unpaid Family Workers | 0 | 0.0% |
| Total | 22 | 100.0% |
Employment Status by Age in Sentinel Butte
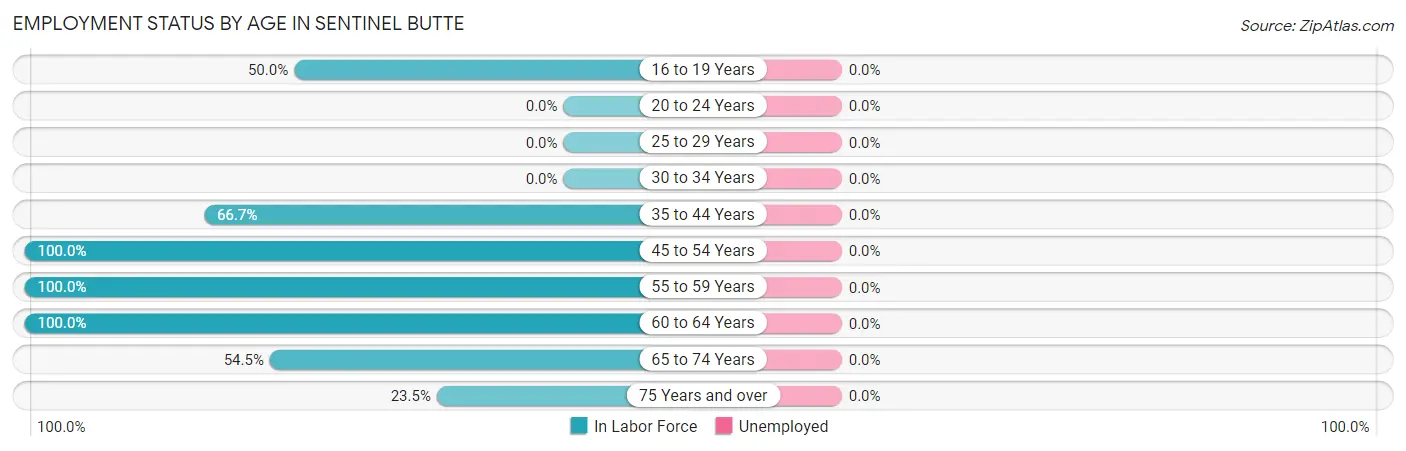
| Age Bracket | In Labor Force | Unemployed |
| 16 to 19 Years | 1 (50.0%) | 0 (0.0%) |
| 20 to 24 Years | 0 (0.0%) | 0 (0.0%) |
| 25 to 29 Years | 0 (0.0%) | 0 (0.0%) |
| 30 to 34 Years | 0 (0.0%) | 0 (0.0%) |
| 35 to 44 Years | 2 (66.7%) | 0 (0.0%) |
| 45 to 54 Years | 2 (100.0%) | 0 (0.0%) |
| 55 to 59 Years | 1 (100.0%) | 0 (0.0%) |
| 60 to 64 Years | 6 (100.0%) | 0 (0.0%) |
| 65 to 74 Years | 6 (54.5%) | 0 (0.0%) |
| 75 Years and over | 4 (23.5%) | 0 (0.0%) |
| Total | 22 (52.4%) | 0 (0.0%) |
Employment Status by Educational Attainment in Sentinel Butte
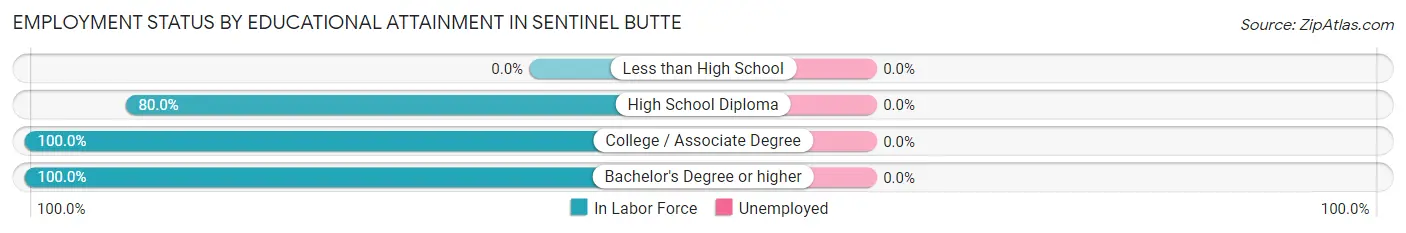
| Educational Attainment | In Labor Force | Unemployed |
| Less than High School | 0 (0.0%) | 0 (0.0%) |
| High School Diploma | 4 (80.0%) | 0 (0.0%) |
| College / Associate Degree | 5 (100.0%) | 0 (0.0%) |
| Bachelor's Degree or higher | 2 (100.0%) | 0 (0.0%) |
| Total | 11 (91.7%) | 0 (0.0%) |
Employment Occupations by Sex in Sentinel Butte
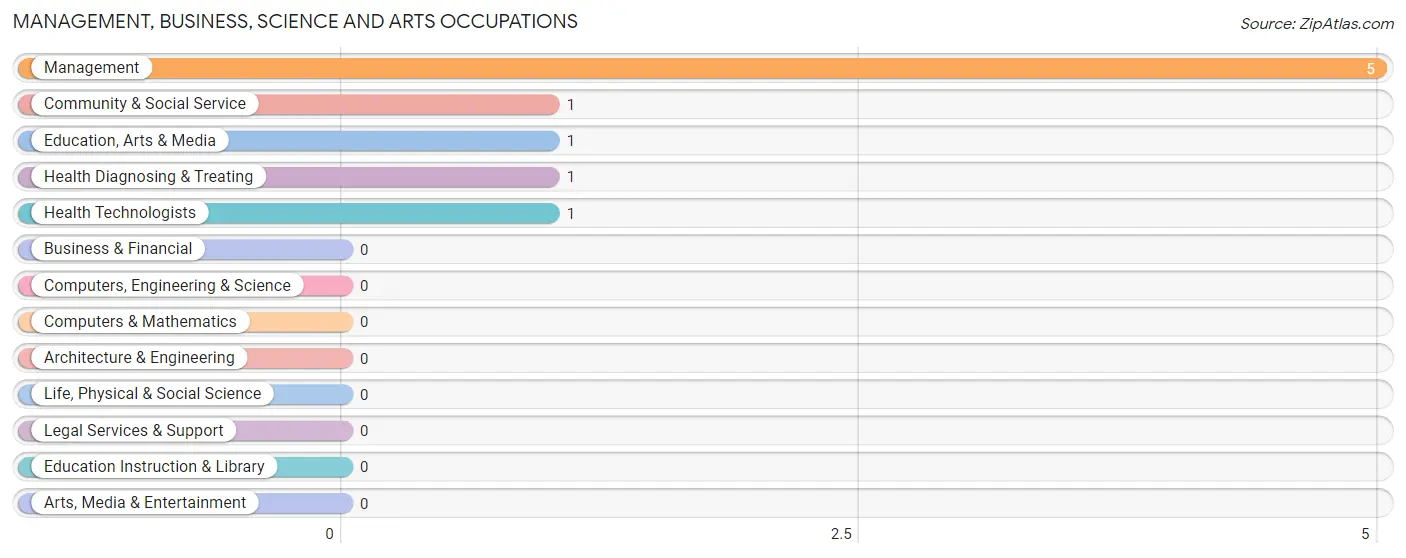
Management, Business, Science and Arts Occupations
The most common Management, Business, Science and Arts occupations in Sentinel Butte are Management (5 | 22.7%), Community & Social Service (1 | 4.5%), Education, Arts & Media (1 | 4.5%), Health Diagnosing & Treating (1 | 4.5%), and Health Technologists (1 | 4.5%).
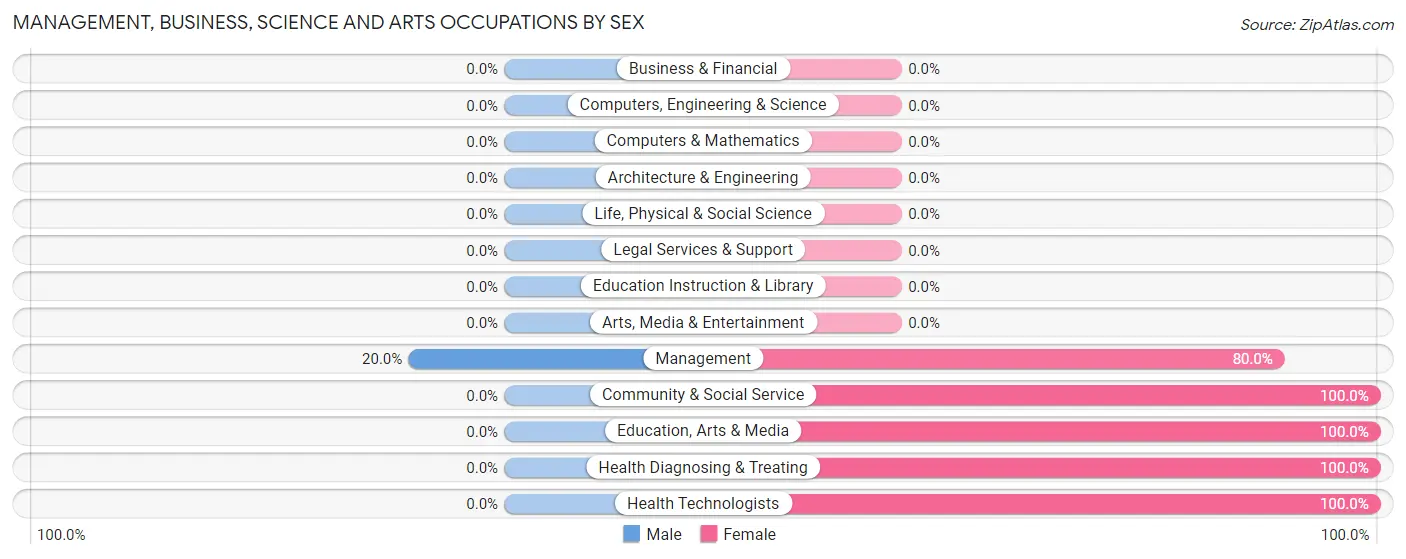
Management, Business, Science and Arts Occupations by Sex
| Occupation | Male | Female |
| Management | 1 (20.0%) | 4 (80.0%) |
| Business & Financial | 0 (0.0%) | 0 (0.0%) |
| Computers, Engineering & Science | 0 (0.0%) | 0 (0.0%) |
| Computers & Mathematics | 0 (0.0%) | 0 (0.0%) |
| Architecture & Engineering | 0 (0.0%) | 0 (0.0%) |
| Life, Physical & Social Science | 0 (0.0%) | 0 (0.0%) |
| Community & Social Service | 0 (0.0%) | 1 (100.0%) |
| Education, Arts & Media | 0 (0.0%) | 1 (100.0%) |
| Legal Services & Support | 0 (0.0%) | 0 (0.0%) |
| Education Instruction & Library | 0 (0.0%) | 0 (0.0%) |
| Arts, Media & Entertainment | 0 (0.0%) | 0 (0.0%) |
| Health Diagnosing & Treating | 0 (0.0%) | 1 (100.0%) |
| Health Technologists | 0 (0.0%) | 1 (100.0%) |
| Total (Category) | 1 (14.3%) | 6 (85.7%) |
| Total (Overall) | 11 (50.0%) | 11 (50.0%) |
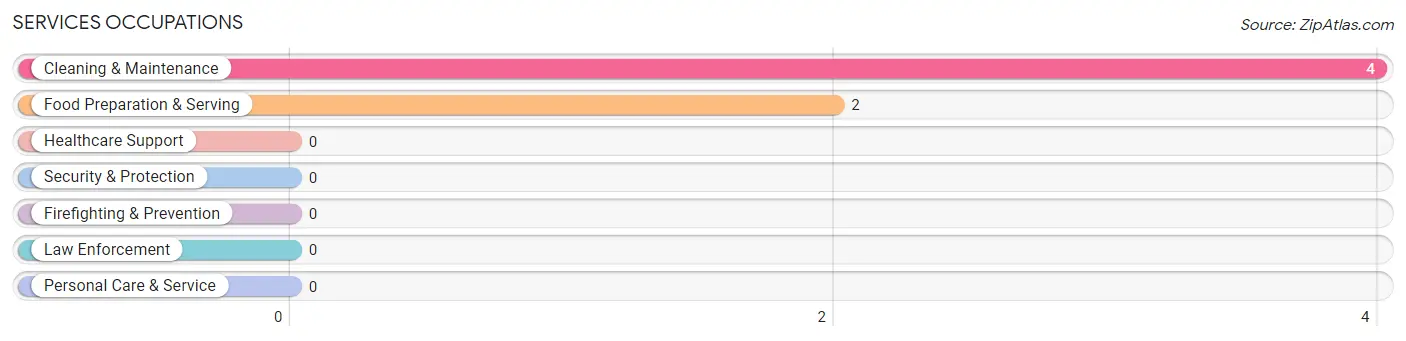
Services Occupations
The most common Services occupations in Sentinel Butte are Cleaning & Maintenance (4 | 18.2%), and Food Preparation & Serving (2 | 9.1%).
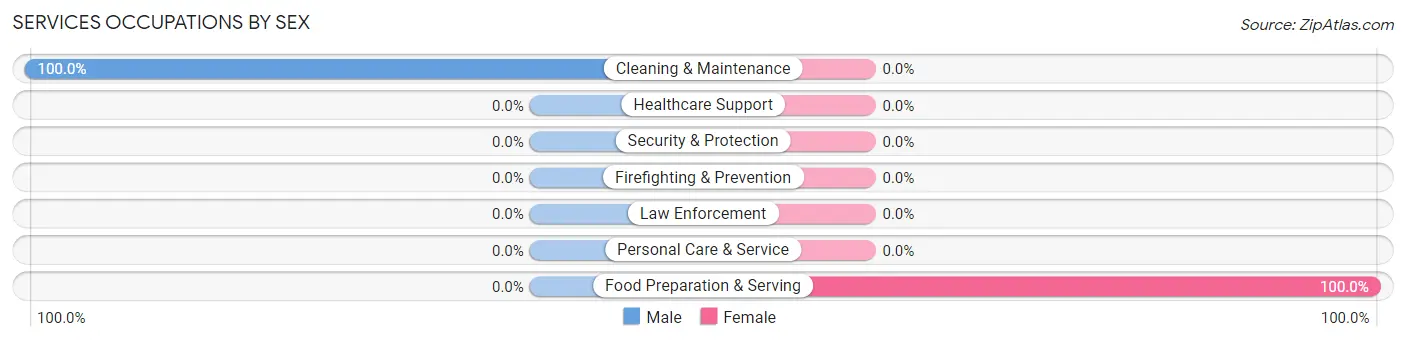
Services Occupations by Sex
| Occupation | Male | Female |
| Healthcare Support | 0 (0.0%) | 0 (0.0%) |
| Security & Protection | 0 (0.0%) | 0 (0.0%) |
| Firefighting & Prevention | 0 (0.0%) | 0 (0.0%) |
| Law Enforcement | 0 (0.0%) | 0 (0.0%) |
| Food Preparation & Serving | 0 (0.0%) | 2 (100.0%) |
| Cleaning & Maintenance | 4 (100.0%) | 0 (0.0%) |
| Personal Care & Service | 0 (0.0%) | 0 (0.0%) |
| Total (Category) | 4 (66.7%) | 2 (33.3%) |
| Total (Overall) | 11 (50.0%) | 11 (50.0%) |
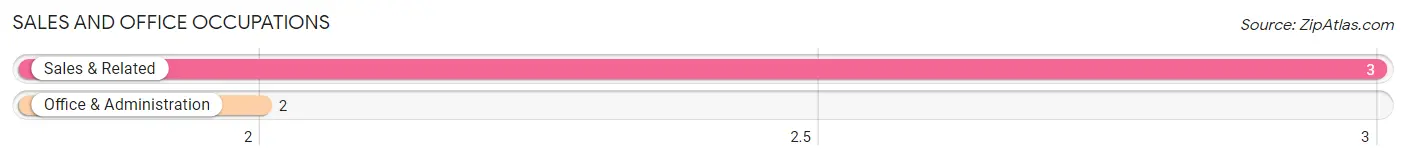
Sales and Office Occupations
The most common Sales and Office occupations in Sentinel Butte are Sales & Related (3 | 13.6%), and Office & Administration (2 | 9.1%).
Sales and Office Occupations by Sex
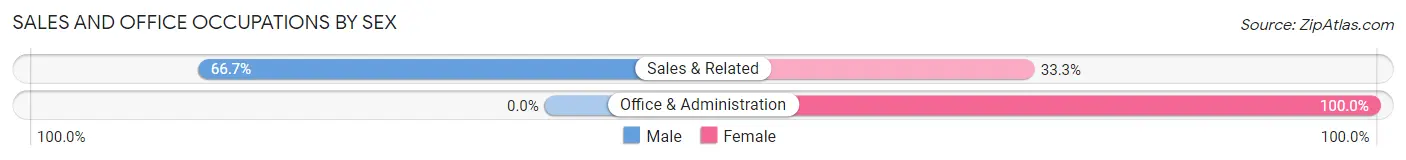
| Occupation | Male | Female |
| Sales & Related | 2 (66.7%) | 1 (33.3%) |
| Office & Administration | 0 (0.0%) | 2 (100.0%) |
| Total (Category) | 2 (40.0%) | 3 (60.0%) |
| Total (Overall) | 11 (50.0%) | 11 (50.0%) |
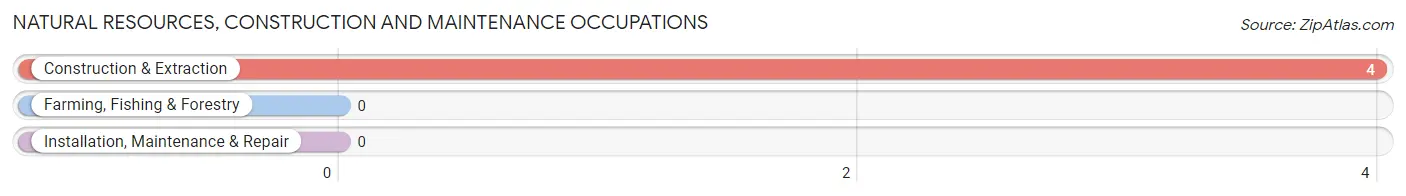
Natural Resources, Construction and Maintenance Occupations
The most common Natural Resources, Construction and Maintenance occupations in Sentinel Butte are , and Construction & Extraction (4 | 18.2%).
Natural Resources, Construction and Maintenance Occupations by Sex
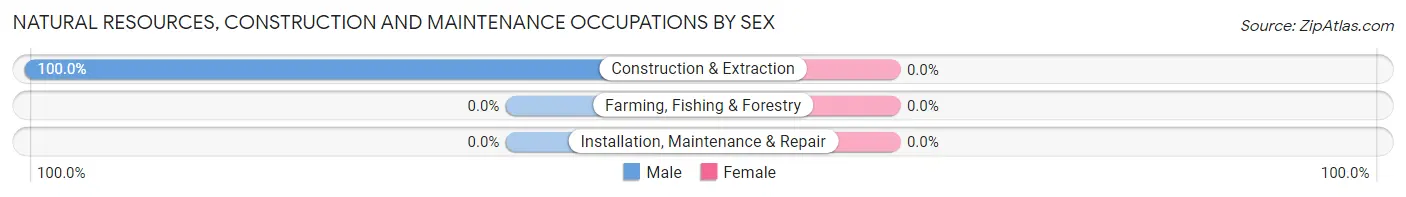
| Occupation | Male | Female |
| Farming, Fishing & Forestry | 0 (0.0%) | 0 (0.0%) |
| Construction & Extraction | 4 (100.0%) | 0 (0.0%) |
| Installation, Maintenance & Repair | 0 (0.0%) | 0 (0.0%) |
| Total (Category) | 4 (100.0%) | 0 (0.0%) |
| Total (Overall) | 11 (50.0%) | 11 (50.0%) |
Production, Transportation and Moving Occupations
Production, Transportation and Moving Occupations by Sex
| Occupation | Male | Female |
| Production | 0 (0.0%) | 0 (0.0%) |
| Transportation | 0 (0.0%) | 0 (0.0%) |
| Material Moving | 0 (0.0%) | 0 (0.0%) |
| Total (Category) | 0 (0.0%) | 0 (0.0%) |
| Total (Overall) | 11 (50.0%) | 11 (50.0%) |
Employment Industries by Sex in Sentinel Butte
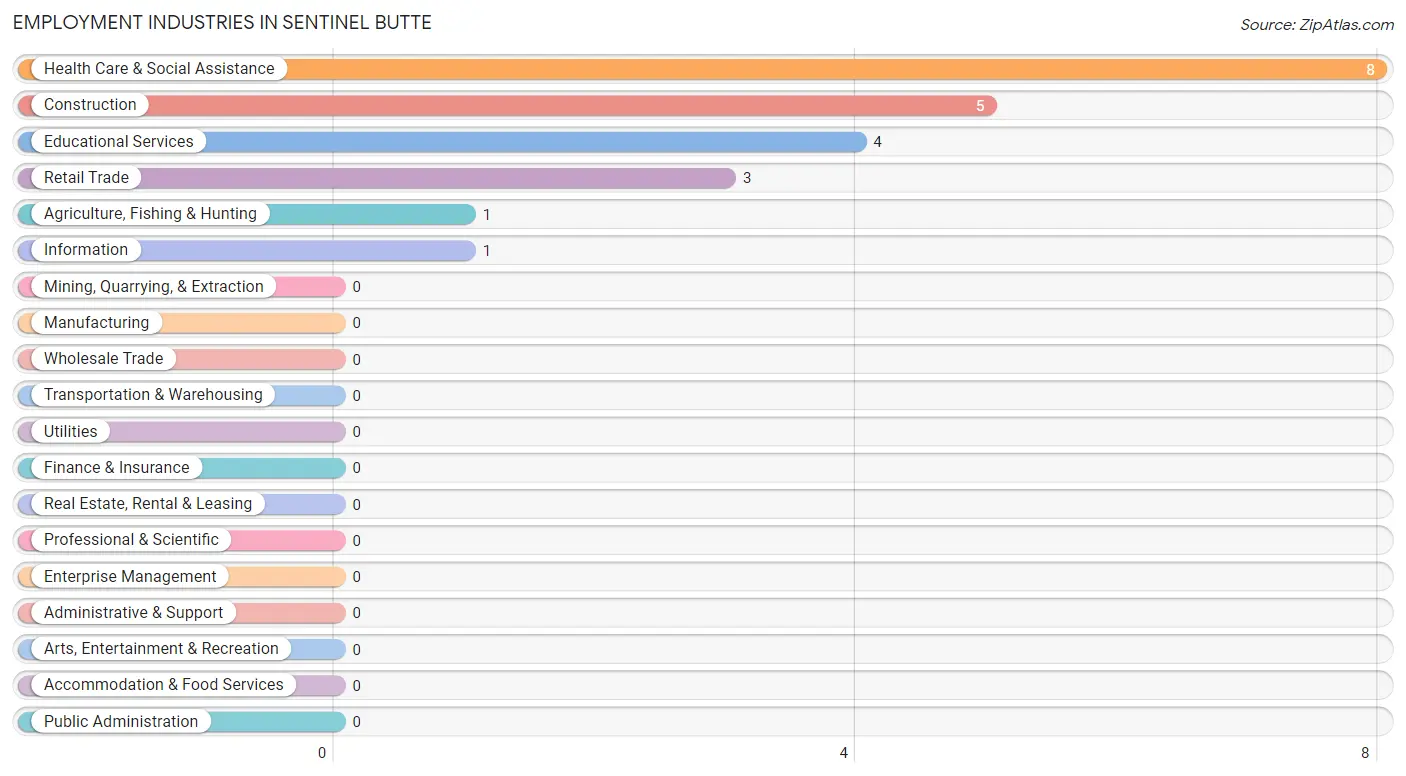
Employment Industries in Sentinel Butte
The major employment industries in Sentinel Butte include Health Care & Social Assistance (8 | 36.4%), Construction (5 | 22.7%), Educational Services (4 | 18.2%), Retail Trade (3 | 13.6%), and Agriculture, Fishing & Hunting (1 | 4.5%).
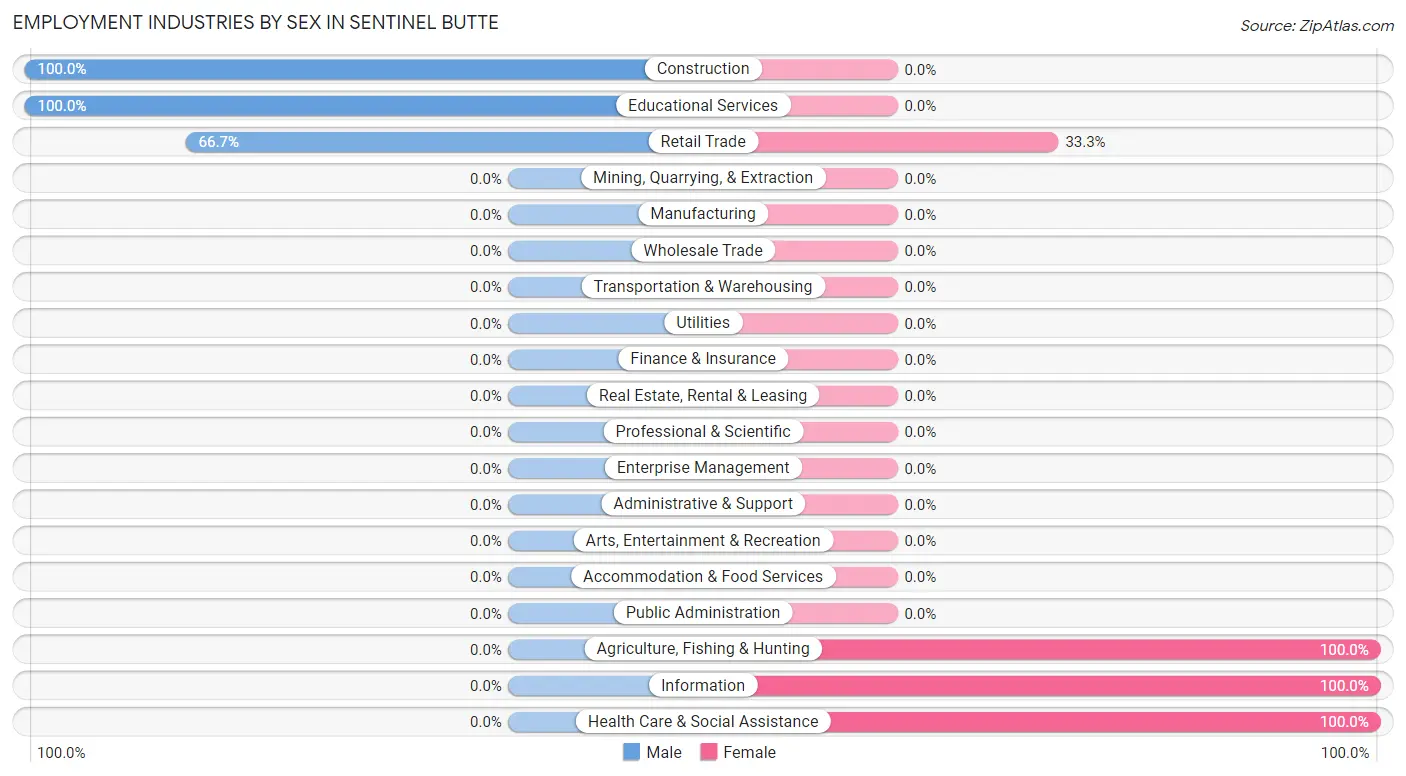
Employment Industries by Sex in Sentinel Butte
The Sentinel Butte industries that see more men than women are Construction (100.0%), Educational Services (100.0%), and Retail Trade (66.7%), whereas the industries that tend to have a higher number of women are Agriculture, Fishing & Hunting (100.0%), Information (100.0%), and Health Care & Social Assistance (100.0%).
| Industry | Male | Female |
| Agriculture, Fishing & Hunting | 0 (0.0%) | 1 (100.0%) |
| Mining, Quarrying, & Extraction | 0 (0.0%) | 0 (0.0%) |
| Construction | 5 (100.0%) | 0 (0.0%) |
| Manufacturing | 0 (0.0%) | 0 (0.0%) |
| Wholesale Trade | 0 (0.0%) | 0 (0.0%) |
| Retail Trade | 2 (66.7%) | 1 (33.3%) |
| Transportation & Warehousing | 0 (0.0%) | 0 (0.0%) |
| Utilities | 0 (0.0%) | 0 (0.0%) |
| Information | 0 (0.0%) | 1 (100.0%) |
| Finance & Insurance | 0 (0.0%) | 0 (0.0%) |
| Real Estate, Rental & Leasing | 0 (0.0%) | 0 (0.0%) |
| Professional & Scientific | 0 (0.0%) | 0 (0.0%) |
| Enterprise Management | 0 (0.0%) | 0 (0.0%) |
| Administrative & Support | 0 (0.0%) | 0 (0.0%) |
| Educational Services | 4 (100.0%) | 0 (0.0%) |
| Health Care & Social Assistance | 0 (0.0%) | 8 (100.0%) |
| Arts, Entertainment & Recreation | 0 (0.0%) | 0 (0.0%) |
| Accommodation & Food Services | 0 (0.0%) | 0 (0.0%) |
| Public Administration | 0 (0.0%) | 0 (0.0%) |
| Total | 11 (50.0%) | 11 (50.0%) |
Education in Sentinel Butte
School Enrollment in Sentinel Butte
The most common levels of schooling among the 5 students in Sentinel Butte are elementary school (2 | 40.0%), high school (2 | 40.0%), and middle school (1 | 20.0%).
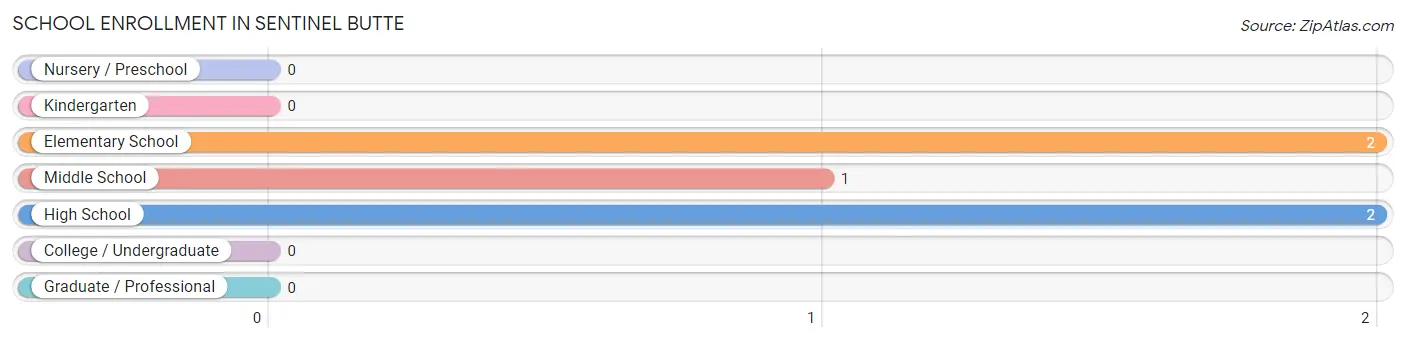
| School Level | # Students | % Students |
| Nursery / Preschool | 0 | 0.0% |
| Kindergarten | 0 | 0.0% |
| Elementary School | 2 | 40.0% |
| Middle School | 1 | 20.0% |
| High School | 2 | 40.0% |
| College / Undergraduate | 0 | 0.0% |
| Graduate / Professional | 0 | 0.0% |
| Total | 5 | 100.0% |
School Enrollment by Age by Funding Source in Sentinel Butte
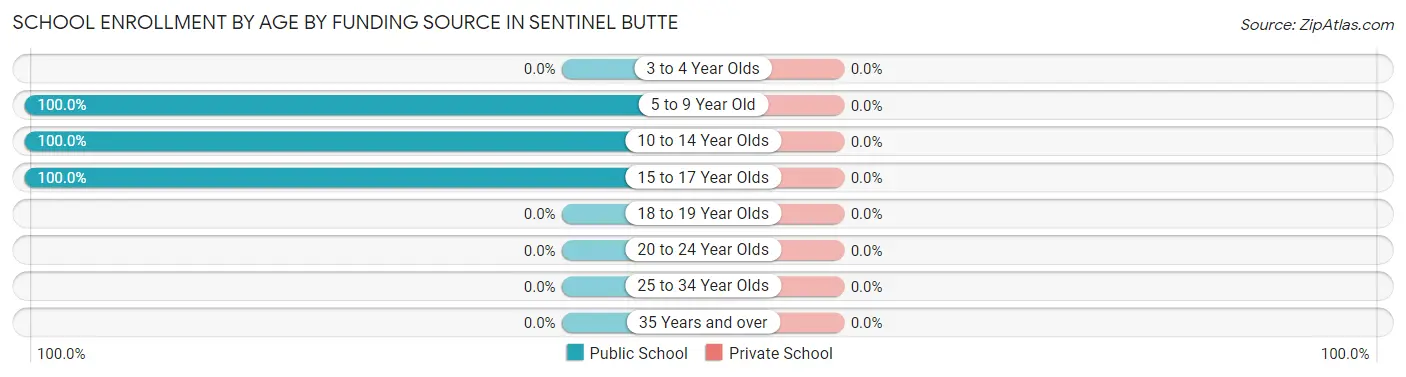
| Age Bracket | Public School | Private School |
| 3 to 4 Year Olds | 0 (0.0%) | 0 (0.0%) |
| 5 to 9 Year Old | 2 (100.0%) | 0 (0.0%) |
| 10 to 14 Year Olds | 1 (100.0%) | 0 (0.0%) |
| 15 to 17 Year Olds | 2 (100.0%) | 0 (0.0%) |
| 18 to 19 Year Olds | 0 (0.0%) | 0 (0.0%) |
| 20 to 24 Year Olds | 0 (0.0%) | 0 (0.0%) |
| 25 to 34 Year Olds | 0 (0.0%) | 0 (0.0%) |
| 35 Years and over | 0 (0.0%) | 0 (0.0%) |
| Total | 5 (100.0%) | 0 (0.0%) |
Educational Attainment by Field of Study in Sentinel Butte
Education (4 | 57.1%), bio, nature & agricultural (1 | 14.3%), business (1 | 14.3%), and literature & languages (1 | 14.3%) are the most common fields of study among 7 individuals in Sentinel Butte who have obtained a bachelor's degree or higher.
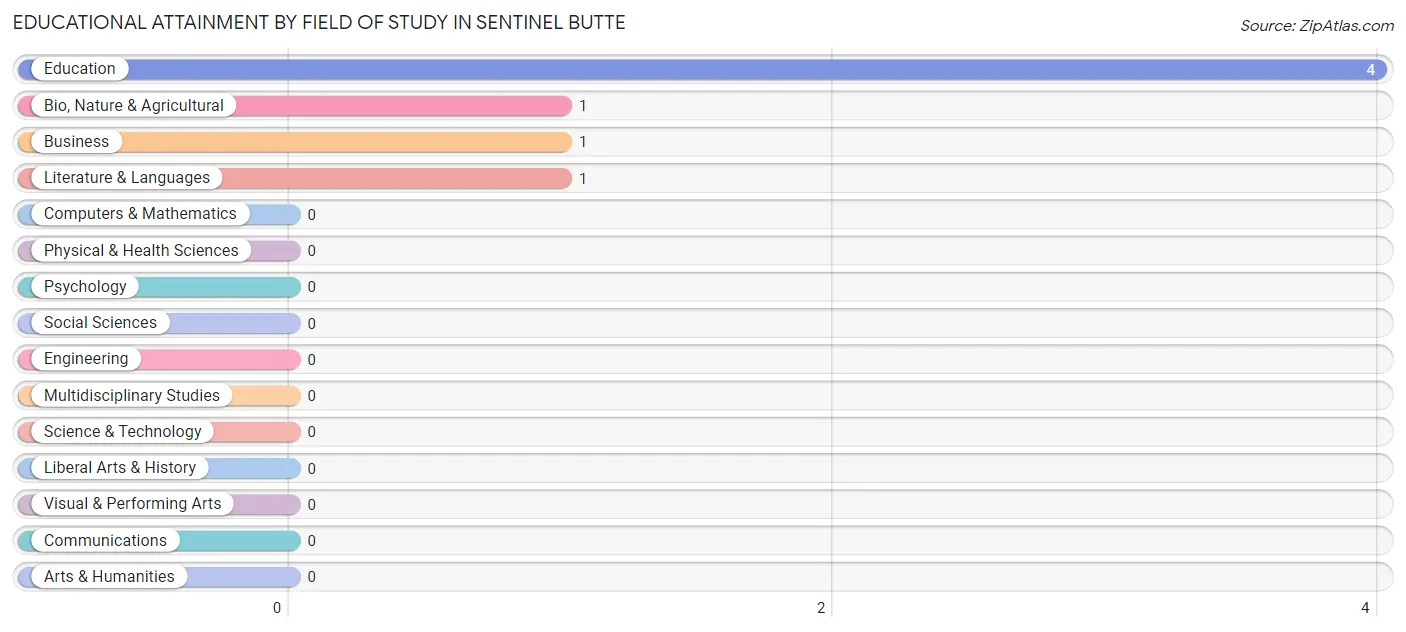
| Field of Study | # Graduates | % Graduates |
| Computers & Mathematics | 0 | 0.0% |
| Bio, Nature & Agricultural | 1 | 14.3% |
| Physical & Health Sciences | 0 | 0.0% |
| Psychology | 0 | 0.0% |
| Social Sciences | 0 | 0.0% |
| Engineering | 0 | 0.0% |
| Multidisciplinary Studies | 0 | 0.0% |
| Science & Technology | 0 | 0.0% |
| Business | 1 | 14.3% |
| Education | 4 | 57.1% |
| Literature & Languages | 1 | 14.3% |
| Liberal Arts & History | 0 | 0.0% |
| Visual & Performing Arts | 0 | 0.0% |
| Communications | 0 | 0.0% |
| Arts & Humanities | 0 | 0.0% |
| Total | 7 | 100.0% |
Transportation & Commute in Sentinel Butte
Vehicle Availability by Sex in Sentinel Butte
The most prevalent vehicle ownership categories in Sentinel Butte are males with 3 vehicles (6, accounting for 54.5%) and females with 3 vehicles (3, making up 54.5%).
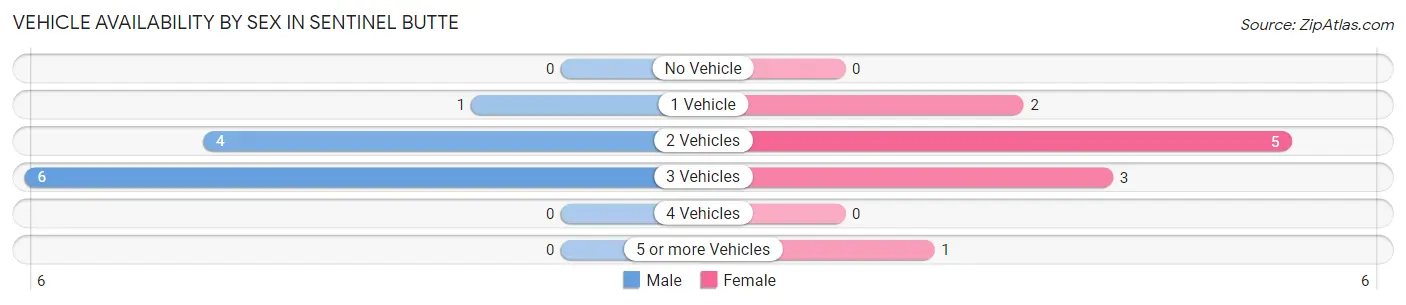
| Vehicles Available | Male | Female |
| No Vehicle | 0 (0.0%) | 0 (0.0%) |
| 1 Vehicle | 1 (9.1%) | 2 (18.2%) |
| 2 Vehicles | 4 (36.4%) | 5 (45.5%) |
| 3 Vehicles | 6 (54.5%) | 3 (27.3%) |
| 4 Vehicles | 0 (0.0%) | 0 (0.0%) |
| 5 or more Vehicles | 0 (0.0%) | 1 (9.1%) |
| Total | 11 (100.0%) | 11 (100.0%) |
Commute Time in Sentinel Butte
The most frequently occuring commute durations in Sentinel Butte are 10 to 14 minutes (8 commuters, 36.4%), 5 to 9 minutes (4 commuters, 18.2%), and 25 to 29 minutes (4 commuters, 18.2%).
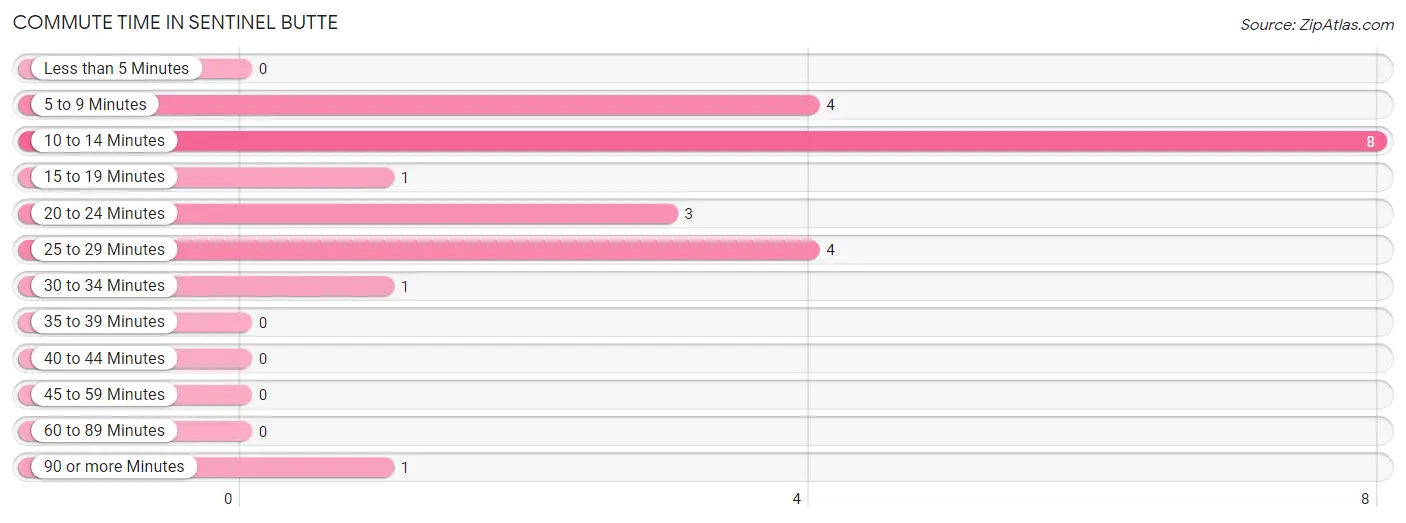
| Commute Time | # Commuters | % Commuters |
| Less than 5 Minutes | 0 | 0.0% |
| 5 to 9 Minutes | 4 | 18.2% |
| 10 to 14 Minutes | 8 | 36.4% |
| 15 to 19 Minutes | 1 | 4.5% |
| 20 to 24 Minutes | 3 | 13.6% |
| 25 to 29 Minutes | 4 | 18.2% |
| 30 to 34 Minutes | 1 | 4.5% |
| 35 to 39 Minutes | 0 | 0.0% |
| 40 to 44 Minutes | 0 | 0.0% |
| 45 to 59 Minutes | 0 | 0.0% |
| 60 to 89 Minutes | 0 | 0.0% |
| 90 or more Minutes | 1 | 4.5% |
Commute Time by Sex in Sentinel Butte
The most common commute times in Sentinel Butte are 10 to 14 minutes (7 commuters, 63.6%) for males and 5 to 9 minutes (4 commuters, 36.4%) for females.
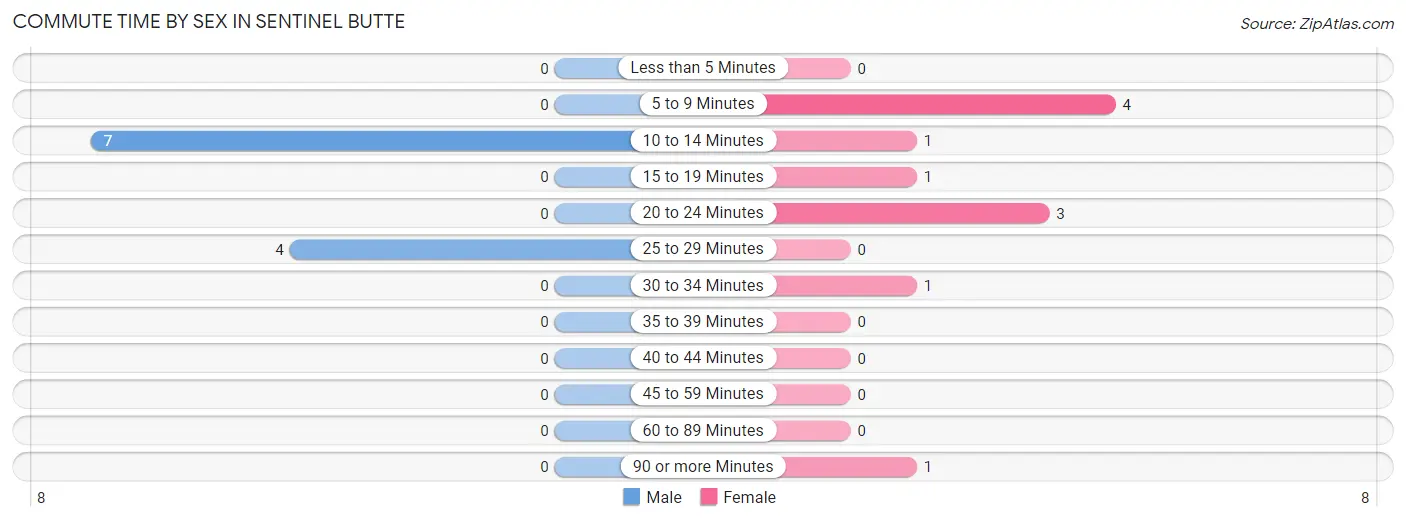
| Commute Time | Male | Female |
| Less than 5 Minutes | 0 (0.0%) | 0 (0.0%) |
| 5 to 9 Minutes | 0 (0.0%) | 4 (36.4%) |
| 10 to 14 Minutes | 7 (63.6%) | 1 (9.1%) |
| 15 to 19 Minutes | 0 (0.0%) | 1 (9.1%) |
| 20 to 24 Minutes | 0 (0.0%) | 3 (27.3%) |
| 25 to 29 Minutes | 4 (36.4%) | 0 (0.0%) |
| 30 to 34 Minutes | 0 (0.0%) | 1 (9.1%) |
| 35 to 39 Minutes | 0 (0.0%) | 0 (0.0%) |
| 40 to 44 Minutes | 0 (0.0%) | 0 (0.0%) |
| 45 to 59 Minutes | 0 (0.0%) | 0 (0.0%) |
| 60 to 89 Minutes | 0 (0.0%) | 0 (0.0%) |
| 90 or more Minutes | 0 (0.0%) | 1 (9.1%) |
Time of Departure to Work by Sex in Sentinel Butte
The most frequent times of departure to work in Sentinel Butte are 5:00 AM to 5:29 AM (4, 36.4%) for males and 6:30 AM to 6:59 AM (5, 45.5%) for females.
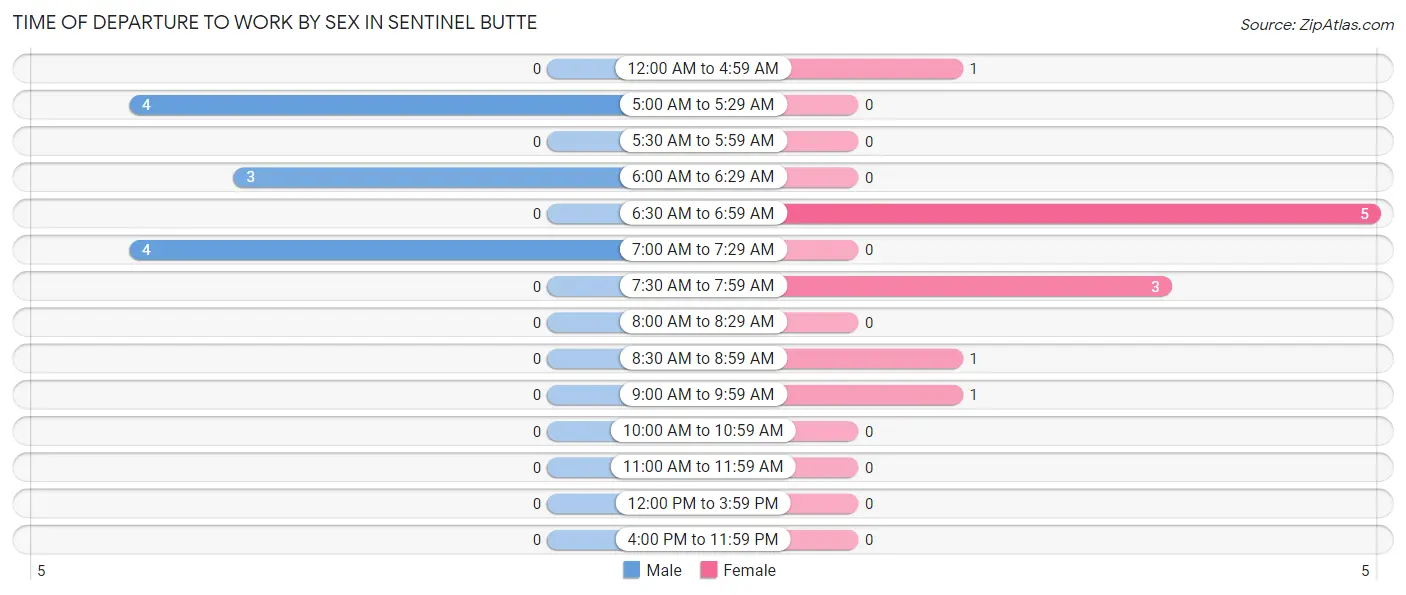
| Time of Departure | Male | Female |
| 12:00 AM to 4:59 AM | 0 (0.0%) | 1 (9.1%) |
| 5:00 AM to 5:29 AM | 4 (36.4%) | 0 (0.0%) |
| 5:30 AM to 5:59 AM | 0 (0.0%) | 0 (0.0%) |
| 6:00 AM to 6:29 AM | 3 (27.3%) | 0 (0.0%) |
| 6:30 AM to 6:59 AM | 0 (0.0%) | 5 (45.5%) |
| 7:00 AM to 7:29 AM | 4 (36.4%) | 0 (0.0%) |
| 7:30 AM to 7:59 AM | 0 (0.0%) | 3 (27.3%) |
| 8:00 AM to 8:29 AM | 0 (0.0%) | 0 (0.0%) |
| 8:30 AM to 8:59 AM | 0 (0.0%) | 1 (9.1%) |
| 9:00 AM to 9:59 AM | 0 (0.0%) | 1 (9.1%) |
| 10:00 AM to 10:59 AM | 0 (0.0%) | 0 (0.0%) |
| 11:00 AM to 11:59 AM | 0 (0.0%) | 0 (0.0%) |
| 12:00 PM to 3:59 PM | 0 (0.0%) | 0 (0.0%) |
| 4:00 PM to 11:59 PM | 0 (0.0%) | 0 (0.0%) |
| Total | 11 (100.0%) | 11 (100.0%) |
Housing Occupancy in Sentinel Butte
Occupancy by Ownership in Sentinel Butte
Of the total 30 dwellings in Sentinel Butte, owner-occupied units account for 30 (100.0%), while renter-occupied units make up 0 (0.0%).
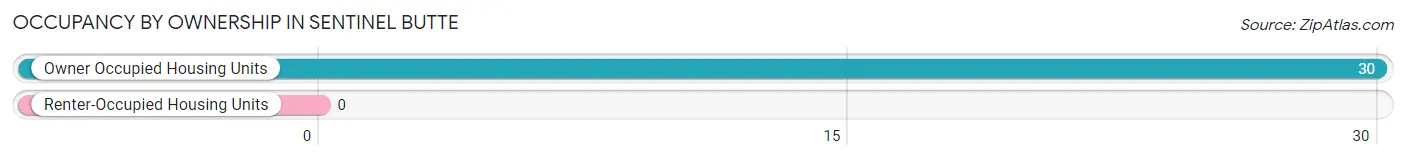
| Occupancy | # Housing Units | % Housing Units |
| Owner Occupied Housing Units | 30 | 100.0% |
| Renter-Occupied Housing Units | 0 | 0.0% |
| Total Occupied Housing Units | 30 | 100.0% |
Occupancy by Household Size in Sentinel Butte
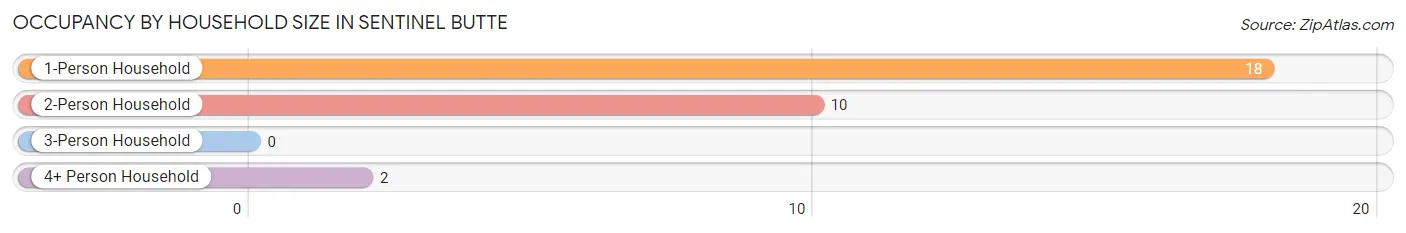
| Household Size | # Housing Units | % Housing Units |
| 1-Person Household | 18 | 60.0% |
| 2-Person Household | 10 | 33.3% |
| 3-Person Household | 0 | 0.0% |
| 4+ Person Household | 2 | 6.7% |
| Total Housing Units | 30 | 100.0% |
Occupancy by Ownership by Household Size in Sentinel Butte
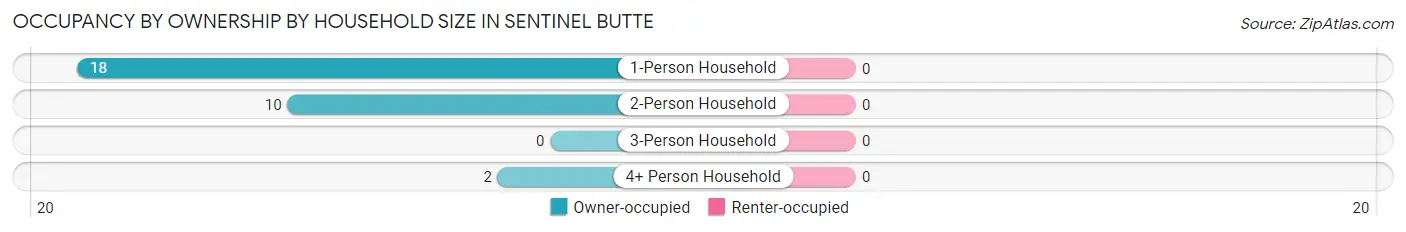
| Household Size | Owner-occupied | Renter-occupied |
| 1-Person Household | 18 (100.0%) | 0 (0.0%) |
| 2-Person Household | 10 (100.0%) | 0 (0.0%) |
| 3-Person Household | 0 (0.0%) | 0 (0.0%) |
| 4+ Person Household | 2 (100.0%) | 0 (0.0%) |
| Total Housing Units | 30 (100.0%) | 0 (0.0%) |
Occupancy by Educational Attainment in Sentinel Butte
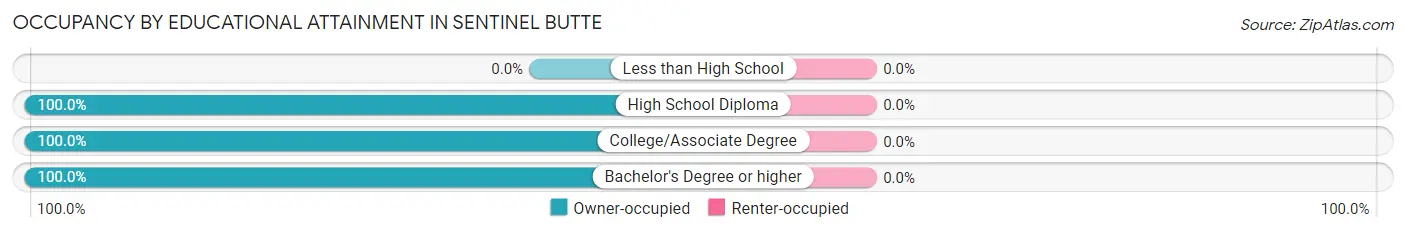
| Household Size | Owner-occupied | Renter-occupied |
| Less than High School | 0 (0.0%) | 0 (0.0%) |
| High School Diploma | 11 (100.0%) | 0 (0.0%) |
| College/Associate Degree | 13 (100.0%) | 0 (0.0%) |
| Bachelor's Degree or higher | 6 (100.0%) | 0 (0.0%) |
Occupancy by Age of Householder in Sentinel Butte
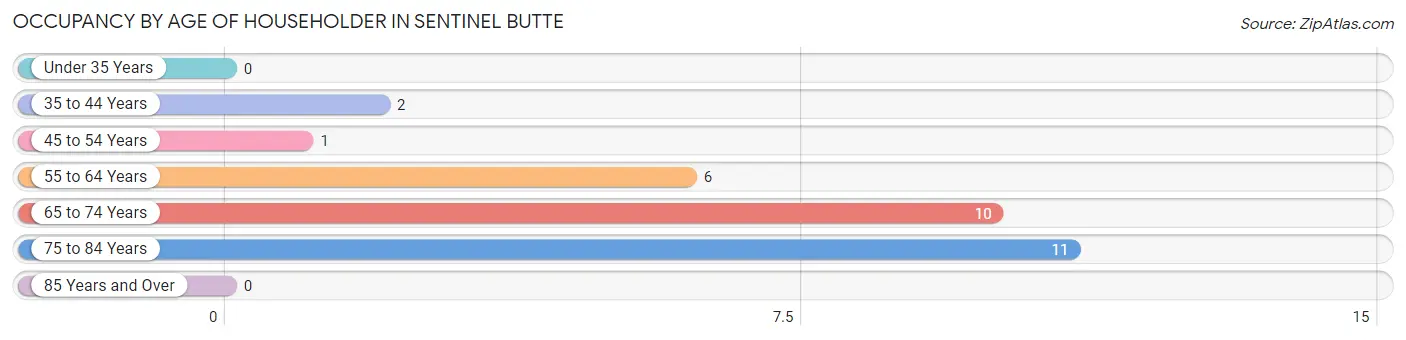
| Age Bracket | # Households | % Households |
| Under 35 Years | 0 | 0.0% |
| 35 to 44 Years | 2 | 6.7% |
| 45 to 54 Years | 1 | 3.3% |
| 55 to 64 Years | 6 | 20.0% |
| 65 to 74 Years | 10 | 33.3% |
| 75 to 84 Years | 11 | 36.7% |
| 85 Years and Over | 0 | 0.0% |
| Total | 30 | 100.0% |
Housing Finances in Sentinel Butte
Median Income by Occupancy in Sentinel Butte
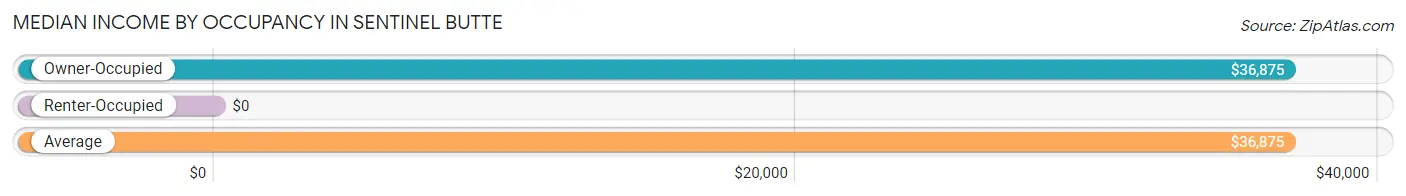
| Occupancy Type | # Households | Median Income |
| Owner-Occupied | 30 (100.0%) | $36,875 |
| Renter-Occupied | 0 (0.0%) | $0 |
| Average | 30 (100.0%) | $36,875 |
Occupancy by Householder Income Bracket in Sentinel Butte
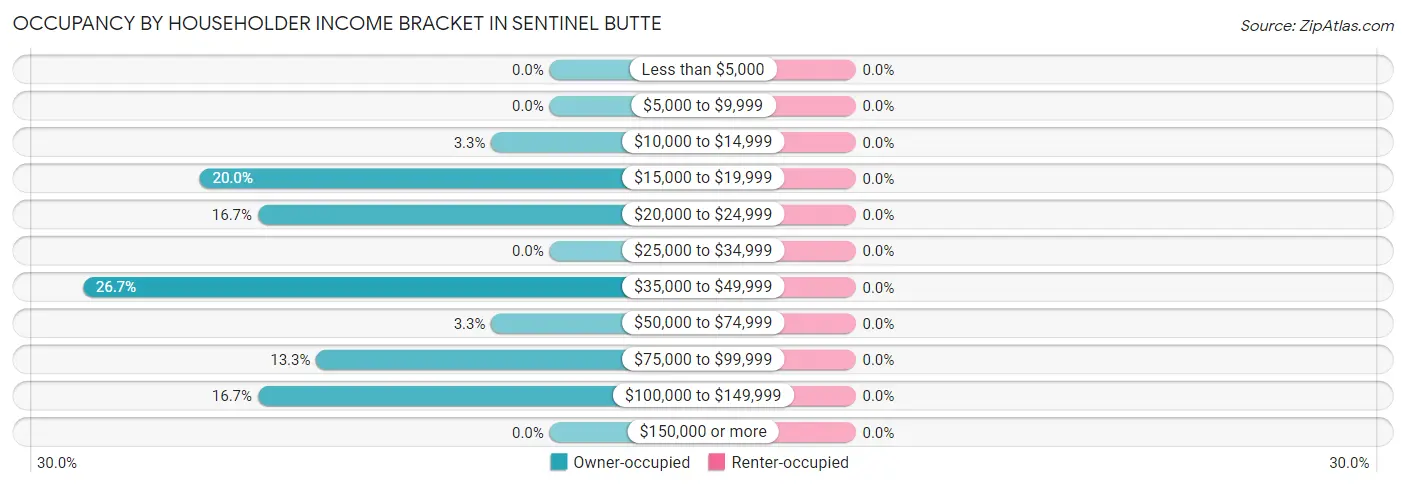
| Income Bracket | Owner-occupied | Renter-occupied |
| Less than $5,000 | 0 (0.0%) | 0 (0.0%) |
| $5,000 to $9,999 | 0 (0.0%) | 0 (0.0%) |
| $10,000 to $14,999 | 1 (3.3%) | 0 (0.0%) |
| $15,000 to $19,999 | 6 (20.0%) | 0 (0.0%) |
| $20,000 to $24,999 | 5 (16.7%) | 0 (0.0%) |
| $25,000 to $34,999 | 0 (0.0%) | 0 (0.0%) |
| $35,000 to $49,999 | 8 (26.7%) | 0 (0.0%) |
| $50,000 to $74,999 | 1 (3.3%) | 0 (0.0%) |
| $75,000 to $99,999 | 4 (13.3%) | 0 (0.0%) |
| $100,000 to $149,999 | 5 (16.7%) | 0 (0.0%) |
| $150,000 or more | 0 (0.0%) | 0 (0.0%) |
| Total | 30 (100.0%) | 0 (0.0%) |
Monthly Housing Cost Tiers in Sentinel Butte
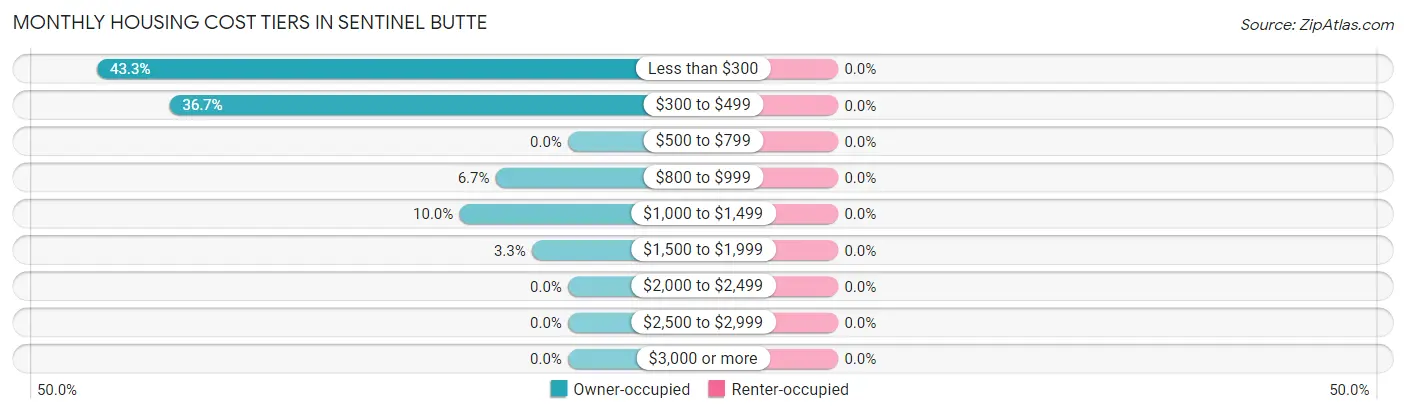
| Monthly Cost | Owner-occupied | Renter-occupied |
| Less than $300 | 13 (43.3%) | 0 (0.0%) |
| $300 to $499 | 11 (36.7%) | 0 (0.0%) |
| $500 to $799 | 0 (0.0%) | 0 (0.0%) |
| $800 to $999 | 2 (6.7%) | 0 (0.0%) |
| $1,000 to $1,499 | 3 (10.0%) | 0 (0.0%) |
| $1,500 to $1,999 | 1 (3.3%) | 0 (0.0%) |
| $2,000 to $2,499 | 0 (0.0%) | 0 (0.0%) |
| $2,500 to $2,999 | 0 (0.0%) | 0 (0.0%) |
| $3,000 or more | 0 (0.0%) | 0 (0.0%) |
| Total | 30 (100.0%) | 0 (0.0%) |
Physical Housing Characteristics in Sentinel Butte
Housing Structures in Sentinel Butte
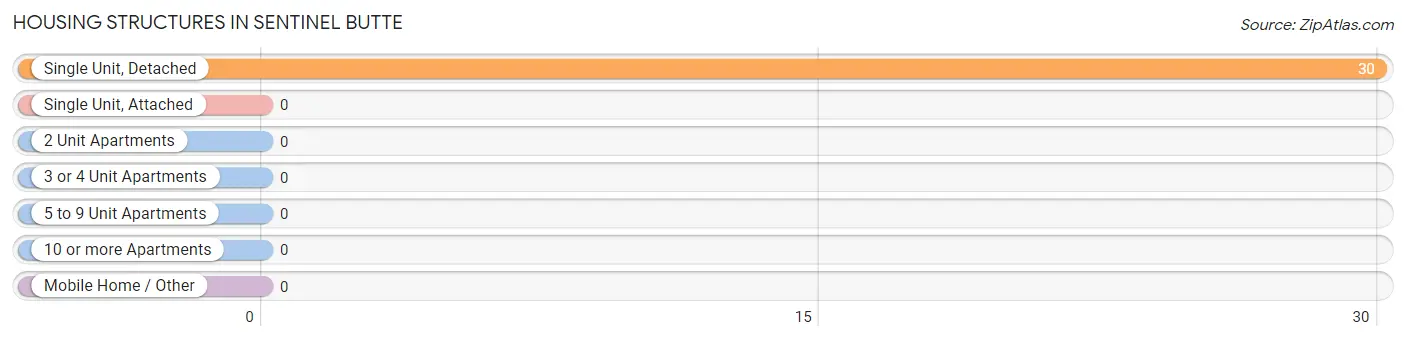
| Structure Type | # Housing Units | % Housing Units |
| Single Unit, Detached | 30 | 100.0% |
| Single Unit, Attached | 0 | 0.0% |
| 2 Unit Apartments | 0 | 0.0% |
| 3 or 4 Unit Apartments | 0 | 0.0% |
| 5 to 9 Unit Apartments | 0 | 0.0% |
| 10 or more Apartments | 0 | 0.0% |
| Mobile Home / Other | 0 | 0.0% |
| Total | 30 | 100.0% |
Housing Structures by Occupancy in Sentinel Butte
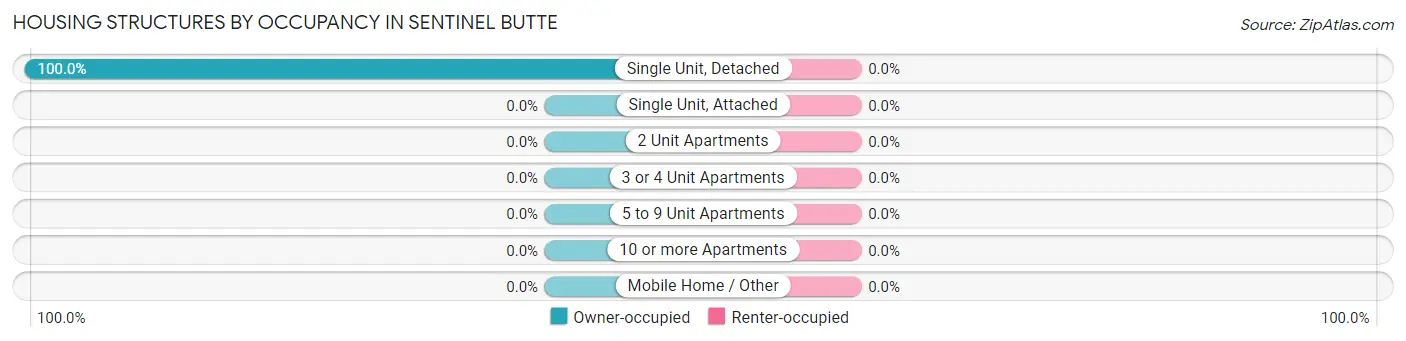
| Structure Type | Owner-occupied | Renter-occupied |
| Single Unit, Detached | 30 (100.0%) | 0 (0.0%) |
| Single Unit, Attached | 0 (0.0%) | 0 (0.0%) |
| 2 Unit Apartments | 0 (0.0%) | 0 (0.0%) |
| 3 or 4 Unit Apartments | 0 (0.0%) | 0 (0.0%) |
| 5 to 9 Unit Apartments | 0 (0.0%) | 0 (0.0%) |
| 10 or more Apartments | 0 (0.0%) | 0 (0.0%) |
| Mobile Home / Other | 0 (0.0%) | 0 (0.0%) |
| Total | 30 (100.0%) | 0 (0.0%) |
Housing Structures by Number of Rooms in Sentinel Butte
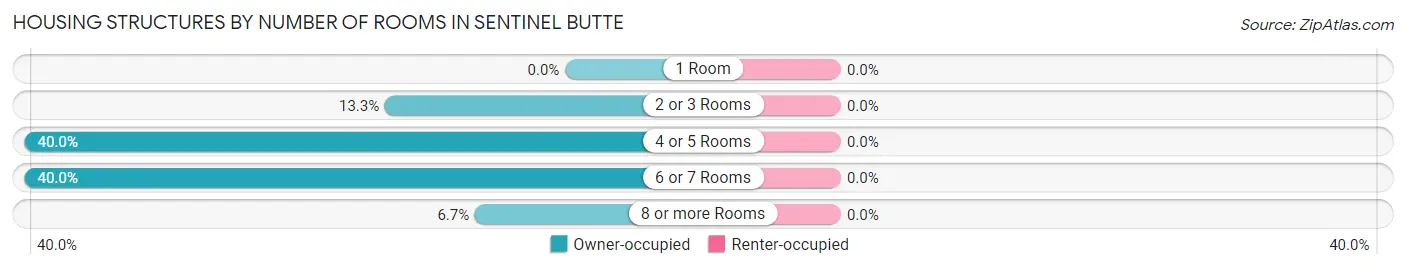
| Number of Rooms | Owner-occupied | Renter-occupied |
| 1 Room | 0 (0.0%) | 0 (0.0%) |
| 2 or 3 Rooms | 4 (13.3%) | 0 (0.0%) |
| 4 or 5 Rooms | 12 (40.0%) | 0 (0.0%) |
| 6 or 7 Rooms | 12 (40.0%) | 0 (0.0%) |
| 8 or more Rooms | 2 (6.7%) | 0 (0.0%) |
| Total | 30 (100.0%) | 0 (0.0%) |
Housing Structure by Heating Type in Sentinel Butte
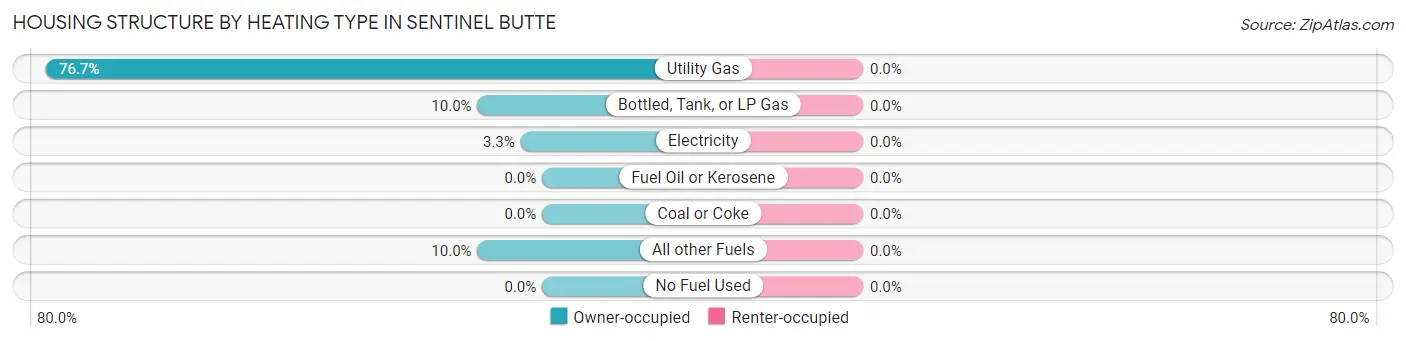
| Heating Type | Owner-occupied | Renter-occupied |
| Utility Gas | 23 (76.7%) | 0 (0.0%) |
| Bottled, Tank, or LP Gas | 3 (10.0%) | 0 (0.0%) |
| Electricity | 1 (3.3%) | 0 (0.0%) |
| Fuel Oil or Kerosene | 0 (0.0%) | 0 (0.0%) |
| Coal or Coke | 0 (0.0%) | 0 (0.0%) |
| All other Fuels | 3 (10.0%) | 0 (0.0%) |
| No Fuel Used | 0 (0.0%) | 0 (0.0%) |
| Total | 30 (100.0%) | 0 (0.0%) |
Household Vehicle Usage in Sentinel Butte
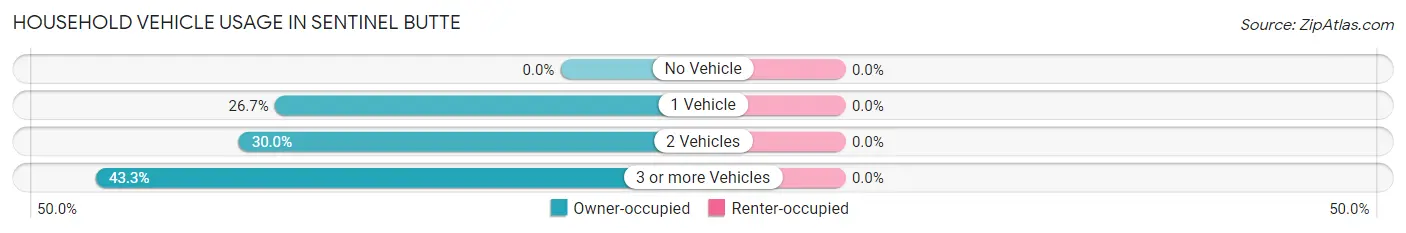
| Vehicles per Household | Owner-occupied | Renter-occupied |
| No Vehicle | 0 (0.0%) | 0 (0.0%) |
| 1 Vehicle | 8 (26.7%) | 0 (0.0%) |
| 2 Vehicles | 9 (30.0%) | 0 (0.0%) |
| 3 or more Vehicles | 13 (43.3%) | 0 (0.0%) |
| Total | 30 (100.0%) | 0 (0.0%) |
Real Estate & Mortgages in Sentinel Butte
Real Estate and Mortgage Overview in Sentinel Butte
| Characteristic | Without Mortgage | With Mortgage |
| Housing Units | 24 | 6 |
| Median Property Value | $57,500 | $187,500 |
| Median Household Income | $35,625 | $0 |
| Monthly Housing Costs | $294 | $0 |
| Real Estate Taxes | $500 | $0 |
Property Value by Mortgage Status in Sentinel Butte
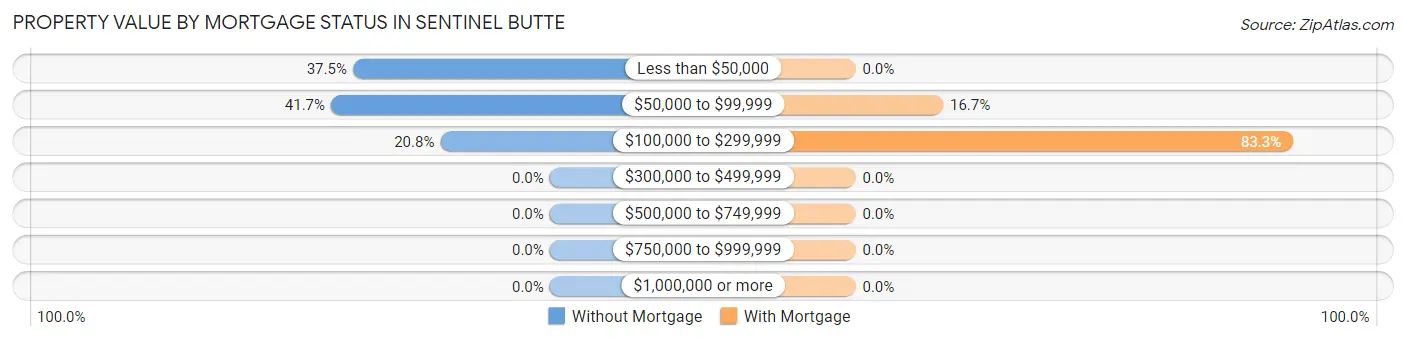
| Property Value | Without Mortgage | With Mortgage |
| Less than $50,000 | 9 (37.5%) | 0 (0.0%) |
| $50,000 to $99,999 | 10 (41.7%) | 1 (16.7%) |
| $100,000 to $299,999 | 5 (20.8%) | 5 (83.3%) |
| $300,000 to $499,999 | 0 (0.0%) | 0 (0.0%) |
| $500,000 to $749,999 | 0 (0.0%) | 0 (0.0%) |
| $750,000 to $999,999 | 0 (0.0%) | 0 (0.0%) |
| $1,000,000 or more | 0 (0.0%) | 0 (0.0%) |
| Total | 24 (100.0%) | 6 (100.0%) |
Household Income by Mortgage Status in Sentinel Butte
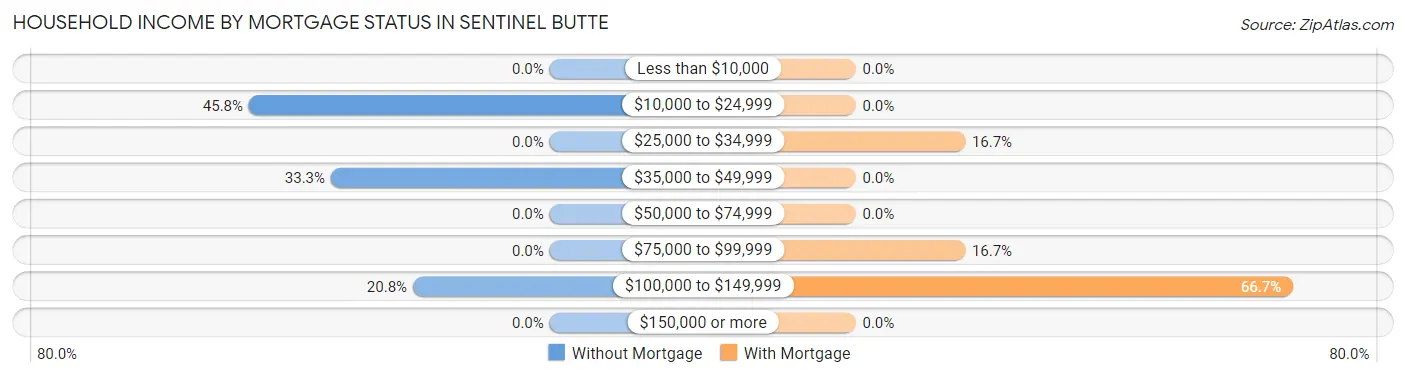
| Household Income | Without Mortgage | With Mortgage |
| Less than $10,000 | 0 (0.0%) | 0 (0.0%) |
| $10,000 to $24,999 | 11 (45.8%) | 0 (0.0%) |
| $25,000 to $34,999 | 0 (0.0%) | 1 (16.7%) |
| $35,000 to $49,999 | 8 (33.3%) | 0 (0.0%) |
| $50,000 to $74,999 | 0 (0.0%) | 0 (0.0%) |
| $75,000 to $99,999 | 0 (0.0%) | 1 (16.7%) |
| $100,000 to $149,999 | 5 (20.8%) | 4 (66.7%) |
| $150,000 or more | 0 (0.0%) | 0 (0.0%) |
| Total | 24 (100.0%) | 6 (100.0%) |
Property Value to Household Income Ratio in Sentinel Butte
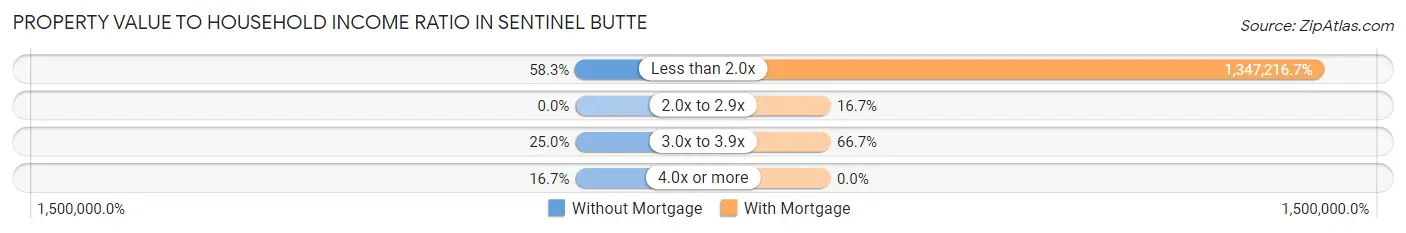
| Value-to-Income Ratio | Without Mortgage | With Mortgage |
| Less than 2.0x | 14 (58.3%) | 80,833 (1,347,216.7%) |
| 2.0x to 2.9x | 0 (0.0%) | 1 (16.7%) |
| 3.0x to 3.9x | 6 (25.0%) | 4 (66.7%) |
| 4.0x or more | 4 (16.7%) | 0 (0.0%) |
| Total | 24 (100.0%) | 6 (100.0%) |
Real Estate Taxes by Mortgage Status in Sentinel Butte
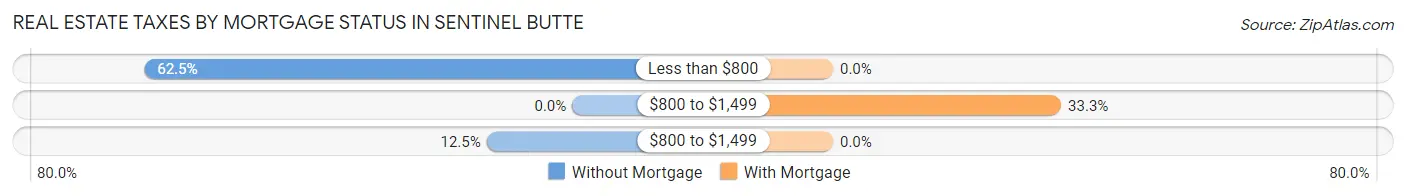
| Property Taxes | Without Mortgage | With Mortgage |
| Less than $800 | 15 (62.5%) | 0 (0.0%) |
| $800 to $1,499 | 0 (0.0%) | 2 (33.3%) |
| $800 to $1,499 | 3 (12.5%) | 0 (0.0%) |
| Total | 24 (100.0%) | 6 (100.0%) |
Health & Disability in Sentinel Butte
Health Insurance Coverage by Age in Sentinel Butte
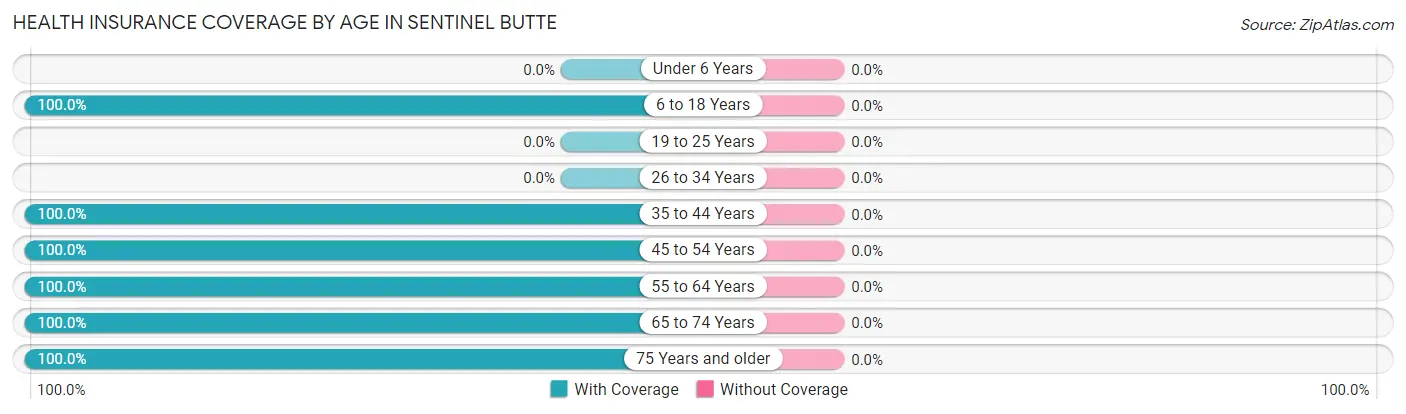
| Age Bracket | With Coverage | Without Coverage |
| Under 6 Years | 0 (0.0%) | 0 (0.0%) |
| 6 to 18 Years | 5 (100.0%) | 0 (0.0%) |
| 19 to 25 Years | 0 (0.0%) | 0 (0.0%) |
| 26 to 34 Years | 0 (0.0%) | 0 (0.0%) |
| 35 to 44 Years | 3 (100.0%) | 0 (0.0%) |
| 45 to 54 Years | 2 (100.0%) | 0 (0.0%) |
| 55 to 64 Years | 7 (100.0%) | 0 (0.0%) |
| 65 to 74 Years | 11 (100.0%) | 0 (0.0%) |
| 75 Years and older | 17 (100.0%) | 0 (0.0%) |
| Total | 45 (100.0%) | 0 (0.0%) |
Health Insurance Coverage by Citizenship Status in Sentinel Butte
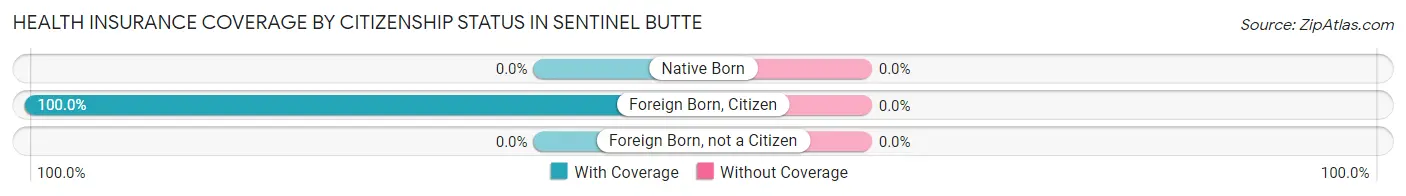
| Citizenship Status | With Coverage | Without Coverage |
| Native Born | 0 (0.0%) | 0 (0.0%) |
| Foreign Born, Citizen | 5 (100.0%) | 0 (0.0%) |
| Foreign Born, not a Citizen | 0 (0.0%) | 0 (0.0%) |
Health Insurance Coverage by Household Income in Sentinel Butte
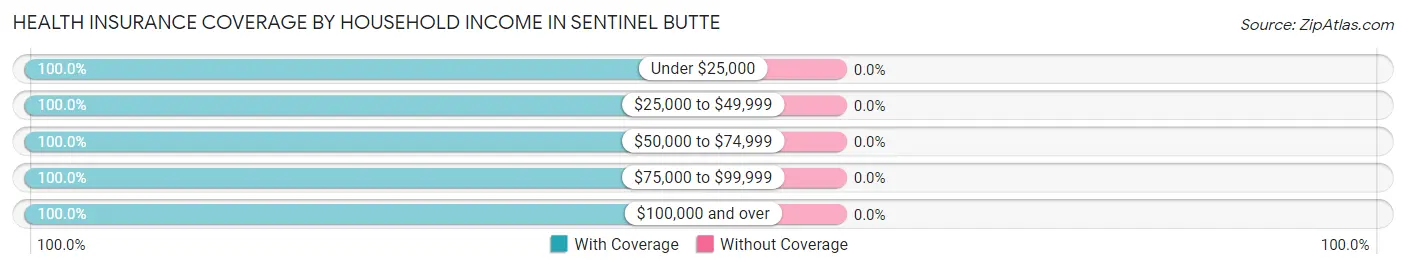
| Household Income | With Coverage | Without Coverage |
| Under $25,000 | 13 (100.0%) | 0 (0.0%) |
| $25,000 to $49,999 | 15 (100.0%) | 0 (0.0%) |
| $50,000 to $74,999 | 2 (100.0%) | 0 (0.0%) |
| $75,000 to $99,999 | 5 (100.0%) | 0 (0.0%) |
| $100,000 and over | 10 (100.0%) | 0 (0.0%) |
Public vs Private Health Insurance Coverage by Age in Sentinel Butte
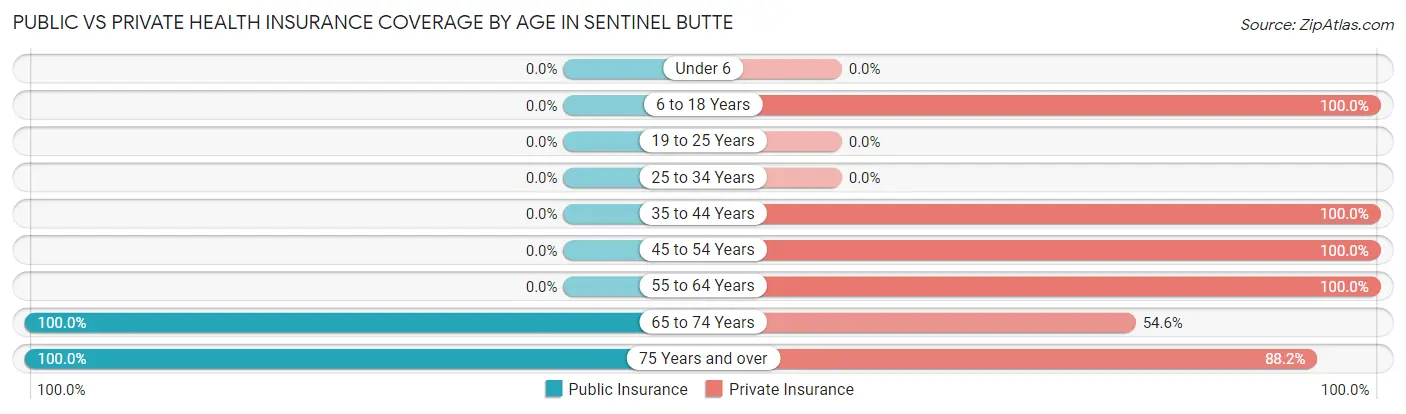
| Age Bracket | Public Insurance | Private Insurance |
| Under 6 | 0 (0.0%) | 0 (0.0%) |
| 6 to 18 Years | 0 (0.0%) | 5 (100.0%) |
| 19 to 25 Years | 0 (0.0%) | 0 (0.0%) |
| 25 to 34 Years | 0 (0.0%) | 0 (0.0%) |
| 35 to 44 Years | 0 (0.0%) | 3 (100.0%) |
| 45 to 54 Years | 0 (0.0%) | 2 (100.0%) |
| 55 to 64 Years | 0 (0.0%) | 7 (100.0%) |
| 65 to 74 Years | 11 (100.0%) | 6 (54.5%) |
| 75 Years and over | 17 (100.0%) | 15 (88.2%) |
| Total | 28 (62.2%) | 38 (84.4%) |
Disability Status by Sex by Age in Sentinel Butte
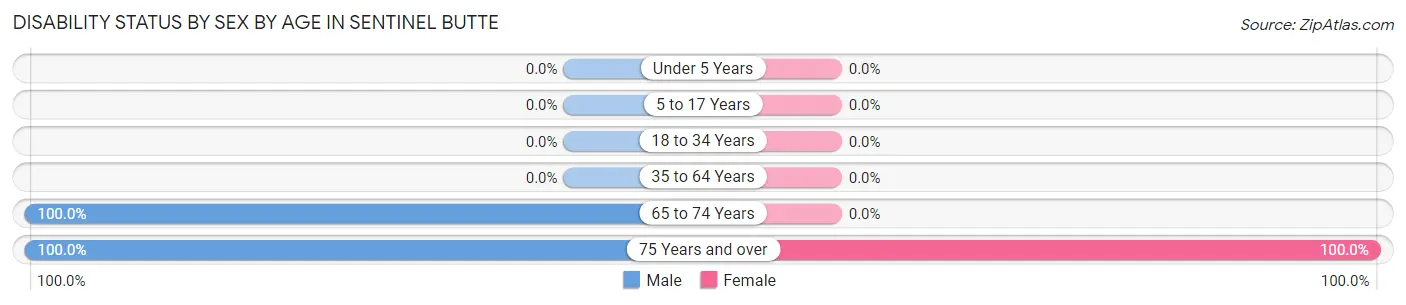
| Age Bracket | Male | Female |
| Under 5 Years | 0 (0.0%) | 0 (0.0%) |
| 5 to 17 Years | 0 (0.0%) | 0 (0.0%) |
| 18 to 34 Years | 0 (0.0%) | 0 (0.0%) |
| 35 to 64 Years | 0 (0.0%) | 0 (0.0%) |
| 65 to 74 Years | 2 (100.0%) | 0 (0.0%) |
| 75 Years and over | 9 (100.0%) | 8 (100.0%) |
Disability Class by Sex by Age in Sentinel Butte
Disability Class: Hearing Difficulty
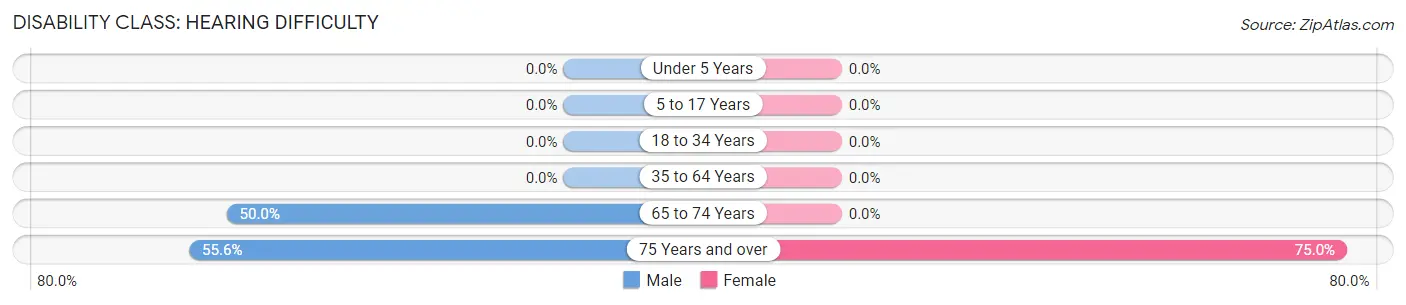
| Age Bracket | Male | Female |
| Under 5 Years | 0 (0.0%) | 0 (0.0%) |
| 5 to 17 Years | 0 (0.0%) | 0 (0.0%) |
| 18 to 34 Years | 0 (0.0%) | 0 (0.0%) |
| 35 to 64 Years | 0 (0.0%) | 0 (0.0%) |
| 65 to 74 Years | 1 (50.0%) | 0 (0.0%) |
| 75 Years and over | 5 (55.6%) | 6 (75.0%) |
Disability Class: Vision Difficulty
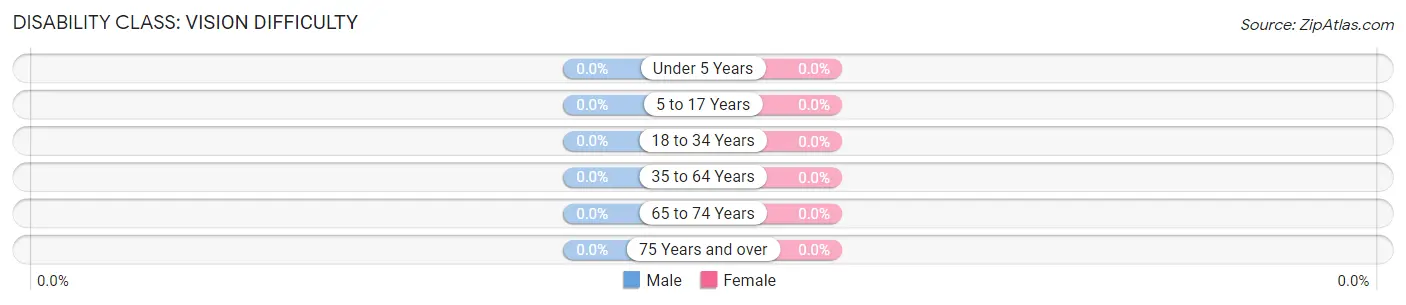
| Age Bracket | Male | Female |
| Under 5 Years | 0 (0.0%) | 0 (0.0%) |
| 5 to 17 Years | 0 (0.0%) | 0 (0.0%) |
| 18 to 34 Years | 0 (0.0%) | 0 (0.0%) |
| 35 to 64 Years | 0 (0.0%) | 0 (0.0%) |
| 65 to 74 Years | 0 (0.0%) | 0 (0.0%) |
| 75 Years and over | 0 (0.0%) | 0 (0.0%) |
Disability Class: Cognitive Difficulty
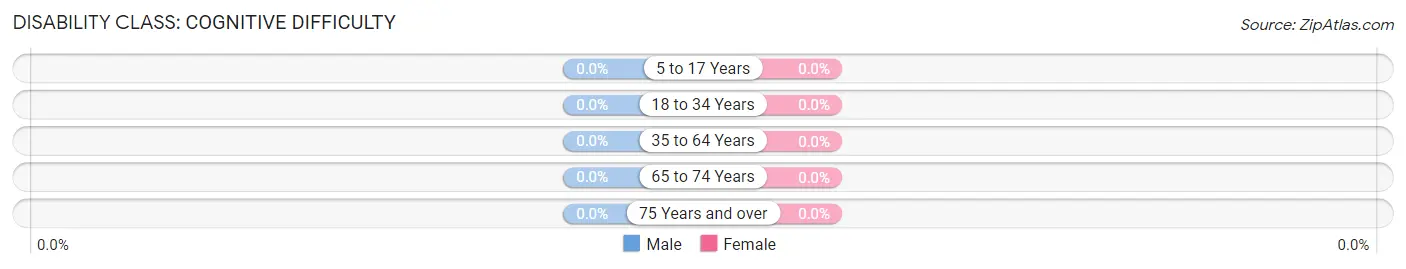
| Age Bracket | Male | Female |
| 5 to 17 Years | 0 (0.0%) | 0 (0.0%) |
| 18 to 34 Years | 0 (0.0%) | 0 (0.0%) |
| 35 to 64 Years | 0 (0.0%) | 0 (0.0%) |
| 65 to 74 Years | 0 (0.0%) | 0 (0.0%) |
| 75 Years and over | 0 (0.0%) | 0 (0.0%) |
Disability Class: Ambulatory Difficulty
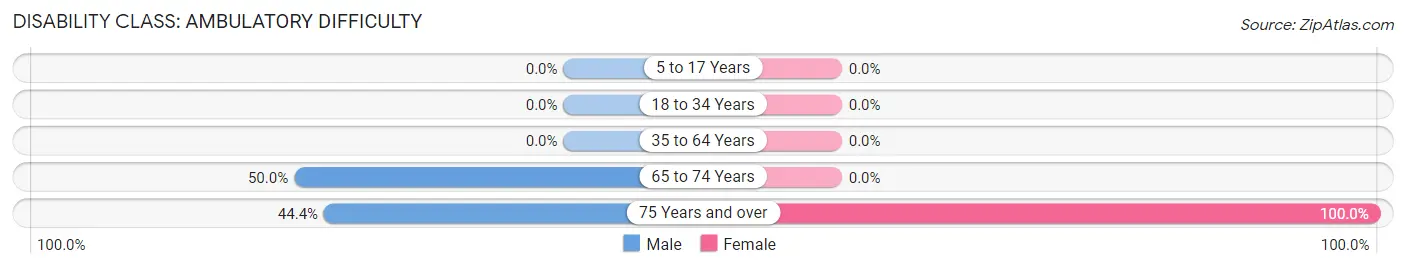
| Age Bracket | Male | Female |
| 5 to 17 Years | 0 (0.0%) | 0 (0.0%) |
| 18 to 34 Years | 0 (0.0%) | 0 (0.0%) |
| 35 to 64 Years | 0 (0.0%) | 0 (0.0%) |
| 65 to 74 Years | 1 (50.0%) | 0 (0.0%) |
| 75 Years and over | 4 (44.4%) | 8 (100.0%) |
Disability Class: Self-Care Difficulty
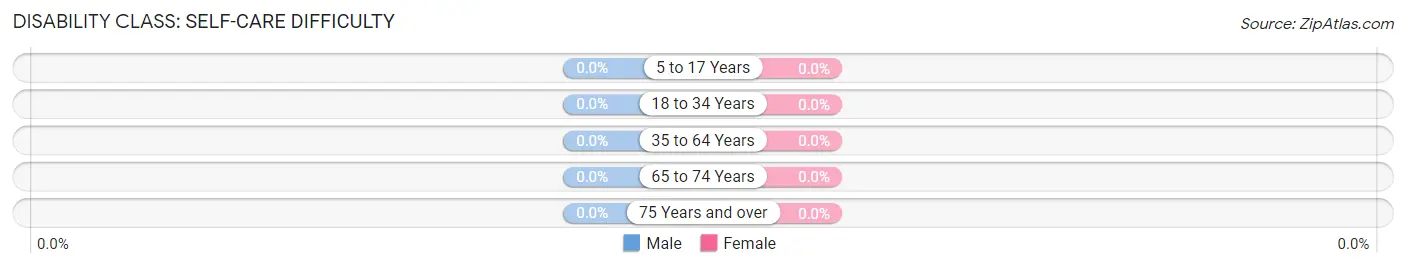
| Age Bracket | Male | Female |
| 5 to 17 Years | 0 (0.0%) | 0 (0.0%) |
| 18 to 34 Years | 0 (0.0%) | 0 (0.0%) |
| 35 to 64 Years | 0 (0.0%) | 0 (0.0%) |
| 65 to 74 Years | 0 (0.0%) | 0 (0.0%) |
| 75 Years and over | 0 (0.0%) | 0 (0.0%) |
Technology Access in Sentinel Butte
Computing Device Access in Sentinel Butte
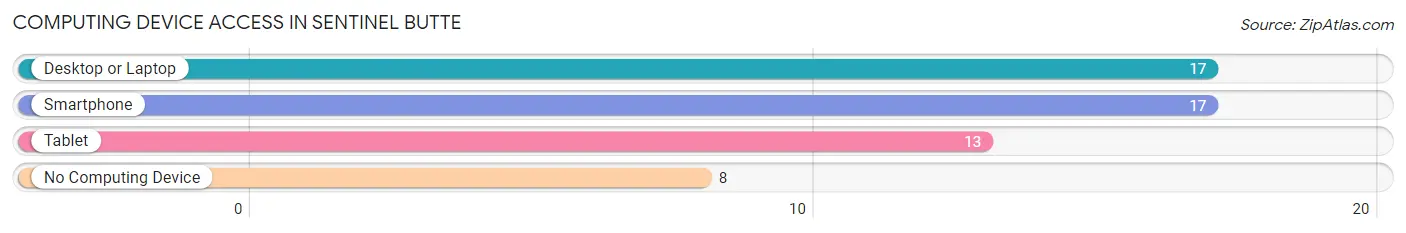
| Device Type | # Households | % Households |
| Desktop or Laptop | 17 | 56.7% |
| Smartphone | 17 | 56.7% |
| Tablet | 13 | 43.3% |
| No Computing Device | 8 | 26.7% |
| Total | 30 | 100.0% |
Internet Access in Sentinel Butte
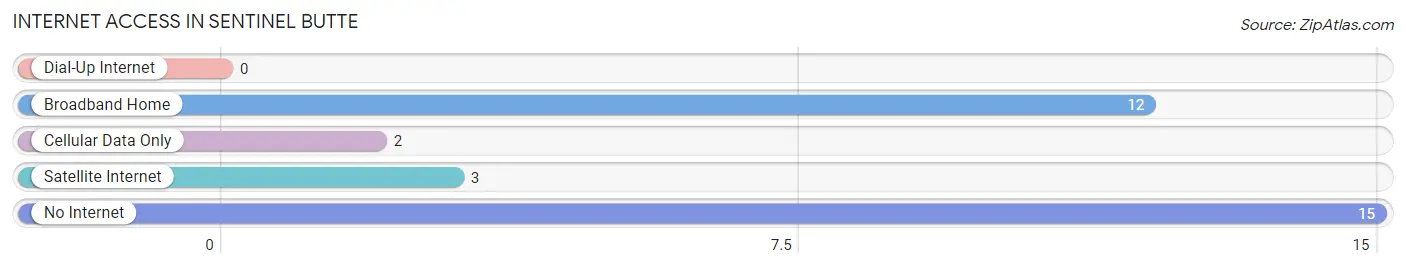
| Internet Type | # Households | % Households |
| Dial-Up Internet | 0 | 0.0% |
| Broadband Home | 12 | 40.0% |
| Cellular Data Only | 2 | 6.7% |
| Satellite Internet | 3 | 10.0% |
| No Internet | 15 | 50.0% |
| Total | 30 | 100.0% |
Sentinel Butte Summary
Sentinel Butte is a small town located in the western part of North Dakota, in the United States. It is situated in Golden Valley County, and is part of the Dickinson Micropolitan Statistical Area. The town has a population of approximately 200 people, and is located on the banks of the Little Missouri River.
History
Sentinel Butte was founded in 1883, when the Northern Pacific Railroad was built through the area. The town was named after a nearby butte, which was used by Native Americans as a lookout point. The town was originally a stop on the railroad, and was used as a supply point for the surrounding area.
In the early 1900s, Sentinel Butte became a popular destination for tourists, as it was located near the Little Missouri National Grassland. The town was also home to a number of businesses, including a hotel, a bank, a general store, and a saloon.
In the 1950s, the town began to decline, as the railroad stopped running through the area. The population of the town decreased, and many of the businesses closed. In the 1970s, the town was revitalized, as the oil industry began to boom in the area.
Geography
Sentinel Butte is located in the western part of North Dakota, in Golden Valley County. The town is situated on the banks of the Little Missouri River, and is surrounded by rolling hills and prairies. The town is located approximately 30 miles from the city of Dickinson, and is part of the Dickinson Micropolitan Statistical Area.
The climate in Sentinel Butte is semi-arid, with hot summers and cold winters. The average temperature in the summer is around 75 degrees Fahrenheit, and the average temperature in the winter is around 20 degrees Fahrenheit.
Economy
The economy of Sentinel Butte is largely based on the oil industry. The town is home to several oil companies, and is a major hub for the oil industry in the region. The town is also home to a number of small businesses, including a grocery store, a hardware store, and a restaurant.
The town is also home to a number of tourist attractions, including the Little Missouri National Grassland, which is a popular destination for hikers and campers. The town is also home to a number of historic sites, including the Sentinel Butte Depot, which was built in 1883.
Demographics
As of the 2010 census, the population of Sentinel Butte was 200 people. The racial makeup of the town was 97.5% White, 0.5% Native American, 0.5% Asian, and 1.5% from other races. The median household income in the town was $41,250, and the median age was 44.5 years.
Conclusion
Sentinel Butte is a small town located in the western part of North Dakota. The town has a population of approximately 200 people, and is home to a number of businesses, including those in the oil industry. The town is also home to a number of tourist attractions, including the Little Missouri National Grassland. The town has a semi-arid climate, with hot summers and cold winters. The population of the town is largely White, with a small percentage of Native American and Asian residents. The median household income in the town is $41,250, and the median age is 44.5 years.
Common Questions
What is Per Capita Income in Sentinel Butte?
Per Capita income in Sentinel Butte is $36,673.
What is the Median Household income in Sentinel Butte?
Median Household Income in Sentinel Butte is $36,875.
What is Inequality or Gini Index in Sentinel Butte?
Inequality or Gini Index in Sentinel Butte is 0.42.
What is the Total Population of Sentinel Butte?
Total Population of Sentinel Butte is 45.
What is the Total Male Population of Sentinel Butte?
Total Male Population of Sentinel Butte is 20.
What is the Total Female Population of Sentinel Butte?
Total Female Population of Sentinel Butte is 25.
What is the Ratio of Males per 100 Females in Sentinel Butte?
There are 80.00 Males per 100 Females in Sentinel Butte.
What is the Ratio of Females per 100 Males in Sentinel Butte?
There are 125.00 Females per 100 Males in Sentinel Butte.
What is the Median Population Age in Sentinel Butte?
Median Population Age in Sentinel Butte is 68.9 Years.
What is the Average Family Size in Sentinel Butte
Average Family Size in Sentinel Butte is 2.2 People.
What is the Average Household Size in Sentinel Butte
Average Household Size in Sentinel Butte is 1.5 People.
How Large is the Labor Force in Sentinel Butte?
There are 22 People in the Labor Forcein in Sentinel Butte.
What is the Percentage of People in the Labor Force in Sentinel Butte?
52.4% of People are in the Labor Force in Sentinel Butte.