Palermo, ND Map & Demographics
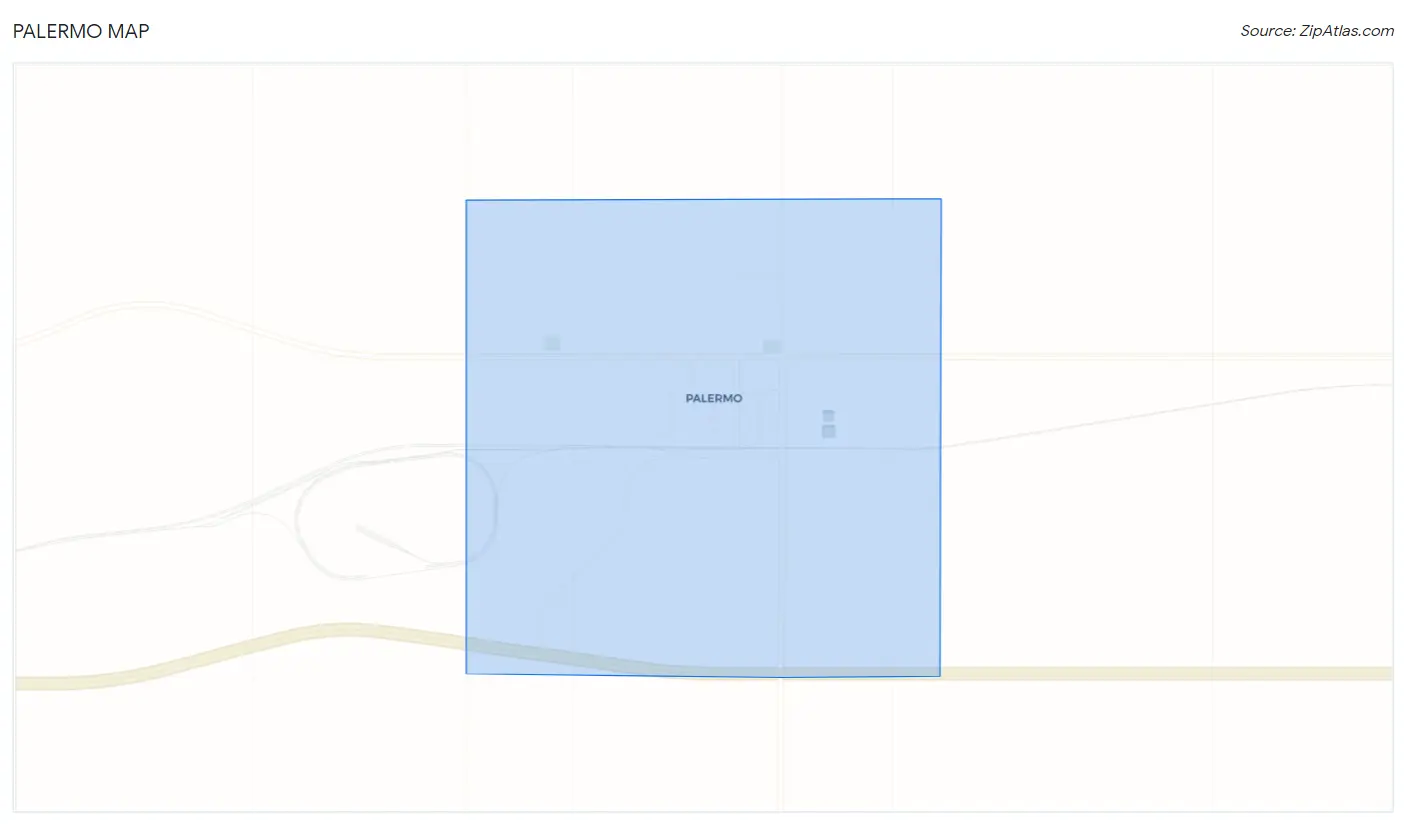
Palermo Map
Palermo Overview
$36,996
PER CAPITA INCOME
$76,500
AVG FAMILY INCOME
$64,375
AVG HOUSEHOLD INCOME
0.41
INEQUALITY / GINI INDEX
131
TOTAL POPULATION
81
MALE POPULATION
50
FEMALE POPULATION
162.00
MALES / 100 FEMALES
61.73
FEMALES / 100 MALES
45.7
MEDIAN AGE
2.9
AVG FAMILY SIZE
2.1
AVG HOUSEHOLD SIZE
63
LABOR FORCE [ PEOPLE ]
49.6%
PERCENT IN LABOR FORCE
1.6%
UNEMPLOYMENT RATE
Palermo Zip Codes
Palermo Area Codes
Income in Palermo
Income Overview in Palermo
Per Capita Income in Palermo is $36,996, while median incomes of families and households are $76,500 and $64,375 respectively.
| Characteristic | Number | Measure |
| Per Capita Income | 131 | $36,996 |
| Median Family Income | 36 | $76,500 |
| Mean Family Income | 36 | $79,303 |
| Median Household Income | 61 | $64,375 |
| Mean Household Income | 61 | $69,054 |
| Income Deficit | 36 | $0 |
| Wage / Income Gap (%) | 131 | 0.00% |
| Wage / Income Gap ($) | 131 | 100.00¢ per $1 |
| Gini / Inequality Index | 131 | 0.41 |
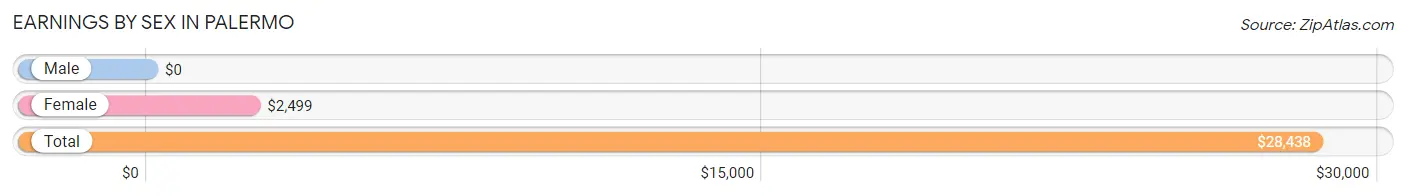
Earnings by Sex in Palermo
| Sex | Number | Average Earnings |
| Male | 48 (66.7%) | $0 |
| Female | 24 (33.3%) | $2,499 |
| Total | 72 (100.0%) | $28,438 |
Earnings by Sex by Income Bracket in Palermo
The most common earnings brackets in Palermo are $75,000 to $99,999 for men (15 | 31.2%) and $2,499 or less for women (13 | 54.2%).
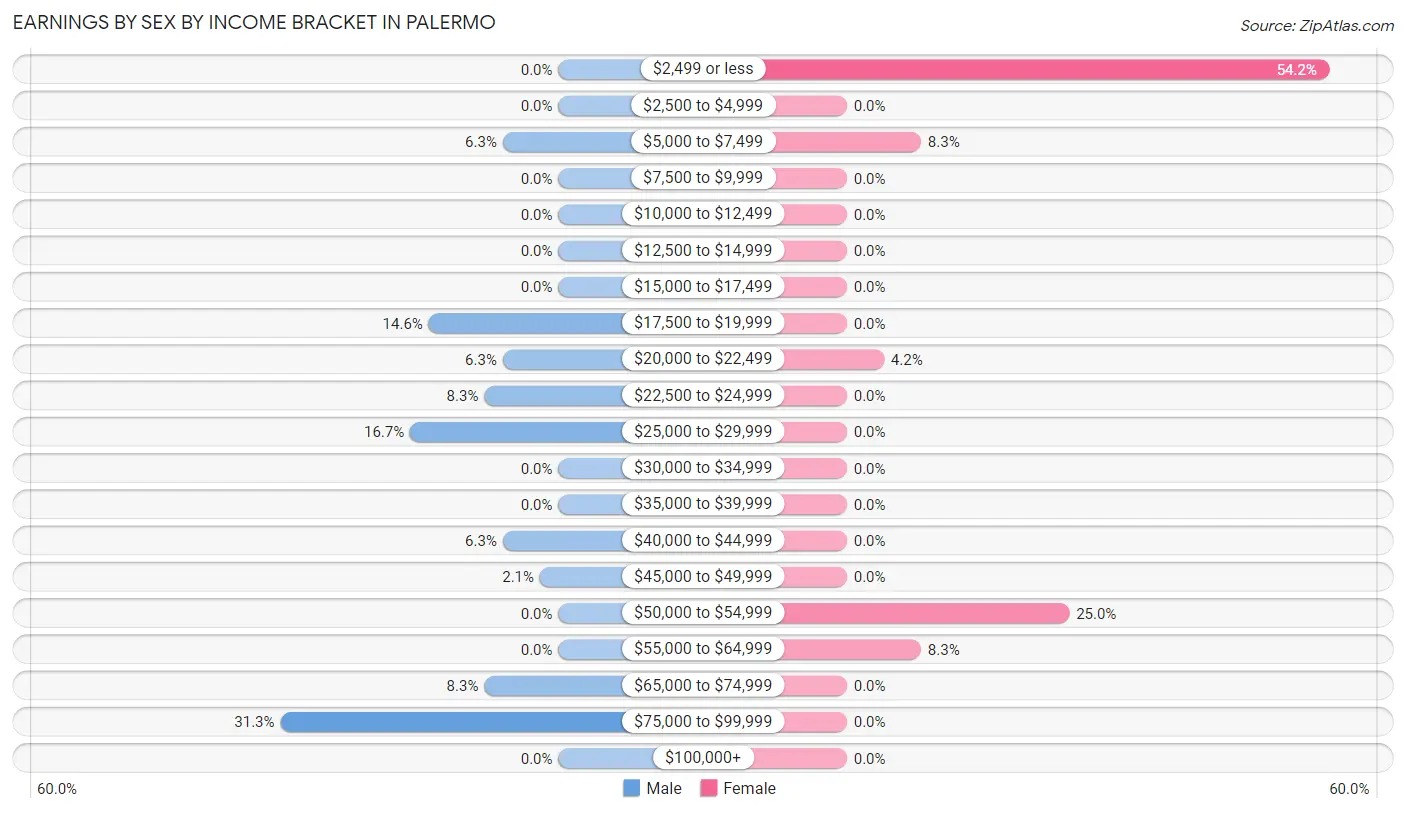
| Income | Male | Female |
| $2,499 or less | 0 (0.0%) | 13 (54.2%) |
| $2,500 to $4,999 | 0 (0.0%) | 0 (0.0%) |
| $5,000 to $7,499 | 3 (6.2%) | 2 (8.3%) |
| $7,500 to $9,999 | 0 (0.0%) | 0 (0.0%) |
| $10,000 to $12,499 | 0 (0.0%) | 0 (0.0%) |
| $12,500 to $14,999 | 0 (0.0%) | 0 (0.0%) |
| $15,000 to $17,499 | 0 (0.0%) | 0 (0.0%) |
| $17,500 to $19,999 | 7 (14.6%) | 0 (0.0%) |
| $20,000 to $22,499 | 3 (6.2%) | 1 (4.2%) |
| $22,500 to $24,999 | 4 (8.3%) | 0 (0.0%) |
| $25,000 to $29,999 | 8 (16.7%) | 0 (0.0%) |
| $30,000 to $34,999 | 0 (0.0%) | 0 (0.0%) |
| $35,000 to $39,999 | 0 (0.0%) | 0 (0.0%) |
| $40,000 to $44,999 | 3 (6.2%) | 0 (0.0%) |
| $45,000 to $49,999 | 1 (2.1%) | 0 (0.0%) |
| $50,000 to $54,999 | 0 (0.0%) | 6 (25.0%) |
| $55,000 to $64,999 | 0 (0.0%) | 2 (8.3%) |
| $65,000 to $74,999 | 4 (8.3%) | 0 (0.0%) |
| $75,000 to $99,999 | 15 (31.2%) | 0 (0.0%) |
| $100,000+ | 0 (0.0%) | 0 (0.0%) |
| Total | 48 (100.0%) | 24 (100.0%) |
Earnings by Sex by Educational Attainment in Palermo
Average earnings in Palermo are $98,000 for men and $2,499 for women, a difference of 97.5%. Men with an educational attainment of high school diploma enjoy the highest average annual earnings of $68,750, while those with high school diploma education earn the least with $68,750. Women with an educational attainment of college or associate's degree earn the most with the average annual earnings of $2,499, while those with college or associate's degree education have the smallest earnings of $2,499.
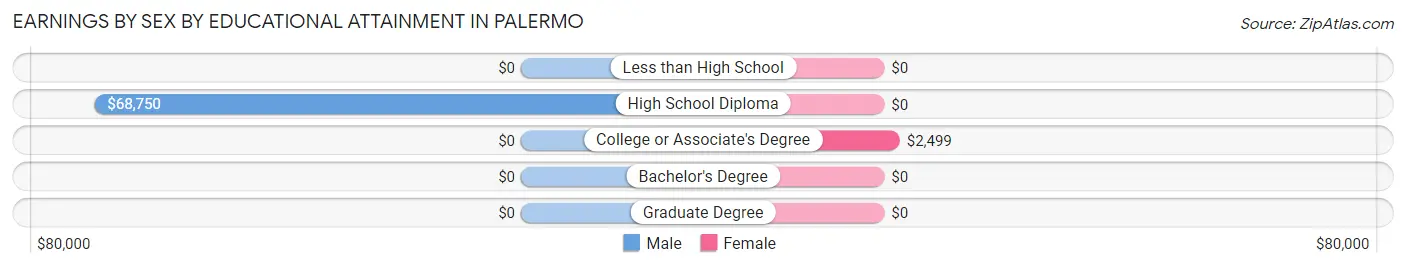
| Educational Attainment | Male Income | Female Income |
| Less than High School | - | - |
| High School Diploma | $68,750 | $0 |
| College or Associate's Degree | - | - |
| Bachelor's Degree | - | - |
| Graduate Degree | - | - |
| Total | $98,000 | $2,499 |
Family Income in Palermo
Family Income Brackets in Palermo
According to the Palermo family income data, there are 11 families falling into the $75,000 to $99,999 income range, which is the most common income bracket and makes up 30.6% of all families.
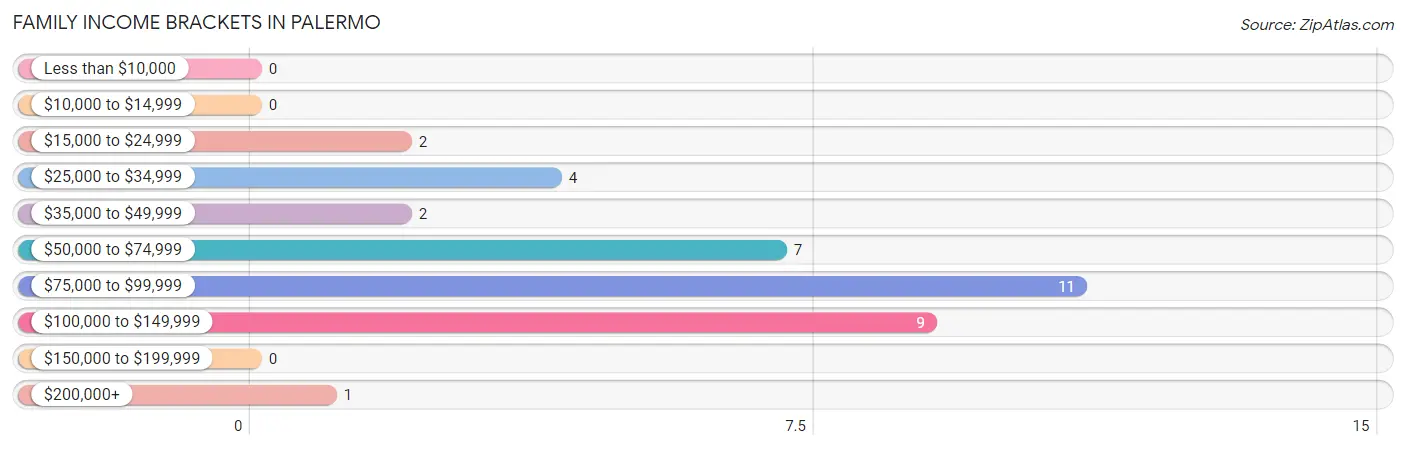
| Income Bracket | # Families | % Families |
| Less than $10,000 | 0 | 0.0% |
| $10,000 to $14,999 | 0 | 0.0% |
| $15,000 to $24,999 | 2 | 5.6% |
| $25,000 to $34,999 | 4 | 11.1% |
| $35,000 to $49,999 | 2 | 5.6% |
| $50,000 to $74,999 | 7 | 19.4% |
| $75,000 to $99,999 | 11 | 30.6% |
| $100,000 to $149,999 | 9 | 25.0% |
| $150,000 to $199,999 | 0 | 0.0% |
| $200,000+ | 1 | 2.8% |
Family Income by Famaliy Size in Palermo
2-person families (19 | 52.8%) account for the highest median family income in Palermo with $76,875 per family, while 2-person families (19 | 52.8%) have the highest median income of $38,438 per family member.
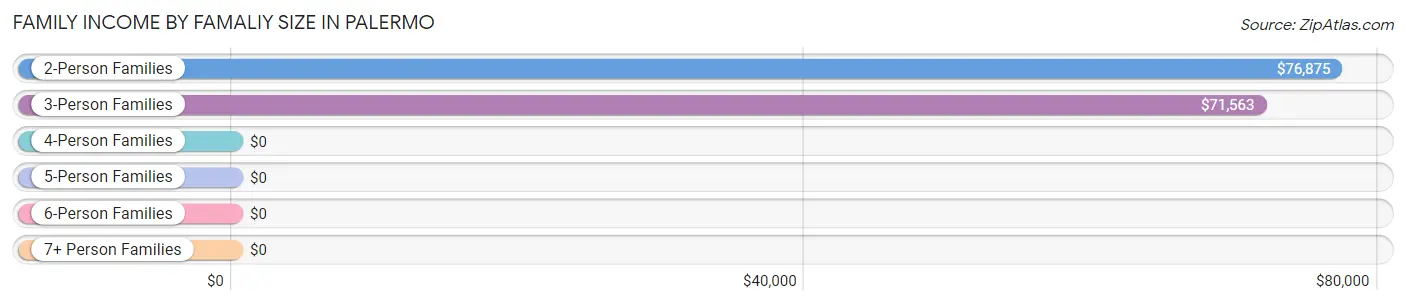
| Income Bracket | # Families | Median Income |
| 2-Person Families | 19 (52.8%) | $76,875 |
| 3-Person Families | 9 (25.0%) | $71,563 |
| 4-Person Families | 7 (19.4%) | $0 |
| 5-Person Families | 1 (2.8%) | $0 |
| 6-Person Families | 0 (0.0%) | $0 |
| 7+ Person Families | 0 (0.0%) | $0 |
| Total | 36 (100.0%) | $76,500 |
Family Income by Number of Earners in Palermo
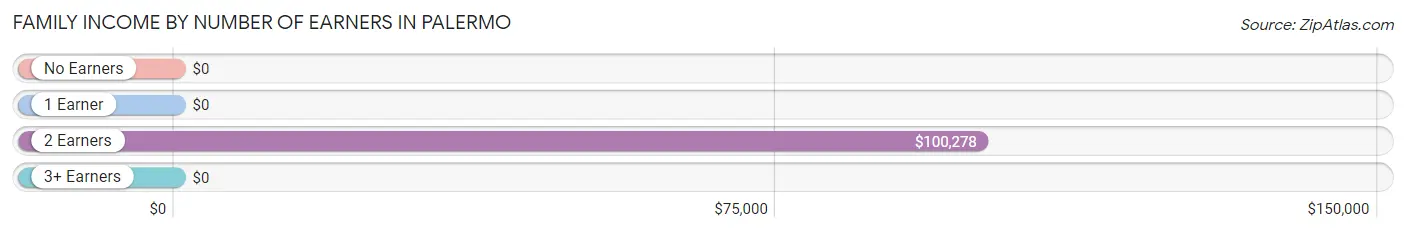
| Number of Earners | # Families | Median Income |
| No Earners | 10 (27.8%) | $0 |
| 1 Earner | 2 (5.6%) | $0 |
| 2 Earners | 18 (50.0%) | $100,278 |
| 3+ Earners | 6 (16.7%) | $0 |
| Total | 36 (100.0%) | $76,500 |
Household Income in Palermo
Household Income Brackets in Palermo
With 16 households falling in the category, the $25,000 to $34,999 income range is the most frequent in Palermo, accounting for 26.2% of all households.
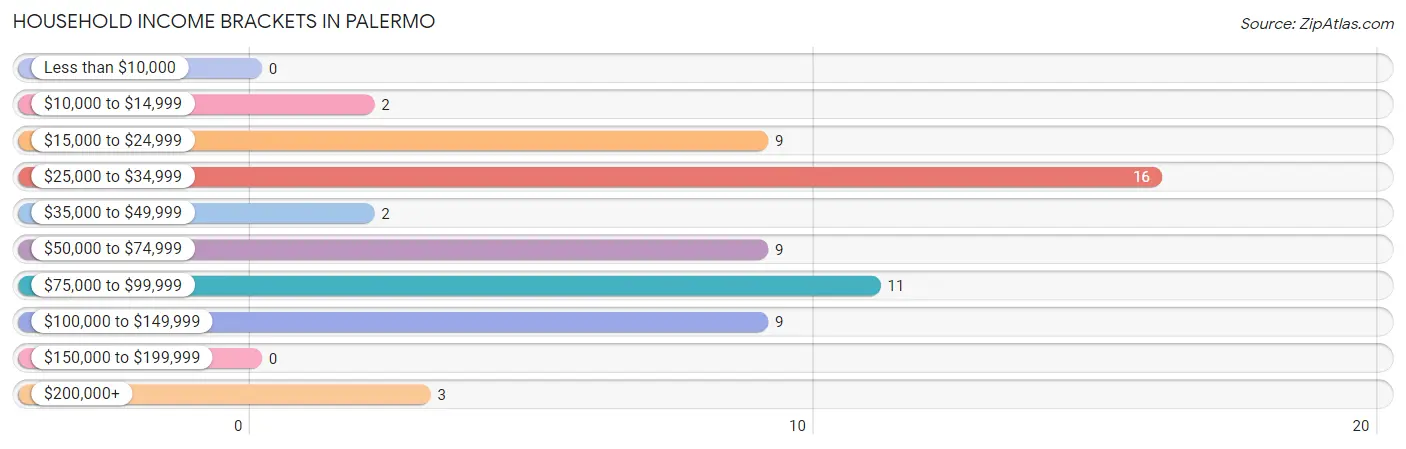
| Income Bracket | # Households | % Households |
| Less than $10,000 | 0 | 0.0% |
| $10,000 to $14,999 | 2 | 3.3% |
| $15,000 to $24,999 | 9 | 14.8% |
| $25,000 to $34,999 | 16 | 26.2% |
| $35,000 to $49,999 | 2 | 3.3% |
| $50,000 to $74,999 | 9 | 14.8% |
| $75,000 to $99,999 | 11 | 18.0% |
| $100,000 to $149,999 | 9 | 14.8% |
| $150,000 to $199,999 | 0 | 0.0% |
| $200,000+ | 3 | 4.9% |
Household Income by Householder Age in Palermo
The median household income in Palermo is $64,375, with the highest median household income of $99,792 found in the 25 to 44 years age bracket for the primary householder. A total of 19 households (31.1%) fall into this category. Meanwhile, the 15 to 24 years age bracket for the primary householder has the lowest median household income of $0, with 7 households (11.5%) in this group.
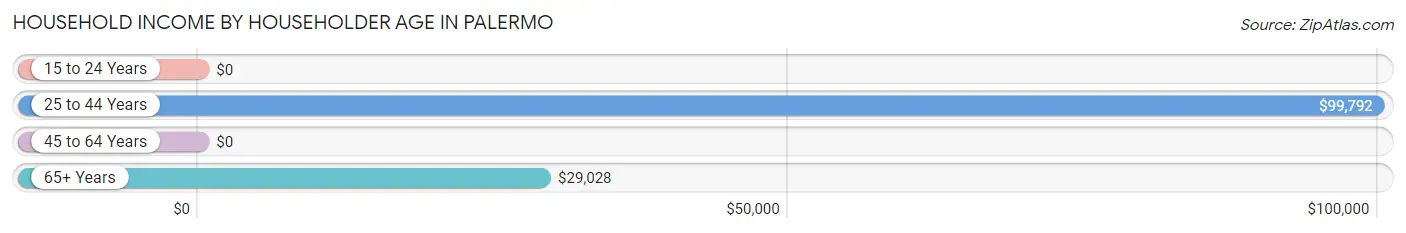
| Income Bracket | # Households | Median Income |
| 15 to 24 Years | 7 (11.5%) | $0 |
| 25 to 44 Years | 19 (31.1%) | $99,792 |
| 45 to 64 Years | 14 (23.0%) | $0 |
| 65+ Years | 21 (34.4%) | $29,028 |
| Total | 61 (100.0%) | $64,375 |
Poverty in Palermo
Income Below Poverty by Sex and Age in Palermo
With 9.9% poverty level for males and 2.0% for females among the residents of Palermo, 35 to 44 year old males and 65 to 74 year old females are the most vulnerable to poverty, with 4 males (100.0%) and 1 females (6.2%) in their respective age groups living below the poverty level.
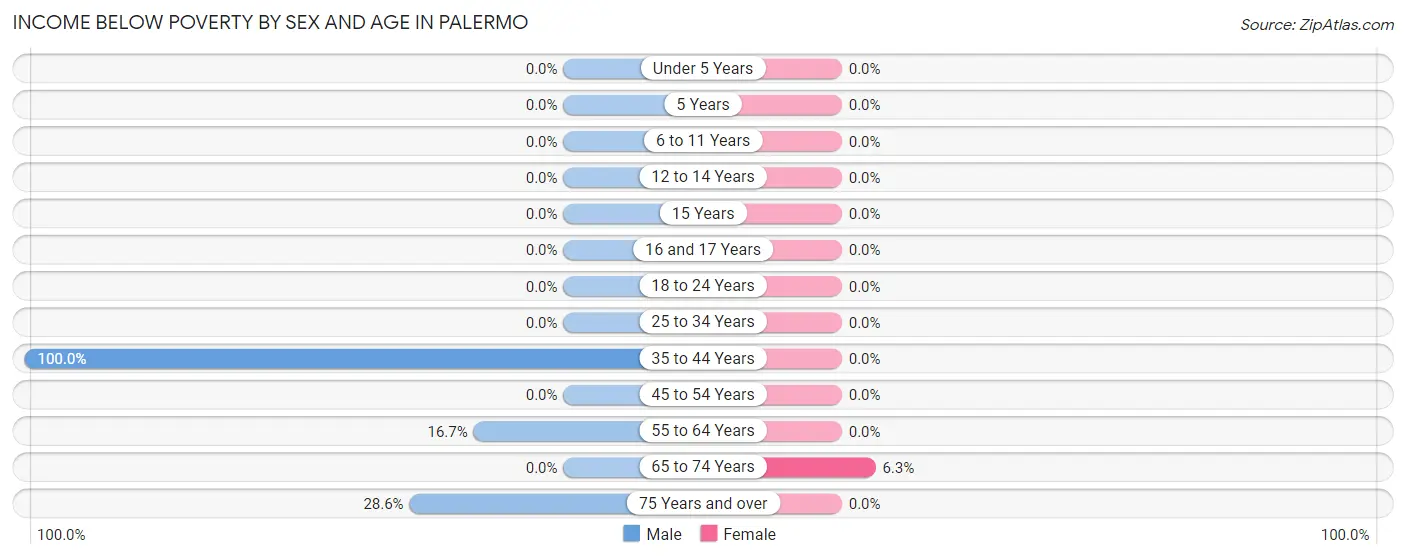
| Age Bracket | Male | Female |
| Under 5 Years | 0 (0.0%) | 0 (0.0%) |
| 5 Years | 0 (0.0%) | 0 (0.0%) |
| 6 to 11 Years | 0 (0.0%) | 0 (0.0%) |
| 12 to 14 Years | 0 (0.0%) | 0 (0.0%) |
| 15 Years | 0 (0.0%) | 0 (0.0%) |
| 16 and 17 Years | 0 (0.0%) | 0 (0.0%) |
| 18 to 24 Years | 0 (0.0%) | 0 (0.0%) |
| 25 to 34 Years | 0 (0.0%) | 0 (0.0%) |
| 35 to 44 Years | 4 (100.0%) | 0 (0.0%) |
| 45 to 54 Years | 0 (0.0%) | 0 (0.0%) |
| 55 to 64 Years | 2 (16.7%) | 0 (0.0%) |
| 65 to 74 Years | 0 (0.0%) | 1 (6.2%) |
| 75 Years and over | 2 (28.6%) | 0 (0.0%) |
| Total | 8 (9.9%) | 1 (2.0%) |
Income Above Poverty by Sex and Age in Palermo
According to the poverty statistics in Palermo, males aged under 5 years and females aged 6 to 11 years are the age groups that are most secure financially, with 100.0% of males and 100.0% of females in these age groups living above the poverty line.
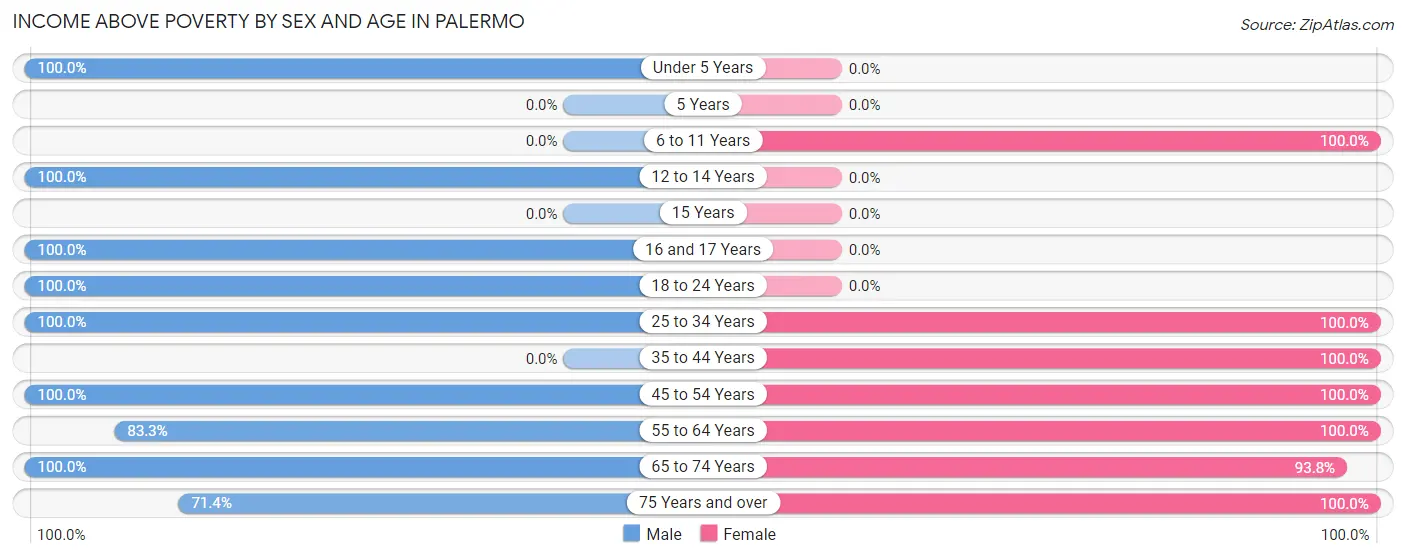
| Age Bracket | Male | Female |
| Under 5 Years | 2 (100.0%) | 0 (0.0%) |
| 5 Years | 0 (0.0%) | 0 (0.0%) |
| 6 to 11 Years | 0 (0.0%) | 1 (100.0%) |
| 12 to 14 Years | 1 (100.0%) | 0 (0.0%) |
| 15 Years | 0 (0.0%) | 0 (0.0%) |
| 16 and 17 Years | 1 (100.0%) | 0 (0.0%) |
| 18 to 24 Years | 24 (100.0%) | 0 (0.0%) |
| 25 to 34 Years | 3 (100.0%) | 4 (100.0%) |
| 35 to 44 Years | 0 (0.0%) | 15 (100.0%) |
| 45 to 54 Years | 18 (100.0%) | 1 (100.0%) |
| 55 to 64 Years | 10 (83.3%) | 10 (100.0%) |
| 65 to 74 Years | 9 (100.0%) | 15 (93.8%) |
| 75 Years and over | 5 (71.4%) | 3 (100.0%) |
| Total | 73 (90.1%) | 49 (98.0%) |
Income Below Poverty Among Married-Couple Families in Palermo
The poverty statistics for married-couple families in Palermo show that 6.2% or 2 of the total 32 families live below the poverty line. Families with no children have the highest poverty rate of 7.4%, comprising of 2 families. On the other hand, families with 1 or 2 children have the lowest poverty rate of 0.0%, which includes 0 families.
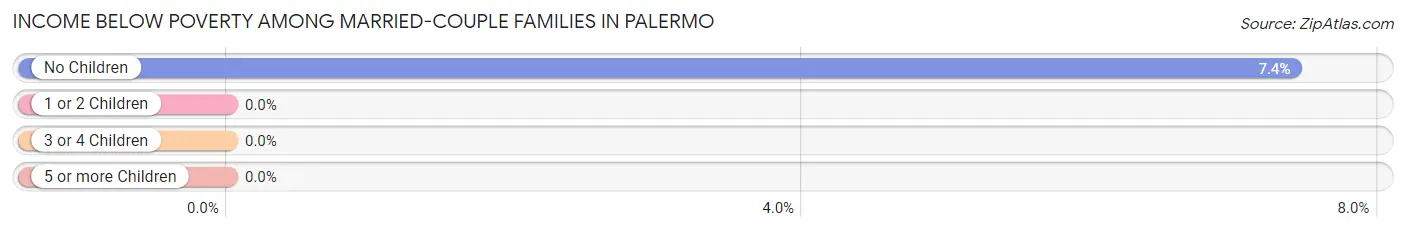
| Children | Above Poverty | Below Poverty |
| No Children | 25 (92.6%) | 2 (7.4%) |
| 1 or 2 Children | 5 (100.0%) | 0 (0.0%) |
| 3 or 4 Children | 0 (0.0%) | 0 (0.0%) |
| 5 or more Children | 0 (0.0%) | 0 (0.0%) |
| Total | 30 (93.8%) | 2 (6.2%) |
Income Below Poverty Among Single-Parent Households in Palermo
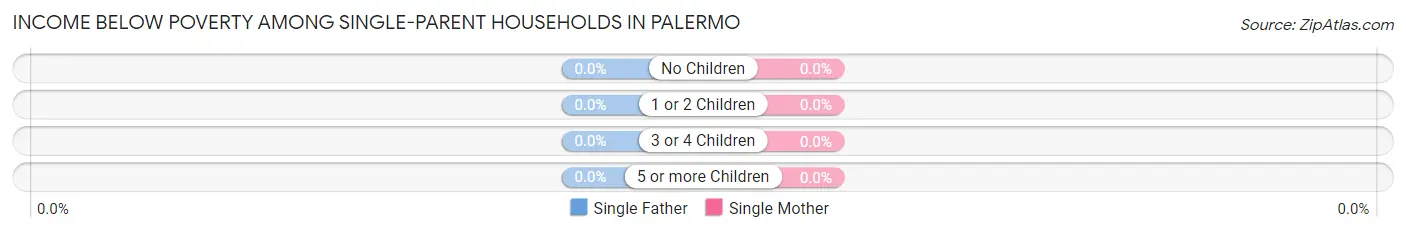
| Children | Single Father | Single Mother |
| No Children | 0 (0.0%) | 0 (0.0%) |
| 1 or 2 Children | 0 (0.0%) | 0 (0.0%) |
| 3 or 4 Children | 0 (0.0%) | 0 (0.0%) |
| 5 or more Children | 0 (0.0%) | 0 (0.0%) |
| Total | 0 (0.0%) | 0 (0.0%) |
Income Below Poverty Among Married-Couple vs Single-Parent Households in Palermo
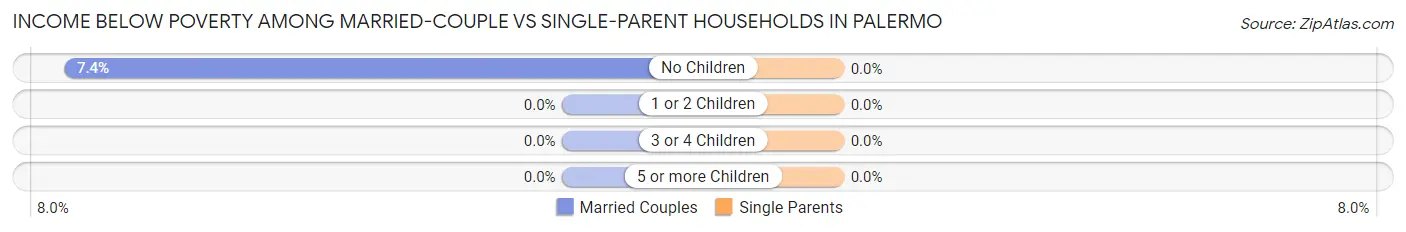
| Children | Married-Couple Families | Single-Parent Households |
| No Children | 2 (7.4%) | 0 (0.0%) |
| 1 or 2 Children | 0 (0.0%) | 0 (0.0%) |
| 3 or 4 Children | 0 (0.0%) | 0 (0.0%) |
| 5 or more Children | 0 (0.0%) | 0 (0.0%) |
| Total | 2 (6.2%) | 0 (0.0%) |
Race in Palermo
The most populous races in Palermo are White / Caucasian (129 | 98.5%), and Two or more Races (2 | 1.5%).
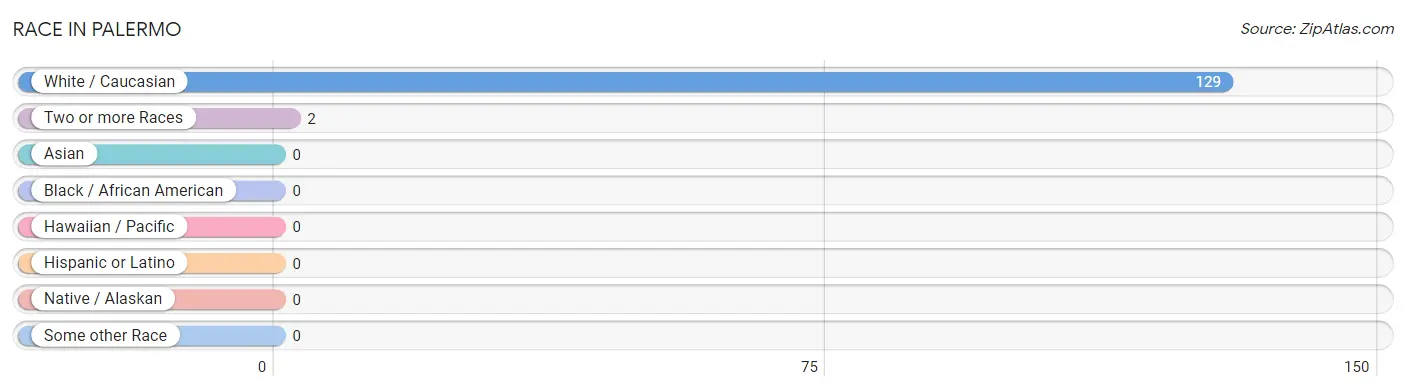
| Race | # Population | % Population |
| Asian | 0 | 0.0% |
| Black / African American | 0 | 0.0% |
| Hawaiian / Pacific | 0 | 0.0% |
| Hispanic or Latino | 0 | 0.0% |
| Native / Alaskan | 0 | 0.0% |
| White / Caucasian | 129 | 98.5% |
| Two or more Races | 2 | 1.5% |
| Some other Race | 0 | 0.0% |
| Total | 131 | 100.0% |
Ancestry in Palermo
The most populous ancestries reported in Palermo are German (29 | 22.1%), Norwegian (27 | 20.6%), English (14 | 10.7%), Scottish (9 | 6.9%), and American (7 | 5.3%), together accounting for 65.6% of all Palermo residents.
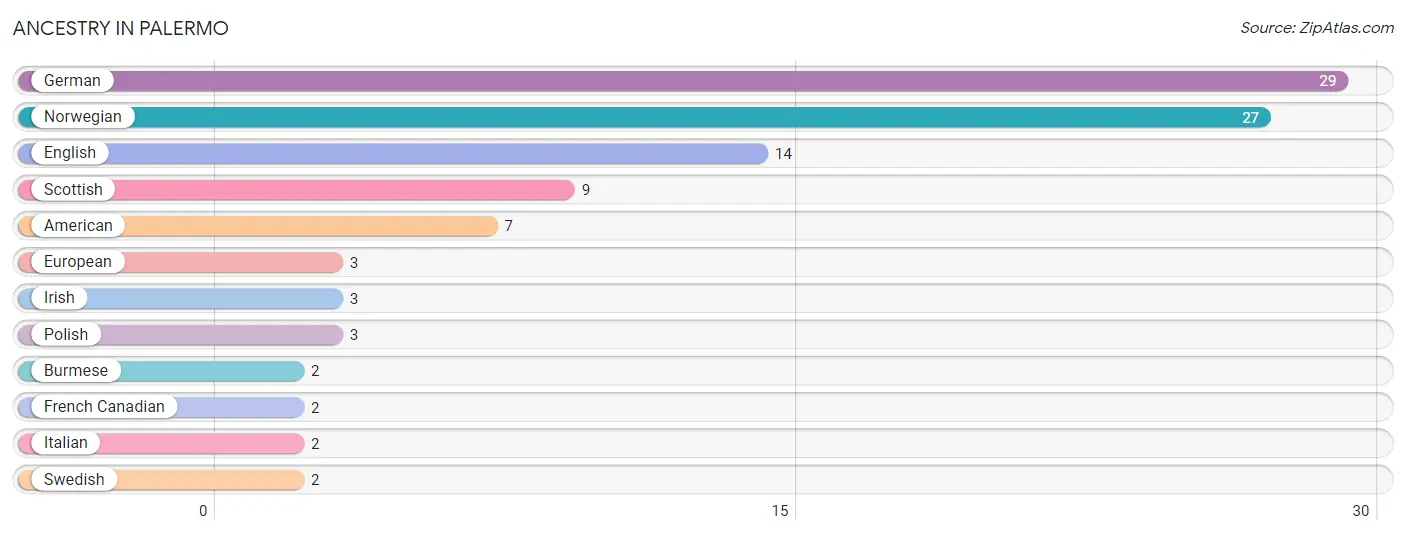
| Ancestry | # Population | % Population |
| American | 7 | 5.3% |
| Burmese | 2 | 1.5% |
| English | 14 | 10.7% |
| European | 3 | 2.3% |
| French Canadian | 2 | 1.5% |
| German | 29 | 22.1% |
| Irish | 3 | 2.3% |
| Italian | 2 | 1.5% |
| Norwegian | 27 | 20.6% |
| Polish | 3 | 2.3% |
| Scottish | 9 | 6.9% |
| Swedish | 2 | 1.5% | View All 12 Rows |
Immigrants in Palermo
The most numerous immigrant groups reported in Palermo came from , and Canada (2 | 1.5%), together accounting for 1.5% of all Palermo residents.

| Immigration Origin | # Population | % Population |
| Canada | 2 | 1.5% | View All 1 Rows |
Sex and Age in Palermo
Sex and Age in Palermo
The most populous age groups in Palermo are 45 to 49 Years (15 | 18.5%) for men and 70 to 74 Years (14 | 28.0%) for women.
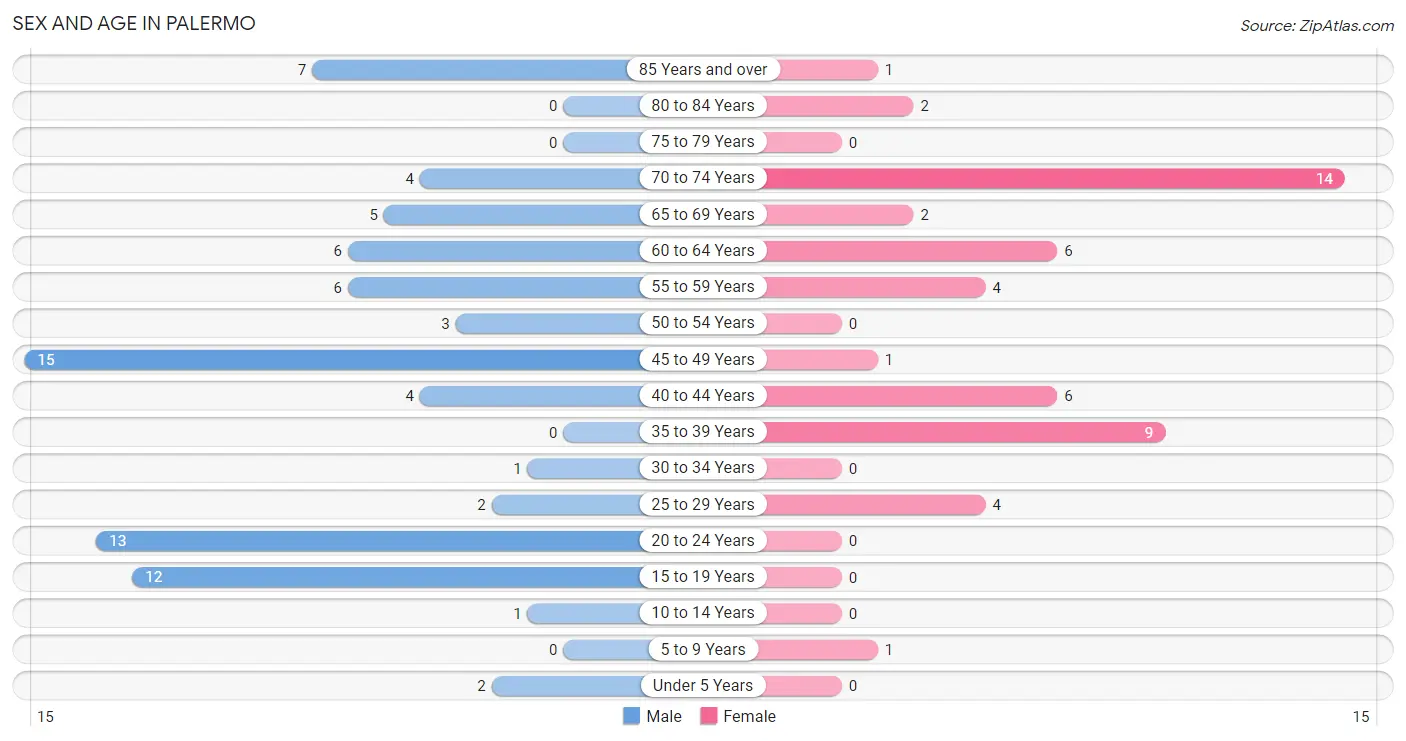
| Age Bracket | Male | Female |
| Under 5 Years | 2 (2.5%) | 0 (0.0%) |
| 5 to 9 Years | 0 (0.0%) | 1 (2.0%) |
| 10 to 14 Years | 1 (1.2%) | 0 (0.0%) |
| 15 to 19 Years | 12 (14.8%) | 0 (0.0%) |
| 20 to 24 Years | 13 (16.1%) | 0 (0.0%) |
| 25 to 29 Years | 2 (2.5%) | 4 (8.0%) |
| 30 to 34 Years | 1 (1.2%) | 0 (0.0%) |
| 35 to 39 Years | 0 (0.0%) | 9 (18.0%) |
| 40 to 44 Years | 4 (4.9%) | 6 (12.0%) |
| 45 to 49 Years | 15 (18.5%) | 1 (2.0%) |
| 50 to 54 Years | 3 (3.7%) | 0 (0.0%) |
| 55 to 59 Years | 6 (7.4%) | 4 (8.0%) |
| 60 to 64 Years | 6 (7.4%) | 6 (12.0%) |
| 65 to 69 Years | 5 (6.2%) | 2 (4.0%) |
| 70 to 74 Years | 4 (4.9%) | 14 (28.0%) |
| 75 to 79 Years | 0 (0.0%) | 0 (0.0%) |
| 80 to 84 Years | 0 (0.0%) | 2 (4.0%) |
| 85 Years and over | 7 (8.6%) | 1 (2.0%) |
| Total | 81 (100.0%) | 50 (100.0%) |
Families and Households in Palermo
Median Family Size in Palermo
The median family size in Palermo is 2.94 persons per family, with single female/mother families (1 | 2.8%) accounting for the largest median family size of 7 persons per family. On the other hand, married-couple families (32 | 88.9%) represent the smallest median family size with 2.75 persons per family.
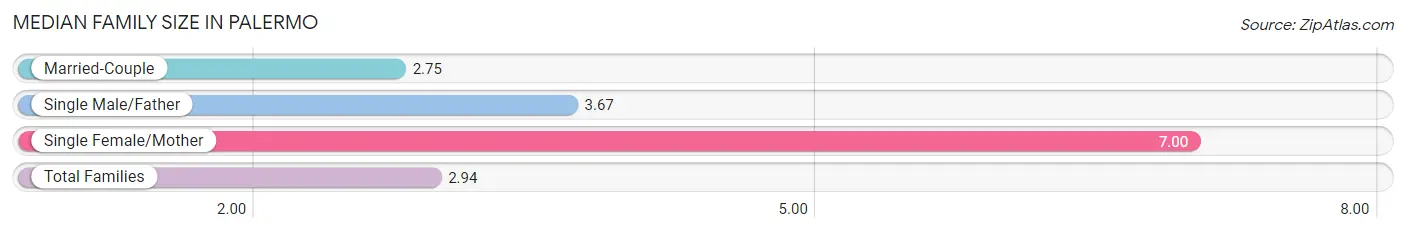
| Family Type | # Families | Family Size |
| Married-Couple | 32 (88.9%) | 2.75 |
| Single Male/Father | 3 (8.3%) | 3.67 |
| Single Female/Mother | 1 (2.8%) | 7.00 |
| Total Families | 36 (100.0%) | 2.94 |
Median Household Size in Palermo
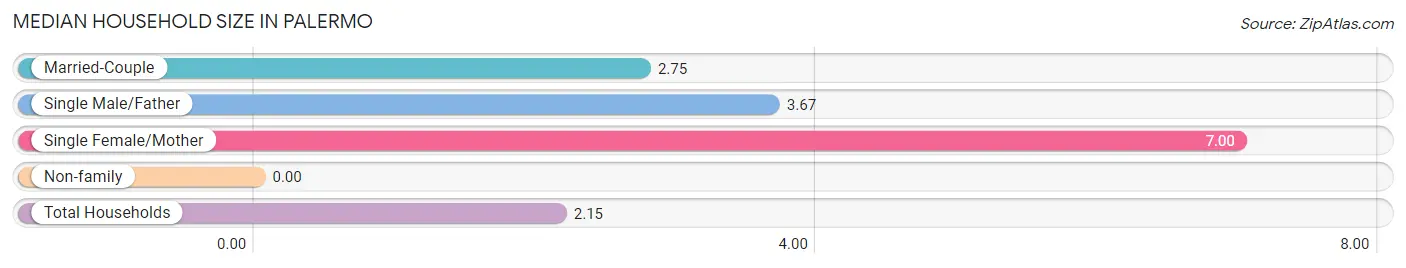
| Household Type | # Households | Household Size |
| Married-Couple | 32 (52.5%) | 2.75 |
| Single Male/Father | 3 (4.9%) | 3.67 |
| Single Female/Mother | 1 (1.6%) | 7.00 |
| Non-family | 25 (41.0%) | - |
| Total Households | 61 (100.0%) | 2.15 |
Household Size by Marriage Status in Palermo
Out of a total of 61 households in Palermo, 36 (59.0%) are family households, while 25 (41.0%) are nonfamily households. The most numerous type of family households are 2-person households, comprising 19, and the most common type of nonfamily households are 1-person households, comprising 25.
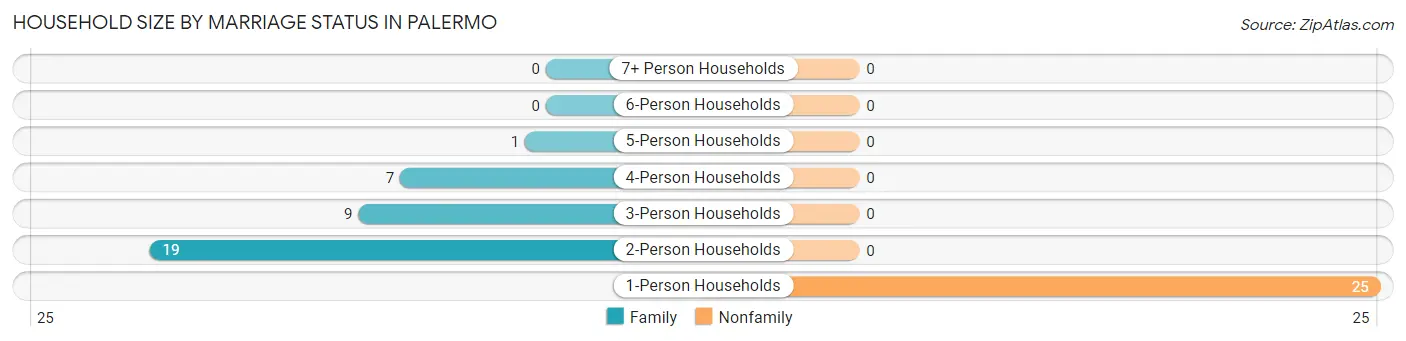
| Household Size | Family Households | Nonfamily Households |
| 1-Person Households | - | 25 (41.0%) |
| 2-Person Households | 19 (31.1%) | 0 (0.0%) |
| 3-Person Households | 9 (14.7%) | 0 (0.0%) |
| 4-Person Households | 7 (11.5%) | 0 (0.0%) |
| 5-Person Households | 1 (1.6%) | 0 (0.0%) |
| 6-Person Households | 0 (0.0%) | 0 (0.0%) |
| 7+ Person Households | 0 (0.0%) | 0 (0.0%) |
| Total | 36 (59.0%) | 25 (41.0%) |
Female Fertility in Palermo
Fertility by Age in Palermo
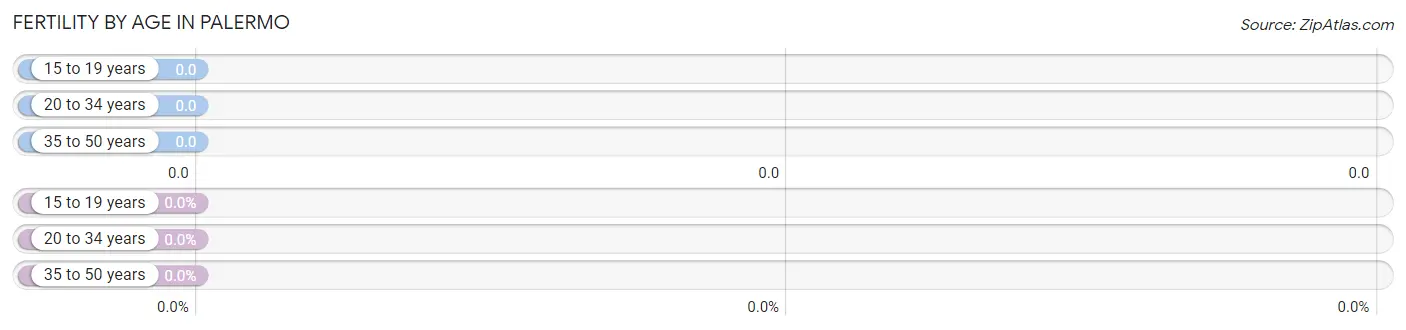
| Age Bracket | Women with Births | Births / 1,000 Women |
| 15 to 19 years | 0 (0.0%) | 0.0 |
| 20 to 34 years | 0 (0.0%) | 0.0 |
| 35 to 50 years | 0 (0.0%) | 0.0 |
| Total | 0 (0.0%) | 0.0 |
Fertility by Age by Marriage Status in Palermo
| Age Bracket | Married | Unmarried |
| 15 to 19 years | 0 (0.0%) | 0 (0.0%) |
| 20 to 34 years | 0 (0.0%) | 0 (0.0%) |
| 35 to 50 years | 0 (0.0%) | 0 (0.0%) |
| Total | 0 (0.0%) | 0 (0.0%) |
Fertility by Education in Palermo
| Educational Attainment | Women with Births | Births / 1,000 Women |
| Less than High School | 0 (0.0%) | 0.0 |
| High School Diploma | 0 (0.0%) | 0.0 |
| College or Associate's Degree | 0 (0.0%) | 0.0 |
| Bachelor's Degree | 0 (0.0%) | 0.0 |
| Graduate Degree | 0 (0.0%) | 0.0 |
| Total | 0 (0.0%) | 0.0 |
Fertility by Education by Marriage Status in Palermo
| Educational Attainment | Married | Unmarried |
| Less than High School | 0 (0.0%) | 0 (0.0%) |
| High School Diploma | 0 (0.0%) | 0 (0.0%) |
| College or Associate's Degree | 0 (0.0%) | 0 (0.0%) |
| Bachelor's Degree | 0 (0.0%) | 0 (0.0%) |
| Graduate Degree | 0 (0.0%) | 0 (0.0%) |
| Total | 0 (0.0%) | 0 (0.0%) |
Employment Characteristics in Palermo
Employment by Class of Employer in Palermo
Among the 62 employed individuals in Palermo, private company employees (30 | 48.4%), self-employed (not incorporated) (19 | 30.6%), and local government employees (10 | 16.1%) make up the most common classes of employment.
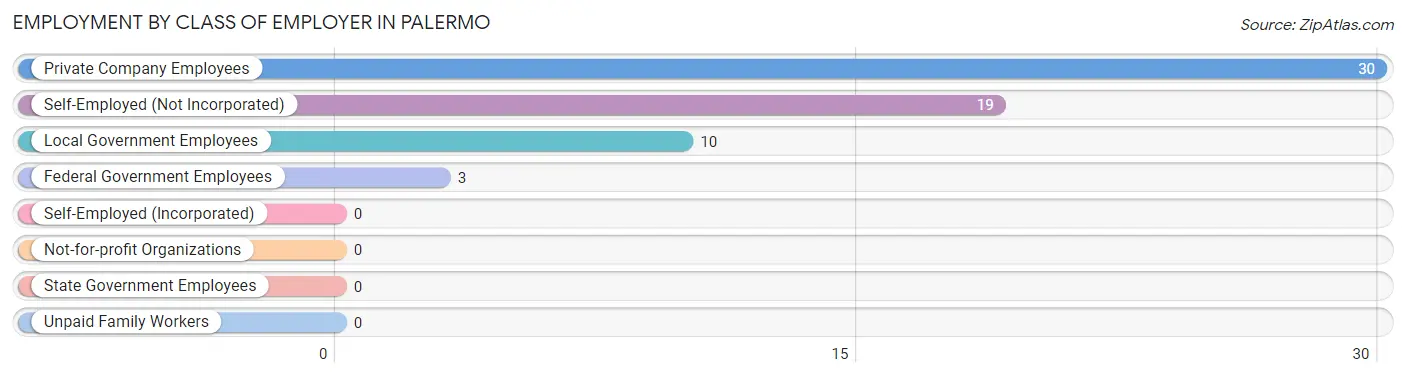
| Employer Class | # Employees | % Employees |
| Private Company Employees | 30 | 48.4% |
| Self-Employed (Incorporated) | 0 | 0.0% |
| Self-Employed (Not Incorporated) | 19 | 30.6% |
| Not-for-profit Organizations | 0 | 0.0% |
| Local Government Employees | 10 | 16.1% |
| State Government Employees | 0 | 0.0% |
| Federal Government Employees | 3 | 4.8% |
| Unpaid Family Workers | 0 | 0.0% |
| Total | 62 | 100.0% |
Employment Status by Age in Palermo
According to the labor force statistics for Palermo, out of the total population over 16 years of age (127), 49.6% or 63 individuals are in the labor force, with 1.6% or 1 of them unemployed. The age group with the highest labor force participation rate is 20 to 24 years, with 100.0% or 13 individuals in the labor force. Within the labor force, the 30 to 34 years age range has the highest percentage of unemployed individuals, with 100.0% or 1 of them being unemployed.
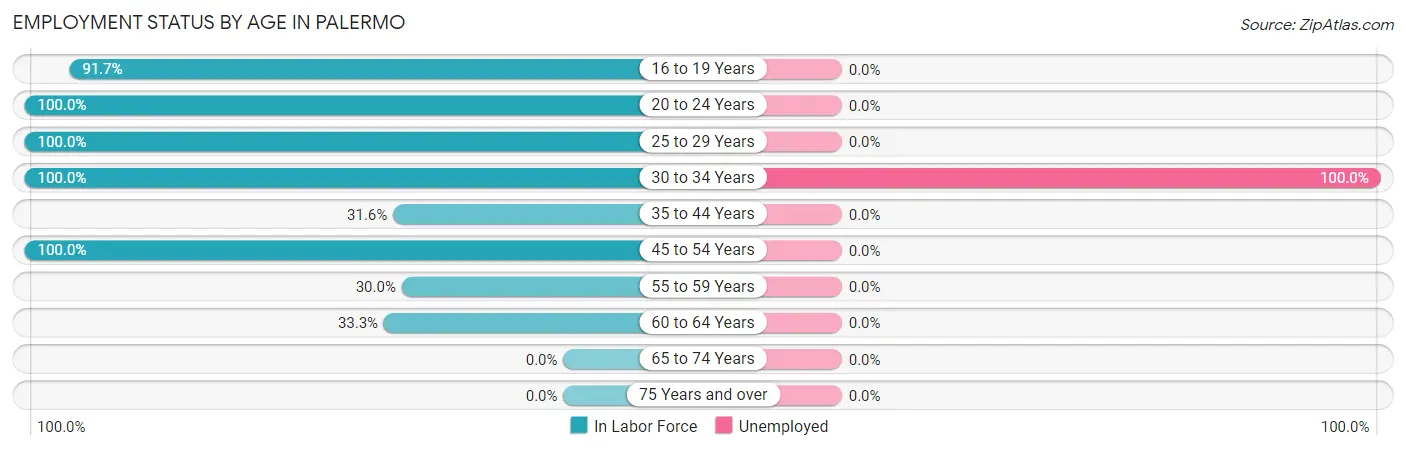
| Age Bracket | In Labor Force | Unemployed |
| 16 to 19 Years | 11 (91.7%) | 0 (0.0%) |
| 20 to 24 Years | 13 (100.0%) | 0 (0.0%) |
| 25 to 29 Years | 6 (100.0%) | 0 (0.0%) |
| 30 to 34 Years | 1 (100.0%) | 1 (100.0%) |
| 35 to 44 Years | 6 (31.6%) | 0 (0.0%) |
| 45 to 54 Years | 19 (100.0%) | 0 (0.0%) |
| 55 to 59 Years | 3 (30.0%) | 0 (0.0%) |
| 60 to 64 Years | 4 (33.3%) | 0 (0.0%) |
| 65 to 74 Years | 0 (0.0%) | 0 (0.0%) |
| 75 Years and over | 0 (0.0%) | 0 (0.0%) |
| Total | 63 (49.6%) | 1 (1.6%) |
Employment Status by Educational Attainment in Palermo
According to labor force statistics for Palermo, 58.2% of individuals (39) out of the total population between 25 and 64 years of age (67) are in the labor force, with 2.6% or 1 of them being unemployed. The group with the highest labor force participation rate are those with the educational attainment of bachelor's degree or higher, with 100.0% or 6 individuals in the labor force. Within the labor force, individuals with high school diploma education have the highest percentage of unemployment, with 11.1% or 1 of them being unemployed.
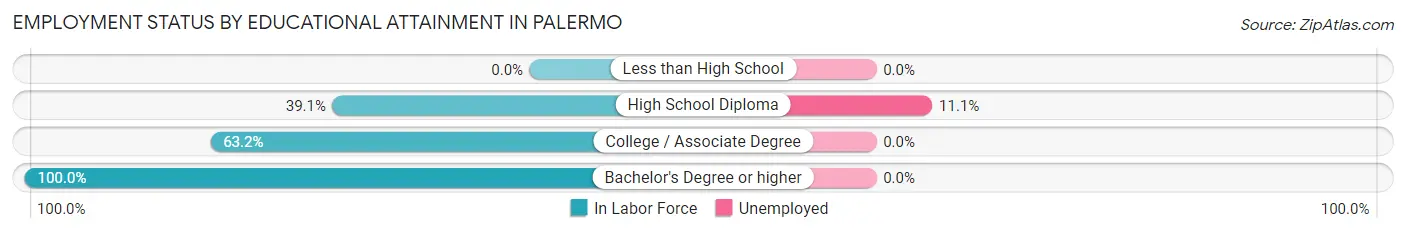
| Educational Attainment | In Labor Force | Unemployed |
| Less than High School | 0 (0.0%) | 0 (0.0%) |
| High School Diploma | 9 (39.1%) | 3 (11.1%) |
| College / Associate Degree | 24 (63.2%) | 0 (0.0%) |
| Bachelor's Degree or higher | 6 (100.0%) | 0 (0.0%) |
| Total | 39 (58.2%) | 2 (2.6%) |
Employment Occupations by Sex in Palermo
Management, Business, Science and Arts Occupations
The most common Management, Business, Science and Arts occupations in Palermo are Community & Social Service (7 | 11.3%), Arts, Media & Entertainment (4 | 6.5%), Education Instruction & Library (3 | 4.8%), and Management (2 | 3.2%).
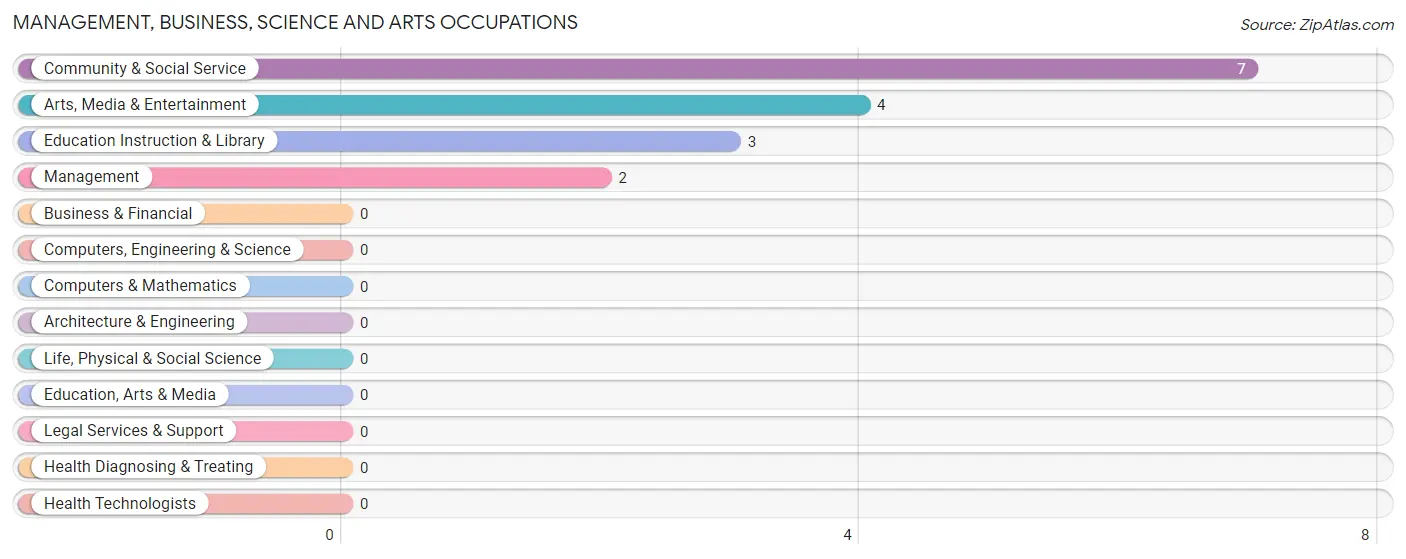
Management, Business, Science and Arts Occupations by Sex
Within the Management, Business, Science and Arts occupations in Palermo, the most male-oriented occupations are Management (100.0%), Education Instruction & Library (100.0%), and Community & Social Service (42.9%), while the most female-oriented occupations are Arts, Media & Entertainment (100.0%), and Community & Social Service (57.1%).
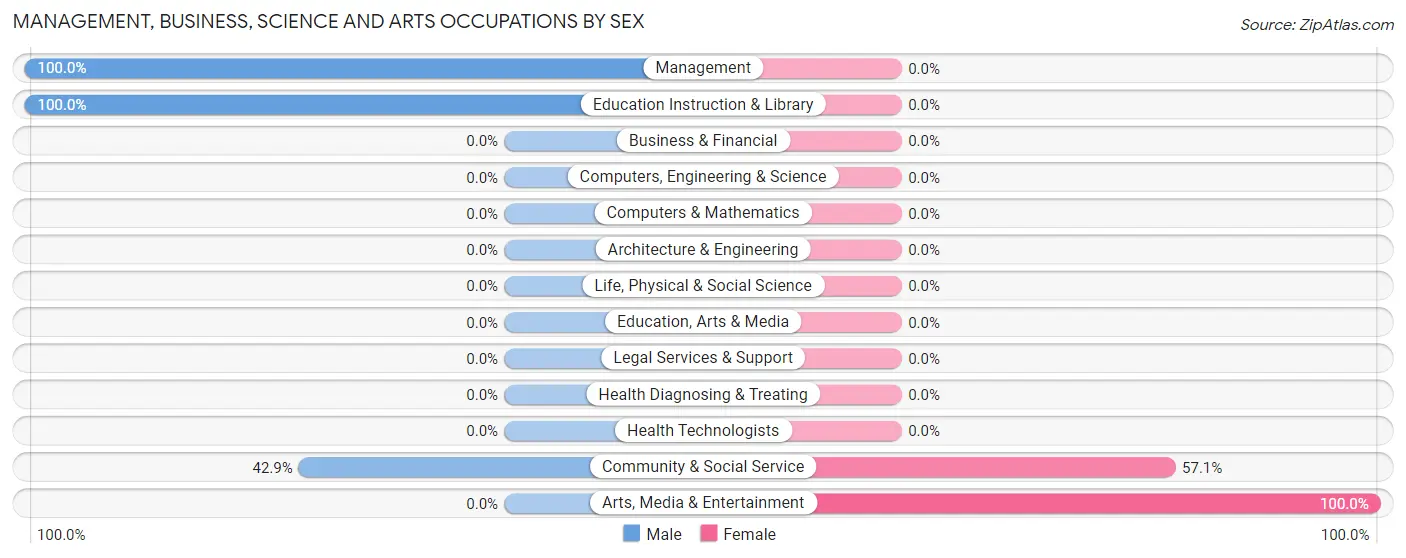
| Occupation | Male | Female |
| Management | 2 (100.0%) | 0 (0.0%) |
| Business & Financial | 0 (0.0%) | 0 (0.0%) |
| Computers, Engineering & Science | 0 (0.0%) | 0 (0.0%) |
| Computers & Mathematics | 0 (0.0%) | 0 (0.0%) |
| Architecture & Engineering | 0 (0.0%) | 0 (0.0%) |
| Life, Physical & Social Science | 0 (0.0%) | 0 (0.0%) |
| Community & Social Service | 3 (42.9%) | 4 (57.1%) |
| Education, Arts & Media | 0 (0.0%) | 0 (0.0%) |
| Legal Services & Support | 0 (0.0%) | 0 (0.0%) |
| Education Instruction & Library | 3 (100.0%) | 0 (0.0%) |
| Arts, Media & Entertainment | 0 (0.0%) | 4 (100.0%) |
| Health Diagnosing & Treating | 0 (0.0%) | 0 (0.0%) |
| Health Technologists | 0 (0.0%) | 0 (0.0%) |
| Total (Category) | 5 (55.6%) | 4 (44.4%) |
| Total (Overall) | 47 (75.8%) | 15 (24.2%) |
Services Occupations
The most common Services occupations in Palermo are Security & Protection (5 | 8.1%), Firefighting & Prevention (3 | 4.8%), Food Preparation & Serving (3 | 4.8%), and Law Enforcement (2 | 3.2%).
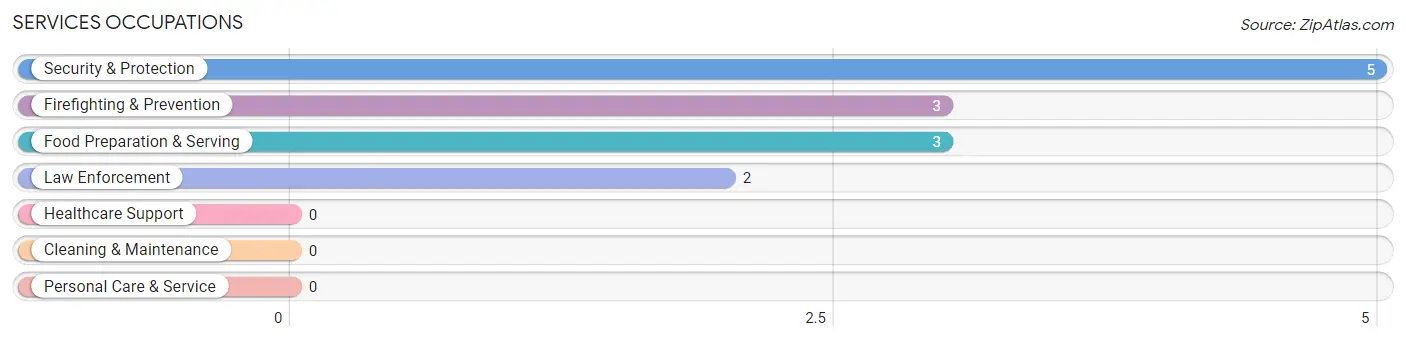
Services Occupations by Sex
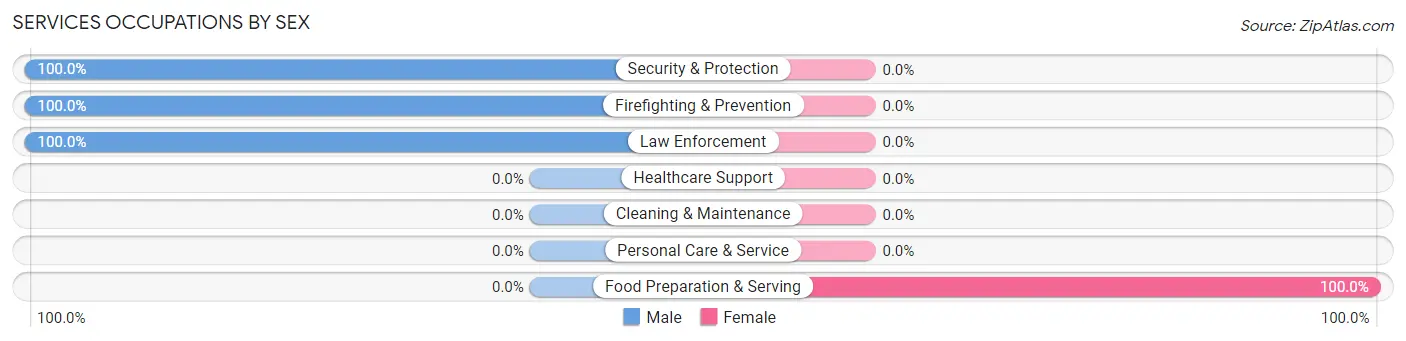
| Occupation | Male | Female |
| Healthcare Support | 0 (0.0%) | 0 (0.0%) |
| Security & Protection | 5 (100.0%) | 0 (0.0%) |
| Firefighting & Prevention | 3 (100.0%) | 0 (0.0%) |
| Law Enforcement | 2 (100.0%) | 0 (0.0%) |
| Food Preparation & Serving | 0 (0.0%) | 3 (100.0%) |
| Cleaning & Maintenance | 0 (0.0%) | 0 (0.0%) |
| Personal Care & Service | 0 (0.0%) | 0 (0.0%) |
| Total (Category) | 5 (62.5%) | 3 (37.5%) |
| Total (Overall) | 47 (75.8%) | 15 (24.2%) |
Sales and Office Occupations
The most common Sales and Office occupations in Palermo are Sales & Related (13 | 21.0%), and Office & Administration (2 | 3.2%).

Sales and Office Occupations by Sex

| Occupation | Male | Female |
| Sales & Related | 7 (53.8%) | 6 (46.2%) |
| Office & Administration | 0 (0.0%) | 2 (100.0%) |
| Total (Category) | 7 (46.7%) | 8 (53.3%) |
| Total (Overall) | 47 (75.8%) | 15 (24.2%) |
Natural Resources, Construction and Maintenance Occupations
The most common Natural Resources, Construction and Maintenance occupations in Palermo are , and Construction & Extraction (18 | 29.0%).
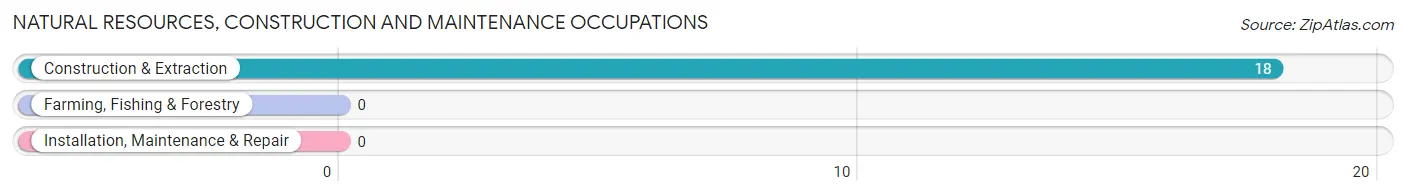
Natural Resources, Construction and Maintenance Occupations by Sex
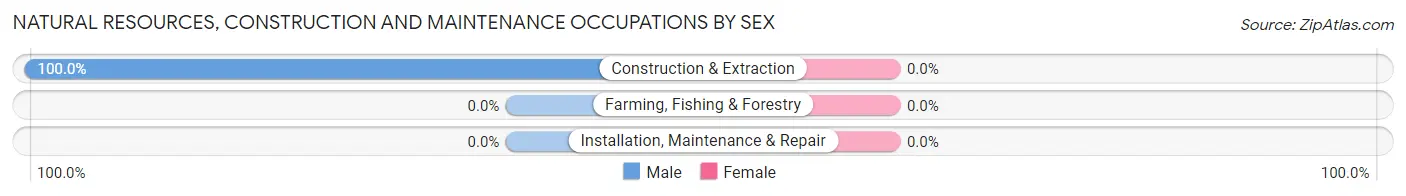
| Occupation | Male | Female |
| Farming, Fishing & Forestry | 0 (0.0%) | 0 (0.0%) |
| Construction & Extraction | 18 (100.0%) | 0 (0.0%) |
| Installation, Maintenance & Repair | 0 (0.0%) | 0 (0.0%) |
| Total (Category) | 18 (100.0%) | 0 (0.0%) |
| Total (Overall) | 47 (75.8%) | 15 (24.2%) |
Production, Transportation and Moving Occupations
The most common Production, Transportation and Moving occupations in Palermo are Material Moving (7 | 11.3%), and Production (5 | 8.1%).
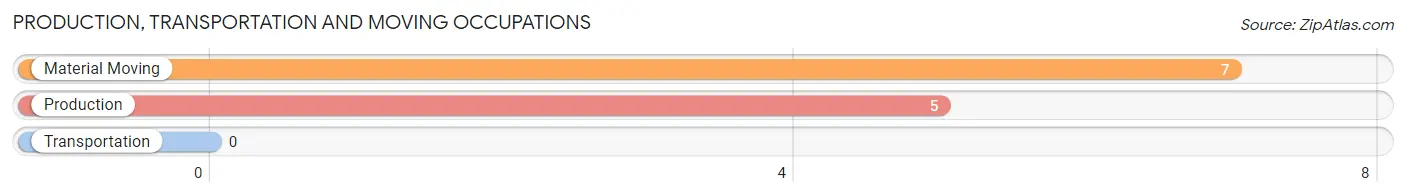
Production, Transportation and Moving Occupations by Sex
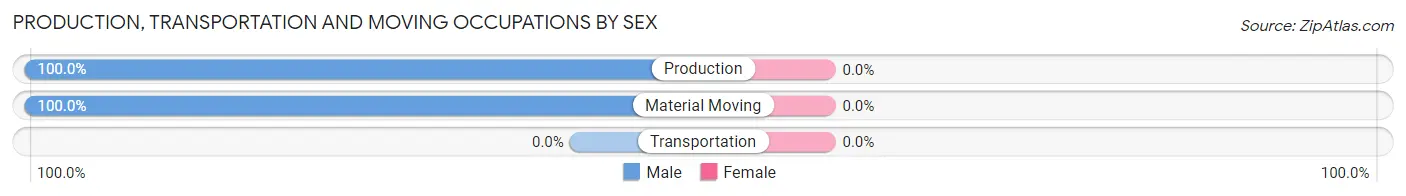
| Occupation | Male | Female |
| Production | 5 (100.0%) | 0 (0.0%) |
| Transportation | 0 (0.0%) | 0 (0.0%) |
| Material Moving | 7 (100.0%) | 0 (0.0%) |
| Total (Category) | 12 (100.0%) | 0 (0.0%) |
| Total (Overall) | 47 (75.8%) | 15 (24.2%) |
Employment Industries by Sex in Palermo
Employment Industries in Palermo
The major employment industries in Palermo include Construction (22 | 35.5%), Retail Trade (22 | 35.5%), Public Administration (5 | 8.1%), Arts, Entertainment & Recreation (4 | 6.5%), and Educational Services (3 | 4.8%).
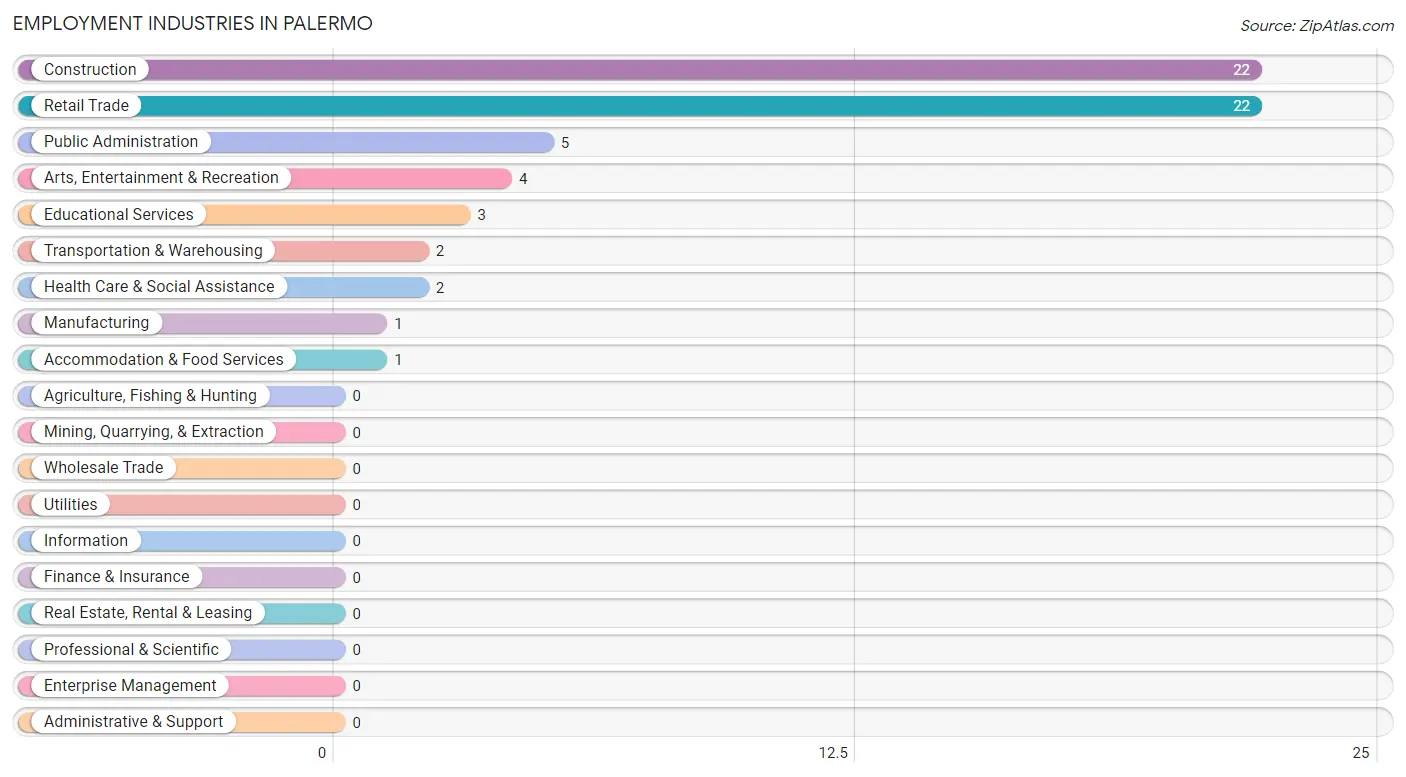
Employment Industries by Sex in Palermo
The Palermo industries that see more men than women are Construction (100.0%), Manufacturing (100.0%), and Transportation & Warehousing (100.0%), whereas the industries that tend to have a higher number of women are Health Care & Social Assistance (100.0%), Arts, Entertainment & Recreation (100.0%), and Accommodation & Food Services (100.0%).
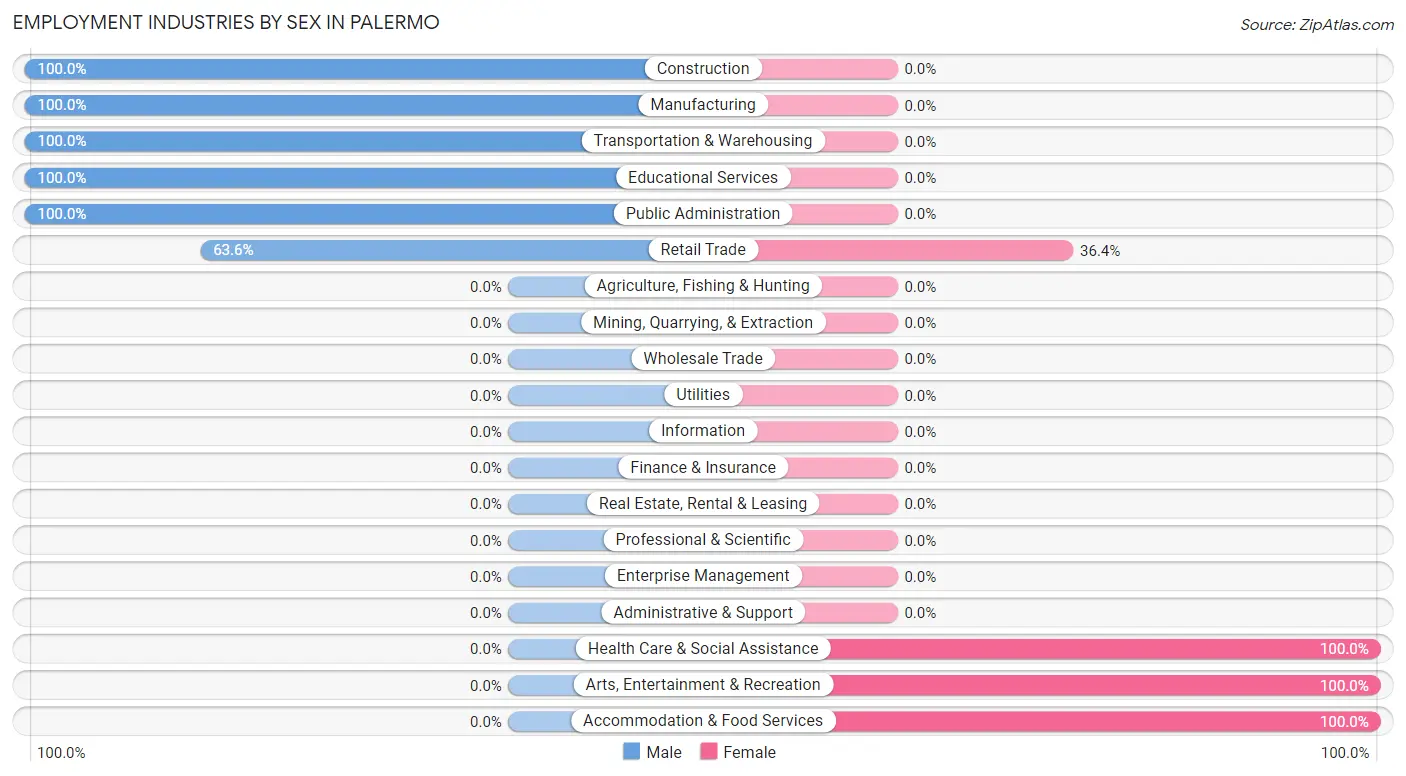
| Industry | Male | Female |
| Agriculture, Fishing & Hunting | 0 (0.0%) | 0 (0.0%) |
| Mining, Quarrying, & Extraction | 0 (0.0%) | 0 (0.0%) |
| Construction | 22 (100.0%) | 0 (0.0%) |
| Manufacturing | 1 (100.0%) | 0 (0.0%) |
| Wholesale Trade | 0 (0.0%) | 0 (0.0%) |
| Retail Trade | 14 (63.6%) | 8 (36.4%) |
| Transportation & Warehousing | 2 (100.0%) | 0 (0.0%) |
| Utilities | 0 (0.0%) | 0 (0.0%) |
| Information | 0 (0.0%) | 0 (0.0%) |
| Finance & Insurance | 0 (0.0%) | 0 (0.0%) |
| Real Estate, Rental & Leasing | 0 (0.0%) | 0 (0.0%) |
| Professional & Scientific | 0 (0.0%) | 0 (0.0%) |
| Enterprise Management | 0 (0.0%) | 0 (0.0%) |
| Administrative & Support | 0 (0.0%) | 0 (0.0%) |
| Educational Services | 3 (100.0%) | 0 (0.0%) |
| Health Care & Social Assistance | 0 (0.0%) | 2 (100.0%) |
| Arts, Entertainment & Recreation | 0 (0.0%) | 4 (100.0%) |
| Accommodation & Food Services | 0 (0.0%) | 1 (100.0%) |
| Public Administration | 5 (100.0%) | 0 (0.0%) |
| Total | 47 (75.8%) | 15 (24.2%) |
Education in Palermo
School Enrollment in Palermo
The most common levels of schooling among the 6 students in Palermo are college / undergraduate (3 | 50.0%), elementary school (1 | 16.7%), and middle school (1 | 16.7%).
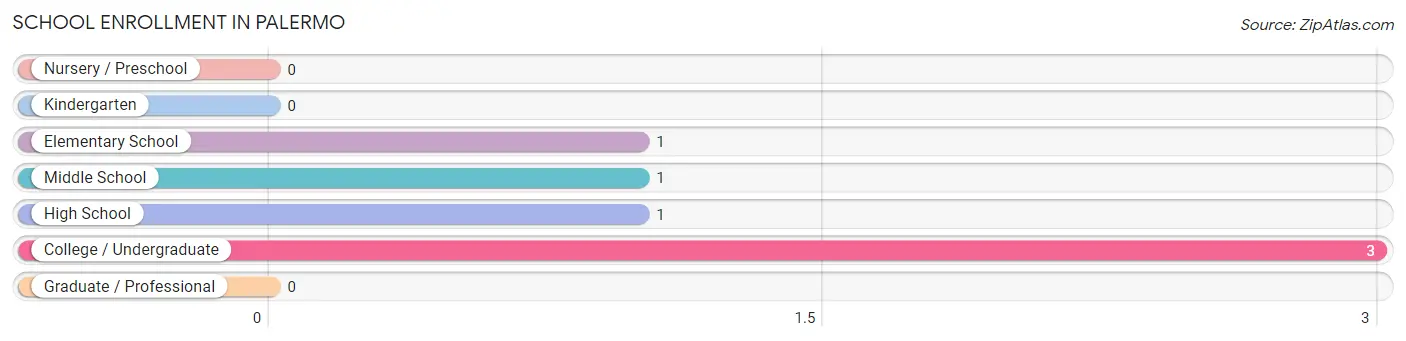
| School Level | # Students | % Students |
| Nursery / Preschool | 0 | 0.0% |
| Kindergarten | 0 | 0.0% |
| Elementary School | 1 | 16.7% |
| Middle School | 1 | 16.7% |
| High School | 1 | 16.7% |
| College / Undergraduate | 3 | 50.0% |
| Graduate / Professional | 0 | 0.0% |
| Total | 6 | 100.0% |
School Enrollment by Age by Funding Source in Palermo
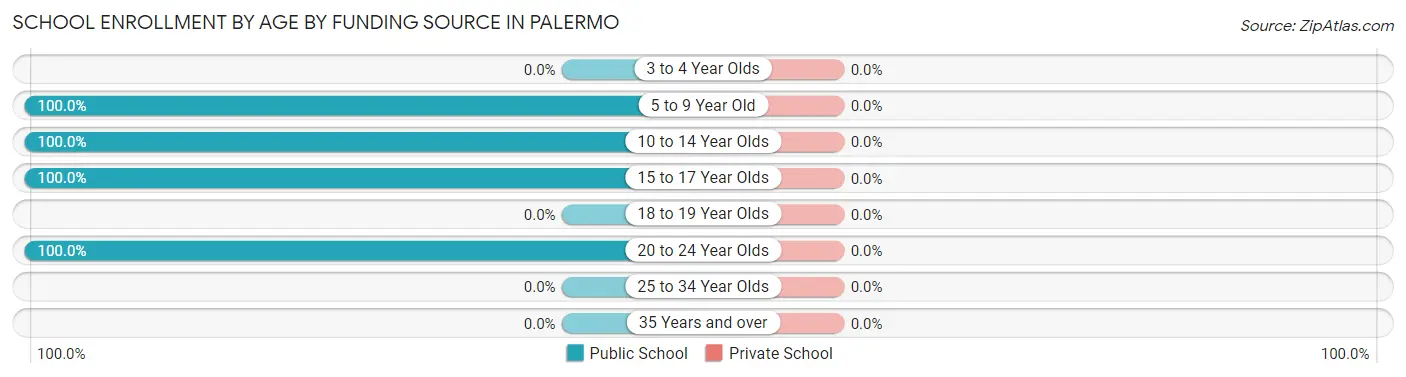
| Age Bracket | Public School | Private School |
| 3 to 4 Year Olds | 0 (0.0%) | 0 (0.0%) |
| 5 to 9 Year Old | 1 (100.0%) | 0 (0.0%) |
| 10 to 14 Year Olds | 1 (100.0%) | 0 (0.0%) |
| 15 to 17 Year Olds | 1 (100.0%) | 0 (0.0%) |
| 18 to 19 Year Olds | 0 (0.0%) | 0 (0.0%) |
| 20 to 24 Year Olds | 3 (100.0%) | 0 (0.0%) |
| 25 to 34 Year Olds | 0 (0.0%) | 0 (0.0%) |
| 35 Years and over | 0 (0.0%) | 0 (0.0%) |
| Total | 6 (100.0%) | 0 (0.0%) |
Educational Attainment by Field of Study in Palermo
, and bio, nature & agricultural (6 | 100.0%) are the most common fields of study among 6 individuals in Palermo who have obtained a bachelor's degree or higher.
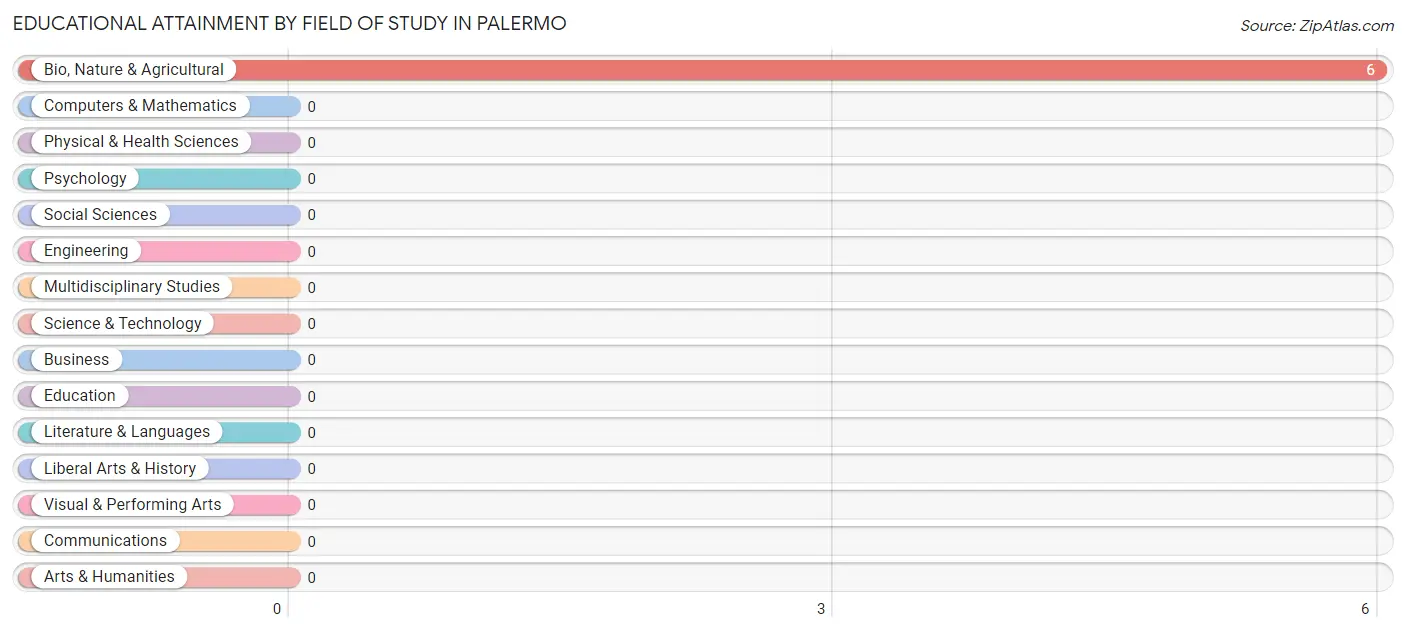
| Field of Study | # Graduates | % Graduates |
| Computers & Mathematics | 0 | 0.0% |
| Bio, Nature & Agricultural | 6 | 100.0% |
| Physical & Health Sciences | 0 | 0.0% |
| Psychology | 0 | 0.0% |
| Social Sciences | 0 | 0.0% |
| Engineering | 0 | 0.0% |
| Multidisciplinary Studies | 0 | 0.0% |
| Science & Technology | 0 | 0.0% |
| Business | 0 | 0.0% |
| Education | 0 | 0.0% |
| Literature & Languages | 0 | 0.0% |
| Liberal Arts & History | 0 | 0.0% |
| Visual & Performing Arts | 0 | 0.0% |
| Communications | 0 | 0.0% |
| Arts & Humanities | 0 | 0.0% |
| Total | 6 | 100.0% |
Transportation & Commute in Palermo
Vehicle Availability by Sex in Palermo
The most prevalent vehicle ownership categories in Palermo are males with 2 vehicles (37, accounting for 78.7%) and females with 2 vehicles (10, making up 246.7%).
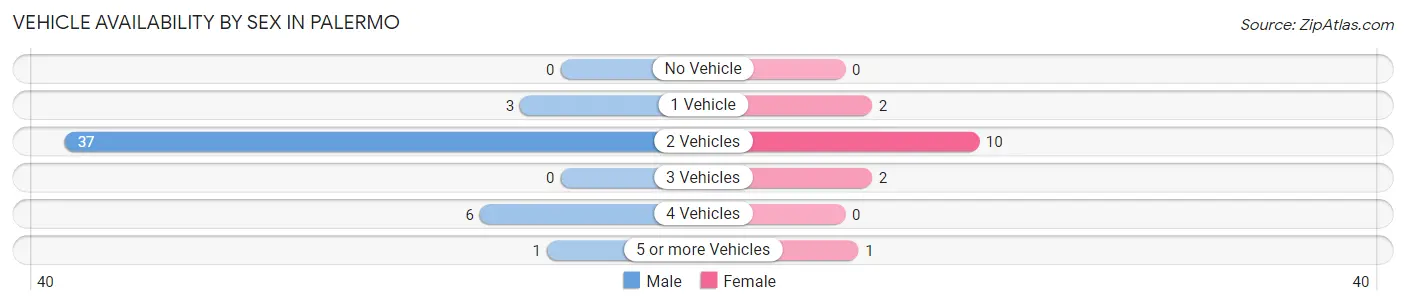
| Vehicles Available | Male | Female |
| No Vehicle | 0 (0.0%) | 0 (0.0%) |
| 1 Vehicle | 3 (6.4%) | 2 (13.3%) |
| 2 Vehicles | 37 (78.7%) | 10 (66.7%) |
| 3 Vehicles | 0 (0.0%) | 2 (13.3%) |
| 4 Vehicles | 6 (12.8%) | 0 (0.0%) |
| 5 or more Vehicles | 1 (2.1%) | 1 (6.7%) |
| Total | 47 (100.0%) | 15 (100.0%) |
Commute Time in Palermo
The most frequently occuring commute durations in Palermo are 15 to 19 minutes (39 commuters, 65.0%), 30 to 34 minutes (8 commuters, 13.3%), and 5 to 9 minutes (4 commuters, 6.7%).
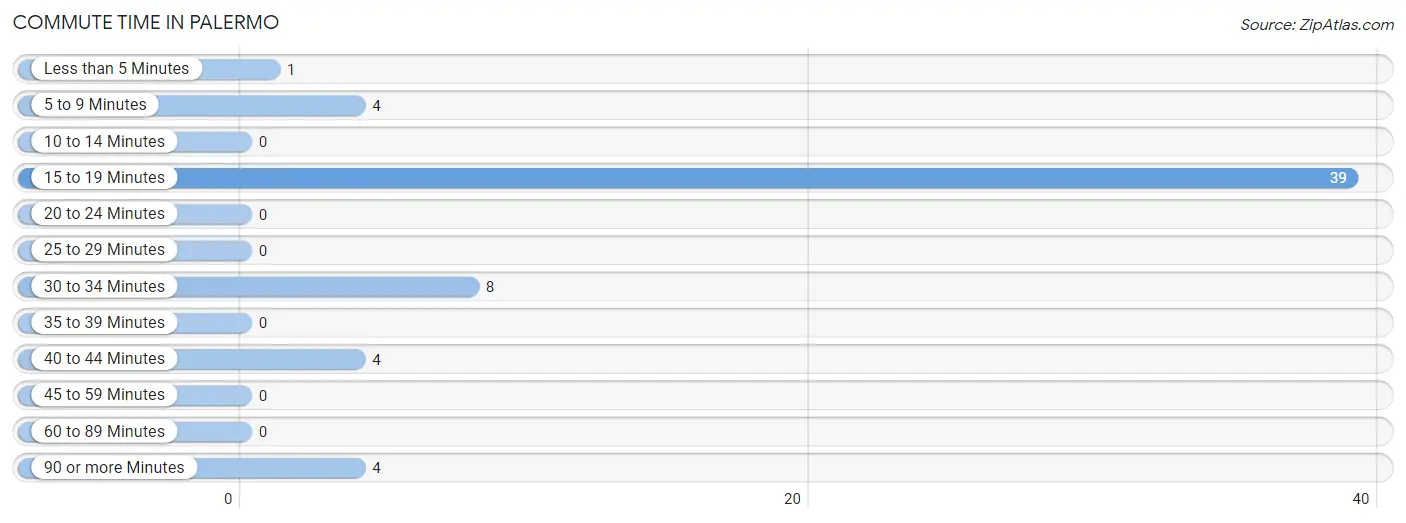
| Commute Time | # Commuters | % Commuters |
| Less than 5 Minutes | 1 | 1.7% |
| 5 to 9 Minutes | 4 | 6.7% |
| 10 to 14 Minutes | 0 | 0.0% |
| 15 to 19 Minutes | 39 | 65.0% |
| 20 to 24 Minutes | 0 | 0.0% |
| 25 to 29 Minutes | 0 | 0.0% |
| 30 to 34 Minutes | 8 | 13.3% |
| 35 to 39 Minutes | 0 | 0.0% |
| 40 to 44 Minutes | 4 | 6.7% |
| 45 to 59 Minutes | 0 | 0.0% |
| 60 to 89 Minutes | 0 | 0.0% |
| 90 or more Minutes | 4 | 6.7% |
Commute Time by Sex in Palermo
The most common commute times in Palermo are 15 to 19 minutes (31 commuters, 66.0%) for males and 15 to 19 minutes (8 commuters, 61.5%) for females.
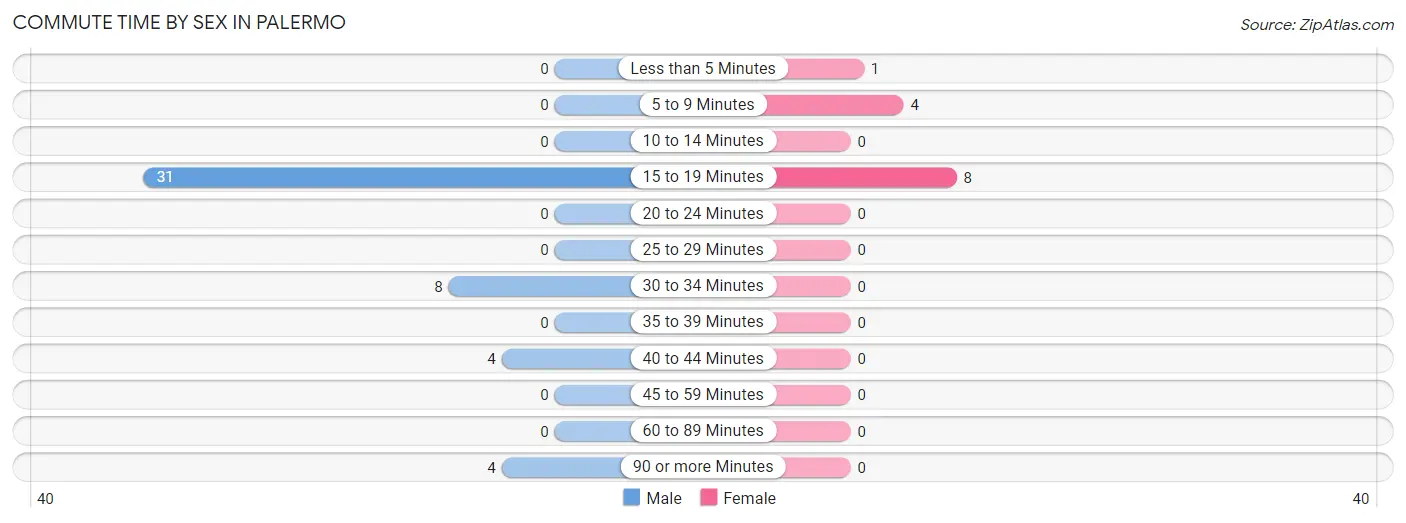
| Commute Time | Male | Female |
| Less than 5 Minutes | 0 (0.0%) | 1 (7.7%) |
| 5 to 9 Minutes | 0 (0.0%) | 4 (30.8%) |
| 10 to 14 Minutes | 0 (0.0%) | 0 (0.0%) |
| 15 to 19 Minutes | 31 (66.0%) | 8 (61.5%) |
| 20 to 24 Minutes | 0 (0.0%) | 0 (0.0%) |
| 25 to 29 Minutes | 0 (0.0%) | 0 (0.0%) |
| 30 to 34 Minutes | 8 (17.0%) | 0 (0.0%) |
| 35 to 39 Minutes | 0 (0.0%) | 0 (0.0%) |
| 40 to 44 Minutes | 4 (8.5%) | 0 (0.0%) |
| 45 to 59 Minutes | 0 (0.0%) | 0 (0.0%) |
| 60 to 89 Minutes | 0 (0.0%) | 0 (0.0%) |
| 90 or more Minutes | 4 (8.5%) | 0 (0.0%) |
Time of Departure to Work by Sex in Palermo
The most frequent times of departure to work in Palermo are 9:00 AM to 9:59 AM (22, 46.8%) for males and 7:30 AM to 7:59 AM (8, 61.5%) for females.
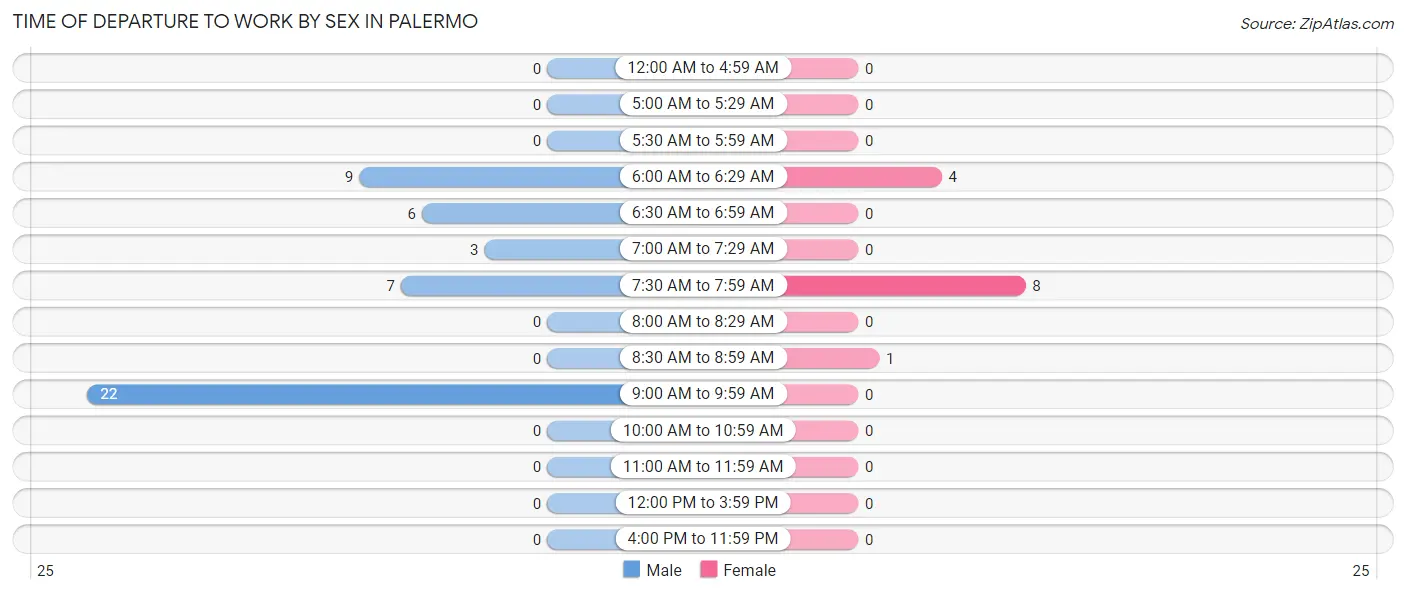
| Time of Departure | Male | Female |
| 12:00 AM to 4:59 AM | 0 (0.0%) | 0 (0.0%) |
| 5:00 AM to 5:29 AM | 0 (0.0%) | 0 (0.0%) |
| 5:30 AM to 5:59 AM | 0 (0.0%) | 0 (0.0%) |
| 6:00 AM to 6:29 AM | 9 (19.2%) | 4 (30.8%) |
| 6:30 AM to 6:59 AM | 6 (12.8%) | 0 (0.0%) |
| 7:00 AM to 7:29 AM | 3 (6.4%) | 0 (0.0%) |
| 7:30 AM to 7:59 AM | 7 (14.9%) | 8 (61.5%) |
| 8:00 AM to 8:29 AM | 0 (0.0%) | 0 (0.0%) |
| 8:30 AM to 8:59 AM | 0 (0.0%) | 1 (7.7%) |
| 9:00 AM to 9:59 AM | 22 (46.8%) | 0 (0.0%) |
| 10:00 AM to 10:59 AM | 0 (0.0%) | 0 (0.0%) |
| 11:00 AM to 11:59 AM | 0 (0.0%) | 0 (0.0%) |
| 12:00 PM to 3:59 PM | 0 (0.0%) | 0 (0.0%) |
| 4:00 PM to 11:59 PM | 0 (0.0%) | 0 (0.0%) |
| Total | 47 (100.0%) | 13 (100.0%) |
Housing Occupancy in Palermo
Occupancy by Ownership in Palermo
Of the total 61 dwellings in Palermo, owner-occupied units account for 30 (49.2%), while renter-occupied units make up 31 (50.8%).
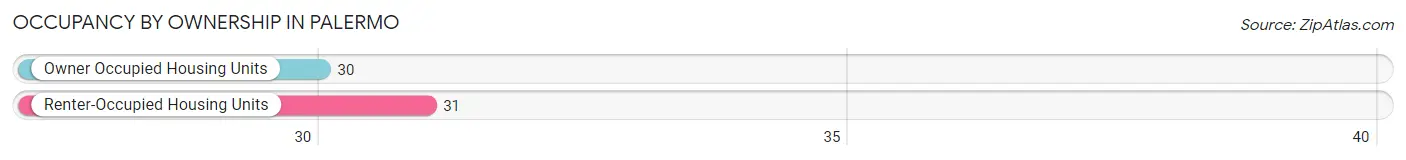
| Occupancy | # Housing Units | % Housing Units |
| Owner Occupied Housing Units | 30 | 49.2% |
| Renter-Occupied Housing Units | 31 | 50.8% |
| Total Occupied Housing Units | 61 | 100.0% |
Occupancy by Household Size in Palermo
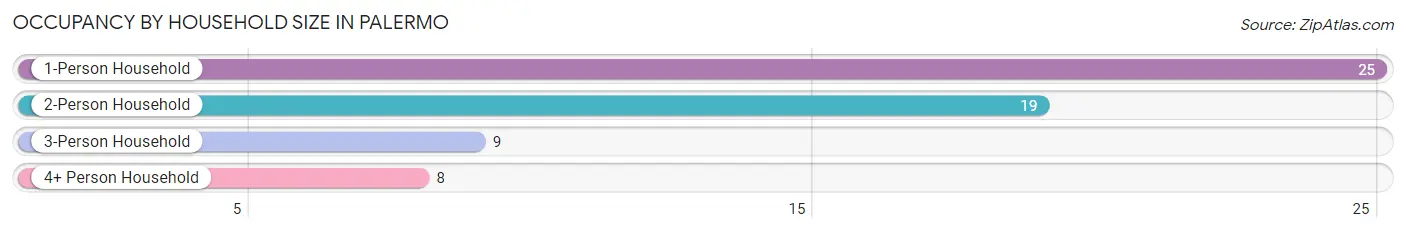
| Household Size | # Housing Units | % Housing Units |
| 1-Person Household | 25 | 41.0% |
| 2-Person Household | 19 | 31.1% |
| 3-Person Household | 9 | 14.7% |
| 4+ Person Household | 8 | 13.1% |
| Total Housing Units | 61 | 100.0% |
Occupancy by Ownership by Household Size in Palermo
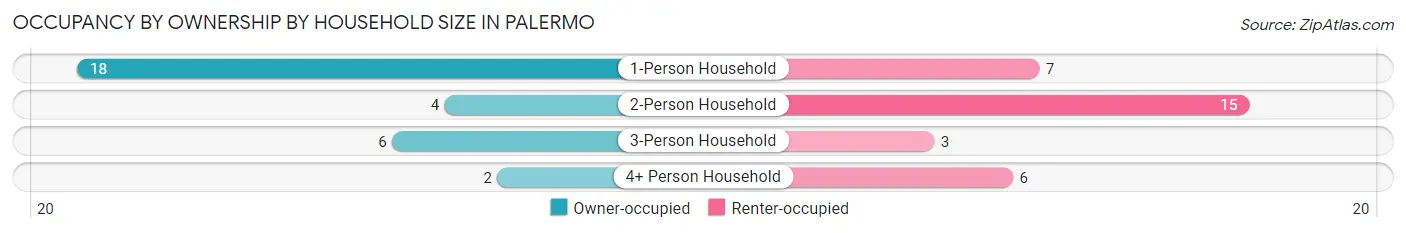
| Household Size | Owner-occupied | Renter-occupied |
| 1-Person Household | 18 (72.0%) | 7 (28.0%) |
| 2-Person Household | 4 (21.0%) | 15 (78.9%) |
| 3-Person Household | 6 (66.7%) | 3 (33.3%) |
| 4+ Person Household | 2 (25.0%) | 6 (75.0%) |
| Total Housing Units | 30 (49.2%) | 31 (50.8%) |
Occupancy by Educational Attainment in Palermo
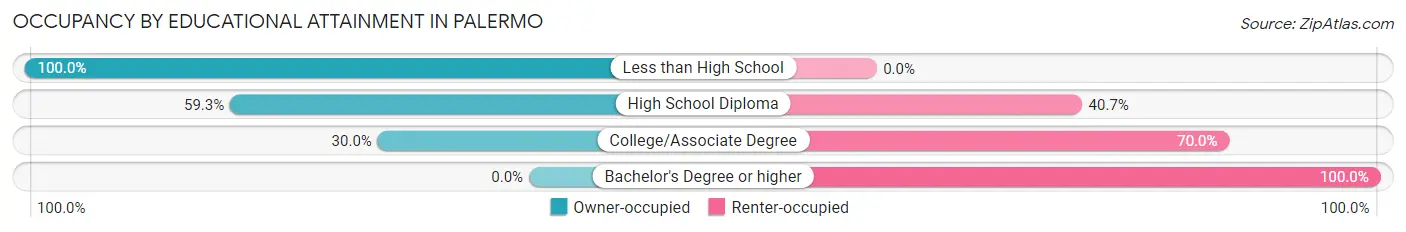
| Household Size | Owner-occupied | Renter-occupied |
| Less than High School | 8 (100.0%) | 0 (0.0%) |
| High School Diploma | 16 (59.3%) | 11 (40.7%) |
| College/Associate Degree | 6 (30.0%) | 14 (70.0%) |
| Bachelor's Degree or higher | 0 (0.0%) | 6 (100.0%) |
Occupancy by Age of Householder in Palermo
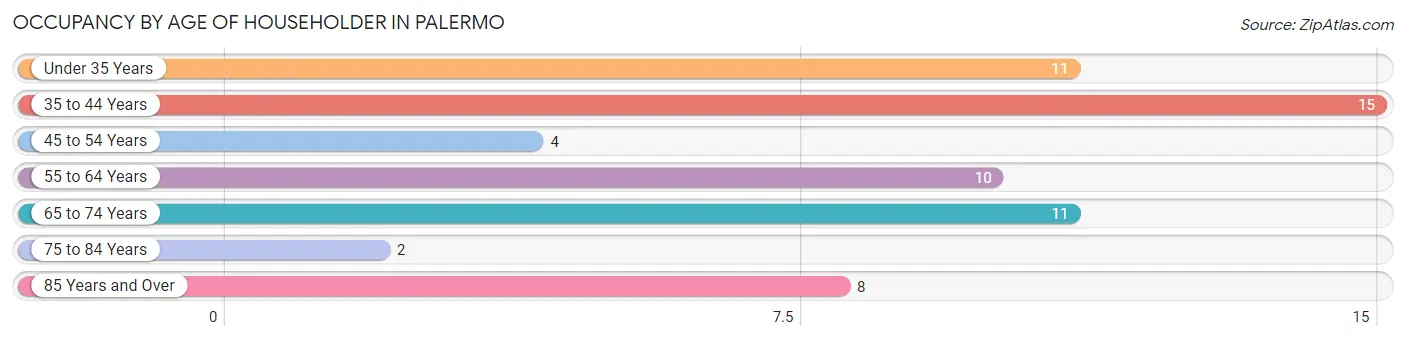
| Age Bracket | # Households | % Households |
| Under 35 Years | 11 | 18.0% |
| 35 to 44 Years | 15 | 24.6% |
| 45 to 54 Years | 4 | 6.6% |
| 55 to 64 Years | 10 | 16.4% |
| 65 to 74 Years | 11 | 18.0% |
| 75 to 84 Years | 2 | 3.3% |
| 85 Years and Over | 8 | 13.1% |
| Total | 61 | 100.0% |
Housing Finances in Palermo
Median Income by Occupancy in Palermo
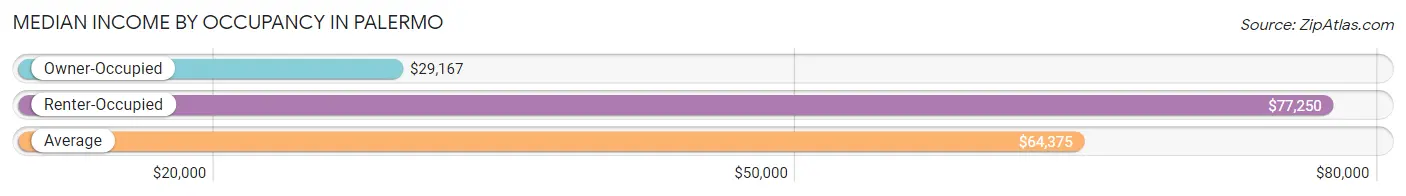
| Occupancy Type | # Households | Median Income |
| Owner-Occupied | 30 (49.2%) | $29,167 |
| Renter-Occupied | 31 (50.8%) | $77,250 |
| Average | 61 (100.0%) | $64,375 |
Occupancy by Householder Income Bracket in Palermo
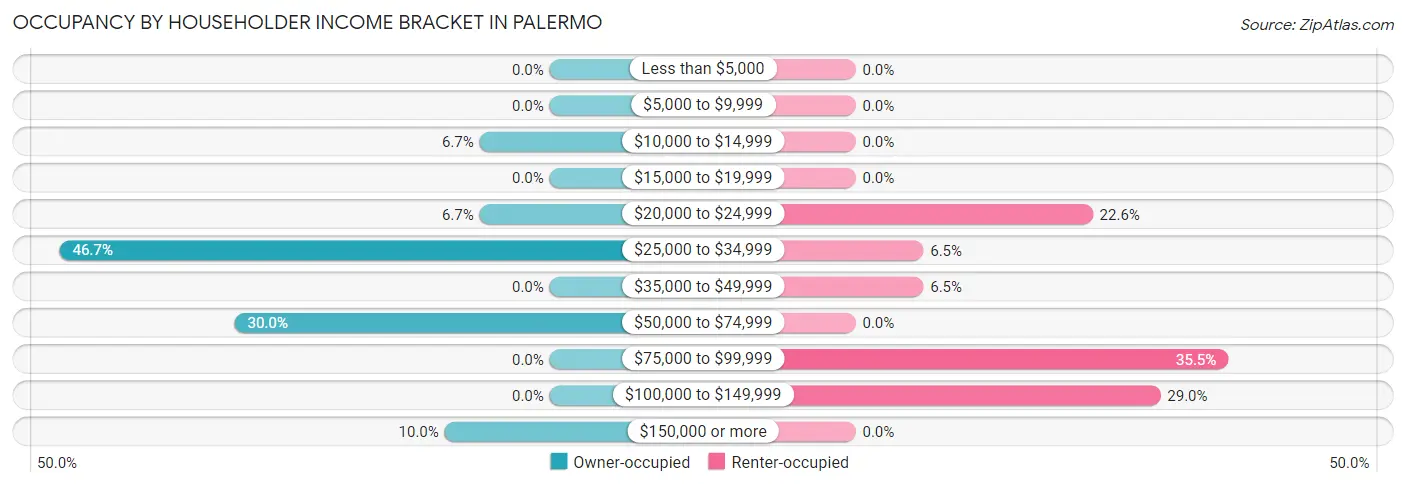
| Income Bracket | Owner-occupied | Renter-occupied |
| Less than $5,000 | 0 (0.0%) | 0 (0.0%) |
| $5,000 to $9,999 | 0 (0.0%) | 0 (0.0%) |
| $10,000 to $14,999 | 2 (6.7%) | 0 (0.0%) |
| $15,000 to $19,999 | 0 (0.0%) | 0 (0.0%) |
| $20,000 to $24,999 | 2 (6.7%) | 7 (22.6%) |
| $25,000 to $34,999 | 14 (46.7%) | 2 (6.5%) |
| $35,000 to $49,999 | 0 (0.0%) | 2 (6.5%) |
| $50,000 to $74,999 | 9 (30.0%) | 0 (0.0%) |
| $75,000 to $99,999 | 0 (0.0%) | 11 (35.5%) |
| $100,000 to $149,999 | 0 (0.0%) | 9 (29.0%) |
| $150,000 or more | 3 (10.0%) | 0 (0.0%) |
| Total | 30 (100.0%) | 31 (100.0%) |
Monthly Housing Cost Tiers in Palermo
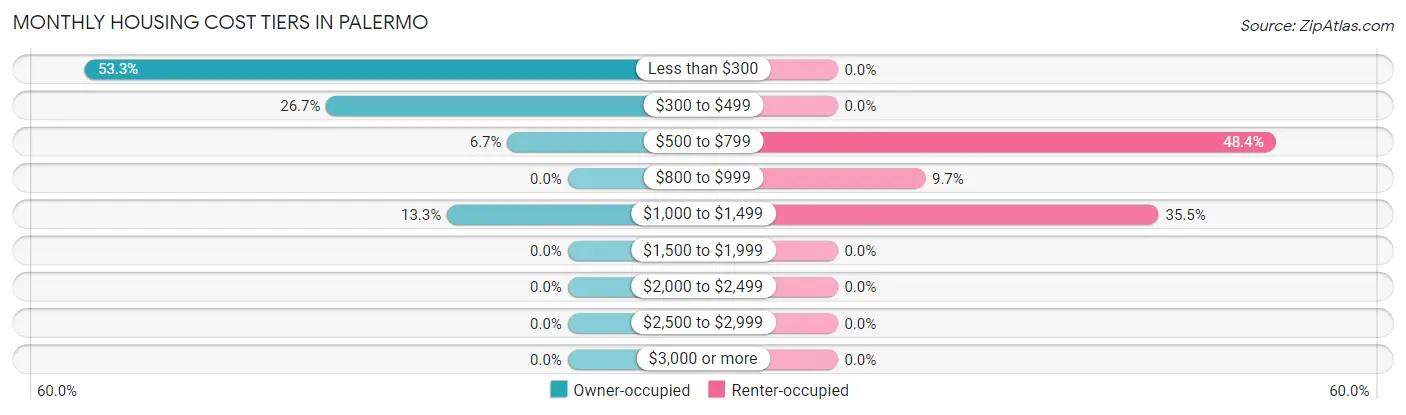
| Monthly Cost | Owner-occupied | Renter-occupied |
| Less than $300 | 16 (53.3%) | 0 (0.0%) |
| $300 to $499 | 8 (26.7%) | 0 (0.0%) |
| $500 to $799 | 2 (6.7%) | 15 (48.4%) |
| $800 to $999 | 0 (0.0%) | 3 (9.7%) |
| $1,000 to $1,499 | 4 (13.3%) | 11 (35.5%) |
| $1,500 to $1,999 | 0 (0.0%) | 0 (0.0%) |
| $2,000 to $2,499 | 0 (0.0%) | 0 (0.0%) |
| $2,500 to $2,999 | 0 (0.0%) | 0 (0.0%) |
| $3,000 or more | 0 (0.0%) | 0 (0.0%) |
| Total | 30 (100.0%) | 31 (100.0%) |
Physical Housing Characteristics in Palermo
Housing Structures in Palermo
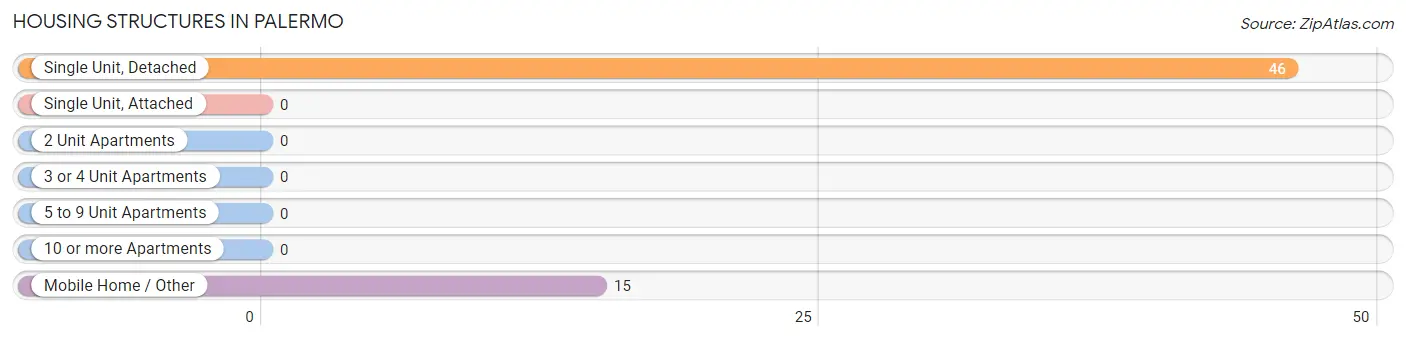
| Structure Type | # Housing Units | % Housing Units |
| Single Unit, Detached | 46 | 75.4% |
| Single Unit, Attached | 0 | 0.0% |
| 2 Unit Apartments | 0 | 0.0% |
| 3 or 4 Unit Apartments | 0 | 0.0% |
| 5 to 9 Unit Apartments | 0 | 0.0% |
| 10 or more Apartments | 0 | 0.0% |
| Mobile Home / Other | 15 | 24.6% |
| Total | 61 | 100.0% |
Housing Structures by Occupancy in Palermo
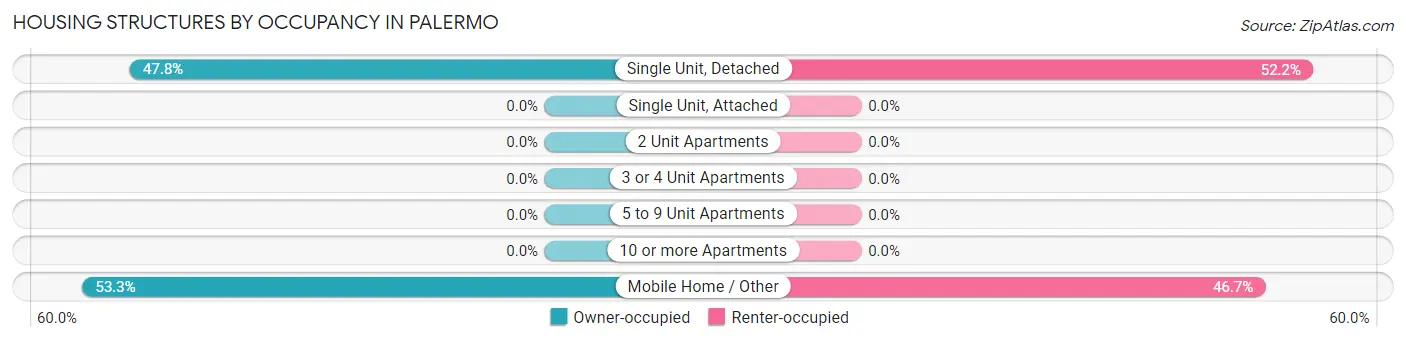
| Structure Type | Owner-occupied | Renter-occupied |
| Single Unit, Detached | 22 (47.8%) | 24 (52.2%) |
| Single Unit, Attached | 0 (0.0%) | 0 (0.0%) |
| 2 Unit Apartments | 0 (0.0%) | 0 (0.0%) |
| 3 or 4 Unit Apartments | 0 (0.0%) | 0 (0.0%) |
| 5 to 9 Unit Apartments | 0 (0.0%) | 0 (0.0%) |
| 10 or more Apartments | 0 (0.0%) | 0 (0.0%) |
| Mobile Home / Other | 8 (53.3%) | 7 (46.7%) |
| Total | 30 (49.2%) | 31 (50.8%) |
Housing Structures by Number of Rooms in Palermo
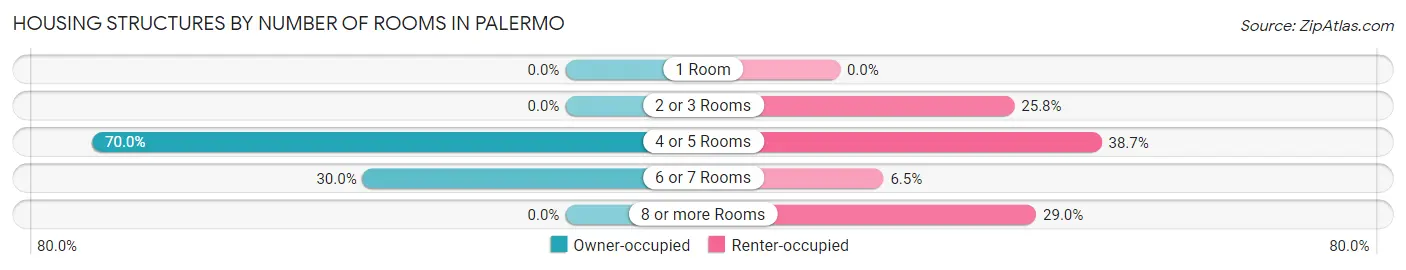
| Number of Rooms | Owner-occupied | Renter-occupied |
| 1 Room | 0 (0.0%) | 0 (0.0%) |
| 2 or 3 Rooms | 0 (0.0%) | 8 (25.8%) |
| 4 or 5 Rooms | 21 (70.0%) | 12 (38.7%) |
| 6 or 7 Rooms | 9 (30.0%) | 2 (6.5%) |
| 8 or more Rooms | 0 (0.0%) | 9 (29.0%) |
| Total | 30 (100.0%) | 31 (100.0%) |
Housing Structure by Heating Type in Palermo
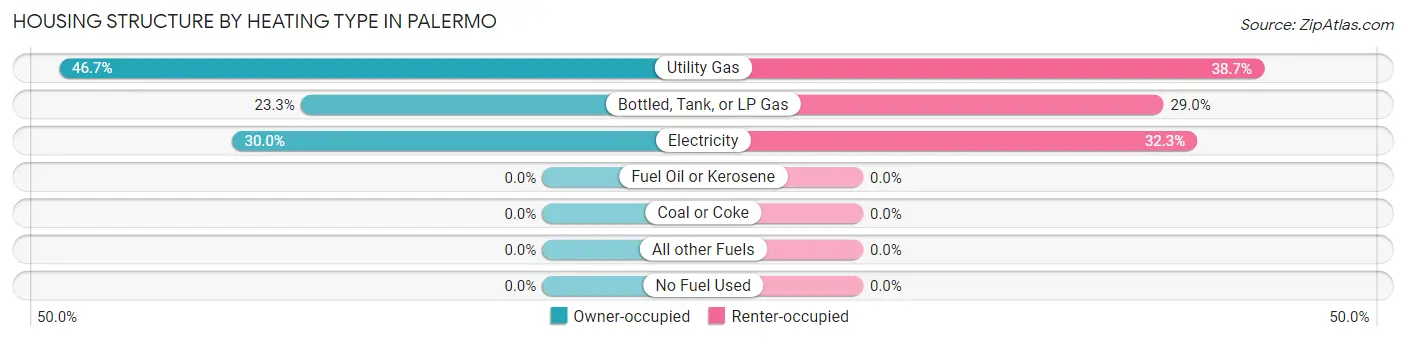
| Heating Type | Owner-occupied | Renter-occupied |
| Utility Gas | 14 (46.7%) | 12 (38.7%) |
| Bottled, Tank, or LP Gas | 7 (23.3%) | 9 (29.0%) |
| Electricity | 9 (30.0%) | 10 (32.3%) |
| Fuel Oil or Kerosene | 0 (0.0%) | 0 (0.0%) |
| Coal or Coke | 0 (0.0%) | 0 (0.0%) |
| All other Fuels | 0 (0.0%) | 0 (0.0%) |
| No Fuel Used | 0 (0.0%) | 0 (0.0%) |
| Total | 30 (100.0%) | 31 (100.0%) |
Household Vehicle Usage in Palermo
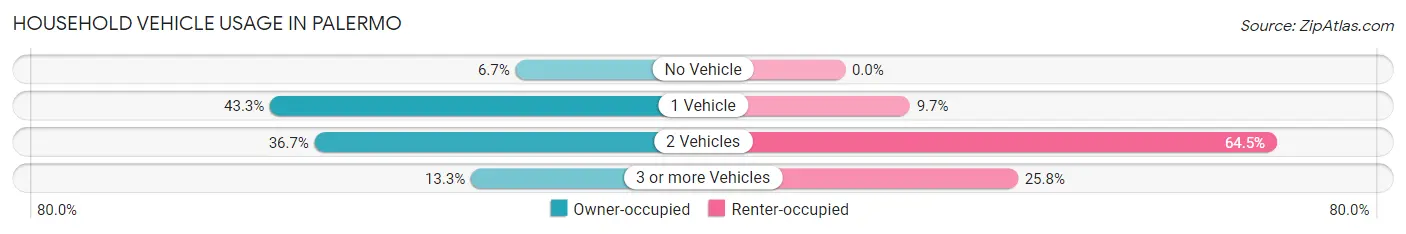
| Vehicles per Household | Owner-occupied | Renter-occupied |
| No Vehicle | 2 (6.7%) | 0 (0.0%) |
| 1 Vehicle | 13 (43.3%) | 3 (9.7%) |
| 2 Vehicles | 11 (36.7%) | 20 (64.5%) |
| 3 or more Vehicles | 4 (13.3%) | 8 (25.8%) |
| Total | 30 (100.0%) | 31 (100.0%) |
Real Estate & Mortgages in Palermo
Real Estate and Mortgage Overview in Palermo
| Characteristic | Without Mortgage | With Mortgage |
| Housing Units | 25 | 5 |
| Median Property Value | - | - |
| Median Household Income | $28,472 | $0 |
| Monthly Housing Costs | $231 | $0 |
| Real Estate Taxes | $199 | $0 |
Property Value by Mortgage Status in Palermo
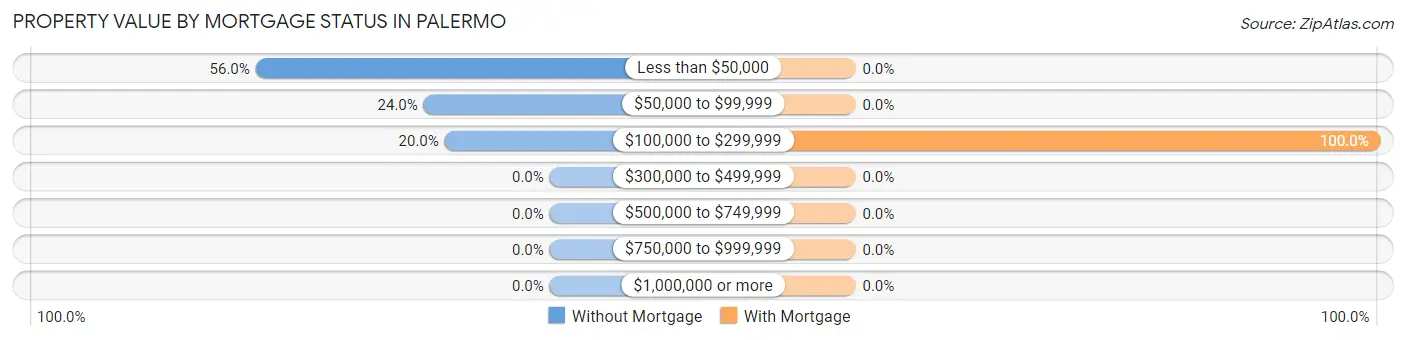
| Property Value | Without Mortgage | With Mortgage |
| Less than $50,000 | 14 (56.0%) | 0 (0.0%) |
| $50,000 to $99,999 | 6 (24.0%) | 0 (0.0%) |
| $100,000 to $299,999 | 5 (20.0%) | 5 (100.0%) |
| $300,000 to $499,999 | 0 (0.0%) | 0 (0.0%) |
| $500,000 to $749,999 | 0 (0.0%) | 0 (0.0%) |
| $750,000 to $999,999 | 0 (0.0%) | 0 (0.0%) |
| $1,000,000 or more | 0 (0.0%) | 0 (0.0%) |
| Total | 25 (100.0%) | 5 (100.0%) |
Household Income by Mortgage Status in Palermo
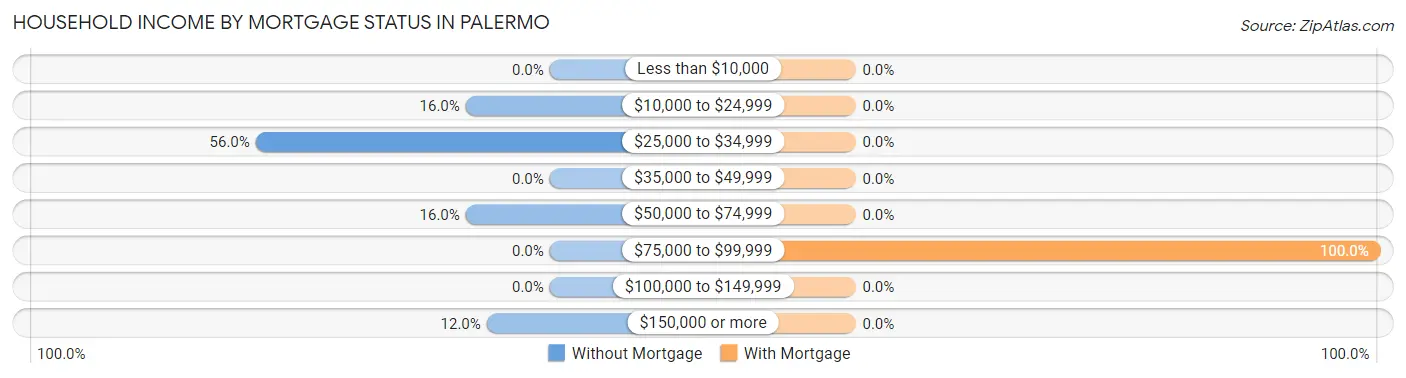
| Household Income | Without Mortgage | With Mortgage |
| Less than $10,000 | 0 (0.0%) | 0 (0.0%) |
| $10,000 to $24,999 | 4 (16.0%) | 0 (0.0%) |
| $25,000 to $34,999 | 14 (56.0%) | 0 (0.0%) |
| $35,000 to $49,999 | 0 (0.0%) | 0 (0.0%) |
| $50,000 to $74,999 | 4 (16.0%) | 0 (0.0%) |
| $75,000 to $99,999 | 0 (0.0%) | 5 (100.0%) |
| $100,000 to $149,999 | 0 (0.0%) | 0 (0.0%) |
| $150,000 or more | 3 (12.0%) | 0 (0.0%) |
| Total | 25 (100.0%) | 5 (100.0%) |
Property Value to Household Income Ratio in Palermo
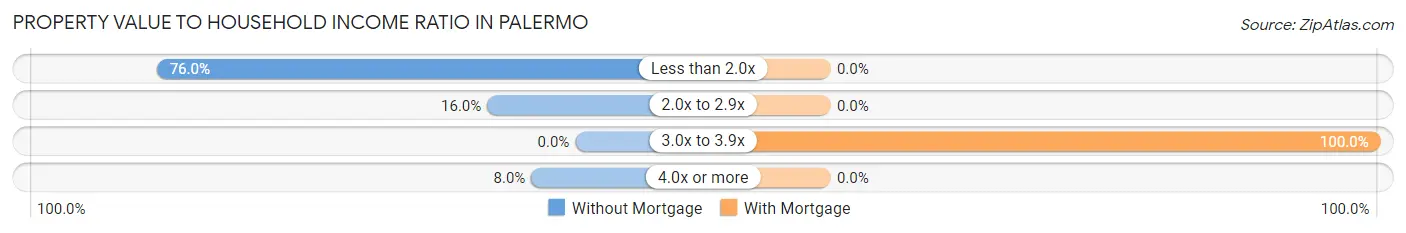
| Value-to-Income Ratio | Without Mortgage | With Mortgage |
| Less than 2.0x | 19 (76.0%) | 0 (0.0%) |
| 2.0x to 2.9x | 4 (16.0%) | 0 (0.0%) |
| 3.0x to 3.9x | 0 (0.0%) | 5 (100.0%) |
| 4.0x or more | 2 (8.0%) | 0 (0.0%) |
| Total | 25 (100.0%) | 5 (100.0%) |
Real Estate Taxes by Mortgage Status in Palermo
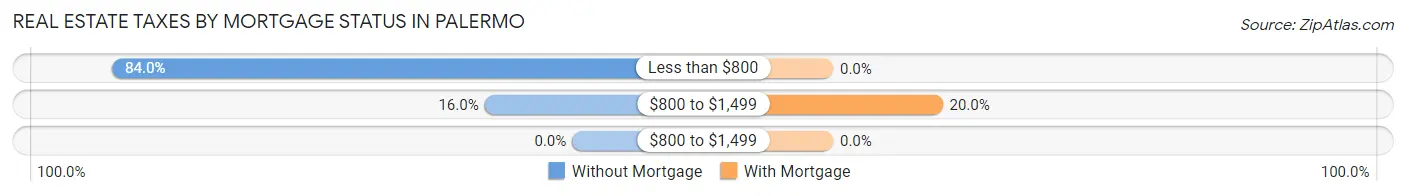
| Property Taxes | Without Mortgage | With Mortgage |
| Less than $800 | 21 (84.0%) | 0 (0.0%) |
| $800 to $1,499 | 4 (16.0%) | 1 (20.0%) |
| $800 to $1,499 | 0 (0.0%) | 0 (0.0%) |
| Total | 25 (100.0%) | 5 (100.0%) |
Health & Disability in Palermo
Health Insurance Coverage by Age in Palermo
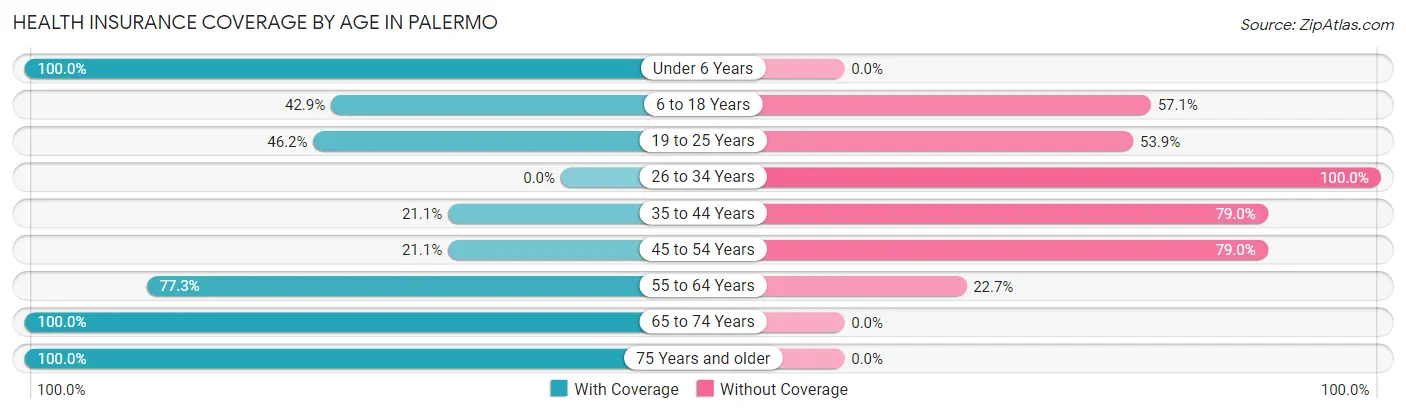
| Age Bracket | With Coverage | Without Coverage |
| Under 6 Years | 2 (100.0%) | 0 (0.0%) |
| 6 to 18 Years | 3 (42.9%) | 4 (57.1%) |
| 19 to 25 Years | 12 (46.2%) | 14 (53.8%) |
| 26 to 34 Years | 0 (0.0%) | 1 (100.0%) |
| 35 to 44 Years | 4 (21.0%) | 15 (78.9%) |
| 45 to 54 Years | 4 (21.0%) | 15 (78.9%) |
| 55 to 64 Years | 17 (77.3%) | 5 (22.7%) |
| 65 to 74 Years | 25 (100.0%) | 0 (0.0%) |
| 75 Years and older | 10 (100.0%) | 0 (0.0%) |
| Total | 77 (58.8%) | 54 (41.2%) |
Health Insurance Coverage by Citizenship Status in Palermo
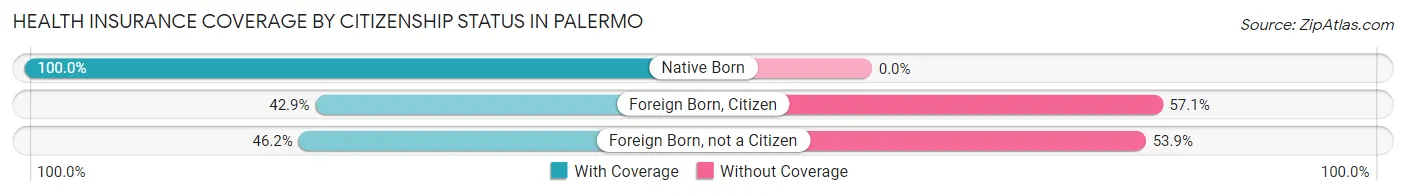
| Citizenship Status | With Coverage | Without Coverage |
| Native Born | 2 (100.0%) | 0 (0.0%) |
| Foreign Born, Citizen | 3 (42.9%) | 4 (57.1%) |
| Foreign Born, not a Citizen | 12 (46.2%) | 14 (53.8%) |
Health Insurance Coverage by Household Income in Palermo
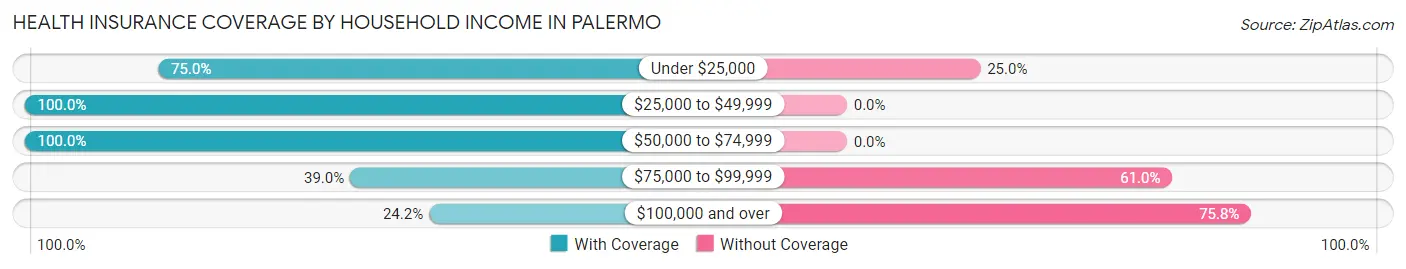
| Household Income | With Coverage | Without Coverage |
| Under $25,000 | 12 (75.0%) | 4 (25.0%) |
| $25,000 to $49,999 | 23 (100.0%) | 0 (0.0%) |
| $50,000 to $74,999 | 18 (100.0%) | 0 (0.0%) |
| $75,000 to $99,999 | 16 (39.0%) | 25 (61.0%) |
| $100,000 and over | 8 (24.2%) | 25 (75.8%) |
Public vs Private Health Insurance Coverage by Age in Palermo
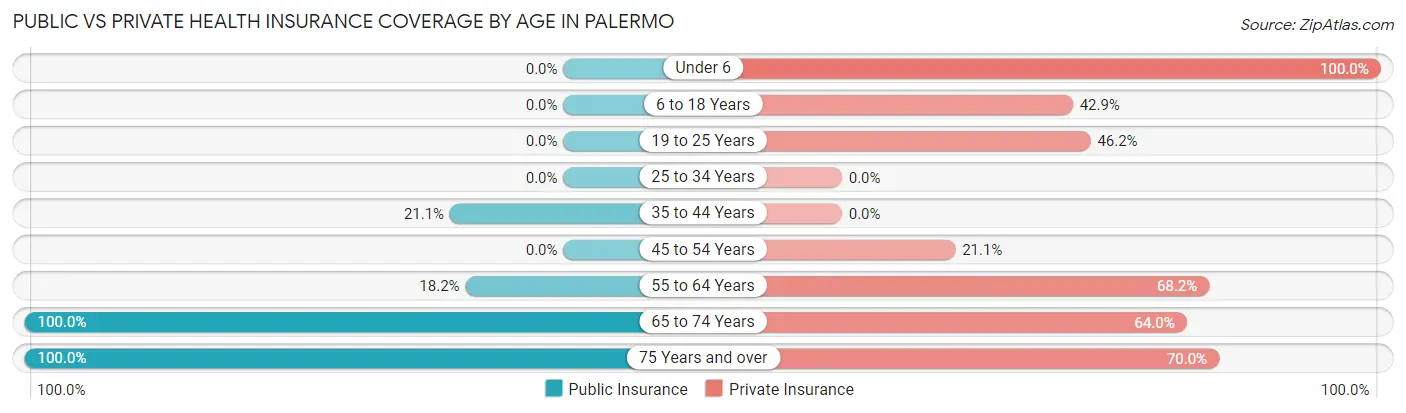
| Age Bracket | Public Insurance | Private Insurance |
| Under 6 | 0 (0.0%) | 2 (100.0%) |
| 6 to 18 Years | 0 (0.0%) | 3 (42.9%) |
| 19 to 25 Years | 0 (0.0%) | 12 (46.2%) |
| 25 to 34 Years | 0 (0.0%) | 0 (0.0%) |
| 35 to 44 Years | 4 (21.0%) | 0 (0.0%) |
| 45 to 54 Years | 0 (0.0%) | 4 (21.0%) |
| 55 to 64 Years | 4 (18.2%) | 15 (68.2%) |
| 65 to 74 Years | 25 (100.0%) | 16 (64.0%) |
| 75 Years and over | 10 (100.0%) | 7 (70.0%) |
| Total | 43 (32.8%) | 59 (45.0%) |
Disability Status by Sex by Age in Palermo
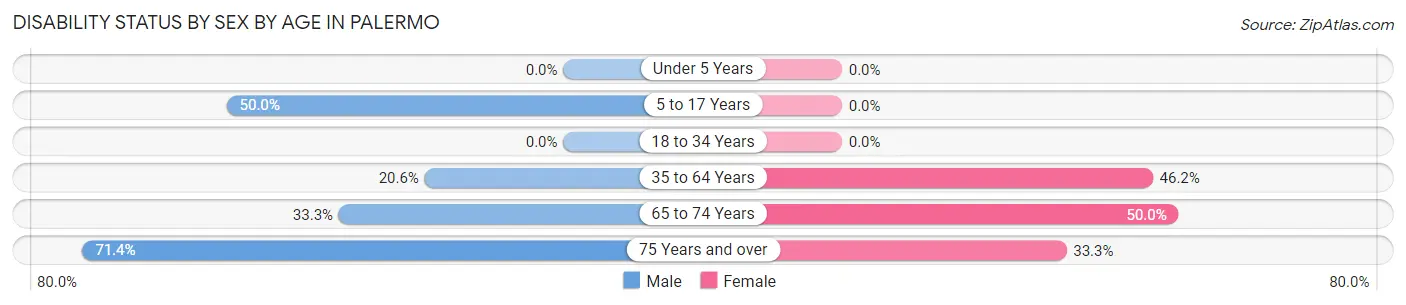
| Age Bracket | Male | Female |
| Under 5 Years | 0 (0.0%) | 0 (0.0%) |
| 5 to 17 Years | 1 (50.0%) | 0 (0.0%) |
| 18 to 34 Years | 0 (0.0%) | 0 (0.0%) |
| 35 to 64 Years | 7 (20.6%) | 12 (46.2%) |
| 65 to 74 Years | 3 (33.3%) | 8 (50.0%) |
| 75 Years and over | 5 (71.4%) | 1 (33.3%) |
Disability Class by Sex by Age in Palermo
Disability Class: Hearing Difficulty
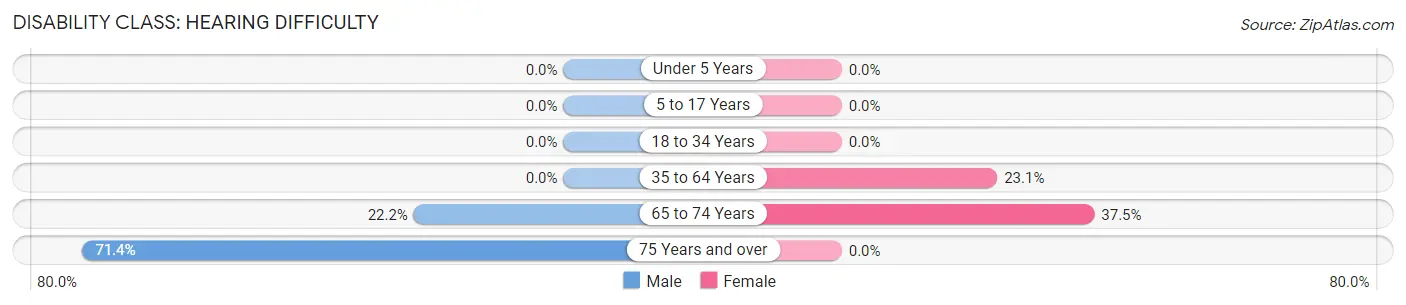
| Age Bracket | Male | Female |
| Under 5 Years | 0 (0.0%) | 0 (0.0%) |
| 5 to 17 Years | 0 (0.0%) | 0 (0.0%) |
| 18 to 34 Years | 0 (0.0%) | 0 (0.0%) |
| 35 to 64 Years | 0 (0.0%) | 6 (23.1%) |
| 65 to 74 Years | 2 (22.2%) | 6 (37.5%) |
| 75 Years and over | 5 (71.4%) | 0 (0.0%) |
Disability Class: Vision Difficulty
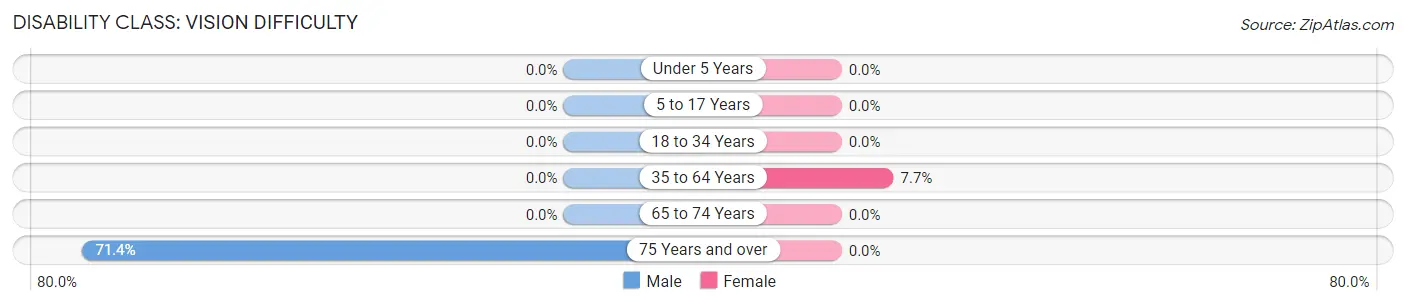
| Age Bracket | Male | Female |
| Under 5 Years | 0 (0.0%) | 0 (0.0%) |
| 5 to 17 Years | 0 (0.0%) | 0 (0.0%) |
| 18 to 34 Years | 0 (0.0%) | 0 (0.0%) |
| 35 to 64 Years | 0 (0.0%) | 2 (7.7%) |
| 65 to 74 Years | 0 (0.0%) | 0 (0.0%) |
| 75 Years and over | 5 (71.4%) | 0 (0.0%) |
Disability Class: Cognitive Difficulty
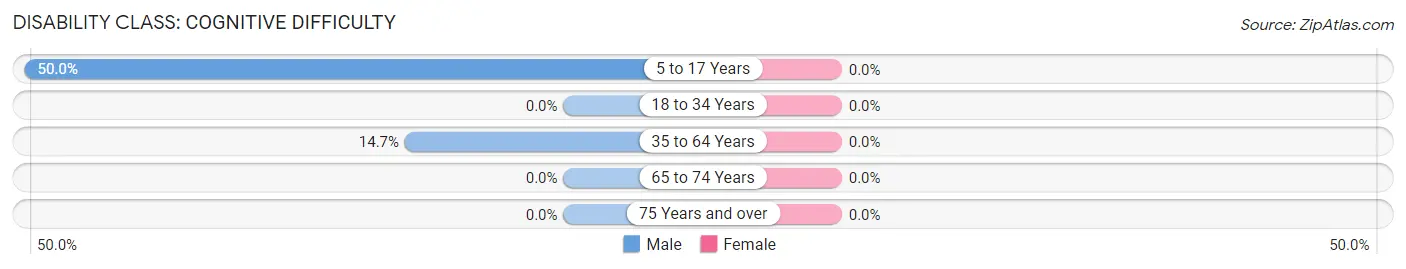
| Age Bracket | Male | Female |
| 5 to 17 Years | 1 (50.0%) | 0 (0.0%) |
| 18 to 34 Years | 0 (0.0%) | 0 (0.0%) |
| 35 to 64 Years | 5 (14.7%) | 0 (0.0%) |
| 65 to 74 Years | 0 (0.0%) | 0 (0.0%) |
| 75 Years and over | 0 (0.0%) | 0 (0.0%) |
Disability Class: Ambulatory Difficulty
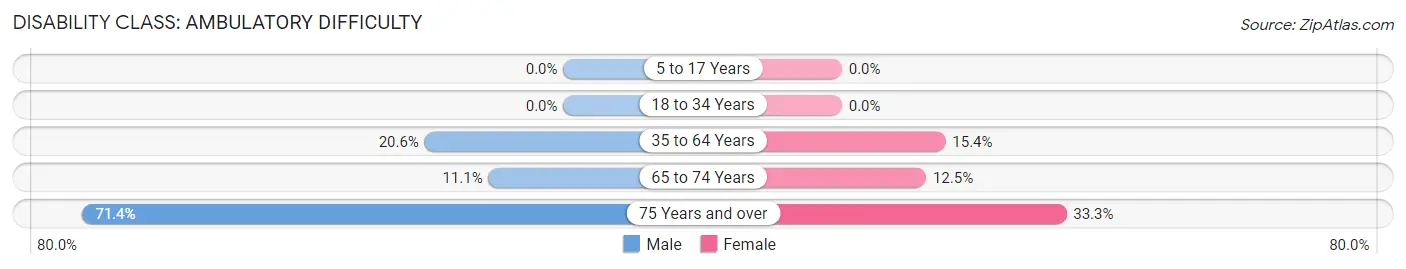
| Age Bracket | Male | Female |
| 5 to 17 Years | 0 (0.0%) | 0 (0.0%) |
| 18 to 34 Years | 0 (0.0%) | 0 (0.0%) |
| 35 to 64 Years | 7 (20.6%) | 4 (15.4%) |
| 65 to 74 Years | 1 (11.1%) | 2 (12.5%) |
| 75 Years and over | 5 (71.4%) | 1 (33.3%) |
Disability Class: Self-Care Difficulty
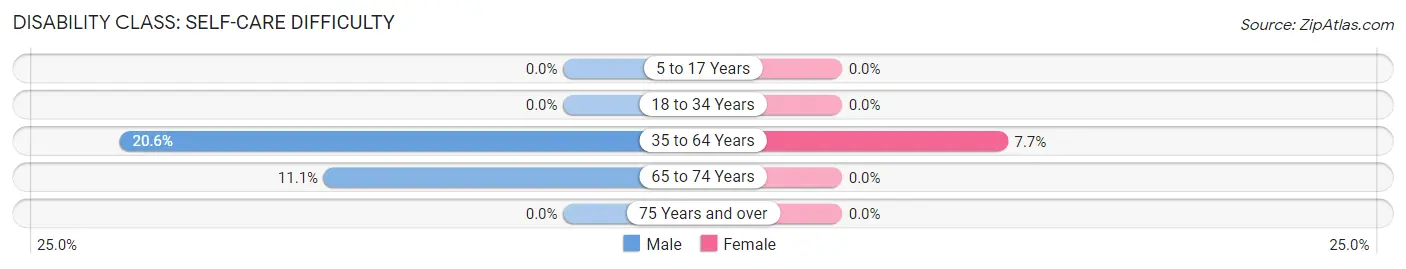
| Age Bracket | Male | Female |
| 5 to 17 Years | 0 (0.0%) | 0 (0.0%) |
| 18 to 34 Years | 0 (0.0%) | 0 (0.0%) |
| 35 to 64 Years | 7 (20.6%) | 2 (7.7%) |
| 65 to 74 Years | 1 (11.1%) | 0 (0.0%) |
| 75 Years and over | 0 (0.0%) | 0 (0.0%) |
Technology Access in Palermo
Computing Device Access in Palermo
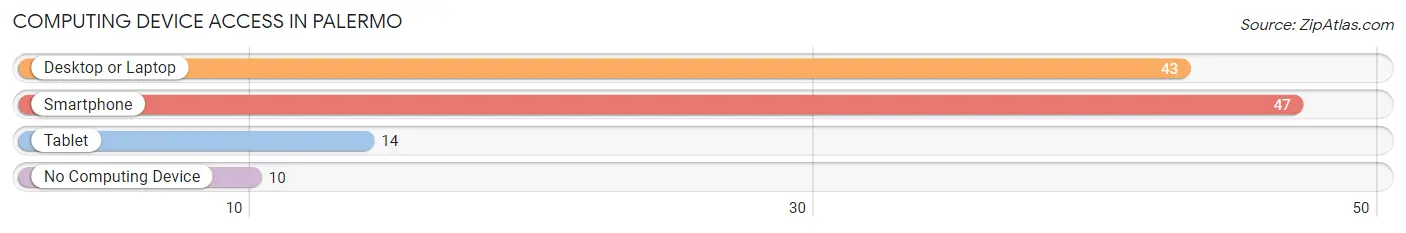
| Device Type | # Households | % Households |
| Desktop or Laptop | 43 | 70.5% |
| Smartphone | 47 | 77.0% |
| Tablet | 14 | 23.0% |
| No Computing Device | 10 | 16.4% |
| Total | 61 | 100.0% |
Internet Access in Palermo
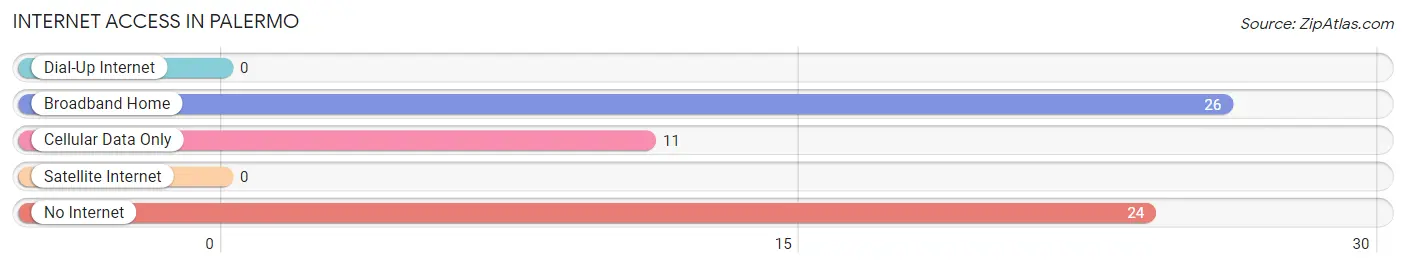
| Internet Type | # Households | % Households |
| Dial-Up Internet | 0 | 0.0% |
| Broadband Home | 26 | 42.6% |
| Cellular Data Only | 11 | 18.0% |
| Satellite Internet | 0 | 0.0% |
| No Internet | 24 | 39.3% |
| Total | 61 | 100.0% |
Palermo Summary
Palermo is a city located in the province of Trapani, in the autonomous region of Sicily, Italy. It is the capital of the province and the second largest city in Sicily after Catania. The city has a population of around 690,000 people and is located on the Tyrrhenian Sea, about 70 km west of the Strait of Messina.
History
The history of Palermo dates back to the 8th century BC when it was founded by the Phoenicians. It was later conquered by the Greeks, Romans, Arabs, Normans, and Spanish. During the Middle Ages, Palermo was an important center of commerce and culture. It was also the capital of the Kingdom of Sicily from 1130 to 1816.
In the 19th century, Palermo experienced a period of economic and cultural growth. It was also the site of the famous Palermo Uprising of 1860, which was a popular revolt against the Bourbon monarchy. The city was also the site of the Palermo Massacre of 1866, when the Italian army killed hundreds of people in an attempt to suppress the uprising.
Geography
Palermo is located on the northern coast of Sicily, on the Tyrrhenian Sea. It is surrounded by mountains, including the Madonie and Peloritani ranges. The city is divided into nine districts, each with its own distinct character. The city center is located in the historic district of Kalsa, which is home to many of the city’s most important monuments and attractions.
The climate in Palermo is Mediterranean, with hot, dry summers and mild, wet winters. The average temperature in the summer is around 25°C (77°F) and in the winter it is around 10°C (50°F).
Economy
Palermo is an important economic center in Sicily. The city is home to a number of industries, including food processing, textiles, chemicals, and electronics. It is also a major port, with a large fishing fleet and a thriving tourism industry.
The city is also home to a number of universities, including the University of Palermo, which is one of the oldest universities in Italy.
Demographics
Palermo has a population of around 690,000 people. The majority of the population is of Italian descent, with a small minority of Arab and African immigrants. The city is also home to a large Jewish community, which dates back to the Middle Ages.
Palermo is a diverse and vibrant city, with a rich cultural heritage. It is home to a number of museums, galleries, and other attractions, as well as a lively nightlife. The city is also known for its delicious cuisine, which is a mix of Italian, Arab, and African influences.
Common Questions
What is Per Capita Income in Palermo?
Per Capita income in Palermo is $36,996.
What is the Median Family Income in Palermo?
Median Family Income in Palermo is $76,500.
What is the Median Household income in Palermo?
Median Household Income in Palermo is $64,375.
What is Inequality or Gini Index in Palermo?
Inequality or Gini Index in Palermo is 0.41.
What is the Total Population of Palermo?
Total Population of Palermo is 131.
What is the Total Male Population of Palermo?
Total Male Population of Palermo is 81.
What is the Total Female Population of Palermo?
Total Female Population of Palermo is 50.
What is the Ratio of Males per 100 Females in Palermo?
There are 162.00 Males per 100 Females in Palermo.
What is the Ratio of Females per 100 Males in Palermo?
There are 61.73 Females per 100 Males in Palermo.
What is the Median Population Age in Palermo?
Median Population Age in Palermo is 45.7 Years.
What is the Average Family Size in Palermo
Average Family Size in Palermo is 2.9 People.
What is the Average Household Size in Palermo
Average Household Size in Palermo is 2.1 People.
How Large is the Labor Force in Palermo?
There are 63 People in the Labor Forcein in Palermo.
What is the Percentage of People in the Labor Force in Palermo?
49.6% of People are in the Labor Force in Palermo.
What is the Unemployment Rate in Palermo?
Unemployment Rate in Palermo is 1.6%.