Page, ND Map & Demographics
Page Map
Page Overview
$32,213
PER CAPITA INCOME
$74,063
AVG FAMILY INCOME
$73,438
AVG HOUSEHOLD INCOME
65.7%
WAGE / INCOME GAP [ % ]
34.3¢/ $1
WAGE / INCOME GAP [ $ ]
0.35
INEQUALITY / GINI INDEX
193
TOTAL POPULATION
98
MALE POPULATION
95
FEMALE POPULATION
103.16
MALES / 100 FEMALES
96.94
FEMALES / 100 MALES
33.7
MEDIAN AGE
3.2
AVG FAMILY SIZE
2.3
AVG HOUSEHOLD SIZE
110
LABOR FORCE [ PEOPLE ]
72.8%
PERCENT IN LABOR FORCE
4.5%
UNEMPLOYMENT RATE
Page Zip Codes
Page Area Codes
Income in Page
Income Overview in Page
Per Capita Income in Page is $32,213, while median incomes of families and households are $74,063 and $73,438 respectively.
| Characteristic | Number | Measure |
| Per Capita Income | 193 | $32,213 |
| Median Family Income | 43 | $74,063 |
| Mean Family Income | 43 | $83,674 |
| Median Household Income | 83 | $73,438 |
| Mean Household Income | 83 | $73,140 |
| Income Deficit | 43 | $0 |
| Wage / Income Gap (%) | 193 | 65.68% |
| Wage / Income Gap ($) | 193 | 34.32¢ per $1 |
| Gini / Inequality Index | 193 | 0.35 |
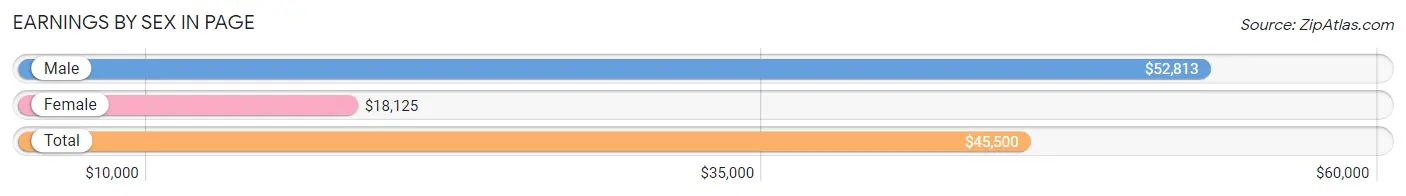
Earnings by Sex in Page
Average Earnings in Page are $45,500, $52,813 for men and $18,125 for women, a difference of 65.7%.
| Sex | Number | Average Earnings |
| Male | 65 (59.1%) | $52,813 |
| Female | 45 (40.9%) | $18,125 |
| Total | 110 (100.0%) | $45,500 |
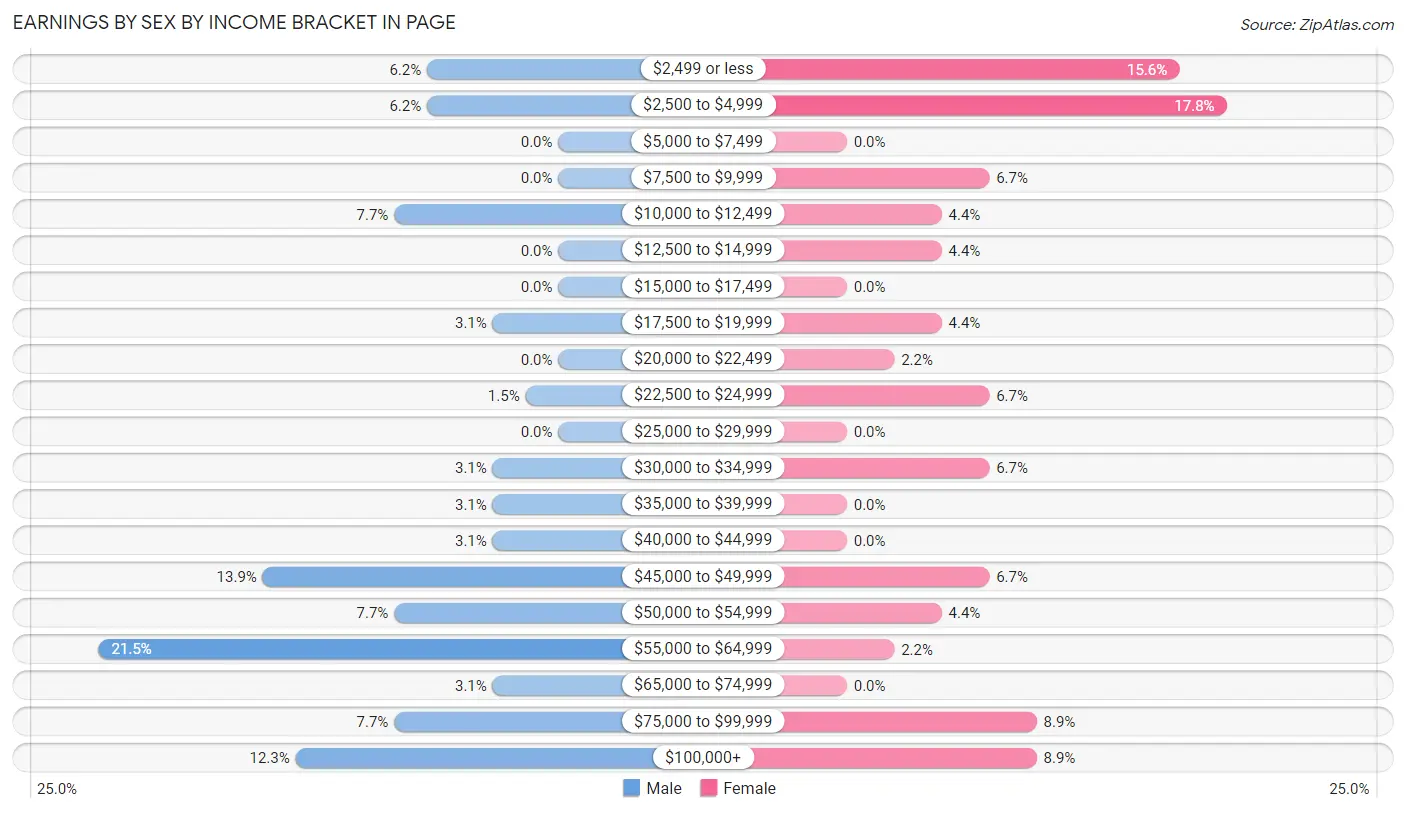
Earnings by Sex by Income Bracket in Page
The most common earnings brackets in Page are $55,000 to $64,999 for men (14 | 21.5%) and $2,500 to $4,999 for women (8 | 17.8%).
| Income | Male | Female |
| $2,499 or less | 4 (6.1%) | 7 (15.6%) |
| $2,500 to $4,999 | 4 (6.1%) | 8 (17.8%) |
| $5,000 to $7,499 | 0 (0.0%) | 0 (0.0%) |
| $7,500 to $9,999 | 0 (0.0%) | 3 (6.7%) |
| $10,000 to $12,499 | 5 (7.7%) | 2 (4.4%) |
| $12,500 to $14,999 | 0 (0.0%) | 2 (4.4%) |
| $15,000 to $17,499 | 0 (0.0%) | 0 (0.0%) |
| $17,500 to $19,999 | 2 (3.1%) | 2 (4.4%) |
| $20,000 to $22,499 | 0 (0.0%) | 1 (2.2%) |
| $22,500 to $24,999 | 1 (1.5%) | 3 (6.7%) |
| $25,000 to $29,999 | 0 (0.0%) | 0 (0.0%) |
| $30,000 to $34,999 | 2 (3.1%) | 3 (6.7%) |
| $35,000 to $39,999 | 2 (3.1%) | 0 (0.0%) |
| $40,000 to $44,999 | 2 (3.1%) | 0 (0.0%) |
| $45,000 to $49,999 | 9 (13.9%) | 3 (6.7%) |
| $50,000 to $54,999 | 5 (7.7%) | 2 (4.4%) |
| $55,000 to $64,999 | 14 (21.5%) | 1 (2.2%) |
| $65,000 to $74,999 | 2 (3.1%) | 0 (0.0%) |
| $75,000 to $99,999 | 5 (7.7%) | 4 (8.9%) |
| $100,000+ | 8 (12.3%) | 4 (8.9%) |
| Total | 65 (100.0%) | 45 (100.0%) |
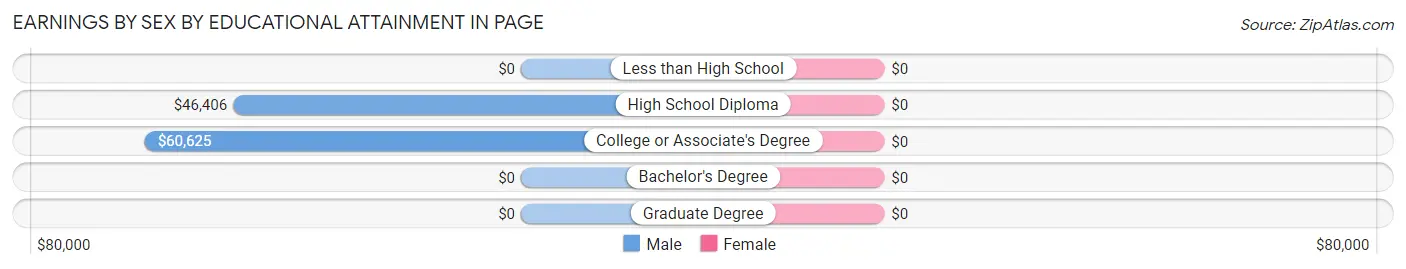
Earnings by Sex by Educational Attainment in Page
| Educational Attainment | Male Income | Female Income |
| Less than High School | - | - |
| High School Diploma | $46,406 | $0 |
| College or Associate's Degree | $60,625 | $0 |
| Bachelor's Degree | - | - |
| Graduate Degree | - | - |
| Total | $51,250 | $23,333 |
Family Income in Page
Family Income Brackets in Page
According to the Page family income data, there are 13 families falling into the $50,000 to $74,999 income range, which is the most common income bracket and makes up 30.2% of all families.
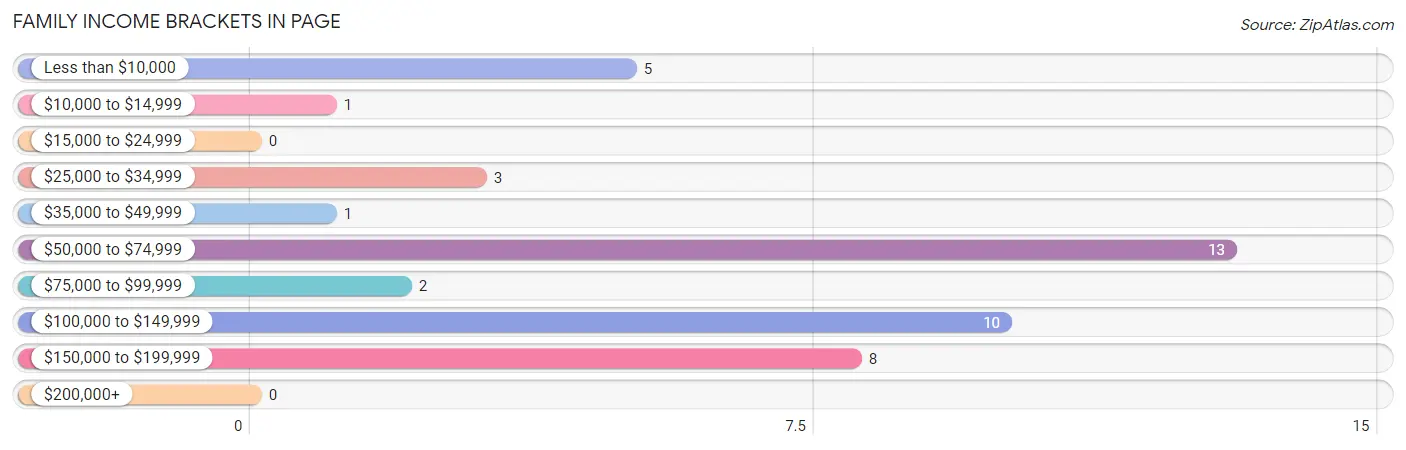
| Income Bracket | # Families | % Families |
| Less than $10,000 | 5 | 11.6% |
| $10,000 to $14,999 | 1 | 2.3% |
| $15,000 to $24,999 | 0 | 0.0% |
| $25,000 to $34,999 | 3 | 7.0% |
| $35,000 to $49,999 | 1 | 2.3% |
| $50,000 to $74,999 | 13 | 30.2% |
| $75,000 to $99,999 | 2 | 4.7% |
| $100,000 to $149,999 | 10 | 23.3% |
| $150,000 to $199,999 | 8 | 18.6% |
| $200,000+ | 0 | 0.0% |
Family Income by Famaliy Size in Page
4-person families (8 | 18.6%) account for the highest median family income in Page with $153,750 per family, while 4-person families (8 | 18.6%) have the highest median income of $38,438 per family member.
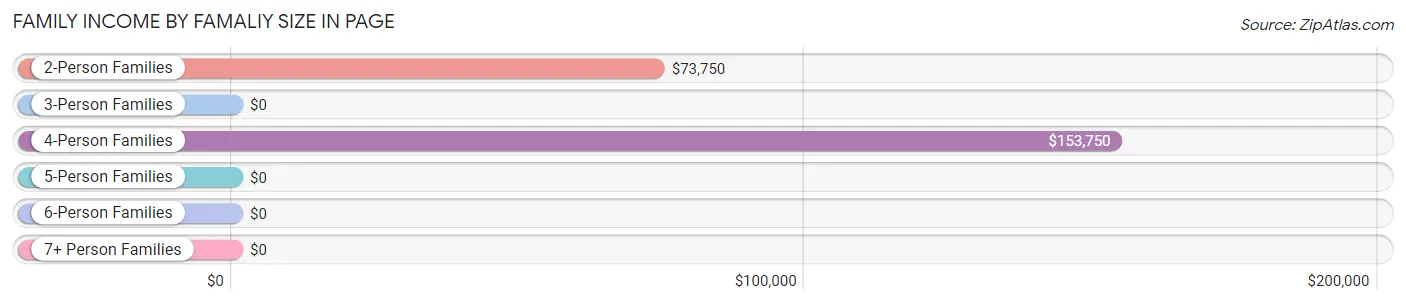
| Income Bracket | # Families | Median Income |
| 2-Person Families | 20 (46.5%) | $73,750 |
| 3-Person Families | 7 (16.3%) | $0 |
| 4-Person Families | 8 (18.6%) | $153,750 |
| 5-Person Families | 6 (14.0%) | $0 |
| 6-Person Families | 2 (4.6%) | $0 |
| 7+ Person Families | 0 (0.0%) | $0 |
| Total | 43 (100.0%) | $74,063 |
Family Income by Number of Earners in Page
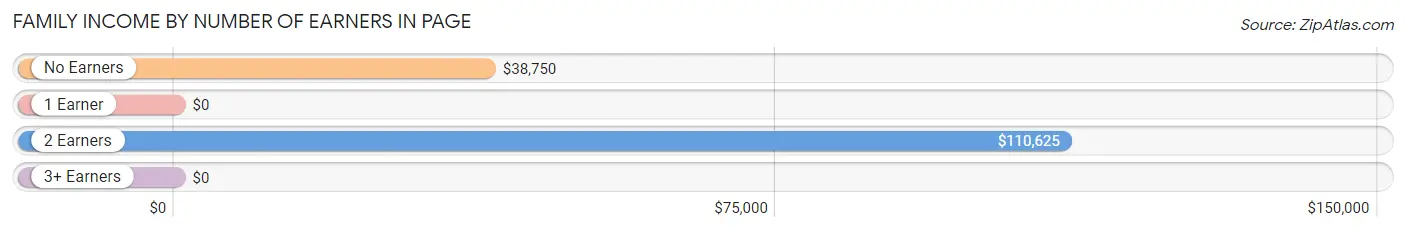
| Number of Earners | # Families | Median Income |
| No Earners | 6 (14.0%) | $38,750 |
| 1 Earner | 16 (37.2%) | $0 |
| 2 Earners | 15 (34.9%) | $110,625 |
| 3+ Earners | 6 (14.0%) | $0 |
| Total | 43 (100.0%) | $74,063 |
Household Income in Page
Household Income Brackets in Page
With 17 households falling in the category, the $50,000 to $74,999 income range is the most frequent in Page, accounting for 20.5% of all households.
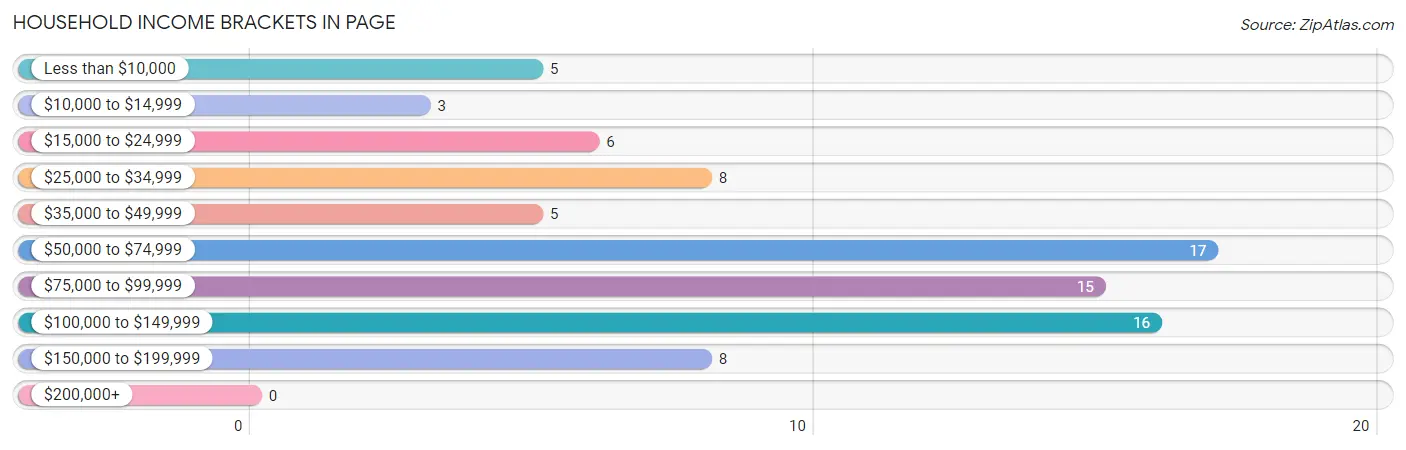
| Income Bracket | # Households | % Households |
| Less than $10,000 | 5 | 6.0% |
| $10,000 to $14,999 | 3 | 3.6% |
| $15,000 to $24,999 | 6 | 7.2% |
| $25,000 to $34,999 | 8 | 9.6% |
| $35,000 to $49,999 | 5 | 6.0% |
| $50,000 to $74,999 | 17 | 20.5% |
| $75,000 to $99,999 | 15 | 18.1% |
| $100,000 to $149,999 | 16 | 19.3% |
| $150,000 to $199,999 | 8 | 9.6% |
| $200,000+ | 0 | 0.0% |
Household Income by Householder Age in Page
The median household income in Page is $73,438, with the highest median household income of $108,750 found in the 15 to 24 years age bracket for the primary householder. A total of 10 households (12.0%) fall into this category. Meanwhile, the 45 to 64 years age bracket for the primary householder has the lowest median household income of $0, with 19 households (22.9%) in this group.
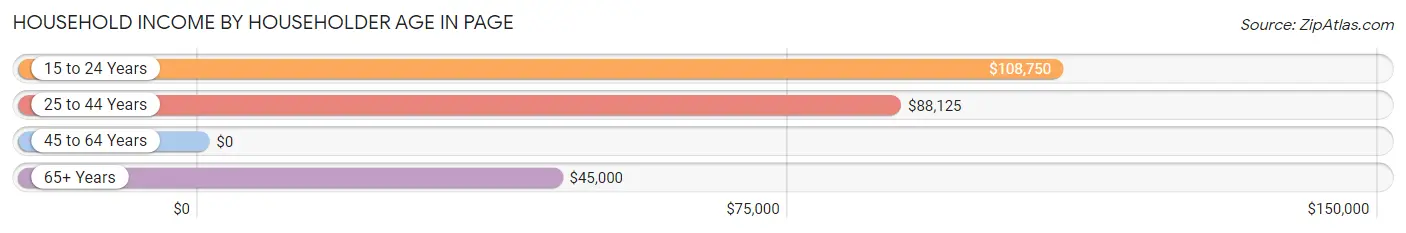
| Income Bracket | # Households | Median Income |
| 15 to 24 Years | 10 (12.0%) | $108,750 |
| 25 to 44 Years | 30 (36.1%) | $88,125 |
| 45 to 64 Years | 19 (22.9%) | $0 |
| 65+ Years | 24 (28.9%) | $45,000 |
| Total | 83 (100.0%) | $73,438 |
Poverty in Page
Income Below Poverty by Sex and Age in Page
With 7.1% poverty level for males and 16.8% for females among the residents of Page, 55 to 64 year old males and 45 to 54 year old females are the most vulnerable to poverty, with 3 males (30.0%) and 1 females (50.0%) in their respective age groups living below the poverty level.
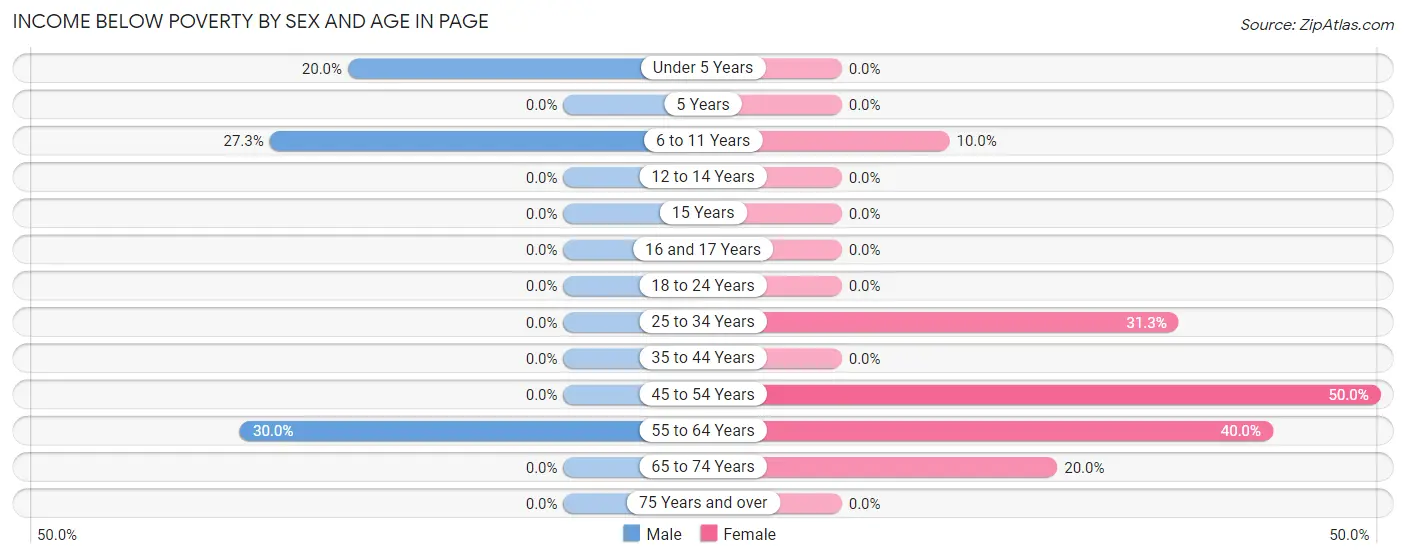
| Age Bracket | Male | Female |
| Under 5 Years | 1 (20.0%) | 0 (0.0%) |
| 5 Years | 0 (0.0%) | 0 (0.0%) |
| 6 to 11 Years | 3 (27.3%) | 2 (10.0%) |
| 12 to 14 Years | 0 (0.0%) | 0 (0.0%) |
| 15 Years | 0 (0.0%) | 0 (0.0%) |
| 16 and 17 Years | 0 (0.0%) | 0 (0.0%) |
| 18 to 24 Years | 0 (0.0%) | 0 (0.0%) |
| 25 to 34 Years | 0 (0.0%) | 5 (31.2%) |
| 35 to 44 Years | 0 (0.0%) | 0 (0.0%) |
| 45 to 54 Years | 0 (0.0%) | 1 (50.0%) |
| 55 to 64 Years | 3 (30.0%) | 4 (40.0%) |
| 65 to 74 Years | 0 (0.0%) | 4 (20.0%) |
| 75 Years and over | 0 (0.0%) | 0 (0.0%) |
| Total | 7 (7.1%) | 16 (16.8%) |
Income Above Poverty by Sex and Age in Page
According to the poverty statistics in Page, males aged 5 years and females aged under 5 years are the age groups that are most secure financially, with 100.0% of males and 100.0% of females in these age groups living above the poverty line.
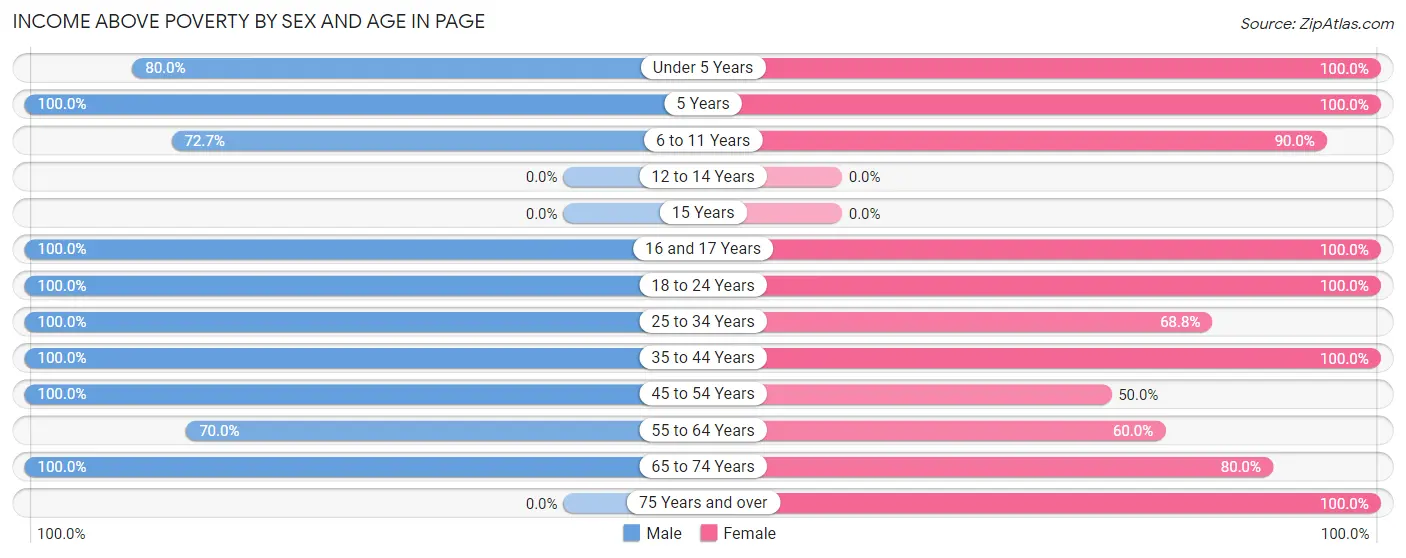
| Age Bracket | Male | Female |
| Under 5 Years | 4 (80.0%) | 2 (100.0%) |
| 5 Years | 1 (100.0%) | 3 (100.0%) |
| 6 to 11 Years | 8 (72.7%) | 18 (90.0%) |
| 12 to 14 Years | 0 (0.0%) | 0 (0.0%) |
| 15 Years | 0 (0.0%) | 0 (0.0%) |
| 16 and 17 Years | 8 (100.0%) | 3 (100.0%) |
| 18 to 24 Years | 14 (100.0%) | 6 (100.0%) |
| 25 to 34 Years | 12 (100.0%) | 11 (68.8%) |
| 35 to 44 Years | 17 (100.0%) | 12 (100.0%) |
| 45 to 54 Years | 6 (100.0%) | 1 (50.0%) |
| 55 to 64 Years | 7 (70.0%) | 6 (60.0%) |
| 65 to 74 Years | 14 (100.0%) | 16 (80.0%) |
| 75 Years and over | 0 (0.0%) | 1 (100.0%) |
| Total | 91 (92.9%) | 79 (83.2%) |
Income Below Poverty Among Married-Couple Families in Page
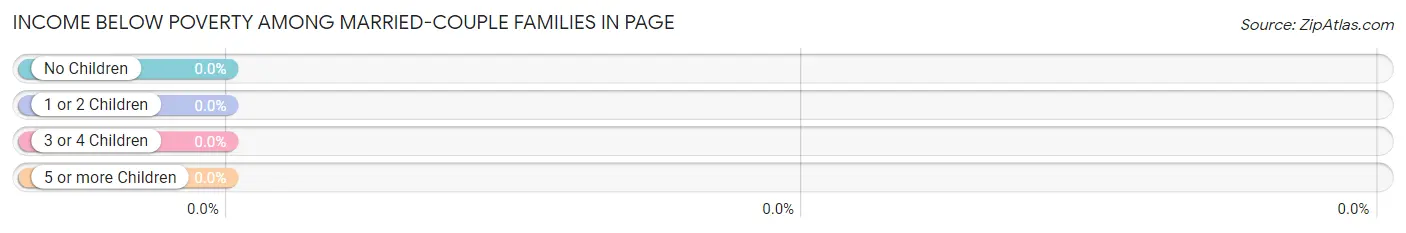
| Children | Above Poverty | Below Poverty |
| No Children | 17 (100.0%) | 0 (0.0%) |
| 1 or 2 Children | 10 (100.0%) | 0 (0.0%) |
| 3 or 4 Children | 8 (100.0%) | 0 (0.0%) |
| 5 or more Children | 0 (0.0%) | 0 (0.0%) |
| Total | 35 (100.0%) | 0 (0.0%) |
Income Below Poverty Among Single-Parent Households in Page
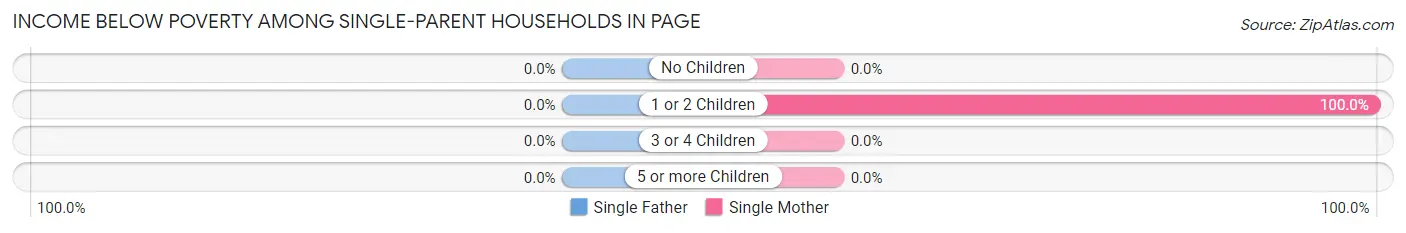
| Children | Single Father | Single Mother |
| No Children | 0 (0.0%) | 0 (0.0%) |
| 1 or 2 Children | 0 (0.0%) | 6 (100.0%) |
| 3 or 4 Children | 0 (0.0%) | 0 (0.0%) |
| 5 or more Children | 0 (0.0%) | 0 (0.0%) |
| Total | 0 (0.0%) | 6 (75.0%) |
Income Below Poverty Among Married-Couple vs Single-Parent Households in Page
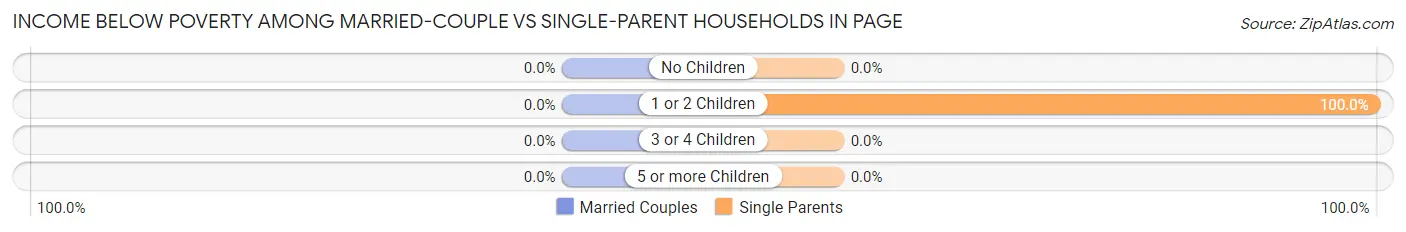
| Children | Married-Couple Families | Single-Parent Households |
| No Children | 0 (0.0%) | 0 (0.0%) |
| 1 or 2 Children | 0 (0.0%) | 6 (100.0%) |
| 3 or 4 Children | 0 (0.0%) | 0 (0.0%) |
| 5 or more Children | 0 (0.0%) | 0 (0.0%) |
| Total | 0 (0.0%) | 6 (75.0%) |
Race in Page
The most populous races in Page are White / Caucasian (179 | 92.7%), Two or more Races (9 | 4.7%), and Black / African American (4 | 2.1%).
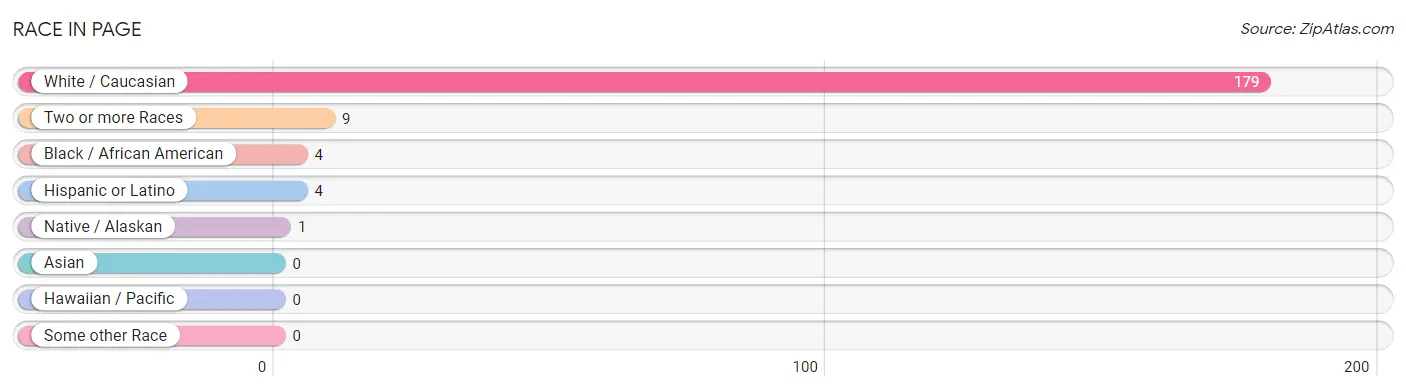
| Race | # Population | % Population |
| Asian | 0 | 0.0% |
| Black / African American | 4 | 2.1% |
| Hawaiian / Pacific | 0 | 0.0% |
| Hispanic or Latino | 4 | 2.1% |
| Native / Alaskan | 1 | 0.5% |
| White / Caucasian | 179 | 92.7% |
| Two or more Races | 9 | 4.7% |
| Some other Race | 0 | 0.0% |
| Total | 193 | 100.0% |
Ancestry in Page
The most populous ancestries reported in Page are German (82 | 42.5%), Norwegian (63 | 32.6%), English (21 | 10.9%), Russian (14 | 7.2%), and American (11 | 5.7%), together accounting for 99.0% of all Page residents.
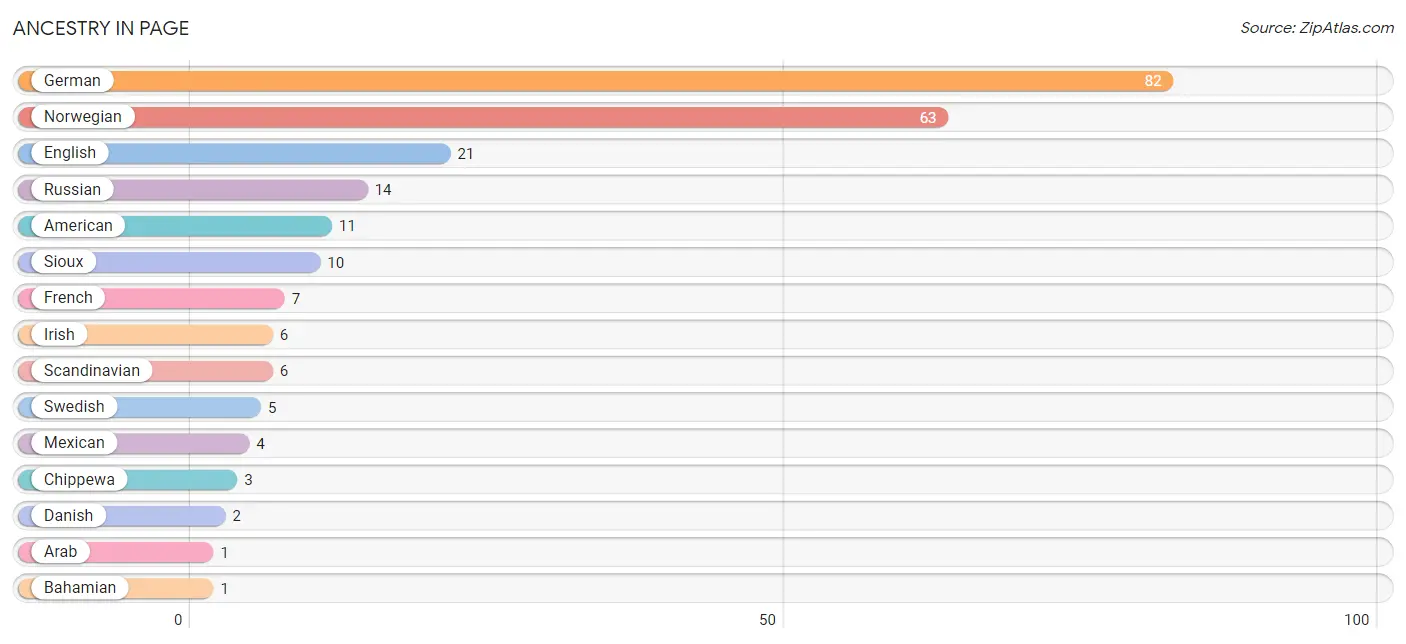
| Ancestry | # Population | % Population |
| American | 11 | 5.7% |
| Arab | 1 | 0.5% |
| Bahamian | 1 | 0.5% |
| British | 1 | 0.5% |
| Chippewa | 3 | 1.5% |
| Danish | 2 | 1.0% |
| English | 21 | 10.9% |
| French | 7 | 3.6% |
| French Canadian | 1 | 0.5% |
| German | 82 | 42.5% |
| Irish | 6 | 3.1% |
| Italian | 1 | 0.5% |
| Lebanese | 1 | 0.5% |
| Mexican | 4 | 2.1% |
| Norwegian | 63 | 32.6% |
| Polish | 1 | 0.5% |
| Russian | 14 | 7.2% |
| Scandinavian | 6 | 3.1% |
| Scottish | 1 | 0.5% |
| Sioux | 10 | 5.2% |
| Swedish | 5 | 2.6% | View All 21 Rows |
Immigrants in Page

| Immigration Origin | # Population | % Population | View All 0 Rows |
Sex and Age in Page
Sex and Age in Page
The most populous age groups in Page are 20 to 24 Years (14 | 14.3%) for men and 30 to 34 Years (14 | 14.7%) for women.
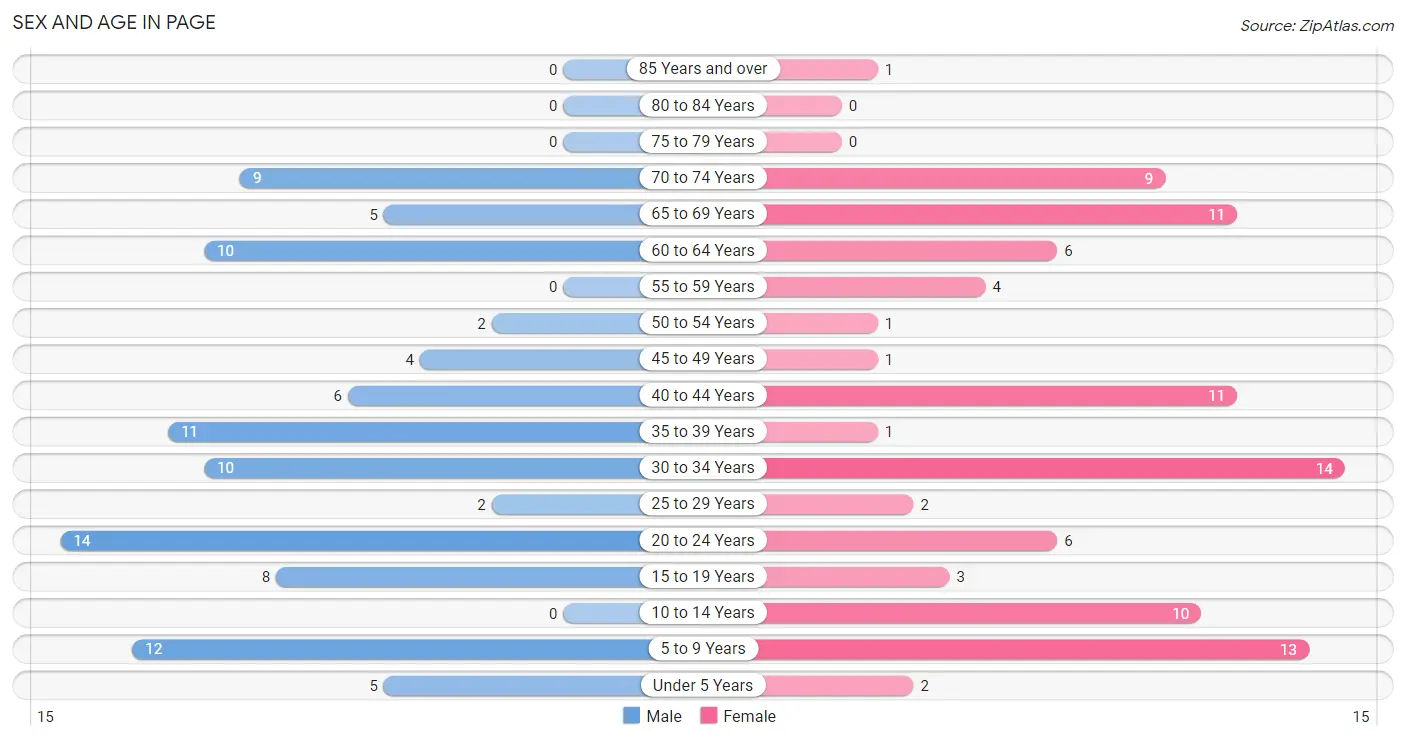
| Age Bracket | Male | Female |
| Under 5 Years | 5 (5.1%) | 2 (2.1%) |
| 5 to 9 Years | 12 (12.2%) | 13 (13.7%) |
| 10 to 14 Years | 0 (0.0%) | 10 (10.5%) |
| 15 to 19 Years | 8 (8.2%) | 3 (3.2%) |
| 20 to 24 Years | 14 (14.3%) | 6 (6.3%) |
| 25 to 29 Years | 2 (2.0%) | 2 (2.1%) |
| 30 to 34 Years | 10 (10.2%) | 14 (14.7%) |
| 35 to 39 Years | 11 (11.2%) | 1 (1.1%) |
| 40 to 44 Years | 6 (6.1%) | 11 (11.6%) |
| 45 to 49 Years | 4 (4.1%) | 1 (1.1%) |
| 50 to 54 Years | 2 (2.0%) | 1 (1.1%) |
| 55 to 59 Years | 0 (0.0%) | 4 (4.2%) |
| 60 to 64 Years | 10 (10.2%) | 6 (6.3%) |
| 65 to 69 Years | 5 (5.1%) | 11 (11.6%) |
| 70 to 74 Years | 9 (9.2%) | 9 (9.5%) |
| 75 to 79 Years | 0 (0.0%) | 0 (0.0%) |
| 80 to 84 Years | 0 (0.0%) | 0 (0.0%) |
| 85 Years and over | 0 (0.0%) | 1 (1.1%) |
| Total | 98 (100.0%) | 95 (100.0%) |
Families and Households in Page
Median Family Size in Page
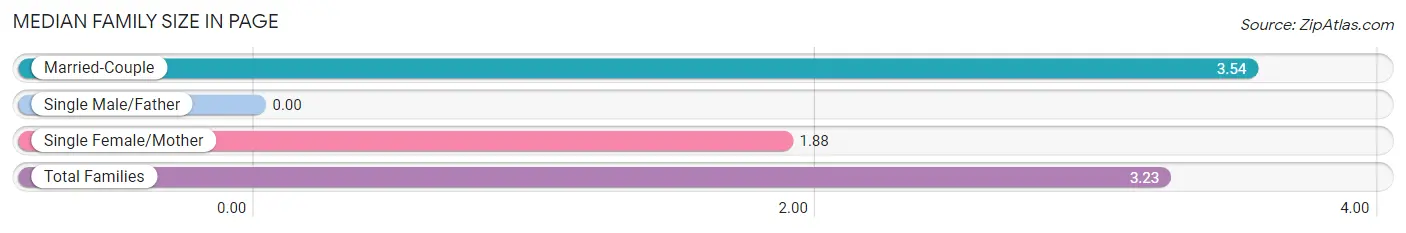
| Family Type | # Families | Family Size |
| Married-Couple | 35 (81.4%) | 3.54 |
| Single Male/Father | 0 (0.0%) | - |
| Single Female/Mother | 8 (18.6%) | 1.88 |
| Total Families | 43 (100.0%) | 3.23 |
Median Household Size in Page
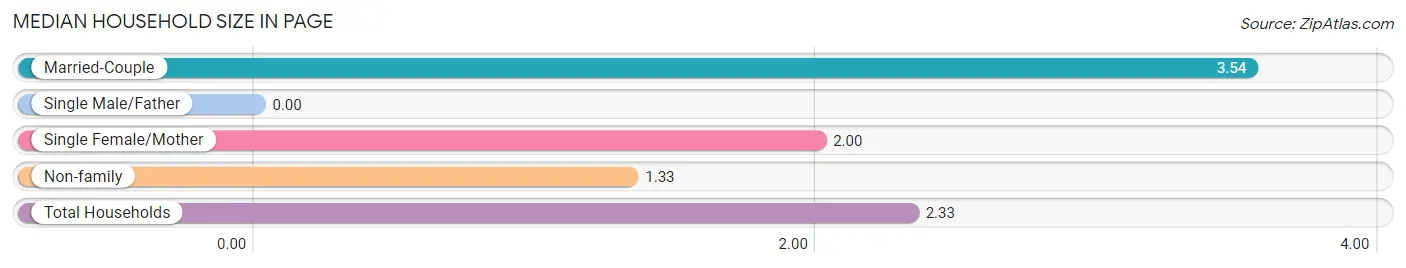
| Household Type | # Households | Household Size |
| Married-Couple | 35 (42.2%) | 3.54 |
| Single Male/Father | 0 (0.0%) | - |
| Single Female/Mother | 8 (9.6%) | 2.00 |
| Non-family | 40 (48.2%) | 1.33 |
| Total Households | 83 (100.0%) | 2.33 |
Household Size by Marriage Status in Page
Out of a total of 83 households in Page, 43 (51.8%) are family households, while 40 (48.2%) are nonfamily households. The most numerous type of family households are 2-person households, comprising 19, and the most common type of nonfamily households are 1-person households, comprising 25.
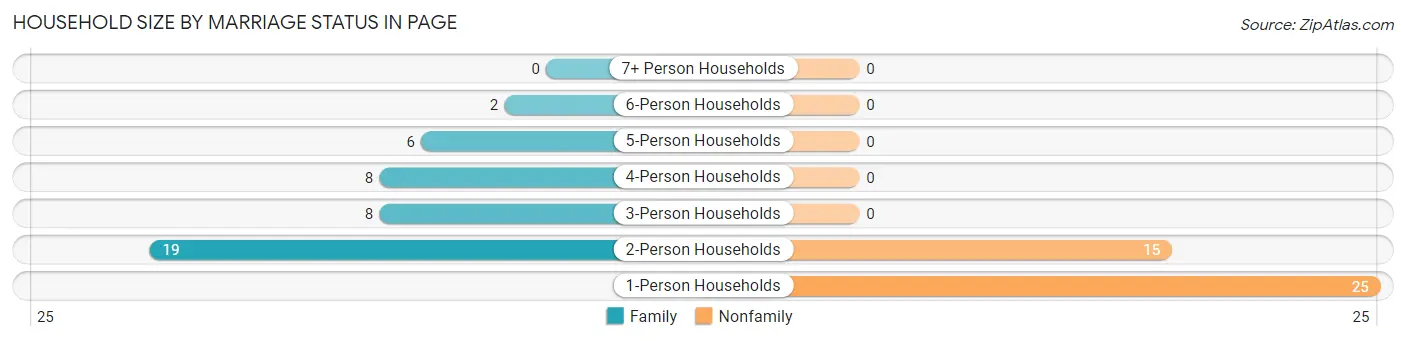
| Household Size | Family Households | Nonfamily Households |
| 1-Person Households | - | 25 (30.1%) |
| 2-Person Households | 19 (22.9%) | 15 (18.1%) |
| 3-Person Households | 8 (9.6%) | 0 (0.0%) |
| 4-Person Households | 8 (9.6%) | 0 (0.0%) |
| 5-Person Households | 6 (7.2%) | 0 (0.0%) |
| 6-Person Households | 2 (2.4%) | 0 (0.0%) |
| 7+ Person Households | 0 (0.0%) | 0 (0.0%) |
| Total | 43 (51.8%) | 40 (48.2%) |
Female Fertility in Page
Fertility by Age in Page
Average fertility rate in Page is 184.0 births per 1,000 women. Women in the age bracket of 20 to 34 years have the highest fertility rate with 318.0 births per 1,000 women. Women in the age bracket of 20 to 34 years acount for 100.0% of all women with births.
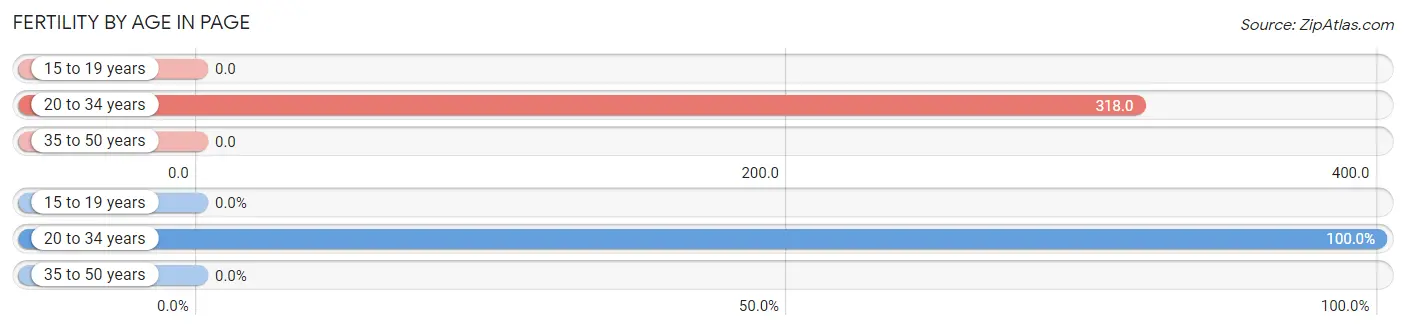
| Age Bracket | Women with Births | Births / 1,000 Women |
| 15 to 19 years | 0 (0.0%) | 0.0 |
| 20 to 34 years | 7 (100.0%) | 318.0 |
| 35 to 50 years | 0 (0.0%) | 0.0 |
| Total | 7 (100.0%) | 184.0 |
Fertility by Age by Marriage Status in Page
28.6% of women with births (7) in Page are married. The highest percentage of unmarried women with births falls into 20 to 34 years age bracket with 71.4% of them unmarried at the time of birth, while the lowest percentage of unmarried women with births belong to 20 to 34 years age bracket with 71.4% of them unmarried.
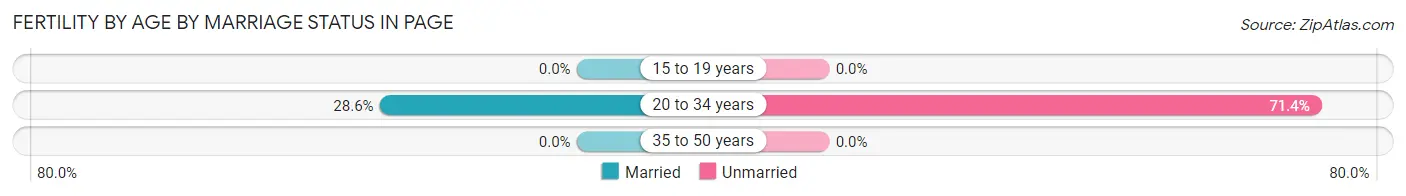
| Age Bracket | Married | Unmarried |
| 15 to 19 years | 0 (0.0%) | 0 (0.0%) |
| 20 to 34 years | 2 (28.6%) | 5 (71.4%) |
| 35 to 50 years | 0 (0.0%) | 0 (0.0%) |
| Total | 2 (28.6%) | 5 (71.4%) |
Fertility by Education in Page
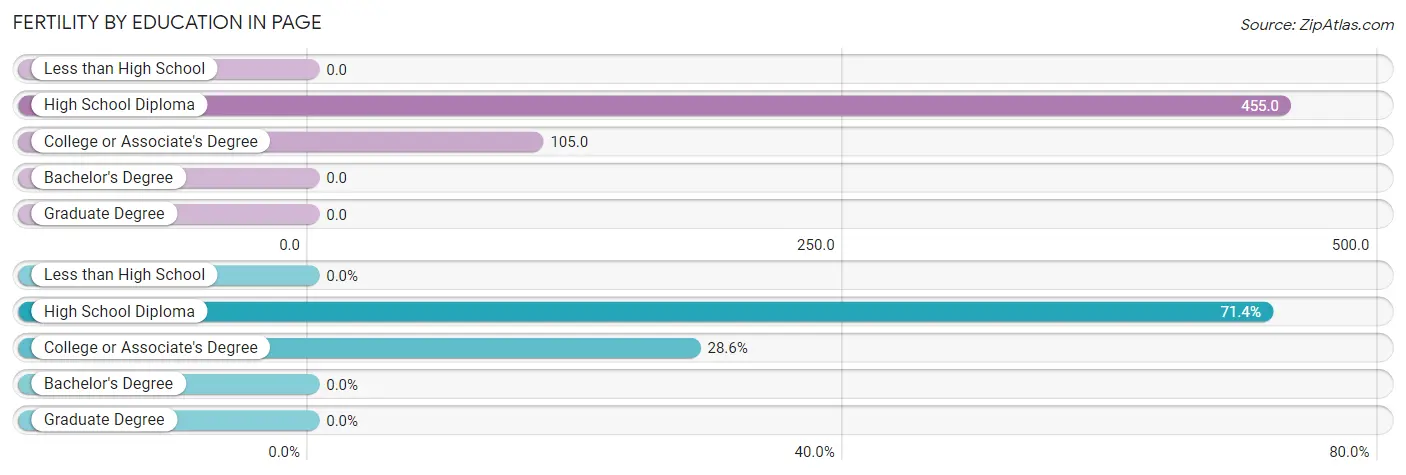
| Educational Attainment | Women with Births | Births / 1,000 Women |
| Less than High School | 0 (0.0%) | 0.0 |
| High School Diploma | 5 (71.4%) | 455.0 |
| College or Associate's Degree | 2 (28.6%) | 105.0 |
| Bachelor's Degree | 0 (0.0%) | 0.0 |
| Graduate Degree | 0 (0.0%) | 0.0 |
| Total | 7 (100.0%) | 184.0 |
Fertility by Education by Marriage Status in Page
71.4% of women with births in Page are unmarried. Women with the educational attainment of college or associate's degree are most likely to be married with 100.0% of them married at childbirth, while women with the educational attainment of high school diploma are least likely to be married with 100.0% of them unmarried at childbirth.
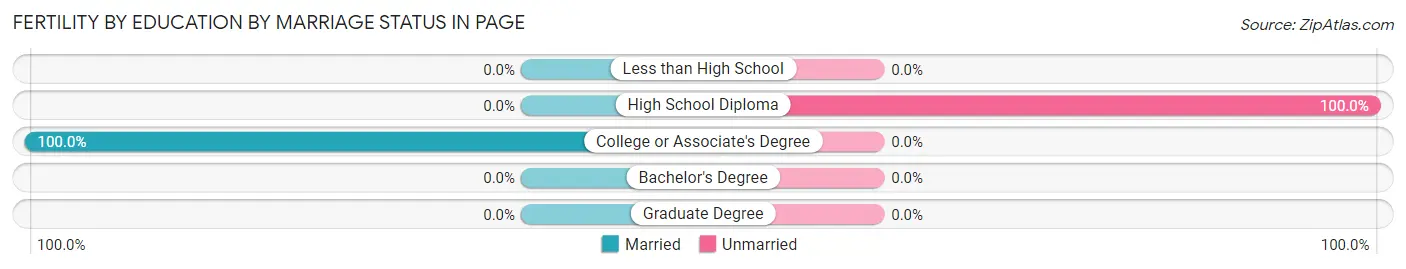
| Educational Attainment | Married | Unmarried |
| Less than High School | 0 (0.0%) | 0 (0.0%) |
| High School Diploma | 0 (0.0%) | 5 (100.0%) |
| College or Associate's Degree | 2 (100.0%) | 0 (0.0%) |
| Bachelor's Degree | 0 (0.0%) | 0 (0.0%) |
| Graduate Degree | 0 (0.0%) | 0 (0.0%) |
| Total | 2 (28.6%) | 5 (71.4%) |
Employment Characteristics in Page
Employment by Class of Employer in Page
Among the 105 employed individuals in Page, private company employees (77 | 73.3%), self-employed (not incorporated) (14 | 13.3%), and local government employees (6 | 5.7%) make up the most common classes of employment.
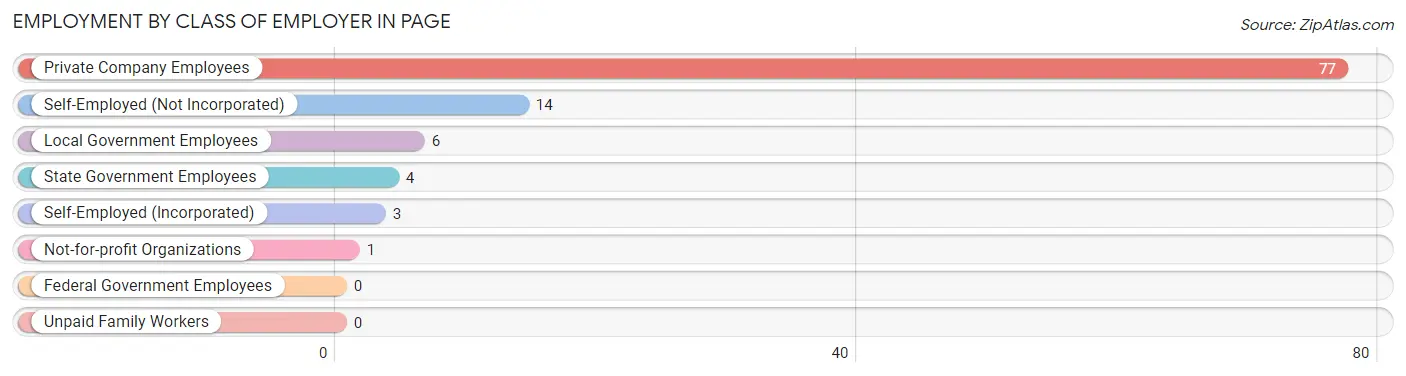
| Employer Class | # Employees | % Employees |
| Private Company Employees | 77 | 73.3% |
| Self-Employed (Incorporated) | 3 | 2.9% |
| Self-Employed (Not Incorporated) | 14 | 13.3% |
| Not-for-profit Organizations | 1 | 0.9% |
| Local Government Employees | 6 | 5.7% |
| State Government Employees | 4 | 3.8% |
| Federal Government Employees | 0 | 0.0% |
| Unpaid Family Workers | 0 | 0.0% |
| Total | 105 | 100.0% |
Employment Status by Age in Page
According to the labor force statistics for Page, out of the total population over 16 years of age (151), 72.8% or 110 individuals are in the labor force, with 4.5% or 5 of them unemployed. The age group with the highest labor force participation rate is 16 to 19 years, with 100.0% or 11 individuals in the labor force. Within the labor force, the 30 to 34 years age range has the highest percentage of unemployed individuals, with 22.7% or 5 of them being unemployed.
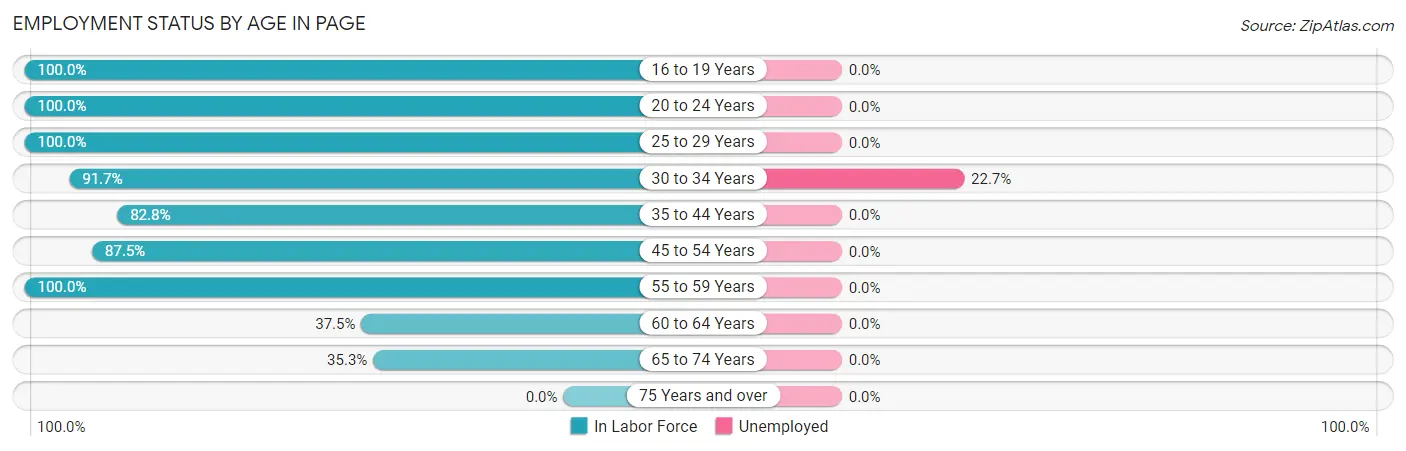
| Age Bracket | In Labor Force | Unemployed |
| 16 to 19 Years | 11 (100.0%) | 0 (0.0%) |
| 20 to 24 Years | 20 (100.0%) | 0 (0.0%) |
| 25 to 29 Years | 4 (100.0%) | 0 (0.0%) |
| 30 to 34 Years | 22 (91.7%) | 5 (22.7%) |
| 35 to 44 Years | 24 (82.8%) | 0 (0.0%) |
| 45 to 54 Years | 7 (87.5%) | 0 (0.0%) |
| 55 to 59 Years | 4 (100.0%) | 0 (0.0%) |
| 60 to 64 Years | 6 (37.5%) | 0 (0.0%) |
| 65 to 74 Years | 12 (35.3%) | 0 (0.0%) |
| 75 Years and over | 0 (0.0%) | 0 (0.0%) |
| Total | 110 (72.8%) | 5 (4.5%) |
Employment Status by Educational Attainment in Page
According to labor force statistics for Page, 78.8% of individuals (67) out of the total population between 25 and 64 years of age (85) are in the labor force, with 7.5% or 5 of them being unemployed. The group with the highest labor force participation rate are those with the educational attainment of less than high school, with 100.0% or 1 individuals in the labor force. Within the labor force, individuals with high school diploma education have the highest percentage of unemployment, with 19.2% or 5 of them being unemployed.
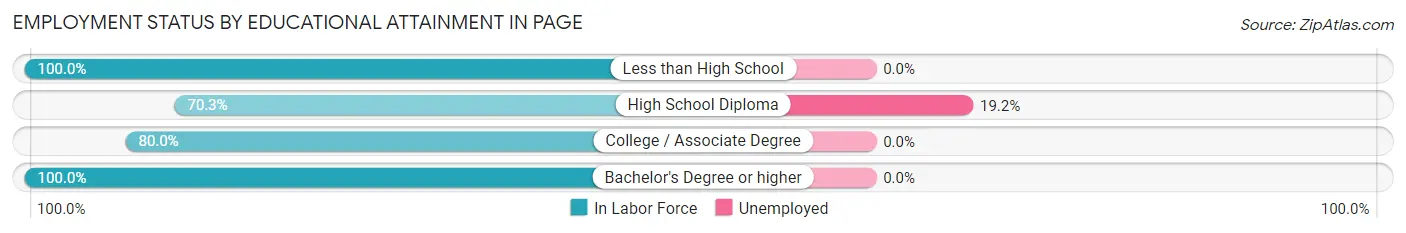
| Educational Attainment | In Labor Force | Unemployed |
| Less than High School | 1 (100.0%) | 0 (0.0%) |
| High School Diploma | 26 (70.3%) | 7 (19.2%) |
| College / Associate Degree | 28 (80.0%) | 0 (0.0%) |
| Bachelor's Degree or higher | 12 (100.0%) | 0 (0.0%) |
| Total | 67 (78.8%) | 6 (7.5%) |
Employment Occupations by Sex in Page
Management, Business, Science and Arts Occupations
The most common Management, Business, Science and Arts occupations in Page are Management (19 | 18.1%), Computers, Engineering & Science (5 | 4.8%), Computers & Mathematics (4 | 3.8%), Business & Financial (2 | 1.9%), and Health Diagnosing & Treating (2 | 1.9%).
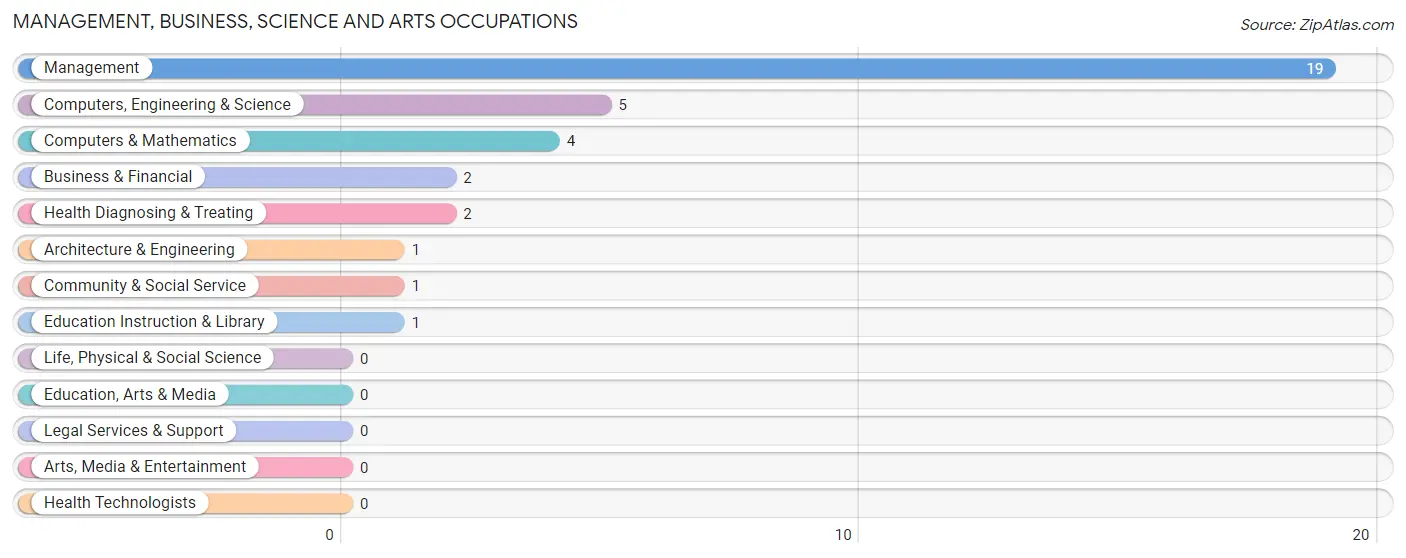
Management, Business, Science and Arts Occupations by Sex
Within the Management, Business, Science and Arts occupations in Page, the most male-oriented occupations are Computers, Engineering & Science (100.0%), Computers & Mathematics (100.0%), and Architecture & Engineering (100.0%), while the most female-oriented occupations are Business & Financial (100.0%), Community & Social Service (100.0%), and Education Instruction & Library (100.0%).
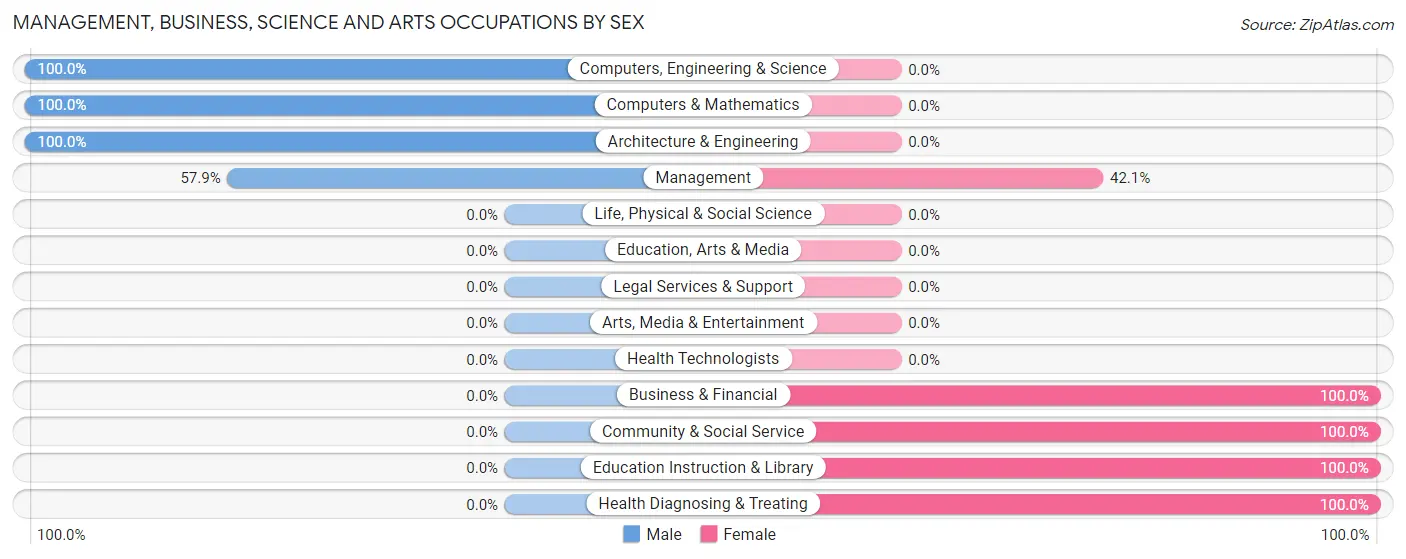
| Occupation | Male | Female |
| Management | 11 (57.9%) | 8 (42.1%) |
| Business & Financial | 0 (0.0%) | 2 (100.0%) |
| Computers, Engineering & Science | 5 (100.0%) | 0 (0.0%) |
| Computers & Mathematics | 4 (100.0%) | 0 (0.0%) |
| Architecture & Engineering | 1 (100.0%) | 0 (0.0%) |
| Life, Physical & Social Science | 0 (0.0%) | 0 (0.0%) |
| Community & Social Service | 0 (0.0%) | 1 (100.0%) |
| Education, Arts & Media | 0 (0.0%) | 0 (0.0%) |
| Legal Services & Support | 0 (0.0%) | 0 (0.0%) |
| Education Instruction & Library | 0 (0.0%) | 1 (100.0%) |
| Arts, Media & Entertainment | 0 (0.0%) | 0 (0.0%) |
| Health Diagnosing & Treating | 0 (0.0%) | 2 (100.0%) |
| Health Technologists | 0 (0.0%) | 0 (0.0%) |
| Total (Category) | 16 (55.2%) | 13 (44.8%) |
| Total (Overall) | 65 (61.9%) | 40 (38.1%) |
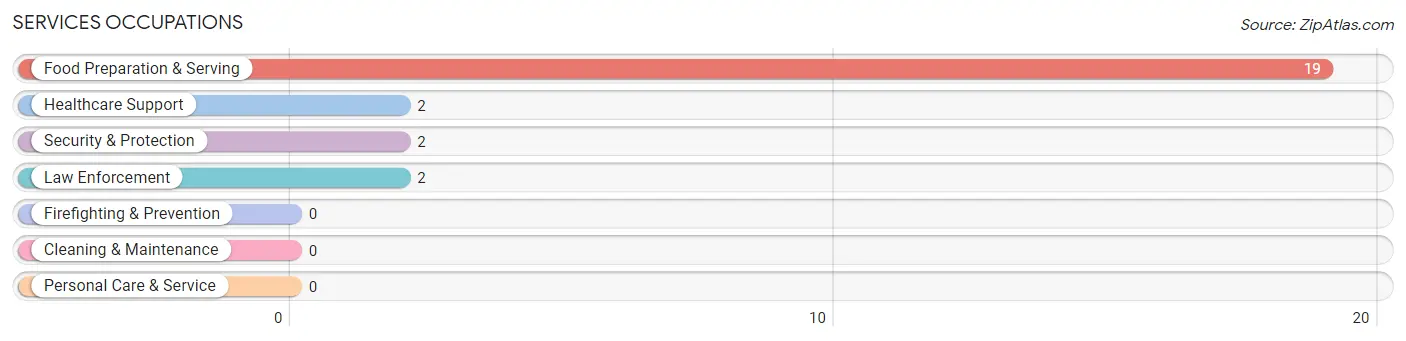
Services Occupations
The most common Services occupations in Page are Food Preparation & Serving (19 | 18.1%), Healthcare Support (2 | 1.9%), Security & Protection (2 | 1.9%), and Law Enforcement (2 | 1.9%).
Services Occupations by Sex
Within the Services occupations in Page, the most male-oriented occupations are Security & Protection (100.0%), Law Enforcement (100.0%), and Food Preparation & Serving (47.4%), while the most female-oriented occupations are Healthcare Support (100.0%), and Food Preparation & Serving (52.6%).
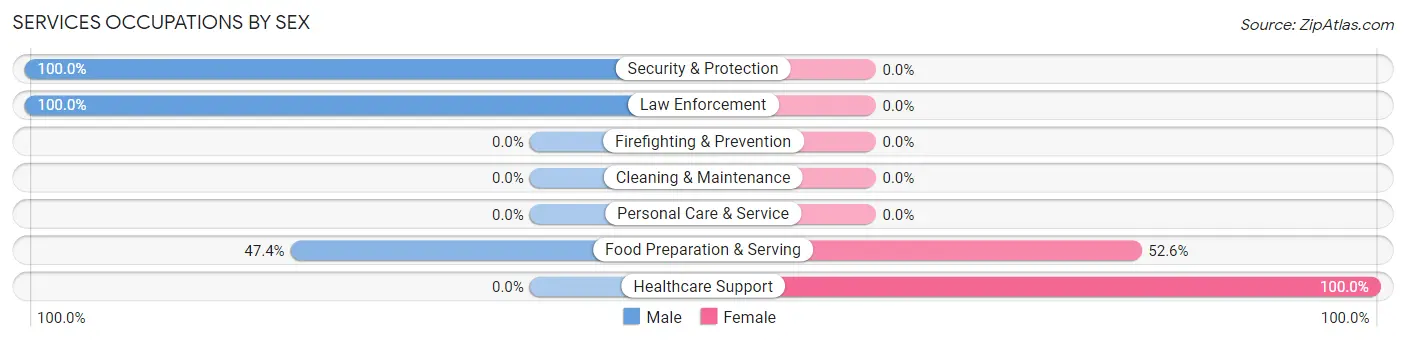
| Occupation | Male | Female |
| Healthcare Support | 0 (0.0%) | 2 (100.0%) |
| Security & Protection | 2 (100.0%) | 0 (0.0%) |
| Firefighting & Prevention | 0 (0.0%) | 0 (0.0%) |
| Law Enforcement | 2 (100.0%) | 0 (0.0%) |
| Food Preparation & Serving | 9 (47.4%) | 10 (52.6%) |
| Cleaning & Maintenance | 0 (0.0%) | 0 (0.0%) |
| Personal Care & Service | 0 (0.0%) | 0 (0.0%) |
| Total (Category) | 11 (47.8%) | 12 (52.2%) |
| Total (Overall) | 65 (61.9%) | 40 (38.1%) |
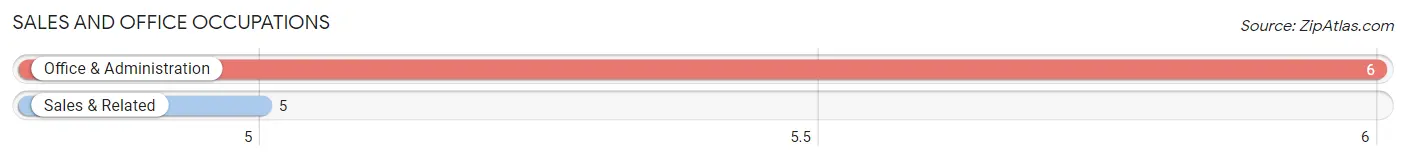
Sales and Office Occupations
The most common Sales and Office occupations in Page are Office & Administration (6 | 5.7%), and Sales & Related (5 | 4.8%).
Sales and Office Occupations by Sex

| Occupation | Male | Female |
| Sales & Related | 0 (0.0%) | 5 (100.0%) |
| Office & Administration | 0 (0.0%) | 6 (100.0%) |
| Total (Category) | 0 (0.0%) | 11 (100.0%) |
| Total (Overall) | 65 (61.9%) | 40 (38.1%) |
Natural Resources, Construction and Maintenance Occupations
The most common Natural Resources, Construction and Maintenance occupations in Page are Construction & Extraction (14 | 13.3%), Installation, Maintenance & Repair (12 | 11.4%), and Farming, Fishing & Forestry (6 | 5.7%).
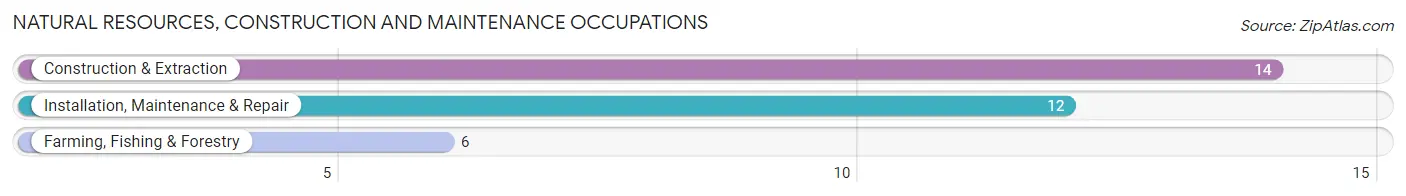
Natural Resources, Construction and Maintenance Occupations by Sex
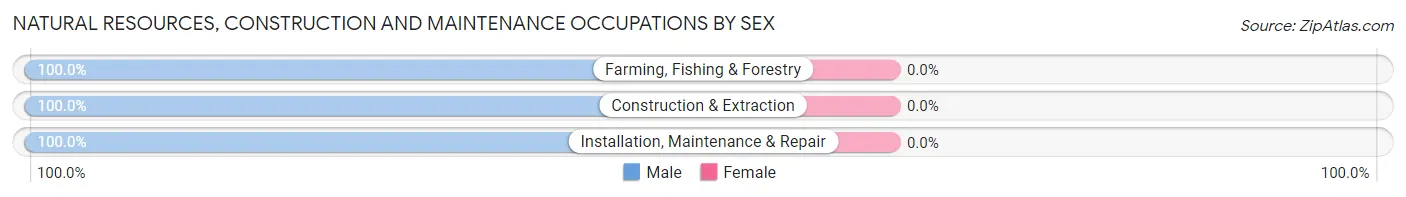
| Occupation | Male | Female |
| Farming, Fishing & Forestry | 6 (100.0%) | 0 (0.0%) |
| Construction & Extraction | 14 (100.0%) | 0 (0.0%) |
| Installation, Maintenance & Repair | 12 (100.0%) | 0 (0.0%) |
| Total (Category) | 32 (100.0%) | 0 (0.0%) |
| Total (Overall) | 65 (61.9%) | 40 (38.1%) |
Production, Transportation and Moving Occupations
The most common Production, Transportation and Moving occupations in Page are Transportation (7 | 6.7%), and Production (3 | 2.9%).
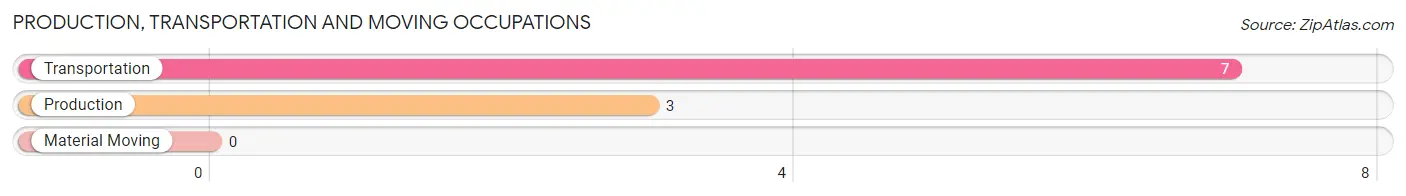
Production, Transportation and Moving Occupations by Sex
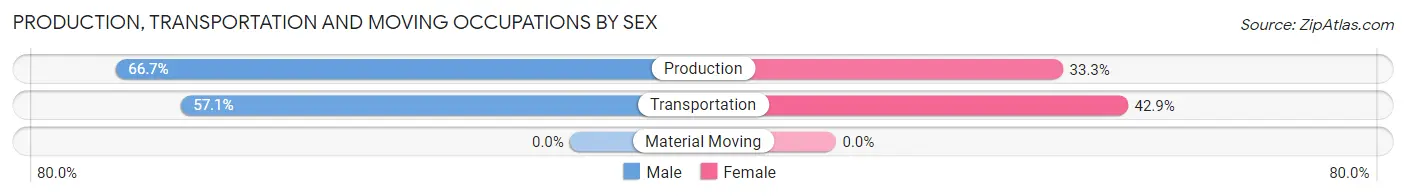
| Occupation | Male | Female |
| Production | 2 (66.7%) | 1 (33.3%) |
| Transportation | 4 (57.1%) | 3 (42.9%) |
| Material Moving | 0 (0.0%) | 0 (0.0%) |
| Total (Category) | 6 (60.0%) | 4 (40.0%) |
| Total (Overall) | 65 (61.9%) | 40 (38.1%) |
Employment Industries by Sex in Page
Employment Industries in Page
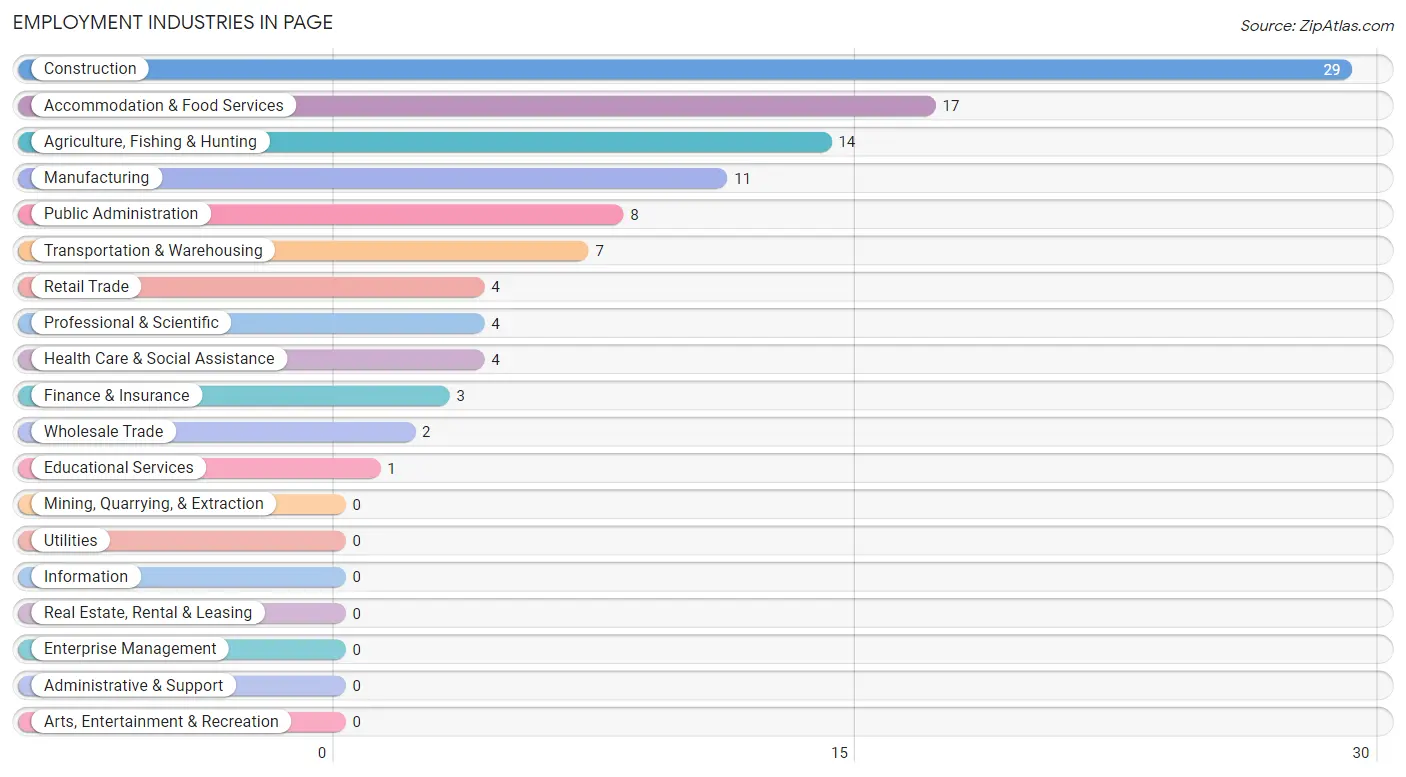
The major employment industries in Page include Construction (29 | 27.6%), Accommodation & Food Services (17 | 16.2%), Agriculture, Fishing & Hunting (14 | 13.3%), Manufacturing (11 | 10.5%), and Public Administration (8 | 7.6%).
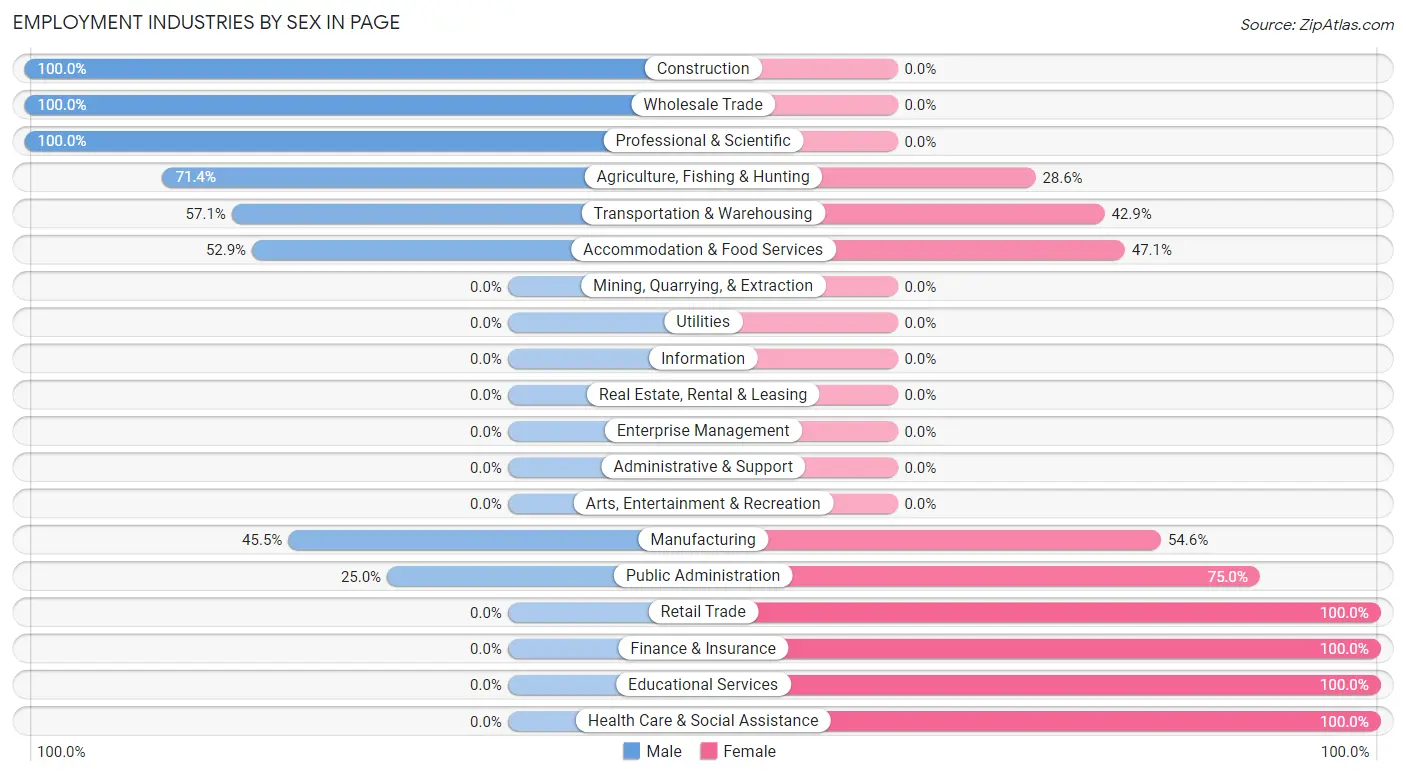
Employment Industries by Sex in Page
The Page industries that see more men than women are Construction (100.0%), Wholesale Trade (100.0%), and Professional & Scientific (100.0%), whereas the industries that tend to have a higher number of women are Retail Trade (100.0%), Finance & Insurance (100.0%), and Educational Services (100.0%).
| Industry | Male | Female |
| Agriculture, Fishing & Hunting | 10 (71.4%) | 4 (28.6%) |
| Mining, Quarrying, & Extraction | 0 (0.0%) | 0 (0.0%) |
| Construction | 29 (100.0%) | 0 (0.0%) |
| Manufacturing | 5 (45.5%) | 6 (54.5%) |
| Wholesale Trade | 2 (100.0%) | 0 (0.0%) |
| Retail Trade | 0 (0.0%) | 4 (100.0%) |
| Transportation & Warehousing | 4 (57.1%) | 3 (42.9%) |
| Utilities | 0 (0.0%) | 0 (0.0%) |
| Information | 0 (0.0%) | 0 (0.0%) |
| Finance & Insurance | 0 (0.0%) | 3 (100.0%) |
| Real Estate, Rental & Leasing | 0 (0.0%) | 0 (0.0%) |
| Professional & Scientific | 4 (100.0%) | 0 (0.0%) |
| Enterprise Management | 0 (0.0%) | 0 (0.0%) |
| Administrative & Support | 0 (0.0%) | 0 (0.0%) |
| Educational Services | 0 (0.0%) | 1 (100.0%) |
| Health Care & Social Assistance | 0 (0.0%) | 4 (100.0%) |
| Arts, Entertainment & Recreation | 0 (0.0%) | 0 (0.0%) |
| Accommodation & Food Services | 9 (52.9%) | 8 (47.1%) |
| Public Administration | 2 (25.0%) | 6 (75.0%) |
| Total | 65 (61.9%) | 40 (38.1%) |
Education in Page
School Enrollment in Page
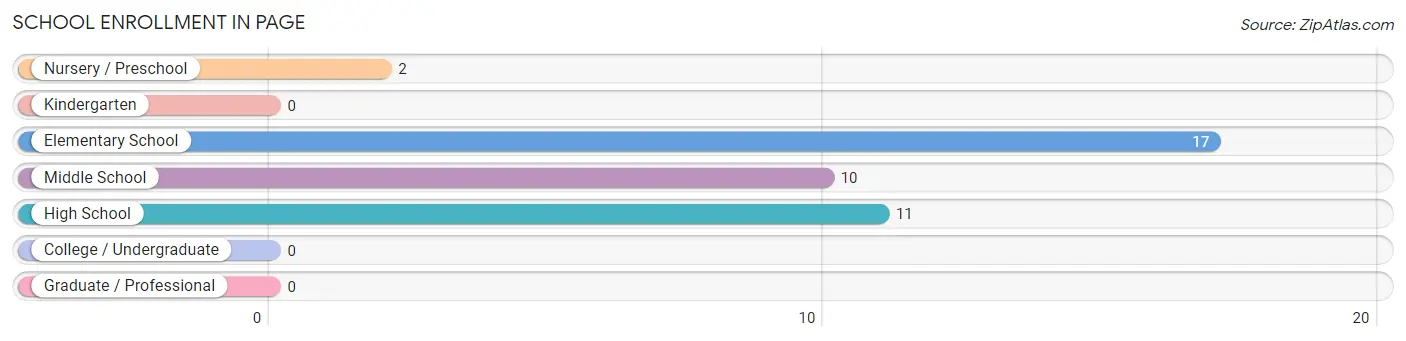
The most common levels of schooling among the 40 students in Page are elementary school (17 | 42.5%), high school (11 | 27.5%), and middle school (10 | 25.0%).
| School Level | # Students | % Students |
| Nursery / Preschool | 2 | 5.0% |
| Kindergarten | 0 | 0.0% |
| Elementary School | 17 | 42.5% |
| Middle School | 10 | 25.0% |
| High School | 11 | 27.5% |
| College / Undergraduate | 0 | 0.0% |
| Graduate / Professional | 0 | 0.0% |
| Total | 40 | 100.0% |
School Enrollment by Age by Funding Source in Page
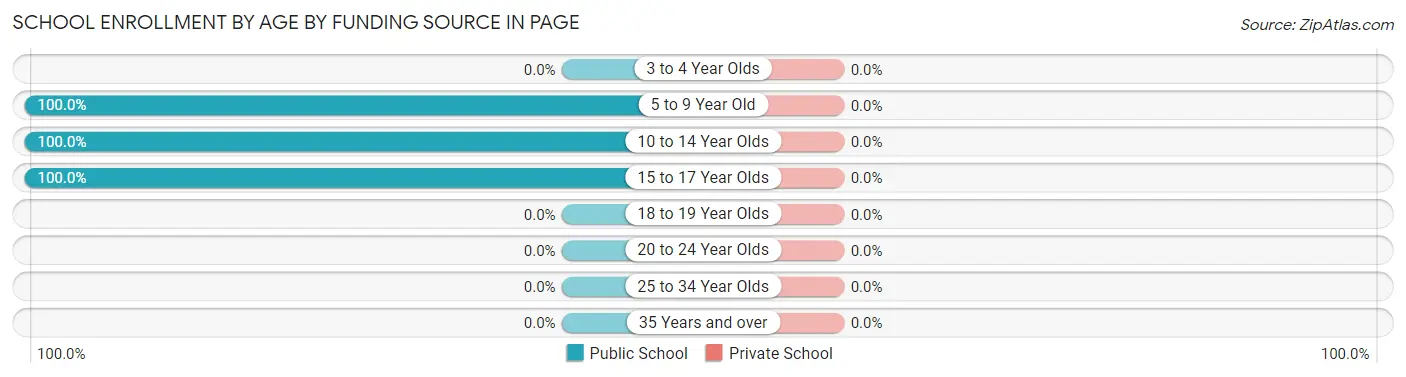
| Age Bracket | Public School | Private School |
| 3 to 4 Year Olds | 0 (0.0%) | 0 (0.0%) |
| 5 to 9 Year Old | 19 (100.0%) | 0 (0.0%) |
| 10 to 14 Year Olds | 10 (100.0%) | 0 (0.0%) |
| 15 to 17 Year Olds | 11 (100.0%) | 0 (0.0%) |
| 18 to 19 Year Olds | 0 (0.0%) | 0 (0.0%) |
| 20 to 24 Year Olds | 0 (0.0%) | 0 (0.0%) |
| 25 to 34 Year Olds | 0 (0.0%) | 0 (0.0%) |
| 35 Years and over | 0 (0.0%) | 0 (0.0%) |
| Total | 40 (100.0%) | 0 (0.0%) |
Educational Attainment by Field of Study in Page
Science & technology (5 | 26.3%), business (5 | 26.3%), bio, nature & agricultural (4 | 21.0%), engineering (2 | 10.5%), and education (2 | 10.5%) are the most common fields of study among 19 individuals in Page who have obtained a bachelor's degree or higher.
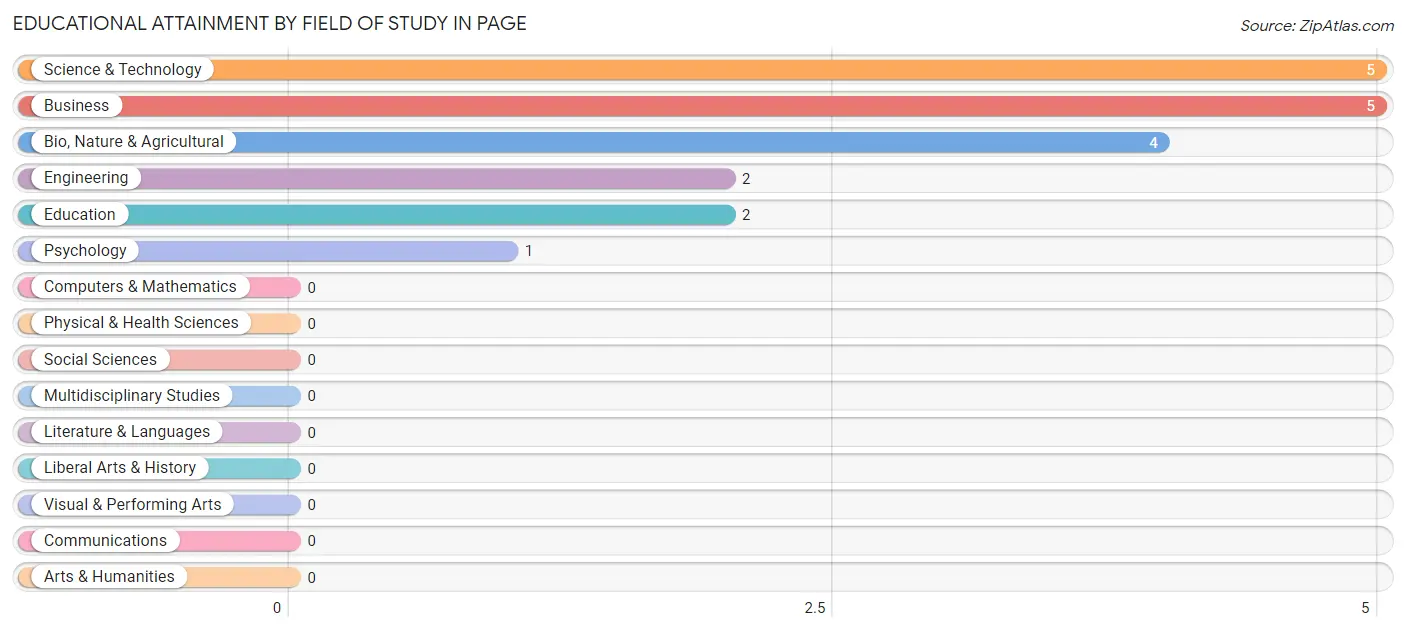
| Field of Study | # Graduates | % Graduates |
| Computers & Mathematics | 0 | 0.0% |
| Bio, Nature & Agricultural | 4 | 21.0% |
| Physical & Health Sciences | 0 | 0.0% |
| Psychology | 1 | 5.3% |
| Social Sciences | 0 | 0.0% |
| Engineering | 2 | 10.5% |
| Multidisciplinary Studies | 0 | 0.0% |
| Science & Technology | 5 | 26.3% |
| Business | 5 | 26.3% |
| Education | 2 | 10.5% |
| Literature & Languages | 0 | 0.0% |
| Liberal Arts & History | 0 | 0.0% |
| Visual & Performing Arts | 0 | 0.0% |
| Communications | 0 | 0.0% |
| Arts & Humanities | 0 | 0.0% |
| Total | 19 | 100.0% |
Transportation & Commute in Page
Vehicle Availability by Sex in Page
The most prevalent vehicle ownership categories in Page are males with 2 vehicles (29, accounting for 44.6%) and females with 2 vehicles (16, making up 72.5%).
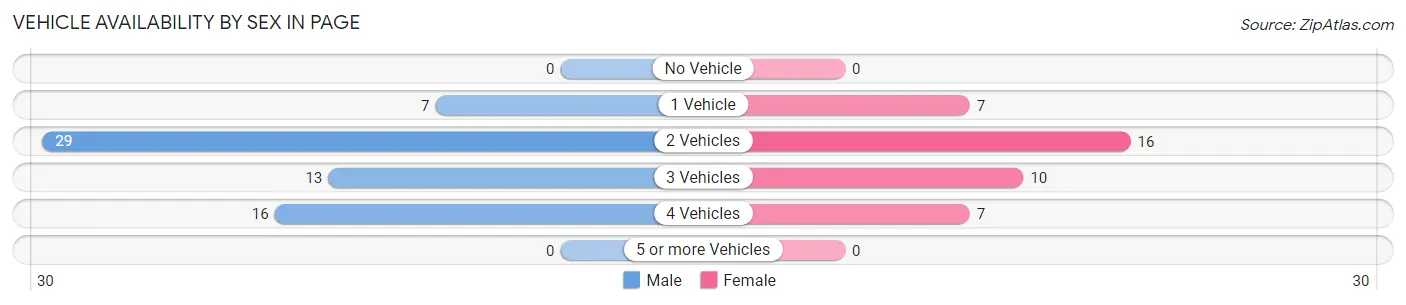
| Vehicles Available | Male | Female |
| No Vehicle | 0 (0.0%) | 0 (0.0%) |
| 1 Vehicle | 7 (10.8%) | 7 (17.5%) |
| 2 Vehicles | 29 (44.6%) | 16 (40.0%) |
| 3 Vehicles | 13 (20.0%) | 10 (25.0%) |
| 4 Vehicles | 16 (24.6%) | 7 (17.5%) |
| 5 or more Vehicles | 0 (0.0%) | 0 (0.0%) |
| Total | 65 (100.0%) | 40 (100.0%) |
Commute Time in Page
The most frequently occuring commute durations in Page are 5 to 9 minutes (25 commuters, 25.0%), less than 5 minutes (24 commuters, 24.0%), and 10 to 14 minutes (17 commuters, 17.0%).
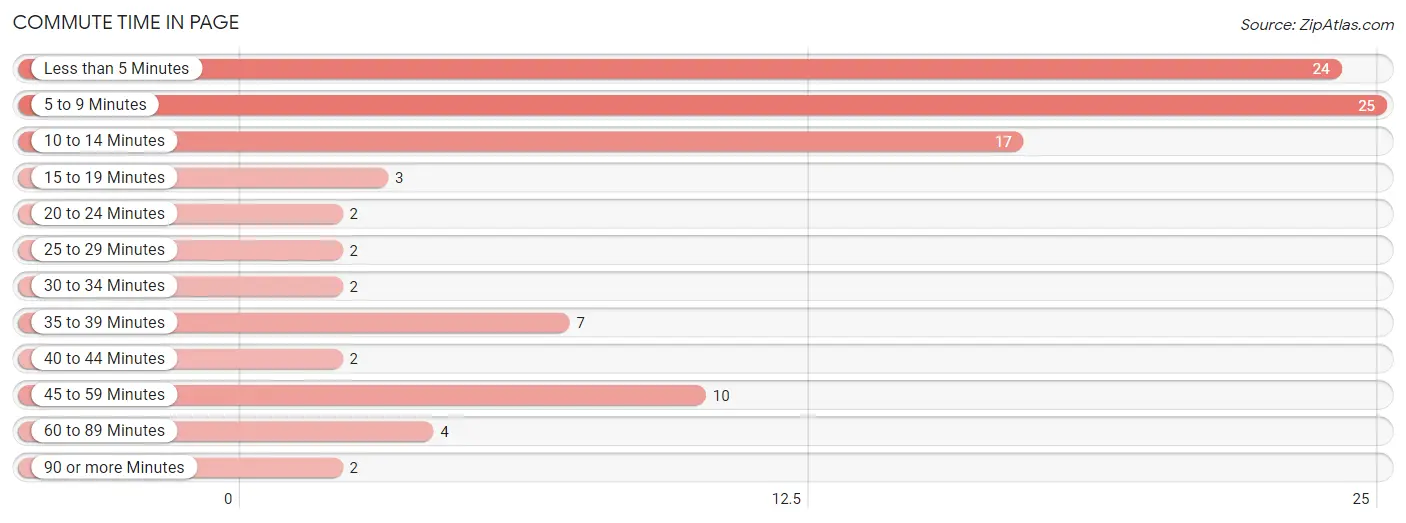
| Commute Time | # Commuters | % Commuters |
| Less than 5 Minutes | 24 | 24.0% |
| 5 to 9 Minutes | 25 | 25.0% |
| 10 to 14 Minutes | 17 | 17.0% |
| 15 to 19 Minutes | 3 | 3.0% |
| 20 to 24 Minutes | 2 | 2.0% |
| 25 to 29 Minutes | 2 | 2.0% |
| 30 to 34 Minutes | 2 | 2.0% |
| 35 to 39 Minutes | 7 | 7.0% |
| 40 to 44 Minutes | 2 | 2.0% |
| 45 to 59 Minutes | 10 | 10.0% |
| 60 to 89 Minutes | 4 | 4.0% |
| 90 or more Minutes | 2 | 2.0% |
Commute Time by Sex in Page
The most common commute times in Page are 5 to 9 minutes (15 commuters, 23.1%) for males and less than 5 minutes (10 commuters, 28.6%) for females.
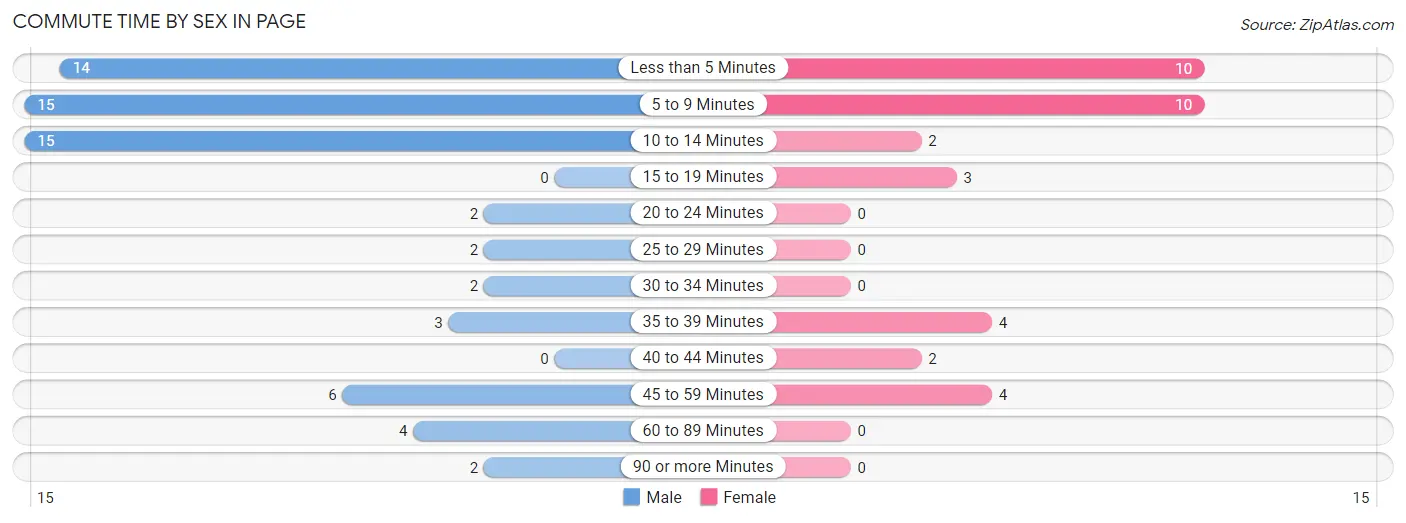
| Commute Time | Male | Female |
| Less than 5 Minutes | 14 (21.5%) | 10 (28.6%) |
| 5 to 9 Minutes | 15 (23.1%) | 10 (28.6%) |
| 10 to 14 Minutes | 15 (23.1%) | 2 (5.7%) |
| 15 to 19 Minutes | 0 (0.0%) | 3 (8.6%) |
| 20 to 24 Minutes | 2 (3.1%) | 0 (0.0%) |
| 25 to 29 Minutes | 2 (3.1%) | 0 (0.0%) |
| 30 to 34 Minutes | 2 (3.1%) | 0 (0.0%) |
| 35 to 39 Minutes | 3 (4.6%) | 4 (11.4%) |
| 40 to 44 Minutes | 0 (0.0%) | 2 (5.7%) |
| 45 to 59 Minutes | 6 (9.2%) | 4 (11.4%) |
| 60 to 89 Minutes | 4 (6.1%) | 0 (0.0%) |
| 90 or more Minutes | 2 (3.1%) | 0 (0.0%) |
Time of Departure to Work by Sex in Page
The most frequent times of departure to work in Page are 6:30 AM to 6:59 AM (26, 40.0%) for males and 9:00 AM to 9:59 AM (9, 25.7%) for females.
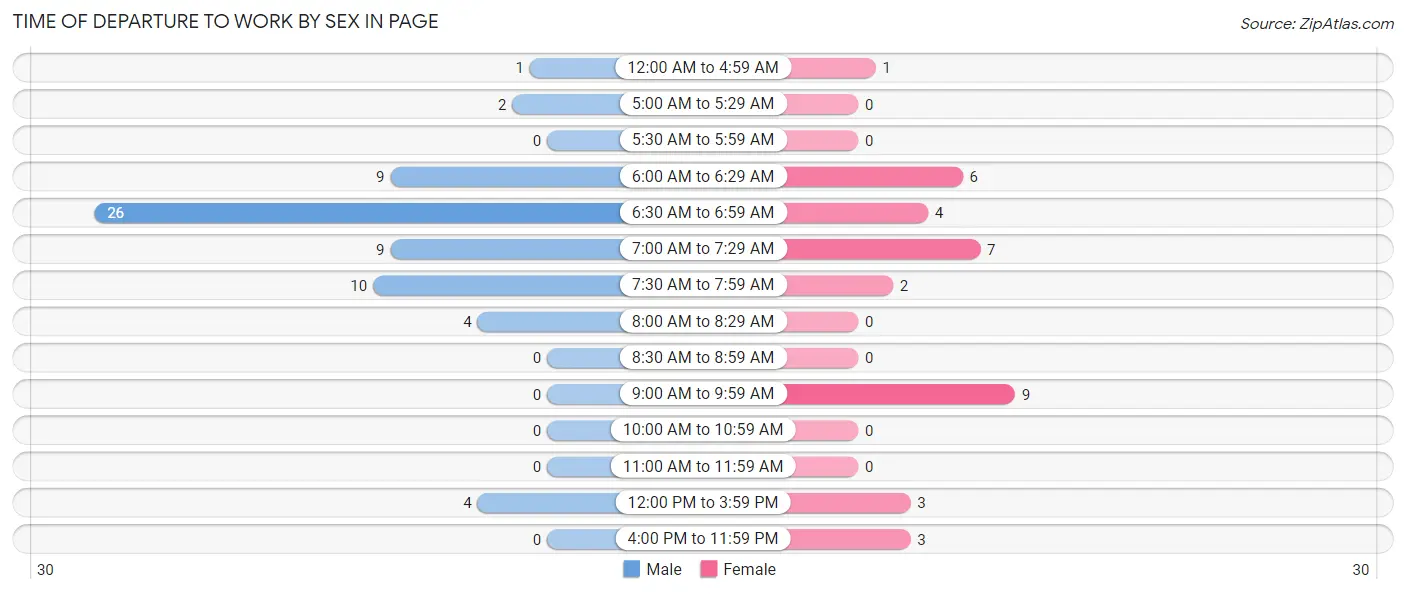
| Time of Departure | Male | Female |
| 12:00 AM to 4:59 AM | 1 (1.5%) | 1 (2.9%) |
| 5:00 AM to 5:29 AM | 2 (3.1%) | 0 (0.0%) |
| 5:30 AM to 5:59 AM | 0 (0.0%) | 0 (0.0%) |
| 6:00 AM to 6:29 AM | 9 (13.9%) | 6 (17.1%) |
| 6:30 AM to 6:59 AM | 26 (40.0%) | 4 (11.4%) |
| 7:00 AM to 7:29 AM | 9 (13.9%) | 7 (20.0%) |
| 7:30 AM to 7:59 AM | 10 (15.4%) | 2 (5.7%) |
| 8:00 AM to 8:29 AM | 4 (6.1%) | 0 (0.0%) |
| 8:30 AM to 8:59 AM | 0 (0.0%) | 0 (0.0%) |
| 9:00 AM to 9:59 AM | 0 (0.0%) | 9 (25.7%) |
| 10:00 AM to 10:59 AM | 0 (0.0%) | 0 (0.0%) |
| 11:00 AM to 11:59 AM | 0 (0.0%) | 0 (0.0%) |
| 12:00 PM to 3:59 PM | 4 (6.1%) | 3 (8.6%) |
| 4:00 PM to 11:59 PM | 0 (0.0%) | 3 (8.6%) |
| Total | 65 (100.0%) | 35 (100.0%) |
Housing Occupancy in Page
Occupancy by Ownership in Page
Of the total 83 dwellings in Page, owner-occupied units account for 60 (72.3%), while renter-occupied units make up 23 (27.7%).
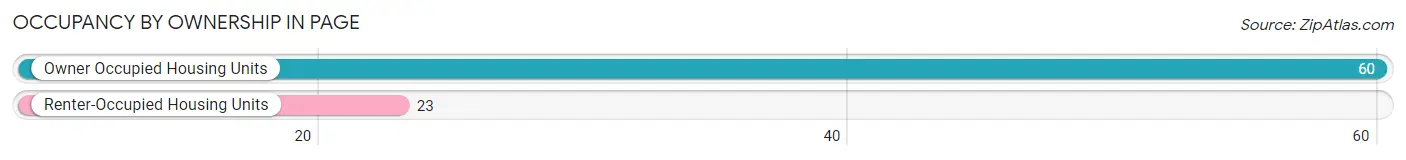
| Occupancy | # Housing Units | % Housing Units |
| Owner Occupied Housing Units | 60 | 72.3% |
| Renter-Occupied Housing Units | 23 | 27.7% |
| Total Occupied Housing Units | 83 | 100.0% |
Occupancy by Household Size in Page
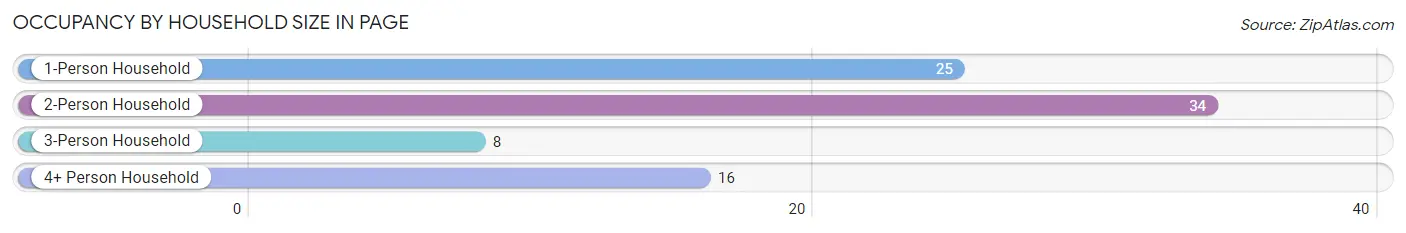
| Household Size | # Housing Units | % Housing Units |
| 1-Person Household | 25 | 30.1% |
| 2-Person Household | 34 | 41.0% |
| 3-Person Household | 8 | 9.6% |
| 4+ Person Household | 16 | 19.3% |
| Total Housing Units | 83 | 100.0% |
Occupancy by Ownership by Household Size in Page
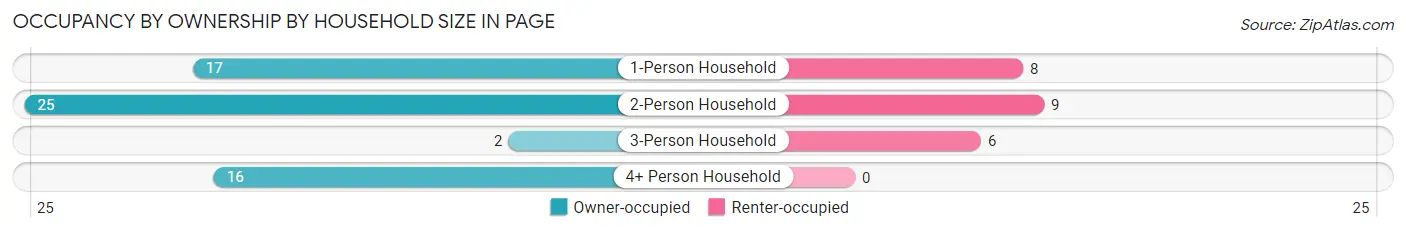
| Household Size | Owner-occupied | Renter-occupied |
| 1-Person Household | 17 (68.0%) | 8 (32.0%) |
| 2-Person Household | 25 (73.5%) | 9 (26.5%) |
| 3-Person Household | 2 (25.0%) | 6 (75.0%) |
| 4+ Person Household | 16 (100.0%) | 0 (0.0%) |
| Total Housing Units | 60 (72.3%) | 23 (27.7%) |
Occupancy by Educational Attainment in Page
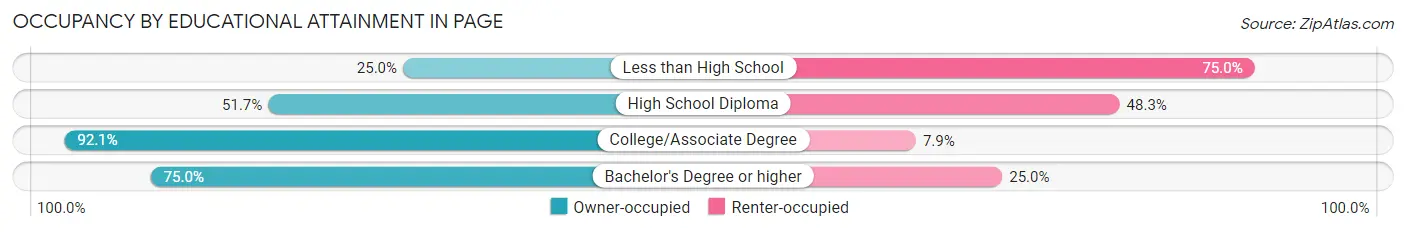
| Household Size | Owner-occupied | Renter-occupied |
| Less than High School | 1 (25.0%) | 3 (75.0%) |
| High School Diploma | 15 (51.7%) | 14 (48.3%) |
| College/Associate Degree | 35 (92.1%) | 3 (7.9%) |
| Bachelor's Degree or higher | 9 (75.0%) | 3 (25.0%) |
Occupancy by Age of Householder in Page
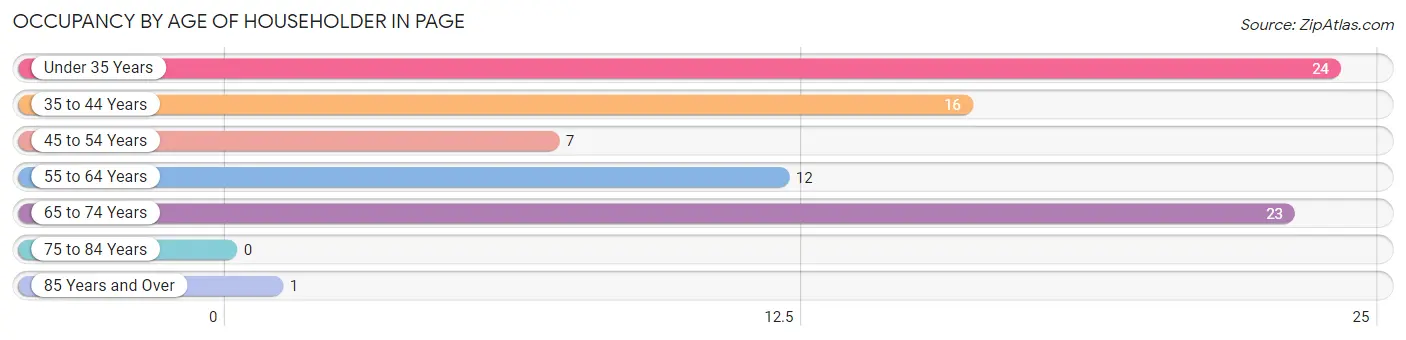
| Age Bracket | # Households | % Households |
| Under 35 Years | 24 | 28.9% |
| 35 to 44 Years | 16 | 19.3% |
| 45 to 54 Years | 7 | 8.4% |
| 55 to 64 Years | 12 | 14.5% |
| 65 to 74 Years | 23 | 27.7% |
| 75 to 84 Years | 0 | 0.0% |
| 85 Years and Over | 1 | 1.2% |
| Total | 83 | 100.0% |
Housing Finances in Page
Median Income by Occupancy in Page
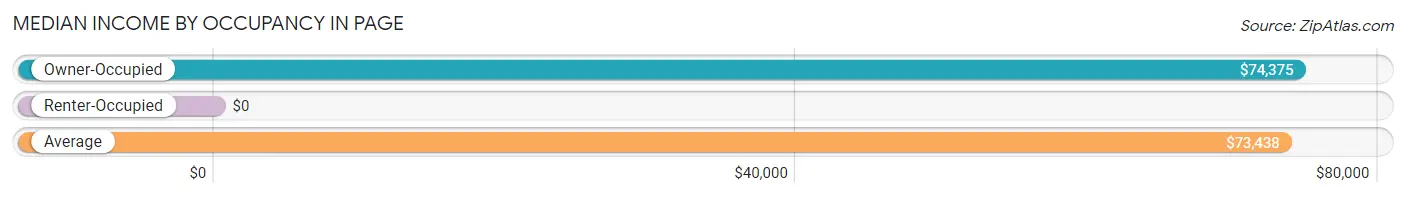
| Occupancy Type | # Households | Median Income |
| Owner-Occupied | 60 (72.3%) | $74,375 |
| Renter-Occupied | 23 (27.7%) | $0 |
| Average | 83 (100.0%) | $73,438 |
Occupancy by Householder Income Bracket in Page
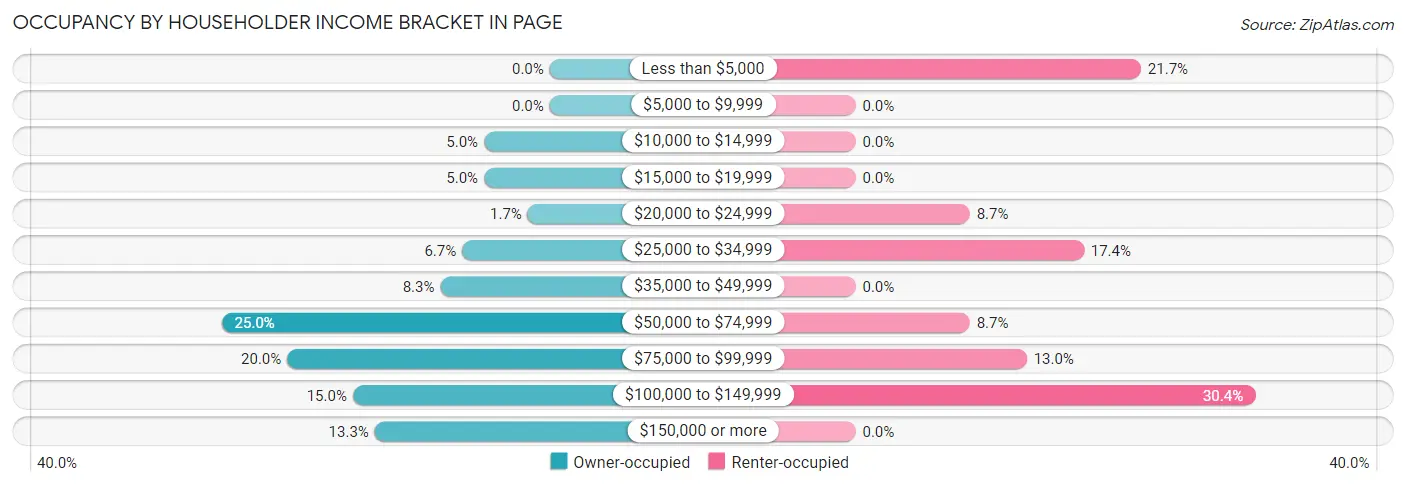
| Income Bracket | Owner-occupied | Renter-occupied |
| Less than $5,000 | 0 (0.0%) | 5 (21.7%) |
| $5,000 to $9,999 | 0 (0.0%) | 0 (0.0%) |
| $10,000 to $14,999 | 3 (5.0%) | 0 (0.0%) |
| $15,000 to $19,999 | 3 (5.0%) | 0 (0.0%) |
| $20,000 to $24,999 | 1 (1.7%) | 2 (8.7%) |
| $25,000 to $34,999 | 4 (6.7%) | 4 (17.4%) |
| $35,000 to $49,999 | 5 (8.3%) | 0 (0.0%) |
| $50,000 to $74,999 | 15 (25.0%) | 2 (8.7%) |
| $75,000 to $99,999 | 12 (20.0%) | 3 (13.0%) |
| $100,000 to $149,999 | 9 (15.0%) | 7 (30.4%) |
| $150,000 or more | 8 (13.3%) | 0 (0.0%) |
| Total | 60 (100.0%) | 23 (100.0%) |
Monthly Housing Cost Tiers in Page
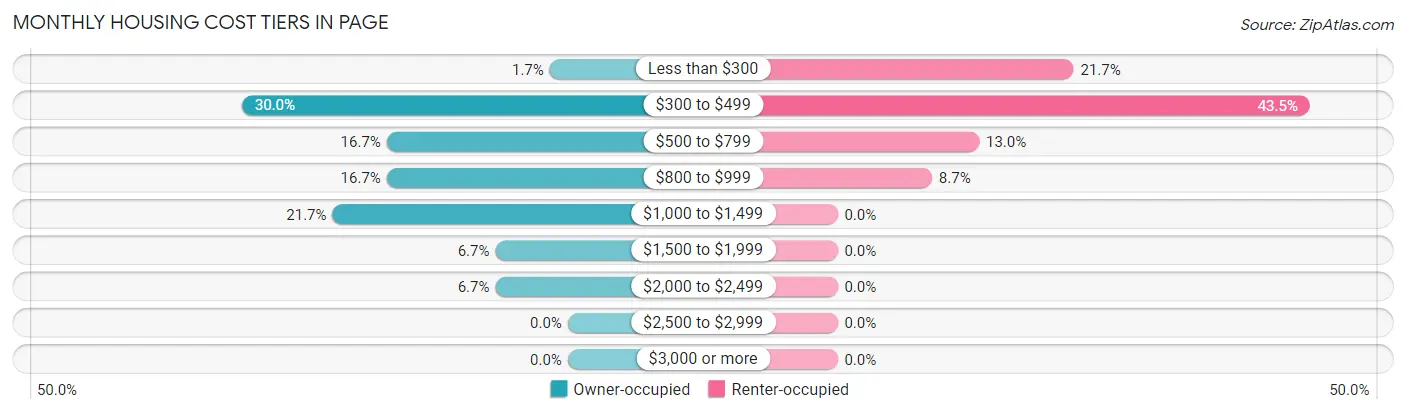
| Monthly Cost | Owner-occupied | Renter-occupied |
| Less than $300 | 1 (1.7%) | 5 (21.7%) |
| $300 to $499 | 18 (30.0%) | 10 (43.5%) |
| $500 to $799 | 10 (16.7%) | 3 (13.0%) |
| $800 to $999 | 10 (16.7%) | 2 (8.7%) |
| $1,000 to $1,499 | 13 (21.7%) | 0 (0.0%) |
| $1,500 to $1,999 | 4 (6.7%) | 0 (0.0%) |
| $2,000 to $2,499 | 4 (6.7%) | 0 (0.0%) |
| $2,500 to $2,999 | 0 (0.0%) | 0 (0.0%) |
| $3,000 or more | 0 (0.0%) | 0 (0.0%) |
| Total | 60 (100.0%) | 23 (100.0%) |
Physical Housing Characteristics in Page
Housing Structures in Page
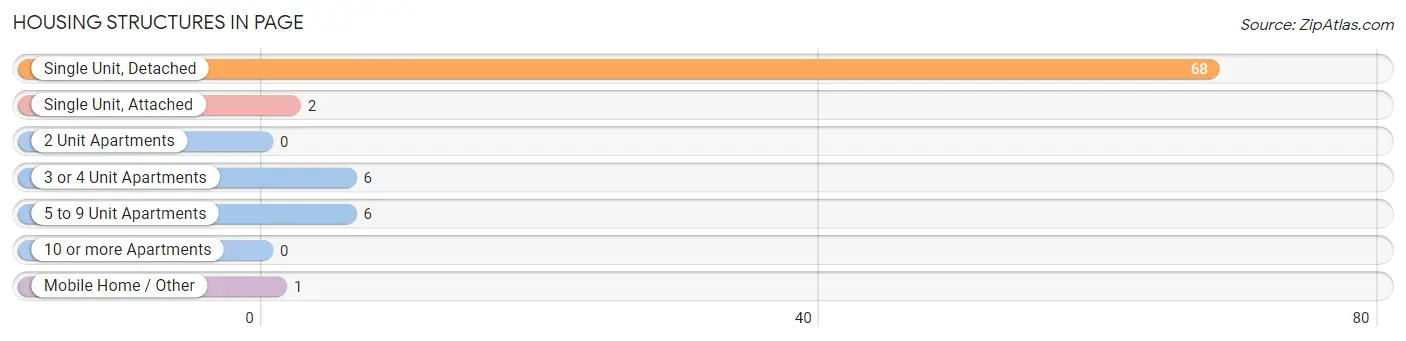
| Structure Type | # Housing Units | % Housing Units |
| Single Unit, Detached | 68 | 81.9% |
| Single Unit, Attached | 2 | 2.4% |
| 2 Unit Apartments | 0 | 0.0% |
| 3 or 4 Unit Apartments | 6 | 7.2% |
| 5 to 9 Unit Apartments | 6 | 7.2% |
| 10 or more Apartments | 0 | 0.0% |
| Mobile Home / Other | 1 | 1.2% |
| Total | 83 | 100.0% |
Housing Structures by Occupancy in Page
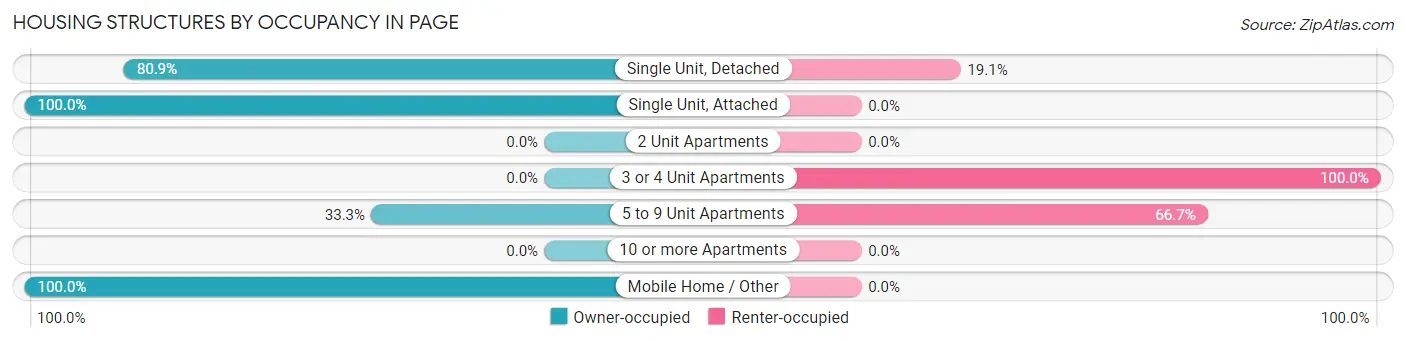
| Structure Type | Owner-occupied | Renter-occupied |
| Single Unit, Detached | 55 (80.9%) | 13 (19.1%) |
| Single Unit, Attached | 2 (100.0%) | 0 (0.0%) |
| 2 Unit Apartments | 0 (0.0%) | 0 (0.0%) |
| 3 or 4 Unit Apartments | 0 (0.0%) | 6 (100.0%) |
| 5 to 9 Unit Apartments | 2 (33.3%) | 4 (66.7%) |
| 10 or more Apartments | 0 (0.0%) | 0 (0.0%) |
| Mobile Home / Other | 1 (100.0%) | 0 (0.0%) |
| Total | 60 (72.3%) | 23 (27.7%) |
Housing Structures by Number of Rooms in Page
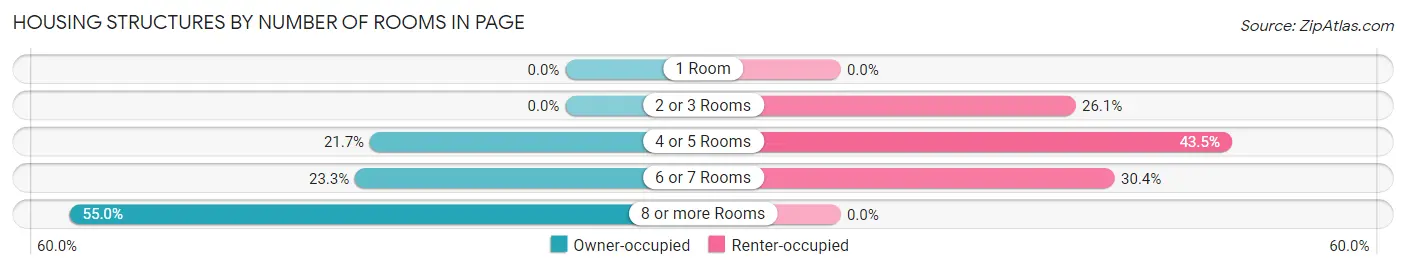
| Number of Rooms | Owner-occupied | Renter-occupied |
| 1 Room | 0 (0.0%) | 0 (0.0%) |
| 2 or 3 Rooms | 0 (0.0%) | 6 (26.1%) |
| 4 or 5 Rooms | 13 (21.7%) | 10 (43.5%) |
| 6 or 7 Rooms | 14 (23.3%) | 7 (30.4%) |
| 8 or more Rooms | 33 (55.0%) | 0 (0.0%) |
| Total | 60 (100.0%) | 23 (100.0%) |
Housing Structure by Heating Type in Page
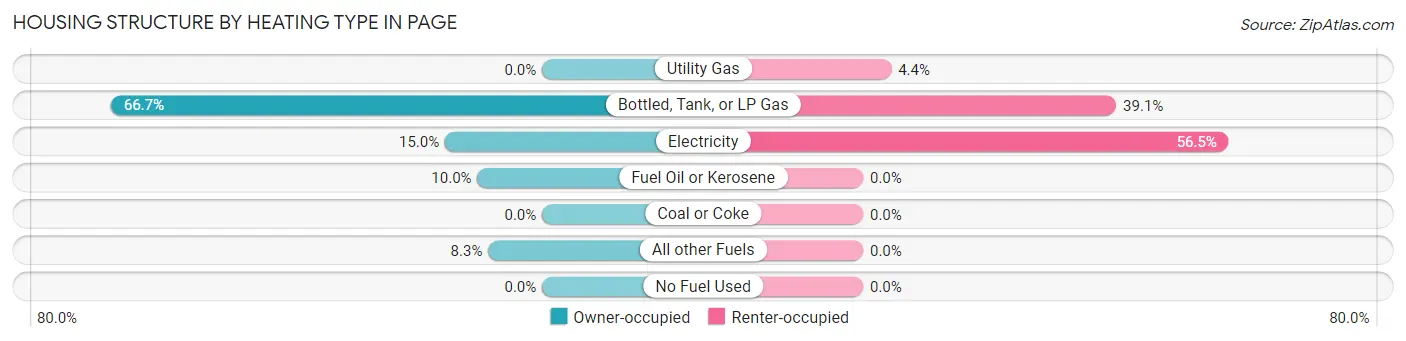
| Heating Type | Owner-occupied | Renter-occupied |
| Utility Gas | 0 (0.0%) | 1 (4.3%) |
| Bottled, Tank, or LP Gas | 40 (66.7%) | 9 (39.1%) |
| Electricity | 9 (15.0%) | 13 (56.5%) |
| Fuel Oil or Kerosene | 6 (10.0%) | 0 (0.0%) |
| Coal or Coke | 0 (0.0%) | 0 (0.0%) |
| All other Fuels | 5 (8.3%) | 0 (0.0%) |
| No Fuel Used | 0 (0.0%) | 0 (0.0%) |
| Total | 60 (100.0%) | 23 (100.0%) |
Household Vehicle Usage in Page
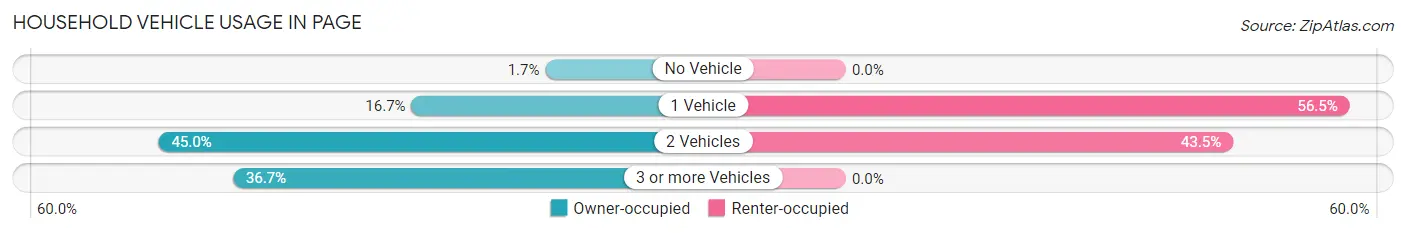
| Vehicles per Household | Owner-occupied | Renter-occupied |
| No Vehicle | 1 (1.7%) | 0 (0.0%) |
| 1 Vehicle | 10 (16.7%) | 13 (56.5%) |
| 2 Vehicles | 27 (45.0%) | 10 (43.5%) |
| 3 or more Vehicles | 22 (36.7%) | 0 (0.0%) |
| Total | 60 (100.0%) | 23 (100.0%) |
Real Estate & Mortgages in Page
Real Estate and Mortgage Overview in Page
| Characteristic | Without Mortgage | With Mortgage |
| Housing Units | 33 | 27 |
| Median Property Value | $84,200 | $89,300 |
| Median Household Income | $72,813 | $6 |
| Monthly Housing Costs | $475 | $0 |
| Real Estate Taxes | $1,375 | $0 |
Property Value by Mortgage Status in Page
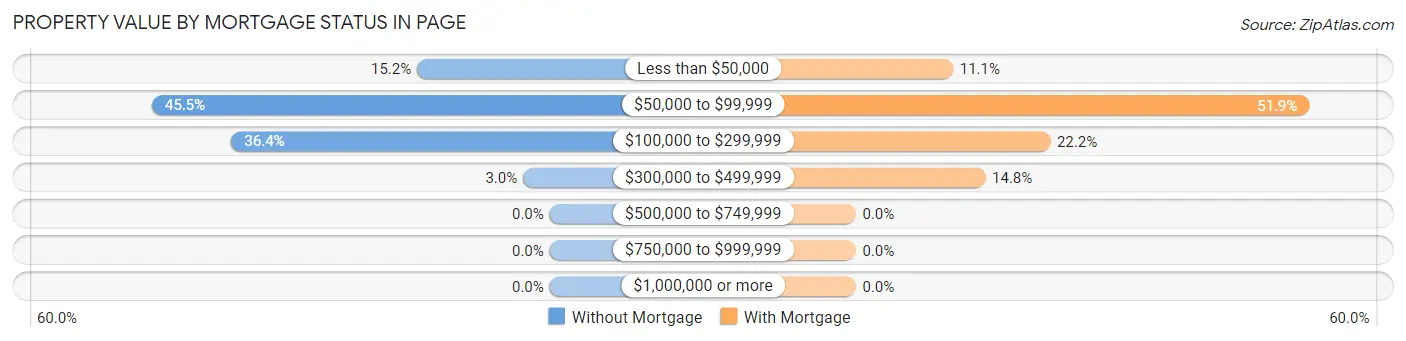
| Property Value | Without Mortgage | With Mortgage |
| Less than $50,000 | 5 (15.1%) | 3 (11.1%) |
| $50,000 to $99,999 | 15 (45.5%) | 14 (51.8%) |
| $100,000 to $299,999 | 12 (36.4%) | 6 (22.2%) |
| $300,000 to $499,999 | 1 (3.0%) | 4 (14.8%) |
| $500,000 to $749,999 | 0 (0.0%) | 0 (0.0%) |
| $750,000 to $999,999 | 0 (0.0%) | 0 (0.0%) |
| $1,000,000 or more | 0 (0.0%) | 0 (0.0%) |
| Total | 33 (100.0%) | 27 (100.0%) |
Household Income by Mortgage Status in Page
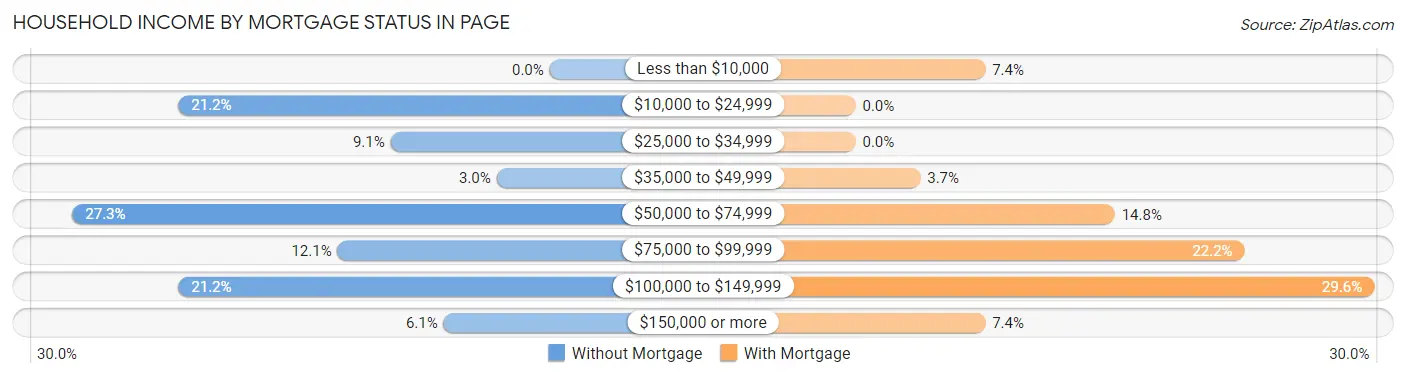
| Household Income | Without Mortgage | With Mortgage |
| Less than $10,000 | 0 (0.0%) | 2 (7.4%) |
| $10,000 to $24,999 | 7 (21.2%) | 0 (0.0%) |
| $25,000 to $34,999 | 3 (9.1%) | 0 (0.0%) |
| $35,000 to $49,999 | 1 (3.0%) | 1 (3.7%) |
| $50,000 to $74,999 | 9 (27.3%) | 4 (14.8%) |
| $75,000 to $99,999 | 4 (12.1%) | 6 (22.2%) |
| $100,000 to $149,999 | 7 (21.2%) | 8 (29.6%) |
| $150,000 or more | 2 (6.1%) | 2 (7.4%) |
| Total | 33 (100.0%) | 27 (100.0%) |
Property Value to Household Income Ratio in Page
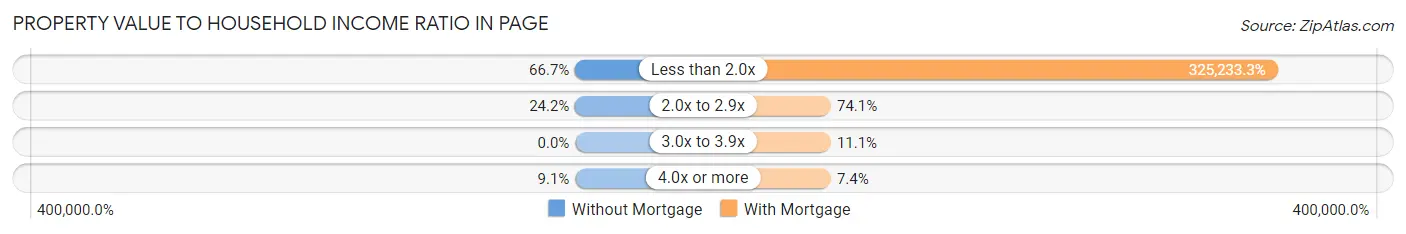
| Value-to-Income Ratio | Without Mortgage | With Mortgage |
| Less than 2.0x | 22 (66.7%) | 87,813 (325,233.3%) |
| 2.0x to 2.9x | 8 (24.2%) | 20 (74.1%) |
| 3.0x to 3.9x | 0 (0.0%) | 3 (11.1%) |
| 4.0x or more | 3 (9.1%) | 2 (7.4%) |
| Total | 33 (100.0%) | 27 (100.0%) |
Real Estate Taxes by Mortgage Status in Page
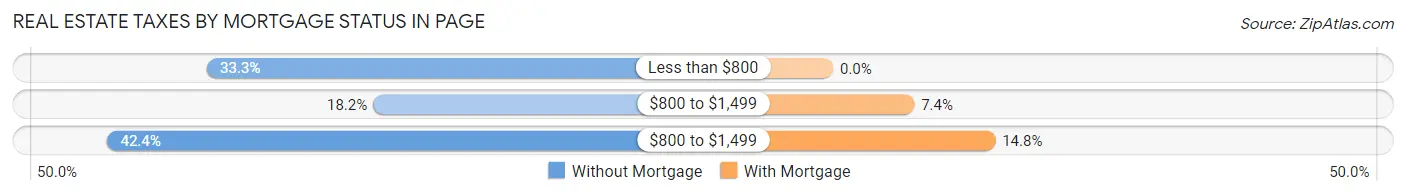
| Property Taxes | Without Mortgage | With Mortgage |
| Less than $800 | 11 (33.3%) | 0 (0.0%) |
| $800 to $1,499 | 6 (18.2%) | 2 (7.4%) |
| $800 to $1,499 | 14 (42.4%) | 4 (14.8%) |
| Total | 33 (100.0%) | 27 (100.0%) |
Health & Disability in Page
Health Insurance Coverage by Age in Page
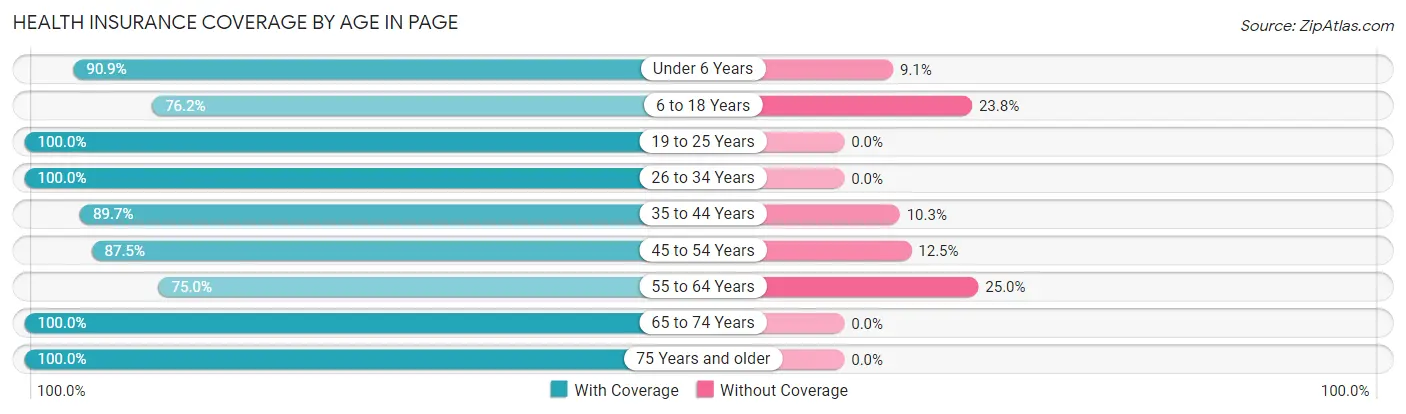
| Age Bracket | With Coverage | Without Coverage |
| Under 6 Years | 10 (90.9%) | 1 (9.1%) |
| 6 to 18 Years | 32 (76.2%) | 10 (23.8%) |
| 19 to 25 Years | 24 (100.0%) | 0 (0.0%) |
| 26 to 34 Years | 24 (100.0%) | 0 (0.0%) |
| 35 to 44 Years | 26 (89.7%) | 3 (10.3%) |
| 45 to 54 Years | 7 (87.5%) | 1 (12.5%) |
| 55 to 64 Years | 15 (75.0%) | 5 (25.0%) |
| 65 to 74 Years | 34 (100.0%) | 0 (0.0%) |
| 75 Years and older | 1 (100.0%) | 0 (0.0%) |
| Total | 173 (89.6%) | 20 (10.4%) |
Health Insurance Coverage by Citizenship Status in Page
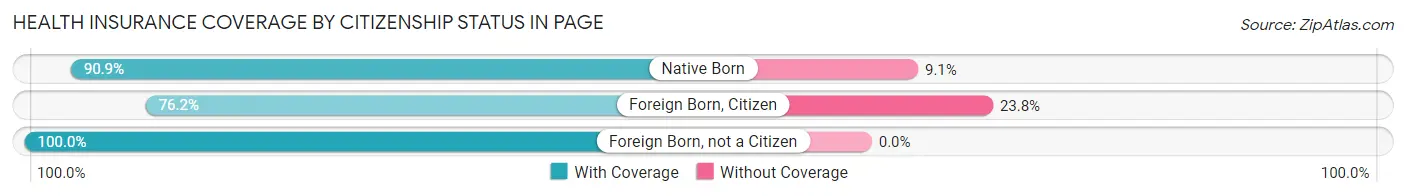
| Citizenship Status | With Coverage | Without Coverage |
| Native Born | 10 (90.9%) | 1 (9.1%) |
| Foreign Born, Citizen | 32 (76.2%) | 10 (23.8%) |
| Foreign Born, not a Citizen | 24 (100.0%) | 0 (0.0%) |
Health Insurance Coverage by Household Income in Page
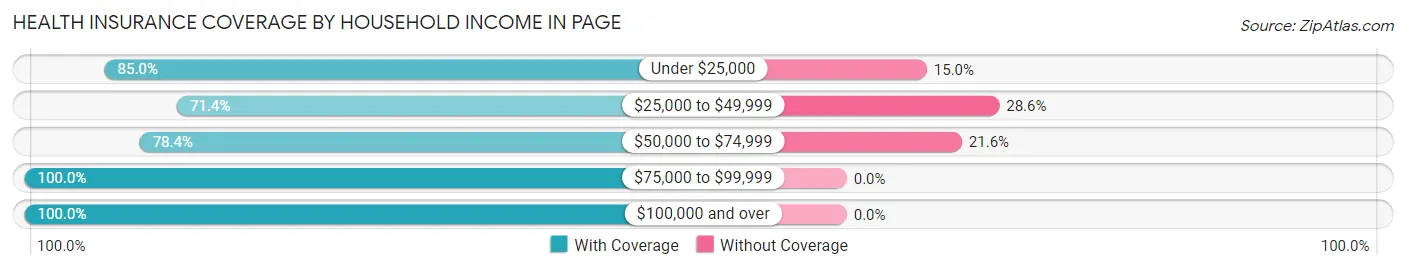
| Household Income | With Coverage | Without Coverage |
| Under $25,000 | 17 (85.0%) | 3 (15.0%) |
| $25,000 to $49,999 | 15 (71.4%) | 6 (28.6%) |
| $50,000 to $74,999 | 40 (78.4%) | 11 (21.6%) |
| $75,000 to $99,999 | 20 (100.0%) | 0 (0.0%) |
| $100,000 and over | 81 (100.0%) | 0 (0.0%) |
Public vs Private Health Insurance Coverage by Age in Page
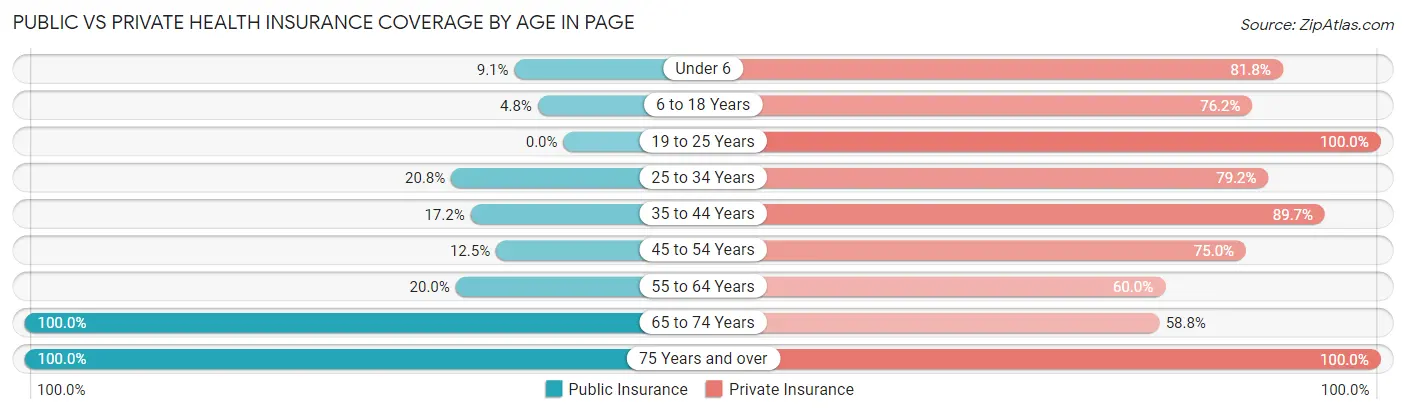
| Age Bracket | Public Insurance | Private Insurance |
| Under 6 | 1 (9.1%) | 9 (81.8%) |
| 6 to 18 Years | 2 (4.8%) | 32 (76.2%) |
| 19 to 25 Years | 0 (0.0%) | 24 (100.0%) |
| 25 to 34 Years | 5 (20.8%) | 19 (79.2%) |
| 35 to 44 Years | 5 (17.2%) | 26 (89.7%) |
| 45 to 54 Years | 1 (12.5%) | 6 (75.0%) |
| 55 to 64 Years | 4 (20.0%) | 12 (60.0%) |
| 65 to 74 Years | 34 (100.0%) | 20 (58.8%) |
| 75 Years and over | 1 (100.0%) | 1 (100.0%) |
| Total | 53 (27.5%) | 149 (77.2%) |
Disability Status by Sex by Age in Page
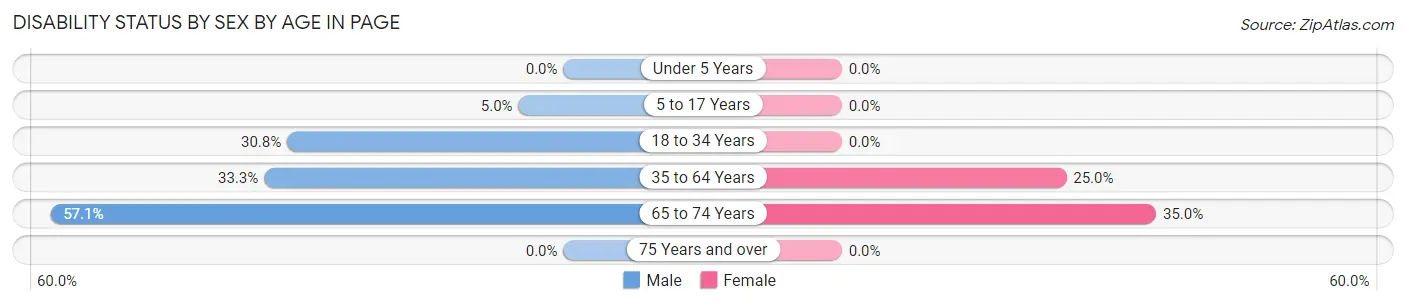
| Age Bracket | Male | Female |
| Under 5 Years | 0 (0.0%) | 0 (0.0%) |
| 5 to 17 Years | 1 (5.0%) | 0 (0.0%) |
| 18 to 34 Years | 8 (30.8%) | 0 (0.0%) |
| 35 to 64 Years | 11 (33.3%) | 6 (25.0%) |
| 65 to 74 Years | 8 (57.1%) | 7 (35.0%) |
| 75 Years and over | 0 (0.0%) | 0 (0.0%) |
Disability Class by Sex by Age in Page
Disability Class: Hearing Difficulty
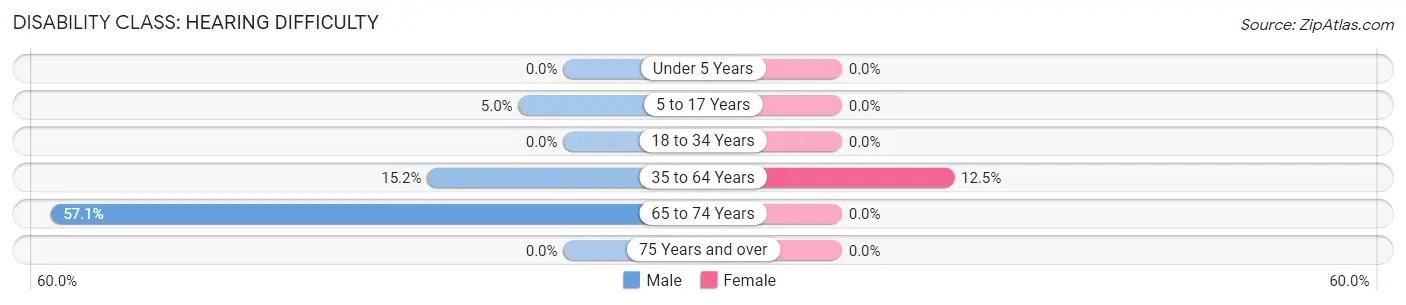
| Age Bracket | Male | Female |
| Under 5 Years | 0 (0.0%) | 0 (0.0%) |
| 5 to 17 Years | 1 (5.0%) | 0 (0.0%) |
| 18 to 34 Years | 0 (0.0%) | 0 (0.0%) |
| 35 to 64 Years | 5 (15.1%) | 3 (12.5%) |
| 65 to 74 Years | 8 (57.1%) | 0 (0.0%) |
| 75 Years and over | 0 (0.0%) | 0 (0.0%) |
Disability Class: Vision Difficulty
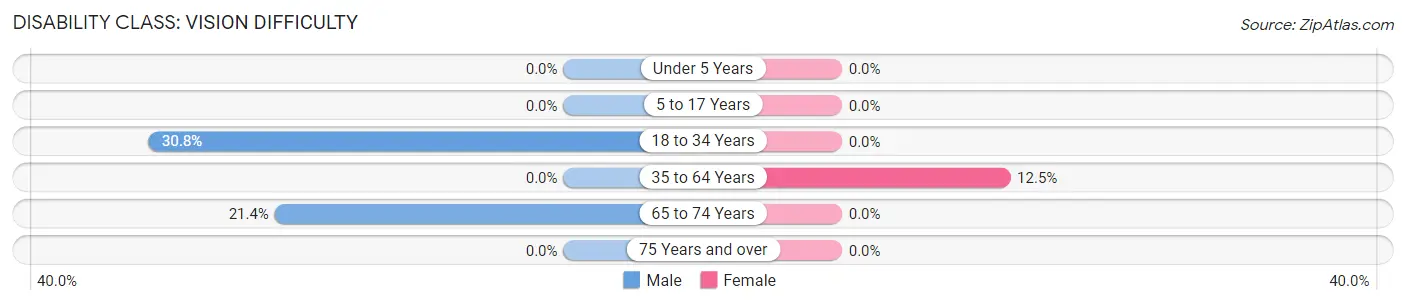
| Age Bracket | Male | Female |
| Under 5 Years | 0 (0.0%) | 0 (0.0%) |
| 5 to 17 Years | 0 (0.0%) | 0 (0.0%) |
| 18 to 34 Years | 8 (30.8%) | 0 (0.0%) |
| 35 to 64 Years | 0 (0.0%) | 3 (12.5%) |
| 65 to 74 Years | 3 (21.4%) | 0 (0.0%) |
| 75 Years and over | 0 (0.0%) | 0 (0.0%) |
Disability Class: Cognitive Difficulty
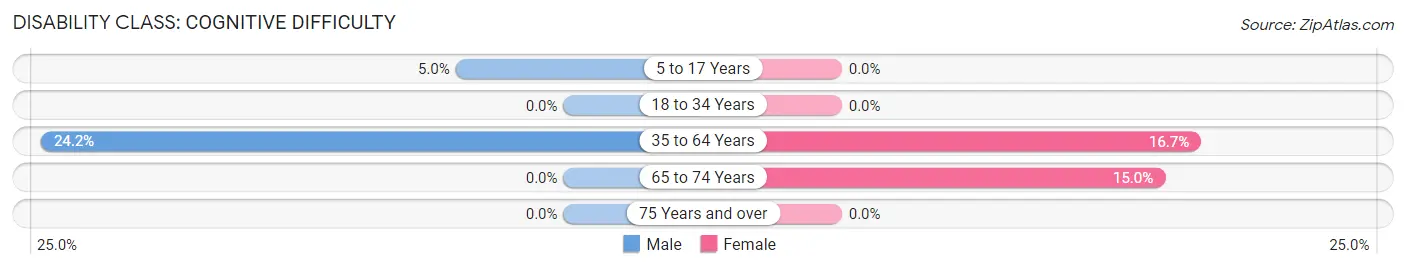
| Age Bracket | Male | Female |
| 5 to 17 Years | 1 (5.0%) | 0 (0.0%) |
| 18 to 34 Years | 0 (0.0%) | 0 (0.0%) |
| 35 to 64 Years | 8 (24.2%) | 4 (16.7%) |
| 65 to 74 Years | 0 (0.0%) | 3 (15.0%) |
| 75 Years and over | 0 (0.0%) | 0 (0.0%) |
Disability Class: Ambulatory Difficulty
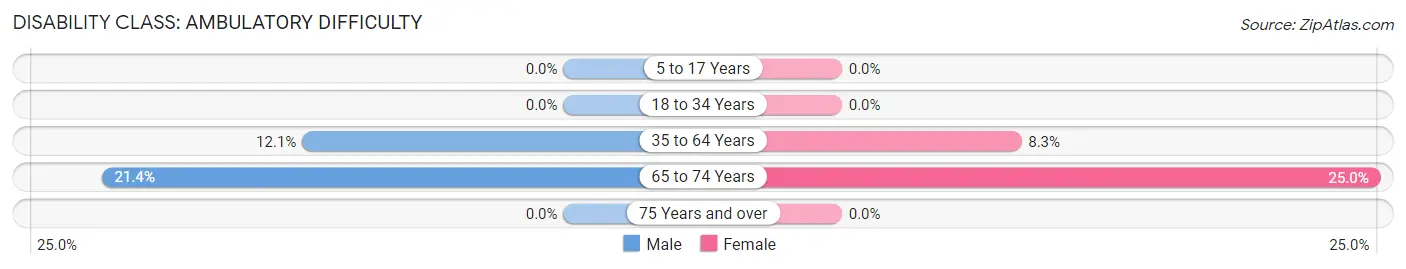
| Age Bracket | Male | Female |
| 5 to 17 Years | 0 (0.0%) | 0 (0.0%) |
| 18 to 34 Years | 0 (0.0%) | 0 (0.0%) |
| 35 to 64 Years | 4 (12.1%) | 2 (8.3%) |
| 65 to 74 Years | 3 (21.4%) | 5 (25.0%) |
| 75 Years and over | 0 (0.0%) | 0 (0.0%) |
Disability Class: Self-Care Difficulty
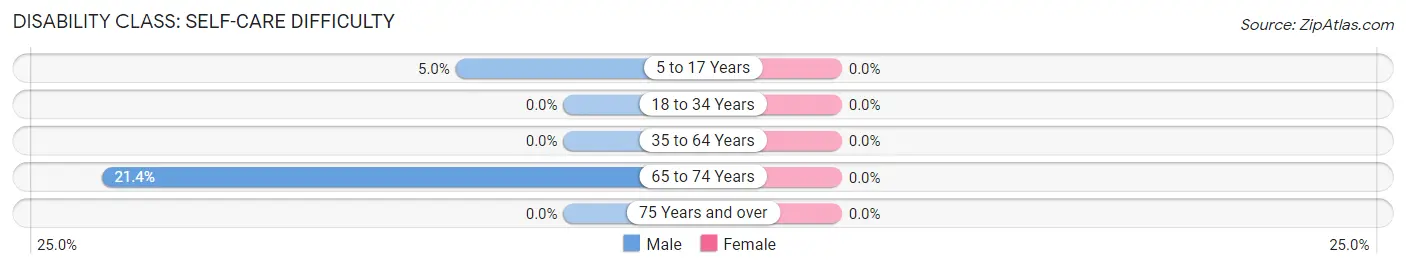
| Age Bracket | Male | Female |
| 5 to 17 Years | 1 (5.0%) | 0 (0.0%) |
| 18 to 34 Years | 0 (0.0%) | 0 (0.0%) |
| 35 to 64 Years | 0 (0.0%) | 0 (0.0%) |
| 65 to 74 Years | 3 (21.4%) | 0 (0.0%) |
| 75 Years and over | 0 (0.0%) | 0 (0.0%) |
Technology Access in Page
Computing Device Access in Page
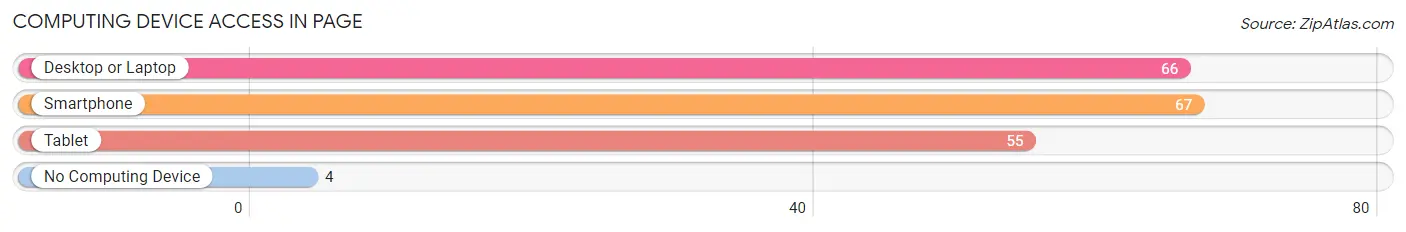
| Device Type | # Households | % Households |
| Desktop or Laptop | 66 | 79.5% |
| Smartphone | 67 | 80.7% |
| Tablet | 55 | 66.3% |
| No Computing Device | 4 | 4.8% |
| Total | 83 | 100.0% |
Internet Access in Page
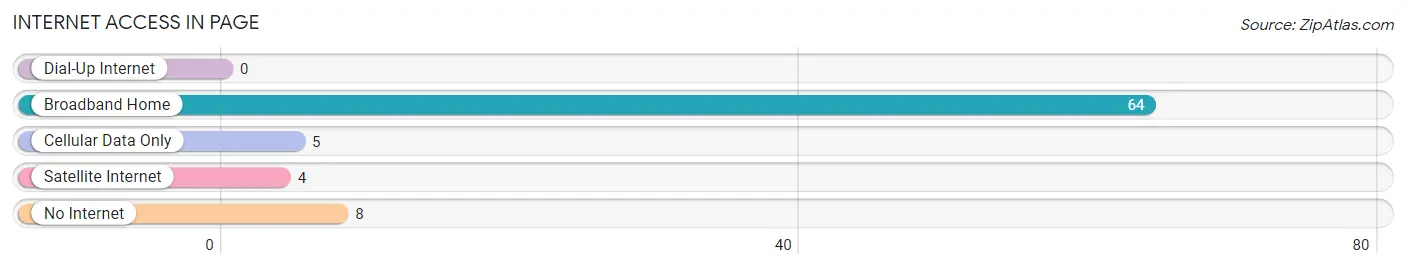
| Internet Type | # Households | % Households |
| Dial-Up Internet | 0 | 0.0% |
| Broadband Home | 64 | 77.1% |
| Cellular Data Only | 5 | 6.0% |
| Satellite Internet | 4 | 4.8% |
| No Internet | 8 | 9.6% |
| Total | 83 | 100.0% |
Page Summary
North Dakota is a state located in the Midwestern and Great Plains regions of the United States. It is bordered by the Canadian provinces of Saskatchewan and Manitoba to the north, Minnesota to the east, South Dakota to the south, and Montana to the west. North Dakota is the 19th-most extensive but the 4th-least populous and the 4th-least densely populated of the 50 United States. The state capital is Bismarck, and the largest city is Fargo.
History
The area that is now North Dakota has been inhabited for thousands of years by various Native American tribes. The first Europeans to explore the area were French fur traders, who arrived in the late 17th century. The area became part of the United States in 1803 as part of the Louisiana Purchase.
In the mid-19th century, the area was part of the Dakota Territory, which was divided into the states of North and South Dakota in 1889. North Dakota was admitted to the Union as the 39th state on November 2, 1889.
Geography
North Dakota is located in the northern Great Plains region of the United States. It is bordered by the Canadian provinces of Saskatchewan and Manitoba to the north, Minnesota to the east, South Dakota to the south, and Montana to the west.
The state has an area of 70,762 square miles, making it the 19th-largest state in the country. North Dakota is the 4th-least populous and the 4th-least densely populated of the 50 United States.
The geography of North Dakota is dominated by the Great Plains, which cover most of the state. The Red River Valley, located in the eastern part of the state, is the most fertile region in the state. The Missouri River forms the western border of the state.
Economy
North Dakota has a diversified economy, with agriculture, energy, and tourism being the main industries.
Agriculture is the largest sector of the state’s economy, accounting for about one-third of the state’s total economic output. The state is a major producer of wheat, barley, oats, canola, sunflowers, and flax.
Energy is the second-largest sector of the state’s economy. North Dakota is the second-largest producer of crude oil in the United States, and the state is home to the largest oil refinery in the country.
Tourism is also an important part of the state’s economy. The state is home to several national parks, including Theodore Roosevelt National Park and the Lewis and Clark National Historic Trail.
Demographics
As of 2019, North Dakota had an estimated population of 762,062, making it the 4th-least populous state in the country. The state has a population density of 10.9 people per square mile, making it the 4th-least densely populated state in the country.
The racial makeup of North Dakota is 87.2% White, 5.2% Native American, 2.7% Hispanic or Latino, 1.7% Asian, 0.7% Black or African American, 0.2% Pacific Islander, and 2.5% from two or more races.
The largest ancestry groups in North Dakota are German (37.2%), Norwegian (17.2%), Irish (13.2%), and English (10.2%). The state is also home to a large population of Native Americans, with the largest tribes being the Sioux, Mandan, and Hidatsa.
The median household income in North Dakota is $58,906, and the median home value is $179,400. The state has a poverty rate of 11.2%.
Common Questions
What is Per Capita Income in Page?
Per Capita income in Page is $32,213.
What is the Median Family Income in Page?
Median Family Income in Page is $74,063.
What is the Median Household income in Page?
Median Household Income in Page is $73,438.
What is Income or Wage Gap in Page?
Income or Wage Gap in Page is 65.7%.
Women in Page earn 34.3 cents for every dollar earned by a man.
What is Inequality or Gini Index in Page?
Inequality or Gini Index in Page is 0.35.
What is the Total Population of Page?
Total Population of Page is 193.
What is the Total Male Population of Page?
Total Male Population of Page is 98.
What is the Total Female Population of Page?
Total Female Population of Page is 95.
What is the Ratio of Males per 100 Females in Page?
There are 103.16 Males per 100 Females in Page.
What is the Ratio of Females per 100 Males in Page?
There are 96.94 Females per 100 Males in Page.
What is the Median Population Age in Page?
Median Population Age in Page is 33.7 Years.
What is the Average Family Size in Page
Average Family Size in Page is 3.2 People.
What is the Average Household Size in Page
Average Household Size in Page is 2.3 People.
How Large is the Labor Force in Page?
There are 110 People in the Labor Forcein in Page.
What is the Percentage of People in the Labor Force in Page?
72.8% of People are in the Labor Force in Page.
What is the Unemployment Rate in Page?
Unemployment Rate in Page is 4.5%.