Munich, ND Map & Demographics
Munich Map
Munich Overview
$40,720
PER CAPITA INCOME
$88,750
AVG FAMILY INCOME
$59,625
AVG HOUSEHOLD INCOME
30.9%
WAGE / INCOME GAP [ % ]
69.1¢/ $1
WAGE / INCOME GAP [ $ ]
0.43
INEQUALITY / GINI INDEX
337
TOTAL POPULATION
204
MALE POPULATION
133
FEMALE POPULATION
153.38
MALES / 100 FEMALES
65.20
FEMALES / 100 MALES
32.9
MEDIAN AGE
3.6
AVG FAMILY SIZE
2.7
AVG HOUSEHOLD SIZE
172
LABOR FORCE [ PEOPLE ]
70.2%
PERCENT IN LABOR FORCE
0.6%
UNEMPLOYMENT RATE
Munich Zip Codes
Munich Area Codes
Income in Munich
Income Overview in Munich
Per Capita Income in Munich is $40,720, while median incomes of families and households are $88,750 and $59,625 respectively.
| Characteristic | Number | Measure |
| Per Capita Income | 337 | $40,720 |
| Median Family Income | 54 | $88,750 |
| Mean Family Income | 54 | $132,898 |
| Median Household Income | 123 | $59,625 |
| Mean Household Income | 123 | $91,144 |
| Income Deficit | 54 | $0 |
| Wage / Income Gap (%) | 337 | 30.85% |
| Wage / Income Gap ($) | 337 | 69.15¢ per $1 |
| Gini / Inequality Index | 337 | 0.43 |
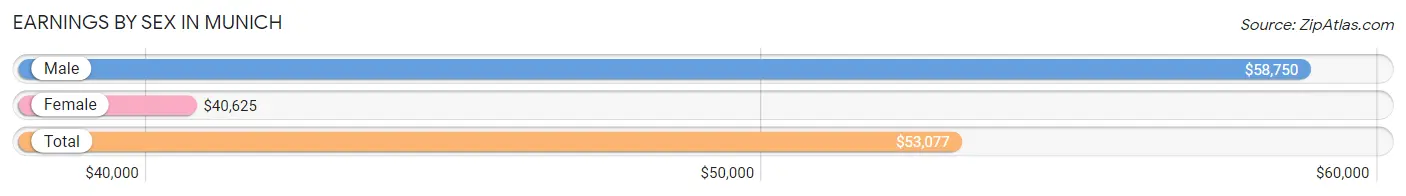
Earnings by Sex in Munich
Average Earnings in Munich are $53,077, $58,750 for men and $40,625 for women, a difference of 30.8%.
| Sex | Number | Average Earnings |
| Male | 127 (69.8%) | $58,750 |
| Female | 55 (30.2%) | $40,625 |
| Total | 182 (100.0%) | $53,077 |
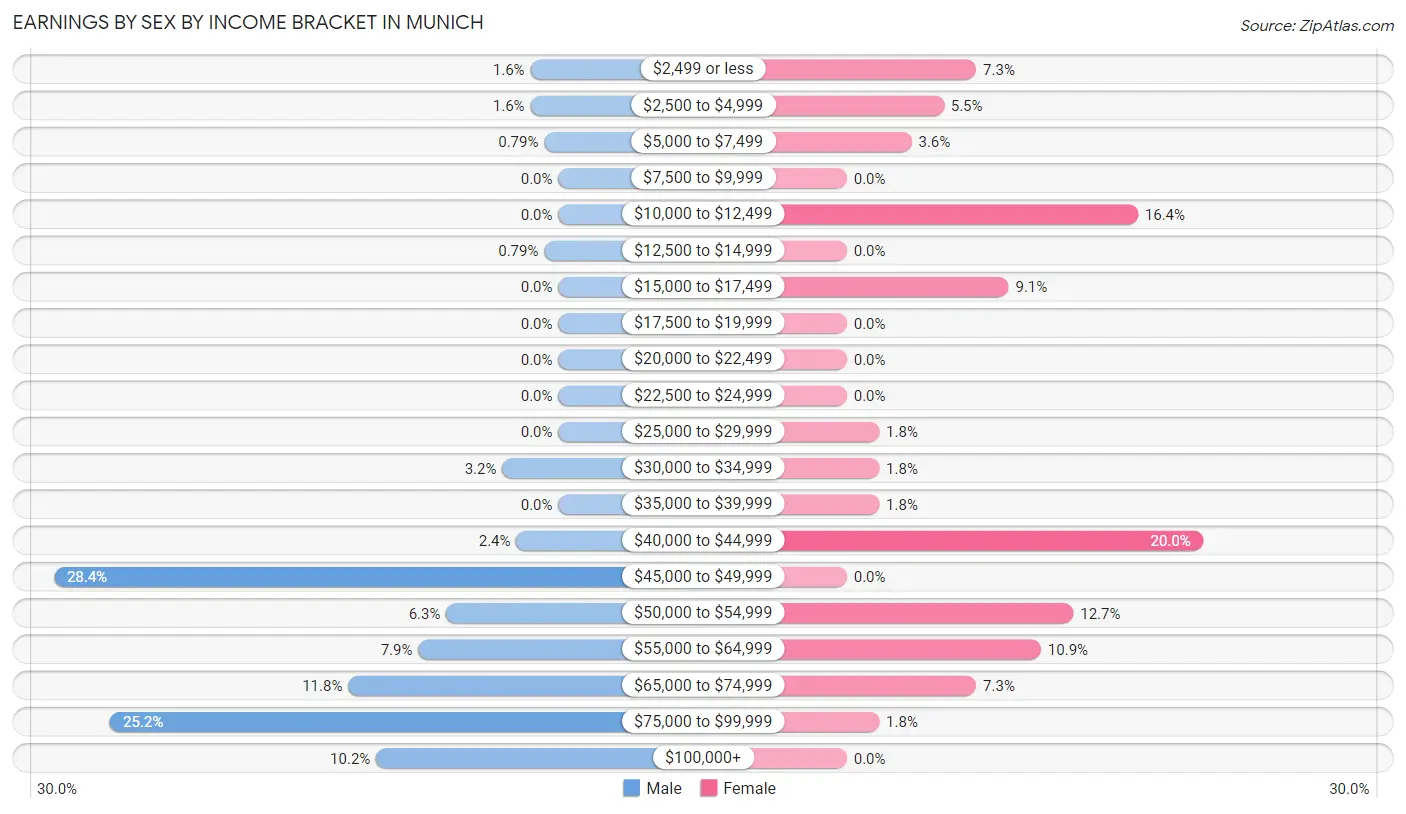
Earnings by Sex by Income Bracket in Munich
The most common earnings brackets in Munich are $45,000 to $49,999 for men (36 | 28.3%) and $40,000 to $44,999 for women (11 | 20.0%).
| Income | Male | Female |
| $2,499 or less | 2 (1.6%) | 4 (7.3%) |
| $2,500 to $4,999 | 2 (1.6%) | 3 (5.4%) |
| $5,000 to $7,499 | 1 (0.8%) | 2 (3.6%) |
| $7,500 to $9,999 | 0 (0.0%) | 0 (0.0%) |
| $10,000 to $12,499 | 0 (0.0%) | 9 (16.4%) |
| $12,500 to $14,999 | 1 (0.8%) | 0 (0.0%) |
| $15,000 to $17,499 | 0 (0.0%) | 5 (9.1%) |
| $17,500 to $19,999 | 0 (0.0%) | 0 (0.0%) |
| $20,000 to $22,499 | 0 (0.0%) | 0 (0.0%) |
| $22,500 to $24,999 | 0 (0.0%) | 0 (0.0%) |
| $25,000 to $29,999 | 0 (0.0%) | 1 (1.8%) |
| $30,000 to $34,999 | 4 (3.2%) | 1 (1.8%) |
| $35,000 to $39,999 | 0 (0.0%) | 1 (1.8%) |
| $40,000 to $44,999 | 3 (2.4%) | 11 (20.0%) |
| $45,000 to $49,999 | 36 (28.3%) | 0 (0.0%) |
| $50,000 to $54,999 | 8 (6.3%) | 7 (12.7%) |
| $55,000 to $64,999 | 10 (7.9%) | 6 (10.9%) |
| $65,000 to $74,999 | 15 (11.8%) | 4 (7.3%) |
| $75,000 to $99,999 | 32 (25.2%) | 1 (1.8%) |
| $100,000+ | 13 (10.2%) | 0 (0.0%) |
| Total | 127 (100.0%) | 55 (100.0%) |
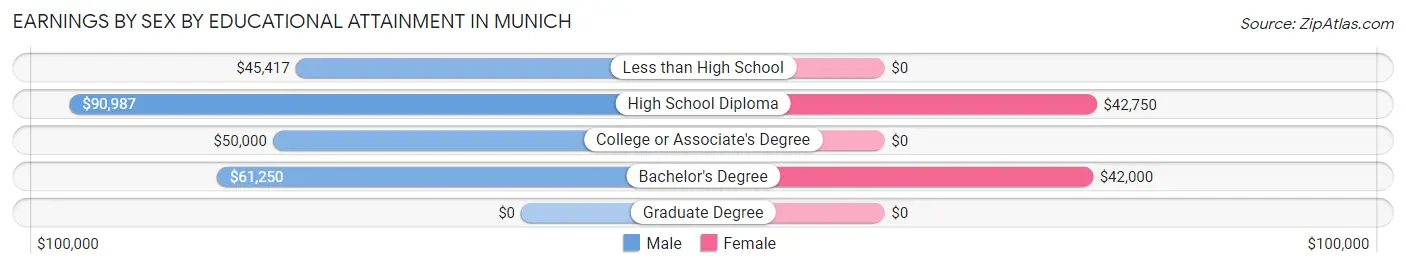
Earnings by Sex by Educational Attainment in Munich
Average earnings in Munich are $61,250 for men and $41,250 for women, a difference of 32.7%. Men with an educational attainment of high school diploma enjoy the highest average annual earnings of $90,987, while those with less than high school education earn the least with $45,417. Women with an educational attainment of high school diploma earn the most with the average annual earnings of $42,750, while those with bachelor's degree education have the smallest earnings of $42,000.
| Educational Attainment | Male Income | Female Income |
| Less than High School | $45,417 | $0 |
| High School Diploma | $90,987 | $42,750 |
| College or Associate's Degree | $50,000 | $0 |
| Bachelor's Degree | $61,250 | $42,000 |
| Graduate Degree | - | - |
| Total | $61,250 | $41,250 |
Family Income in Munich
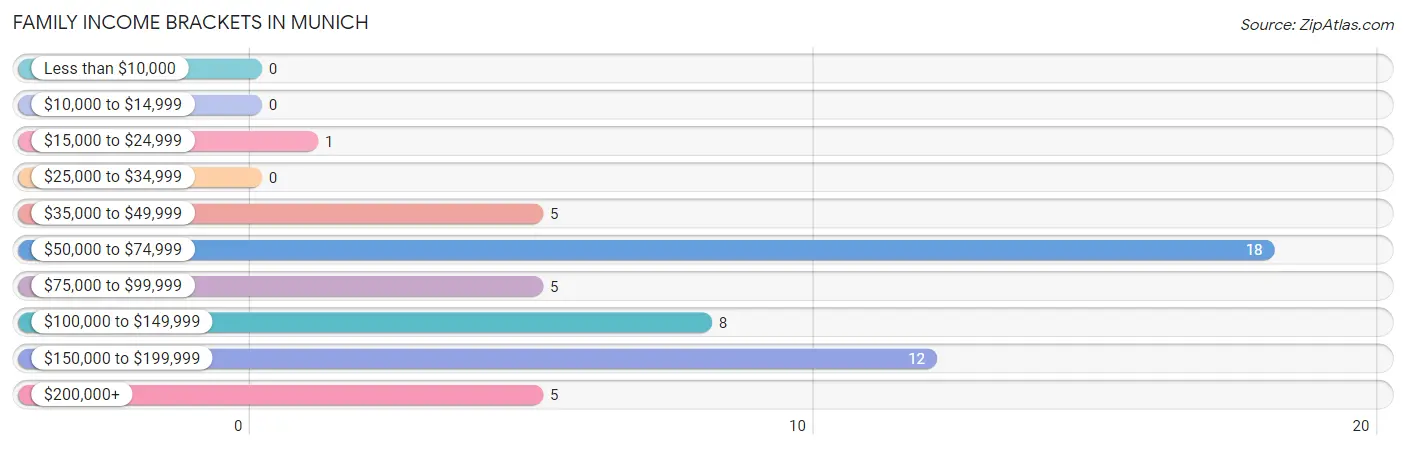
Family Income Brackets in Munich
According to the Munich family income data, there are 18 families falling into the $50,000 to $74,999 income range, which is the most common income bracket and makes up 33.3% of all families.
| Income Bracket | # Families | % Families |
| Less than $10,000 | 0 | 0.0% |
| $10,000 to $14,999 | 0 | 0.0% |
| $15,000 to $24,999 | 1 | 1.9% |
| $25,000 to $34,999 | 0 | 0.0% |
| $35,000 to $49,999 | 5 | 9.3% |
| $50,000 to $74,999 | 18 | 33.3% |
| $75,000 to $99,999 | 5 | 9.3% |
| $100,000 to $149,999 | 8 | 14.8% |
| $150,000 to $199,999 | 12 | 22.2% |
| $200,000+ | 5 | 9.3% |
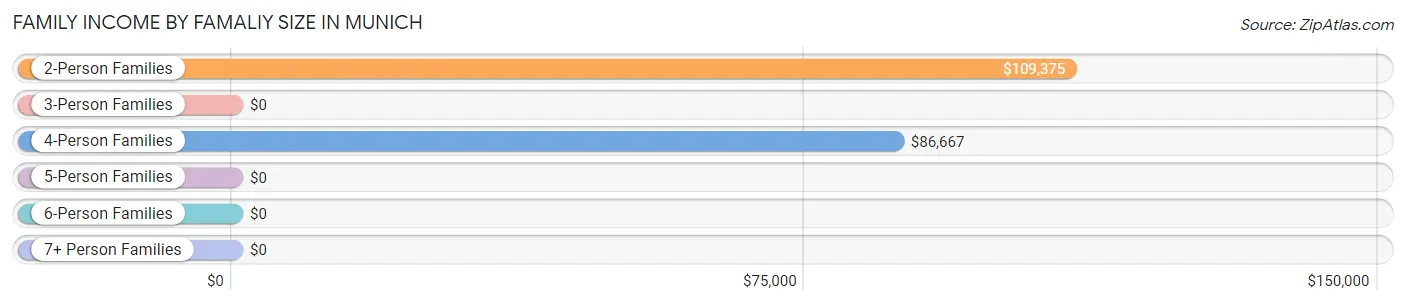
Family Income by Famaliy Size in Munich
2-person families (23 | 42.6%) account for the highest median family income in Munich with $109,375 per family, while 2-person families (23 | 42.6%) have the highest median income of $54,688 per family member.
| Income Bracket | # Families | Median Income |
| 2-Person Families | 23 (42.6%) | $109,375 |
| 3-Person Families | 1 (1.8%) | $0 |
| 4-Person Families | 20 (37.0%) | $86,667 |
| 5-Person Families | 3 (5.6%) | $0 |
| 6-Person Families | 7 (13.0%) | $0 |
| 7+ Person Families | 0 (0.0%) | $0 |
| Total | 54 (100.0%) | $88,750 |
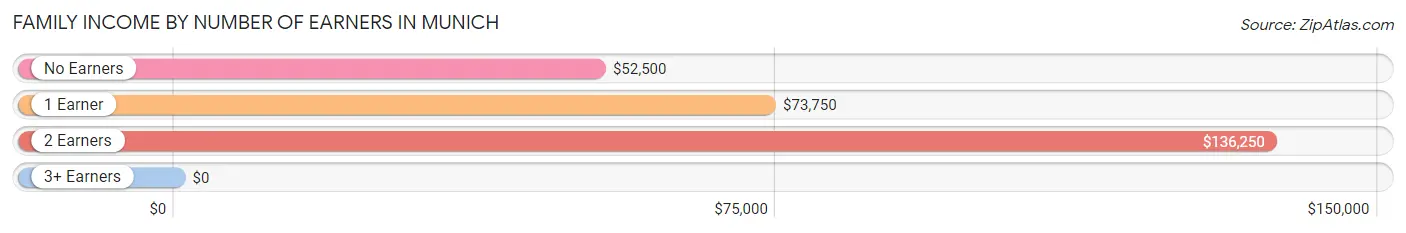
Family Income by Number of Earners in Munich
| Number of Earners | # Families | Median Income |
| No Earners | 6 (11.1%) | $52,500 |
| 1 Earner | 14 (25.9%) | $73,750 |
| 2 Earners | 29 (53.7%) | $136,250 |
| 3+ Earners | 5 (9.3%) | $0 |
| Total | 54 (100.0%) | $88,750 |
Household Income in Munich
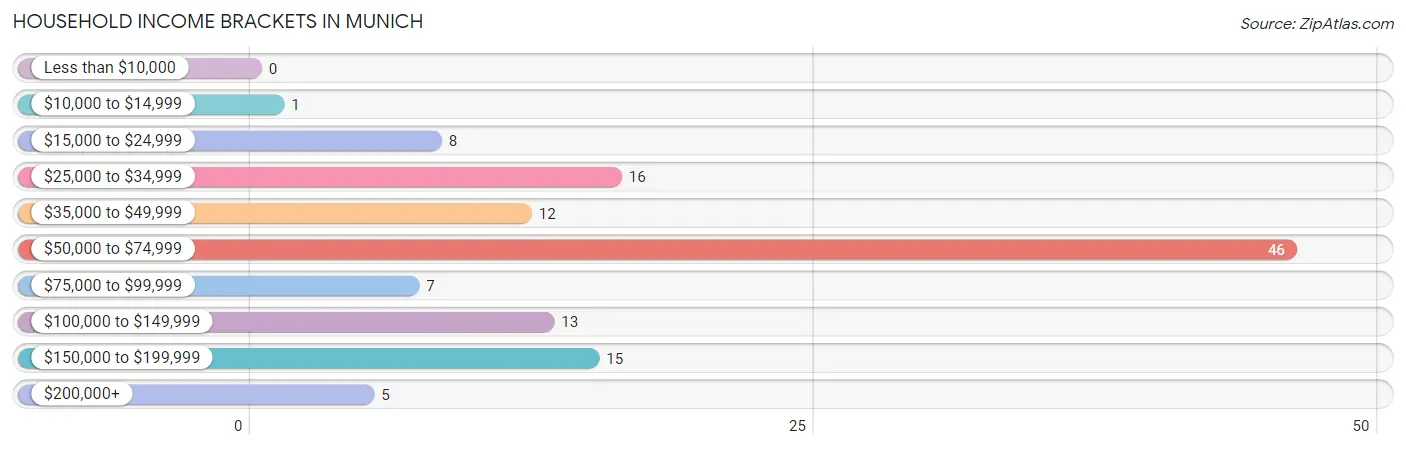
Household Income Brackets in Munich
With 46 households falling in the category, the $50,000 to $74,999 income range is the most frequent in Munich, accounting for 37.4% of all households.
| Income Bracket | # Households | % Households |
| Less than $10,000 | 0 | 0.0% |
| $10,000 to $14,999 | 1 | 0.8% |
| $15,000 to $24,999 | 8 | 6.5% |
| $25,000 to $34,999 | 16 | 13.0% |
| $35,000 to $49,999 | 12 | 9.8% |
| $50,000 to $74,999 | 46 | 37.4% |
| $75,000 to $99,999 | 7 | 5.7% |
| $100,000 to $149,999 | 13 | 10.6% |
| $150,000 to $199,999 | 15 | 12.2% |
| $200,000+ | 5 | 4.1% |
Household Income by Householder Age in Munich
The median household income in Munich is $59,625, with the highest median household income of $126,250 found in the 45 to 64 years age bracket for the primary householder. A total of 24 households (19.5%) fall into this category. Meanwhile, the 15 to 24 years age bracket for the primary householder has the lowest median household income of $0, with 5 households (4.1%) in this group.
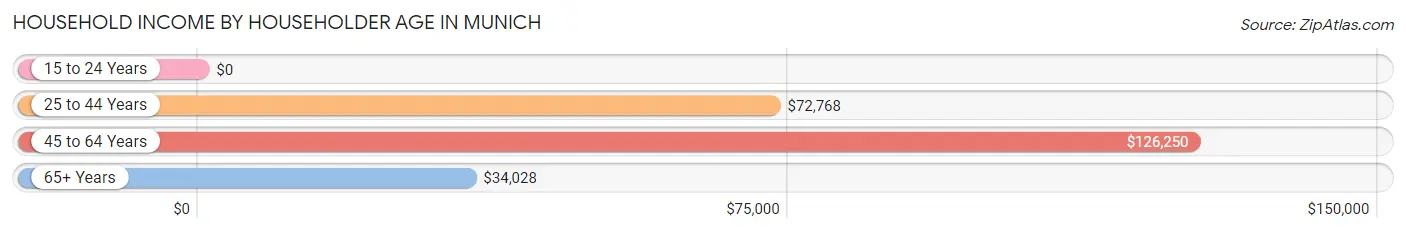
| Income Bracket | # Households | Median Income |
| 15 to 24 Years | 5 (4.1%) | $0 |
| 25 to 44 Years | 57 (46.3%) | $72,768 |
| 45 to 64 Years | 24 (19.5%) | $126,250 |
| 65+ Years | 37 (30.1%) | $34,028 |
| Total | 123 (100.0%) | $59,625 |
Poverty in Munich
Income Below Poverty by Sex and Age in Munich
With 1.0% poverty level for males and 20.3% for females among the residents of Munich, 18 to 24 year old males and 55 to 64 year old females are the most vulnerable to poverty, with 1 males (20.0%) and 27 females (73.0%) in their respective age groups living below the poverty level.
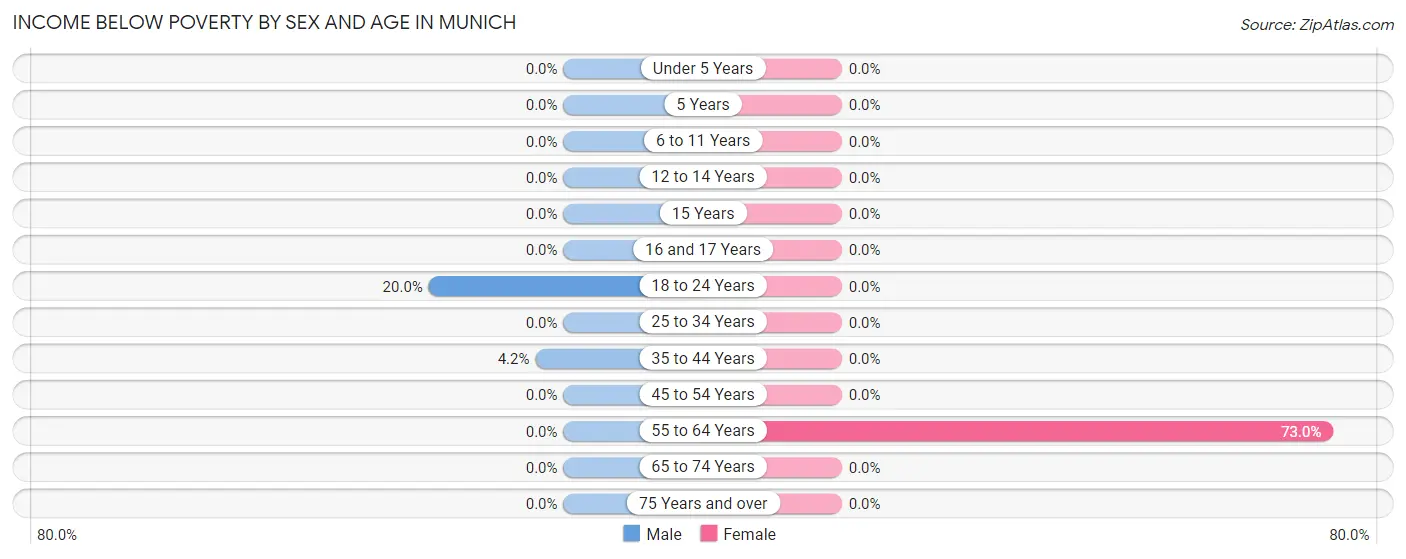
| Age Bracket | Male | Female |
| Under 5 Years | 0 (0.0%) | 0 (0.0%) |
| 5 Years | 0 (0.0%) | 0 (0.0%) |
| 6 to 11 Years | 0 (0.0%) | 0 (0.0%) |
| 12 to 14 Years | 0 (0.0%) | 0 (0.0%) |
| 15 Years | 0 (0.0%) | 0 (0.0%) |
| 16 and 17 Years | 0 (0.0%) | 0 (0.0%) |
| 18 to 24 Years | 1 (20.0%) | 0 (0.0%) |
| 25 to 34 Years | 0 (0.0%) | 0 (0.0%) |
| 35 to 44 Years | 1 (4.2%) | 0 (0.0%) |
| 45 to 54 Years | 0 (0.0%) | 0 (0.0%) |
| 55 to 64 Years | 0 (0.0%) | 27 (73.0%) |
| 65 to 74 Years | 0 (0.0%) | 0 (0.0%) |
| 75 Years and over | 0 (0.0%) | 0 (0.0%) |
| Total | 2 (1.0%) | 27 (20.3%) |
Income Above Poverty by Sex and Age in Munich
According to the poverty statistics in Munich, males aged under 5 years and females aged under 5 years are the age groups that are most secure financially, with 100.0% of males and 100.0% of females in these age groups living above the poverty line.
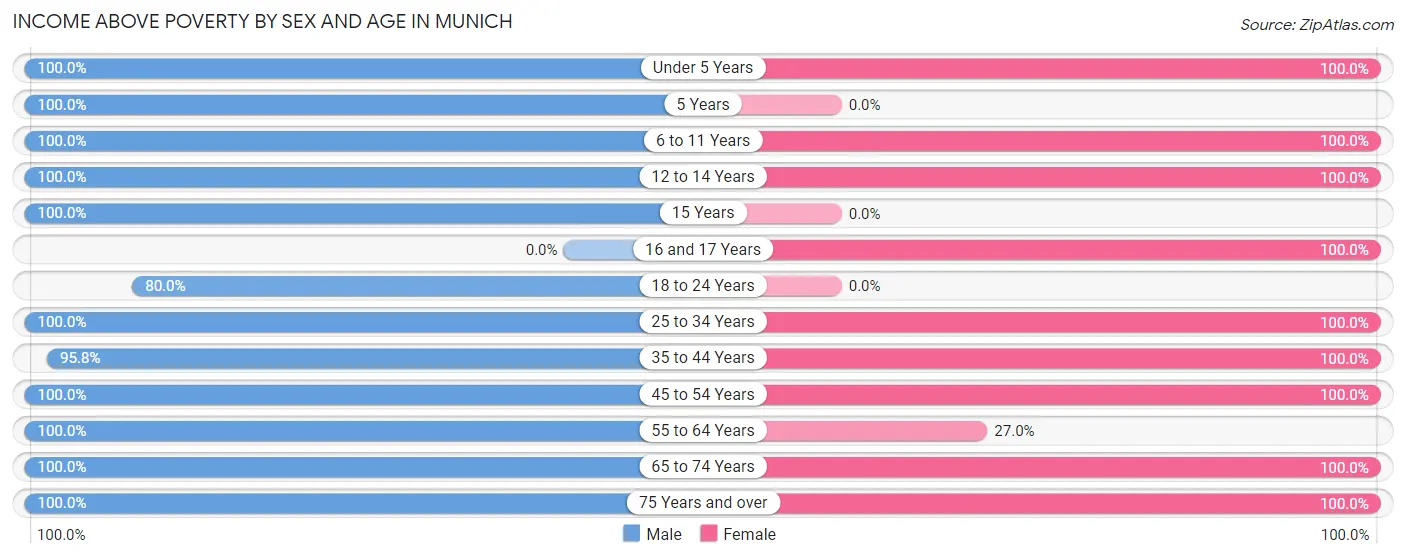
| Age Bracket | Male | Female |
| Under 5 Years | 17 (100.0%) | 17 (100.0%) |
| 5 Years | 1 (100.0%) | 0 (0.0%) |
| 6 to 11 Years | 18 (100.0%) | 5 (100.0%) |
| 12 to 14 Years | 26 (100.0%) | 2 (100.0%) |
| 15 Years | 6 (100.0%) | 0 (0.0%) |
| 16 and 17 Years | 0 (0.0%) | 4 (100.0%) |
| 18 to 24 Years | 4 (80.0%) | 0 (0.0%) |
| 25 to 34 Years | 68 (100.0%) | 5 (100.0%) |
| 35 to 44 Years | 23 (95.8%) | 25 (100.0%) |
| 45 to 54 Years | 3 (100.0%) | 7 (100.0%) |
| 55 to 64 Years | 21 (100.0%) | 10 (27.0%) |
| 65 to 74 Years | 11 (100.0%) | 16 (100.0%) |
| 75 Years and over | 4 (100.0%) | 15 (100.0%) |
| Total | 202 (99.0%) | 106 (79.7%) |
Income Below Poverty Among Married-Couple Families in Munich
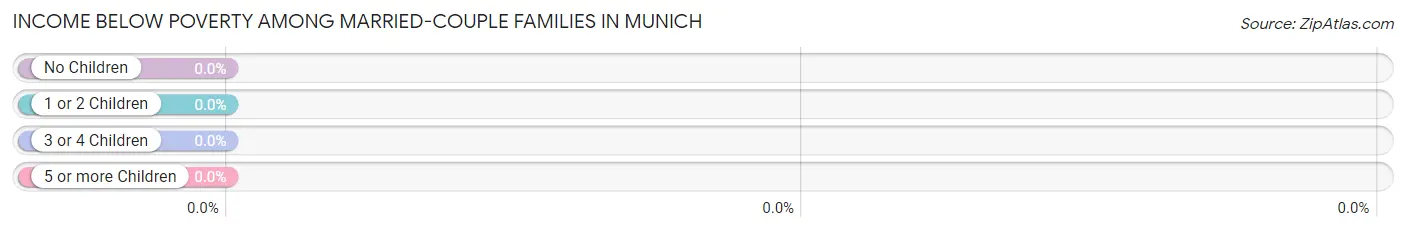
| Children | Above Poverty | Below Poverty |
| No Children | 23 (100.0%) | 0 (0.0%) |
| 1 or 2 Children | 15 (100.0%) | 0 (0.0%) |
| 3 or 4 Children | 10 (100.0%) | 0 (0.0%) |
| 5 or more Children | 0 (0.0%) | 0 (0.0%) |
| Total | 48 (100.0%) | 0 (0.0%) |
Income Below Poverty Among Single-Parent Households in Munich
| Children | Single Father | Single Mother |
| No Children | 0 (0.0%) | 0 (0.0%) |
| 1 or 2 Children | 0 (0.0%) | 0 (0.0%) |
| 3 or 4 Children | 0 (0.0%) | 0 (0.0%) |
| 5 or more Children | 0 (0.0%) | 0 (0.0%) |
| Total | 0 (0.0%) | 0 (0.0%) |
Income Below Poverty Among Married-Couple vs Single-Parent Households in Munich
| Children | Married-Couple Families | Single-Parent Households |
| No Children | 0 (0.0%) | 0 (0.0%) |
| 1 or 2 Children | 0 (0.0%) | 0 (0.0%) |
| 3 or 4 Children | 0 (0.0%) | 0 (0.0%) |
| 5 or more Children | 0 (0.0%) | 0 (0.0%) |
| Total | 0 (0.0%) | 0 (0.0%) |
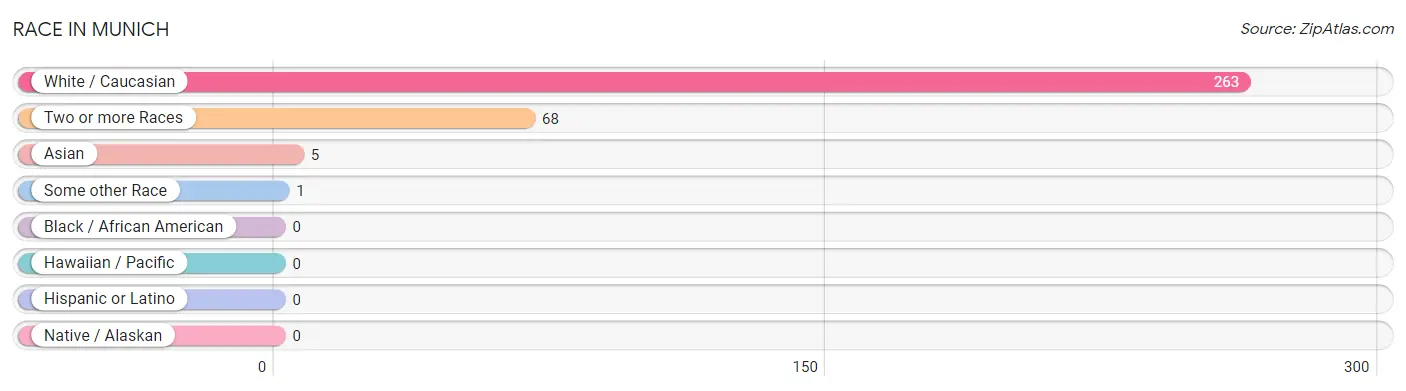
Race in Munich
The most populous races in Munich are White / Caucasian (263 | 78.0%), Two or more Races (68 | 20.2%), and Asian (5 | 1.5%).
| Race | # Population | % Population |
| Asian | 5 | 1.5% |
| Black / African American | 0 | 0.0% |
| Hawaiian / Pacific | 0 | 0.0% |
| Hispanic or Latino | 0 | 0.0% |
| Native / Alaskan | 0 | 0.0% |
| White / Caucasian | 263 | 78.0% |
| Two or more Races | 68 | 20.2% |
| Some other Race | 1 | 0.3% |
| Total | 337 | 100.0% |
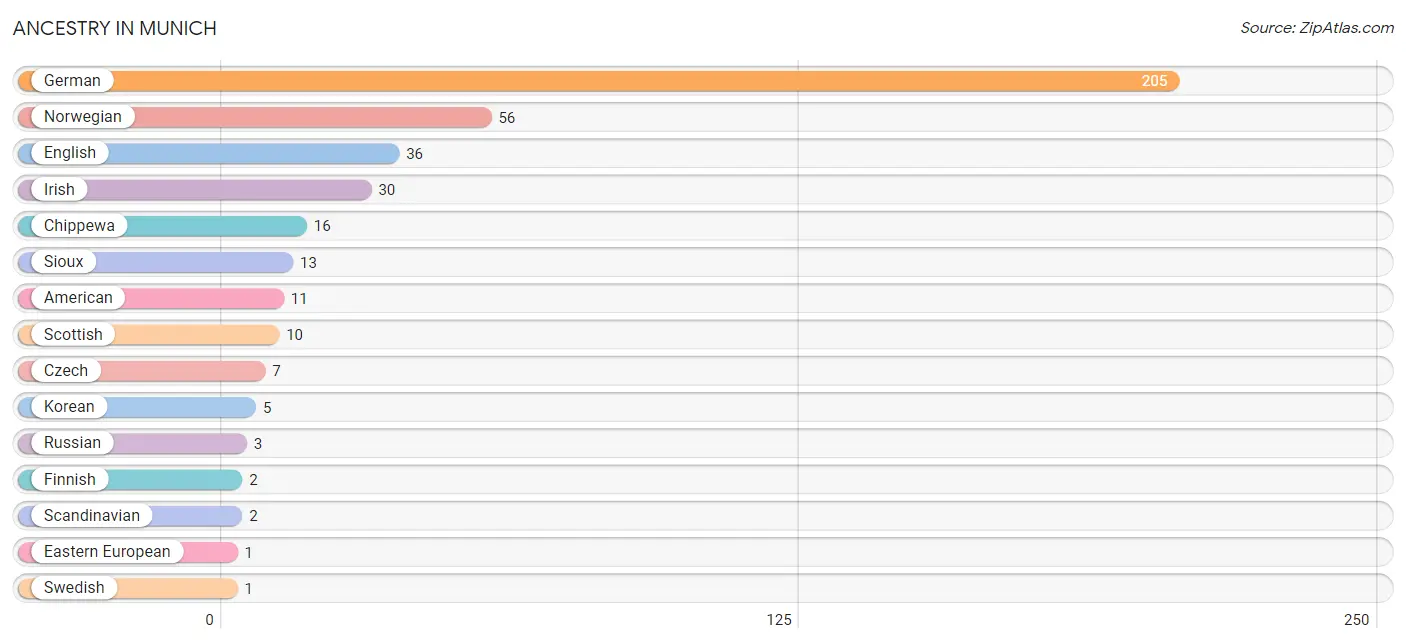
Ancestry in Munich
The most populous ancestries reported in Munich are German (205 | 60.8%), Norwegian (56 | 16.6%), English (36 | 10.7%), Irish (30 | 8.9%), and Chippewa (16 | 4.8%), together accounting for 101.8% of all Munich residents.
| Ancestry | # Population | % Population |
| American | 11 | 3.3% |
| Chippewa | 16 | 4.8% |
| Czech | 7 | 2.1% |
| Eastern European | 1 | 0.3% |
| English | 36 | 10.7% |
| Finnish | 2 | 0.6% |
| German | 205 | 60.8% |
| Irish | 30 | 8.9% |
| Korean | 5 | 1.5% |
| Norwegian | 56 | 16.6% |
| Russian | 3 | 0.9% |
| Scandinavian | 2 | 0.6% |
| Scottish | 10 | 3.0% |
| Sioux | 13 | 3.9% |
| Swedish | 1 | 0.3% |
| Ukrainian | 1 | 0.3% | View All 16 Rows |
Immigrants in Munich
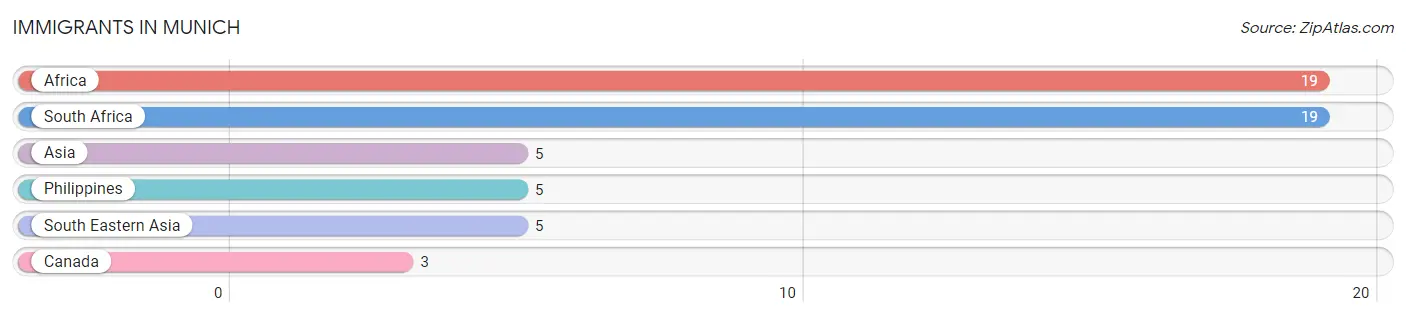
The most numerous immigrant groups reported in Munich came from Africa (19 | 5.6%), South Africa (19 | 5.6%), Asia (5 | 1.5%), Philippines (5 | 1.5%), and South Eastern Asia (5 | 1.5%), together accounting for 15.7% of all Munich residents.
| Immigration Origin | # Population | % Population |
| Africa | 19 | 5.6% |
| Asia | 5 | 1.5% |
| Canada | 3 | 0.9% |
| Philippines | 5 | 1.5% |
| South Africa | 19 | 5.6% |
| South Eastern Asia | 5 | 1.5% | View All 6 Rows |
Sex and Age in Munich
Sex and Age in Munich
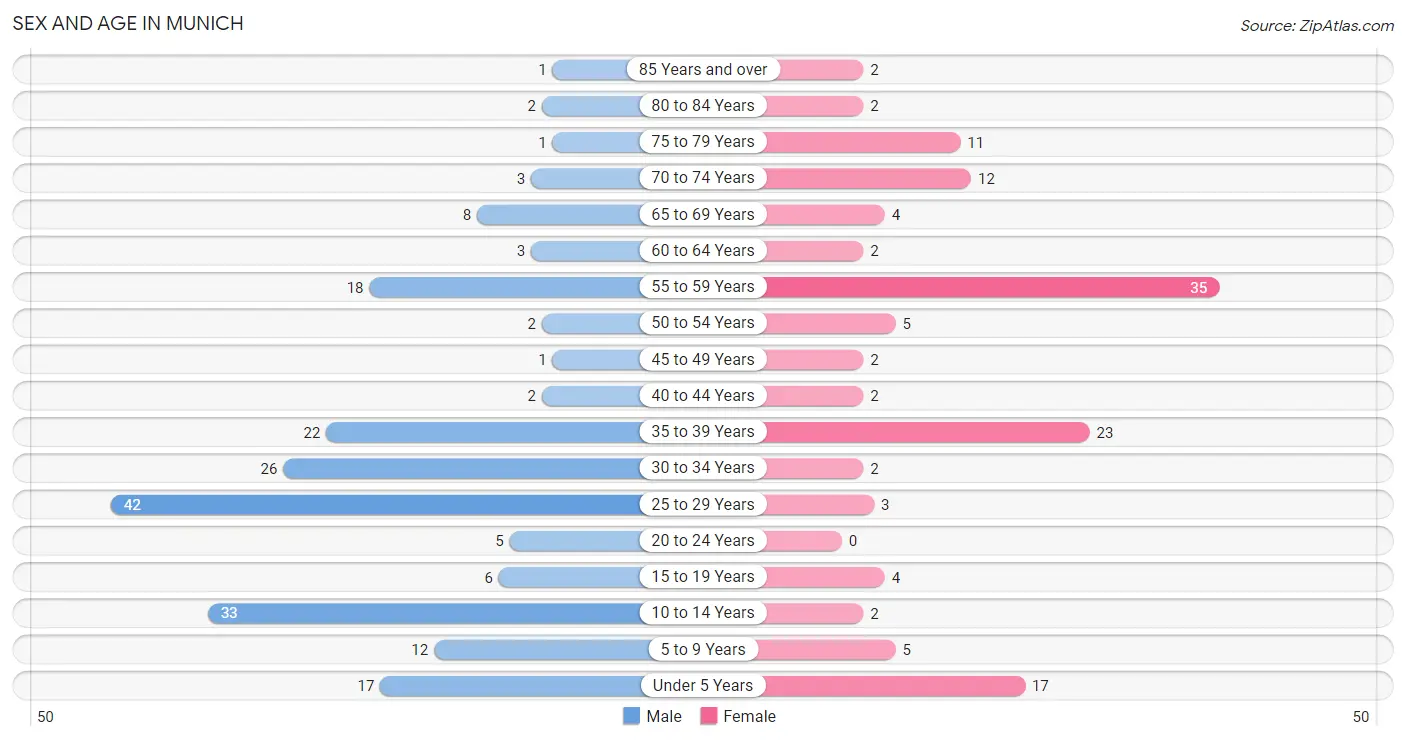
The most populous age groups in Munich are 25 to 29 Years (42 | 20.6%) for men and 55 to 59 Years (35 | 26.3%) for women.
| Age Bracket | Male | Female |
| Under 5 Years | 17 (8.3%) | 17 (12.8%) |
| 5 to 9 Years | 12 (5.9%) | 5 (3.8%) |
| 10 to 14 Years | 33 (16.2%) | 2 (1.5%) |
| 15 to 19 Years | 6 (2.9%) | 4 (3.0%) |
| 20 to 24 Years | 5 (2.5%) | 0 (0.0%) |
| 25 to 29 Years | 42 (20.6%) | 3 (2.3%) |
| 30 to 34 Years | 26 (12.8%) | 2 (1.5%) |
| 35 to 39 Years | 22 (10.8%) | 23 (17.3%) |
| 40 to 44 Years | 2 (1.0%) | 2 (1.5%) |
| 45 to 49 Years | 1 (0.5%) | 2 (1.5%) |
| 50 to 54 Years | 2 (1.0%) | 5 (3.8%) |
| 55 to 59 Years | 18 (8.8%) | 35 (26.3%) |
| 60 to 64 Years | 3 (1.5%) | 2 (1.5%) |
| 65 to 69 Years | 8 (3.9%) | 4 (3.0%) |
| 70 to 74 Years | 3 (1.5%) | 12 (9.0%) |
| 75 to 79 Years | 1 (0.5%) | 11 (8.3%) |
| 80 to 84 Years | 2 (1.0%) | 2 (1.5%) |
| 85 Years and over | 1 (0.5%) | 2 (1.5%) |
| Total | 204 (100.0%) | 133 (100.0%) |
Families and Households in Munich
Median Family Size in Munich
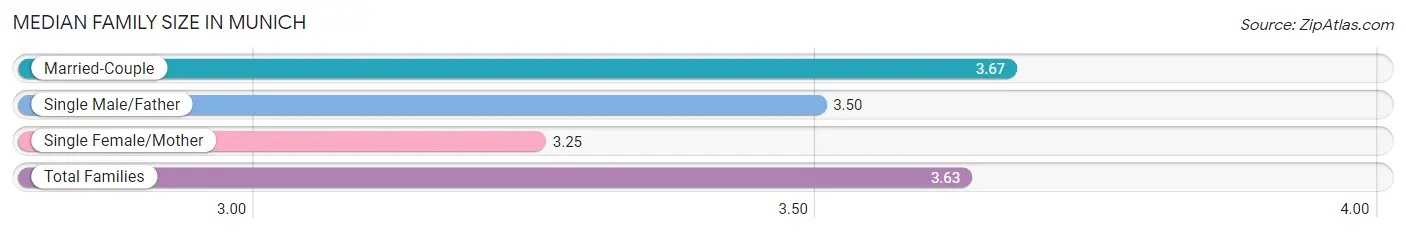
The median family size in Munich is 3.63 persons per family, with married-couple families (48 | 88.9%) accounting for the largest median family size of 3.67 persons per family. On the other hand, single female/mother families (4 | 7.4%) represent the smallest median family size with 3.25 persons per family.
| Family Type | # Families | Family Size |
| Married-Couple | 48 (88.9%) | 3.67 |
| Single Male/Father | 2 (3.7%) | 3.50 |
| Single Female/Mother | 4 (7.4%) | 3.25 |
| Total Families | 54 (100.0%) | 3.63 |
Median Household Size in Munich
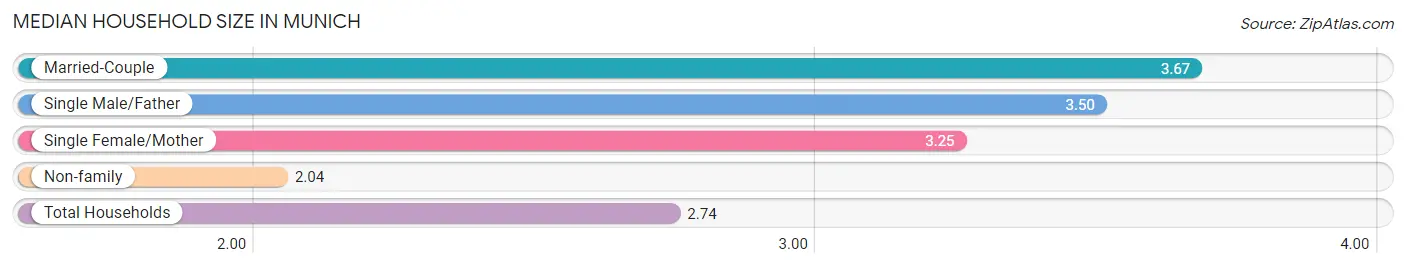
The median household size in Munich is 2.74 persons per household, with married-couple households (48 | 39.0%) accounting for the largest median household size of 3.67 persons per household. non-family households (69 | 56.1%) represent the smallest median household size with 2.04 persons per household.
| Household Type | # Households | Household Size |
| Married-Couple | 48 (39.0%) | 3.67 |
| Single Male/Father | 2 (1.6%) | 3.50 |
| Single Female/Mother | 4 (3.3%) | 3.25 |
| Non-family | 69 (56.1%) | 2.04 |
| Total Households | 123 (100.0%) | 2.74 |
Household Size by Marriage Status in Munich
Out of a total of 123 households in Munich, 54 (43.9%) are family households, while 69 (56.1%) are nonfamily households. The most numerous type of family households are 2-person households, comprising 23, and the most common type of nonfamily households are 1-person households, comprising 61.
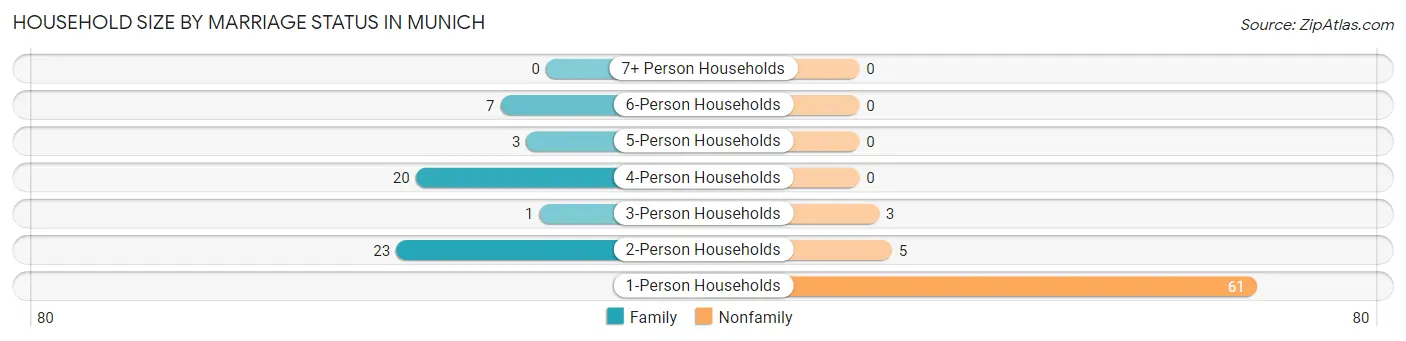
| Household Size | Family Households | Nonfamily Households |
| 1-Person Households | - | 61 (49.6%) |
| 2-Person Households | 23 (18.7%) | 5 (4.1%) |
| 3-Person Households | 1 (0.8%) | 3 (2.4%) |
| 4-Person Households | 20 (16.3%) | 0 (0.0%) |
| 5-Person Households | 3 (2.4%) | 0 (0.0%) |
| 6-Person Households | 7 (5.7%) | 0 (0.0%) |
| 7+ Person Households | 0 (0.0%) | 0 (0.0%) |
| Total | 54 (43.9%) | 69 (56.1%) |
Female Fertility in Munich
Fertility by Age in Munich
Average fertility rate in Munich is 28.0 births per 1,000 women. Women in the age bracket of 35 to 50 years have the highest fertility rate with 37.0 births per 1,000 women. Women in the age bracket of 35 to 50 years acount for 100.0% of all women with births.
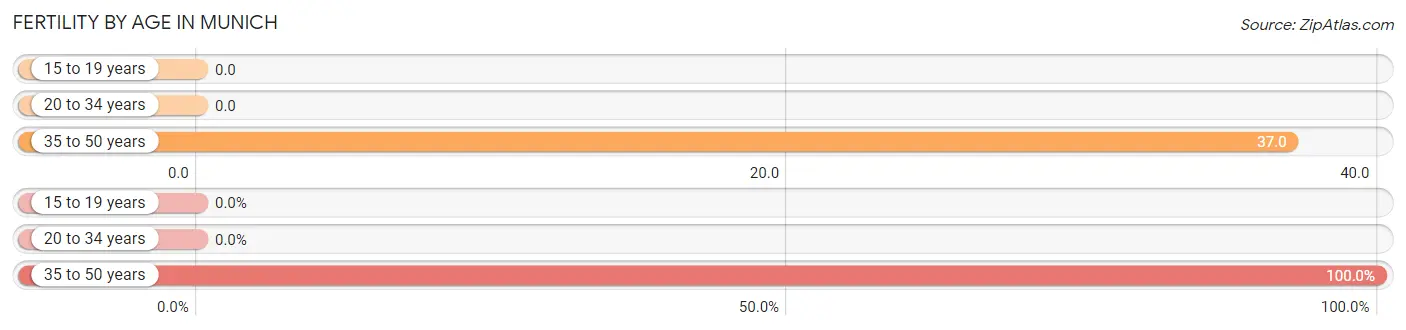
| Age Bracket | Women with Births | Births / 1,000 Women |
| 15 to 19 years | 0 (0.0%) | 0.0 |
| 20 to 34 years | 0 (0.0%) | 0.0 |
| 35 to 50 years | 1 (100.0%) | 37.0 |
| Total | 1 (100.0%) | 28.0 |
Fertility by Age by Marriage Status in Munich
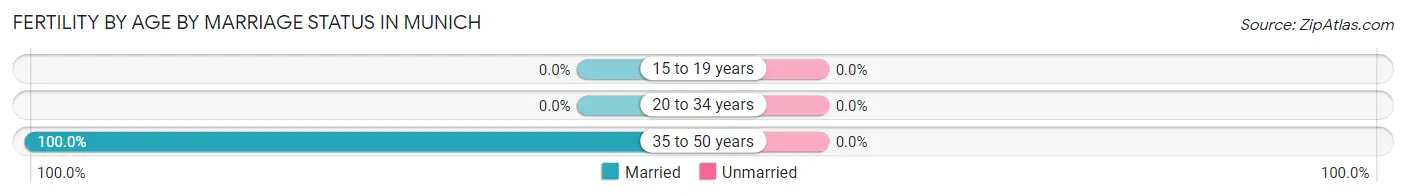
| Age Bracket | Married | Unmarried |
| 15 to 19 years | 0 (0.0%) | 0 (0.0%) |
| 20 to 34 years | 0 (0.0%) | 0 (0.0%) |
| 35 to 50 years | 1 (100.0%) | 0 (0.0%) |
| Total | 1 (100.0%) | 0 (0.0%) |
Fertility by Education in Munich
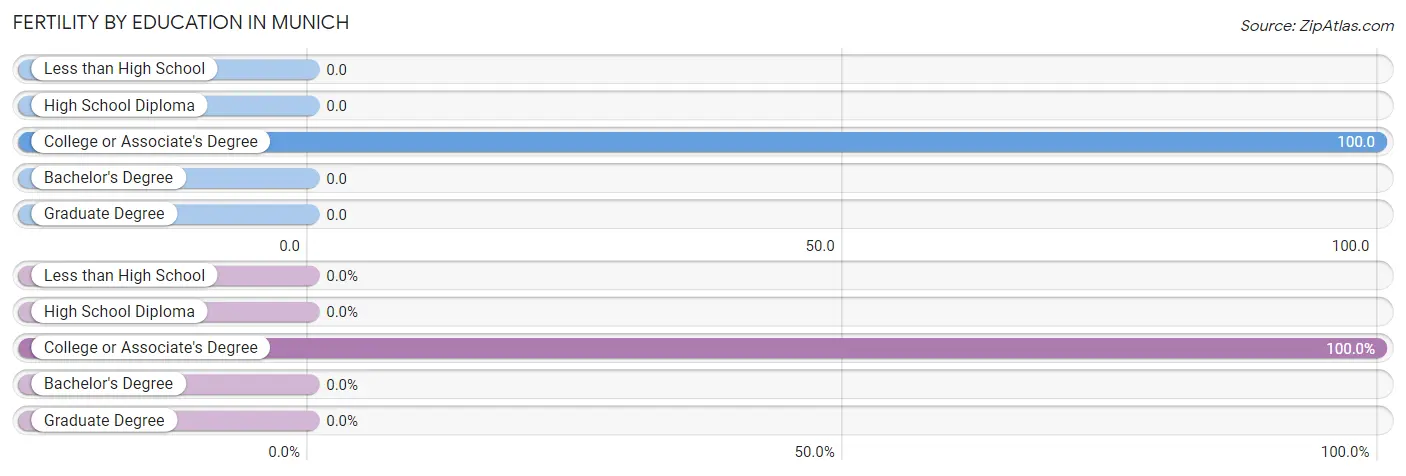
| Educational Attainment | Women with Births | Births / 1,000 Women |
| Less than High School | 0 (0.0%) | 0.0 |
| High School Diploma | 0 (0.0%) | 0.0 |
| College or Associate's Degree | 1 (100.0%) | 100.0 |
| Bachelor's Degree | 0 (0.0%) | 0.0 |
| Graduate Degree | 0 (0.0%) | 0.0 |
| Total | 1 (100.0%) | 28.0 |
Fertility by Education by Marriage Status in Munich
| Educational Attainment | Married | Unmarried |
| Less than High School | 0 (0.0%) | 0 (0.0%) |
| High School Diploma | 0 (0.0%) | 0 (0.0%) |
| College or Associate's Degree | 1 (100.0%) | 0 (0.0%) |
| Bachelor's Degree | 0 (0.0%) | 0 (0.0%) |
| Graduate Degree | 0 (0.0%) | 0 (0.0%) |
| Total | 1 (100.0%) | 0 (0.0%) |
Employment Characteristics in Munich
Employment by Class of Employer in Munich
Among the 170 employed individuals in Munich, private company employees (74 | 43.5%), self-employed (not incorporated) (52 | 30.6%), and not-for-profit organizations (15 | 8.8%) make up the most common classes of employment.
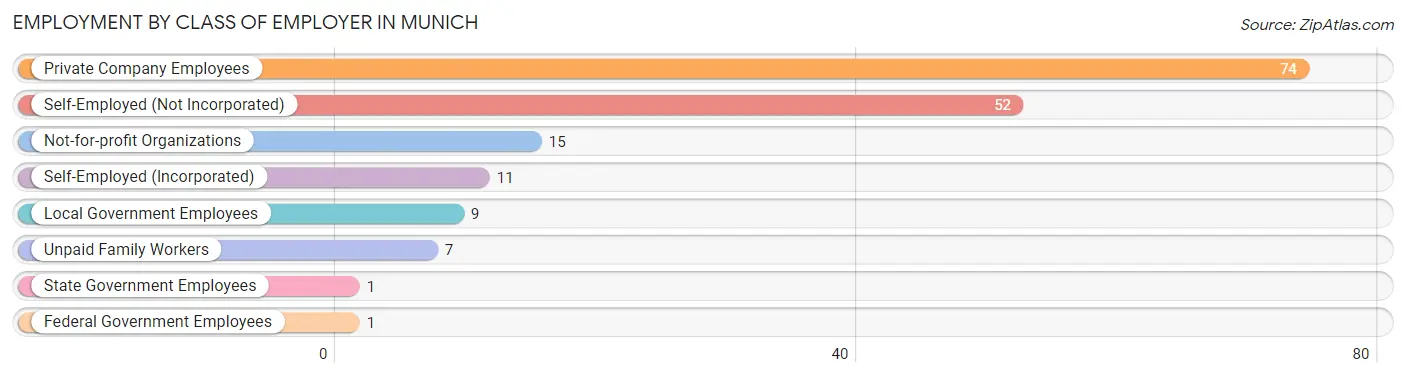
| Employer Class | # Employees | % Employees |
| Private Company Employees | 74 | 43.5% |
| Self-Employed (Incorporated) | 11 | 6.5% |
| Self-Employed (Not Incorporated) | 52 | 30.6% |
| Not-for-profit Organizations | 15 | 8.8% |
| Local Government Employees | 9 | 5.3% |
| State Government Employees | 1 | 0.6% |
| Federal Government Employees | 1 | 0.6% |
| Unpaid Family Workers | 7 | 4.1% |
| Total | 170 | 100.0% |
Employment Status by Age in Munich
According to the labor force statistics for Munich, out of the total population over 16 years of age (245), 70.2% or 172 individuals are in the labor force, with 0.6% or 1 of them unemployed. The age group with the highest labor force participation rate is 25 to 29 years, with 100.0% or 45 individuals in the labor force. Within the labor force, the 16 to 19 years age range has the highest percentage of unemployed individuals, with 100.0% or 1 of them being unemployed.
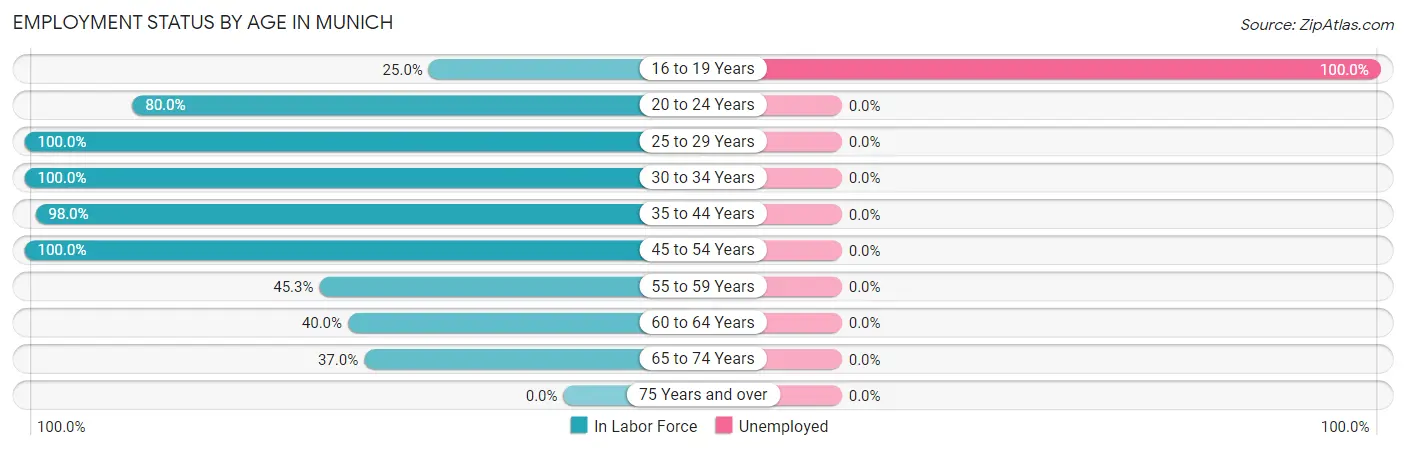
| Age Bracket | In Labor Force | Unemployed |
| 16 to 19 Years | 1 (25.0%) | 1 (100.0%) |
| 20 to 24 Years | 4 (80.0%) | 0 (0.0%) |
| 25 to 29 Years | 45 (100.0%) | 0 (0.0%) |
| 30 to 34 Years | 28 (100.0%) | 0 (0.0%) |
| 35 to 44 Years | 48 (98.0%) | 0 (0.0%) |
| 45 to 54 Years | 10 (100.0%) | 0 (0.0%) |
| 55 to 59 Years | 24 (45.3%) | 0 (0.0%) |
| 60 to 64 Years | 2 (40.0%) | 0 (0.0%) |
| 65 to 74 Years | 10 (37.0%) | 0 (0.0%) |
| 75 Years and over | 0 (0.0%) | 0 (0.0%) |
| Total | 172 (70.2%) | 1 (0.6%) |
Employment Status by Educational Attainment in Munich
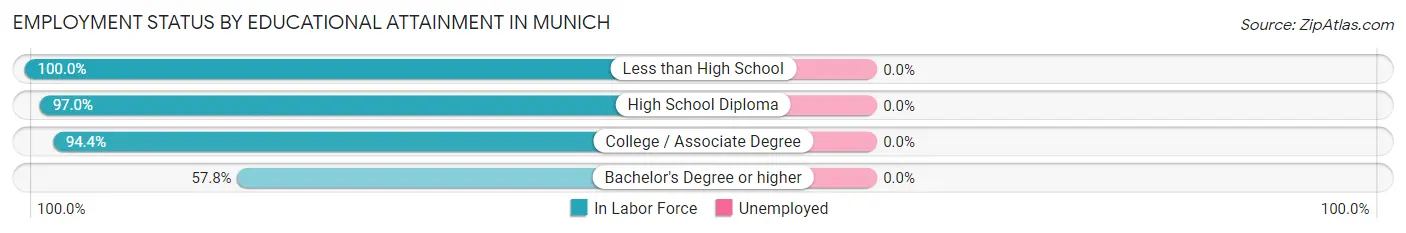
| Educational Attainment | In Labor Force | Unemployed |
| Less than High School | 4 (100.0%) | 0 (0.0%) |
| High School Diploma | 32 (97.0%) | 0 (0.0%) |
| College / Associate Degree | 84 (94.4%) | 0 (0.0%) |
| Bachelor's Degree or higher | 37 (57.8%) | 0 (0.0%) |
| Total | 157 (82.6%) | 0 (0.0%) |
Employment Occupations by Sex in Munich
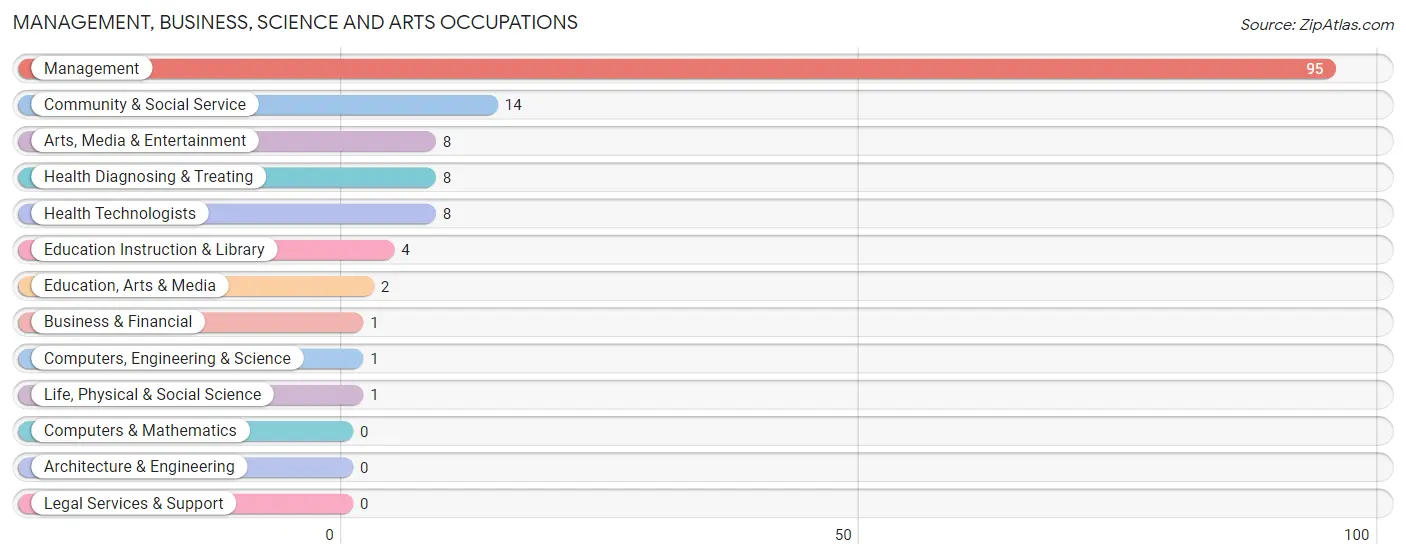
Management, Business, Science and Arts Occupations
The most common Management, Business, Science and Arts occupations in Munich are Management (95 | 55.6%), Community & Social Service (14 | 8.2%), Arts, Media & Entertainment (8 | 4.7%), Health Diagnosing & Treating (8 | 4.7%), and Health Technologists (8 | 4.7%).
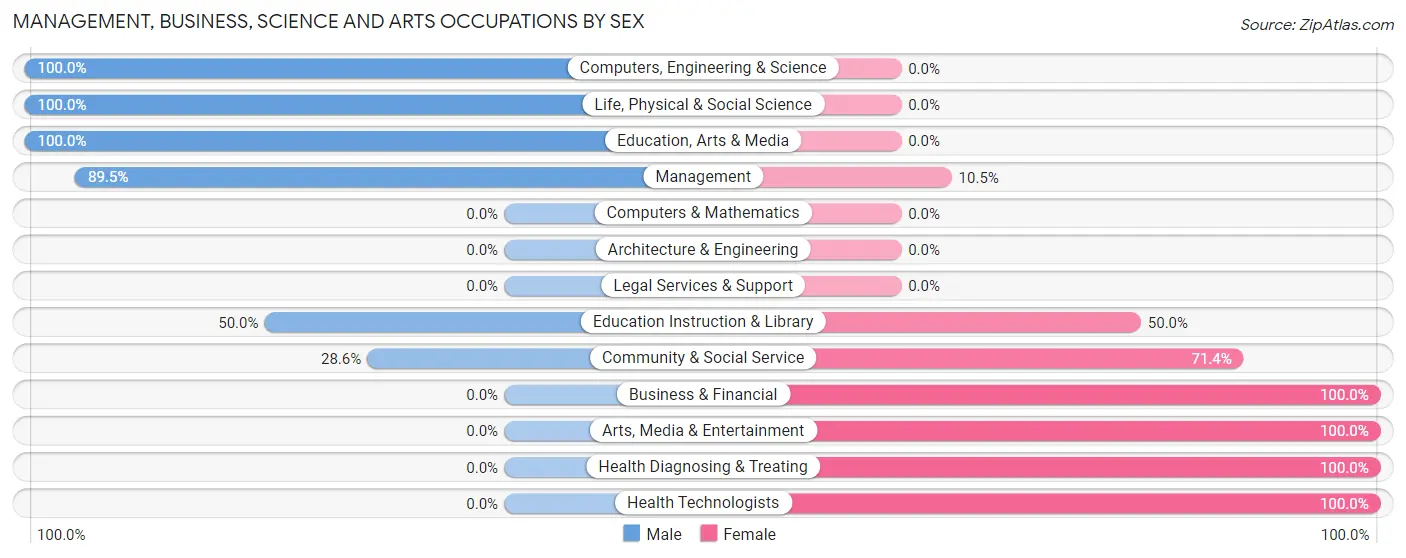
Management, Business, Science and Arts Occupations by Sex
Within the Management, Business, Science and Arts occupations in Munich, the most male-oriented occupations are Computers, Engineering & Science (100.0%), Life, Physical & Social Science (100.0%), and Education, Arts & Media (100.0%), while the most female-oriented occupations are Business & Financial (100.0%), Arts, Media & Entertainment (100.0%), and Health Diagnosing & Treating (100.0%).
| Occupation | Male | Female |
| Management | 85 (89.5%) | 10 (10.5%) |
| Business & Financial | 0 (0.0%) | 1 (100.0%) |
| Computers, Engineering & Science | 1 (100.0%) | 0 (0.0%) |
| Computers & Mathematics | 0 (0.0%) | 0 (0.0%) |
| Architecture & Engineering | 0 (0.0%) | 0 (0.0%) |
| Life, Physical & Social Science | 1 (100.0%) | 0 (0.0%) |
| Community & Social Service | 4 (28.6%) | 10 (71.4%) |
| Education, Arts & Media | 2 (100.0%) | 0 (0.0%) |
| Legal Services & Support | 0 (0.0%) | 0 (0.0%) |
| Education Instruction & Library | 2 (50.0%) | 2 (50.0%) |
| Arts, Media & Entertainment | 0 (0.0%) | 8 (100.0%) |
| Health Diagnosing & Treating | 0 (0.0%) | 8 (100.0%) |
| Health Technologists | 0 (0.0%) | 8 (100.0%) |
| Total (Category) | 90 (75.6%) | 29 (24.4%) |
| Total (Overall) | 123 (71.9%) | 48 (28.1%) |
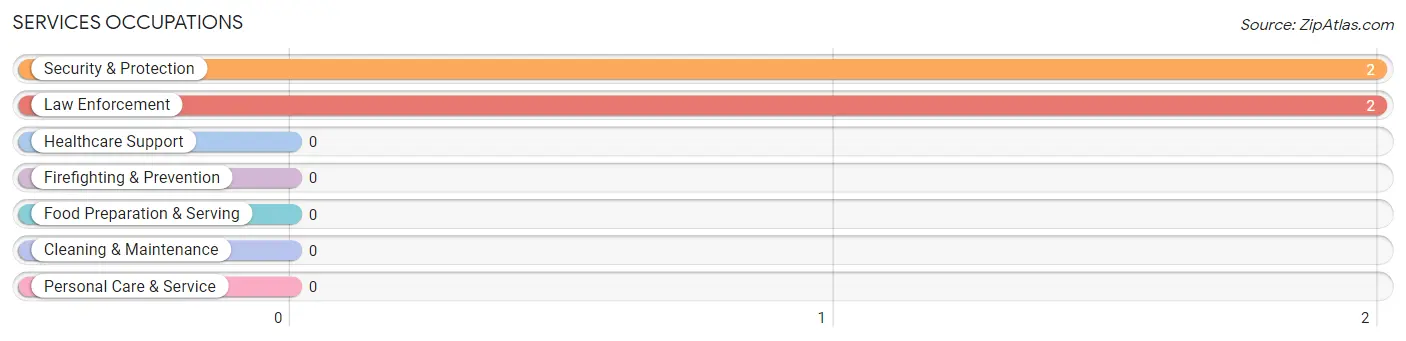
Services Occupations
The most common Services occupations in Munich are Security & Protection (2 | 1.2%), and Law Enforcement (2 | 1.2%).
Services Occupations by Sex
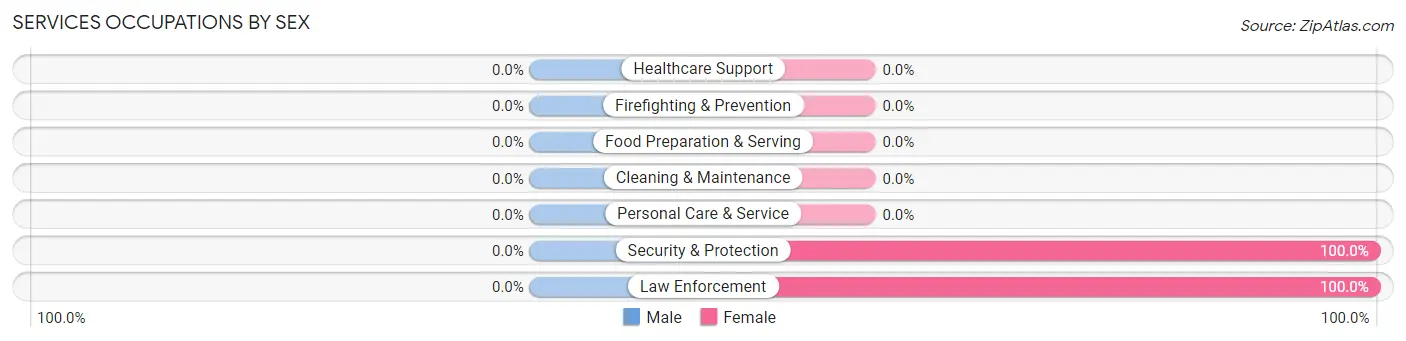
| Occupation | Male | Female |
| Healthcare Support | 0 (0.0%) | 0 (0.0%) |
| Security & Protection | 0 (0.0%) | 2 (100.0%) |
| Firefighting & Prevention | 0 (0.0%) | 0 (0.0%) |
| Law Enforcement | 0 (0.0%) | 2 (100.0%) |
| Food Preparation & Serving | 0 (0.0%) | 0 (0.0%) |
| Cleaning & Maintenance | 0 (0.0%) | 0 (0.0%) |
| Personal Care & Service | 0 (0.0%) | 0 (0.0%) |
| Total (Category) | 0 (0.0%) | 2 (100.0%) |
| Total (Overall) | 123 (71.9%) | 48 (28.1%) |
Sales and Office Occupations
The most common Sales and Office occupations in Munich are Sales & Related (10 | 5.9%), and Office & Administration (8 | 4.7%).
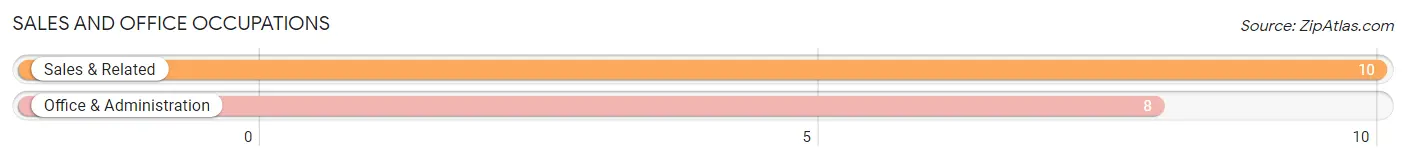
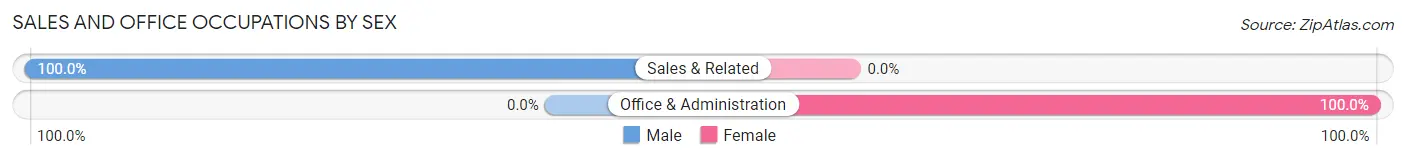
Sales and Office Occupations by Sex
| Occupation | Male | Female |
| Sales & Related | 10 (100.0%) | 0 (0.0%) |
| Office & Administration | 0 (0.0%) | 8 (100.0%) |
| Total (Category) | 10 (55.6%) | 8 (44.4%) |
| Total (Overall) | 123 (71.9%) | 48 (28.1%) |
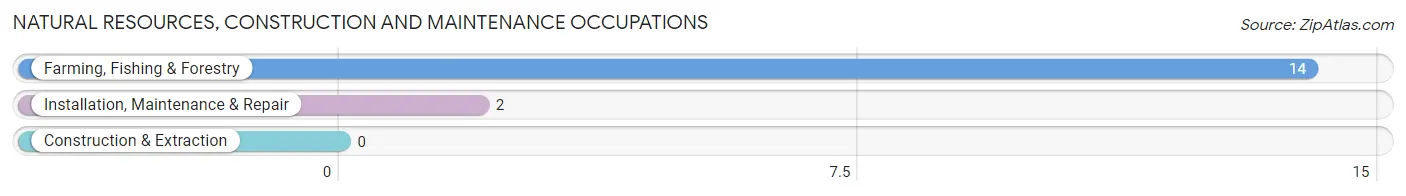
Natural Resources, Construction and Maintenance Occupations
The most common Natural Resources, Construction and Maintenance occupations in Munich are Farming, Fishing & Forestry (14 | 8.2%), and Installation, Maintenance & Repair (2 | 1.2%).
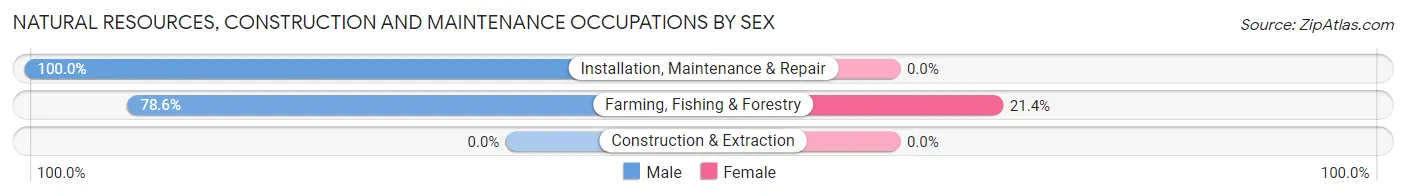
Natural Resources, Construction and Maintenance Occupations by Sex
| Occupation | Male | Female |
| Farming, Fishing & Forestry | 11 (78.6%) | 3 (21.4%) |
| Construction & Extraction | 0 (0.0%) | 0 (0.0%) |
| Installation, Maintenance & Repair | 2 (100.0%) | 0 (0.0%) |
| Total (Category) | 13 (81.2%) | 3 (18.8%) |
| Total (Overall) | 123 (71.9%) | 48 (28.1%) |
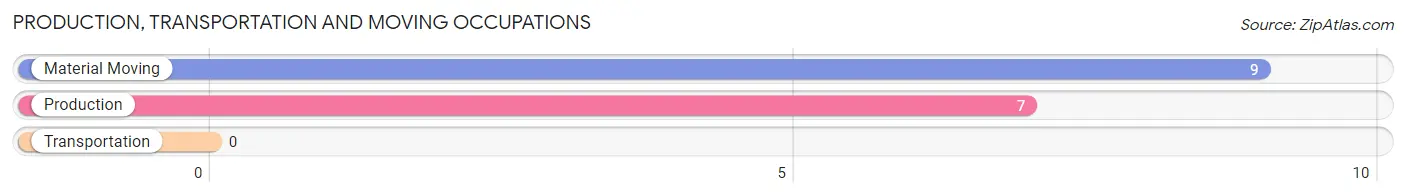
Production, Transportation and Moving Occupations
The most common Production, Transportation and Moving occupations in Munich are Material Moving (9 | 5.3%), and Production (7 | 4.1%).
Production, Transportation and Moving Occupations by Sex
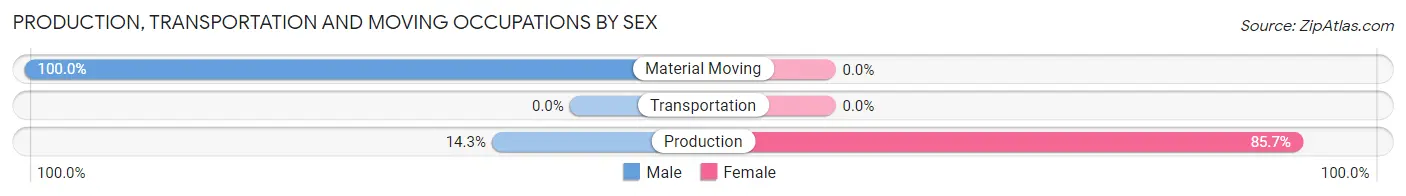
| Occupation | Male | Female |
| Production | 1 (14.3%) | 6 (85.7%) |
| Transportation | 0 (0.0%) | 0 (0.0%) |
| Material Moving | 9 (100.0%) | 0 (0.0%) |
| Total (Category) | 10 (62.5%) | 6 (37.5%) |
| Total (Overall) | 123 (71.9%) | 48 (28.1%) |
Employment Industries by Sex in Munich
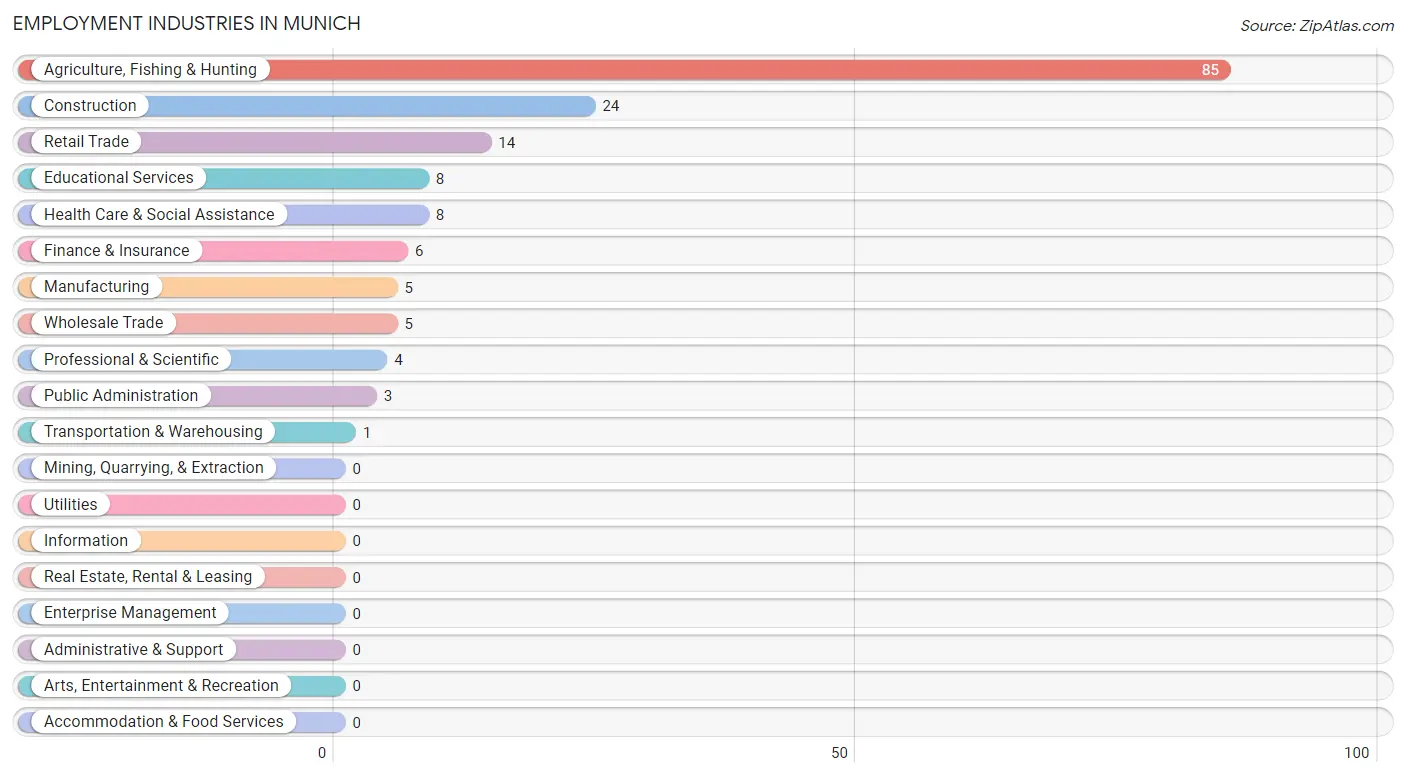
Employment Industries in Munich
The major employment industries in Munich include Agriculture, Fishing & Hunting (85 | 49.7%), Construction (24 | 14.0%), Retail Trade (14 | 8.2%), Educational Services (8 | 4.7%), and Health Care & Social Assistance (8 | 4.7%).
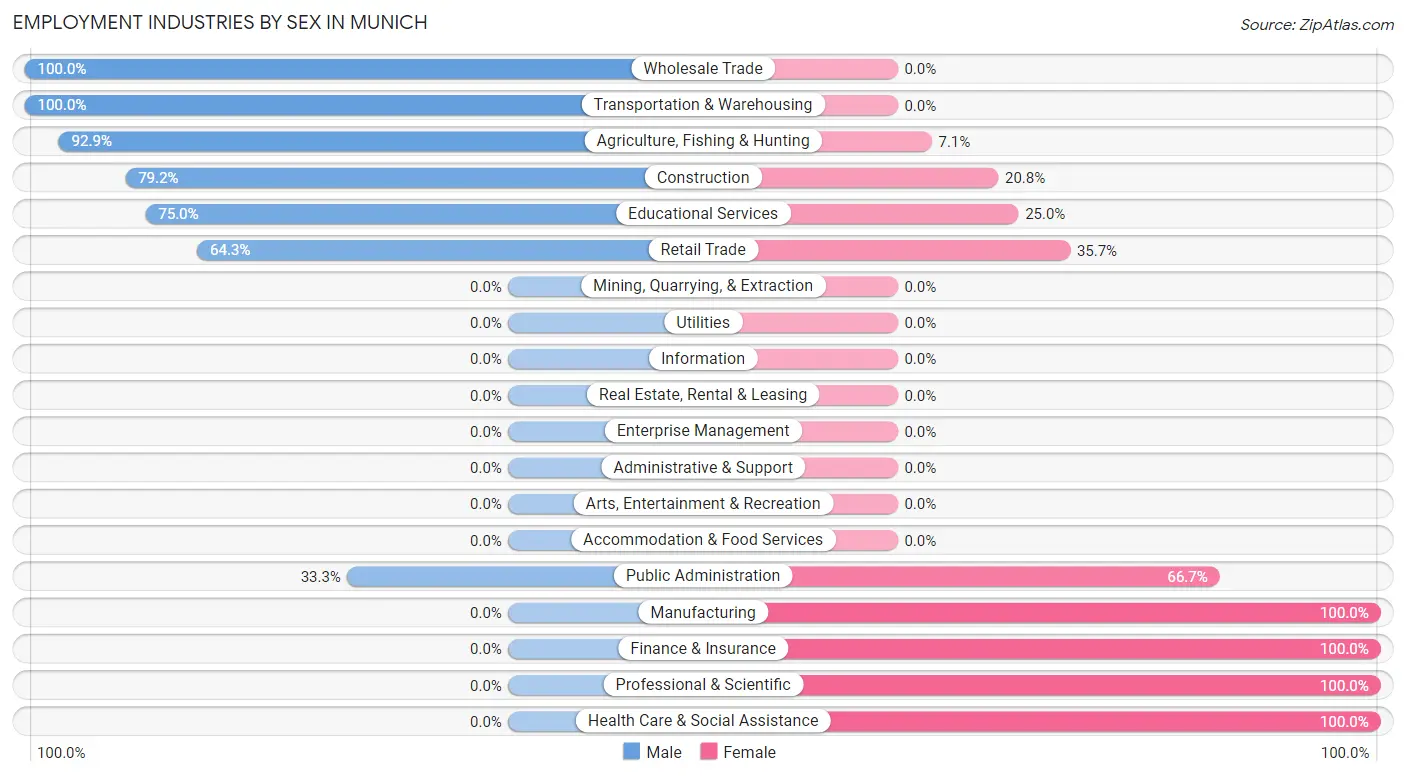
Employment Industries by Sex in Munich
The Munich industries that see more men than women are Wholesale Trade (100.0%), Transportation & Warehousing (100.0%), and Agriculture, Fishing & Hunting (92.9%), whereas the industries that tend to have a higher number of women are Manufacturing (100.0%), Finance & Insurance (100.0%), and Professional & Scientific (100.0%).
| Industry | Male | Female |
| Agriculture, Fishing & Hunting | 79 (92.9%) | 6 (7.1%) |
| Mining, Quarrying, & Extraction | 0 (0.0%) | 0 (0.0%) |
| Construction | 19 (79.2%) | 5 (20.8%) |
| Manufacturing | 0 (0.0%) | 5 (100.0%) |
| Wholesale Trade | 5 (100.0%) | 0 (0.0%) |
| Retail Trade | 9 (64.3%) | 5 (35.7%) |
| Transportation & Warehousing | 1 (100.0%) | 0 (0.0%) |
| Utilities | 0 (0.0%) | 0 (0.0%) |
| Information | 0 (0.0%) | 0 (0.0%) |
| Finance & Insurance | 0 (0.0%) | 6 (100.0%) |
| Real Estate, Rental & Leasing | 0 (0.0%) | 0 (0.0%) |
| Professional & Scientific | 0 (0.0%) | 4 (100.0%) |
| Enterprise Management | 0 (0.0%) | 0 (0.0%) |
| Administrative & Support | 0 (0.0%) | 0 (0.0%) |
| Educational Services | 6 (75.0%) | 2 (25.0%) |
| Health Care & Social Assistance | 0 (0.0%) | 8 (100.0%) |
| Arts, Entertainment & Recreation | 0 (0.0%) | 0 (0.0%) |
| Accommodation & Food Services | 0 (0.0%) | 0 (0.0%) |
| Public Administration | 1 (33.3%) | 2 (66.7%) |
| Total | 123 (71.9%) | 48 (28.1%) |
Education in Munich
School Enrollment in Munich
The most common levels of schooling among the 63 students in Munich are high school (27 | 42.9%), elementary school (17 | 27.0%), and middle school (17 | 27.0%).
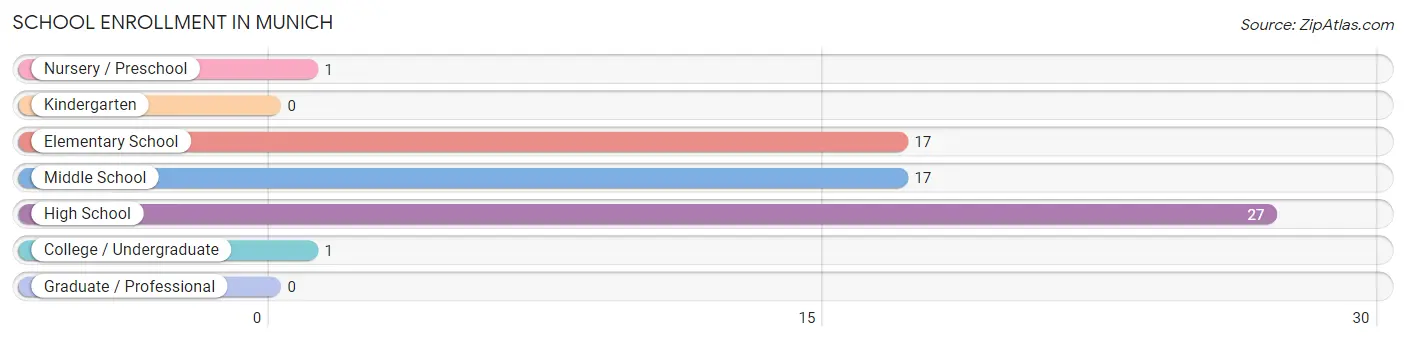
| School Level | # Students | % Students |
| Nursery / Preschool | 1 | 1.6% |
| Kindergarten | 0 | 0.0% |
| Elementary School | 17 | 27.0% |
| Middle School | 17 | 27.0% |
| High School | 27 | 42.9% |
| College / Undergraduate | 1 | 1.6% |
| Graduate / Professional | 0 | 0.0% |
| Total | 63 | 100.0% |
School Enrollment by Age by Funding Source in Munich
Out of a total of 63 students who are enrolled in schools in Munich, 1 (1.6%) attend a private institution, while the remaining 62 (98.4%) are enrolled in public schools. The age group of 5 to 9 year old has the highest likelihood of being enrolled in private schools, with 1 (5.9% in the age bracket) enrolled. Conversely, the age group of 10 to 14 year olds has the lowest likelihood of being enrolled in a private school, with 35 (100.0% in the age bracket) attending a public institution.
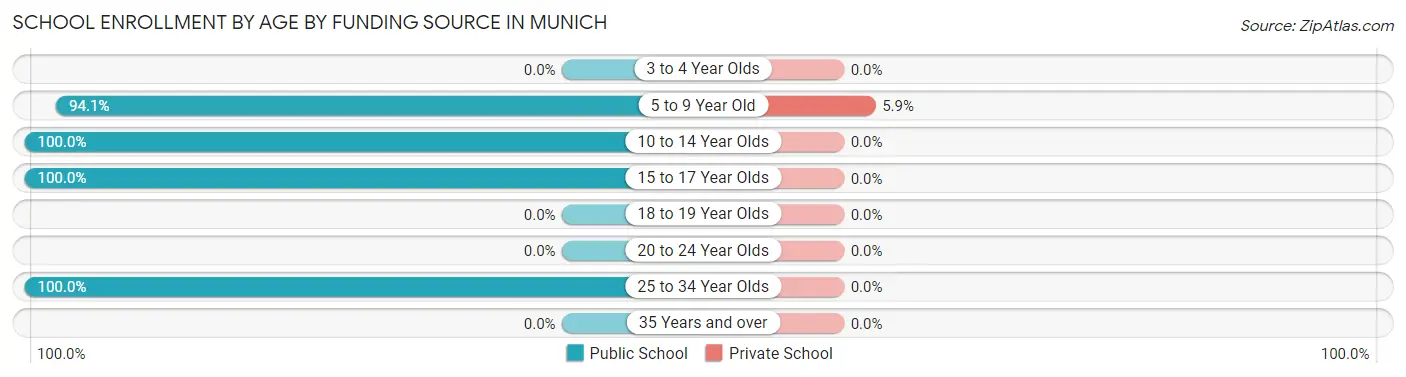
| Age Bracket | Public School | Private School |
| 3 to 4 Year Olds | 0 (0.0%) | 0 (0.0%) |
| 5 to 9 Year Old | 16 (94.1%) | 1 (5.9%) |
| 10 to 14 Year Olds | 35 (100.0%) | 0 (0.0%) |
| 15 to 17 Year Olds | 10 (100.0%) | 0 (0.0%) |
| 18 to 19 Year Olds | 0 (0.0%) | 0 (0.0%) |
| 20 to 24 Year Olds | 0 (0.0%) | 0 (0.0%) |
| 25 to 34 Year Olds | 1 (100.0%) | 0 (0.0%) |
| 35 Years and over | 0 (0.0%) | 0 (0.0%) |
| Total | 62 (98.4%) | 1 (1.6%) |
Educational Attainment by Field of Study in Munich
Business (31 | 43.1%), education (20 | 27.8%), science & technology (9 | 12.5%), communications (5 | 6.9%), and bio, nature & agricultural (4 | 5.6%) are the most common fields of study among 72 individuals in Munich who have obtained a bachelor's degree or higher.
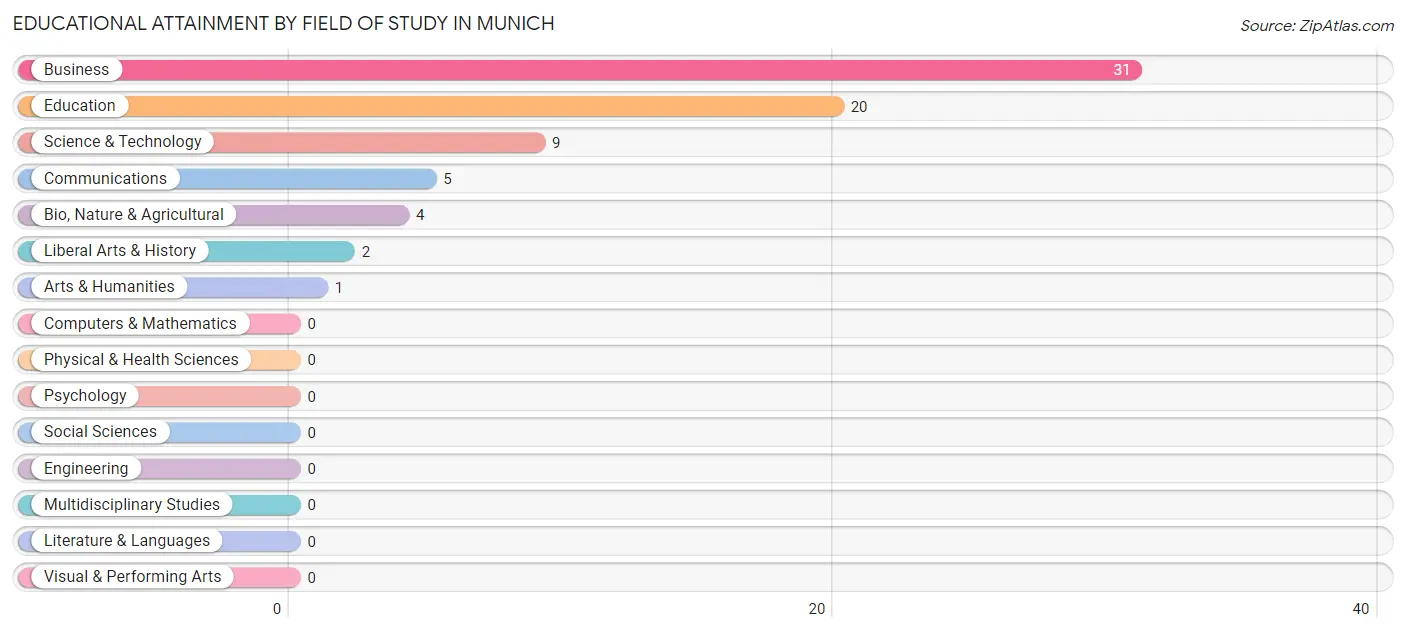
| Field of Study | # Graduates | % Graduates |
| Computers & Mathematics | 0 | 0.0% |
| Bio, Nature & Agricultural | 4 | 5.6% |
| Physical & Health Sciences | 0 | 0.0% |
| Psychology | 0 | 0.0% |
| Social Sciences | 0 | 0.0% |
| Engineering | 0 | 0.0% |
| Multidisciplinary Studies | 0 | 0.0% |
| Science & Technology | 9 | 12.5% |
| Business | 31 | 43.1% |
| Education | 20 | 27.8% |
| Literature & Languages | 0 | 0.0% |
| Liberal Arts & History | 2 | 2.8% |
| Visual & Performing Arts | 0 | 0.0% |
| Communications | 5 | 6.9% |
| Arts & Humanities | 1 | 1.4% |
| Total | 72 | 100.0% |
Transportation & Commute in Munich
Vehicle Availability by Sex in Munich
The most prevalent vehicle ownership categories in Munich are males with 2 vehicles (84, accounting for 68.9%) and females with 2 vehicles (19, making up 175.0%).
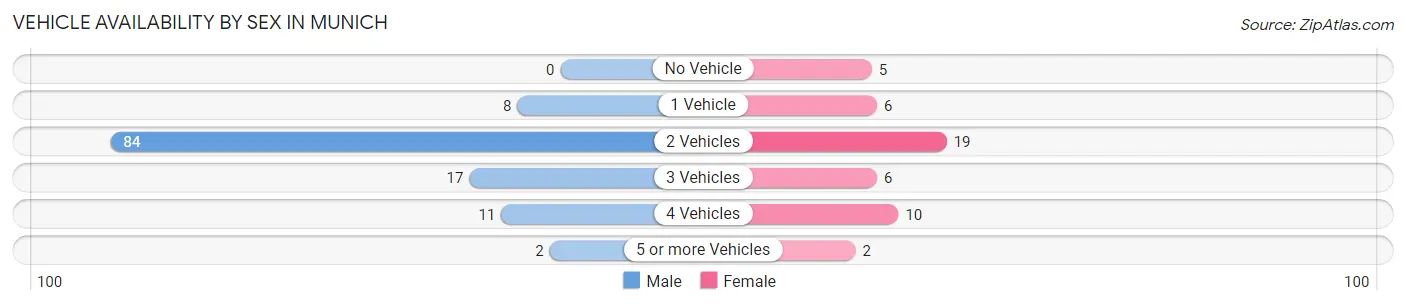
| Vehicles Available | Male | Female |
| No Vehicle | 0 (0.0%) | 5 (10.4%) |
| 1 Vehicle | 8 (6.6%) | 6 (12.5%) |
| 2 Vehicles | 84 (68.9%) | 19 (39.6%) |
| 3 Vehicles | 17 (13.9%) | 6 (12.5%) |
| 4 Vehicles | 11 (9.0%) | 10 (20.8%) |
| 5 or more Vehicles | 2 (1.6%) | 2 (4.2%) |
| Total | 122 (100.0%) | 48 (100.0%) |
Commute Time in Munich
The most frequently occuring commute durations in Munich are 15 to 19 minutes (54 commuters, 32.9%), less than 5 minutes (25 commuters, 15.2%), and 30 to 34 minutes (23 commuters, 14.0%).
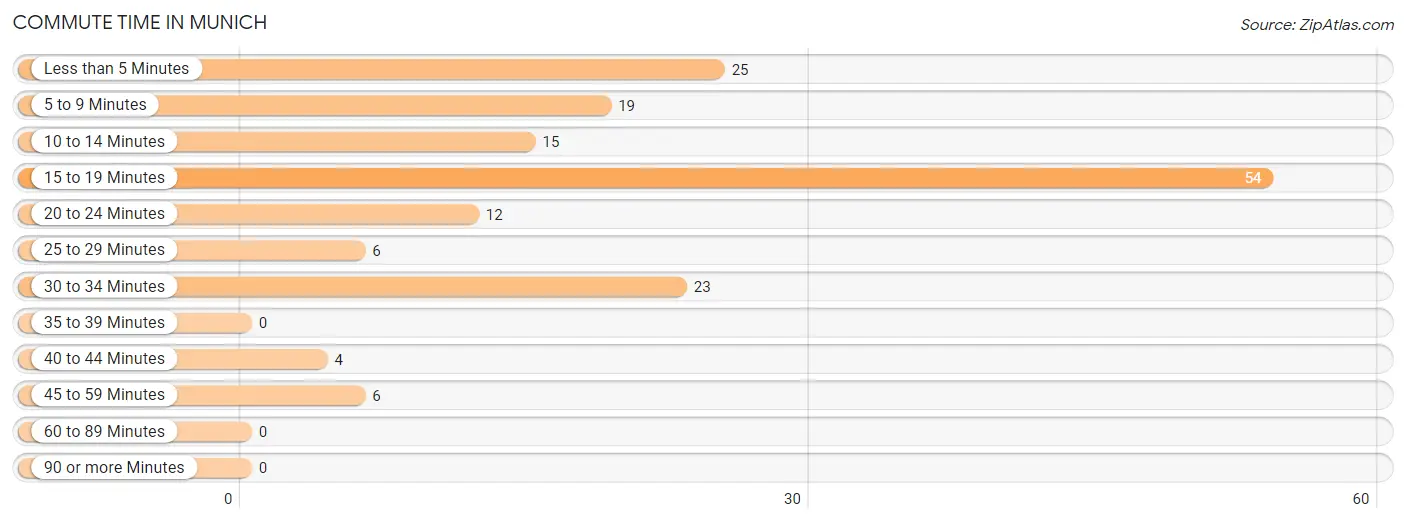
| Commute Time | # Commuters | % Commuters |
| Less than 5 Minutes | 25 | 15.2% |
| 5 to 9 Minutes | 19 | 11.6% |
| 10 to 14 Minutes | 15 | 9.1% |
| 15 to 19 Minutes | 54 | 32.9% |
| 20 to 24 Minutes | 12 | 7.3% |
| 25 to 29 Minutes | 6 | 3.7% |
| 30 to 34 Minutes | 23 | 14.0% |
| 35 to 39 Minutes | 0 | 0.0% |
| 40 to 44 Minutes | 4 | 2.4% |
| 45 to 59 Minutes | 6 | 3.7% |
| 60 to 89 Minutes | 0 | 0.0% |
| 90 or more Minutes | 0 | 0.0% |
Commute Time by Sex in Munich
The most common commute times in Munich are 15 to 19 minutes (50 commuters, 41.7%) for males and 30 to 34 minutes (14 commuters, 31.8%) for females.
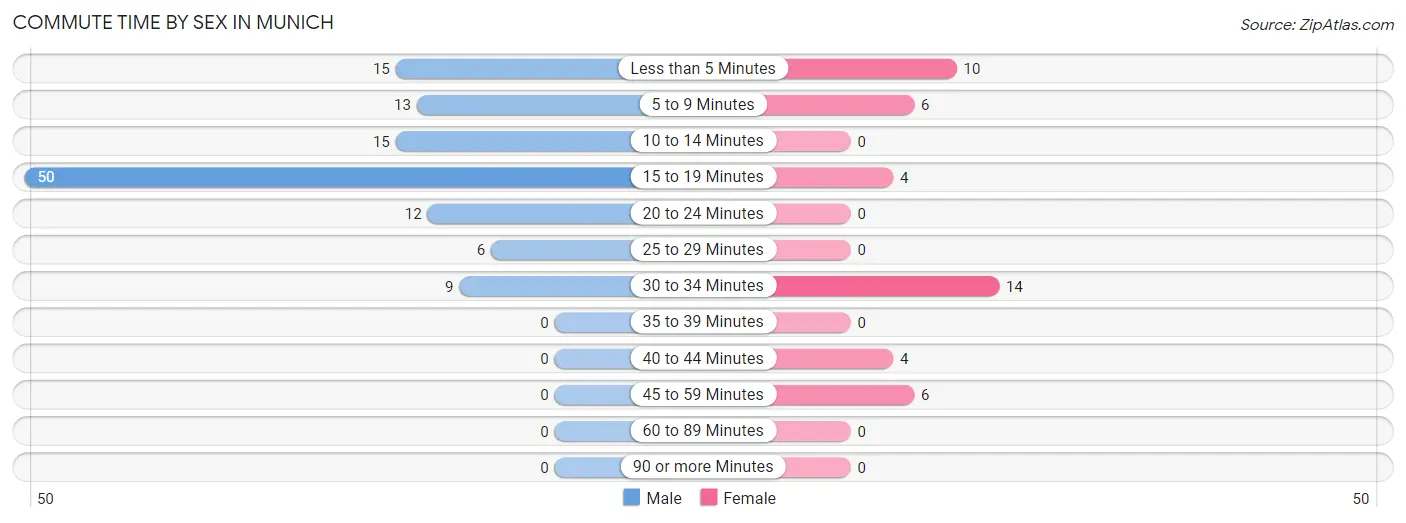
| Commute Time | Male | Female |
| Less than 5 Minutes | 15 (12.5%) | 10 (22.7%) |
| 5 to 9 Minutes | 13 (10.8%) | 6 (13.6%) |
| 10 to 14 Minutes | 15 (12.5%) | 0 (0.0%) |
| 15 to 19 Minutes | 50 (41.7%) | 4 (9.1%) |
| 20 to 24 Minutes | 12 (10.0%) | 0 (0.0%) |
| 25 to 29 Minutes | 6 (5.0%) | 0 (0.0%) |
| 30 to 34 Minutes | 9 (7.5%) | 14 (31.8%) |
| 35 to 39 Minutes | 0 (0.0%) | 0 (0.0%) |
| 40 to 44 Minutes | 0 (0.0%) | 4 (9.1%) |
| 45 to 59 Minutes | 0 (0.0%) | 6 (13.6%) |
| 60 to 89 Minutes | 0 (0.0%) | 0 (0.0%) |
| 90 or more Minutes | 0 (0.0%) | 0 (0.0%) |
Time of Departure to Work by Sex in Munich
The most frequent times of departure to work in Munich are 8:00 AM to 8:29 AM (41, 34.2%) for males and 7:00 AM to 7:29 AM (13, 29.5%) for females.
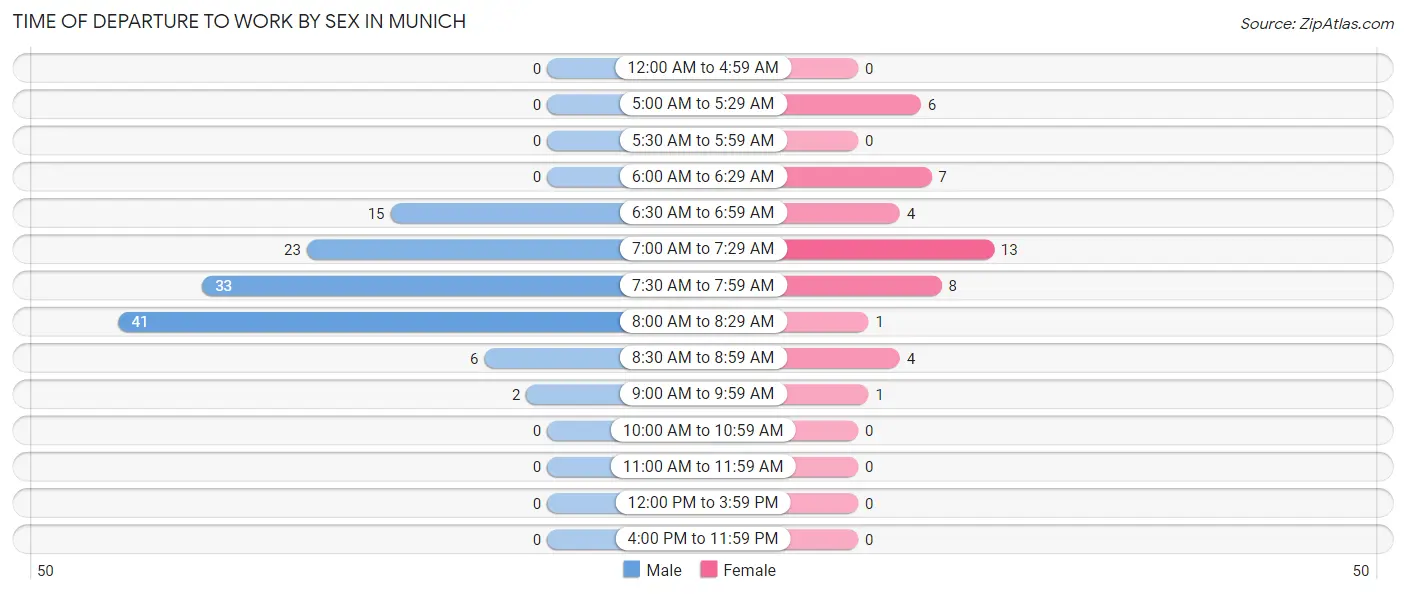
| Time of Departure | Male | Female |
| 12:00 AM to 4:59 AM | 0 (0.0%) | 0 (0.0%) |
| 5:00 AM to 5:29 AM | 0 (0.0%) | 6 (13.6%) |
| 5:30 AM to 5:59 AM | 0 (0.0%) | 0 (0.0%) |
| 6:00 AM to 6:29 AM | 0 (0.0%) | 7 (15.9%) |
| 6:30 AM to 6:59 AM | 15 (12.5%) | 4 (9.1%) |
| 7:00 AM to 7:29 AM | 23 (19.2%) | 13 (29.5%) |
| 7:30 AM to 7:59 AM | 33 (27.5%) | 8 (18.2%) |
| 8:00 AM to 8:29 AM | 41 (34.2%) | 1 (2.3%) |
| 8:30 AM to 8:59 AM | 6 (5.0%) | 4 (9.1%) |
| 9:00 AM to 9:59 AM | 2 (1.7%) | 1 (2.3%) |
| 10:00 AM to 10:59 AM | 0 (0.0%) | 0 (0.0%) |
| 11:00 AM to 11:59 AM | 0 (0.0%) | 0 (0.0%) |
| 12:00 PM to 3:59 PM | 0 (0.0%) | 0 (0.0%) |
| 4:00 PM to 11:59 PM | 0 (0.0%) | 0 (0.0%) |
| Total | 120 (100.0%) | 44 (100.0%) |
Housing Occupancy in Munich
Occupancy by Ownership in Munich
Of the total 123 dwellings in Munich, owner-occupied units account for 103 (83.7%), while renter-occupied units make up 20 (16.3%).
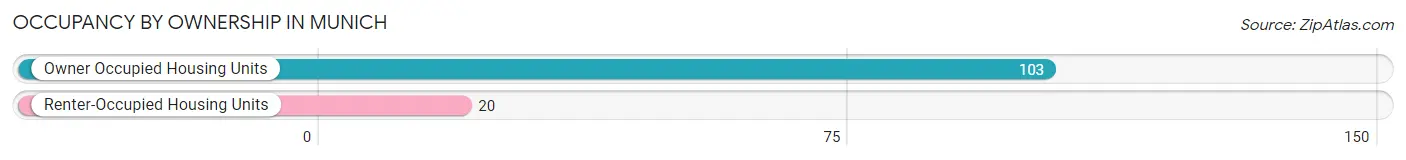
| Occupancy | # Housing Units | % Housing Units |
| Owner Occupied Housing Units | 103 | 83.7% |
| Renter-Occupied Housing Units | 20 | 16.3% |
| Total Occupied Housing Units | 123 | 100.0% |
Occupancy by Household Size in Munich
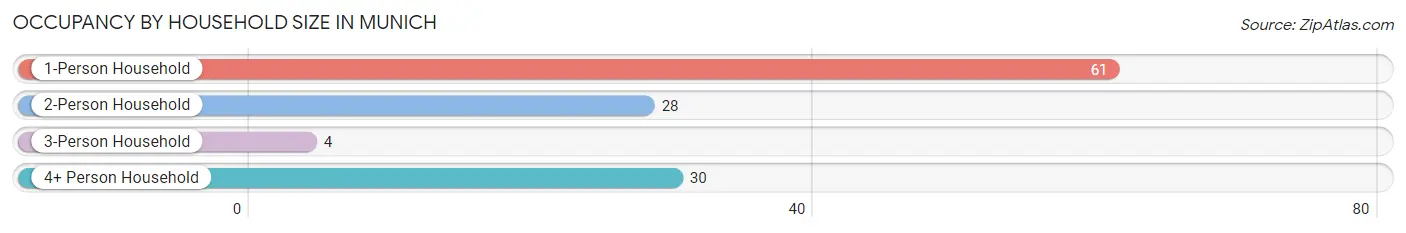
| Household Size | # Housing Units | % Housing Units |
| 1-Person Household | 61 | 49.6% |
| 2-Person Household | 28 | 22.8% |
| 3-Person Household | 4 | 3.3% |
| 4+ Person Household | 30 | 24.4% |
| Total Housing Units | 123 | 100.0% |
Occupancy by Ownership by Household Size in Munich
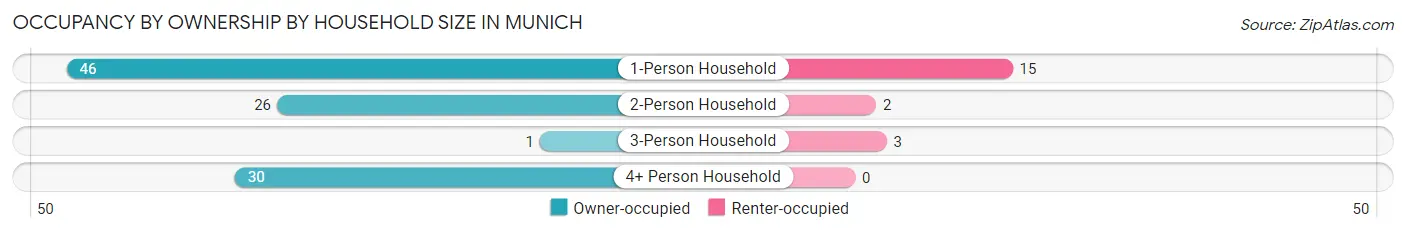
| Household Size | Owner-occupied | Renter-occupied |
| 1-Person Household | 46 (75.4%) | 15 (24.6%) |
| 2-Person Household | 26 (92.9%) | 2 (7.1%) |
| 3-Person Household | 1 (25.0%) | 3 (75.0%) |
| 4+ Person Household | 30 (100.0%) | 0 (0.0%) |
| Total Housing Units | 103 (83.7%) | 20 (16.3%) |
Occupancy by Educational Attainment in Munich
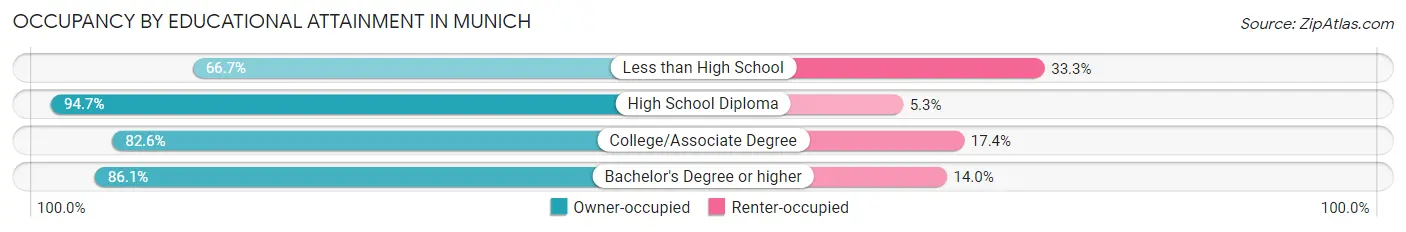
| Household Size | Owner-occupied | Renter-occupied |
| Less than High School | 10 (66.7%) | 5 (33.3%) |
| High School Diploma | 18 (94.7%) | 1 (5.3%) |
| College/Associate Degree | 38 (82.6%) | 8 (17.4%) |
| Bachelor's Degree or higher | 37 (86.1%) | 6 (14.0%) |
Occupancy by Age of Householder in Munich
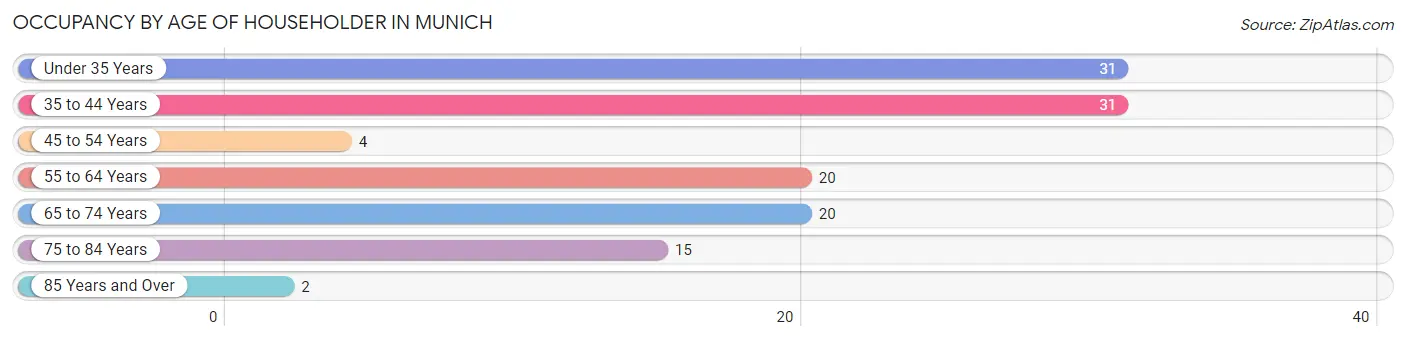
| Age Bracket | # Households | % Households |
| Under 35 Years | 31 | 25.2% |
| 35 to 44 Years | 31 | 25.2% |
| 45 to 54 Years | 4 | 3.3% |
| 55 to 64 Years | 20 | 16.3% |
| 65 to 74 Years | 20 | 16.3% |
| 75 to 84 Years | 15 | 12.2% |
| 85 Years and Over | 2 | 1.6% |
| Total | 123 | 100.0% |
Housing Finances in Munich
Median Income by Occupancy in Munich
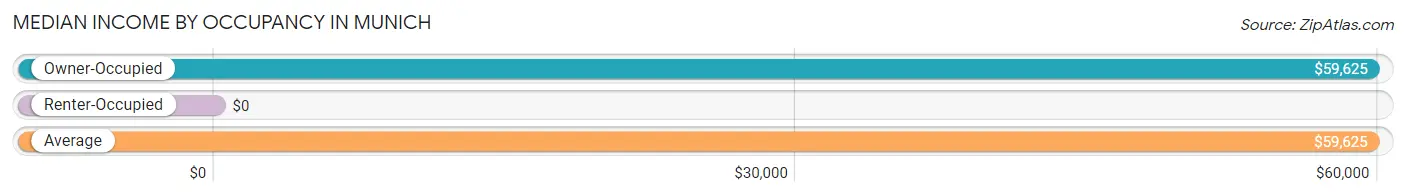
| Occupancy Type | # Households | Median Income |
| Owner-Occupied | 103 (83.7%) | $59,625 |
| Renter-Occupied | 20 (16.3%) | $0 |
| Average | 123 (100.0%) | $59,625 |
Occupancy by Householder Income Bracket in Munich
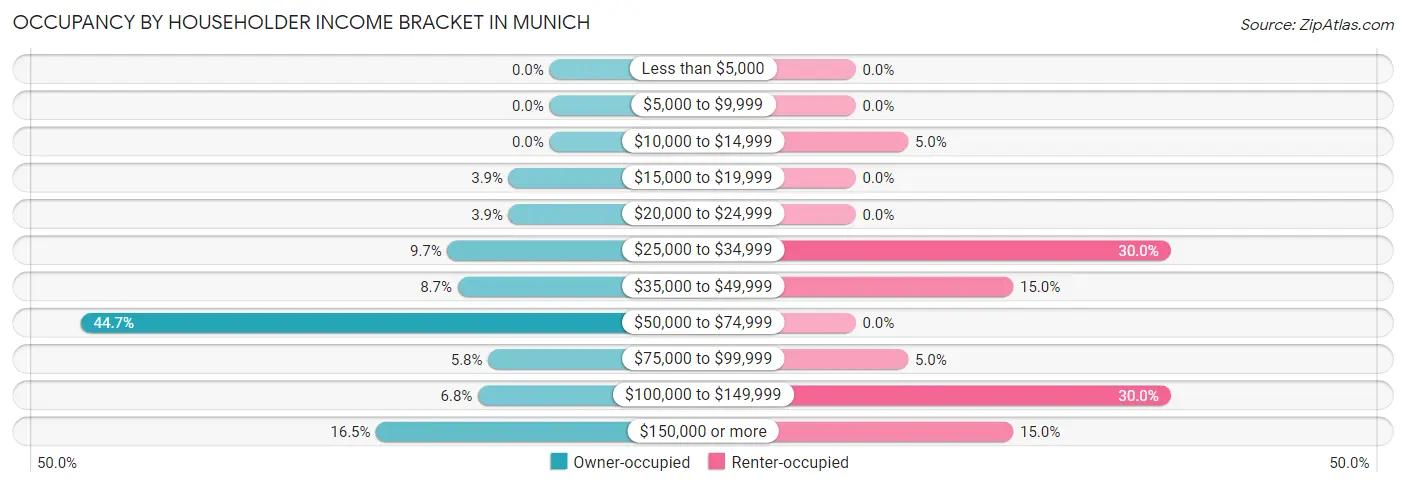
| Income Bracket | Owner-occupied | Renter-occupied |
| Less than $5,000 | 0 (0.0%) | 0 (0.0%) |
| $5,000 to $9,999 | 0 (0.0%) | 0 (0.0%) |
| $10,000 to $14,999 | 0 (0.0%) | 1 (5.0%) |
| $15,000 to $19,999 | 4 (3.9%) | 0 (0.0%) |
| $20,000 to $24,999 | 4 (3.9%) | 0 (0.0%) |
| $25,000 to $34,999 | 10 (9.7%) | 6 (30.0%) |
| $35,000 to $49,999 | 9 (8.7%) | 3 (15.0%) |
| $50,000 to $74,999 | 46 (44.7%) | 0 (0.0%) |
| $75,000 to $99,999 | 6 (5.8%) | 1 (5.0%) |
| $100,000 to $149,999 | 7 (6.8%) | 6 (30.0%) |
| $150,000 or more | 17 (16.5%) | 3 (15.0%) |
| Total | 103 (100.0%) | 20 (100.0%) |
Monthly Housing Cost Tiers in Munich
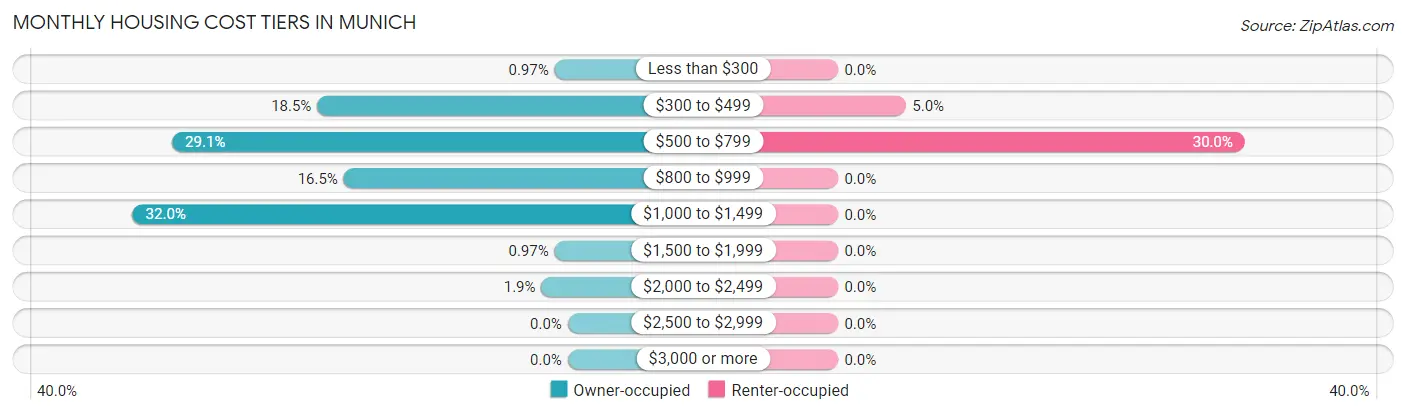
| Monthly Cost | Owner-occupied | Renter-occupied |
| Less than $300 | 1 (1.0%) | 0 (0.0%) |
| $300 to $499 | 19 (18.4%) | 1 (5.0%) |
| $500 to $799 | 30 (29.1%) | 6 (30.0%) |
| $800 to $999 | 17 (16.5%) | 0 (0.0%) |
| $1,000 to $1,499 | 33 (32.0%) | 0 (0.0%) |
| $1,500 to $1,999 | 1 (1.0%) | 0 (0.0%) |
| $2,000 to $2,499 | 2 (1.9%) | 0 (0.0%) |
| $2,500 to $2,999 | 0 (0.0%) | 0 (0.0%) |
| $3,000 or more | 0 (0.0%) | 0 (0.0%) |
| Total | 103 (100.0%) | 20 (100.0%) |
Physical Housing Characteristics in Munich
Housing Structures in Munich
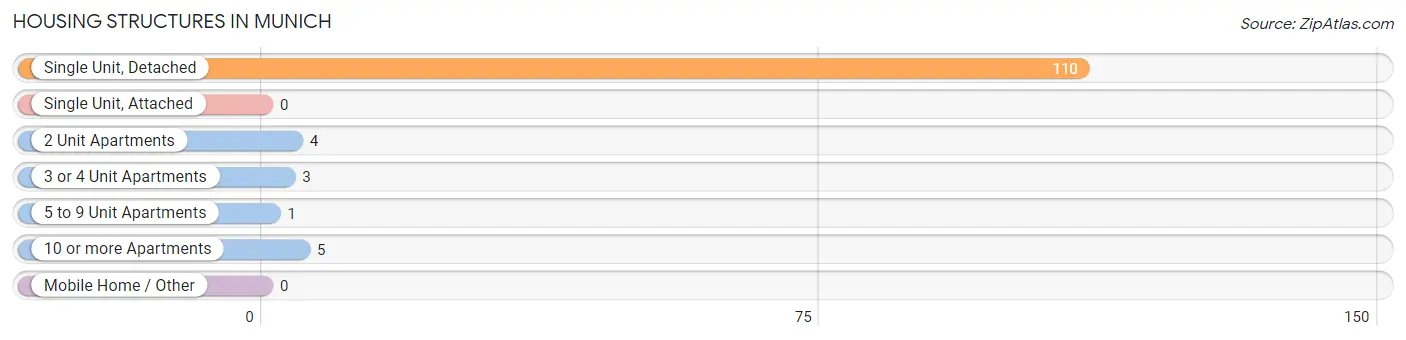
| Structure Type | # Housing Units | % Housing Units |
| Single Unit, Detached | 110 | 89.4% |
| Single Unit, Attached | 0 | 0.0% |
| 2 Unit Apartments | 4 | 3.3% |
| 3 or 4 Unit Apartments | 3 | 2.4% |
| 5 to 9 Unit Apartments | 1 | 0.8% |
| 10 or more Apartments | 5 | 4.1% |
| Mobile Home / Other | 0 | 0.0% |
| Total | 123 | 100.0% |
Housing Structures by Occupancy in Munich
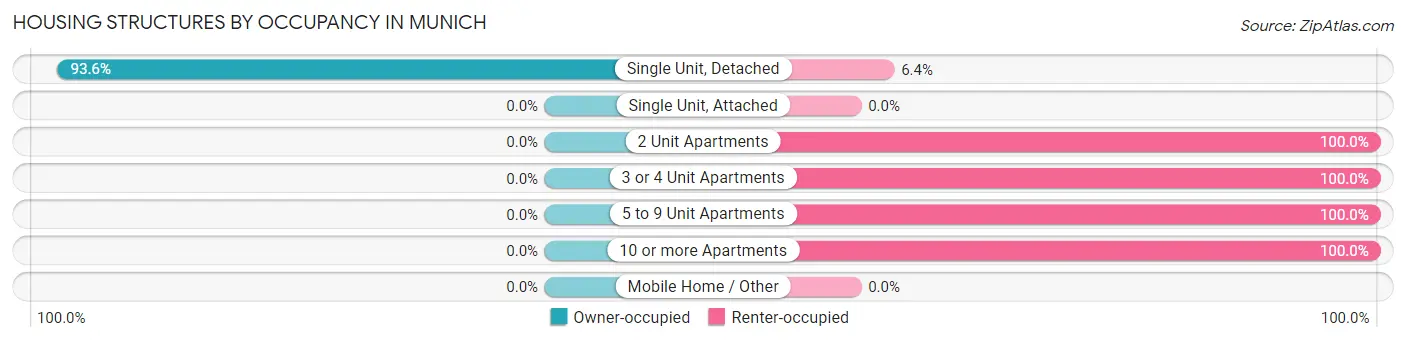
| Structure Type | Owner-occupied | Renter-occupied |
| Single Unit, Detached | 103 (93.6%) | 7 (6.4%) |
| Single Unit, Attached | 0 (0.0%) | 0 (0.0%) |
| 2 Unit Apartments | 0 (0.0%) | 4 (100.0%) |
| 3 or 4 Unit Apartments | 0 (0.0%) | 3 (100.0%) |
| 5 to 9 Unit Apartments | 0 (0.0%) | 1 (100.0%) |
| 10 or more Apartments | 0 (0.0%) | 5 (100.0%) |
| Mobile Home / Other | 0 (0.0%) | 0 (0.0%) |
| Total | 103 (83.7%) | 20 (16.3%) |
Housing Structures by Number of Rooms in Munich
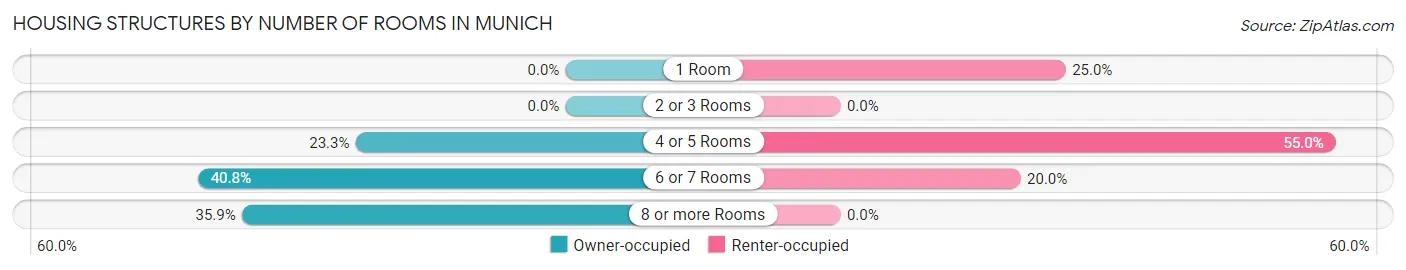
| Number of Rooms | Owner-occupied | Renter-occupied |
| 1 Room | 0 (0.0%) | 5 (25.0%) |
| 2 or 3 Rooms | 0 (0.0%) | 0 (0.0%) |
| 4 or 5 Rooms | 24 (23.3%) | 11 (55.0%) |
| 6 or 7 Rooms | 42 (40.8%) | 4 (20.0%) |
| 8 or more Rooms | 37 (35.9%) | 0 (0.0%) |
| Total | 103 (100.0%) | 20 (100.0%) |
Housing Structure by Heating Type in Munich
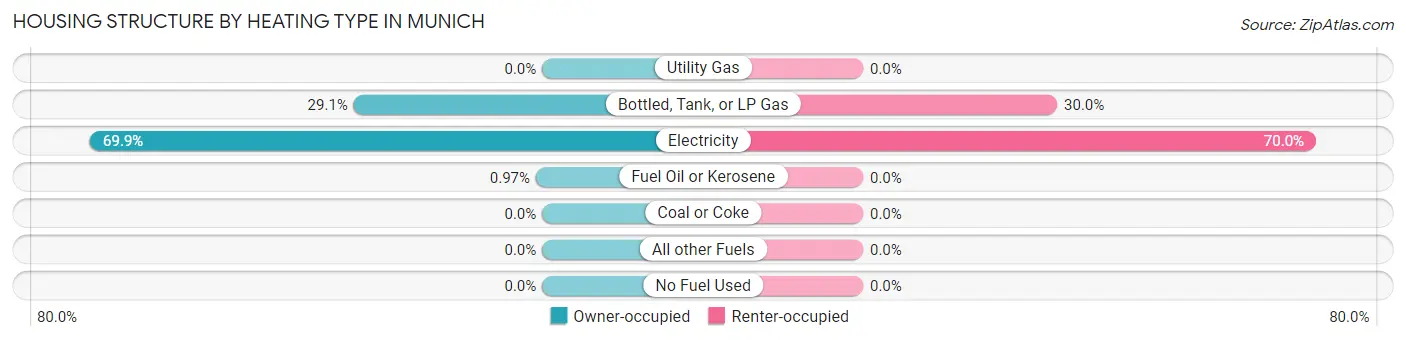
| Heating Type | Owner-occupied | Renter-occupied |
| Utility Gas | 0 (0.0%) | 0 (0.0%) |
| Bottled, Tank, or LP Gas | 30 (29.1%) | 6 (30.0%) |
| Electricity | 72 (69.9%) | 14 (70.0%) |
| Fuel Oil or Kerosene | 1 (1.0%) | 0 (0.0%) |
| Coal or Coke | 0 (0.0%) | 0 (0.0%) |
| All other Fuels | 0 (0.0%) | 0 (0.0%) |
| No Fuel Used | 0 (0.0%) | 0 (0.0%) |
| Total | 103 (100.0%) | 20 (100.0%) |
Household Vehicle Usage in Munich
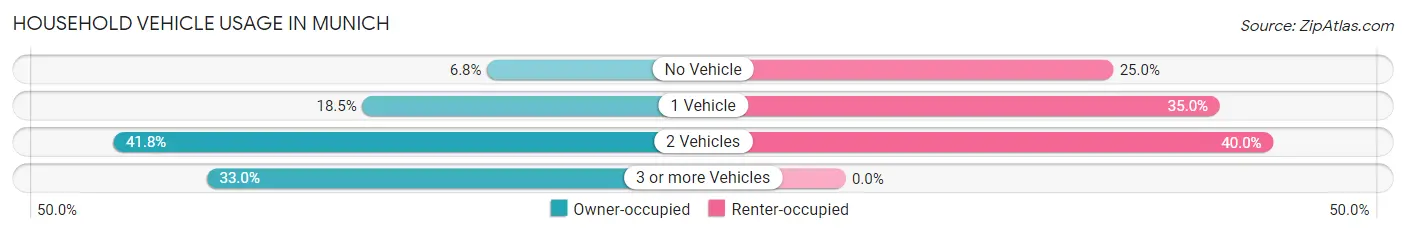
| Vehicles per Household | Owner-occupied | Renter-occupied |
| No Vehicle | 7 (6.8%) | 5 (25.0%) |
| 1 Vehicle | 19 (18.4%) | 7 (35.0%) |
| 2 Vehicles | 43 (41.7%) | 8 (40.0%) |
| 3 or more Vehicles | 34 (33.0%) | 0 (0.0%) |
| Total | 103 (100.0%) | 20 (100.0%) |
Real Estate & Mortgages in Munich
Real Estate and Mortgage Overview in Munich
| Characteristic | Without Mortgage | With Mortgage |
| Housing Units | 62 | 41 |
| Median Property Value | $107,500 | $108,600 |
| Median Household Income | $54,444 | $0 |
| Monthly Housing Costs | $633 | $0 |
| Real Estate Taxes | $1,300 | $1 |
Property Value by Mortgage Status in Munich
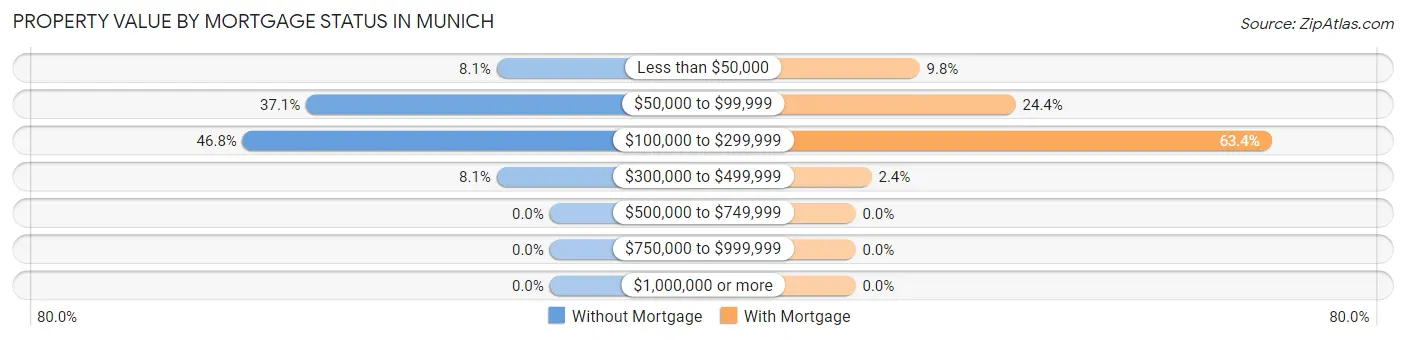
| Property Value | Without Mortgage | With Mortgage |
| Less than $50,000 | 5 (8.1%) | 4 (9.8%) |
| $50,000 to $99,999 | 23 (37.1%) | 10 (24.4%) |
| $100,000 to $299,999 | 29 (46.8%) | 26 (63.4%) |
| $300,000 to $499,999 | 5 (8.1%) | 1 (2.4%) |
| $500,000 to $749,999 | 0 (0.0%) | 0 (0.0%) |
| $750,000 to $999,999 | 0 (0.0%) | 0 (0.0%) |
| $1,000,000 or more | 0 (0.0%) | 0 (0.0%) |
| Total | 62 (100.0%) | 41 (100.0%) |
Household Income by Mortgage Status in Munich
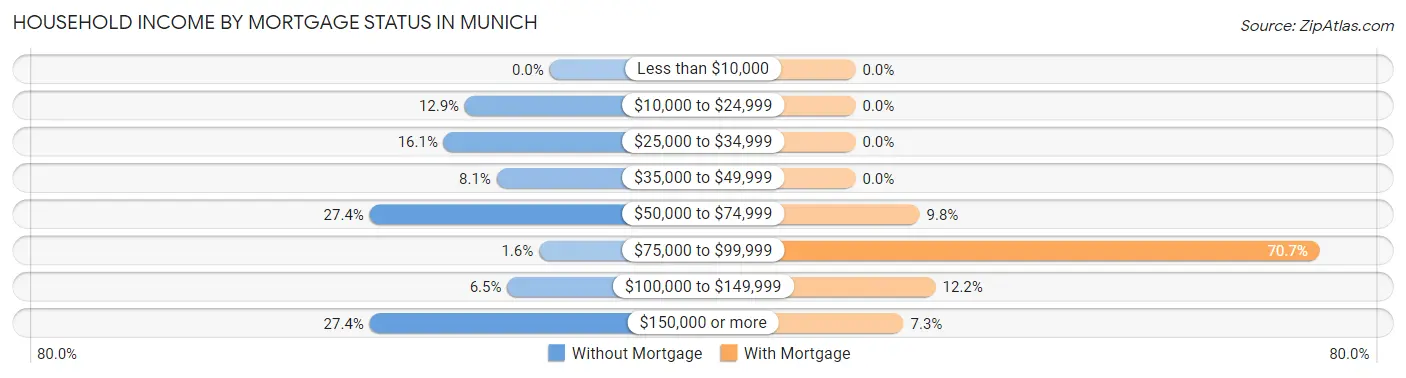
| Household Income | Without Mortgage | With Mortgage |
| Less than $10,000 | 0 (0.0%) | 0 (0.0%) |
| $10,000 to $24,999 | 8 (12.9%) | 0 (0.0%) |
| $25,000 to $34,999 | 10 (16.1%) | 0 (0.0%) |
| $35,000 to $49,999 | 5 (8.1%) | 0 (0.0%) |
| $50,000 to $74,999 | 17 (27.4%) | 4 (9.8%) |
| $75,000 to $99,999 | 1 (1.6%) | 29 (70.7%) |
| $100,000 to $149,999 | 4 (6.5%) | 5 (12.2%) |
| $150,000 or more | 17 (27.4%) | 3 (7.3%) |
| Total | 62 (100.0%) | 41 (100.0%) |
Property Value to Household Income Ratio in Munich
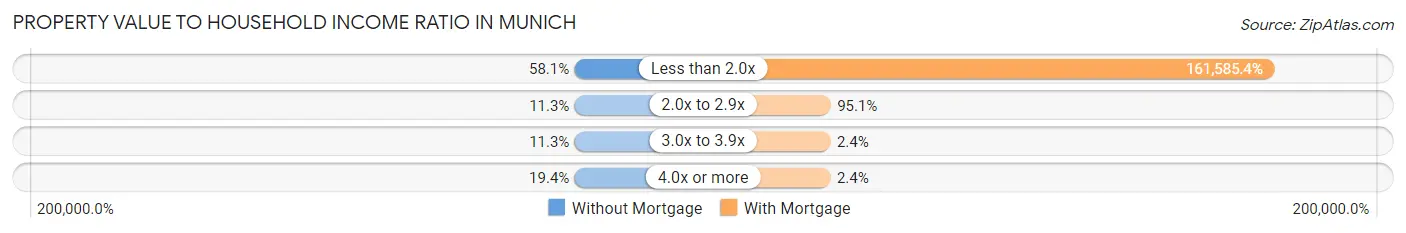
| Value-to-Income Ratio | Without Mortgage | With Mortgage |
| Less than 2.0x | 36 (58.1%) | 66,250 (161,585.4%) |
| 2.0x to 2.9x | 7 (11.3%) | 39 (95.1%) |
| 3.0x to 3.9x | 7 (11.3%) | 1 (2.4%) |
| 4.0x or more | 12 (19.4%) | 1 (2.4%) |
| Total | 62 (100.0%) | 41 (100.0%) |
Real Estate Taxes by Mortgage Status in Munich
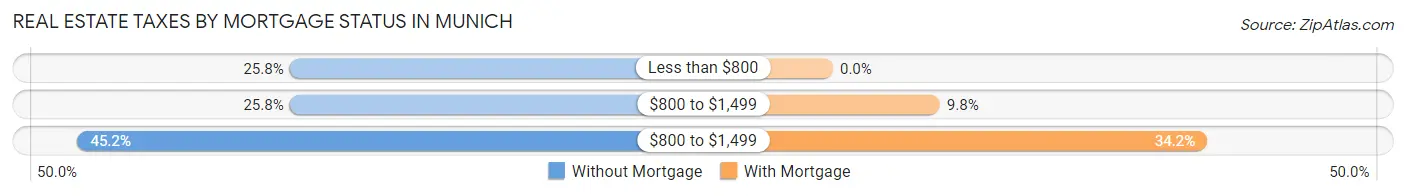
| Property Taxes | Without Mortgage | With Mortgage |
| Less than $800 | 16 (25.8%) | 0 (0.0%) |
| $800 to $1,499 | 16 (25.8%) | 4 (9.8%) |
| $800 to $1,499 | 28 (45.2%) | 14 (34.2%) |
| Total | 62 (100.0%) | 41 (100.0%) |
Health & Disability in Munich
Health Insurance Coverage by Age in Munich
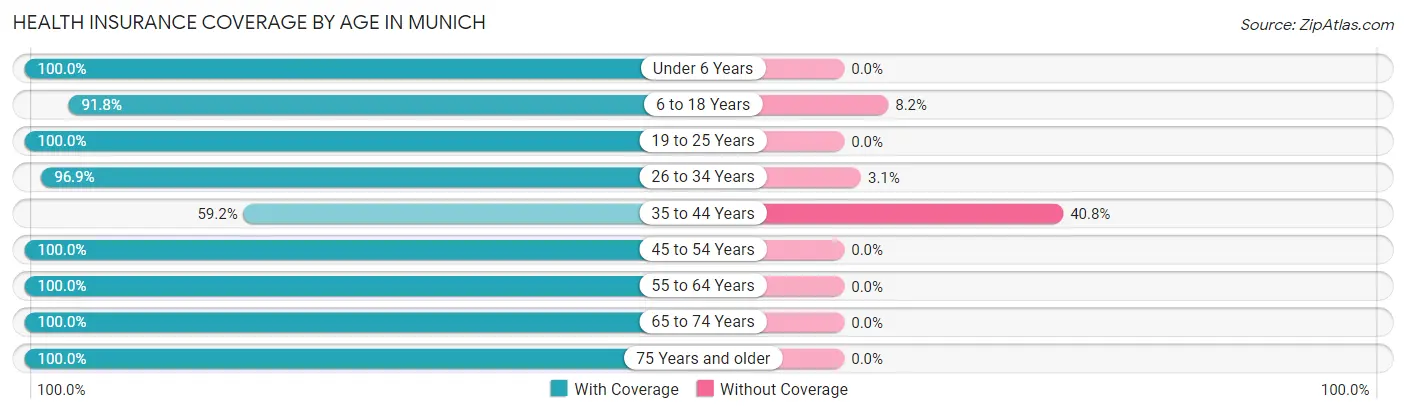
| Age Bracket | With Coverage | Without Coverage |
| Under 6 Years | 35 (100.0%) | 0 (0.0%) |
| 6 to 18 Years | 56 (91.8%) | 5 (8.2%) |
| 19 to 25 Years | 14 (100.0%) | 0 (0.0%) |
| 26 to 34 Years | 62 (96.9%) | 2 (3.1%) |
| 35 to 44 Years | 29 (59.2%) | 20 (40.8%) |
| 45 to 54 Years | 10 (100.0%) | 0 (0.0%) |
| 55 to 64 Years | 58 (100.0%) | 0 (0.0%) |
| 65 to 74 Years | 27 (100.0%) | 0 (0.0%) |
| 75 Years and older | 19 (100.0%) | 0 (0.0%) |
| Total | 310 (92.0%) | 27 (8.0%) |
Health Insurance Coverage by Citizenship Status in Munich
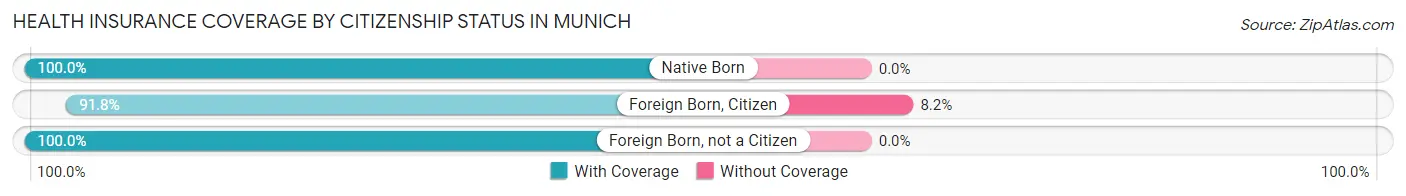
| Citizenship Status | With Coverage | Without Coverage |
| Native Born | 35 (100.0%) | 0 (0.0%) |
| Foreign Born, Citizen | 56 (91.8%) | 5 (8.2%) |
| Foreign Born, not a Citizen | 14 (100.0%) | 0 (0.0%) |
Health Insurance Coverage by Household Income in Munich
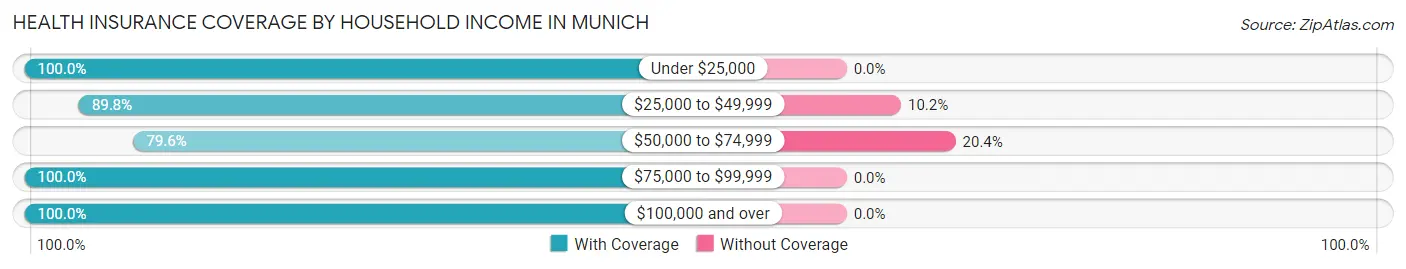
| Household Income | With Coverage | Without Coverage |
| Under $25,000 | 10 (100.0%) | 0 (0.0%) |
| $25,000 to $49,999 | 53 (89.8%) | 6 (10.2%) |
| $50,000 to $74,999 | 82 (79.6%) | 21 (20.4%) |
| $75,000 to $99,999 | 45 (100.0%) | 0 (0.0%) |
| $100,000 and over | 120 (100.0%) | 0 (0.0%) |
Public vs Private Health Insurance Coverage by Age in Munich
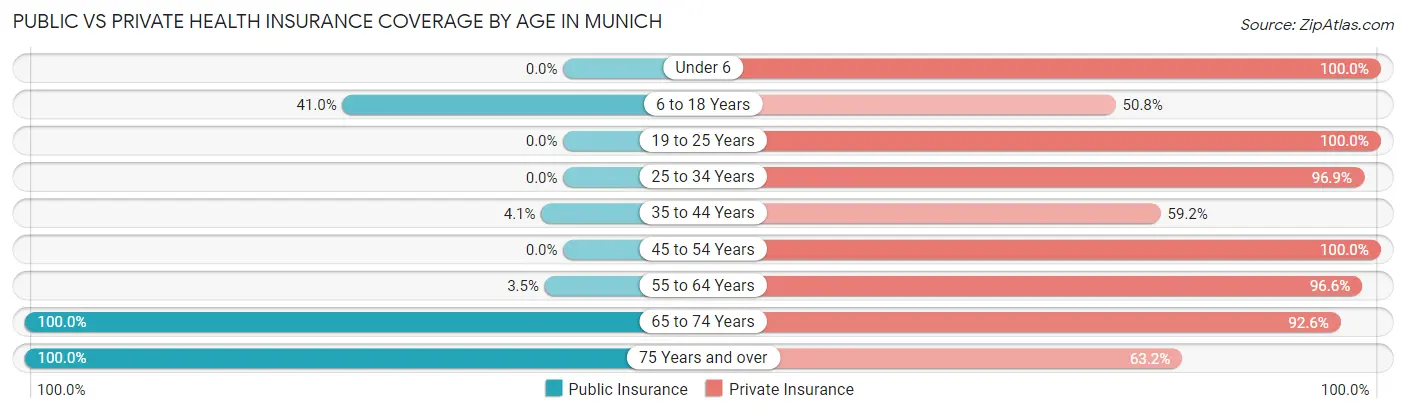
| Age Bracket | Public Insurance | Private Insurance |
| Under 6 | 0 (0.0%) | 35 (100.0%) |
| 6 to 18 Years | 25 (41.0%) | 31 (50.8%) |
| 19 to 25 Years | 0 (0.0%) | 14 (100.0%) |
| 25 to 34 Years | 0 (0.0%) | 62 (96.9%) |
| 35 to 44 Years | 2 (4.1%) | 29 (59.2%) |
| 45 to 54 Years | 0 (0.0%) | 10 (100.0%) |
| 55 to 64 Years | 2 (3.5%) | 56 (96.6%) |
| 65 to 74 Years | 27 (100.0%) | 25 (92.6%) |
| 75 Years and over | 19 (100.0%) | 12 (63.2%) |
| Total | 75 (22.3%) | 274 (81.3%) |
Disability Status by Sex by Age in Munich
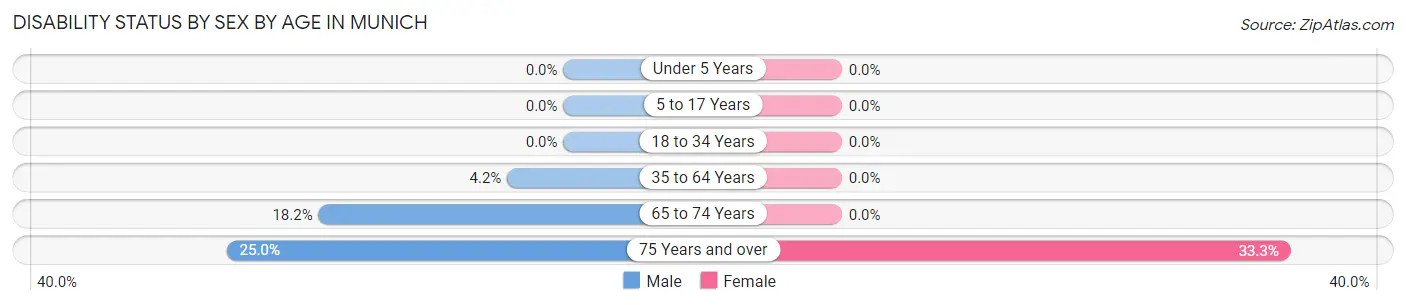
| Age Bracket | Male | Female |
| Under 5 Years | 0 (0.0%) | 0 (0.0%) |
| 5 to 17 Years | 0 (0.0%) | 0 (0.0%) |
| 18 to 34 Years | 0 (0.0%) | 0 (0.0%) |
| 35 to 64 Years | 2 (4.2%) | 0 (0.0%) |
| 65 to 74 Years | 2 (18.2%) | 0 (0.0%) |
| 75 Years and over | 1 (25.0%) | 5 (33.3%) |
Disability Class by Sex by Age in Munich
Disability Class: Hearing Difficulty
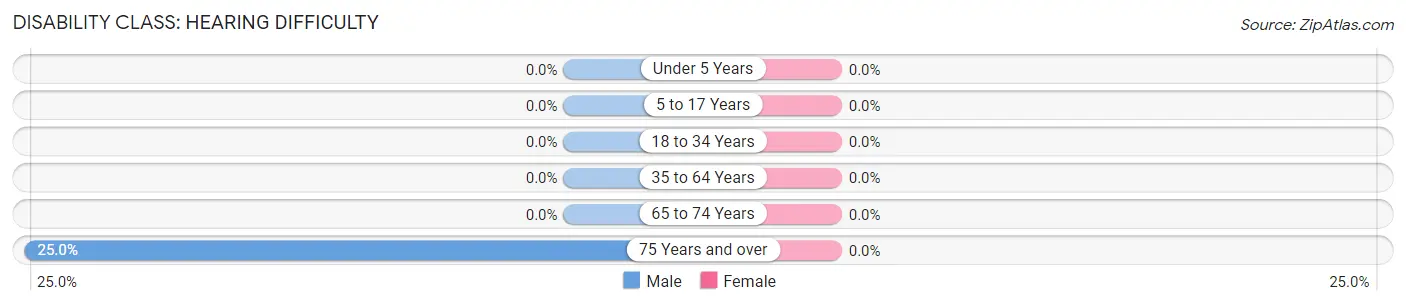
| Age Bracket | Male | Female |
| Under 5 Years | 0 (0.0%) | 0 (0.0%) |
| 5 to 17 Years | 0 (0.0%) | 0 (0.0%) |
| 18 to 34 Years | 0 (0.0%) | 0 (0.0%) |
| 35 to 64 Years | 0 (0.0%) | 0 (0.0%) |
| 65 to 74 Years | 0 (0.0%) | 0 (0.0%) |
| 75 Years and over | 1 (25.0%) | 0 (0.0%) |
Disability Class: Vision Difficulty
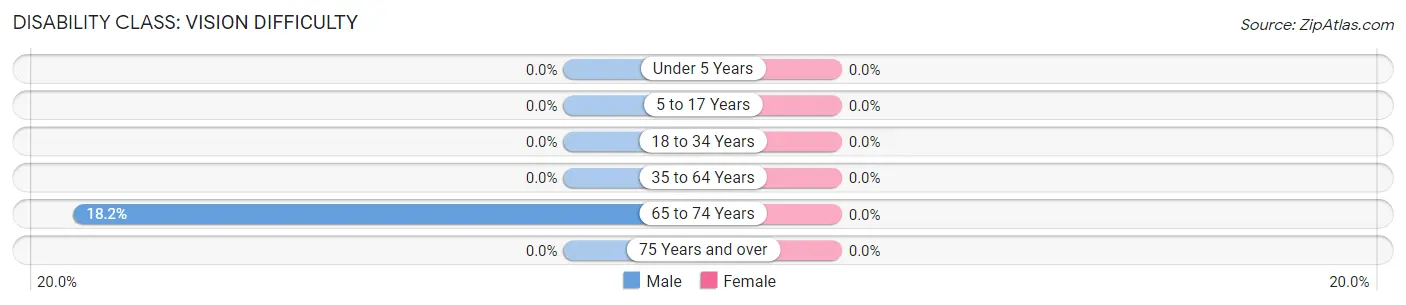
| Age Bracket | Male | Female |
| Under 5 Years | 0 (0.0%) | 0 (0.0%) |
| 5 to 17 Years | 0 (0.0%) | 0 (0.0%) |
| 18 to 34 Years | 0 (0.0%) | 0 (0.0%) |
| 35 to 64 Years | 0 (0.0%) | 0 (0.0%) |
| 65 to 74 Years | 2 (18.2%) | 0 (0.0%) |
| 75 Years and over | 0 (0.0%) | 0 (0.0%) |
Disability Class: Cognitive Difficulty
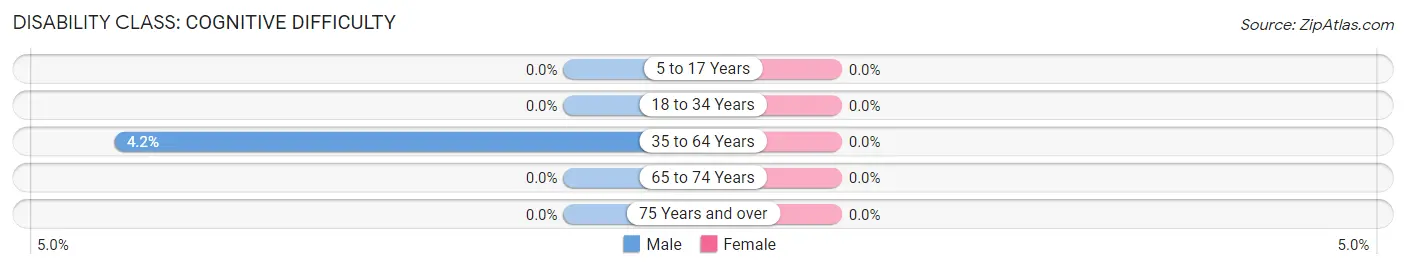
| Age Bracket | Male | Female |
| 5 to 17 Years | 0 (0.0%) | 0 (0.0%) |
| 18 to 34 Years | 0 (0.0%) | 0 (0.0%) |
| 35 to 64 Years | 2 (4.2%) | 0 (0.0%) |
| 65 to 74 Years | 0 (0.0%) | 0 (0.0%) |
| 75 Years and over | 0 (0.0%) | 0 (0.0%) |
Disability Class: Ambulatory Difficulty
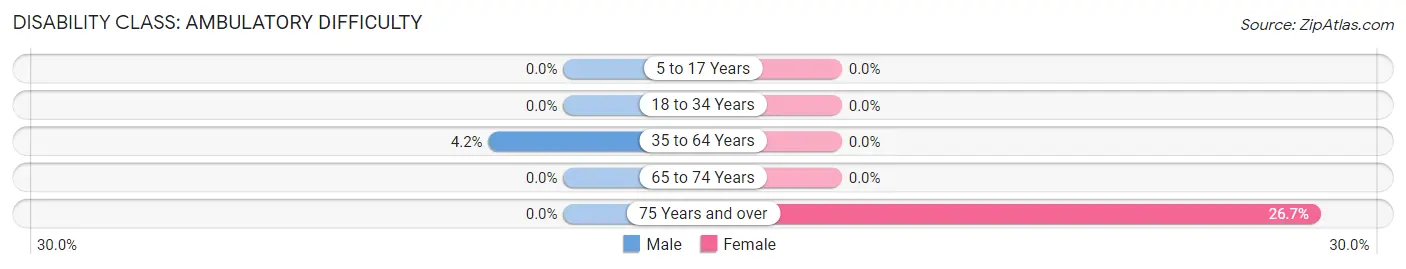
| Age Bracket | Male | Female |
| 5 to 17 Years | 0 (0.0%) | 0 (0.0%) |
| 18 to 34 Years | 0 (0.0%) | 0 (0.0%) |
| 35 to 64 Years | 2 (4.2%) | 0 (0.0%) |
| 65 to 74 Years | 0 (0.0%) | 0 (0.0%) |
| 75 Years and over | 0 (0.0%) | 4 (26.7%) |
Disability Class: Self-Care Difficulty
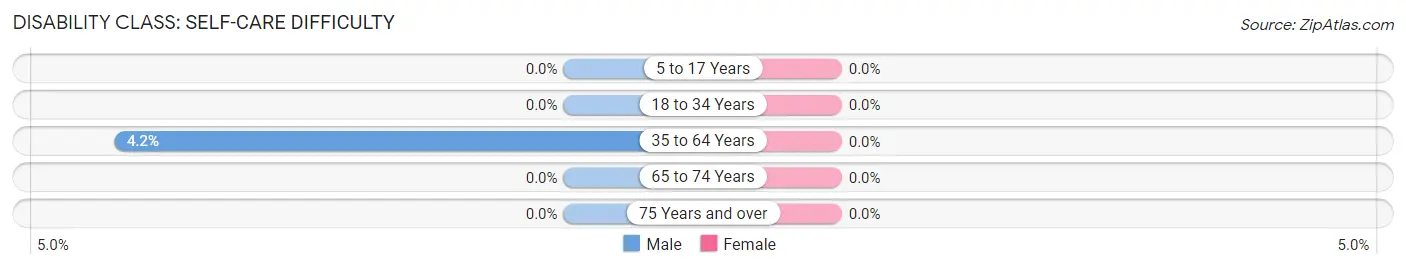
| Age Bracket | Male | Female |
| 5 to 17 Years | 0 (0.0%) | 0 (0.0%) |
| 18 to 34 Years | 0 (0.0%) | 0 (0.0%) |
| 35 to 64 Years | 2 (4.2%) | 0 (0.0%) |
| 65 to 74 Years | 0 (0.0%) | 0 (0.0%) |
| 75 Years and over | 0 (0.0%) | 0 (0.0%) |
Technology Access in Munich
Computing Device Access in Munich
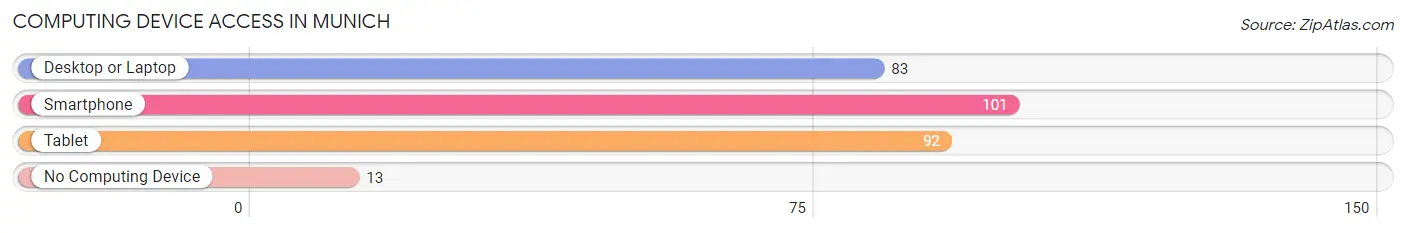
| Device Type | # Households | % Households |
| Desktop or Laptop | 83 | 67.5% |
| Smartphone | 101 | 82.1% |
| Tablet | 92 | 74.8% |
| No Computing Device | 13 | 10.6% |
| Total | 123 | 100.0% |
Internet Access in Munich
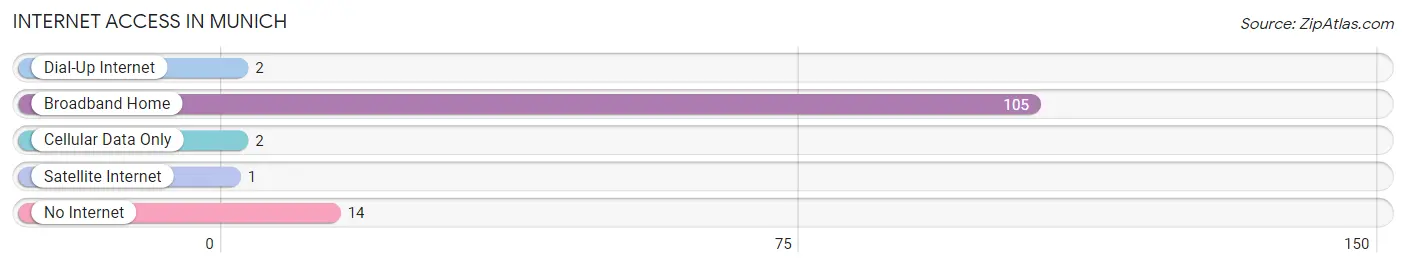
| Internet Type | # Households | % Households |
| Dial-Up Internet | 2 | 1.6% |
| Broadband Home | 105 | 85.4% |
| Cellular Data Only | 2 | 1.6% |
| Satellite Internet | 1 | 0.8% |
| No Internet | 14 | 11.4% |
| Total | 123 | 100.0% |
Munich Summary
Munich is the capital of the German state of Bavaria and is the third largest city in Germany. It is located on the banks of the Isar River in the south of the country and is the largest city in Bavaria. Munich is a major cultural, economic, and political center in Germany and is home to many of the country’s most important institutions.
History
Munich was first mentioned in 1158 as a small settlement on the banks of the Isar River. It was founded by Henry the Lion, Duke of Bavaria, and was initially a small fishing village. Over the centuries, Munich grew in size and importance, becoming a major trading center and a center of learning. In the late 18th century, Munich became the capital of Bavaria and the seat of the Bavarian government.
In the 19th century, Munich became a major industrial center and was the birthplace of the modern German economy. The city was also the site of the first Oktoberfest celebration in 1810. During the 20th century, Munich was the site of several important events, including the 1972 Summer Olympics and the World Cup in 1974.
Geography
Munich is located in the south of Germany, on the banks of the Isar River. The city is surrounded by the Bavarian Alps and is located in the foothills of the Alps. Munich has a temperate climate, with warm summers and cold winters. The city is divided into 25 districts, each with its own unique character and attractions.
Economy
Munich is a major economic center in Germany and is home to many of the country’s largest companies. The city is a major center for the automotive industry, with BMW, Audi, and Mercedes-Benz all having their headquarters in Munich. The city is also a major center for the financial and insurance industries, with many of Germany’s largest banks and insurance companies based in the city. Munich is also home to many of Germany’s leading universities and research institutions.
Demographics
As of 2020, Munich had a population of 1.5 million people. The city is home to a diverse population, with people from all over the world living in the city. The majority of the population is German, with the largest minority groups being Turkish, Italian, and Polish. Munich is also home to a large number of international students, with many of the city’s universities attracting students from all over the world.
Common Questions
What is Per Capita Income in Munich?
Per Capita income in Munich is $40,720.
What is the Median Family Income in Munich?
Median Family Income in Munich is $88,750.
What is the Median Household income in Munich?
Median Household Income in Munich is $59,625.
What is Income or Wage Gap in Munich?
Income or Wage Gap in Munich is 30.9%.
Women in Munich earn 69.1 cents for every dollar earned by a man.
What is Inequality or Gini Index in Munich?
Inequality or Gini Index in Munich is 0.43.
What is the Total Population of Munich?
Total Population of Munich is 337.
What is the Total Male Population of Munich?
Total Male Population of Munich is 204.
What is the Total Female Population of Munich?
Total Female Population of Munich is 133.
What is the Ratio of Males per 100 Females in Munich?
There are 153.38 Males per 100 Females in Munich.
What is the Ratio of Females per 100 Males in Munich?
There are 65.20 Females per 100 Males in Munich.
What is the Median Population Age in Munich?
Median Population Age in Munich is 32.9 Years.
What is the Average Family Size in Munich
Average Family Size in Munich is 3.6 People.
What is the Average Household Size in Munich
Average Household Size in Munich is 2.7 People.
How Large is the Labor Force in Munich?
There are 172 People in the Labor Forcein in Munich.
What is the Percentage of People in the Labor Force in Munich?
70.2% of People are in the Labor Force in Munich.
What is the Unemployment Rate in Munich?
Unemployment Rate in Munich is 0.6%.