Medora, ND Map & Demographics
Medora Map
Medora Overview
$32,170
PER CAPITA INCOME
$81,250
AVG FAMILY INCOME
$64,643
AVG HOUSEHOLD INCOME
0.35
INEQUALITY / GINI INDEX
151
TOTAL POPULATION
88
MALE POPULATION
63
FEMALE POPULATION
139.68
MALES / 100 FEMALES
71.59
FEMALES / 100 MALES
36.9
MEDIAN AGE
2.2
AVG FAMILY SIZE
1.9
AVG HOUSEHOLD SIZE
79
LABOR FORCE [ PEOPLE ]
59.0%
PERCENT IN LABOR FORCE
5.1%
UNEMPLOYMENT RATE
Medora Zip Codes
Medora Area Codes
Income in Medora
Income Overview in Medora
Per Capita Income in Medora is $32,170, while median incomes of families and households are $81,250 and $64,643 respectively.
| Characteristic | Number | Measure |
| Per Capita Income | 151 | $32,170 |
| Median Family Income | 36 | $81,250 |
| Mean Family Income | 36 | $87,067 |
| Median Household Income | 68 | $64,643 |
| Mean Household Income | 68 | $69,635 |
| Income Deficit | 36 | $0 |
| Wage / Income Gap (%) | 151 | 0.00% |
| Wage / Income Gap ($) | 151 | 100.00¢ per $1 |
| Gini / Inequality Index | 151 | 0.35 |
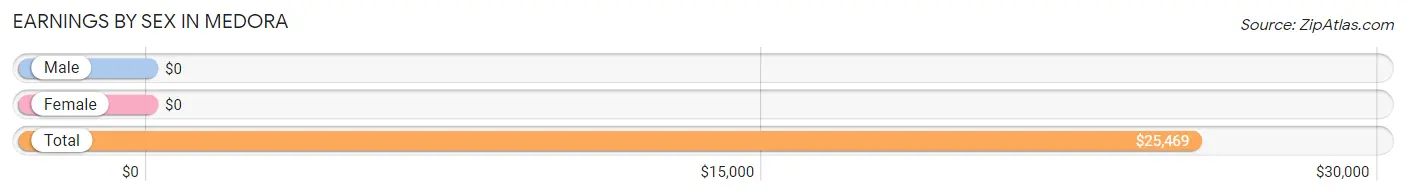
Earnings by Sex in Medora
| Sex | Number | Average Earnings |
| Male | 68 (67.3%) | $0 |
| Female | 33 (32.7%) | $0 |
| Total | 101 (100.0%) | $25,469 |
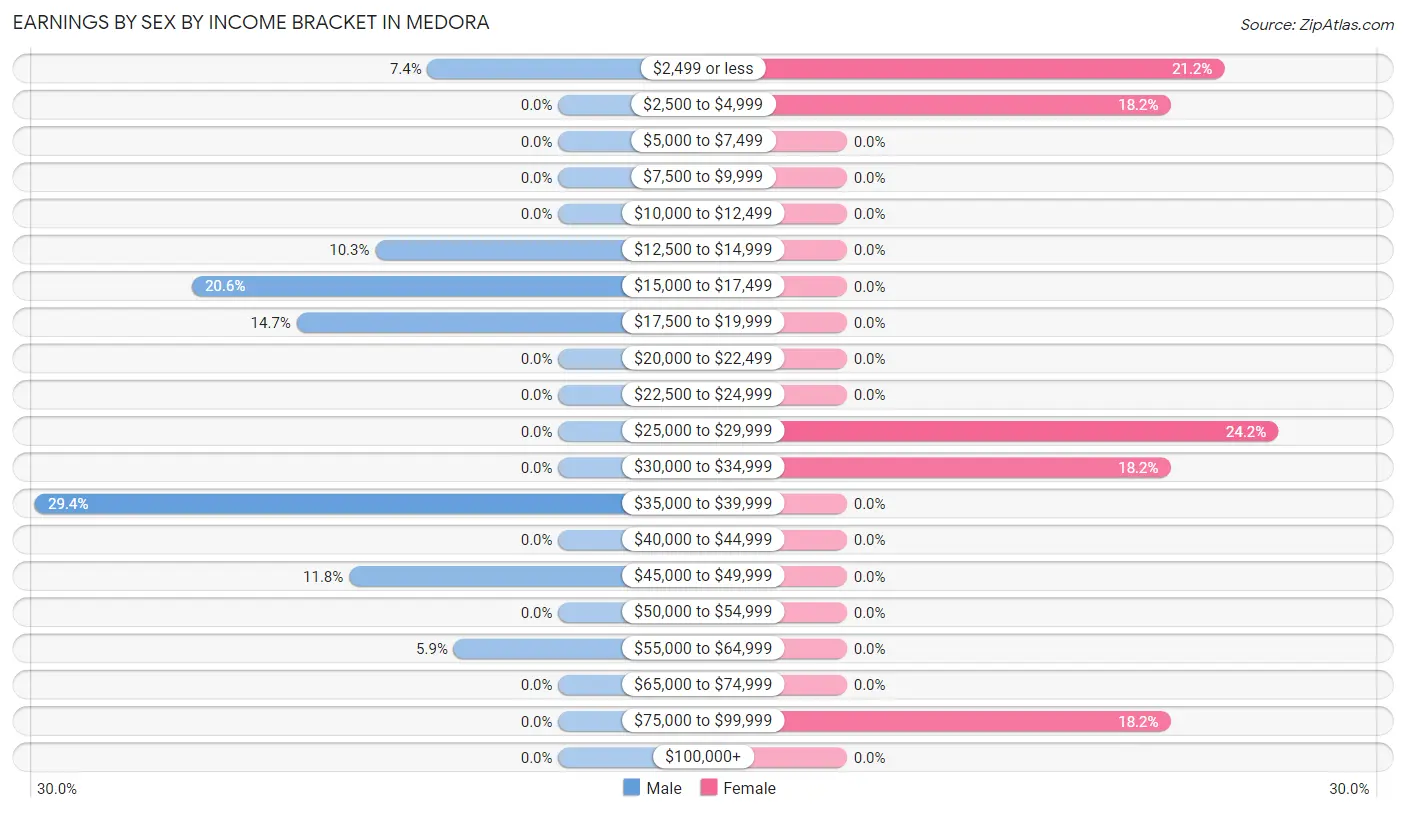
Earnings by Sex by Income Bracket in Medora
The most common earnings brackets in Medora are $35,000 to $39,999 for men (20 | 29.4%) and $25,000 to $29,999 for women (8 | 24.2%).
| Income | Male | Female |
| $2,499 or less | 5 (7.3%) | 7 (21.2%) |
| $2,500 to $4,999 | 0 (0.0%) | 6 (18.2%) |
| $5,000 to $7,499 | 0 (0.0%) | 0 (0.0%) |
| $7,500 to $9,999 | 0 (0.0%) | 0 (0.0%) |
| $10,000 to $12,499 | 0 (0.0%) | 0 (0.0%) |
| $12,500 to $14,999 | 7 (10.3%) | 0 (0.0%) |
| $15,000 to $17,499 | 14 (20.6%) | 0 (0.0%) |
| $17,500 to $19,999 | 10 (14.7%) | 0 (0.0%) |
| $20,000 to $22,499 | 0 (0.0%) | 0 (0.0%) |
| $22,500 to $24,999 | 0 (0.0%) | 0 (0.0%) |
| $25,000 to $29,999 | 0 (0.0%) | 8 (24.2%) |
| $30,000 to $34,999 | 0 (0.0%) | 6 (18.2%) |
| $35,000 to $39,999 | 20 (29.4%) | 0 (0.0%) |
| $40,000 to $44,999 | 0 (0.0%) | 0 (0.0%) |
| $45,000 to $49,999 | 8 (11.8%) | 0 (0.0%) |
| $50,000 to $54,999 | 0 (0.0%) | 0 (0.0%) |
| $55,000 to $64,999 | 4 (5.9%) | 0 (0.0%) |
| $65,000 to $74,999 | 0 (0.0%) | 0 (0.0%) |
| $75,000 to $99,999 | 0 (0.0%) | 6 (18.2%) |
| $100,000+ | 0 (0.0%) | 0 (0.0%) |
| Total | 68 (100.0%) | 33 (100.0%) |
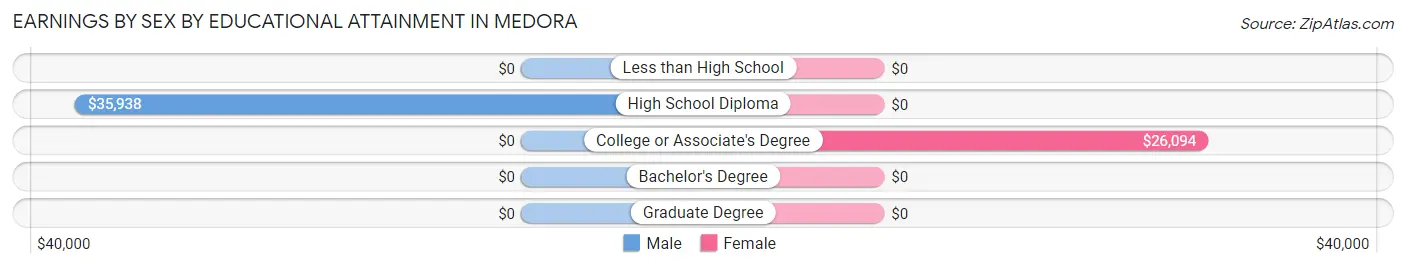
Earnings by Sex by Educational Attainment in Medora
| Educational Attainment | Male Income | Female Income |
| Less than High School | - | - |
| High School Diploma | $35,938 | $0 |
| College or Associate's Degree | - | - |
| Bachelor's Degree | - | - |
| Graduate Degree | - | - |
| Total | - | - |
Family Income in Medora
Family Income Brackets in Medora
According to the Medora family income data, there are 15 families falling into the $100,000 to $149,999 income range, which is the most common income bracket and makes up 41.7% of all families.
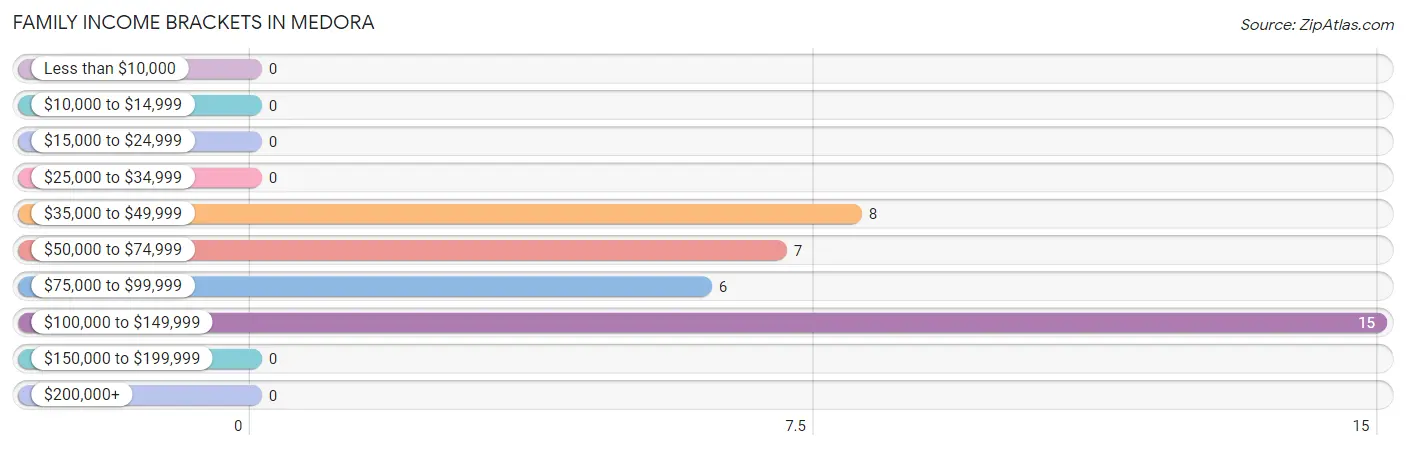
| Income Bracket | # Families | % Families |
| Less than $10,000 | 0 | 0.0% |
| $10,000 to $14,999 | 0 | 0.0% |
| $15,000 to $24,999 | 0 | 0.0% |
| $25,000 to $34,999 | 0 | 0.0% |
| $35,000 to $49,999 | 8 | 22.2% |
| $50,000 to $74,999 | 7 | 19.4% |
| $75,000 to $99,999 | 6 | 16.7% |
| $100,000 to $149,999 | 15 | 41.7% |
| $150,000 to $199,999 | 0 | 0.0% |
| $200,000+ | 0 | 0.0% |
Family Income by Famaliy Size in Medora
2-person families (30 | 83.3%) account for the highest median family income in Medora with $91,250 per family, while 2-person families (30 | 83.3%) have the highest median income of $45,625 per family member.
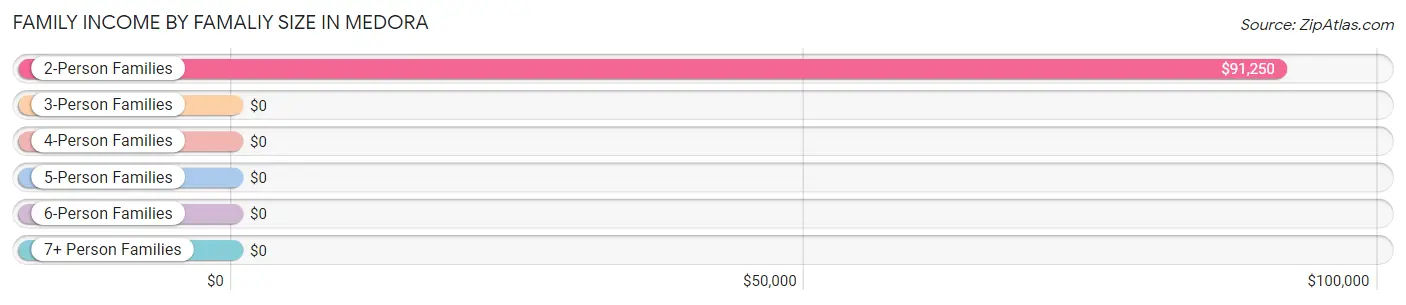
| Income Bracket | # Families | Median Income |
| 2-Person Families | 30 (83.3%) | $91,250 |
| 3-Person Families | 6 (16.7%) | $0 |
| 4-Person Families | 0 (0.0%) | $0 |
| 5-Person Families | 0 (0.0%) | $0 |
| 6-Person Families | 0 (0.0%) | $0 |
| 7+ Person Families | 0 (0.0%) | $0 |
| Total | 36 (100.0%) | $81,250 |
Family Income by Number of Earners in Medora
| Number of Earners | # Families | Median Income |
| No Earners | 7 (19.4%) | $0 |
| 1 Earner | 14 (38.9%) | $0 |
| 2 Earners | 15 (41.7%) | $0 |
| 3+ Earners | 0 (0.0%) | $0 |
| Total | 36 (100.0%) | $81,250 |
Household Income in Medora
Household Income Brackets in Medora
With 23 households falling in the category, the $50,000 to $74,999 income range is the most frequent in Medora, accounting for 33.8% of all households.
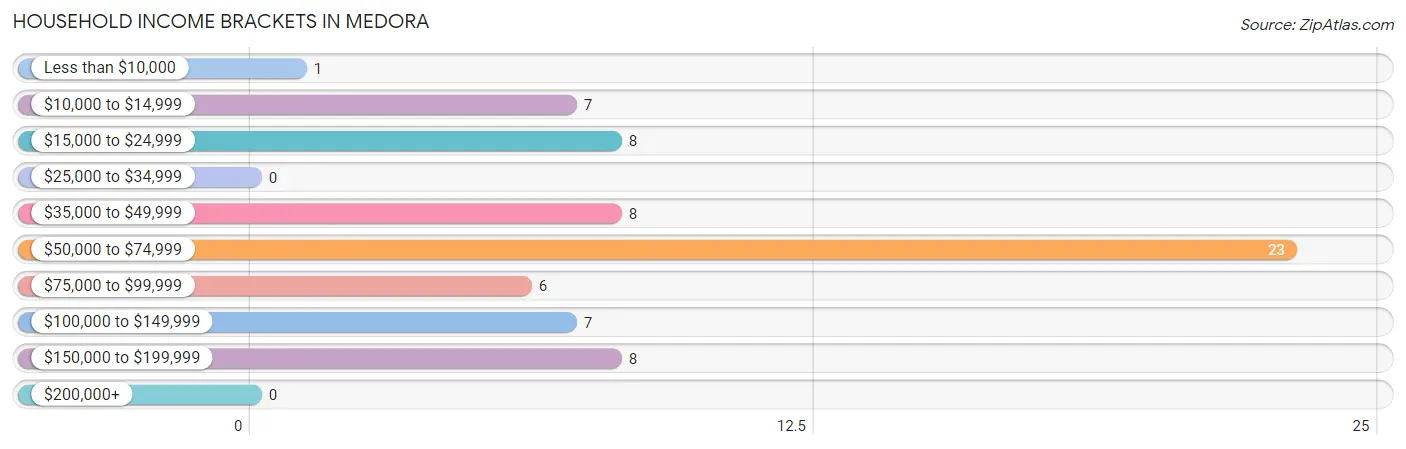
| Income Bracket | # Households | % Households |
| Less than $10,000 | 1 | 1.5% |
| $10,000 to $14,999 | 7 | 10.3% |
| $15,000 to $24,999 | 8 | 11.8% |
| $25,000 to $34,999 | 0 | 0.0% |
| $35,000 to $49,999 | 8 | 11.8% |
| $50,000 to $74,999 | 23 | 33.8% |
| $75,000 to $99,999 | 6 | 8.8% |
| $100,000 to $149,999 | 7 | 10.3% |
| $150,000 to $199,999 | 8 | 11.8% |
| $200,000+ | 0 | 0.0% |
Household Income by Householder Age in Medora
The median household income in Medora is $64,643, with the highest median household income of $14,107 found in the 15 to 24 years age bracket for the primary householder. A total of 11 households (16.2%) fall into this category. Meanwhile, the 25 to 44 years age bracket for the primary householder has the lowest median household income of $0, with 24 households (35.3%) in this group.
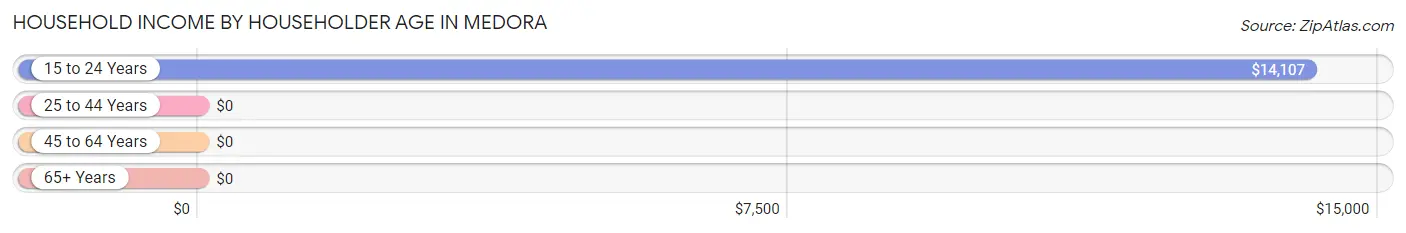
| Income Bracket | # Households | Median Income |
| 15 to 24 Years | 11 (16.2%) | $14,107 |
| 25 to 44 Years | 24 (35.3%) | $0 |
| 45 to 64 Years | 14 (20.6%) | $0 |
| 65+ Years | 19 (27.9%) | $0 |
| Total | 68 (100.0%) | $64,643 |
Poverty in Medora
Income Below Poverty by Sex and Age in Medora
With 13.8% poverty level for males and 14.3% for females among the residents of Medora, 35 to 44 year old males and 18 to 24 year old females are the most vulnerable to poverty, with 4 males (100.0%) and 6 females (100.0%) in their respective age groups living below the poverty level.
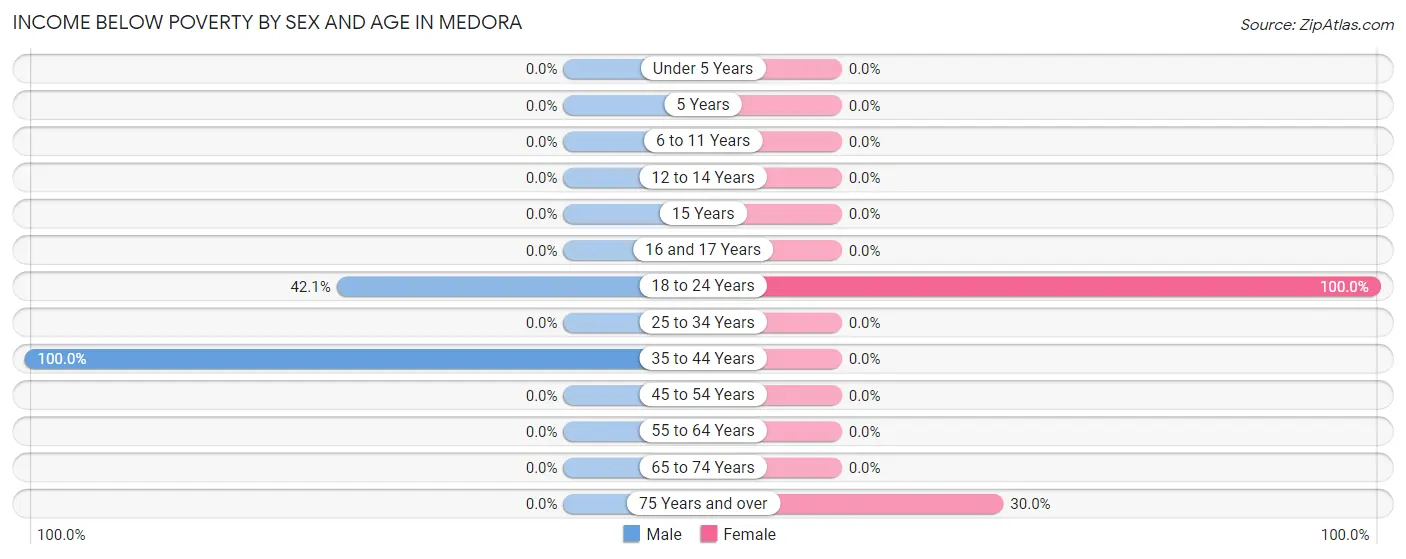
| Age Bracket | Male | Female |
| Under 5 Years | 0 (0.0%) | 0 (0.0%) |
| 5 Years | 0 (0.0%) | 0 (0.0%) |
| 6 to 11 Years | 0 (0.0%) | 0 (0.0%) |
| 12 to 14 Years | 0 (0.0%) | 0 (0.0%) |
| 15 Years | 0 (0.0%) | 0 (0.0%) |
| 16 and 17 Years | 0 (0.0%) | 0 (0.0%) |
| 18 to 24 Years | 8 (42.1%) | 6 (100.0%) |
| 25 to 34 Years | 0 (0.0%) | 0 (0.0%) |
| 35 to 44 Years | 4 (100.0%) | 0 (0.0%) |
| 45 to 54 Years | 0 (0.0%) | 0 (0.0%) |
| 55 to 64 Years | 0 (0.0%) | 0 (0.0%) |
| 65 to 74 Years | 0 (0.0%) | 0 (0.0%) |
| 75 Years and over | 0 (0.0%) | 3 (30.0%) |
| Total | 12 (13.8%) | 9 (14.3%) |
Income Above Poverty by Sex and Age in Medora
According to the poverty statistics in Medora, males aged under 5 years and females aged 12 to 14 years are the age groups that are most secure financially, with 100.0% of males and 100.0% of females in these age groups living above the poverty line.
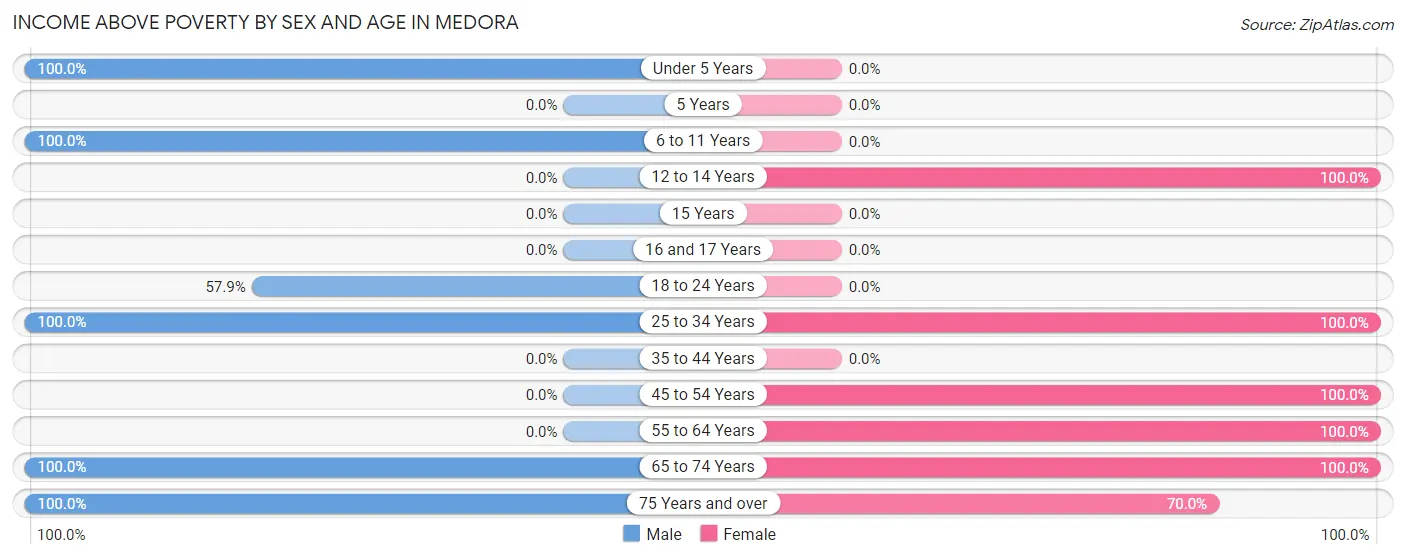
| Age Bracket | Male | Female |
| Under 5 Years | 6 (100.0%) | 0 (0.0%) |
| 5 Years | 0 (0.0%) | 0 (0.0%) |
| 6 to 11 Years | 6 (100.0%) | 0 (0.0%) |
| 12 to 14 Years | 0 (0.0%) | 4 (100.0%) |
| 15 Years | 0 (0.0%) | 0 (0.0%) |
| 16 and 17 Years | 0 (0.0%) | 0 (0.0%) |
| 18 to 24 Years | 11 (57.9%) | 0 (0.0%) |
| 25 to 34 Years | 24 (100.0%) | 6 (100.0%) |
| 35 to 44 Years | 0 (0.0%) | 0 (0.0%) |
| 45 to 54 Years | 0 (0.0%) | 6 (100.0%) |
| 55 to 64 Years | 0 (0.0%) | 8 (100.0%) |
| 65 to 74 Years | 21 (100.0%) | 23 (100.0%) |
| 75 Years and over | 7 (100.0%) | 7 (70.0%) |
| Total | 75 (86.2%) | 54 (85.7%) |
Income Below Poverty Among Married-Couple Families in Medora
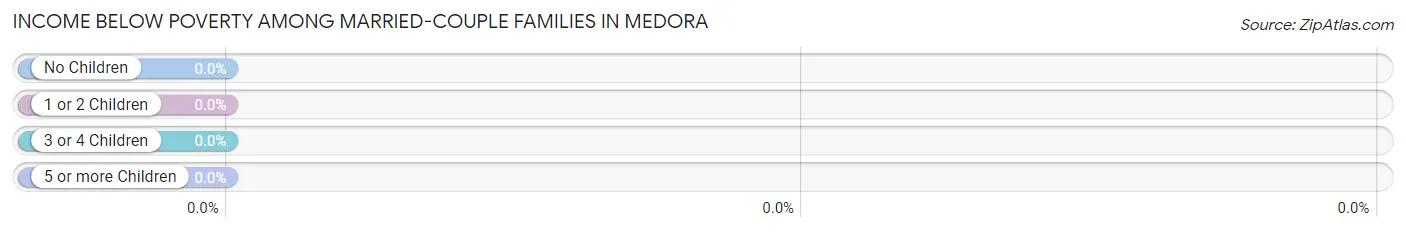
| Children | Above Poverty | Below Poverty |
| No Children | 15 (100.0%) | 0 (0.0%) |
| 1 or 2 Children | 0 (0.0%) | 0 (0.0%) |
| 3 or 4 Children | 0 (0.0%) | 0 (0.0%) |
| 5 or more Children | 0 (0.0%) | 0 (0.0%) |
| Total | 15 (100.0%) | 0 (0.0%) |
Income Below Poverty Among Single-Parent Households in Medora
| Children | Single Father | Single Mother |
| No Children | 0 (0.0%) | 0 (0.0%) |
| 1 or 2 Children | 0 (0.0%) | 0 (0.0%) |
| 3 or 4 Children | 0 (0.0%) | 0 (0.0%) |
| 5 or more Children | 0 (0.0%) | 0 (0.0%) |
| Total | 0 (0.0%) | 0 (0.0%) |
Income Below Poverty Among Married-Couple vs Single-Parent Households in Medora
| Children | Married-Couple Families | Single-Parent Households |
| No Children | 0 (0.0%) | 0 (0.0%) |
| 1 or 2 Children | 0 (0.0%) | 0 (0.0%) |
| 3 or 4 Children | 0 (0.0%) | 0 (0.0%) |
| 5 or more Children | 0 (0.0%) | 0 (0.0%) |
| Total | 0 (0.0%) | 0 (0.0%) |
Race in Medora
The most populous races in Medora are White / Caucasian (139 | 92.0%), Hispanic or Latino (12 | 8.0%), and Two or more Races (12 | 8.0%).
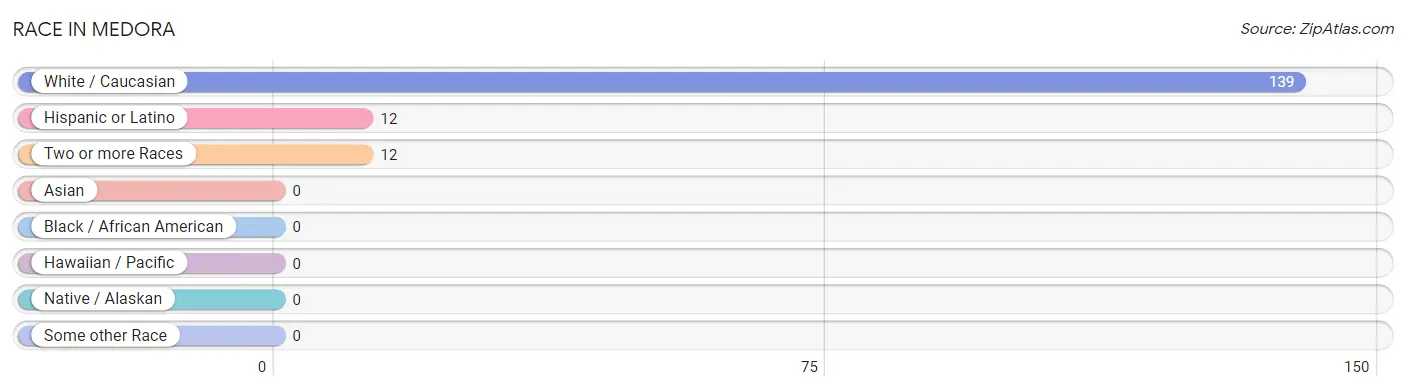
| Race | # Population | % Population |
| Asian | 0 | 0.0% |
| Black / African American | 0 | 0.0% |
| Hawaiian / Pacific | 0 | 0.0% |
| Hispanic or Latino | 12 | 8.0% |
| Native / Alaskan | 0 | 0.0% |
| White / Caucasian | 139 | 92.0% |
| Two or more Races | 12 | 8.0% |
| Some other Race | 0 | 0.0% |
| Total | 151 | 100.0% |
Ancestry in Medora
The most populous ancestries reported in Medora are German (53 | 35.1%), Norwegian (40 | 26.5%), Irish (37 | 24.5%), English (21 | 13.9%), and French Canadian (14 | 9.3%), together accounting for 109.3% of all Medora residents.
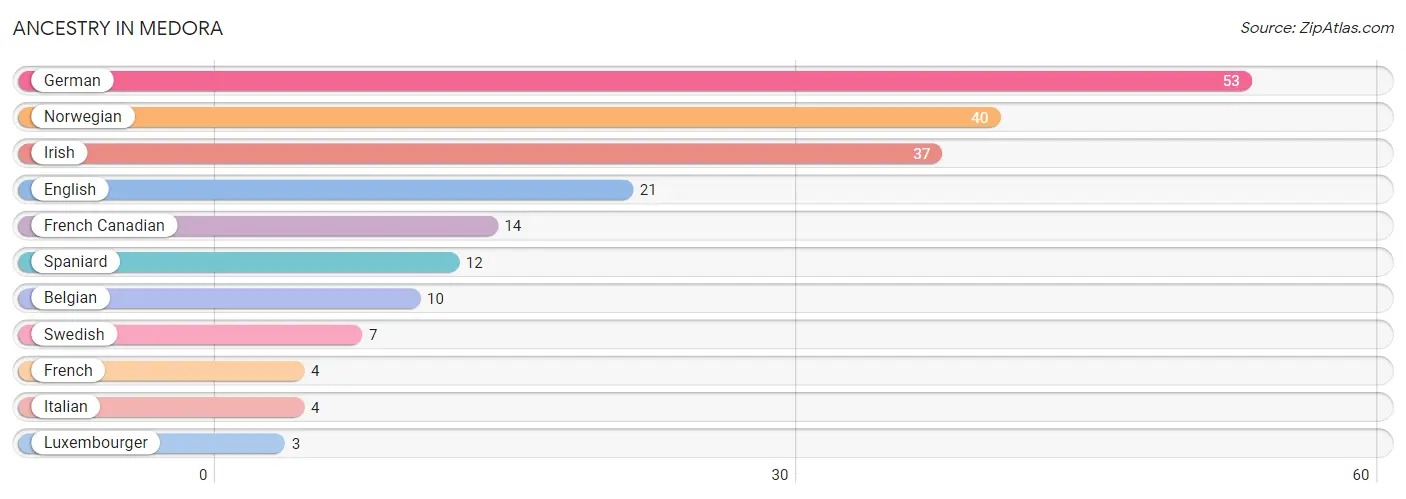
| Ancestry | # Population | % Population |
| Belgian | 10 | 6.6% |
| English | 21 | 13.9% |
| French | 4 | 2.6% |
| French Canadian | 14 | 9.3% |
| German | 53 | 35.1% |
| Irish | 37 | 24.5% |
| Italian | 4 | 2.6% |
| Luxembourger | 3 | 2.0% |
| Norwegian | 40 | 26.5% |
| Spaniard | 12 | 8.0% |
| Swedish | 7 | 4.6% | View All 11 Rows |
Immigrants in Medora
The most numerous immigrant groups reported in Medora came from Central America (12 | 8.0%), Latin America (12 | 8.0%), and Mexico (12 | 8.0%), together accounting for 23.8% of all Medora residents.
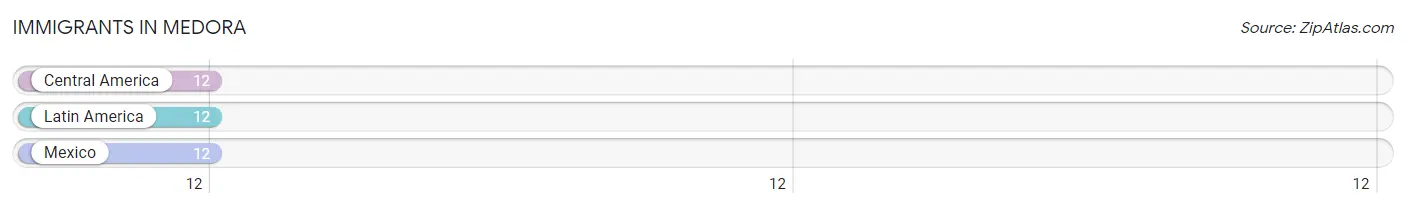
| Immigration Origin | # Population | % Population |
| Central America | 12 | 8.0% |
| Latin America | 12 | 8.0% |
| Mexico | 12 | 8.0% | View All 3 Rows |
Sex and Age in Medora
Sex and Age in Medora
The most populous age groups in Medora are 25 to 29 Years (24 | 27.3%) for men and 70 to 74 Years (18 | 28.6%) for women.
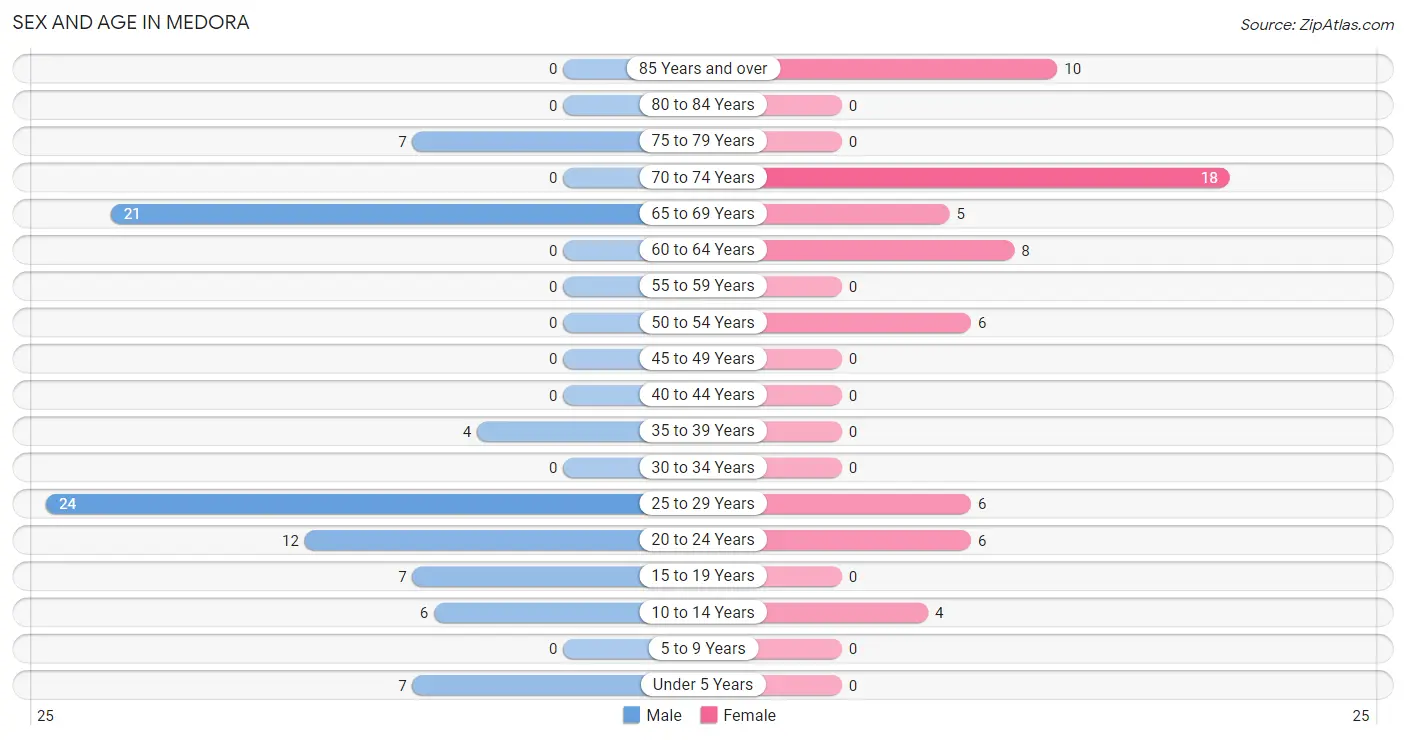
| Age Bracket | Male | Female |
| Under 5 Years | 7 (8.0%) | 0 (0.0%) |
| 5 to 9 Years | 0 (0.0%) | 0 (0.0%) |
| 10 to 14 Years | 6 (6.8%) | 4 (6.4%) |
| 15 to 19 Years | 7 (8.0%) | 0 (0.0%) |
| 20 to 24 Years | 12 (13.6%) | 6 (9.5%) |
| 25 to 29 Years | 24 (27.3%) | 6 (9.5%) |
| 30 to 34 Years | 0 (0.0%) | 0 (0.0%) |
| 35 to 39 Years | 4 (4.5%) | 0 (0.0%) |
| 40 to 44 Years | 0 (0.0%) | 0 (0.0%) |
| 45 to 49 Years | 0 (0.0%) | 0 (0.0%) |
| 50 to 54 Years | 0 (0.0%) | 6 (9.5%) |
| 55 to 59 Years | 0 (0.0%) | 0 (0.0%) |
| 60 to 64 Years | 0 (0.0%) | 8 (12.7%) |
| 65 to 69 Years | 21 (23.9%) | 5 (7.9%) |
| 70 to 74 Years | 0 (0.0%) | 18 (28.6%) |
| 75 to 79 Years | 7 (8.0%) | 0 (0.0%) |
| 80 to 84 Years | 0 (0.0%) | 0 (0.0%) |
| 85 Years and over | 0 (0.0%) | 10 (15.9%) |
| Total | 88 (100.0%) | 63 (100.0%) |
Families and Households in Medora
Median Family Size in Medora
The median family size in Medora is 2.22 persons per family, with single female/mother families (13 | 36.1%) accounting for the largest median family size of 2.85 persons per family. On the other hand, single male/father families (8 | 22.2%) represent the smallest median family size with 1.75 persons per family.
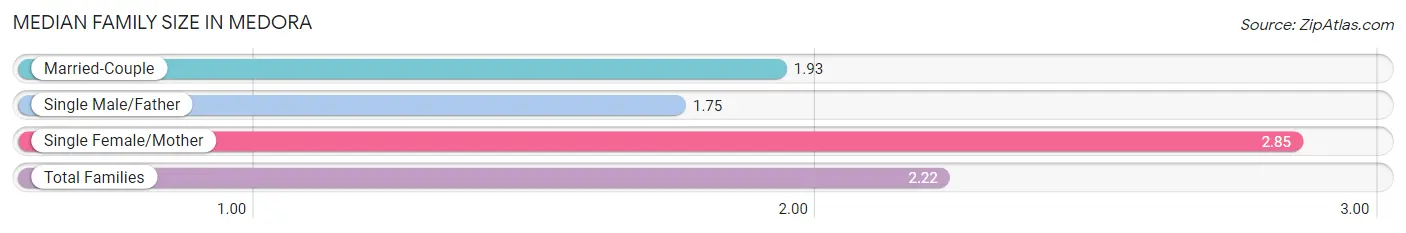
| Family Type | # Families | Family Size |
| Married-Couple | 15 (41.7%) | 1.93 |
| Single Male/Father | 8 (22.2%) | 1.75 |
| Single Female/Mother | 13 (36.1%) | 2.85 |
| Total Families | 36 (100.0%) | 2.22 |
Median Household Size in Medora
The median household size in Medora is 1.85 persons per household, with single female/mother households (13 | 19.1%) accounting for the largest median household size of 2.85 persons per household. non-family households (32 | 47.1%) represent the smallest median household size with 1.25 persons per household.
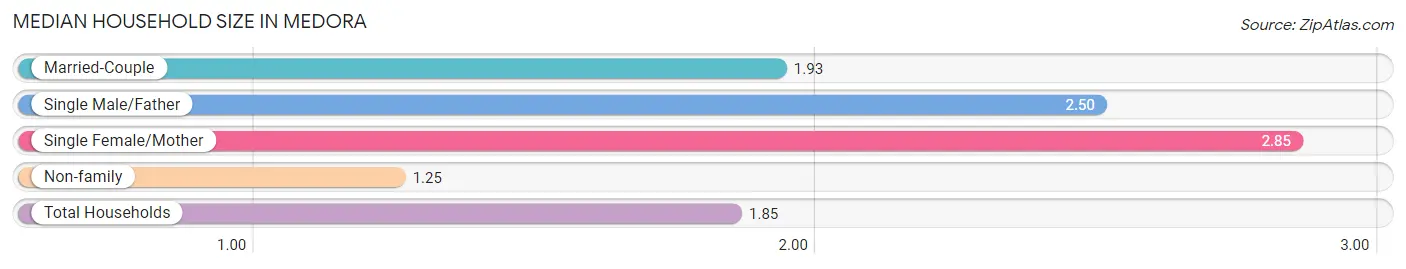
| Household Type | # Households | Household Size |
| Married-Couple | 15 (22.1%) | 1.93 |
| Single Male/Father | 8 (11.8%) | 2.50 |
| Single Female/Mother | 13 (19.1%) | 2.85 |
| Non-family | 32 (47.1%) | 1.25 |
| Total Households | 68 (100.0%) | 1.85 |
Household Size by Marriage Status in Medora
Out of a total of 68 households in Medora, 36 (52.9%) are family households, while 32 (47.1%) are nonfamily households. The most numerous type of family households are 2-person households, comprising 22, and the most common type of nonfamily households are 1-person households, comprising 20.
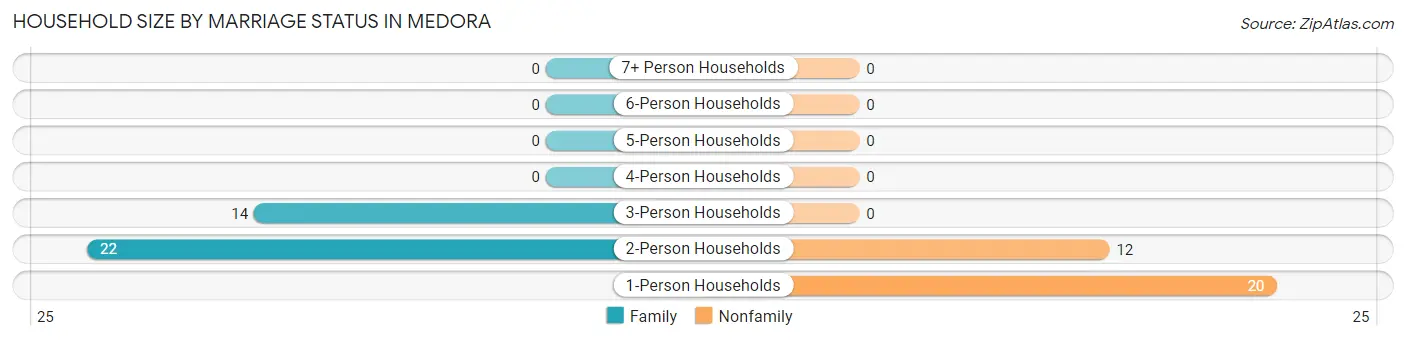
| Household Size | Family Households | Nonfamily Households |
| 1-Person Households | - | 20 (29.4%) |
| 2-Person Households | 22 (32.4%) | 12 (17.6%) |
| 3-Person Households | 14 (20.6%) | 0 (0.0%) |
| 4-Person Households | 0 (0.0%) | 0 (0.0%) |
| 5-Person Households | 0 (0.0%) | 0 (0.0%) |
| 6-Person Households | 0 (0.0%) | 0 (0.0%) |
| 7+ Person Households | 0 (0.0%) | 0 (0.0%) |
| Total | 36 (52.9%) | 32 (47.1%) |
Female Fertility in Medora
Fertility by Age in Medora
Average fertility rate in Medora is 500.0 births per 1,000 women. Women in the age bracket of 20 to 34 years have the highest fertility rate with 500.0 births per 1,000 women. Women in the age bracket of 20 to 34 years acount for 100.0% of all women with births.
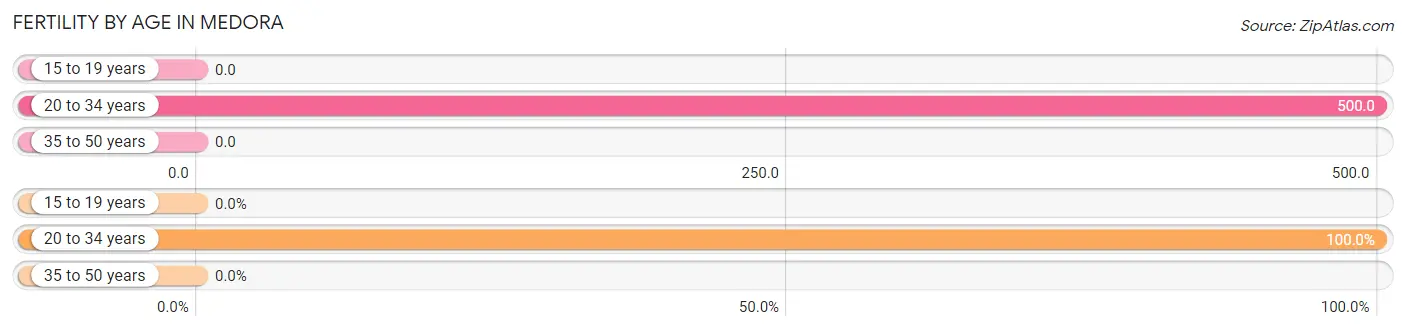
| Age Bracket | Women with Births | Births / 1,000 Women |
| 15 to 19 years | 0 (0.0%) | 0.0 |
| 20 to 34 years | 6 (100.0%) | 500.0 |
| 35 to 50 years | 0 (0.0%) | 0.0 |
| Total | 6 (100.0%) | 500.0 |
Fertility by Age by Marriage Status in Medora
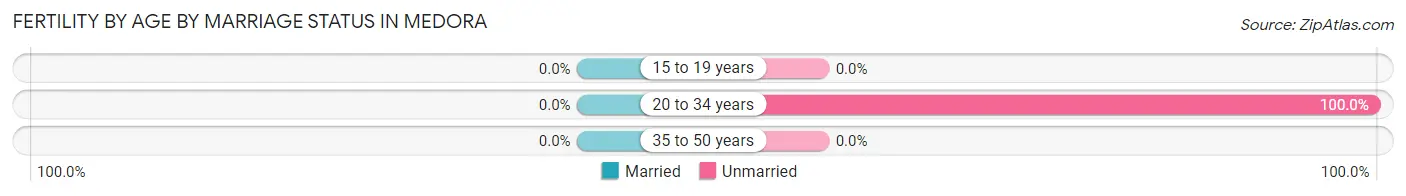
| Age Bracket | Married | Unmarried |
| 15 to 19 years | 0 (0.0%) | 0 (0.0%) |
| 20 to 34 years | 0 (0.0%) | 6 (100.0%) |
| 35 to 50 years | 0 (0.0%) | 0 (0.0%) |
| Total | 0 (0.0%) | 6 (100.0%) |
Fertility by Education in Medora
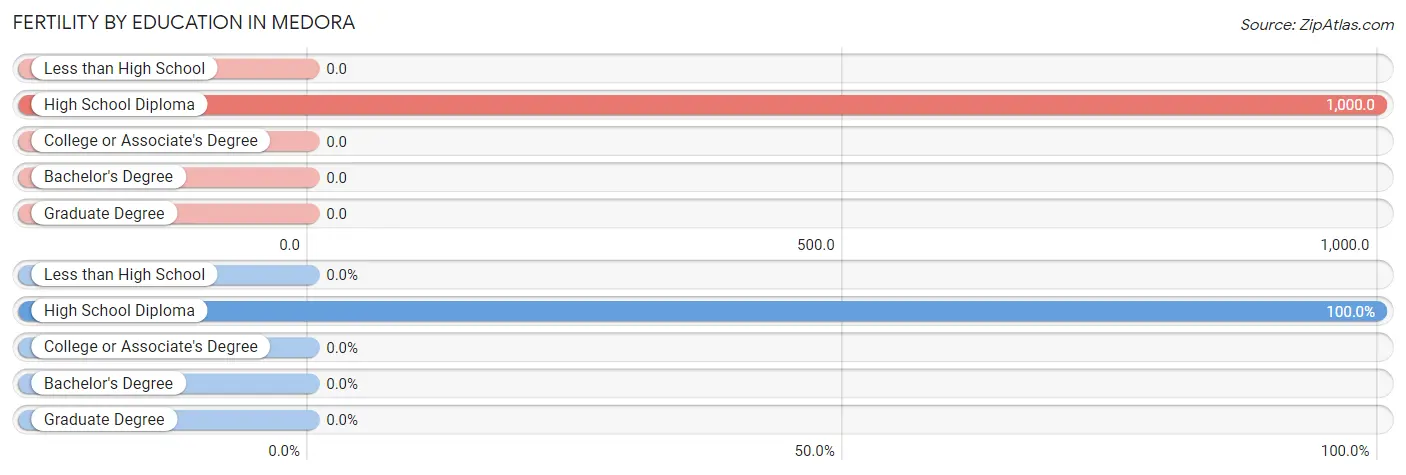
| Educational Attainment | Women with Births | Births / 1,000 Women |
| Less than High School | 0 (0.0%) | 0.0 |
| High School Diploma | 6 (100.0%) | 1,000.0 |
| College or Associate's Degree | 0 (0.0%) | 0.0 |
| Bachelor's Degree | 0 (0.0%) | 0.0 |
| Graduate Degree | 0 (0.0%) | 0.0 |
| Total | 6 (100.0%) | 500.0 |
Fertility by Education by Marriage Status in Medora
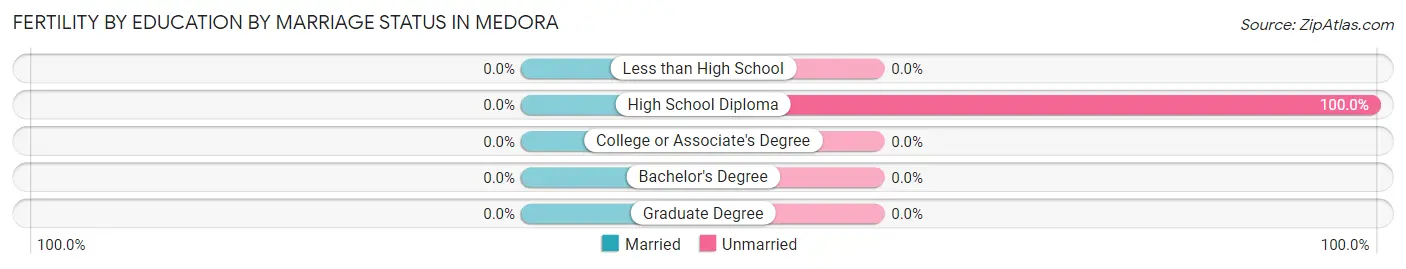
| Educational Attainment | Married | Unmarried |
| Less than High School | 0 (0.0%) | 0 (0.0%) |
| High School Diploma | 0 (0.0%) | 6 (100.0%) |
| College or Associate's Degree | 0 (0.0%) | 0 (0.0%) |
| Bachelor's Degree | 0 (0.0%) | 0 (0.0%) |
| Graduate Degree | 0 (0.0%) | 0 (0.0%) |
| Total | 0 (0.0%) | 6 (100.0%) |
Employment Characteristics in Medora
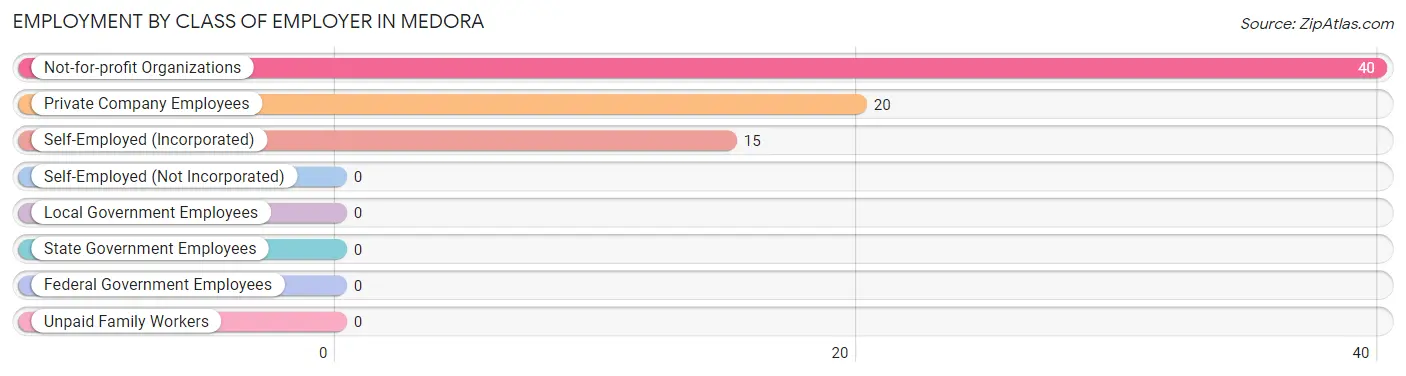
Employment by Class of Employer in Medora
Among the 75 employed individuals in Medora, not-for-profit organizations (40 | 53.3%), private company employees (20 | 26.7%), and self-employed (incorporated) (15 | 20.0%) make up the most common classes of employment.
| Employer Class | # Employees | % Employees |
| Private Company Employees | 20 | 26.7% |
| Self-Employed (Incorporated) | 15 | 20.0% |
| Self-Employed (Not Incorporated) | 0 | 0.0% |
| Not-for-profit Organizations | 40 | 53.3% |
| Local Government Employees | 0 | 0.0% |
| State Government Employees | 0 | 0.0% |
| Federal Government Employees | 0 | 0.0% |
| Unpaid Family Workers | 0 | 0.0% |
| Total | 75 | 100.0% |
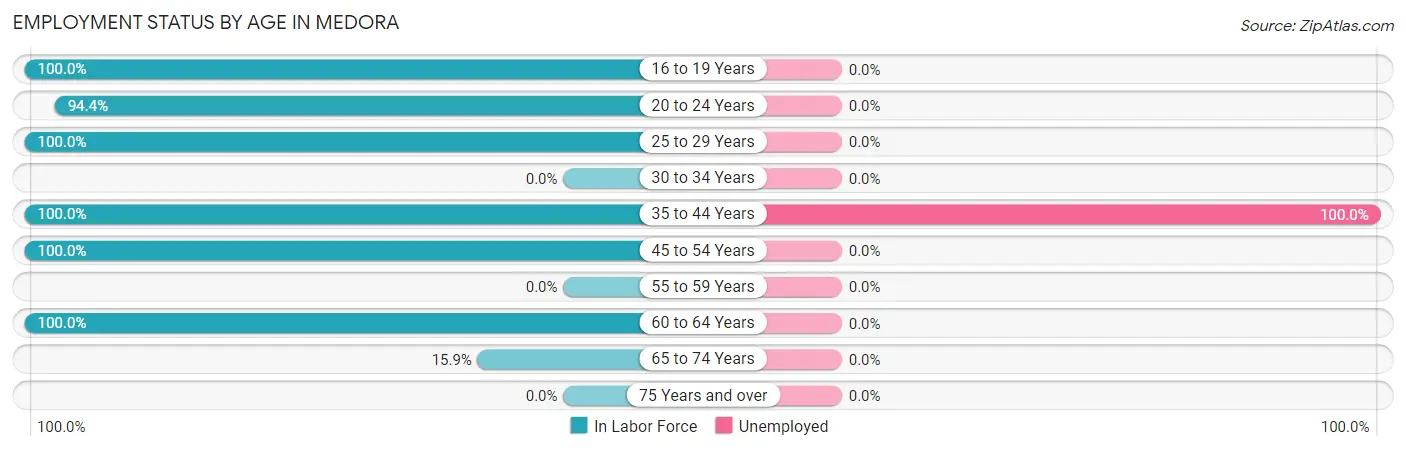
Employment Status by Age in Medora
According to the labor force statistics for Medora, out of the total population over 16 years of age (134), 59.0% or 79 individuals are in the labor force, with 5.1% or 4 of them unemployed. The age group with the highest labor force participation rate is 16 to 19 years, with 100.0% or 7 individuals in the labor force. Within the labor force, the 35 to 44 years age range has the highest percentage of unemployed individuals, with 100.0% or 4 of them being unemployed.
| Age Bracket | In Labor Force | Unemployed |
| 16 to 19 Years | 7 (100.0%) | 0 (0.0%) |
| 20 to 24 Years | 17 (94.4%) | 0 (0.0%) |
| 25 to 29 Years | 30 (100.0%) | 0 (0.0%) |
| 30 to 34 Years | 0 (0.0%) | 0 (0.0%) |
| 35 to 44 Years | 4 (100.0%) | 4 (100.0%) |
| 45 to 54 Years | 6 (100.0%) | 0 (0.0%) |
| 55 to 59 Years | 0 (0.0%) | 0 (0.0%) |
| 60 to 64 Years | 8 (100.0%) | 0 (0.0%) |
| 65 to 74 Years | 7 (15.9%) | 0 (0.0%) |
| 75 Years and over | 0 (0.0%) | 0 (0.0%) |
| Total | 79 (59.0%) | 4 (5.1%) |
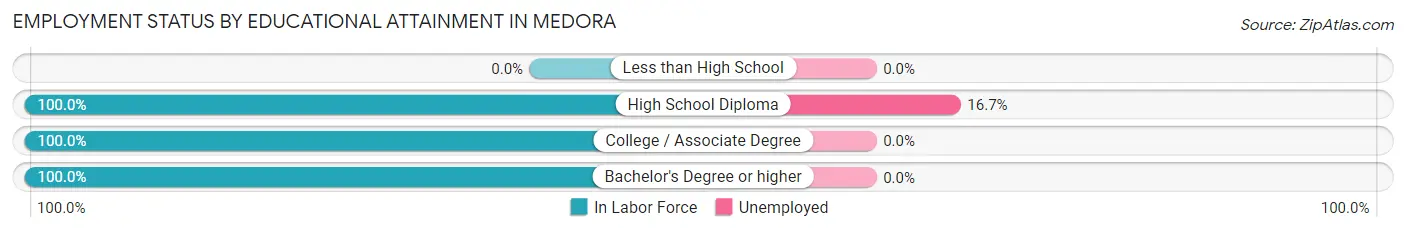
Employment Status by Educational Attainment in Medora
According to labor force statistics for Medora, 100.0% of individuals (48) out of the total population between 25 and 64 years of age (48) are in the labor force, with 8.3% or 4 of them being unemployed. The group with the highest labor force participation rate are those with the educational attainment of high school diploma, with 100.0% or 24 individuals in the labor force. Within the labor force, individuals with high school diploma education have the highest percentage of unemployment, with 16.7% or 4 of them being unemployed.
| Educational Attainment | In Labor Force | Unemployed |
| Less than High School | 0 (0.0%) | 0 (0.0%) |
| High School Diploma | 24 (100.0%) | 4 (16.7%) |
| College / Associate Degree | 14 (100.0%) | 0 (0.0%) |
| Bachelor's Degree or higher | 10 (100.0%) | 0 (0.0%) |
| Total | 48 (100.0%) | 4 (8.3%) |
Employment Occupations by Sex in Medora
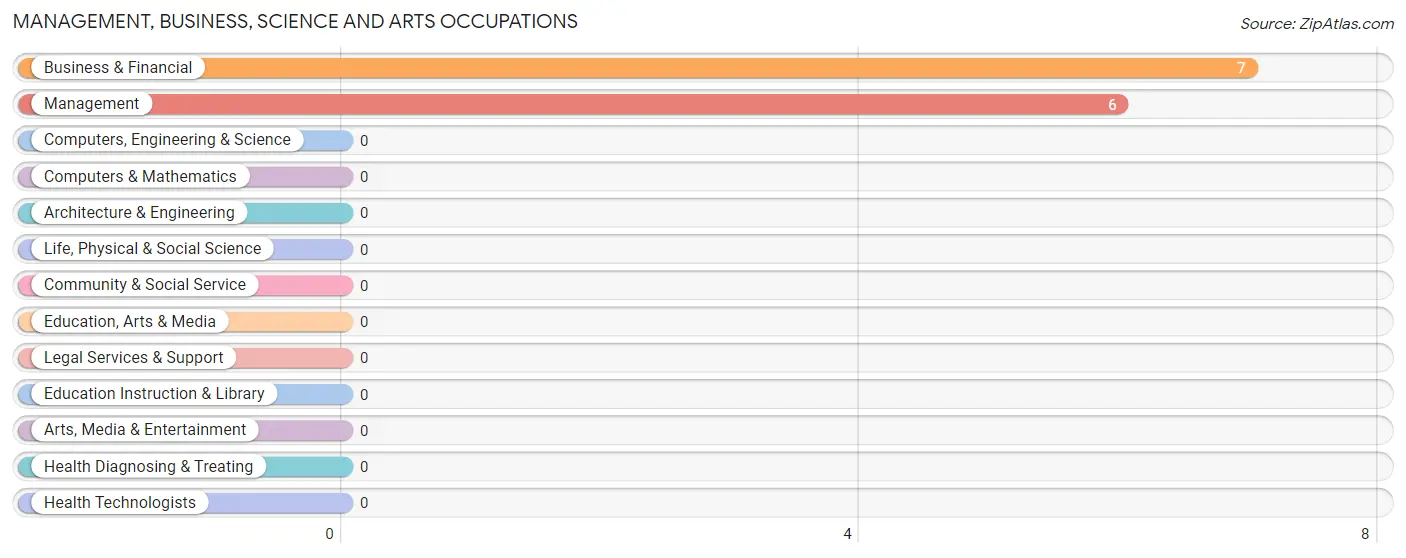
Management, Business, Science and Arts Occupations
The most common Management, Business, Science and Arts occupations in Medora are Business & Financial (7 | 9.3%), and Management (6 | 8.0%).
Management, Business, Science and Arts Occupations by Sex
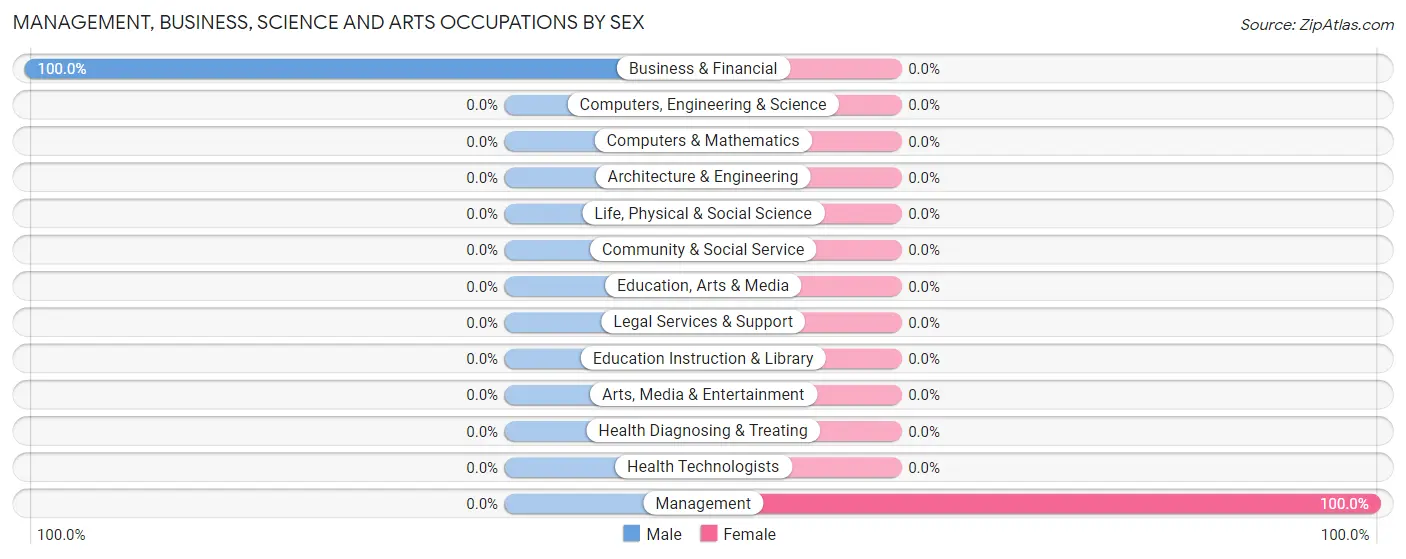
| Occupation | Male | Female |
| Management | 0 (0.0%) | 6 (100.0%) |
| Business & Financial | 7 (100.0%) | 0 (0.0%) |
| Computers, Engineering & Science | 0 (0.0%) | 0 (0.0%) |
| Computers & Mathematics | 0 (0.0%) | 0 (0.0%) |
| Architecture & Engineering | 0 (0.0%) | 0 (0.0%) |
| Life, Physical & Social Science | 0 (0.0%) | 0 (0.0%) |
| Community & Social Service | 0 (0.0%) | 0 (0.0%) |
| Education, Arts & Media | 0 (0.0%) | 0 (0.0%) |
| Legal Services & Support | 0 (0.0%) | 0 (0.0%) |
| Education Instruction & Library | 0 (0.0%) | 0 (0.0%) |
| Arts, Media & Entertainment | 0 (0.0%) | 0 (0.0%) |
| Health Diagnosing & Treating | 0 (0.0%) | 0 (0.0%) |
| Health Technologists | 0 (0.0%) | 0 (0.0%) |
| Total (Category) | 7 (53.8%) | 6 (46.2%) |
| Total (Overall) | 49 (65.3%) | 26 (34.7%) |
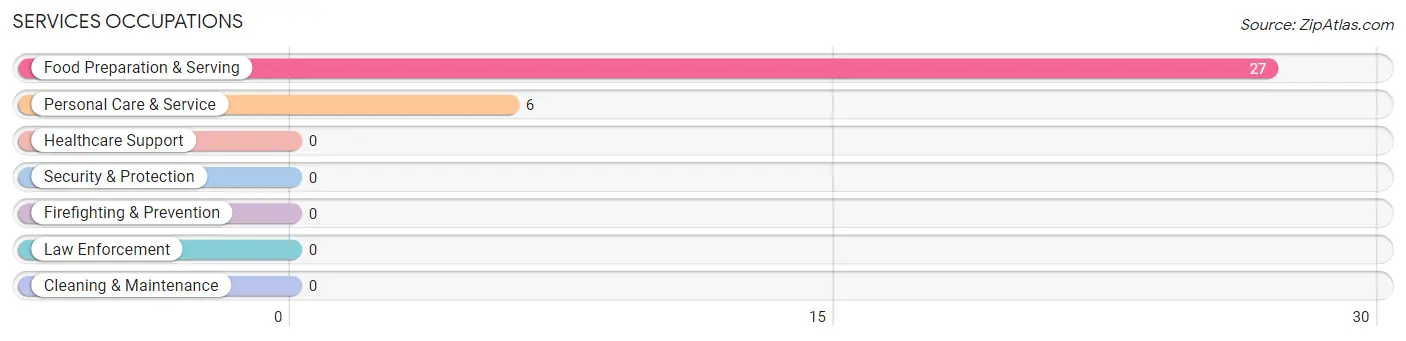
Services Occupations
The most common Services occupations in Medora are Food Preparation & Serving (27 | 36.0%), and Personal Care & Service (6 | 8.0%).
Services Occupations by Sex
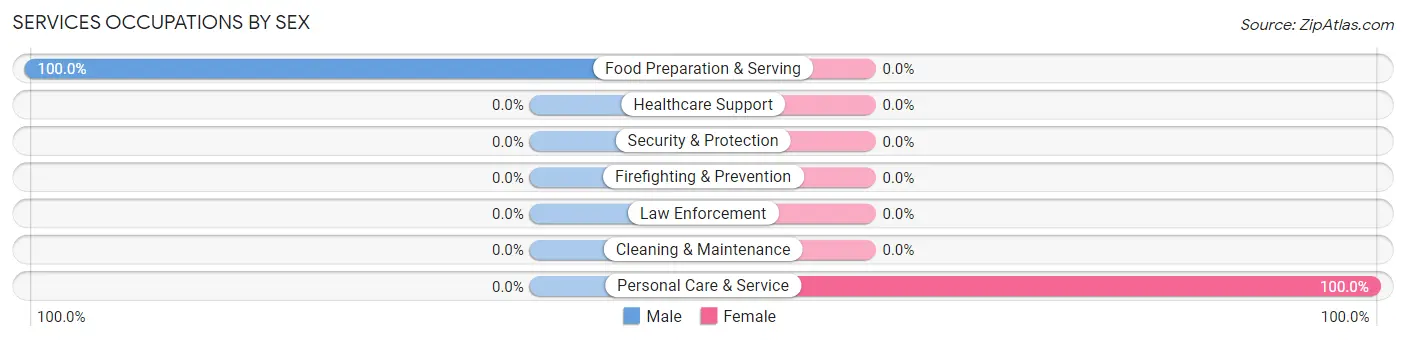
| Occupation | Male | Female |
| Healthcare Support | 0 (0.0%) | 0 (0.0%) |
| Security & Protection | 0 (0.0%) | 0 (0.0%) |
| Firefighting & Prevention | 0 (0.0%) | 0 (0.0%) |
| Law Enforcement | 0 (0.0%) | 0 (0.0%) |
| Food Preparation & Serving | 27 (100.0%) | 0 (0.0%) |
| Cleaning & Maintenance | 0 (0.0%) | 0 (0.0%) |
| Personal Care & Service | 0 (0.0%) | 6 (100.0%) |
| Total (Category) | 27 (81.8%) | 6 (18.2%) |
| Total (Overall) | 49 (65.3%) | 26 (34.7%) |
Sales and Office Occupations
The most common Sales and Office occupations in Medora are Office & Administration (13 | 17.3%), and Sales & Related (8 | 10.7%).

Sales and Office Occupations by Sex

| Occupation | Male | Female |
| Sales & Related | 0 (0.0%) | 8 (100.0%) |
| Office & Administration | 7 (53.8%) | 6 (46.2%) |
| Total (Category) | 7 (33.3%) | 14 (66.7%) |
| Total (Overall) | 49 (65.3%) | 26 (34.7%) |
Natural Resources, Construction and Maintenance Occupations
Natural Resources, Construction and Maintenance Occupations by Sex
| Occupation | Male | Female |
| Farming, Fishing & Forestry | 0 (0.0%) | 0 (0.0%) |
| Construction & Extraction | 0 (0.0%) | 0 (0.0%) |
| Installation, Maintenance & Repair | 0 (0.0%) | 0 (0.0%) |
| Total (Category) | 0 (0.0%) | 0 (0.0%) |
| Total (Overall) | 49 (65.3%) | 26 (34.7%) |
Production, Transportation and Moving Occupations
The most common Production, Transportation and Moving occupations in Medora are , and Production (8 | 10.7%).
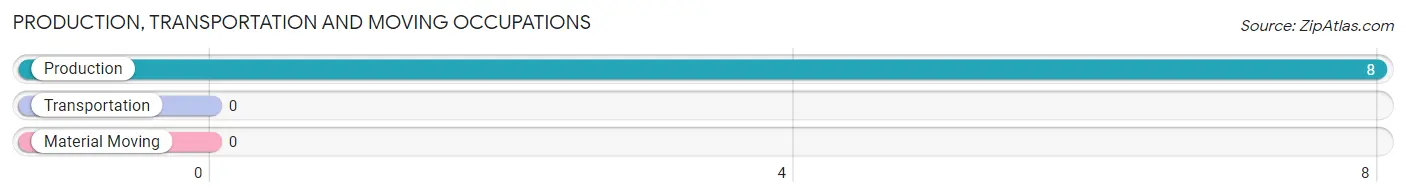
Production, Transportation and Moving Occupations by Sex
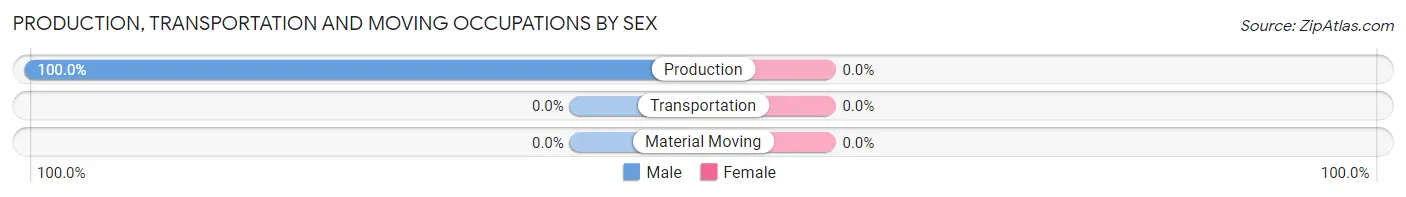
| Occupation | Male | Female |
| Production | 8 (100.0%) | 0 (0.0%) |
| Transportation | 0 (0.0%) | 0 (0.0%) |
| Material Moving | 0 (0.0%) | 0 (0.0%) |
| Total (Category) | 8 (100.0%) | 0 (0.0%) |
| Total (Overall) | 49 (65.3%) | 26 (34.7%) |
Employment Industries by Sex in Medora
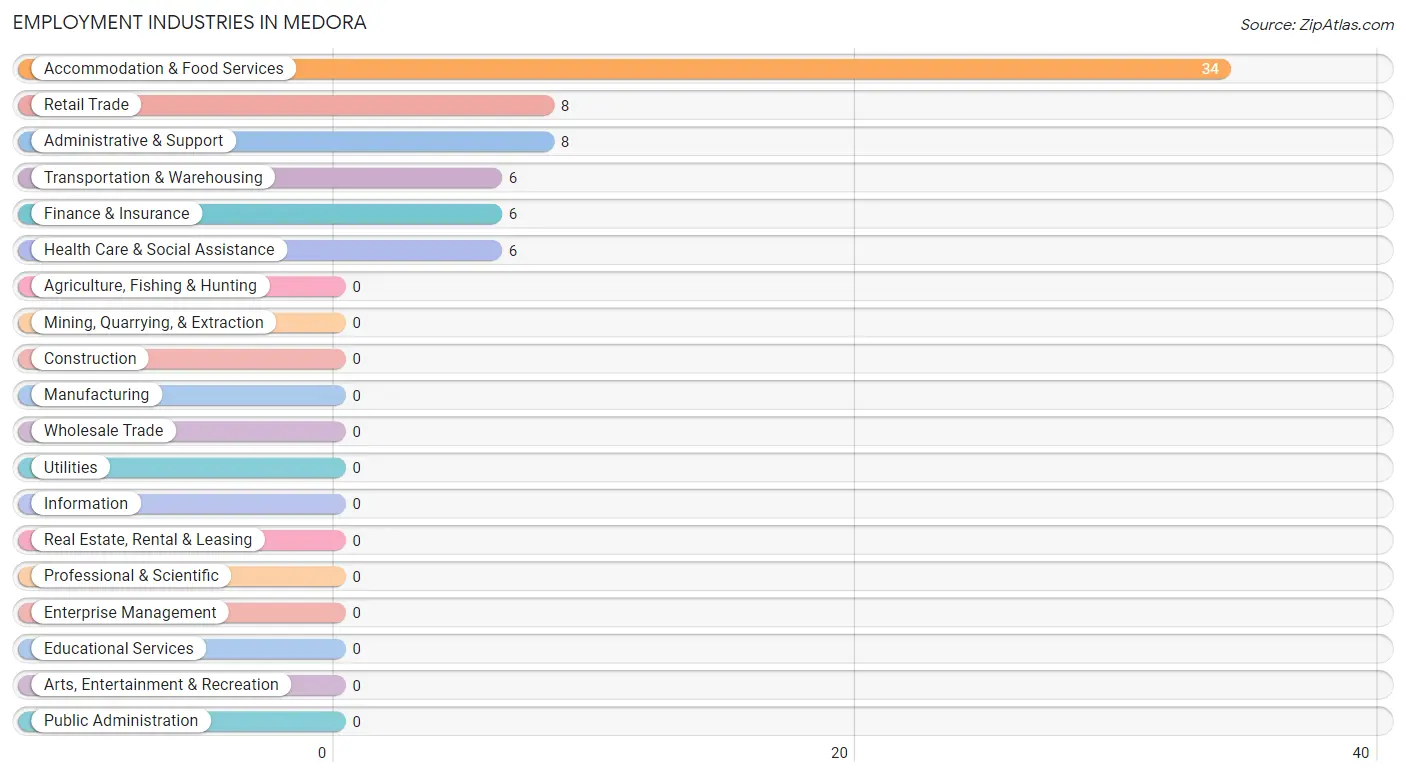
Employment Industries in Medora
The major employment industries in Medora include Accommodation & Food Services (34 | 45.3%), Retail Trade (8 | 10.7%), Administrative & Support (8 | 10.7%), Transportation & Warehousing (6 | 8.0%), and Finance & Insurance (6 | 8.0%).
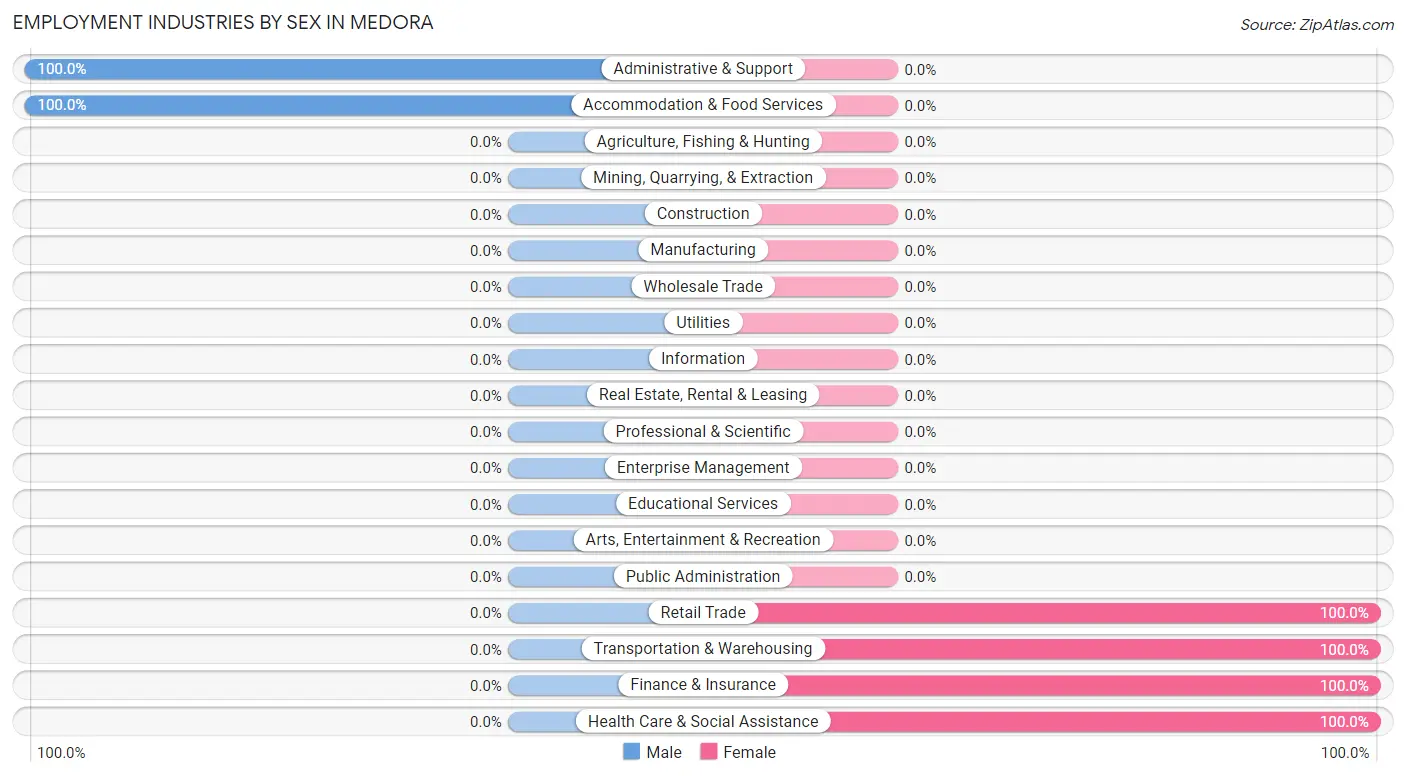
Employment Industries by Sex in Medora
The Medora industries that see more men than women are Administrative & Support (100.0%), and Accommodation & Food Services (100.0%), whereas the industries that tend to have a higher number of women are Retail Trade (100.0%), Transportation & Warehousing (100.0%), and Finance & Insurance (100.0%).
| Industry | Male | Female |
| Agriculture, Fishing & Hunting | 0 (0.0%) | 0 (0.0%) |
| Mining, Quarrying, & Extraction | 0 (0.0%) | 0 (0.0%) |
| Construction | 0 (0.0%) | 0 (0.0%) |
| Manufacturing | 0 (0.0%) | 0 (0.0%) |
| Wholesale Trade | 0 (0.0%) | 0 (0.0%) |
| Retail Trade | 0 (0.0%) | 8 (100.0%) |
| Transportation & Warehousing | 0 (0.0%) | 6 (100.0%) |
| Utilities | 0 (0.0%) | 0 (0.0%) |
| Information | 0 (0.0%) | 0 (0.0%) |
| Finance & Insurance | 0 (0.0%) | 6 (100.0%) |
| Real Estate, Rental & Leasing | 0 (0.0%) | 0 (0.0%) |
| Professional & Scientific | 0 (0.0%) | 0 (0.0%) |
| Enterprise Management | 0 (0.0%) | 0 (0.0%) |
| Administrative & Support | 8 (100.0%) | 0 (0.0%) |
| Educational Services | 0 (0.0%) | 0 (0.0%) |
| Health Care & Social Assistance | 0 (0.0%) | 6 (100.0%) |
| Arts, Entertainment & Recreation | 0 (0.0%) | 0 (0.0%) |
| Accommodation & Food Services | 34 (100.0%) | 0 (0.0%) |
| Public Administration | 0 (0.0%) | 0 (0.0%) |
| Total | 49 (65.3%) | 26 (34.7%) |
Education in Medora
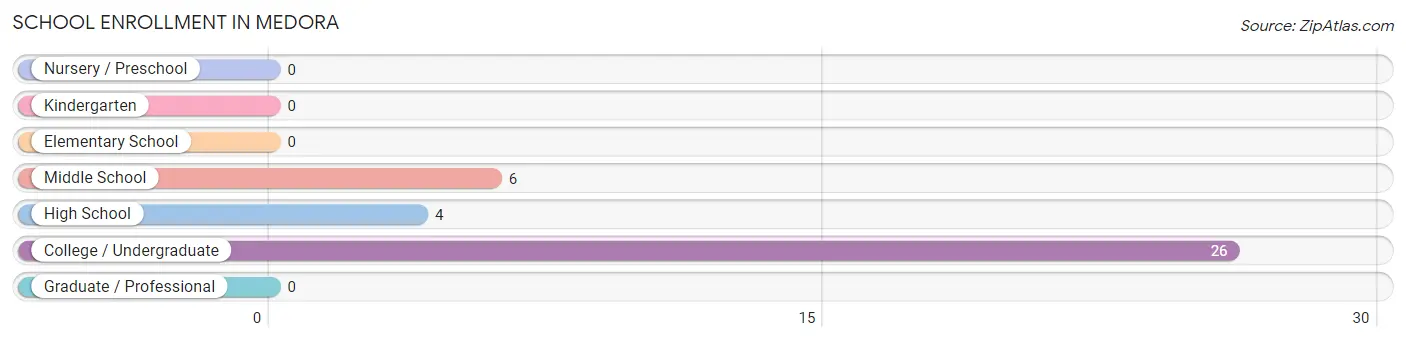
School Enrollment in Medora
The most common levels of schooling among the 36 students in Medora are college / undergraduate (26 | 72.2%), middle school (6 | 16.7%), and high school (4 | 11.1%).
| School Level | # Students | % Students |
| Nursery / Preschool | 0 | 0.0% |
| Kindergarten | 0 | 0.0% |
| Elementary School | 0 | 0.0% |
| Middle School | 6 | 16.7% |
| High School | 4 | 11.1% |
| College / Undergraduate | 26 | 72.2% |
| Graduate / Professional | 0 | 0.0% |
| Total | 36 | 100.0% |
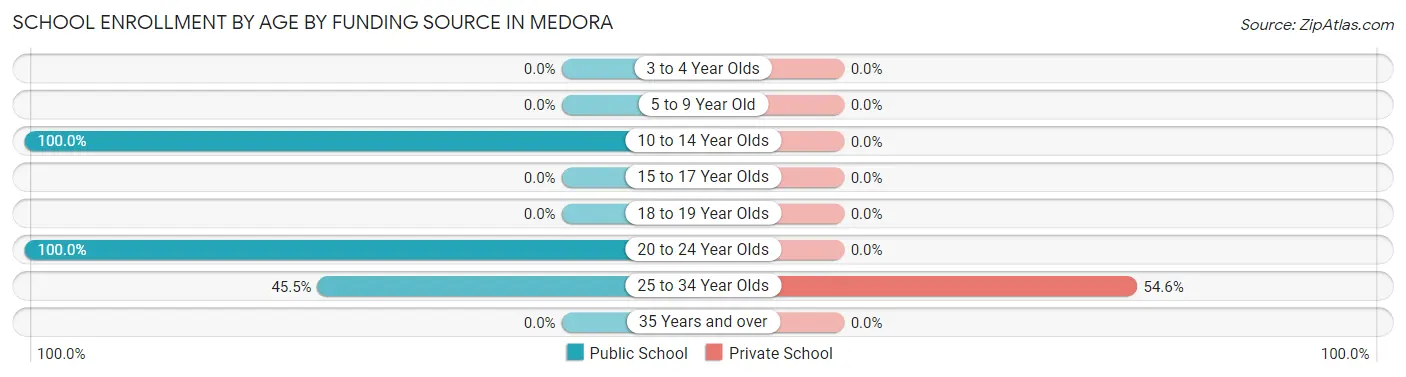
School Enrollment by Age by Funding Source in Medora
Out of a total of 36 students who are enrolled in schools in Medora, 12 (33.3%) attend a private institution, while the remaining 24 (66.7%) are enrolled in public schools. The age group of 25 to 34 year olds has the highest likelihood of being enrolled in private schools, with 12 (54.5% in the age bracket) enrolled. Conversely, the age group of 10 to 14 year olds has the lowest likelihood of being enrolled in a private school, with 10 (100.0% in the age bracket) attending a public institution.
| Age Bracket | Public School | Private School |
| 3 to 4 Year Olds | 0 (0.0%) | 0 (0.0%) |
| 5 to 9 Year Old | 0 (0.0%) | 0 (0.0%) |
| 10 to 14 Year Olds | 10 (100.0%) | 0 (0.0%) |
| 15 to 17 Year Olds | 0 (0.0%) | 0 (0.0%) |
| 18 to 19 Year Olds | 0 (0.0%) | 0 (0.0%) |
| 20 to 24 Year Olds | 4 (100.0%) | 0 (0.0%) |
| 25 to 34 Year Olds | 10 (45.5%) | 12 (54.5%) |
| 35 Years and over | 0 (0.0%) | 0 (0.0%) |
| Total | 24 (66.7%) | 12 (33.3%) |
Educational Attainment by Field of Study in Medora
Psychology (11 | 31.4%), literature & languages (11 | 31.4%), business (6 | 17.1%), communications (4 | 11.4%), and education (3 | 8.6%) are the most common fields of study among 35 individuals in Medora who have obtained a bachelor's degree or higher.
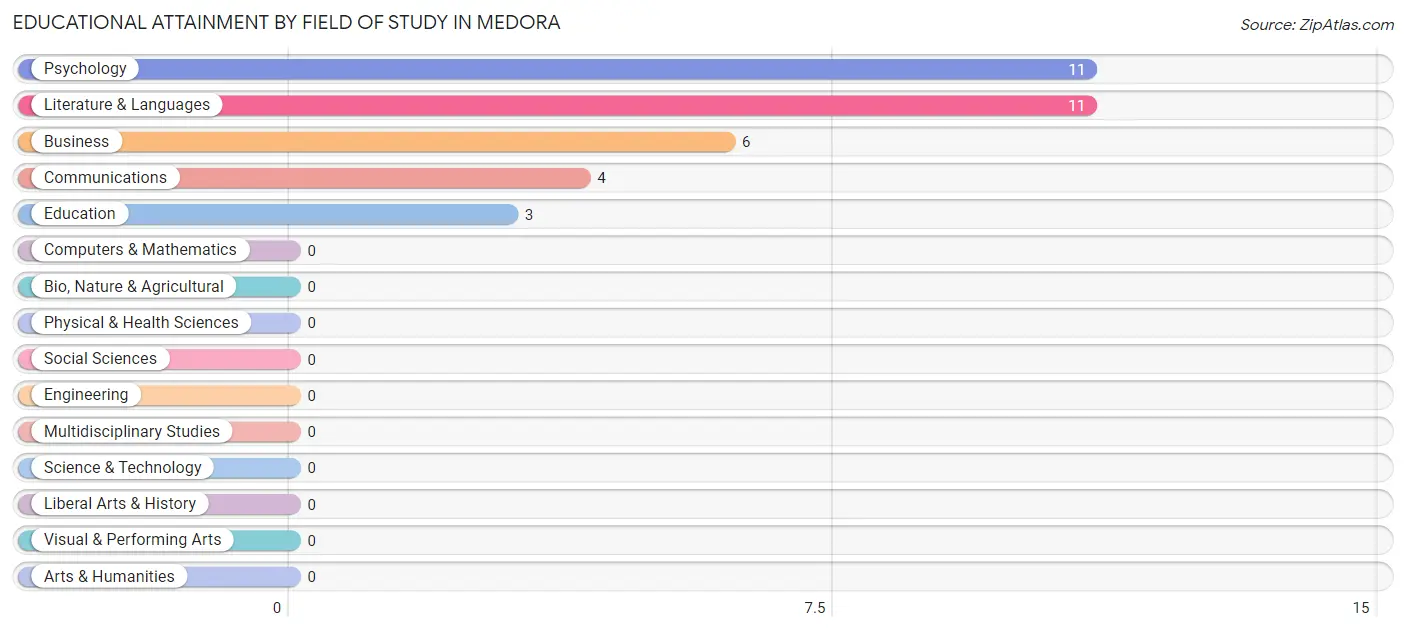
| Field of Study | # Graduates | % Graduates |
| Computers & Mathematics | 0 | 0.0% |
| Bio, Nature & Agricultural | 0 | 0.0% |
| Physical & Health Sciences | 0 | 0.0% |
| Psychology | 11 | 31.4% |
| Social Sciences | 0 | 0.0% |
| Engineering | 0 | 0.0% |
| Multidisciplinary Studies | 0 | 0.0% |
| Science & Technology | 0 | 0.0% |
| Business | 6 | 17.1% |
| Education | 3 | 8.6% |
| Literature & Languages | 11 | 31.4% |
| Liberal Arts & History | 0 | 0.0% |
| Visual & Performing Arts | 0 | 0.0% |
| Communications | 4 | 11.4% |
| Arts & Humanities | 0 | 0.0% |
| Total | 35 | 100.0% |
Transportation & Commute in Medora
Vehicle Availability by Sex in Medora
The most prevalent vehicle ownership categories in Medora are males with 2 vehicles (28, accounting for 57.1%) and females with 2 vehicles (12, making up 140.0%).
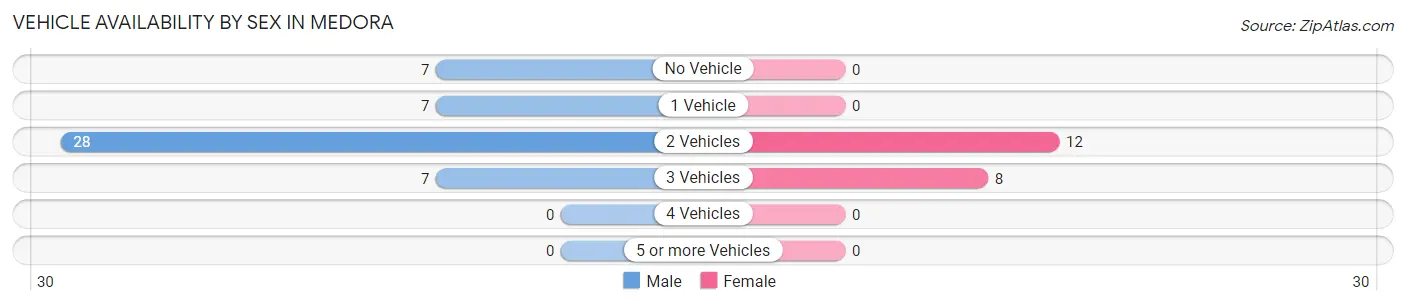
| Vehicles Available | Male | Female |
| No Vehicle | 7 (14.3%) | 0 (0.0%) |
| 1 Vehicle | 7 (14.3%) | 0 (0.0%) |
| 2 Vehicles | 28 (57.1%) | 12 (60.0%) |
| 3 Vehicles | 7 (14.3%) | 8 (40.0%) |
| 4 Vehicles | 0 (0.0%) | 0 (0.0%) |
| 5 or more Vehicles | 0 (0.0%) | 0 (0.0%) |
| Total | 49 (100.0%) | 20 (100.0%) |
Commute Time in Medora
The most frequently occuring commute durations in Medora are less than 5 minutes (36 commuters, 53.7%), 5 to 9 minutes (22 commuters, 32.8%), and 30 to 34 minutes (6 commuters, 9.0%).
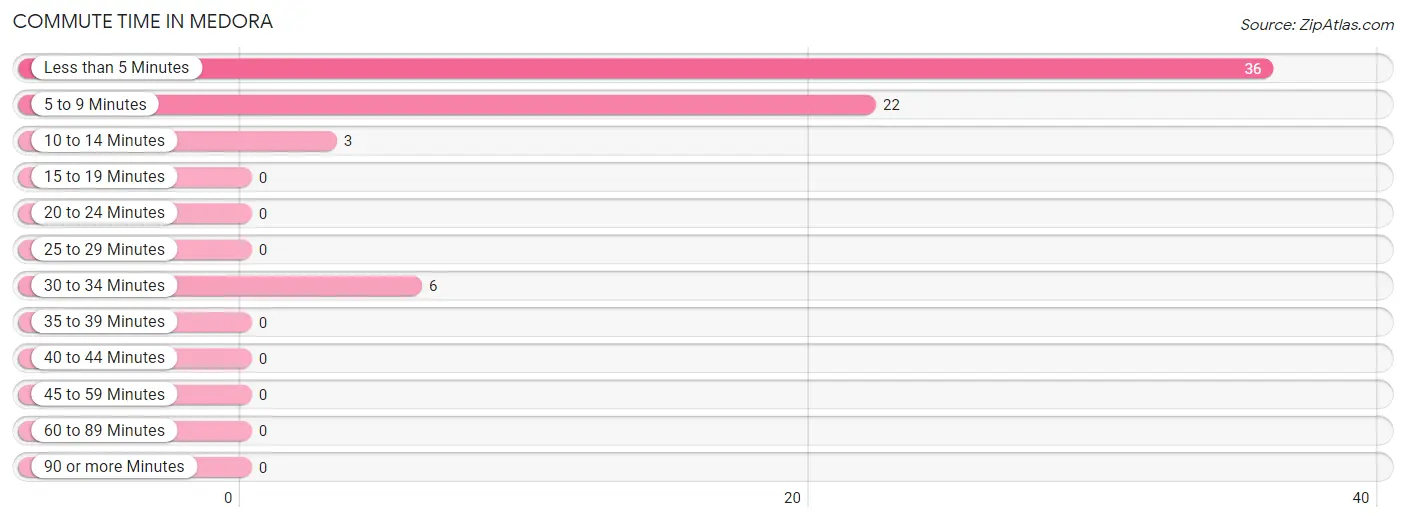
| Commute Time | # Commuters | % Commuters |
| Less than 5 Minutes | 36 | 53.7% |
| 5 to 9 Minutes | 22 | 32.8% |
| 10 to 14 Minutes | 3 | 4.5% |
| 15 to 19 Minutes | 0 | 0.0% |
| 20 to 24 Minutes | 0 | 0.0% |
| 25 to 29 Minutes | 0 | 0.0% |
| 30 to 34 Minutes | 6 | 9.0% |
| 35 to 39 Minutes | 0 | 0.0% |
| 40 to 44 Minutes | 0 | 0.0% |
| 45 to 59 Minutes | 0 | 0.0% |
| 60 to 89 Minutes | 0 | 0.0% |
| 90 or more Minutes | 0 | 0.0% |
Commute Time by Sex in Medora
The most common commute times in Medora are less than 5 minutes (24 commuters, 58.5%) for males and less than 5 minutes (12 commuters, 46.2%) for females.
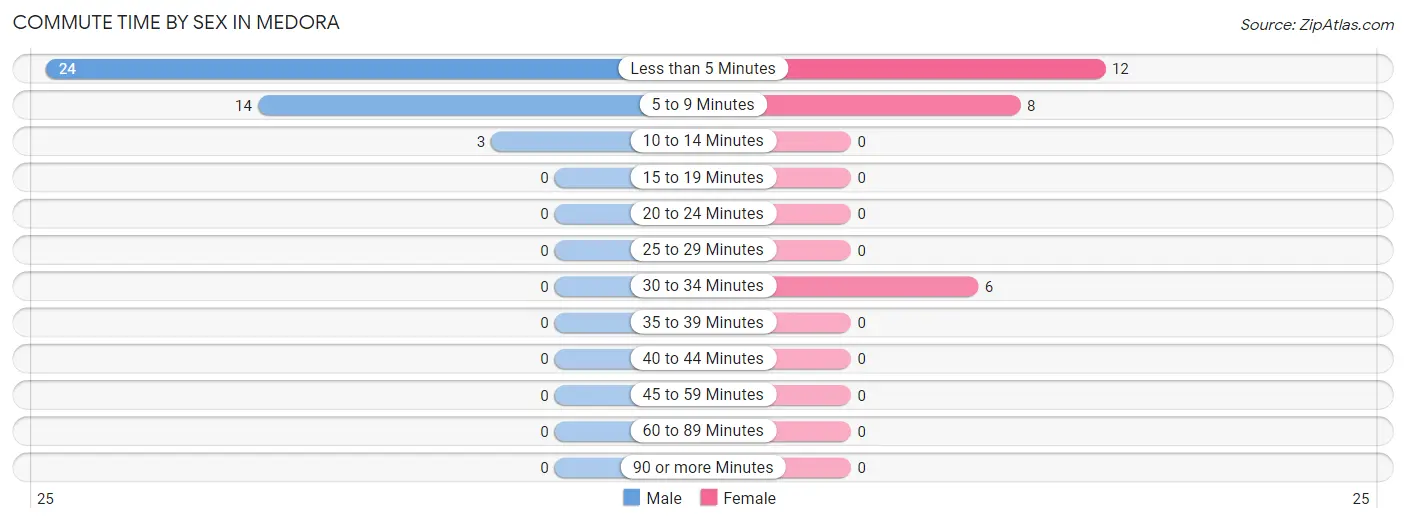
| Commute Time | Male | Female |
| Less than 5 Minutes | 24 (58.5%) | 12 (46.2%) |
| 5 to 9 Minutes | 14 (34.2%) | 8 (30.8%) |
| 10 to 14 Minutes | 3 (7.3%) | 0 (0.0%) |
| 15 to 19 Minutes | 0 (0.0%) | 0 (0.0%) |
| 20 to 24 Minutes | 0 (0.0%) | 0 (0.0%) |
| 25 to 29 Minutes | 0 (0.0%) | 0 (0.0%) |
| 30 to 34 Minutes | 0 (0.0%) | 6 (23.1%) |
| 35 to 39 Minutes | 0 (0.0%) | 0 (0.0%) |
| 40 to 44 Minutes | 0 (0.0%) | 0 (0.0%) |
| 45 to 59 Minutes | 0 (0.0%) | 0 (0.0%) |
| 60 to 89 Minutes | 0 (0.0%) | 0 (0.0%) |
| 90 or more Minutes | 0 (0.0%) | 0 (0.0%) |
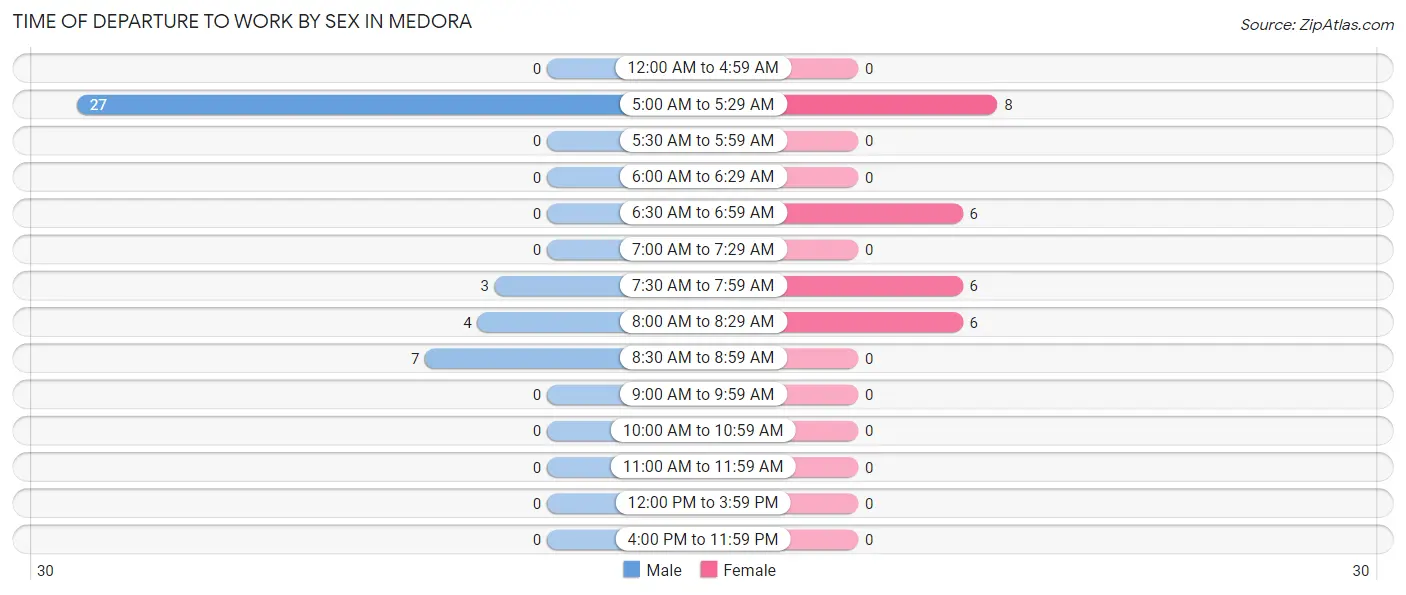
Time of Departure to Work by Sex in Medora
The most frequent times of departure to work in Medora are 5:00 AM to 5:29 AM (27, 65.8%) for males and 5:00 AM to 5:29 AM (8, 30.8%) for females.
| Time of Departure | Male | Female |
| 12:00 AM to 4:59 AM | 0 (0.0%) | 0 (0.0%) |
| 5:00 AM to 5:29 AM | 27 (65.8%) | 8 (30.8%) |
| 5:30 AM to 5:59 AM | 0 (0.0%) | 0 (0.0%) |
| 6:00 AM to 6:29 AM | 0 (0.0%) | 0 (0.0%) |
| 6:30 AM to 6:59 AM | 0 (0.0%) | 6 (23.1%) |
| 7:00 AM to 7:29 AM | 0 (0.0%) | 0 (0.0%) |
| 7:30 AM to 7:59 AM | 3 (7.3%) | 6 (23.1%) |
| 8:00 AM to 8:29 AM | 4 (9.8%) | 6 (23.1%) |
| 8:30 AM to 8:59 AM | 7 (17.1%) | 0 (0.0%) |
| 9:00 AM to 9:59 AM | 0 (0.0%) | 0 (0.0%) |
| 10:00 AM to 10:59 AM | 0 (0.0%) | 0 (0.0%) |
| 11:00 AM to 11:59 AM | 0 (0.0%) | 0 (0.0%) |
| 12:00 PM to 3:59 PM | 0 (0.0%) | 0 (0.0%) |
| 4:00 PM to 11:59 PM | 0 (0.0%) | 0 (0.0%) |
| Total | 41 (100.0%) | 26 (100.0%) |
Housing Occupancy in Medora
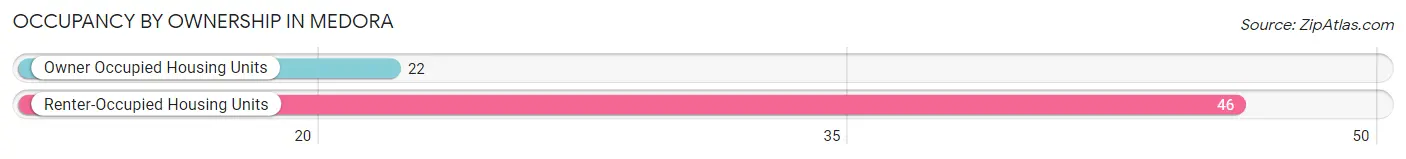
Occupancy by Ownership in Medora
Of the total 68 dwellings in Medora, owner-occupied units account for 22 (32.4%), while renter-occupied units make up 46 (67.6%).
| Occupancy | # Housing Units | % Housing Units |
| Owner Occupied Housing Units | 22 | 32.4% |
| Renter-Occupied Housing Units | 46 | 67.6% |
| Total Occupied Housing Units | 68 | 100.0% |
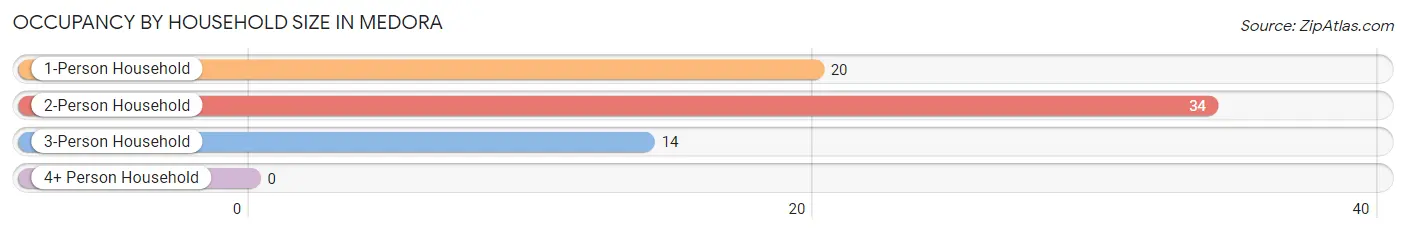
Occupancy by Household Size in Medora
| Household Size | # Housing Units | % Housing Units |
| 1-Person Household | 20 | 29.4% |
| 2-Person Household | 34 | 50.0% |
| 3-Person Household | 14 | 20.6% |
| 4+ Person Household | 0 | 0.0% |
| Total Housing Units | 68 | 100.0% |
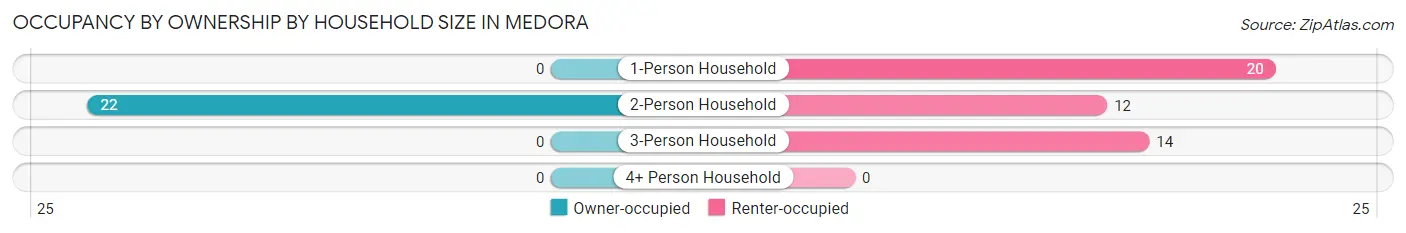
Occupancy by Ownership by Household Size in Medora
| Household Size | Owner-occupied | Renter-occupied |
| 1-Person Household | 0 (0.0%) | 20 (100.0%) |
| 2-Person Household | 22 (64.7%) | 12 (35.3%) |
| 3-Person Household | 0 (0.0%) | 14 (100.0%) |
| 4+ Person Household | 0 (0.0%) | 0 (0.0%) |
| Total Housing Units | 22 (32.4%) | 46 (67.6%) |
Occupancy by Educational Attainment in Medora
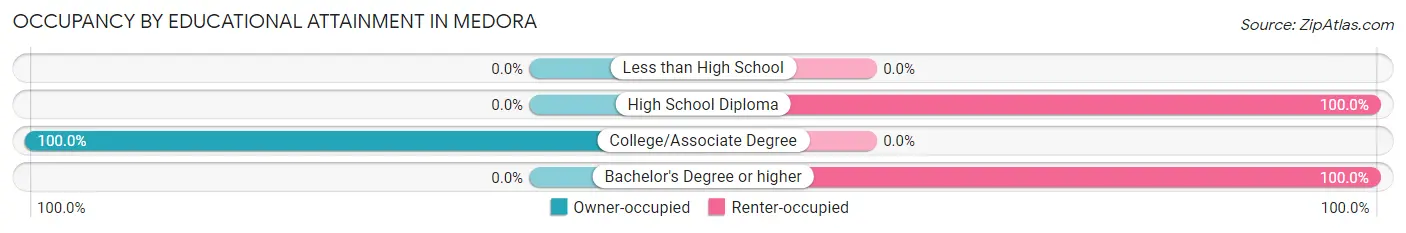
| Household Size | Owner-occupied | Renter-occupied |
| Less than High School | 0 (0.0%) | 0 (0.0%) |
| High School Diploma | 0 (0.0%) | 33 (100.0%) |
| College/Associate Degree | 22 (100.0%) | 0 (0.0%) |
| Bachelor's Degree or higher | 0 (0.0%) | 13 (100.0%) |
Occupancy by Age of Householder in Medora
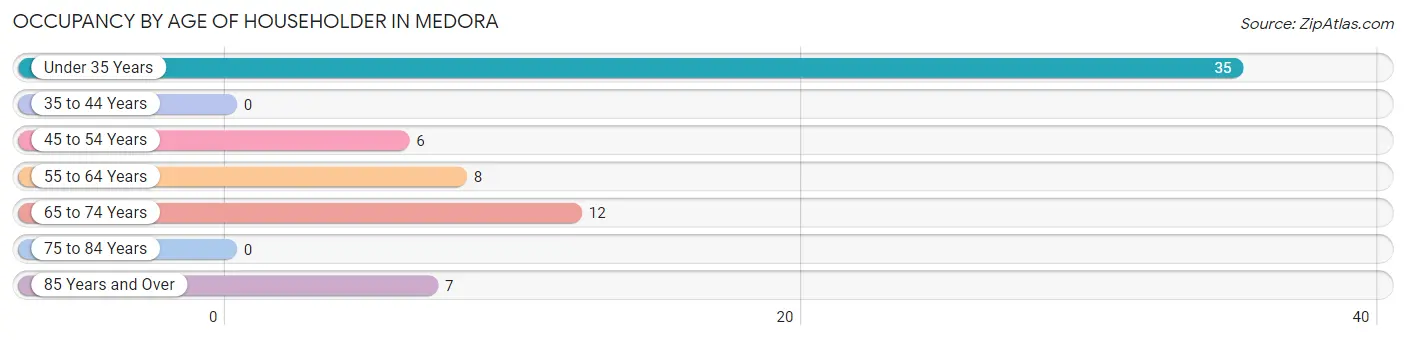
| Age Bracket | # Households | % Households |
| Under 35 Years | 35 | 51.5% |
| 35 to 44 Years | 0 | 0.0% |
| 45 to 54 Years | 6 | 8.8% |
| 55 to 64 Years | 8 | 11.8% |
| 65 to 74 Years | 12 | 17.6% |
| 75 to 84 Years | 0 | 0.0% |
| 85 Years and Over | 7 | 10.3% |
| Total | 68 | 100.0% |
Housing Finances in Medora
Median Income by Occupancy in Medora
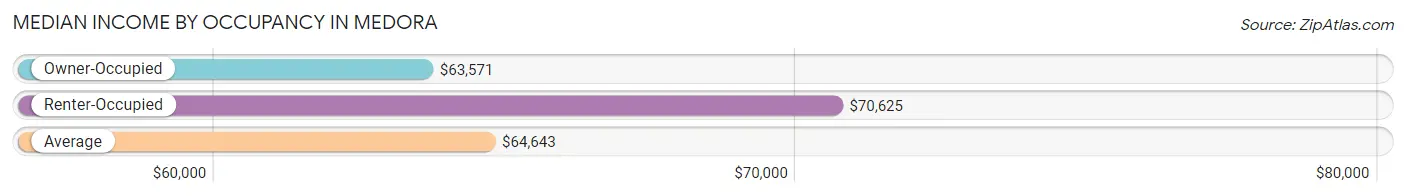
| Occupancy Type | # Households | Median Income |
| Owner-Occupied | 22 (32.4%) | $63,571 |
| Renter-Occupied | 46 (67.6%) | $70,625 |
| Average | 68 (100.0%) | $64,643 |
Occupancy by Householder Income Bracket in Medora
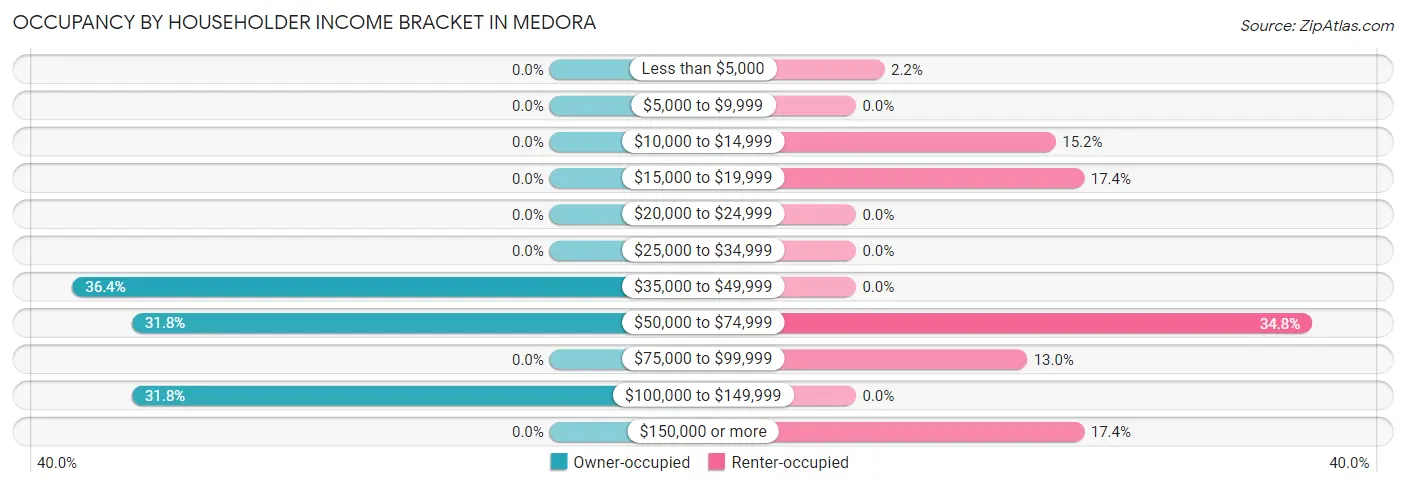
| Income Bracket | Owner-occupied | Renter-occupied |
| Less than $5,000 | 0 (0.0%) | 1 (2.2%) |
| $5,000 to $9,999 | 0 (0.0%) | 0 (0.0%) |
| $10,000 to $14,999 | 0 (0.0%) | 7 (15.2%) |
| $15,000 to $19,999 | 0 (0.0%) | 8 (17.4%) |
| $20,000 to $24,999 | 0 (0.0%) | 0 (0.0%) |
| $25,000 to $34,999 | 0 (0.0%) | 0 (0.0%) |
| $35,000 to $49,999 | 8 (36.4%) | 0 (0.0%) |
| $50,000 to $74,999 | 7 (31.8%) | 16 (34.8%) |
| $75,000 to $99,999 | 0 (0.0%) | 6 (13.0%) |
| $100,000 to $149,999 | 7 (31.8%) | 0 (0.0%) |
| $150,000 or more | 0 (0.0%) | 8 (17.4%) |
| Total | 22 (100.0%) | 46 (100.0%) |
Monthly Housing Cost Tiers in Medora
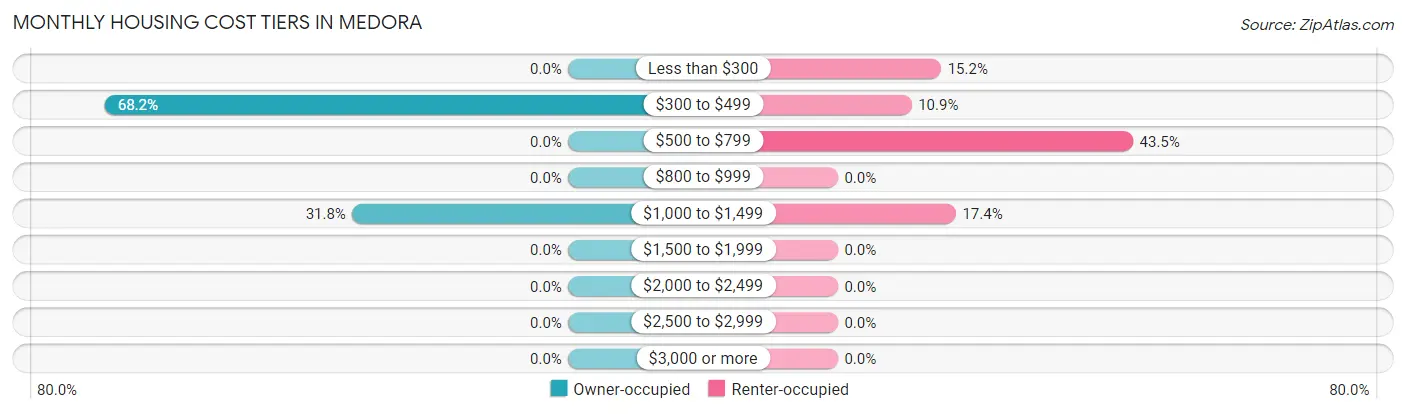
| Monthly Cost | Owner-occupied | Renter-occupied |
| Less than $300 | 0 (0.0%) | 7 (15.2%) |
| $300 to $499 | 15 (68.2%) | 5 (10.9%) |
| $500 to $799 | 0 (0.0%) | 20 (43.5%) |
| $800 to $999 | 0 (0.0%) | 0 (0.0%) |
| $1,000 to $1,499 | 7 (31.8%) | 8 (17.4%) |
| $1,500 to $1,999 | 0 (0.0%) | 0 (0.0%) |
| $2,000 to $2,499 | 0 (0.0%) | 0 (0.0%) |
| $2,500 to $2,999 | 0 (0.0%) | 0 (0.0%) |
| $3,000 or more | 0 (0.0%) | 0 (0.0%) |
| Total | 22 (100.0%) | 46 (100.0%) |
Physical Housing Characteristics in Medora
Housing Structures in Medora
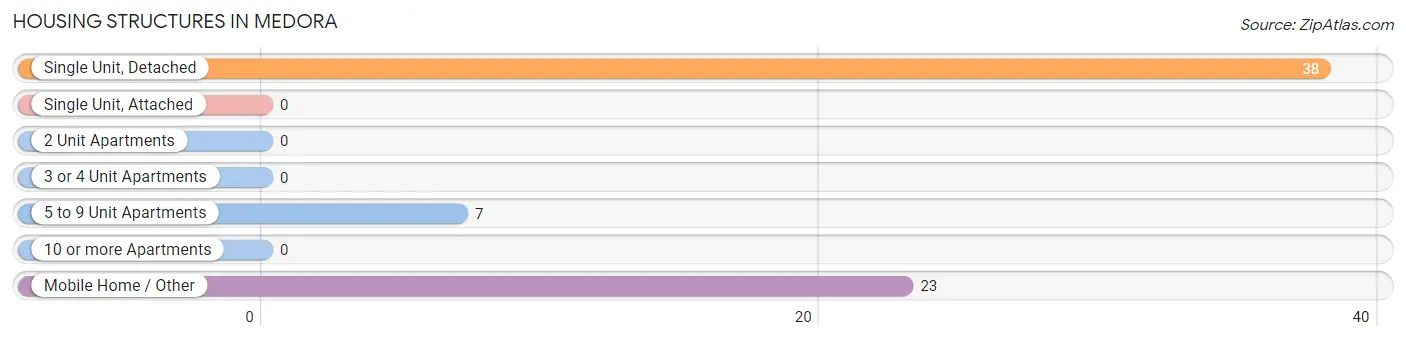
| Structure Type | # Housing Units | % Housing Units |
| Single Unit, Detached | 38 | 55.9% |
| Single Unit, Attached | 0 | 0.0% |
| 2 Unit Apartments | 0 | 0.0% |
| 3 or 4 Unit Apartments | 0 | 0.0% |
| 5 to 9 Unit Apartments | 7 | 10.3% |
| 10 or more Apartments | 0 | 0.0% |
| Mobile Home / Other | 23 | 33.8% |
| Total | 68 | 100.0% |
Housing Structures by Occupancy in Medora
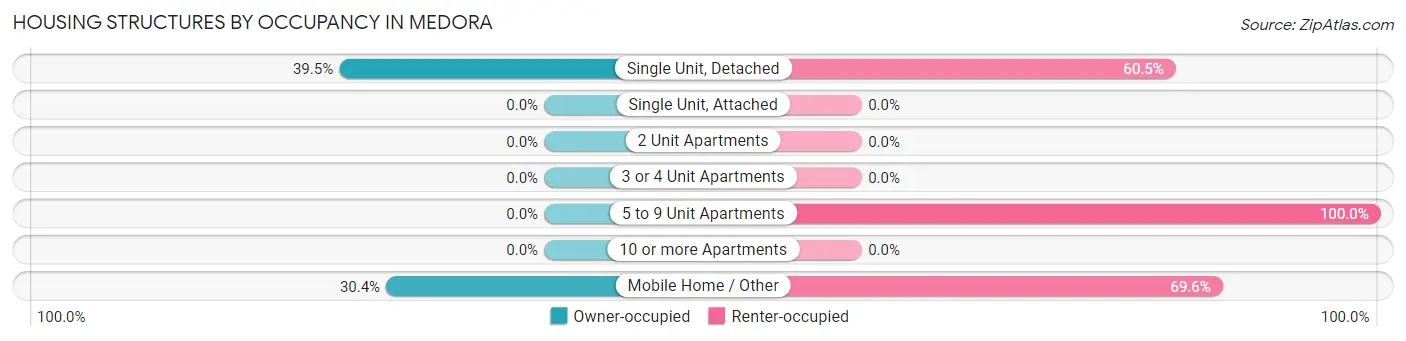
| Structure Type | Owner-occupied | Renter-occupied |
| Single Unit, Detached | 15 (39.5%) | 23 (60.5%) |
| Single Unit, Attached | 0 (0.0%) | 0 (0.0%) |
| 2 Unit Apartments | 0 (0.0%) | 0 (0.0%) |
| 3 or 4 Unit Apartments | 0 (0.0%) | 0 (0.0%) |
| 5 to 9 Unit Apartments | 0 (0.0%) | 7 (100.0%) |
| 10 or more Apartments | 0 (0.0%) | 0 (0.0%) |
| Mobile Home / Other | 7 (30.4%) | 16 (69.6%) |
| Total | 22 (32.4%) | 46 (67.6%) |
Housing Structures by Number of Rooms in Medora
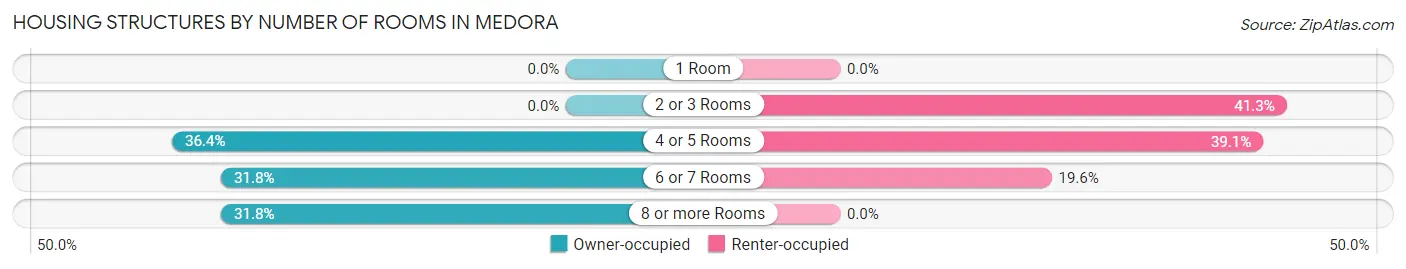
| Number of Rooms | Owner-occupied | Renter-occupied |
| 1 Room | 0 (0.0%) | 0 (0.0%) |
| 2 or 3 Rooms | 0 (0.0%) | 19 (41.3%) |
| 4 or 5 Rooms | 8 (36.4%) | 18 (39.1%) |
| 6 or 7 Rooms | 7 (31.8%) | 9 (19.6%) |
| 8 or more Rooms | 7 (31.8%) | 0 (0.0%) |
| Total | 22 (100.0%) | 46 (100.0%) |
Housing Structure by Heating Type in Medora
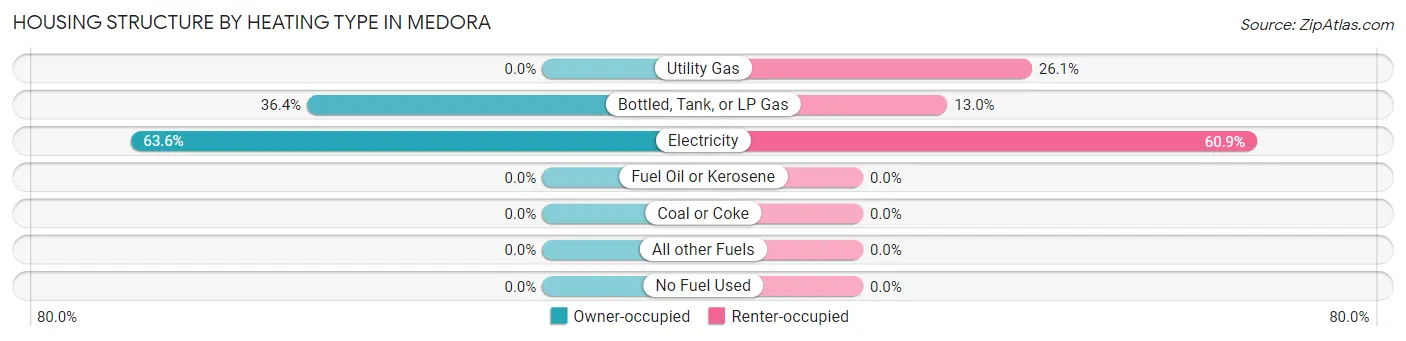
| Heating Type | Owner-occupied | Renter-occupied |
| Utility Gas | 0 (0.0%) | 12 (26.1%) |
| Bottled, Tank, or LP Gas | 8 (36.4%) | 6 (13.0%) |
| Electricity | 14 (63.6%) | 28 (60.9%) |
| Fuel Oil or Kerosene | 0 (0.0%) | 0 (0.0%) |
| Coal or Coke | 0 (0.0%) | 0 (0.0%) |
| All other Fuels | 0 (0.0%) | 0 (0.0%) |
| No Fuel Used | 0 (0.0%) | 0 (0.0%) |
| Total | 22 (100.0%) | 46 (100.0%) |
Household Vehicle Usage in Medora
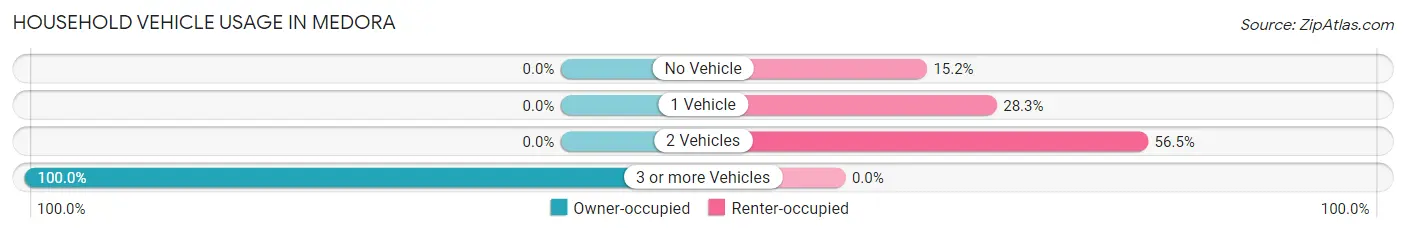
| Vehicles per Household | Owner-occupied | Renter-occupied |
| No Vehicle | 0 (0.0%) | 7 (15.2%) |
| 1 Vehicle | 0 (0.0%) | 13 (28.3%) |
| 2 Vehicles | 0 (0.0%) | 26 (56.5%) |
| 3 or more Vehicles | 22 (100.0%) | 0 (0.0%) |
| Total | 22 (100.0%) | 46 (100.0%) |
Real Estate & Mortgages in Medora
Real Estate and Mortgage Overview in Medora
| Characteristic | Without Mortgage | With Mortgage |
| Housing Units | 22 | 0 |
| Median Property Value | - | - |
| Median Household Income | $63,571 | $0 |
| Monthly Housing Costs | - | - |
| Real Estate Taxes | - | - |
Property Value by Mortgage Status in Medora
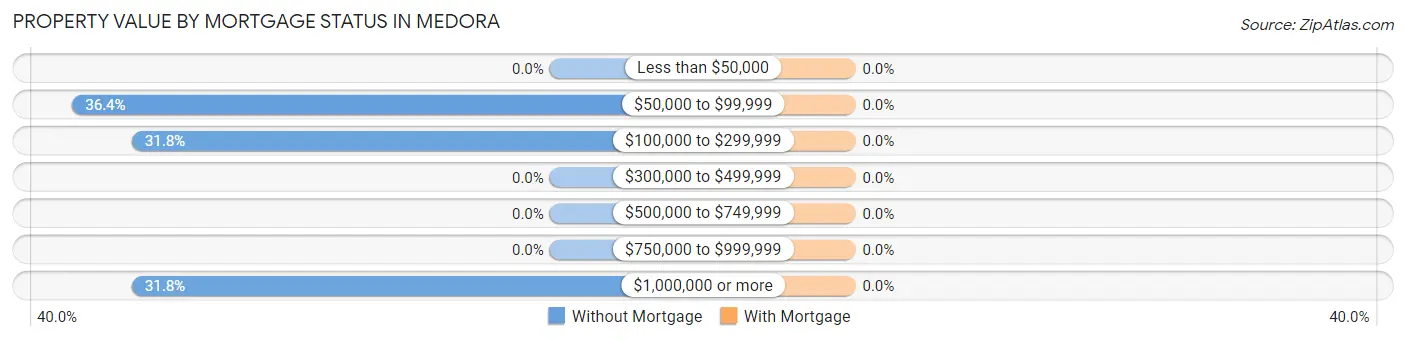
| Property Value | Without Mortgage | With Mortgage |
| Less than $50,000 | 0 (0.0%) | 0 (0.0%) |
| $50,000 to $99,999 | 8 (36.4%) | 0 (0.0%) |
| $100,000 to $299,999 | 7 (31.8%) | 0 (0.0%) |
| $300,000 to $499,999 | 0 (0.0%) | 0 (0.0%) |
| $500,000 to $749,999 | 0 (0.0%) | 0 (0.0%) |
| $750,000 to $999,999 | 0 (0.0%) | 0 (0.0%) |
| $1,000,000 or more | 7 (31.8%) | 0 (0.0%) |
| Total | 22 (100.0%) | 0 (0.0%) |
Household Income by Mortgage Status in Medora
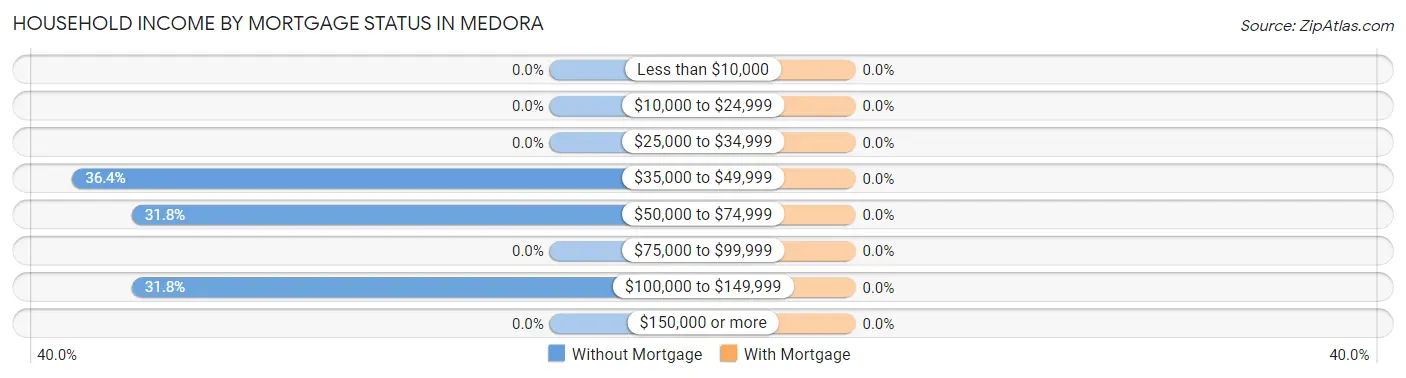
| Household Income | Without Mortgage | With Mortgage |
| Less than $10,000 | 0 (0.0%) | 0 (0.0%) |
| $10,000 to $24,999 | 0 (0.0%) | 0 (0.0%) |
| $25,000 to $34,999 | 0 (0.0%) | 0 (0.0%) |
| $35,000 to $49,999 | 8 (36.4%) | 0 (0.0%) |
| $50,000 to $74,999 | 7 (31.8%) | 0 (0.0%) |
| $75,000 to $99,999 | 0 (0.0%) | 0 (0.0%) |
| $100,000 to $149,999 | 7 (31.8%) | 0 (0.0%) |
| $150,000 or more | 0 (0.0%) | 0 (0.0%) |
| Total | 22 (100.0%) | 0 (0.0%) |
Property Value to Household Income Ratio in Medora
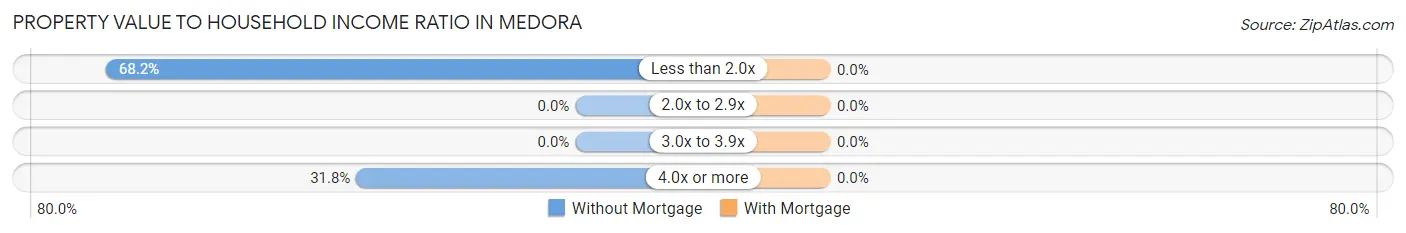
| Value-to-Income Ratio | Without Mortgage | With Mortgage |
| Less than 2.0x | 15 (68.2%) | 0 (0.0%) |
| 2.0x to 2.9x | 0 (0.0%) | 0 (0.0%) |
| 3.0x to 3.9x | 0 (0.0%) | 0 (0.0%) |
| 4.0x or more | 7 (31.8%) | 0 (0.0%) |
| Total | 22 (100.0%) | 0 (0.0%) |
Real Estate Taxes by Mortgage Status in Medora
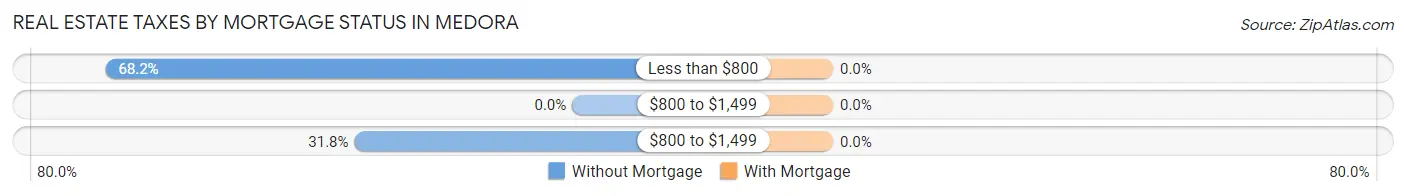
| Property Taxes | Without Mortgage | With Mortgage |
| Less than $800 | 15 (68.2%) | 0 (0.0%) |
| $800 to $1,499 | 0 (0.0%) | 0 (0.0%) |
| $800 to $1,499 | 7 (31.8%) | 0 (0.0%) |
| Total | 22 (100.0%) | 0 (0.0%) |
Health & Disability in Medora
Health Insurance Coverage by Age in Medora
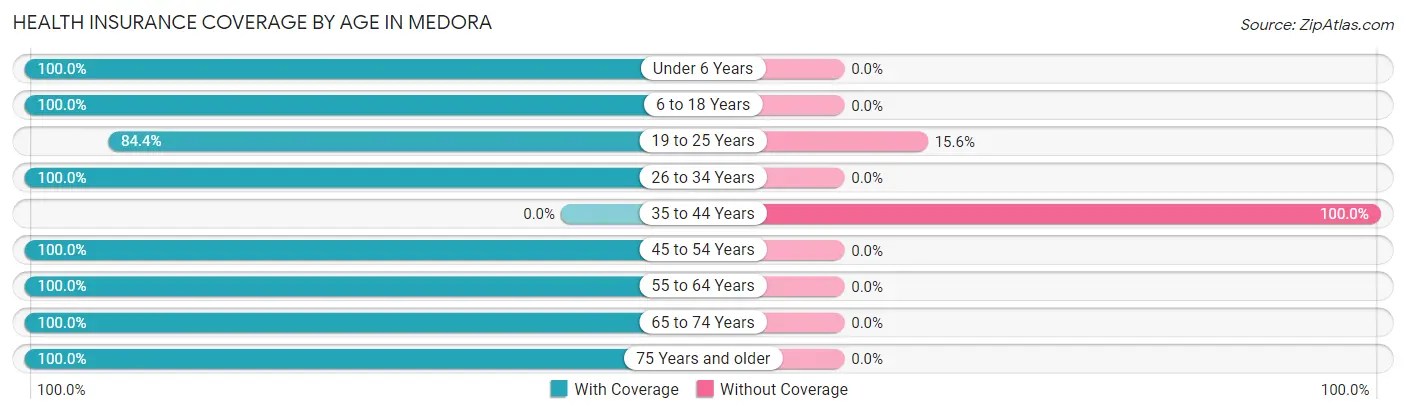
| Age Bracket | With Coverage | Without Coverage |
| Under 6 Years | 7 (100.0%) | 0 (0.0%) |
| 6 to 18 Years | 10 (100.0%) | 0 (0.0%) |
| 19 to 25 Years | 38 (84.4%) | 7 (15.6%) |
| 26 to 34 Years | 10 (100.0%) | 0 (0.0%) |
| 35 to 44 Years | 0 (0.0%) | 4 (100.0%) |
| 45 to 54 Years | 6 (100.0%) | 0 (0.0%) |
| 55 to 64 Years | 8 (100.0%) | 0 (0.0%) |
| 65 to 74 Years | 44 (100.0%) | 0 (0.0%) |
| 75 Years and older | 17 (100.0%) | 0 (0.0%) |
| Total | 140 (92.7%) | 11 (7.3%) |
Health Insurance Coverage by Citizenship Status in Medora

| Citizenship Status | With Coverage | Without Coverage |
| Native Born | 7 (100.0%) | 0 (0.0%) |
| Foreign Born, Citizen | 10 (100.0%) | 0 (0.0%) |
| Foreign Born, not a Citizen | 38 (84.4%) | 7 (15.6%) |
Health Insurance Coverage by Household Income in Medora
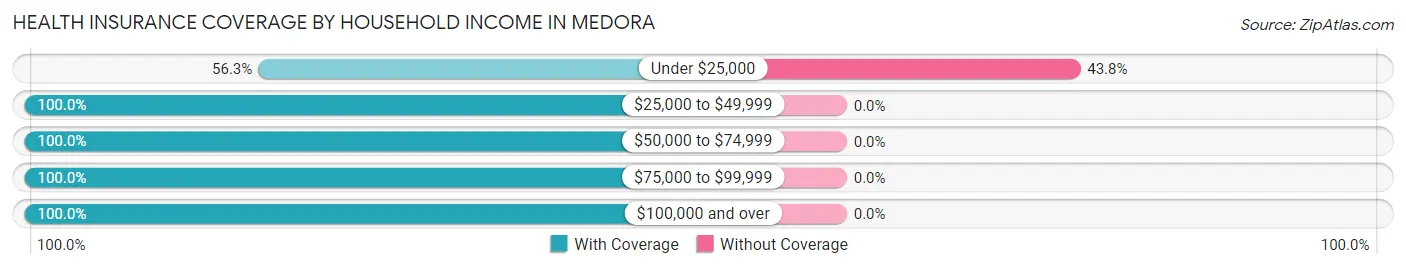
| Household Income | With Coverage | Without Coverage |
| Under $25,000 | 9 (56.2%) | 7 (43.8%) |
| $25,000 to $49,999 | 15 (100.0%) | 0 (0.0%) |
| $50,000 to $74,999 | 45 (100.0%) | 0 (0.0%) |
| $75,000 to $99,999 | 16 (100.0%) | 0 (0.0%) |
| $100,000 and over | 34 (100.0%) | 0 (0.0%) |
Public vs Private Health Insurance Coverage by Age in Medora
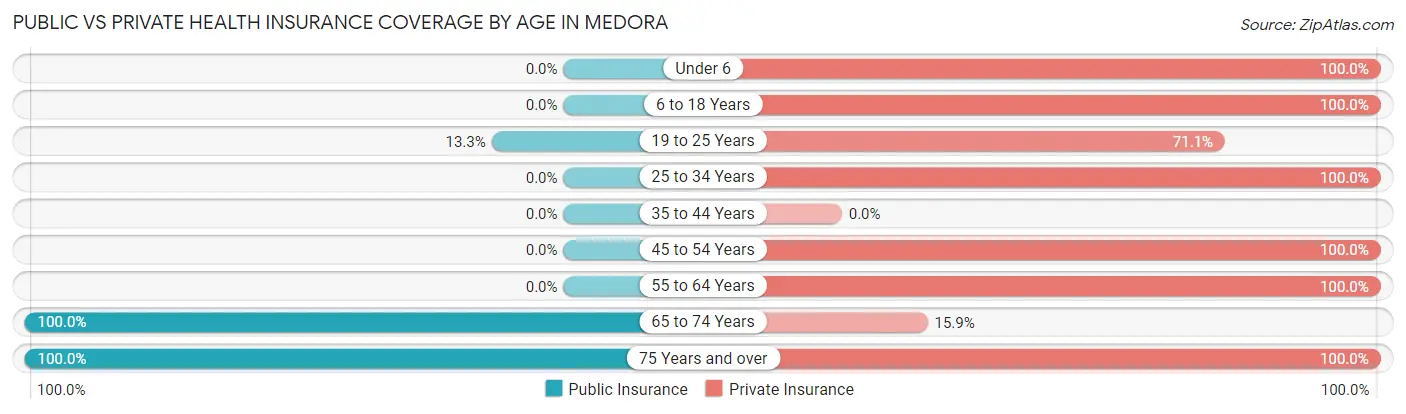
| Age Bracket | Public Insurance | Private Insurance |
| Under 6 | 0 (0.0%) | 7 (100.0%) |
| 6 to 18 Years | 0 (0.0%) | 10 (100.0%) |
| 19 to 25 Years | 6 (13.3%) | 32 (71.1%) |
| 25 to 34 Years | 0 (0.0%) | 10 (100.0%) |
| 35 to 44 Years | 0 (0.0%) | 0 (0.0%) |
| 45 to 54 Years | 0 (0.0%) | 6 (100.0%) |
| 55 to 64 Years | 0 (0.0%) | 8 (100.0%) |
| 65 to 74 Years | 44 (100.0%) | 7 (15.9%) |
| 75 Years and over | 17 (100.0%) | 17 (100.0%) |
| Total | 67 (44.4%) | 97 (64.2%) |
Disability Status by Sex by Age in Medora
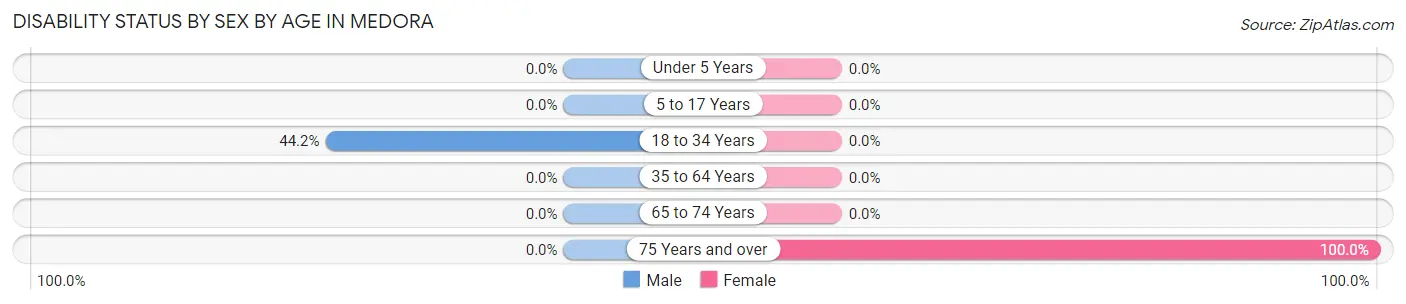
| Age Bracket | Male | Female |
| Under 5 Years | 0 (0.0%) | 0 (0.0%) |
| 5 to 17 Years | 0 (0.0%) | 0 (0.0%) |
| 18 to 34 Years | 19 (44.2%) | 0 (0.0%) |
| 35 to 64 Years | 0 (0.0%) | 0 (0.0%) |
| 65 to 74 Years | 0 (0.0%) | 0 (0.0%) |
| 75 Years and over | 0 (0.0%) | 10 (100.0%) |
Disability Class by Sex by Age in Medora
Disability Class: Hearing Difficulty
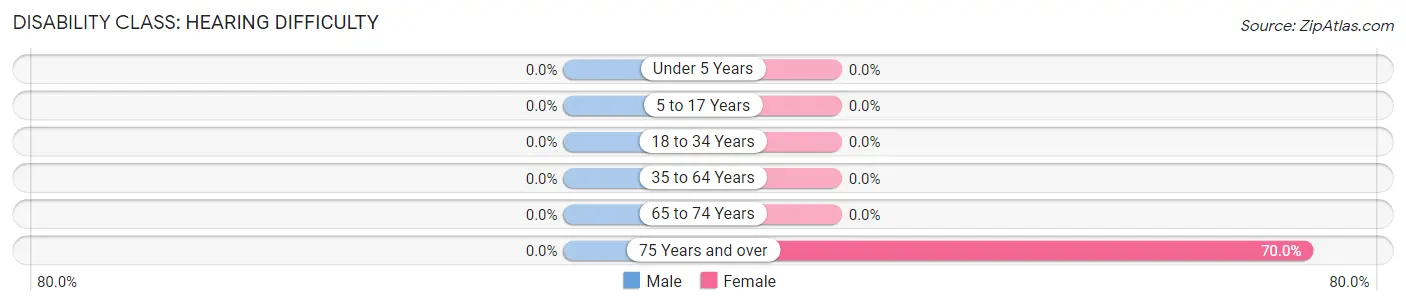
| Age Bracket | Male | Female |
| Under 5 Years | 0 (0.0%) | 0 (0.0%) |
| 5 to 17 Years | 0 (0.0%) | 0 (0.0%) |
| 18 to 34 Years | 0 (0.0%) | 0 (0.0%) |
| 35 to 64 Years | 0 (0.0%) | 0 (0.0%) |
| 65 to 74 Years | 0 (0.0%) | 0 (0.0%) |
| 75 Years and over | 0 (0.0%) | 7 (70.0%) |
Disability Class: Vision Difficulty
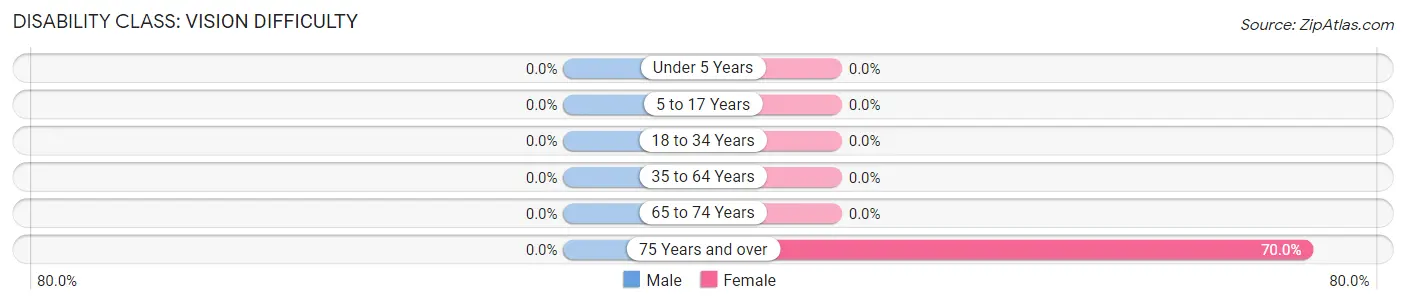
| Age Bracket | Male | Female |
| Under 5 Years | 0 (0.0%) | 0 (0.0%) |
| 5 to 17 Years | 0 (0.0%) | 0 (0.0%) |
| 18 to 34 Years | 0 (0.0%) | 0 (0.0%) |
| 35 to 64 Years | 0 (0.0%) | 0 (0.0%) |
| 65 to 74 Years | 0 (0.0%) | 0 (0.0%) |
| 75 Years and over | 0 (0.0%) | 7 (70.0%) |
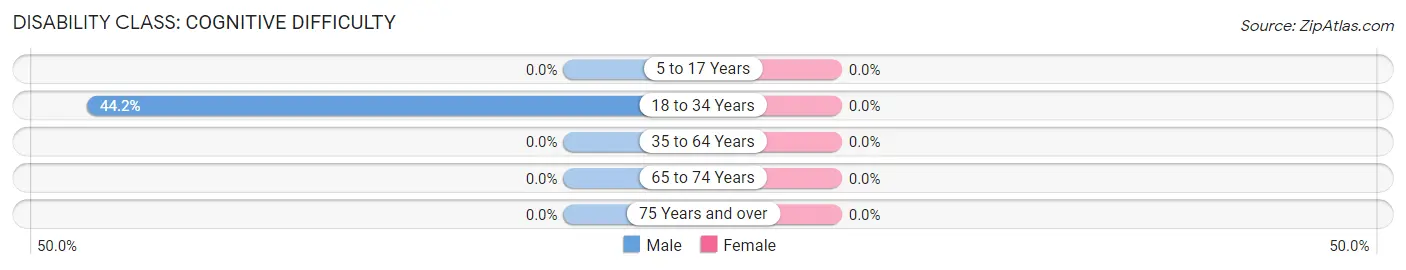
Disability Class: Cognitive Difficulty
| Age Bracket | Male | Female |
| 5 to 17 Years | 0 (0.0%) | 0 (0.0%) |
| 18 to 34 Years | 19 (44.2%) | 0 (0.0%) |
| 35 to 64 Years | 0 (0.0%) | 0 (0.0%) |
| 65 to 74 Years | 0 (0.0%) | 0 (0.0%) |
| 75 Years and over | 0 (0.0%) | 0 (0.0%) |
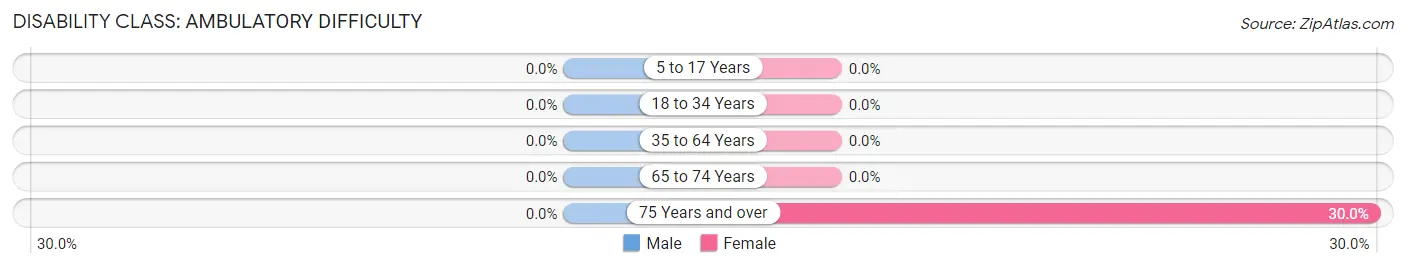
Disability Class: Ambulatory Difficulty
| Age Bracket | Male | Female |
| 5 to 17 Years | 0 (0.0%) | 0 (0.0%) |
| 18 to 34 Years | 0 (0.0%) | 0 (0.0%) |
| 35 to 64 Years | 0 (0.0%) | 0 (0.0%) |
| 65 to 74 Years | 0 (0.0%) | 0 (0.0%) |
| 75 Years and over | 0 (0.0%) | 3 (30.0%) |
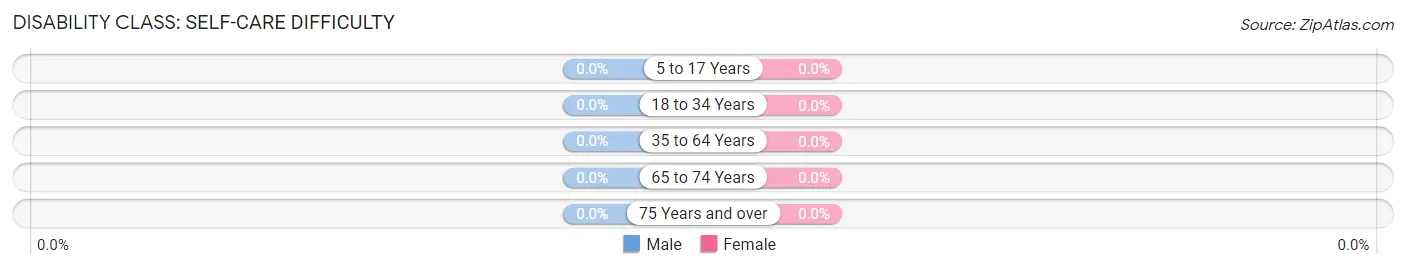
Disability Class: Self-Care Difficulty
| Age Bracket | Male | Female |
| 5 to 17 Years | 0 (0.0%) | 0 (0.0%) |
| 18 to 34 Years | 0 (0.0%) | 0 (0.0%) |
| 35 to 64 Years | 0 (0.0%) | 0 (0.0%) |
| 65 to 74 Years | 0 (0.0%) | 0 (0.0%) |
| 75 Years and over | 0 (0.0%) | 0 (0.0%) |
Technology Access in Medora
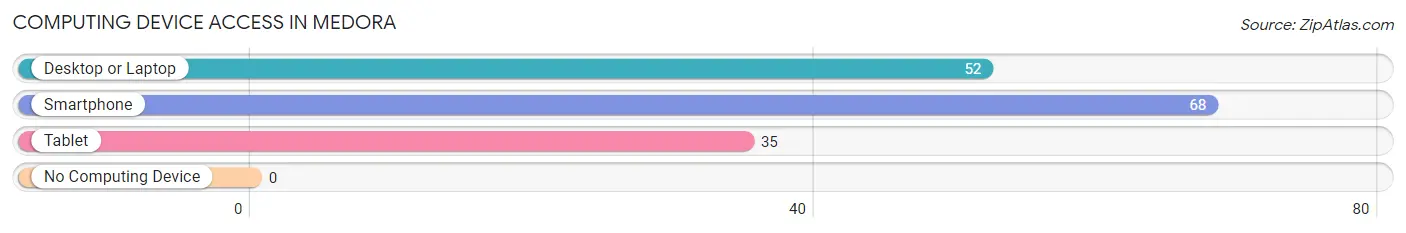
Computing Device Access in Medora
| Device Type | # Households | % Households |
| Desktop or Laptop | 52 | 76.5% |
| Smartphone | 68 | 100.0% |
| Tablet | 35 | 51.5% |
| No Computing Device | 0 | 0.0% |
| Total | 68 | 100.0% |
Internet Access in Medora
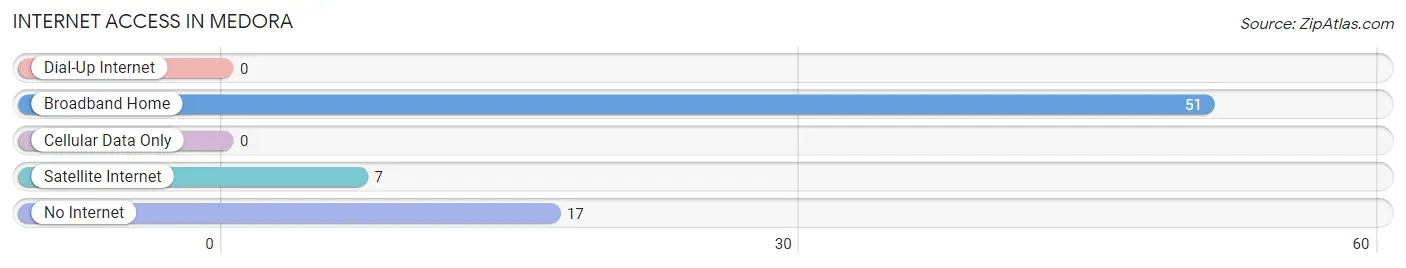
| Internet Type | # Households | % Households |
| Dial-Up Internet | 0 | 0.0% |
| Broadband Home | 51 | 75.0% |
| Cellular Data Only | 0 | 0.0% |
| Satellite Internet | 7 | 10.3% |
| No Internet | 17 | 25.0% |
| Total | 68 | 100.0% |
Medora Summary
Medora, North Dakota is a small town located in the southwestern corner of the state, near the Montana border. It is the county seat of Billings County and is home to a population of just over 100 people. The town was founded in 1883 by the Marquis de Mores, a French nobleman, and was named after his wife, Medora von Hoffman.
Medora is located in the Badlands of North Dakota, a region of rugged terrain and sparse vegetation. The town is situated on the Little Missouri River, which flows through the area. The surrounding area is mostly grassland, with some areas of forest. The town is located at an elevation of 2,890 feet (880 m).
The economy of Medora is largely based on tourism. The town is home to the Theodore Roosevelt National Park, which attracts visitors from all over the world. The park is home to a variety of wildlife, including bison, elk, and wild horses. The town also has a variety of restaurants, shops, and lodging options.
The population of Medora in 2000 was 106 people. The median age was 44.7 years, and the median household income was $31,250. The racial makeup of the town was 97.2% White, 0.9% Native American, 0.9% Asian, and 0.9% from other races. The median house value was $68,400.
Medora is served by the Billings County School District. The town has one elementary school, one middle school, and one high school. The town also has a library, a post office, and a volunteer fire department.
Medora is a small town with a rich history and a unique culture. It is a great place to visit and explore the beauty of the Badlands. The town is home to a variety of attractions, including the Theodore Roosevelt National Park, and is a great place to experience the beauty of the North Dakota Badlands.
Common Questions
What is Per Capita Income in Medora?
Per Capita income in Medora is $32,170.
What is the Median Family Income in Medora?
Median Family Income in Medora is $81,250.
What is the Median Household income in Medora?
Median Household Income in Medora is $64,643.
What is Inequality or Gini Index in Medora?
Inequality or Gini Index in Medora is 0.35.
What is the Total Population of Medora?
Total Population of Medora is 151.
What is the Total Male Population of Medora?
Total Male Population of Medora is 88.
What is the Total Female Population of Medora?
Total Female Population of Medora is 63.
What is the Ratio of Males per 100 Females in Medora?
There are 139.68 Males per 100 Females in Medora.
What is the Ratio of Females per 100 Males in Medora?
There are 71.59 Females per 100 Males in Medora.
What is the Median Population Age in Medora?
Median Population Age in Medora is 36.9 Years.
What is the Average Family Size in Medora
Average Family Size in Medora is 2.2 People.
What is the Average Household Size in Medora
Average Household Size in Medora is 1.9 People.
How Large is the Labor Force in Medora?
There are 79 People in the Labor Forcein in Medora.
What is the Percentage of People in the Labor Force in Medora?
59.0% of People are in the Labor Force in Medora.
What is the Unemployment Rate in Medora?
Unemployment Rate in Medora is 5.1%.