Marmarth, ND Map & Demographics
Marmarth Map
Marmarth Overview
$41,583
PER CAPITA INCOME
$59,196
AVG FAMILY INCOME
$58,661
AVG HOUSEHOLD INCOME
56.4%
WAGE / INCOME GAP [ % ]
43.6¢/ $1
WAGE / INCOME GAP [ $ ]
0.40
INEQUALITY / GINI INDEX
93
TOTAL POPULATION
56
MALE POPULATION
37
FEMALE POPULATION
151.35
MALES / 100 FEMALES
66.07
FEMALES / 100 MALES
58.5
MEDIAN AGE
2.3
AVG FAMILY SIZE
1.7
AVG HOUSEHOLD SIZE
38
LABOR FORCE [ PEOPLE ]
50.0%
PERCENT IN LABOR FORCE
2.6%
UNEMPLOYMENT RATE
Marmarth Zip Codes
Marmarth Area Codes
Income in Marmarth
Income Overview in Marmarth
Per Capita Income in Marmarth is $41,583, while median incomes of families and households are $59,196 and $58,661 respectively.
| Characteristic | Number | Measure |
| Per Capita Income | 93 | $41,583 |
| Median Family Income | 29 | $59,196 |
| Mean Family Income | 29 | $91,093 |
| Median Household Income | 55 | $58,661 |
| Mean Household Income | 55 | $65,738 |
| Income Deficit | 29 | $0 |
| Wage / Income Gap (%) | 93 | 56.42% |
| Wage / Income Gap ($) | 93 | 43.58¢ per $1 |
| Gini / Inequality Index | 93 | 0.40 |
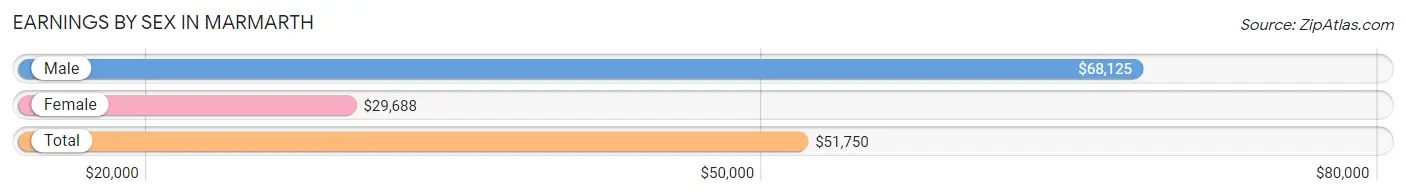
Earnings by Sex in Marmarth
Average Earnings in Marmarth are $51,750, $68,125 for men and $29,688 for women, a difference of 56.4%.
| Sex | Number | Average Earnings |
| Male | 22 (56.4%) | $68,125 |
| Female | 17 (43.6%) | $29,688 |
| Total | 39 (100.0%) | $51,750 |
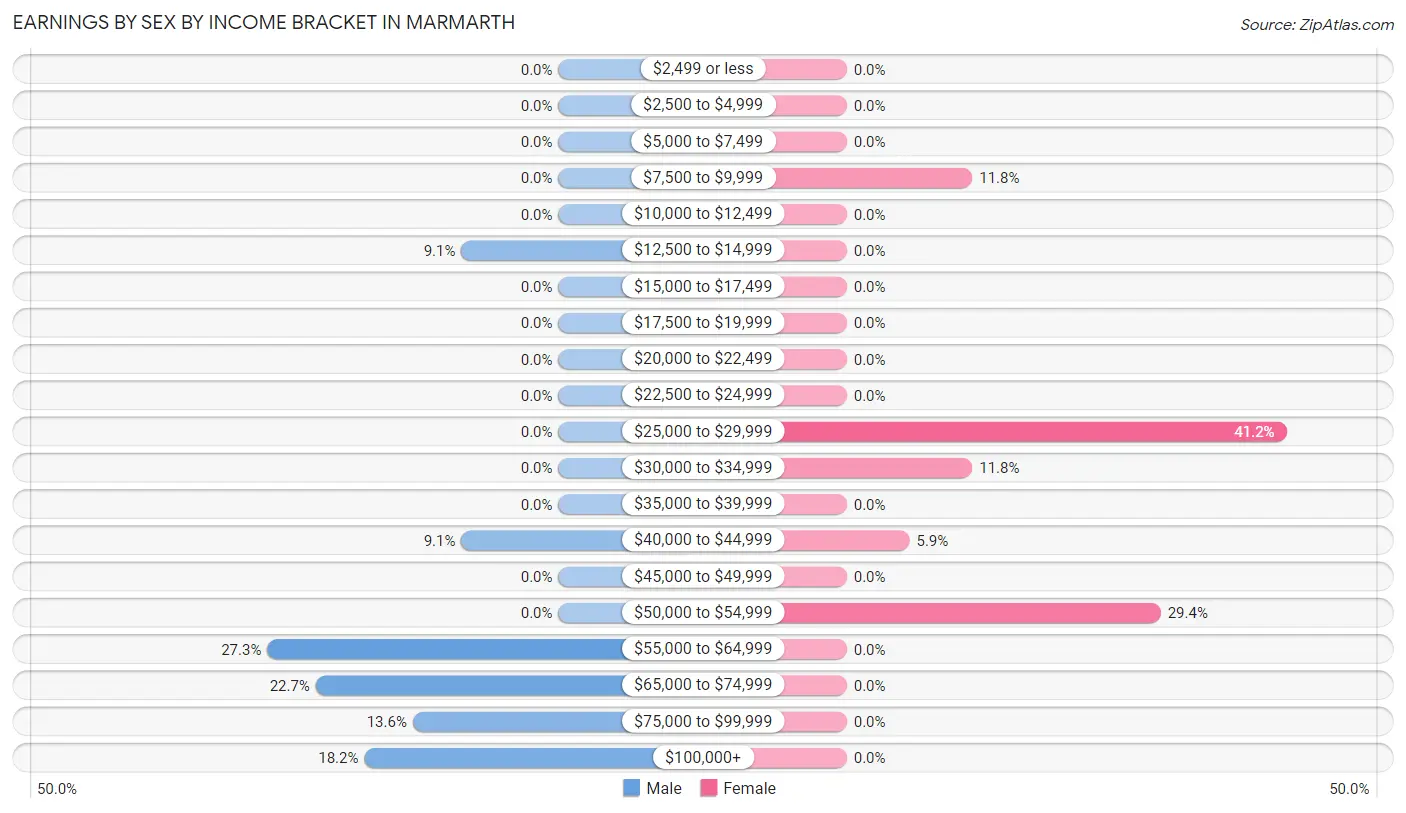
Earnings by Sex by Income Bracket in Marmarth
The most common earnings brackets in Marmarth are $55,000 to $64,999 for men (6 | 27.3%) and $25,000 to $29,999 for women (7 | 41.2%).
| Income | Male | Female |
| $2,499 or less | 0 (0.0%) | 0 (0.0%) |
| $2,500 to $4,999 | 0 (0.0%) | 0 (0.0%) |
| $5,000 to $7,499 | 0 (0.0%) | 0 (0.0%) |
| $7,500 to $9,999 | 0 (0.0%) | 2 (11.8%) |
| $10,000 to $12,499 | 0 (0.0%) | 0 (0.0%) |
| $12,500 to $14,999 | 2 (9.1%) | 0 (0.0%) |
| $15,000 to $17,499 | 0 (0.0%) | 0 (0.0%) |
| $17,500 to $19,999 | 0 (0.0%) | 0 (0.0%) |
| $20,000 to $22,499 | 0 (0.0%) | 0 (0.0%) |
| $22,500 to $24,999 | 0 (0.0%) | 0 (0.0%) |
| $25,000 to $29,999 | 0 (0.0%) | 7 (41.2%) |
| $30,000 to $34,999 | 0 (0.0%) | 2 (11.8%) |
| $35,000 to $39,999 | 0 (0.0%) | 0 (0.0%) |
| $40,000 to $44,999 | 2 (9.1%) | 1 (5.9%) |
| $45,000 to $49,999 | 0 (0.0%) | 0 (0.0%) |
| $50,000 to $54,999 | 0 (0.0%) | 5 (29.4%) |
| $55,000 to $64,999 | 6 (27.3%) | 0 (0.0%) |
| $65,000 to $74,999 | 5 (22.7%) | 0 (0.0%) |
| $75,000 to $99,999 | 3 (13.6%) | 0 (0.0%) |
| $100,000+ | 4 (18.2%) | 0 (0.0%) |
| Total | 22 (100.0%) | 17 (100.0%) |
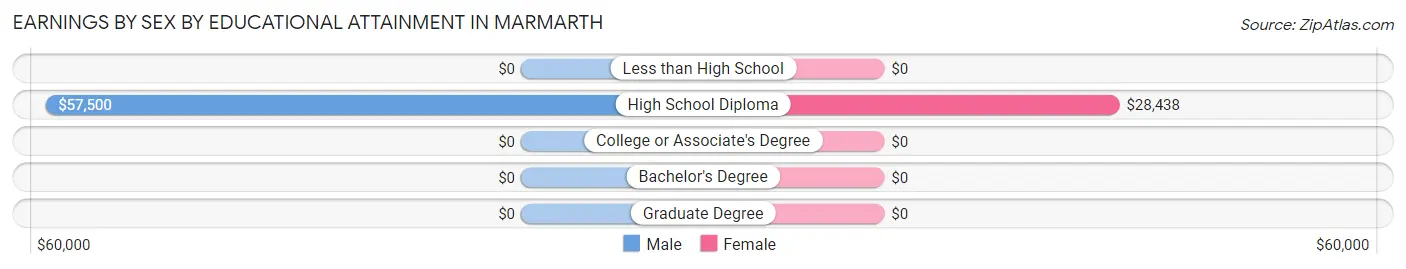
Earnings by Sex by Educational Attainment in Marmarth
Average earnings in Marmarth are $68,125 for men and $29,688 for women, a difference of 56.4%. Men with an educational attainment of high school diploma enjoy the highest average annual earnings of $57,500, while those with high school diploma education earn the least with $57,500. Women with an educational attainment of high school diploma earn the most with the average annual earnings of $28,438, while those with high school diploma education have the smallest earnings of $28,438.
| Educational Attainment | Male Income | Female Income |
| Less than High School | - | - |
| High School Diploma | $57,500 | $28,438 |
| College or Associate's Degree | - | - |
| Bachelor's Degree | - | - |
| Graduate Degree | - | - |
| Total | $68,125 | $29,688 |
Family Income in Marmarth
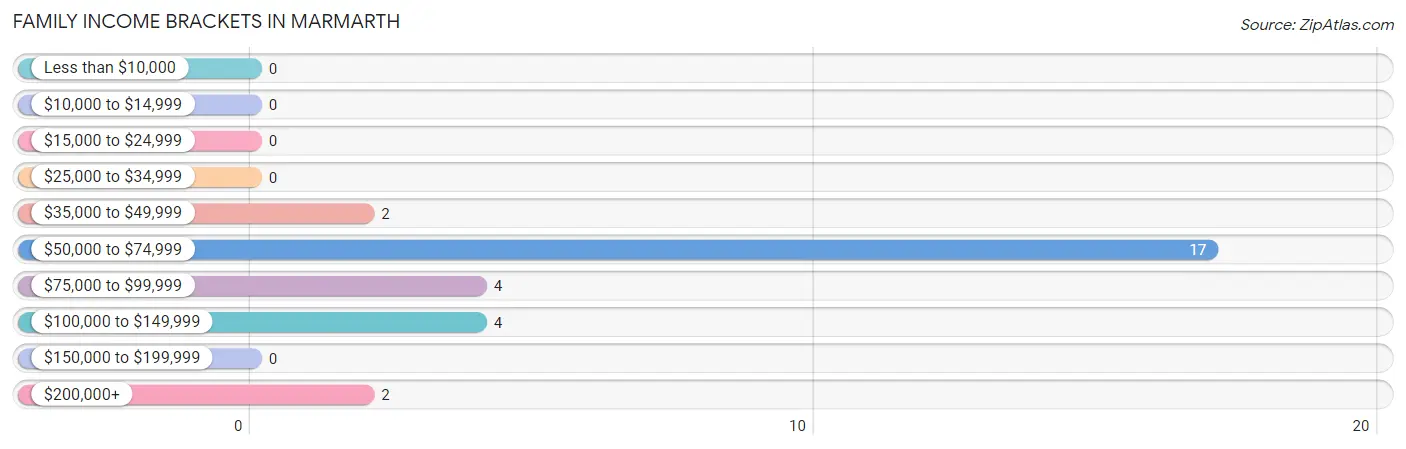
Family Income Brackets in Marmarth
According to the Marmarth family income data, there are 17 families falling into the $50,000 to $74,999 income range, which is the most common income bracket and makes up 58.6% of all families.
| Income Bracket | # Families | % Families |
| Less than $10,000 | 0 | 0.0% |
| $10,000 to $14,999 | 0 | 0.0% |
| $15,000 to $24,999 | 0 | 0.0% |
| $25,000 to $34,999 | 0 | 0.0% |
| $35,000 to $49,999 | 2 | 6.9% |
| $50,000 to $74,999 | 17 | 58.6% |
| $75,000 to $99,999 | 4 | 13.8% |
| $100,000 to $149,999 | 4 | 13.8% |
| $150,000 to $199,999 | 0 | 0.0% |
| $200,000+ | 2 | 6.9% |
Family Income by Famaliy Size in Marmarth
| Income Bracket | # Families | Median Income |
| 2-Person Families | 9 (31.0%) | $0 |
| 3-Person Families | 16 (55.2%) | $0 |
| 4-Person Families | 4 (13.8%) | $0 |
| 5-Person Families | 0 (0.0%) | $0 |
| 6-Person Families | 0 (0.0%) | $0 |
| 7+ Person Families | 0 (0.0%) | $0 |
| Total | 29 (100.0%) | $59,196 |
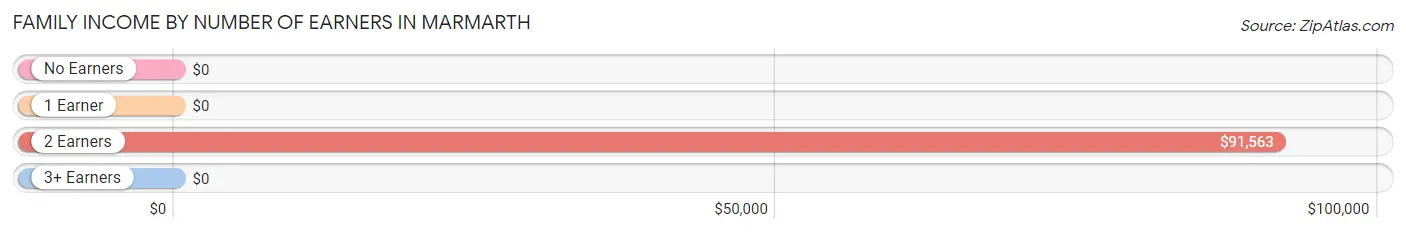
Family Income by Number of Earners in Marmarth
| Number of Earners | # Families | Median Income |
| No Earners | 4 (13.8%) | $0 |
| 1 Earner | 14 (48.3%) | $0 |
| 2 Earners | 11 (37.9%) | $91,563 |
| 3+ Earners | 0 (0.0%) | $0 |
| Total | 29 (100.0%) | $59,196 |
Household Income in Marmarth
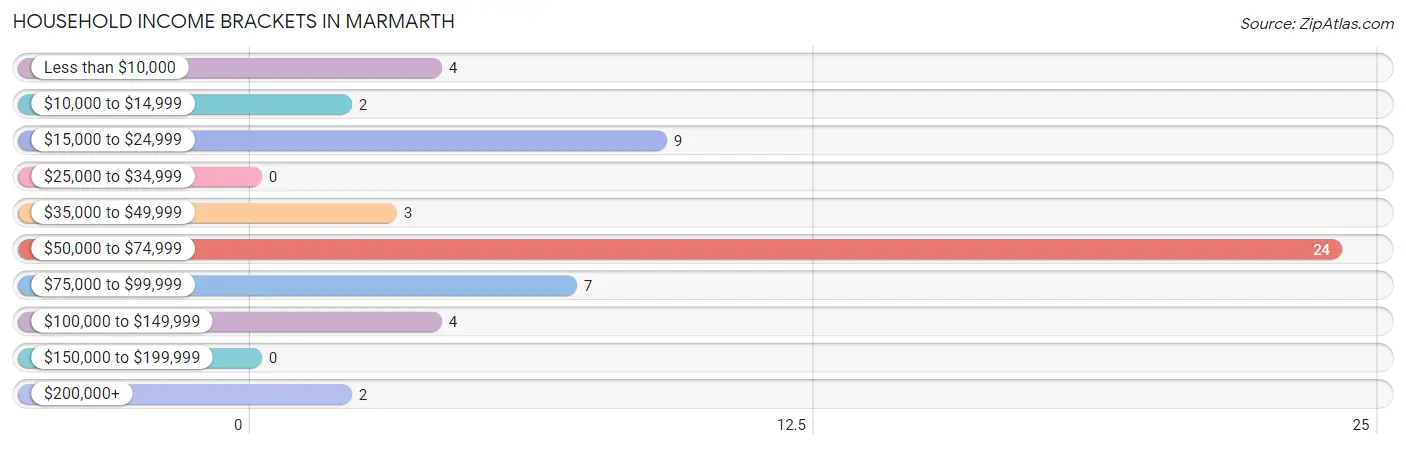
Household Income Brackets in Marmarth
With 24 households falling in the category, the $50,000 to $74,999 income range is the most frequent in Marmarth, accounting for 43.6% of all households.
| Income Bracket | # Households | % Households |
| Less than $10,000 | 4 | 7.3% |
| $10,000 to $14,999 | 2 | 3.6% |
| $15,000 to $24,999 | 9 | 16.4% |
| $25,000 to $34,999 | 0 | 0.0% |
| $35,000 to $49,999 | 3 | 5.5% |
| $50,000 to $74,999 | 24 | 43.6% |
| $75,000 to $99,999 | 7 | 12.7% |
| $100,000 to $149,999 | 4 | 7.3% |
| $150,000 to $199,999 | 0 | 0.0% |
| $200,000+ | 2 | 3.6% |
Household Income by Householder Age in Marmarth
The median household income in Marmarth is $58,661, with the highest median household income of $90,625 found in the 25 to 44 years age bracket for the primary householder. A total of 10 households (18.2%) fall into this category.
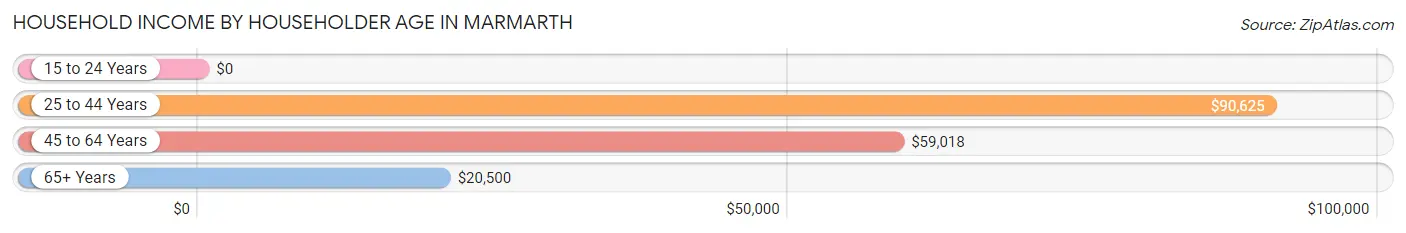
| Income Bracket | # Households | Median Income |
| 15 to 24 Years | 0 (0.0%) | $0 |
| 25 to 44 Years | 10 (18.2%) | $90,625 |
| 45 to 64 Years | 23 (41.8%) | $59,018 |
| 65+ Years | 22 (40.0%) | $20,500 |
| Total | 55 (100.0%) | $58,661 |
Poverty in Marmarth
Income Below Poverty by Sex and Age in Marmarth
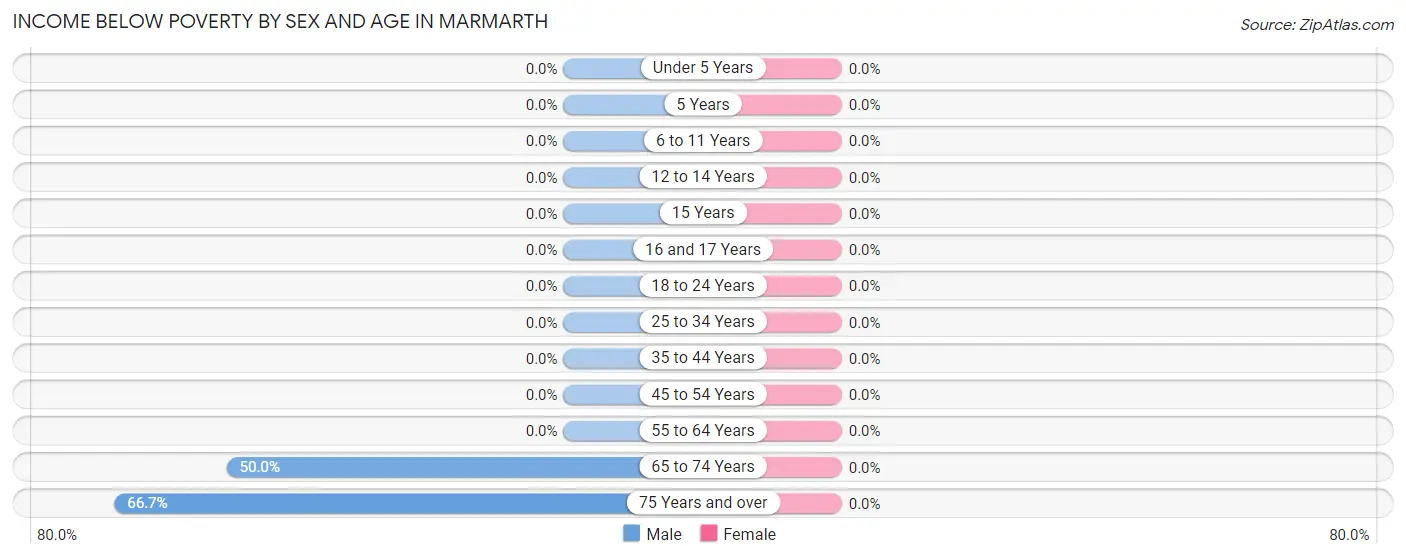
| Age Bracket | Male | Female |
| Under 5 Years | 0 (0.0%) | 0 (0.0%) |
| 5 Years | 0 (0.0%) | 0 (0.0%) |
| 6 to 11 Years | 0 (0.0%) | 0 (0.0%) |
| 12 to 14 Years | 0 (0.0%) | 0 (0.0%) |
| 15 Years | 0 (0.0%) | 0 (0.0%) |
| 16 and 17 Years | 0 (0.0%) | 0 (0.0%) |
| 18 to 24 Years | 0 (0.0%) | 0 (0.0%) |
| 25 to 34 Years | 0 (0.0%) | 0 (0.0%) |
| 35 to 44 Years | 0 (0.0%) | 0 (0.0%) |
| 45 to 54 Years | 0 (0.0%) | 0 (0.0%) |
| 55 to 64 Years | 0 (0.0%) | 0 (0.0%) |
| 65 to 74 Years | 2 (50.0%) | 0 (0.0%) |
| 75 Years and over | 4 (66.7%) | 0 (0.0%) |
| Total | 6 (10.7%) | 0 (0.0%) |
Income Above Poverty by Sex and Age in Marmarth
According to the poverty statistics in Marmarth, males aged 6 to 11 years and females aged 6 to 11 years are the age groups that are most secure financially, with 100.0% of males and 100.0% of females in these age groups living above the poverty line.
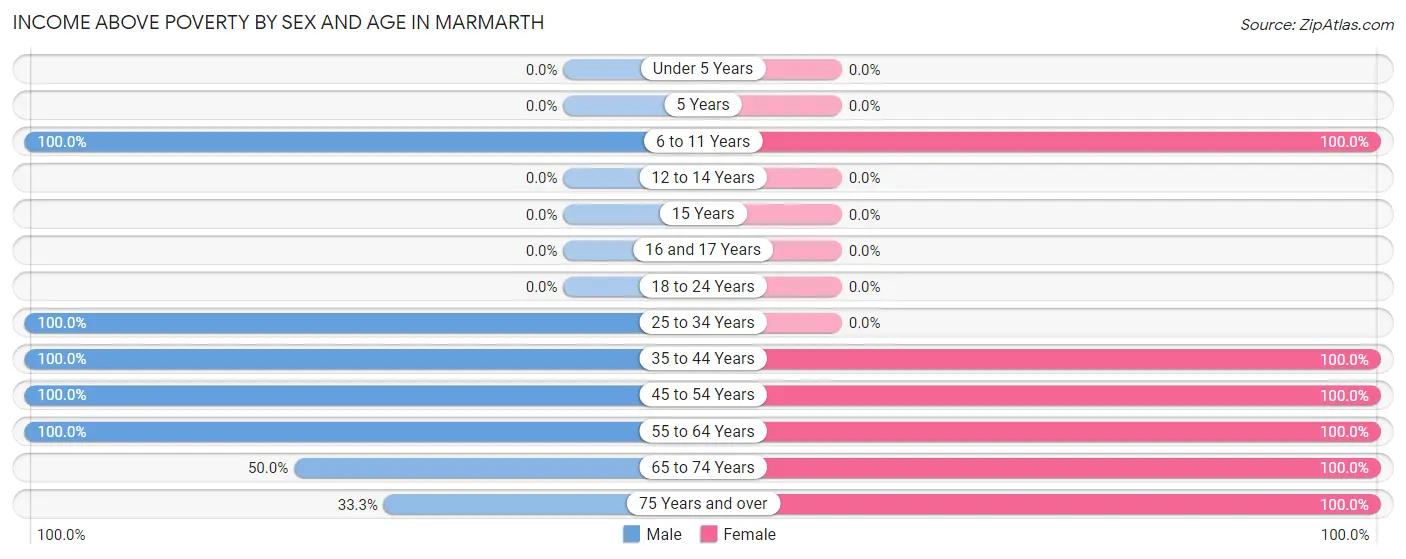
| Age Bracket | Male | Female |
| Under 5 Years | 0 (0.0%) | 0 (0.0%) |
| 5 Years | 0 (0.0%) | 0 (0.0%) |
| 6 to 11 Years | 10 (100.0%) | 7 (100.0%) |
| 12 to 14 Years | 0 (0.0%) | 0 (0.0%) |
| 15 Years | 0 (0.0%) | 0 (0.0%) |
| 16 and 17 Years | 0 (0.0%) | 0 (0.0%) |
| 18 to 24 Years | 0 (0.0%) | 0 (0.0%) |
| 25 to 34 Years | 4 (100.0%) | 0 (0.0%) |
| 35 to 44 Years | 6 (100.0%) | 6 (100.0%) |
| 45 to 54 Years | 5 (100.0%) | 5 (100.0%) |
| 55 to 64 Years | 21 (100.0%) | 3 (100.0%) |
| 65 to 74 Years | 2 (50.0%) | 5 (100.0%) |
| 75 Years and over | 2 (33.3%) | 11 (100.0%) |
| Total | 50 (89.3%) | 37 (100.0%) |
Income Below Poverty Among Married-Couple Families in Marmarth
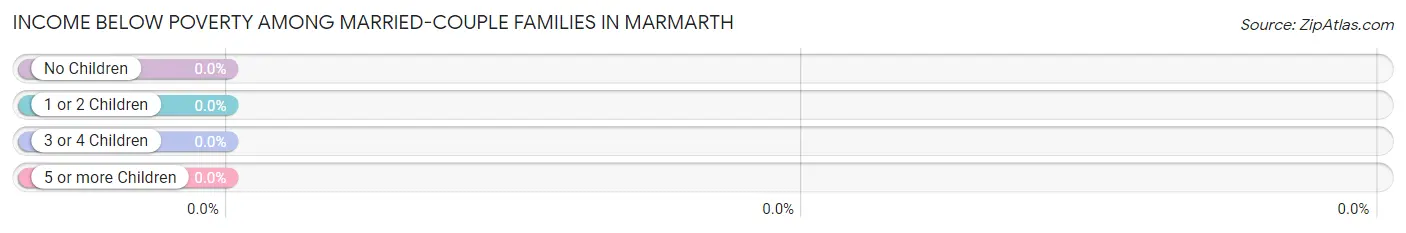
| Children | Above Poverty | Below Poverty |
| No Children | 9 (100.0%) | 0 (0.0%) |
| 1 or 2 Children | 20 (100.0%) | 0 (0.0%) |
| 3 or 4 Children | 0 (0.0%) | 0 (0.0%) |
| 5 or more Children | 0 (0.0%) | 0 (0.0%) |
| Total | 29 (100.0%) | 0 (0.0%) |
Income Below Poverty Among Single-Parent Households in Marmarth
| Children | Single Father | Single Mother |
| No Children | 0 (0.0%) | 0 (0.0%) |
| 1 or 2 Children | 0 (0.0%) | 0 (0.0%) |
| 3 or 4 Children | 0 (0.0%) | 0 (0.0%) |
| 5 or more Children | 0 (0.0%) | 0 (0.0%) |
| Total | 0 (0.0%) | 0 (0.0%) |
Income Below Poverty Among Married-Couple vs Single-Parent Households in Marmarth
| Children | Married-Couple Families | Single-Parent Households |
| No Children | 0 (0.0%) | 0 (0.0%) |
| 1 or 2 Children | 0 (0.0%) | 0 (0.0%) |
| 3 or 4 Children | 0 (0.0%) | 0 (0.0%) |
| 5 or more Children | 0 (0.0%) | 0 (0.0%) |
| Total | 0 (0.0%) | 0 (0.0%) |
Race in Marmarth
The most populous races in Marmarth are White / Caucasian (79 | 85.0%), and Two or more Races (14 | 15.0%).
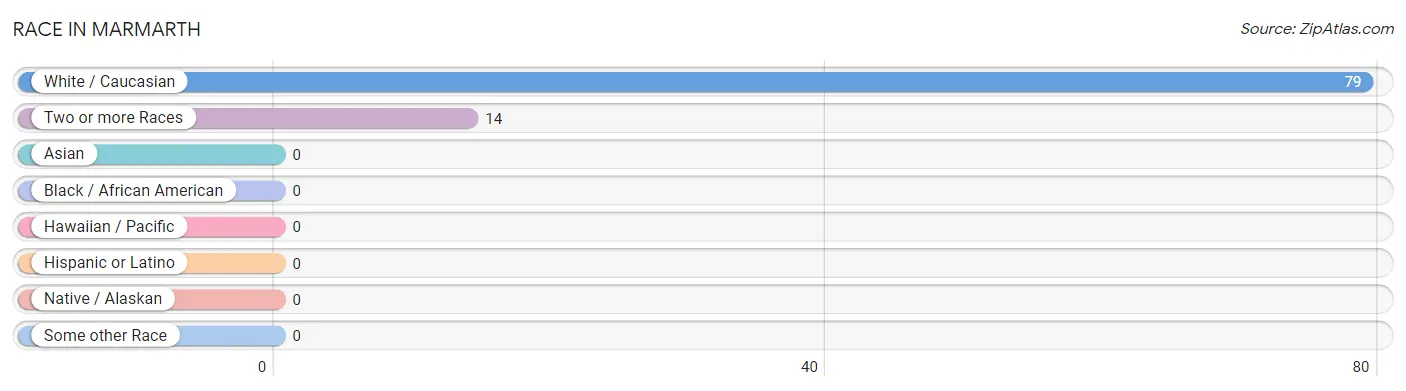
| Race | # Population | % Population |
| Asian | 0 | 0.0% |
| Black / African American | 0 | 0.0% |
| Hawaiian / Pacific | 0 | 0.0% |
| Hispanic or Latino | 0 | 0.0% |
| Native / Alaskan | 0 | 0.0% |
| White / Caucasian | 79 | 85.0% |
| Two or more Races | 14 | 15.0% |
| Some other Race | 0 | 0.0% |
| Total | 93 | 100.0% |
Ancestry in Marmarth
The most populous ancestries reported in Marmarth are German (25 | 26.9%), Cherokee (14 | 15.0%), Danish (5 | 5.4%), English (4 | 4.3%), and Norwegian (4 | 4.3%), together accounting for 55.9% of all Marmarth residents.
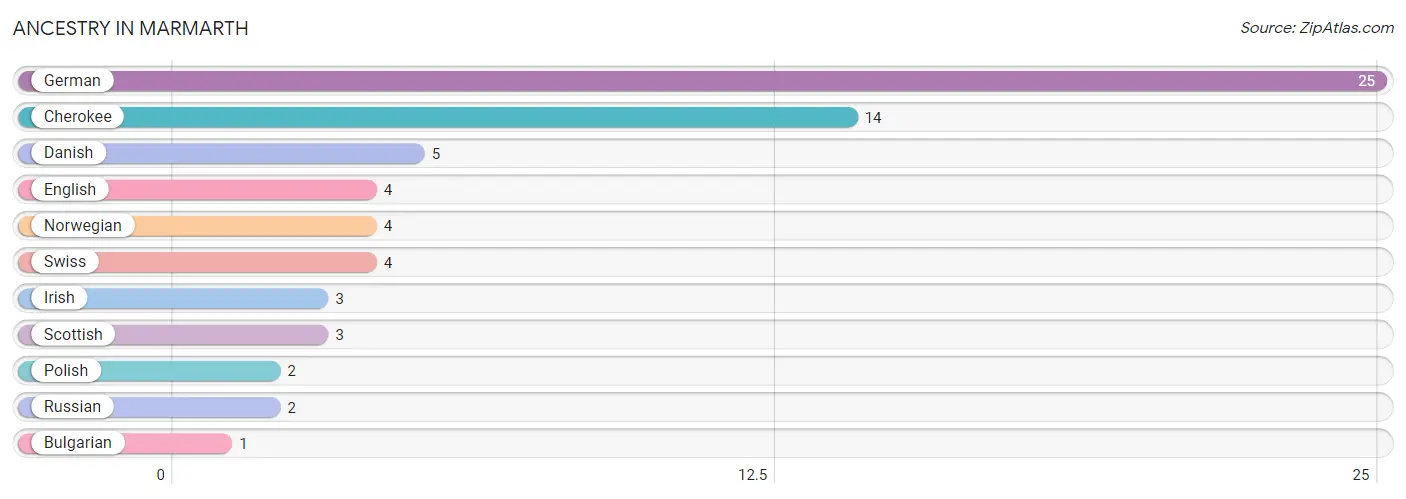
| Ancestry | # Population | % Population |
| Bulgarian | 1 | 1.1% |
| Cherokee | 14 | 15.0% |
| Danish | 5 | 5.4% |
| English | 4 | 4.3% |
| German | 25 | 26.9% |
| Irish | 3 | 3.2% |
| Norwegian | 4 | 4.3% |
| Polish | 2 | 2.1% |
| Russian | 2 | 2.1% |
| Scottish | 3 | 3.2% |
| Swiss | 4 | 4.3% | View All 11 Rows |
Immigrants in Marmarth

| Immigration Origin | # Population | % Population | View All 0 Rows |
Sex and Age in Marmarth
Sex and Age in Marmarth
The most populous age groups in Marmarth are 60 to 64 Years (18 | 32.1%) for men and 45 to 49 Years (5 | 13.5%) for women.
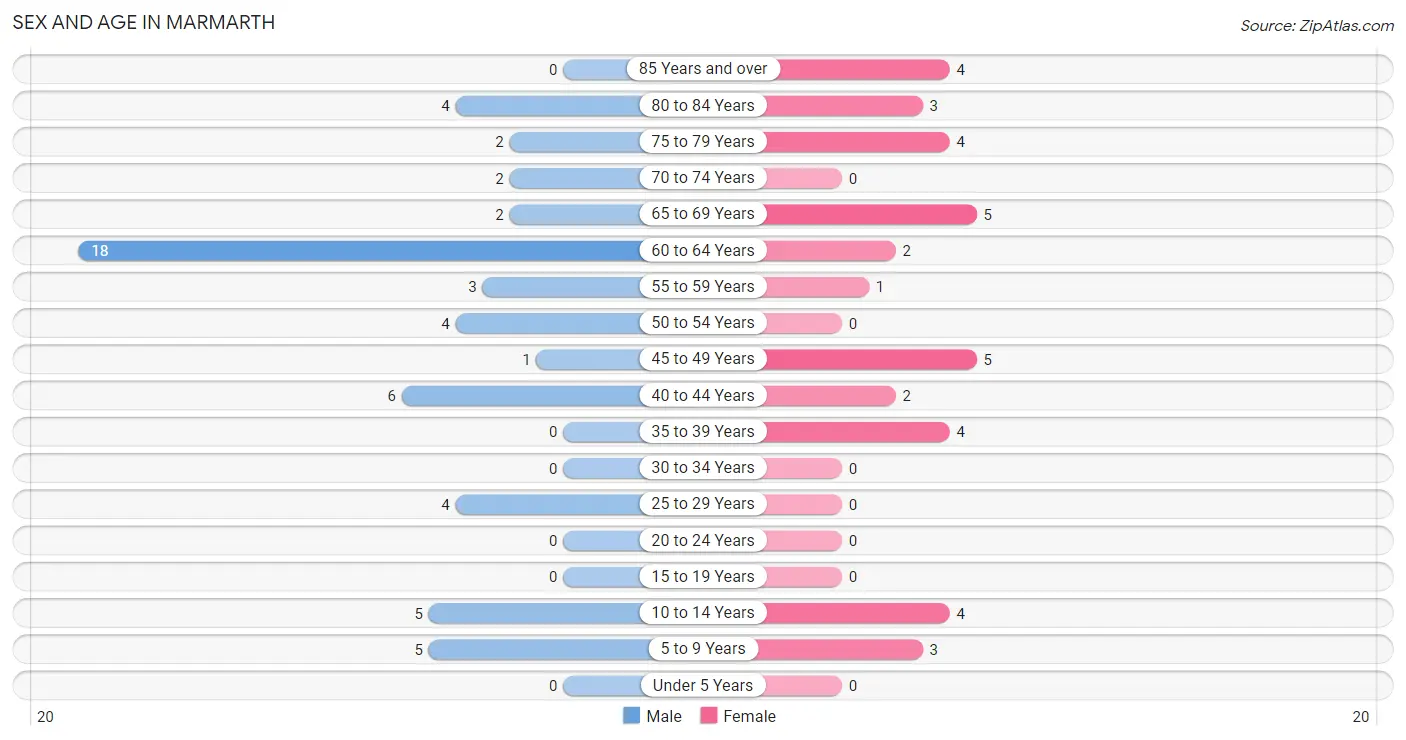
| Age Bracket | Male | Female |
| Under 5 Years | 0 (0.0%) | 0 (0.0%) |
| 5 to 9 Years | 5 (8.9%) | 3 (8.1%) |
| 10 to 14 Years | 5 (8.9%) | 4 (10.8%) |
| 15 to 19 Years | 0 (0.0%) | 0 (0.0%) |
| 20 to 24 Years | 0 (0.0%) | 0 (0.0%) |
| 25 to 29 Years | 4 (7.1%) | 0 (0.0%) |
| 30 to 34 Years | 0 (0.0%) | 0 (0.0%) |
| 35 to 39 Years | 0 (0.0%) | 4 (10.8%) |
| 40 to 44 Years | 6 (10.7%) | 2 (5.4%) |
| 45 to 49 Years | 1 (1.8%) | 5 (13.5%) |
| 50 to 54 Years | 4 (7.1%) | 0 (0.0%) |
| 55 to 59 Years | 3 (5.4%) | 1 (2.7%) |
| 60 to 64 Years | 18 (32.1%) | 2 (5.4%) |
| 65 to 69 Years | 2 (3.6%) | 5 (13.5%) |
| 70 to 74 Years | 2 (3.6%) | 0 (0.0%) |
| 75 to 79 Years | 2 (3.6%) | 4 (10.8%) |
| 80 to 84 Years | 4 (7.1%) | 3 (8.1%) |
| 85 Years and over | 0 (0.0%) | 4 (10.8%) |
| Total | 56 (100.0%) | 37 (100.0%) |
Families and Households in Marmarth
Median Family Size in Marmarth
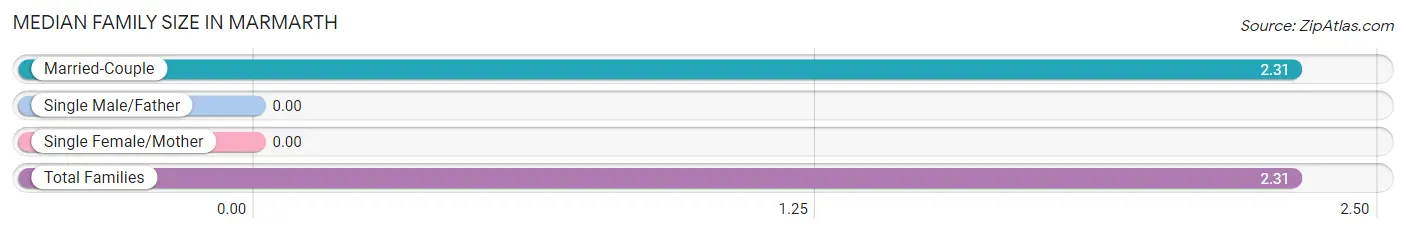
| Family Type | # Families | Family Size |
| Married-Couple | 29 (100.0%) | 2.31 |
| Single Male/Father | 0 (0.0%) | - |
| Single Female/Mother | 0 (0.0%) | - |
| Total Families | 29 (100.0%) | 2.31 |
Median Household Size in Marmarth
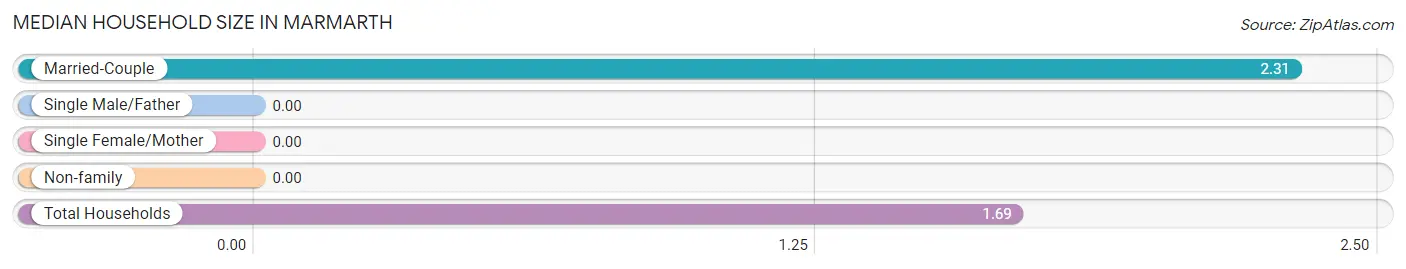
| Household Type | # Households | Household Size |
| Married-Couple | 29 (52.7%) | 2.31 |
| Single Male/Father | 0 (0.0%) | - |
| Single Female/Mother | 0 (0.0%) | - |
| Non-family | 26 (47.3%) | - |
| Total Households | 55 (100.0%) | 1.69 |
Household Size by Marriage Status in Marmarth
Out of a total of 55 households in Marmarth, 29 (52.7%) are family households, while 26 (47.3%) are nonfamily households. The most numerous type of family households are 3-person households, comprising 16, and the most common type of nonfamily households are 1-person households, comprising 26.
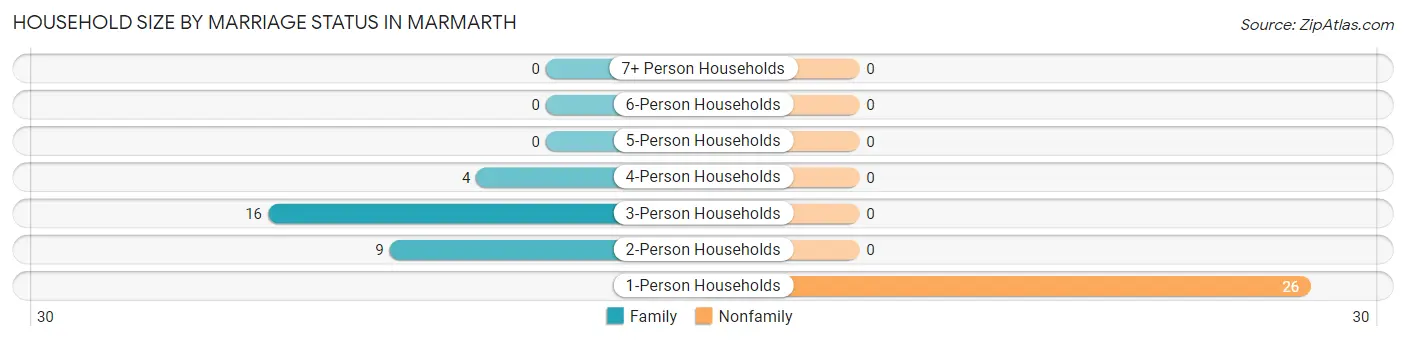
| Household Size | Family Households | Nonfamily Households |
| 1-Person Households | - | 26 (47.3%) |
| 2-Person Households | 9 (16.4%) | 0 (0.0%) |
| 3-Person Households | 16 (29.1%) | 0 (0.0%) |
| 4-Person Households | 4 (7.3%) | 0 (0.0%) |
| 5-Person Households | 0 (0.0%) | 0 (0.0%) |
| 6-Person Households | 0 (0.0%) | 0 (0.0%) |
| 7+ Person Households | 0 (0.0%) | 0 (0.0%) |
| Total | 29 (52.7%) | 26 (47.3%) |
Female Fertility in Marmarth
Fertility by Age in Marmarth
| Age Bracket | Women with Births | Births / 1,000 Women |
| 15 to 19 years | 0 (0.0%) | 0.0 |
| 20 to 34 years | 0 (0.0%) | 0.0 |
| 35 to 50 years | 0 (0.0%) | 0.0 |
| Total | 0 (0.0%) | 0.0 |
Fertility by Age by Marriage Status in Marmarth
| Age Bracket | Married | Unmarried |
| 15 to 19 years | 0 (0.0%) | 0 (0.0%) |
| 20 to 34 years | 0 (0.0%) | 0 (0.0%) |
| 35 to 50 years | 0 (0.0%) | 0 (0.0%) |
| Total | 0 (0.0%) | 0 (0.0%) |
Fertility by Education in Marmarth
| Educational Attainment | Women with Births | Births / 1,000 Women |
| Less than High School | 0 (0.0%) | 0.0 |
| High School Diploma | 0 (0.0%) | 0.0 |
| College or Associate's Degree | 0 (0.0%) | 0.0 |
| Bachelor's Degree | 0 (0.0%) | 0.0 |
| Graduate Degree | 0 (0.0%) | 0.0 |
| Total | 0 (0.0%) | 0.0 |
Fertility by Education by Marriage Status in Marmarth
| Educational Attainment | Married | Unmarried |
| Less than High School | 0 (0.0%) | 0 (0.0%) |
| High School Diploma | 0 (0.0%) | 0 (0.0%) |
| College or Associate's Degree | 0 (0.0%) | 0 (0.0%) |
| Bachelor's Degree | 0 (0.0%) | 0 (0.0%) |
| Graduate Degree | 0 (0.0%) | 0 (0.0%) |
| Total | 0 (0.0%) | 0 (0.0%) |
Employment Characteristics in Marmarth
Employment by Class of Employer in Marmarth
Among the 37 employed individuals in Marmarth, private company employees (17 | 46.0%), self-employed (not incorporated) (8 | 21.6%), and local government employees (7 | 18.9%) make up the most common classes of employment.
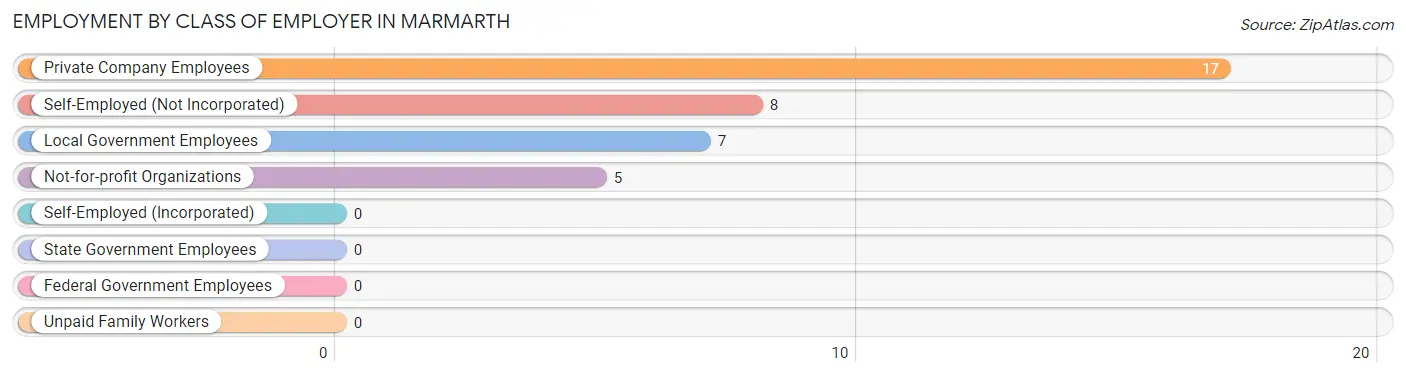
| Employer Class | # Employees | % Employees |
| Private Company Employees | 17 | 46.0% |
| Self-Employed (Incorporated) | 0 | 0.0% |
| Self-Employed (Not Incorporated) | 8 | 21.6% |
| Not-for-profit Organizations | 5 | 13.5% |
| Local Government Employees | 7 | 18.9% |
| State Government Employees | 0 | 0.0% |
| Federal Government Employees | 0 | 0.0% |
| Unpaid Family Workers | 0 | 0.0% |
| Total | 37 | 100.0% |
Employment Status by Age in Marmarth
According to the labor force statistics for Marmarth, out of the total population over 16 years of age (76), 50.0% or 38 individuals are in the labor force, with 2.6% or 1 of them unemployed. The age group with the highest labor force participation rate is 25 to 29 years, with 100.0% or 4 individuals in the labor force. Within the labor force, the 55 to 59 years age range has the highest percentage of unemployed individuals, with 25.0% or 1 of them being unemployed.
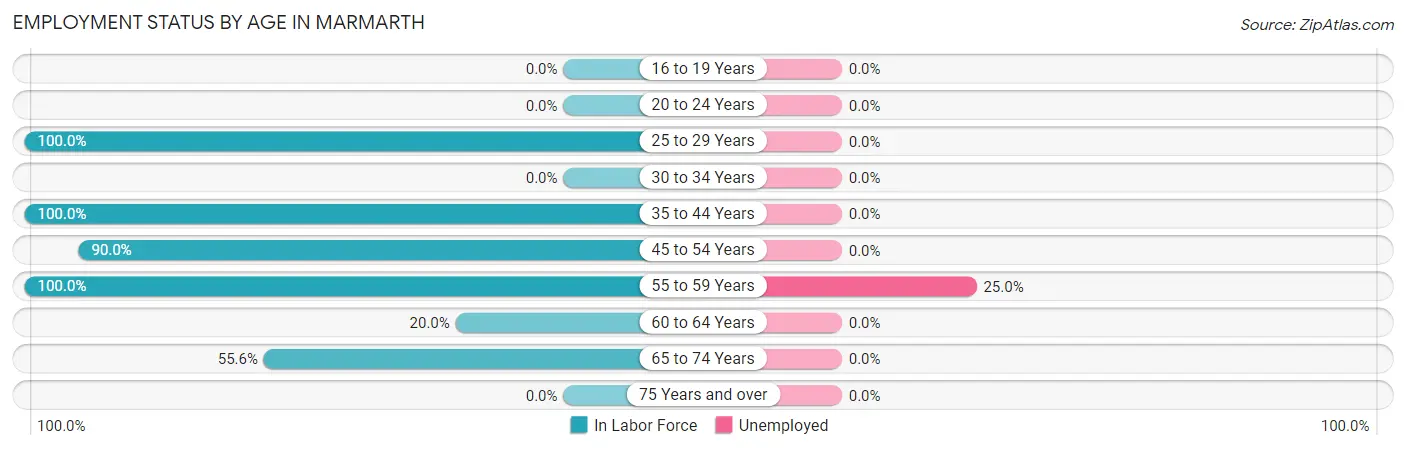
| Age Bracket | In Labor Force | Unemployed |
| 16 to 19 Years | 0 (0.0%) | 0 (0.0%) |
| 20 to 24 Years | 0 (0.0%) | 0 (0.0%) |
| 25 to 29 Years | 4 (100.0%) | 0 (0.0%) |
| 30 to 34 Years | 0 (0.0%) | 0 (0.0%) |
| 35 to 44 Years | 12 (100.0%) | 0 (0.0%) |
| 45 to 54 Years | 9 (90.0%) | 0 (0.0%) |
| 55 to 59 Years | 4 (100.0%) | 1 (25.0%) |
| 60 to 64 Years | 4 (20.0%) | 0 (0.0%) |
| 65 to 74 Years | 5 (55.6%) | 0 (0.0%) |
| 75 Years and over | 0 (0.0%) | 0 (0.0%) |
| Total | 38 (50.0%) | 1 (2.6%) |
Employment Status by Educational Attainment in Marmarth
According to labor force statistics for Marmarth, 66.0% of individuals (33) out of the total population between 25 and 64 years of age (50) are in the labor force, with 3.0% or 1 of them being unemployed. The group with the highest labor force participation rate are those with the educational attainment of less than high school, with 100.0% or 6 individuals in the labor force. Within the labor force, individuals with high school diploma education have the highest percentage of unemployment, with 8.3% or 1 of them being unemployed.
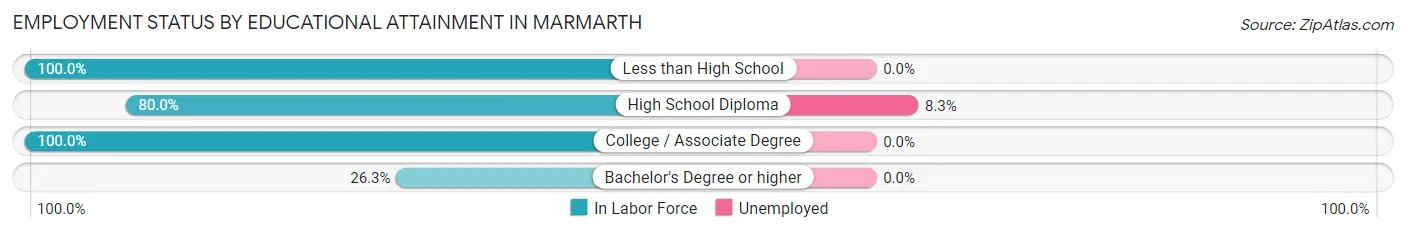
| Educational Attainment | In Labor Force | Unemployed |
| Less than High School | 6 (100.0%) | 0 (0.0%) |
| High School Diploma | 12 (80.0%) | 1 (8.3%) |
| College / Associate Degree | 10 (100.0%) | 0 (0.0%) |
| Bachelor's Degree or higher | 5 (26.3%) | 0 (0.0%) |
| Total | 33 (66.0%) | 2 (3.0%) |
Employment Occupations by Sex in Marmarth
Management, Business, Science and Arts Occupations
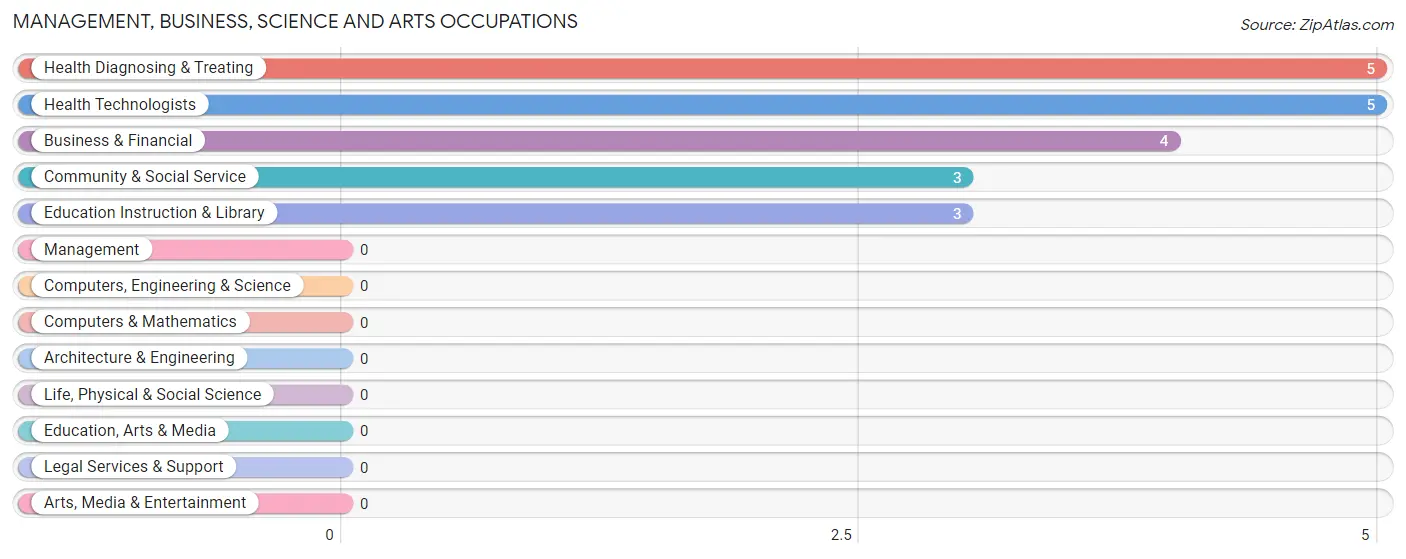
The most common Management, Business, Science and Arts occupations in Marmarth are Health Diagnosing & Treating (5 | 13.5%), Health Technologists (5 | 13.5%), Business & Financial (4 | 10.8%), Community & Social Service (3 | 8.1%), and Education Instruction & Library (3 | 8.1%).
Management, Business, Science and Arts Occupations by Sex
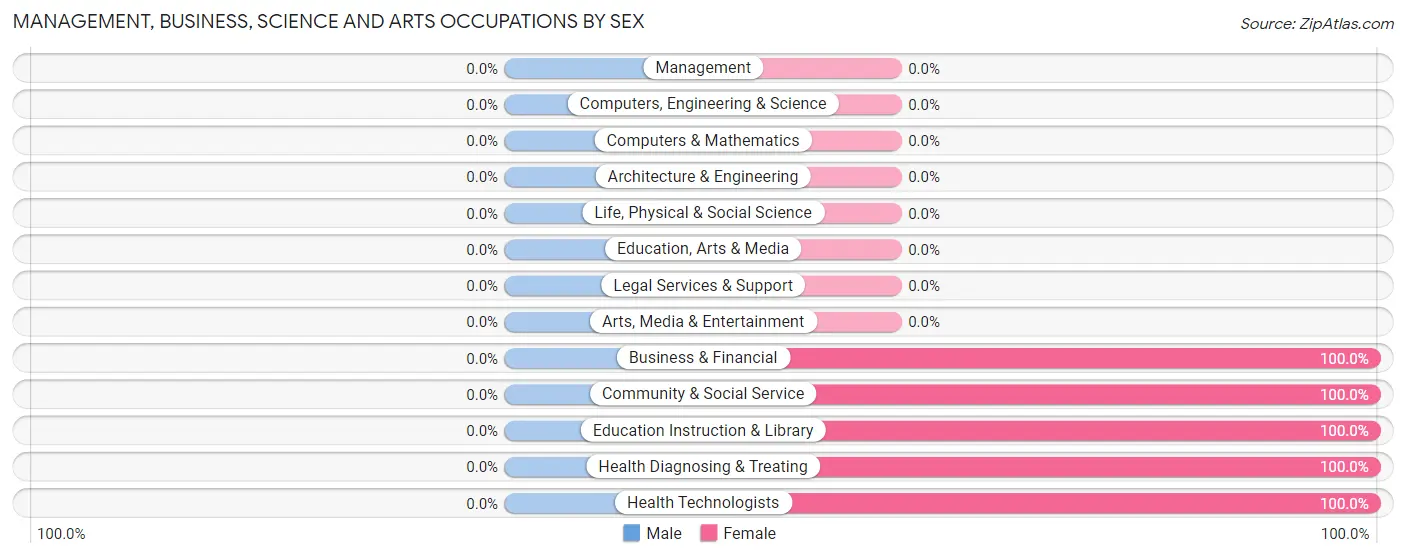
| Occupation | Male | Female |
| Management | 0 (0.0%) | 0 (0.0%) |
| Business & Financial | 0 (0.0%) | 4 (100.0%) |
| Computers, Engineering & Science | 0 (0.0%) | 0 (0.0%) |
| Computers & Mathematics | 0 (0.0%) | 0 (0.0%) |
| Architecture & Engineering | 0 (0.0%) | 0 (0.0%) |
| Life, Physical & Social Science | 0 (0.0%) | 0 (0.0%) |
| Community & Social Service | 0 (0.0%) | 3 (100.0%) |
| Education, Arts & Media | 0 (0.0%) | 0 (0.0%) |
| Legal Services & Support | 0 (0.0%) | 0 (0.0%) |
| Education Instruction & Library | 0 (0.0%) | 3 (100.0%) |
| Arts, Media & Entertainment | 0 (0.0%) | 0 (0.0%) |
| Health Diagnosing & Treating | 0 (0.0%) | 5 (100.0%) |
| Health Technologists | 0 (0.0%) | 5 (100.0%) |
| Total (Category) | 0 (0.0%) | 12 (100.0%) |
| Total (Overall) | 21 (56.8%) | 16 (43.2%) |
Services Occupations
The most common Services occupations in Marmarth are , and Cleaning & Maintenance (6 | 16.2%).
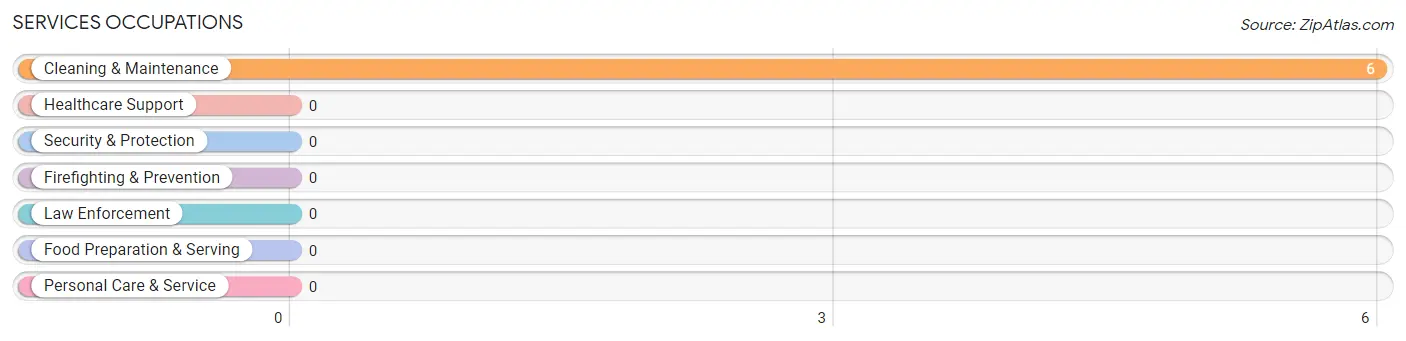
Services Occupations by Sex
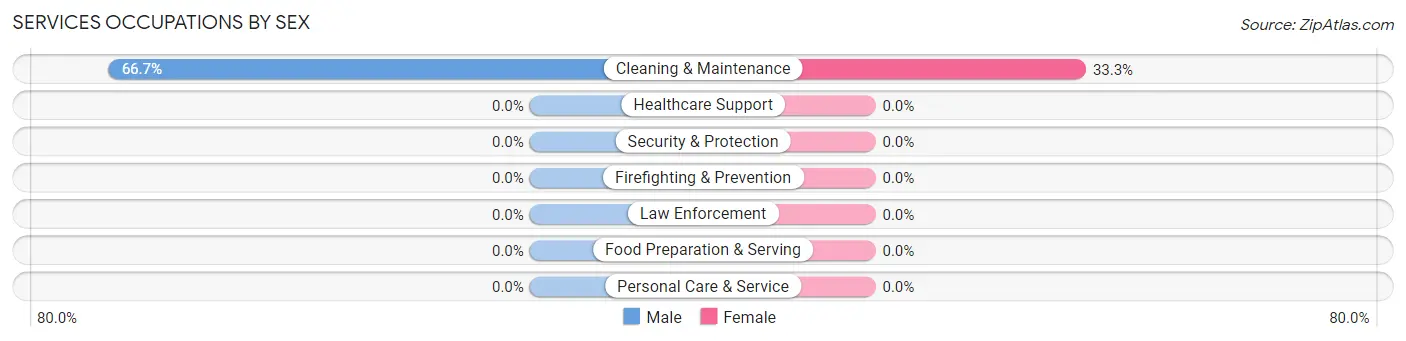
| Occupation | Male | Female |
| Healthcare Support | 0 (0.0%) | 0 (0.0%) |
| Security & Protection | 0 (0.0%) | 0 (0.0%) |
| Firefighting & Prevention | 0 (0.0%) | 0 (0.0%) |
| Law Enforcement | 0 (0.0%) | 0 (0.0%) |
| Food Preparation & Serving | 0 (0.0%) | 0 (0.0%) |
| Cleaning & Maintenance | 4 (66.7%) | 2 (33.3%) |
| Personal Care & Service | 0 (0.0%) | 0 (0.0%) |
| Total (Category) | 4 (66.7%) | 2 (33.3%) |
| Total (Overall) | 21 (56.8%) | 16 (43.2%) |
Sales and Office Occupations
The most common Sales and Office occupations in Marmarth are , and Office & Administration (2 | 5.4%).
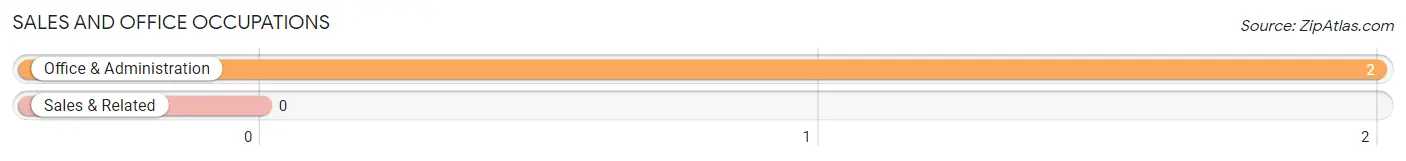
Sales and Office Occupations by Sex
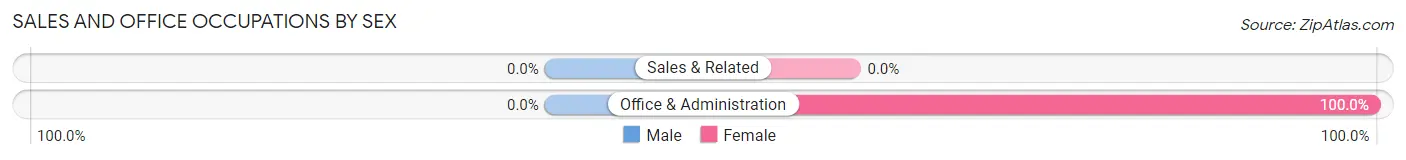
| Occupation | Male | Female |
| Sales & Related | 0 (0.0%) | 0 (0.0%) |
| Office & Administration | 0 (0.0%) | 2 (100.0%) |
| Total (Category) | 0 (0.0%) | 2 (100.0%) |
| Total (Overall) | 21 (56.8%) | 16 (43.2%) |
Natural Resources, Construction and Maintenance Occupations
The most common Natural Resources, Construction and Maintenance occupations in Marmarth are , and Farming, Fishing & Forestry (4 | 10.8%).
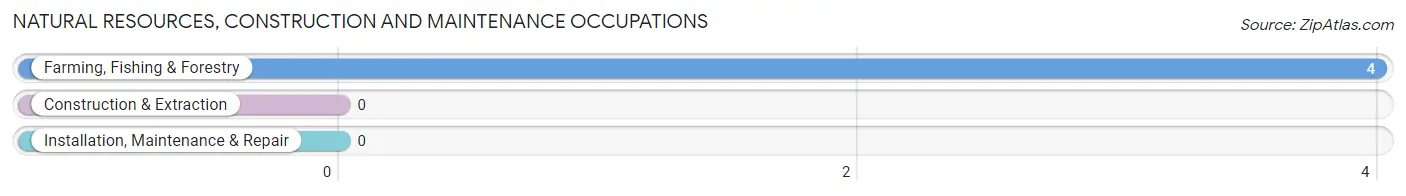
Natural Resources, Construction and Maintenance Occupations by Sex
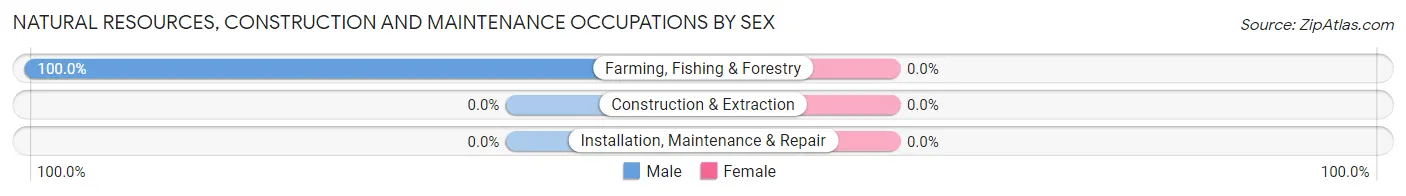
| Occupation | Male | Female |
| Farming, Fishing & Forestry | 4 (100.0%) | 0 (0.0%) |
| Construction & Extraction | 0 (0.0%) | 0 (0.0%) |
| Installation, Maintenance & Repair | 0 (0.0%) | 0 (0.0%) |
| Total (Category) | 4 (100.0%) | 0 (0.0%) |
| Total (Overall) | 21 (56.8%) | 16 (43.2%) |
Production, Transportation and Moving Occupations
The most common Production, Transportation and Moving occupations in Marmarth are Transportation (8 | 21.6%), and Material Moving (5 | 13.5%).
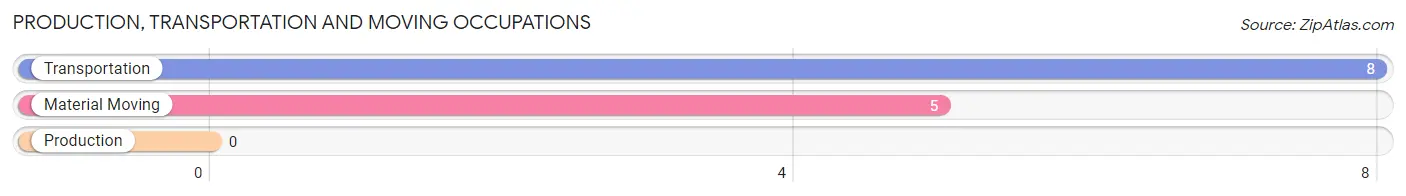
Production, Transportation and Moving Occupations by Sex
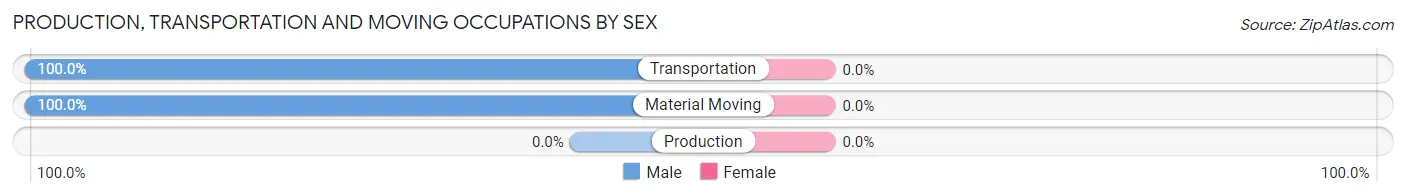
| Occupation | Male | Female |
| Production | 0 (0.0%) | 0 (0.0%) |
| Transportation | 8 (100.0%) | 0 (0.0%) |
| Material Moving | 5 (100.0%) | 0 (0.0%) |
| Total (Category) | 13 (100.0%) | 0 (0.0%) |
| Total (Overall) | 21 (56.8%) | 16 (43.2%) |
Employment Industries by Sex in Marmarth
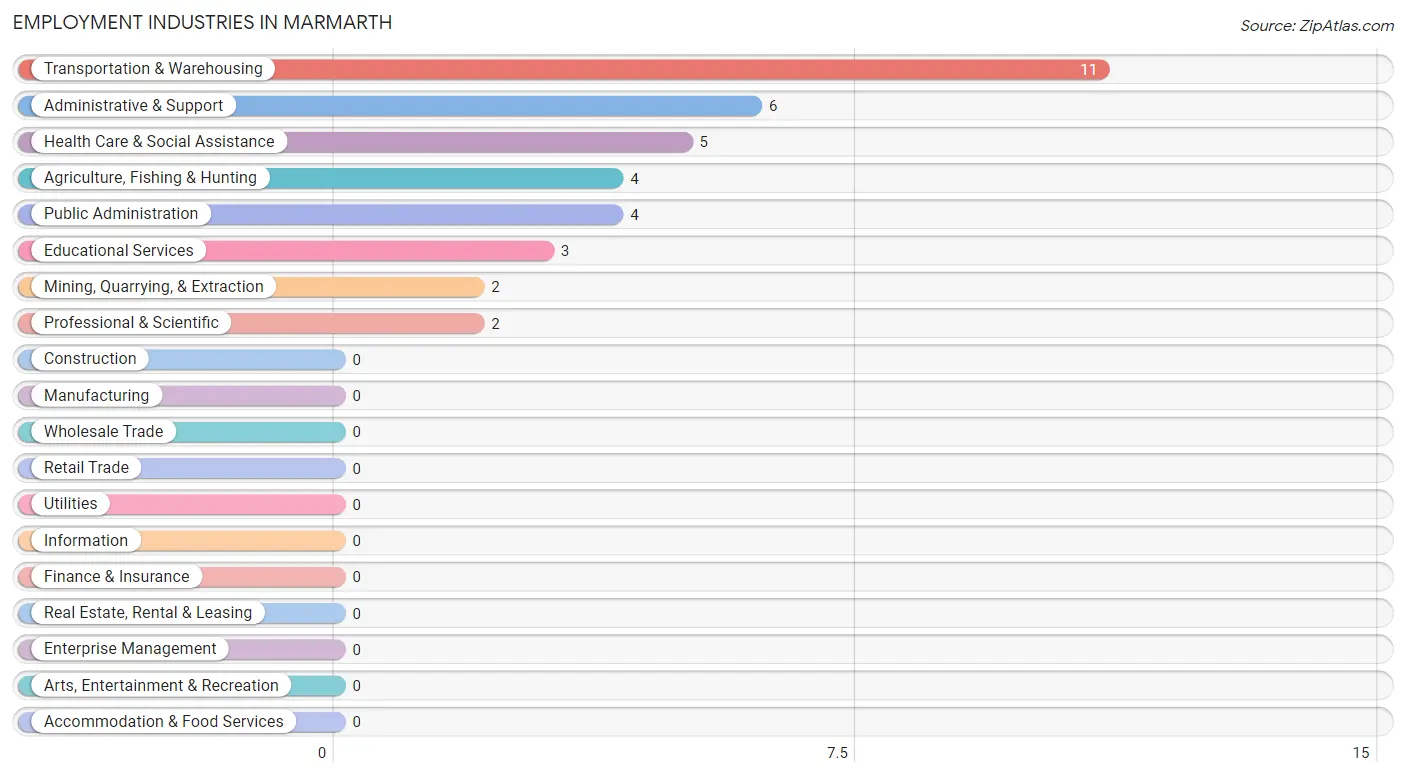
Employment Industries in Marmarth
The major employment industries in Marmarth include Transportation & Warehousing (11 | 29.7%), Administrative & Support (6 | 16.2%), Health Care & Social Assistance (5 | 13.5%), Agriculture, Fishing & Hunting (4 | 10.8%), and Public Administration (4 | 10.8%).
Employment Industries by Sex in Marmarth
The Marmarth industries that see more men than women are Agriculture, Fishing & Hunting (100.0%), Mining, Quarrying, & Extraction (100.0%), and Transportation & Warehousing (100.0%), whereas the industries that tend to have a higher number of women are Professional & Scientific (100.0%), Educational Services (100.0%), and Health Care & Social Assistance (100.0%).
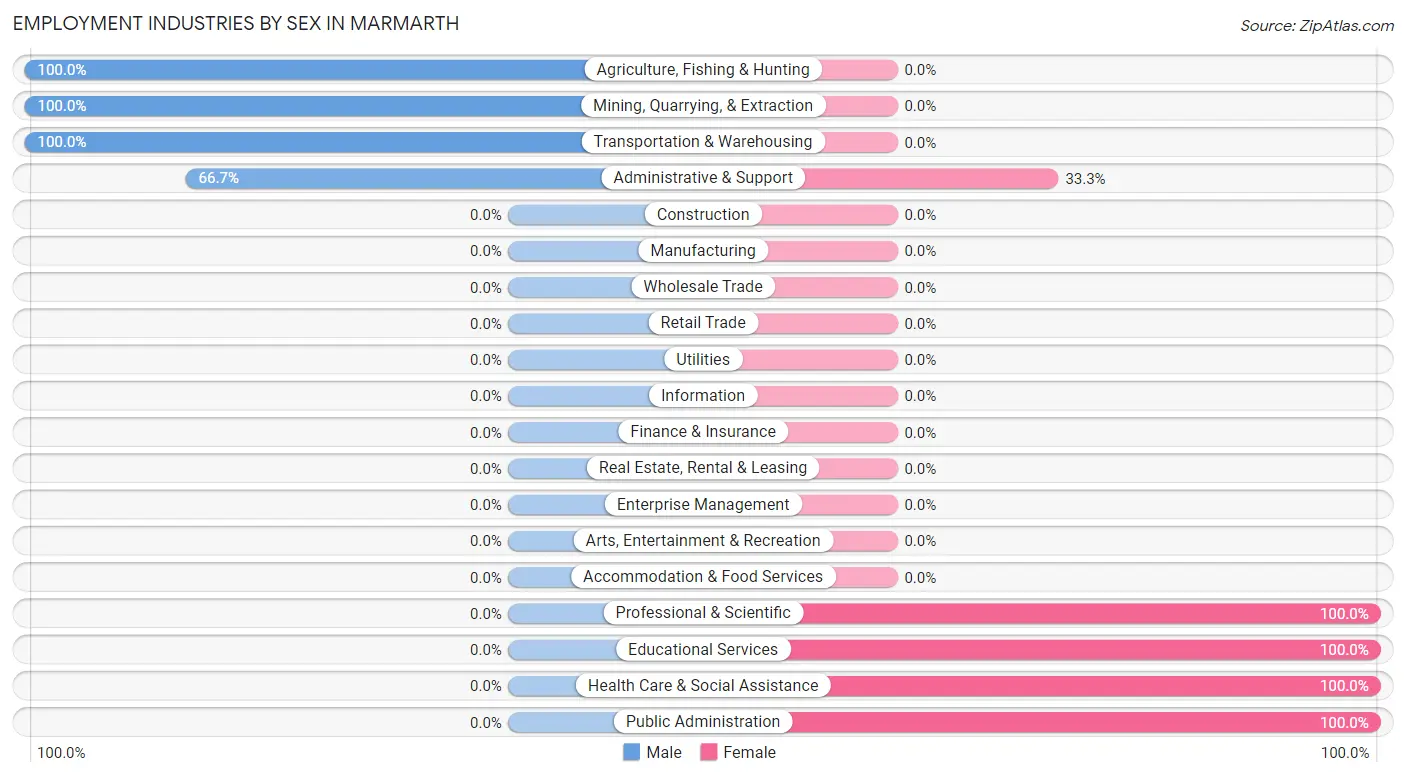
| Industry | Male | Female |
| Agriculture, Fishing & Hunting | 4 (100.0%) | 0 (0.0%) |
| Mining, Quarrying, & Extraction | 2 (100.0%) | 0 (0.0%) |
| Construction | 0 (0.0%) | 0 (0.0%) |
| Manufacturing | 0 (0.0%) | 0 (0.0%) |
| Wholesale Trade | 0 (0.0%) | 0 (0.0%) |
| Retail Trade | 0 (0.0%) | 0 (0.0%) |
| Transportation & Warehousing | 11 (100.0%) | 0 (0.0%) |
| Utilities | 0 (0.0%) | 0 (0.0%) |
| Information | 0 (0.0%) | 0 (0.0%) |
| Finance & Insurance | 0 (0.0%) | 0 (0.0%) |
| Real Estate, Rental & Leasing | 0 (0.0%) | 0 (0.0%) |
| Professional & Scientific | 0 (0.0%) | 2 (100.0%) |
| Enterprise Management | 0 (0.0%) | 0 (0.0%) |
| Administrative & Support | 4 (66.7%) | 2 (33.3%) |
| Educational Services | 0 (0.0%) | 3 (100.0%) |
| Health Care & Social Assistance | 0 (0.0%) | 5 (100.0%) |
| Arts, Entertainment & Recreation | 0 (0.0%) | 0 (0.0%) |
| Accommodation & Food Services | 0 (0.0%) | 0 (0.0%) |
| Public Administration | 0 (0.0%) | 4 (100.0%) |
| Total | 21 (56.8%) | 16 (43.2%) |
Education in Marmarth
School Enrollment in Marmarth
The most common levels of schooling among the 17 students in Marmarth are middle school (9 | 52.9%), and elementary school (8 | 47.1%).
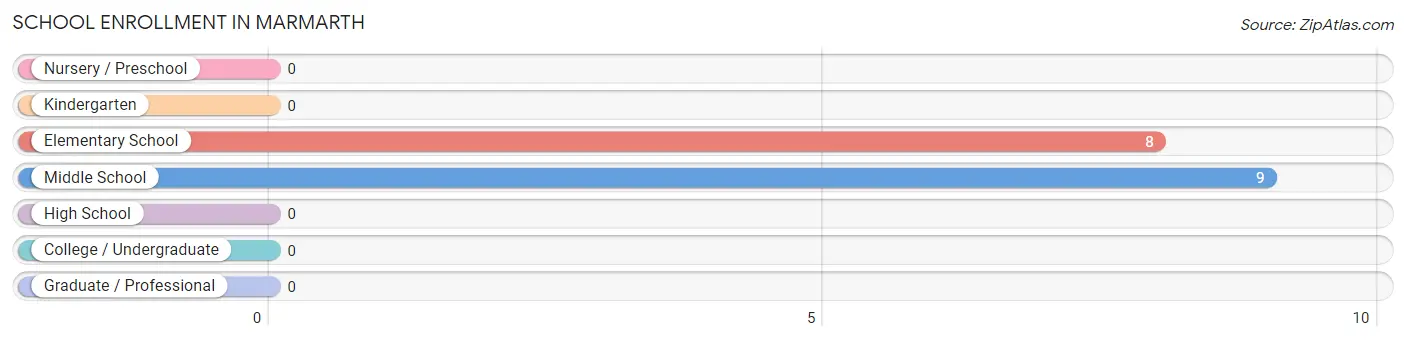
| School Level | # Students | % Students |
| Nursery / Preschool | 0 | 0.0% |
| Kindergarten | 0 | 0.0% |
| Elementary School | 8 | 47.1% |
| Middle School | 9 | 52.9% |
| High School | 0 | 0.0% |
| College / Undergraduate | 0 | 0.0% |
| Graduate / Professional | 0 | 0.0% |
| Total | 17 | 100.0% |
School Enrollment by Age by Funding Source in Marmarth
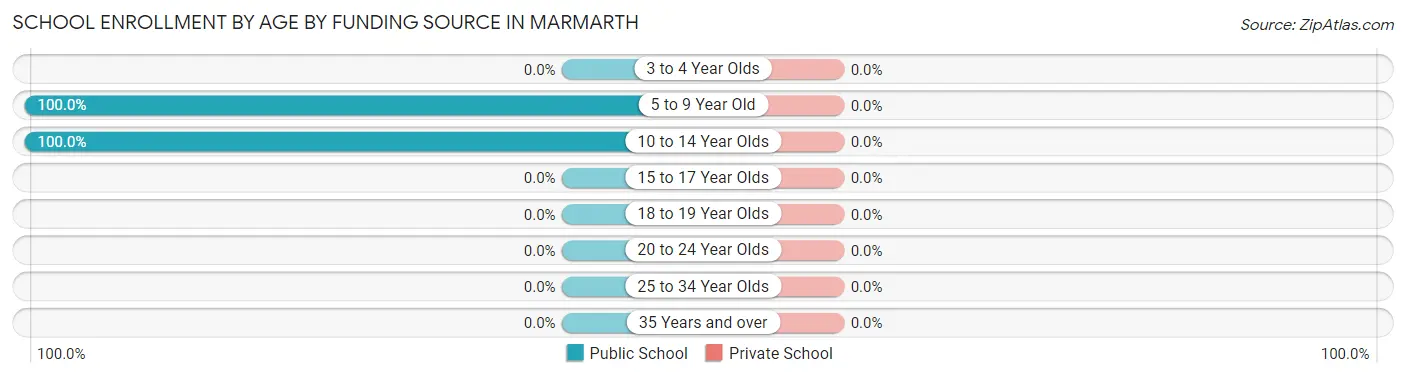
| Age Bracket | Public School | Private School |
| 3 to 4 Year Olds | 0 (0.0%) | 0 (0.0%) |
| 5 to 9 Year Old | 8 (100.0%) | 0 (0.0%) |
| 10 to 14 Year Olds | 9 (100.0%) | 0 (0.0%) |
| 15 to 17 Year Olds | 0 (0.0%) | 0 (0.0%) |
| 18 to 19 Year Olds | 0 (0.0%) | 0 (0.0%) |
| 20 to 24 Year Olds | 0 (0.0%) | 0 (0.0%) |
| 25 to 34 Year Olds | 0 (0.0%) | 0 (0.0%) |
| 35 Years and over | 0 (0.0%) | 0 (0.0%) |
| Total | 17 (100.0%) | 0 (0.0%) |
Educational Attainment by Field of Study in Marmarth
Business (14 | 58.3%), visual & performing arts (5 | 20.8%), computers & mathematics (2 | 8.3%), science & technology (2 | 8.3%), and education (1 | 4.2%) are the most common fields of study among 24 individuals in Marmarth who have obtained a bachelor's degree or higher.
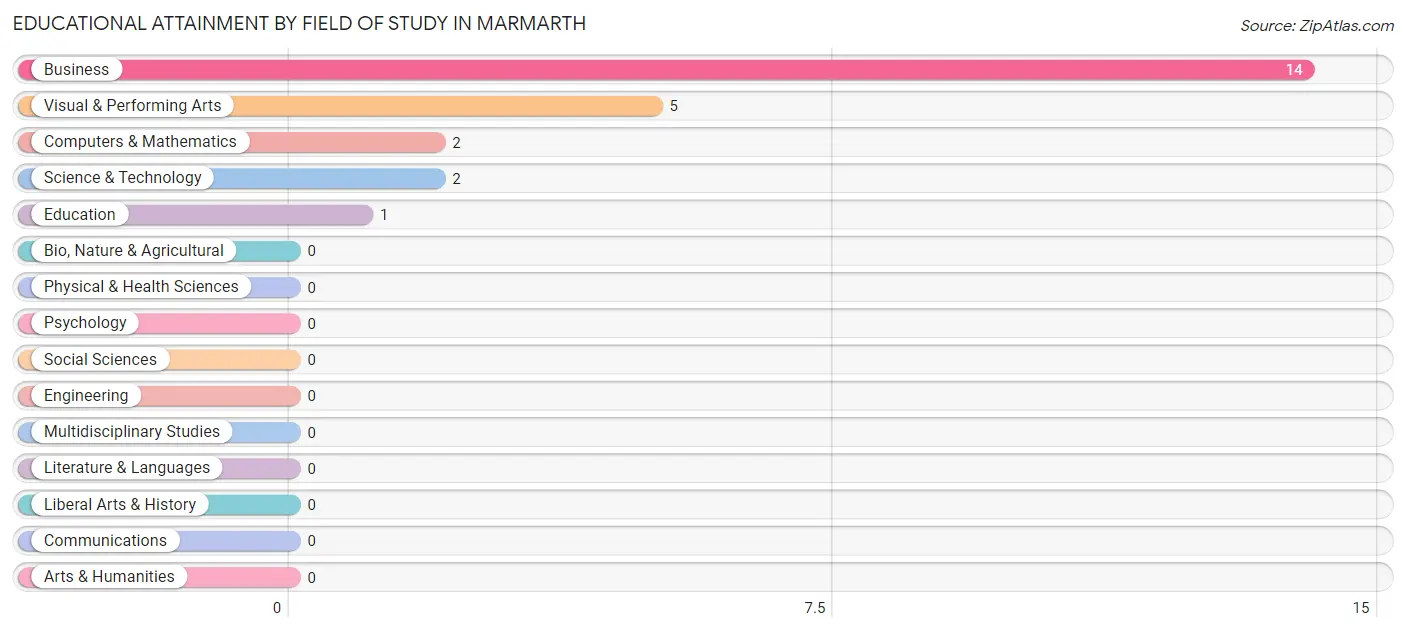
| Field of Study | # Graduates | % Graduates |
| Computers & Mathematics | 2 | 8.3% |
| Bio, Nature & Agricultural | 0 | 0.0% |
| Physical & Health Sciences | 0 | 0.0% |
| Psychology | 0 | 0.0% |
| Social Sciences | 0 | 0.0% |
| Engineering | 0 | 0.0% |
| Multidisciplinary Studies | 0 | 0.0% |
| Science & Technology | 2 | 8.3% |
| Business | 14 | 58.3% |
| Education | 1 | 4.2% |
| Literature & Languages | 0 | 0.0% |
| Liberal Arts & History | 0 | 0.0% |
| Visual & Performing Arts | 5 | 20.8% |
| Communications | 0 | 0.0% |
| Arts & Humanities | 0 | 0.0% |
| Total | 24 | 100.0% |
Transportation & Commute in Marmarth
Vehicle Availability by Sex in Marmarth
The most prevalent vehicle ownership categories in Marmarth are males with 4 vehicles (10, accounting for 47.6%) and females with 4 vehicles (11, making up 62.5%).
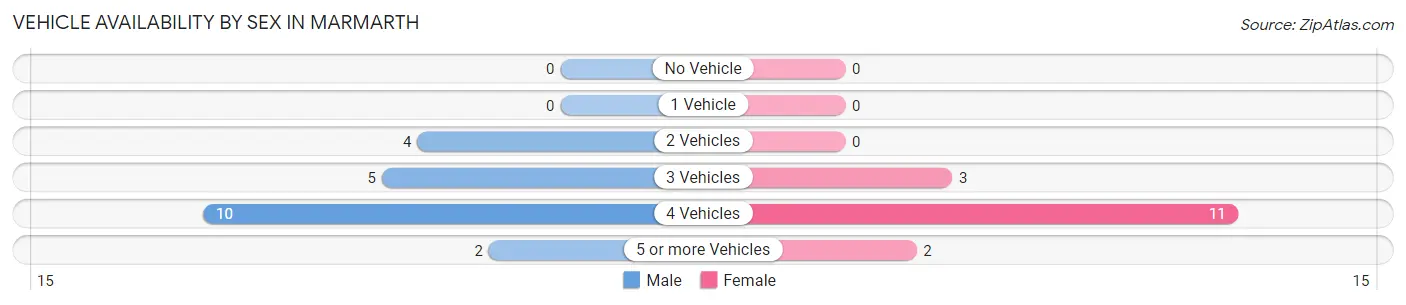
| Vehicles Available | Male | Female |
| No Vehicle | 0 (0.0%) | 0 (0.0%) |
| 1 Vehicle | 0 (0.0%) | 0 (0.0%) |
| 2 Vehicles | 4 (19.1%) | 0 (0.0%) |
| 3 Vehicles | 5 (23.8%) | 3 (18.8%) |
| 4 Vehicles | 10 (47.6%) | 11 (68.8%) |
| 5 or more Vehicles | 2 (9.5%) | 2 (12.5%) |
| Total | 21 (100.0%) | 16 (100.0%) |
Commute Time in Marmarth
The most frequently occuring commute durations in Marmarth are 15 to 19 minutes (14 commuters, 40.0%), 10 to 14 minutes (5 commuters, 14.3%), and 90 or more minutes (5 commuters, 14.3%).
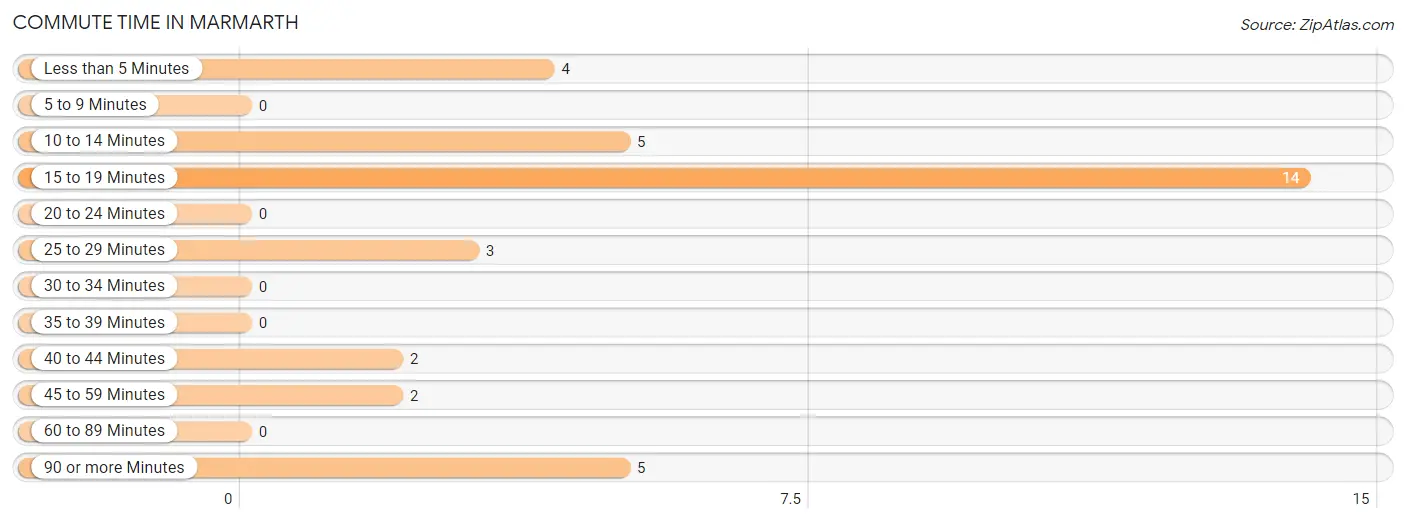
| Commute Time | # Commuters | % Commuters |
| Less than 5 Minutes | 4 | 11.4% |
| 5 to 9 Minutes | 0 | 0.0% |
| 10 to 14 Minutes | 5 | 14.3% |
| 15 to 19 Minutes | 14 | 40.0% |
| 20 to 24 Minutes | 0 | 0.0% |
| 25 to 29 Minutes | 3 | 8.6% |
| 30 to 34 Minutes | 0 | 0.0% |
| 35 to 39 Minutes | 0 | 0.0% |
| 40 to 44 Minutes | 2 | 5.7% |
| 45 to 59 Minutes | 2 | 5.7% |
| 60 to 89 Minutes | 0 | 0.0% |
| 90 or more Minutes | 5 | 14.3% |
Commute Time by Sex in Marmarth
The most common commute times in Marmarth are 15 to 19 minutes (14 commuters, 66.7%) for males and 10 to 14 minutes (5 commuters, 35.7%) for females.
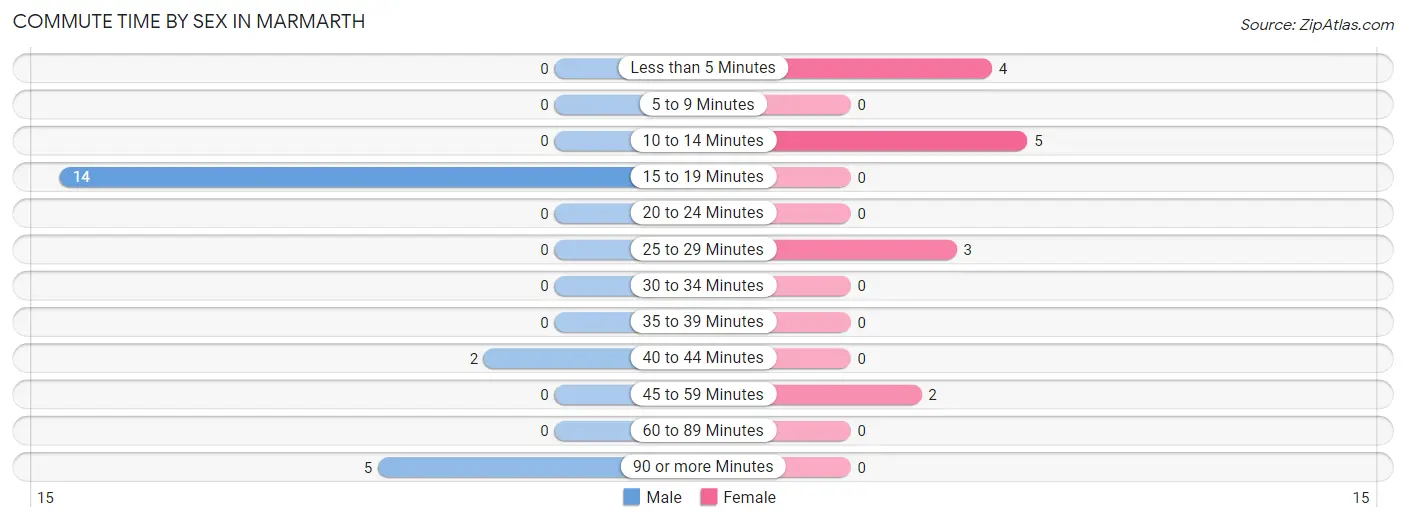
| Commute Time | Male | Female |
| Less than 5 Minutes | 0 (0.0%) | 4 (28.6%) |
| 5 to 9 Minutes | 0 (0.0%) | 0 (0.0%) |
| 10 to 14 Minutes | 0 (0.0%) | 5 (35.7%) |
| 15 to 19 Minutes | 14 (66.7%) | 0 (0.0%) |
| 20 to 24 Minutes | 0 (0.0%) | 0 (0.0%) |
| 25 to 29 Minutes | 0 (0.0%) | 3 (21.4%) |
| 30 to 34 Minutes | 0 (0.0%) | 0 (0.0%) |
| 35 to 39 Minutes | 0 (0.0%) | 0 (0.0%) |
| 40 to 44 Minutes | 2 (9.5%) | 0 (0.0%) |
| 45 to 59 Minutes | 0 (0.0%) | 2 (14.3%) |
| 60 to 89 Minutes | 0 (0.0%) | 0 (0.0%) |
| 90 or more Minutes | 5 (23.8%) | 0 (0.0%) |
Time of Departure to Work by Sex in Marmarth
The most frequent times of departure to work in Marmarth are 7:00 AM to 7:29 AM (12, 57.1%) for males and 7:00 AM to 7:29 AM (5, 35.7%) for females.
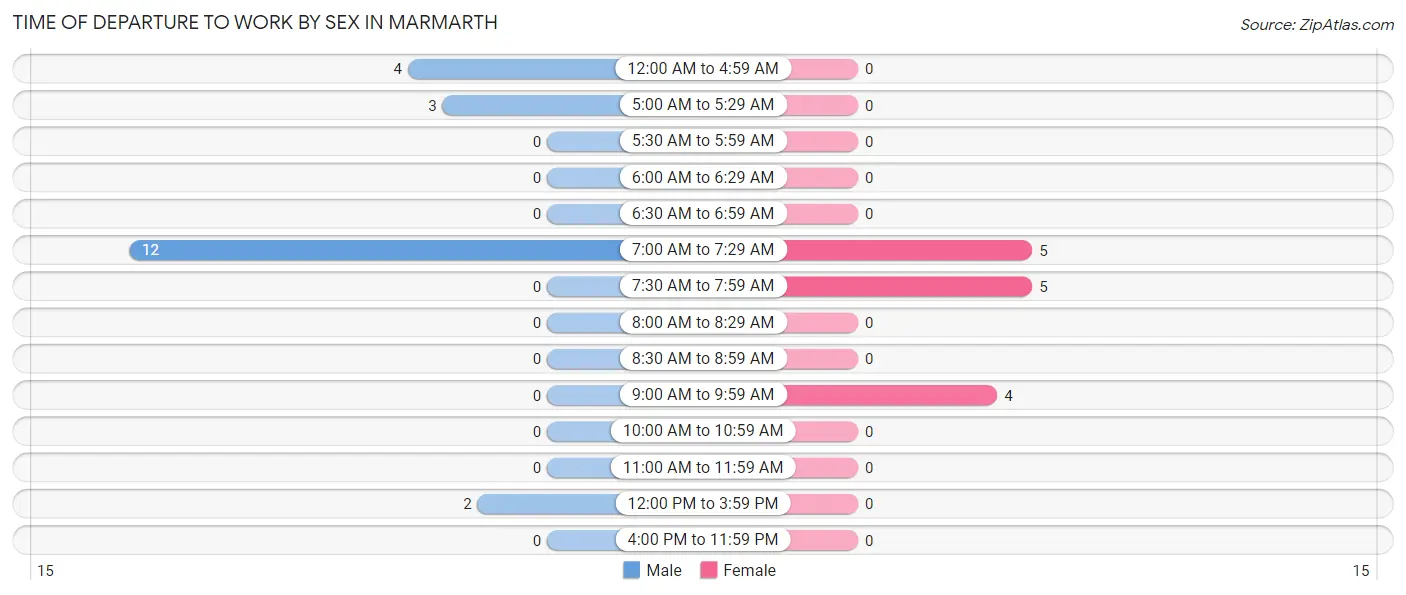
| Time of Departure | Male | Female |
| 12:00 AM to 4:59 AM | 4 (19.1%) | 0 (0.0%) |
| 5:00 AM to 5:29 AM | 3 (14.3%) | 0 (0.0%) |
| 5:30 AM to 5:59 AM | 0 (0.0%) | 0 (0.0%) |
| 6:00 AM to 6:29 AM | 0 (0.0%) | 0 (0.0%) |
| 6:30 AM to 6:59 AM | 0 (0.0%) | 0 (0.0%) |
| 7:00 AM to 7:29 AM | 12 (57.1%) | 5 (35.7%) |
| 7:30 AM to 7:59 AM | 0 (0.0%) | 5 (35.7%) |
| 8:00 AM to 8:29 AM | 0 (0.0%) | 0 (0.0%) |
| 8:30 AM to 8:59 AM | 0 (0.0%) | 0 (0.0%) |
| 9:00 AM to 9:59 AM | 0 (0.0%) | 4 (28.6%) |
| 10:00 AM to 10:59 AM | 0 (0.0%) | 0 (0.0%) |
| 11:00 AM to 11:59 AM | 0 (0.0%) | 0 (0.0%) |
| 12:00 PM to 3:59 PM | 2 (9.5%) | 0 (0.0%) |
| 4:00 PM to 11:59 PM | 0 (0.0%) | 0 (0.0%) |
| Total | 21 (100.0%) | 14 (100.0%) |
Housing Occupancy in Marmarth
Occupancy by Ownership in Marmarth
Of the total 55 dwellings in Marmarth, owner-occupied units account for 47 (85.5%), while renter-occupied units make up 8 (14.5%).
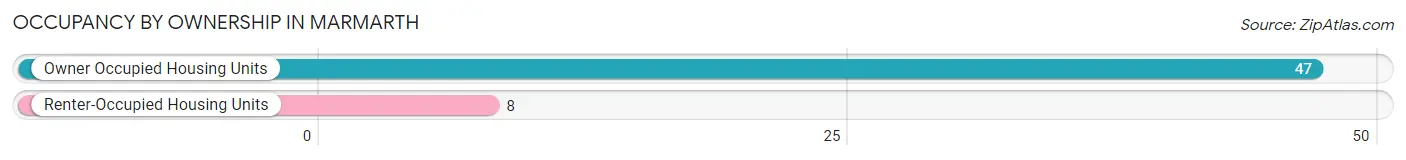
| Occupancy | # Housing Units | % Housing Units |
| Owner Occupied Housing Units | 47 | 85.5% |
| Renter-Occupied Housing Units | 8 | 14.5% |
| Total Occupied Housing Units | 55 | 100.0% |
Occupancy by Household Size in Marmarth
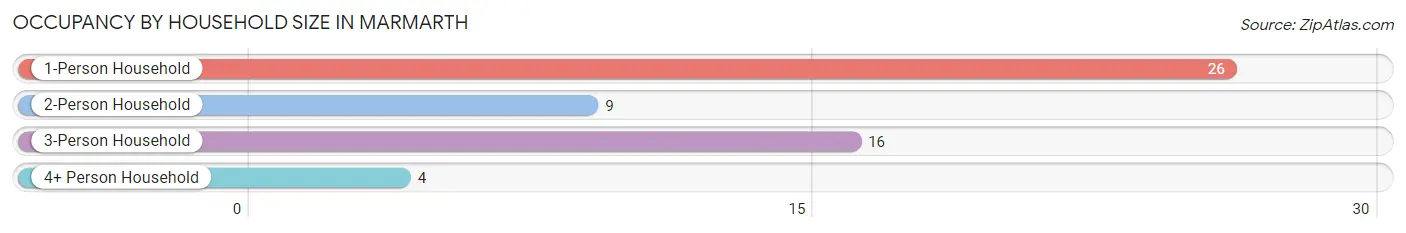
| Household Size | # Housing Units | % Housing Units |
| 1-Person Household | 26 | 47.3% |
| 2-Person Household | 9 | 16.4% |
| 3-Person Household | 16 | 29.1% |
| 4+ Person Household | 4 | 7.3% |
| Total Housing Units | 55 | 100.0% |
Occupancy by Ownership by Household Size in Marmarth
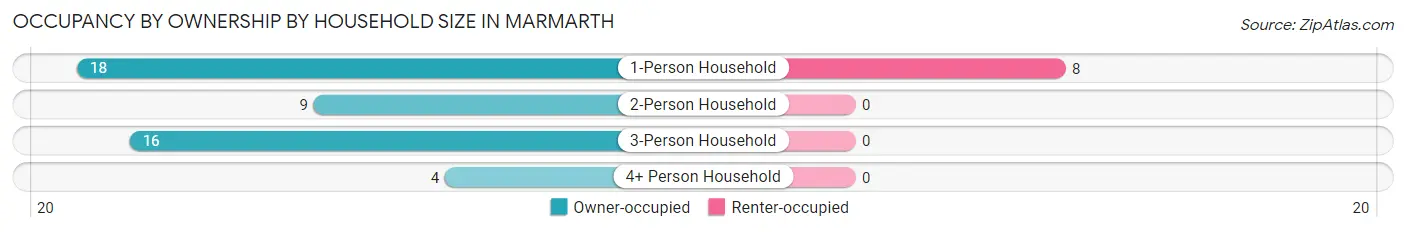
| Household Size | Owner-occupied | Renter-occupied |
| 1-Person Household | 18 (69.2%) | 8 (30.8%) |
| 2-Person Household | 9 (100.0%) | 0 (0.0%) |
| 3-Person Household | 16 (100.0%) | 0 (0.0%) |
| 4+ Person Household | 4 (100.0%) | 0 (0.0%) |
| Total Housing Units | 47 (85.5%) | 8 (14.5%) |
Occupancy by Educational Attainment in Marmarth
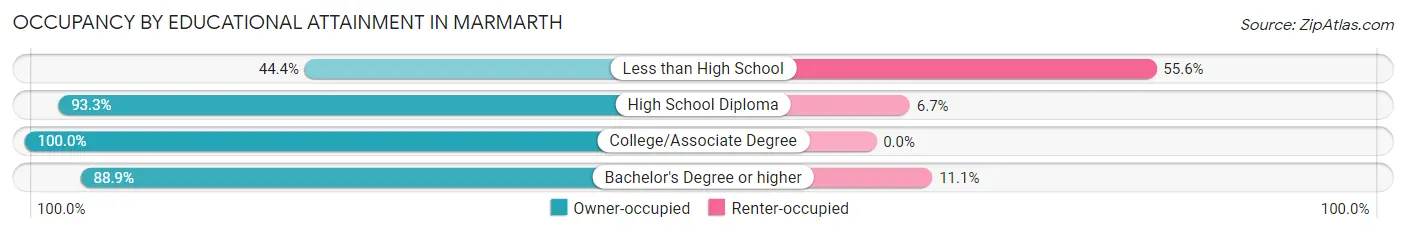
| Household Size | Owner-occupied | Renter-occupied |
| Less than High School | 4 (44.4%) | 5 (55.6%) |
| High School Diploma | 14 (93.3%) | 1 (6.7%) |
| College/Associate Degree | 13 (100.0%) | 0 (0.0%) |
| Bachelor's Degree or higher | 16 (88.9%) | 2 (11.1%) |
Occupancy by Age of Householder in Marmarth
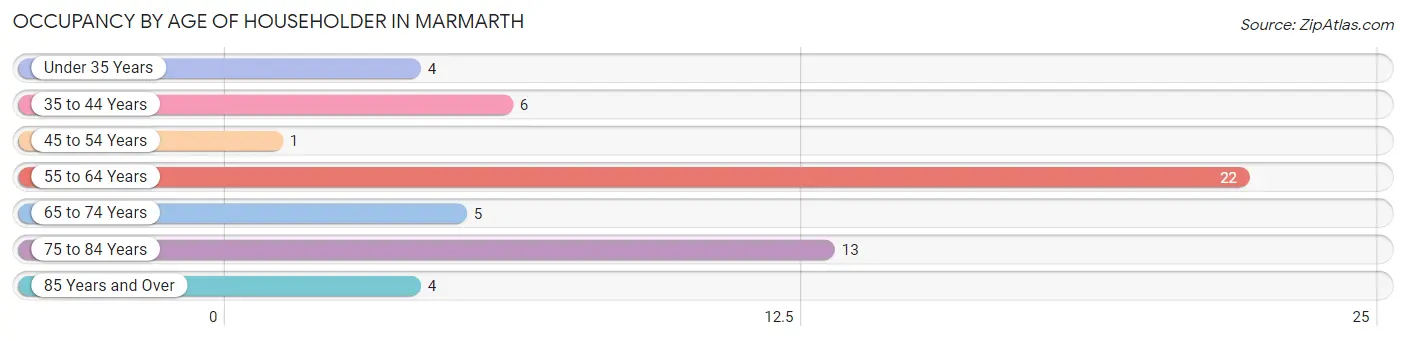
| Age Bracket | # Households | % Households |
| Under 35 Years | 4 | 7.3% |
| 35 to 44 Years | 6 | 10.9% |
| 45 to 54 Years | 1 | 1.8% |
| 55 to 64 Years | 22 | 40.0% |
| 65 to 74 Years | 5 | 9.1% |
| 75 to 84 Years | 13 | 23.6% |
| 85 Years and Over | 4 | 7.3% |
| Total | 55 | 100.0% |
Housing Finances in Marmarth
Median Income by Occupancy in Marmarth
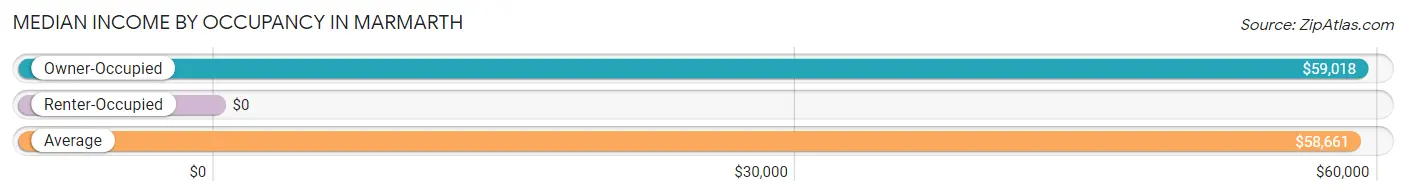
| Occupancy Type | # Households | Median Income |
| Owner-Occupied | 47 (85.5%) | $59,018 |
| Renter-Occupied | 8 (14.5%) | $0 |
| Average | 55 (100.0%) | $58,661 |
Occupancy by Householder Income Bracket in Marmarth
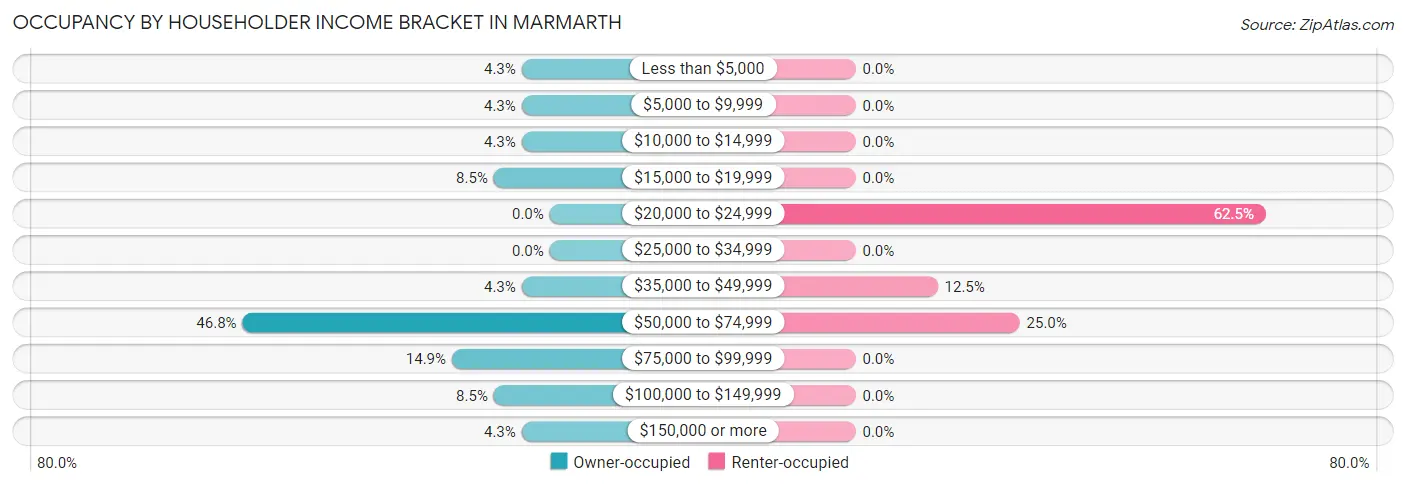
| Income Bracket | Owner-occupied | Renter-occupied |
| Less than $5,000 | 2 (4.3%) | 0 (0.0%) |
| $5,000 to $9,999 | 2 (4.3%) | 0 (0.0%) |
| $10,000 to $14,999 | 2 (4.3%) | 0 (0.0%) |
| $15,000 to $19,999 | 4 (8.5%) | 0 (0.0%) |
| $20,000 to $24,999 | 0 (0.0%) | 5 (62.5%) |
| $25,000 to $34,999 | 0 (0.0%) | 0 (0.0%) |
| $35,000 to $49,999 | 2 (4.3%) | 1 (12.5%) |
| $50,000 to $74,999 | 22 (46.8%) | 2 (25.0%) |
| $75,000 to $99,999 | 7 (14.9%) | 0 (0.0%) |
| $100,000 to $149,999 | 4 (8.5%) | 0 (0.0%) |
| $150,000 or more | 2 (4.3%) | 0 (0.0%) |
| Total | 47 (100.0%) | 8 (100.0%) |
Monthly Housing Cost Tiers in Marmarth
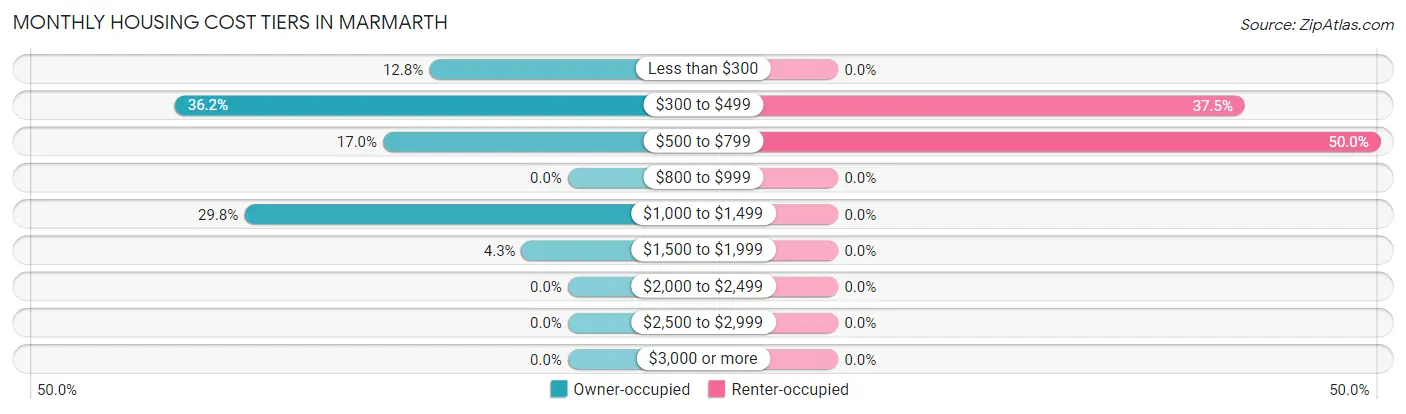
| Monthly Cost | Owner-occupied | Renter-occupied |
| Less than $300 | 6 (12.8%) | 0 (0.0%) |
| $300 to $499 | 17 (36.2%) | 3 (37.5%) |
| $500 to $799 | 8 (17.0%) | 4 (50.0%) |
| $800 to $999 | 0 (0.0%) | 0 (0.0%) |
| $1,000 to $1,499 | 14 (29.8%) | 0 (0.0%) |
| $1,500 to $1,999 | 2 (4.3%) | 0 (0.0%) |
| $2,000 to $2,499 | 0 (0.0%) | 0 (0.0%) |
| $2,500 to $2,999 | 0 (0.0%) | 0 (0.0%) |
| $3,000 or more | 0 (0.0%) | 0 (0.0%) |
| Total | 47 (100.0%) | 8 (100.0%) |
Physical Housing Characteristics in Marmarth
Housing Structures in Marmarth
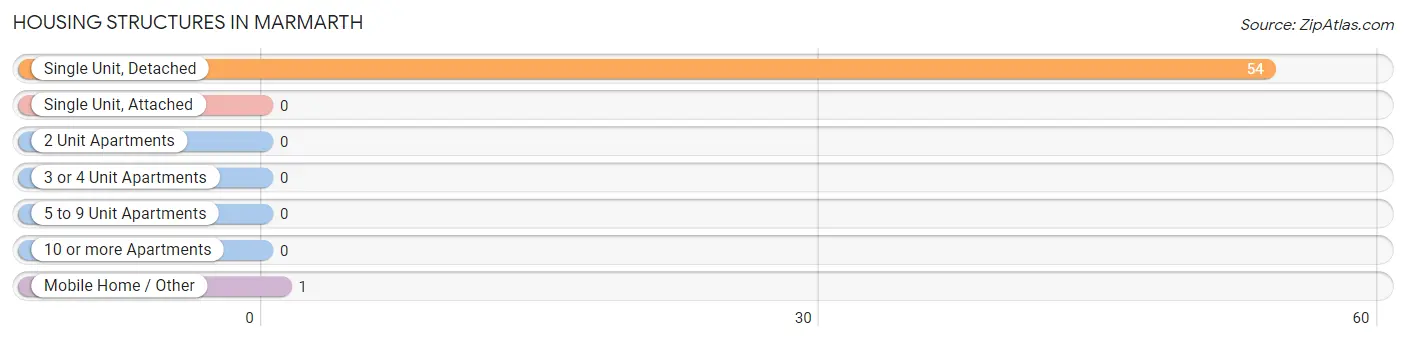
| Structure Type | # Housing Units | % Housing Units |
| Single Unit, Detached | 54 | 98.2% |
| Single Unit, Attached | 0 | 0.0% |
| 2 Unit Apartments | 0 | 0.0% |
| 3 or 4 Unit Apartments | 0 | 0.0% |
| 5 to 9 Unit Apartments | 0 | 0.0% |
| 10 or more Apartments | 0 | 0.0% |
| Mobile Home / Other | 1 | 1.8% |
| Total | 55 | 100.0% |
Housing Structures by Occupancy in Marmarth
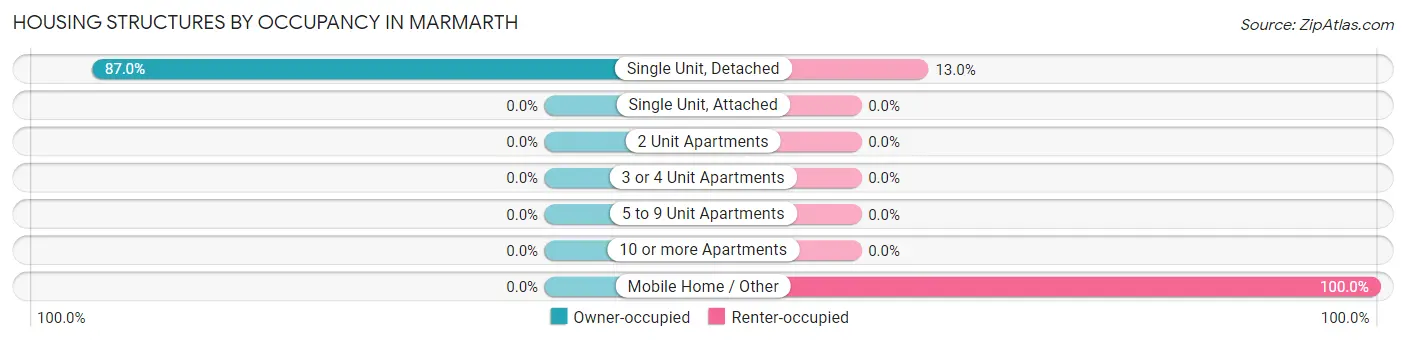
| Structure Type | Owner-occupied | Renter-occupied |
| Single Unit, Detached | 47 (87.0%) | 7 (13.0%) |
| Single Unit, Attached | 0 (0.0%) | 0 (0.0%) |
| 2 Unit Apartments | 0 (0.0%) | 0 (0.0%) |
| 3 or 4 Unit Apartments | 0 (0.0%) | 0 (0.0%) |
| 5 to 9 Unit Apartments | 0 (0.0%) | 0 (0.0%) |
| 10 or more Apartments | 0 (0.0%) | 0 (0.0%) |
| Mobile Home / Other | 0 (0.0%) | 1 (100.0%) |
| Total | 47 (85.5%) | 8 (14.5%) |
Housing Structures by Number of Rooms in Marmarth
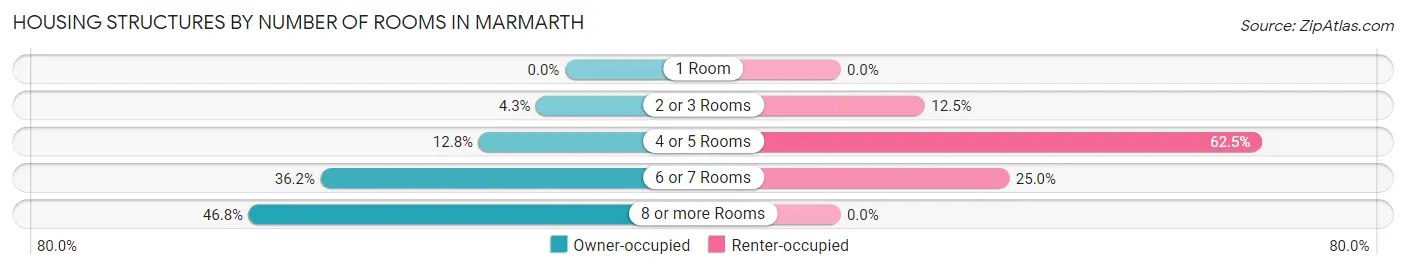
| Number of Rooms | Owner-occupied | Renter-occupied |
| 1 Room | 0 (0.0%) | 0 (0.0%) |
| 2 or 3 Rooms | 2 (4.3%) | 1 (12.5%) |
| 4 or 5 Rooms | 6 (12.8%) | 5 (62.5%) |
| 6 or 7 Rooms | 17 (36.2%) | 2 (25.0%) |
| 8 or more Rooms | 22 (46.8%) | 0 (0.0%) |
| Total | 47 (100.0%) | 8 (100.0%) |
Housing Structure by Heating Type in Marmarth
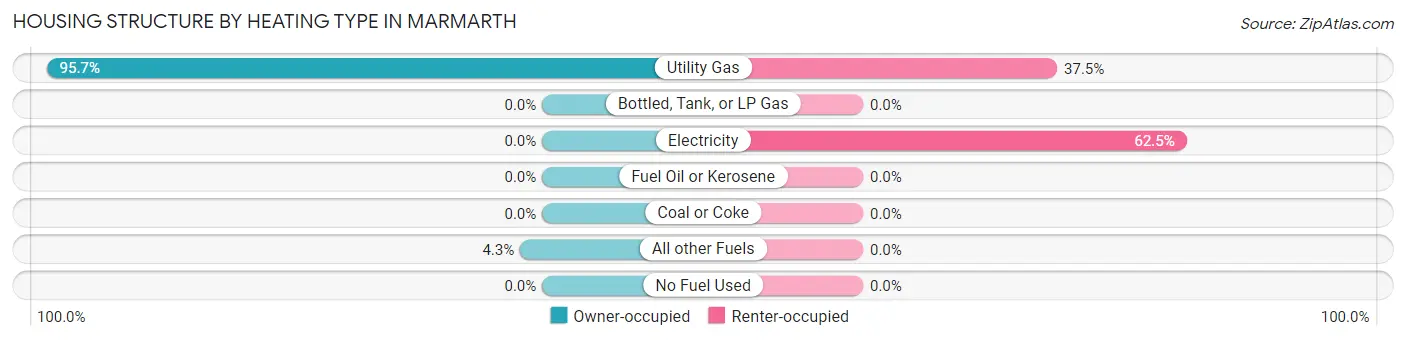
| Heating Type | Owner-occupied | Renter-occupied |
| Utility Gas | 45 (95.7%) | 3 (37.5%) |
| Bottled, Tank, or LP Gas | 0 (0.0%) | 0 (0.0%) |
| Electricity | 0 (0.0%) | 5 (62.5%) |
| Fuel Oil or Kerosene | 0 (0.0%) | 0 (0.0%) |
| Coal or Coke | 0 (0.0%) | 0 (0.0%) |
| All other Fuels | 2 (4.3%) | 0 (0.0%) |
| No Fuel Used | 0 (0.0%) | 0 (0.0%) |
| Total | 47 (100.0%) | 8 (100.0%) |
Household Vehicle Usage in Marmarth
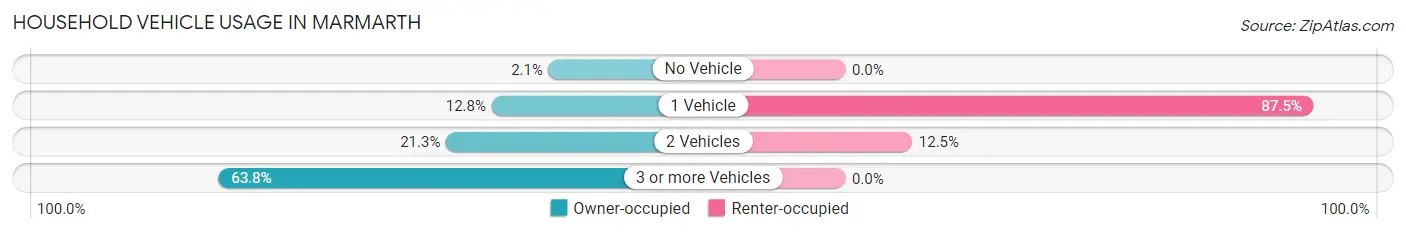
| Vehicles per Household | Owner-occupied | Renter-occupied |
| No Vehicle | 1 (2.1%) | 0 (0.0%) |
| 1 Vehicle | 6 (12.8%) | 7 (87.5%) |
| 2 Vehicles | 10 (21.3%) | 1 (12.5%) |
| 3 or more Vehicles | 30 (63.8%) | 0 (0.0%) |
| Total | 47 (100.0%) | 8 (100.0%) |
Real Estate & Mortgages in Marmarth
Real Estate and Mortgage Overview in Marmarth
| Characteristic | Without Mortgage | With Mortgage |
| Housing Units | 42 | 5 |
| Median Property Value | $39,200 | $0 |
| Median Household Income | $59,107 | $2 |
| Monthly Housing Costs | - | - |
| Real Estate Taxes | $199 | $0 |
Property Value by Mortgage Status in Marmarth
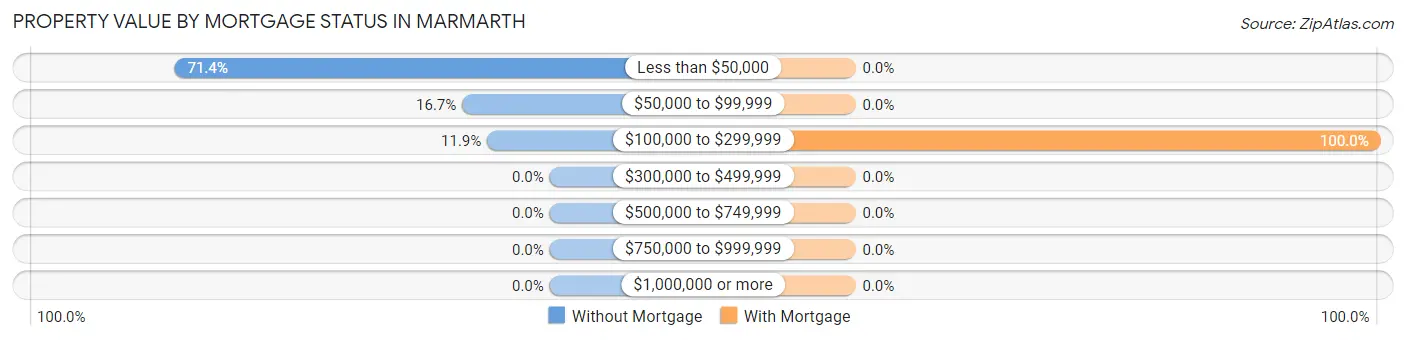
| Property Value | Without Mortgage | With Mortgage |
| Less than $50,000 | 30 (71.4%) | 0 (0.0%) |
| $50,000 to $99,999 | 7 (16.7%) | 0 (0.0%) |
| $100,000 to $299,999 | 5 (11.9%) | 5 (100.0%) |
| $300,000 to $499,999 | 0 (0.0%) | 0 (0.0%) |
| $500,000 to $749,999 | 0 (0.0%) | 0 (0.0%) |
| $750,000 to $999,999 | 0 (0.0%) | 0 (0.0%) |
| $1,000,000 or more | 0 (0.0%) | 0 (0.0%) |
| Total | 42 (100.0%) | 5 (100.0%) |
Household Income by Mortgage Status in Marmarth
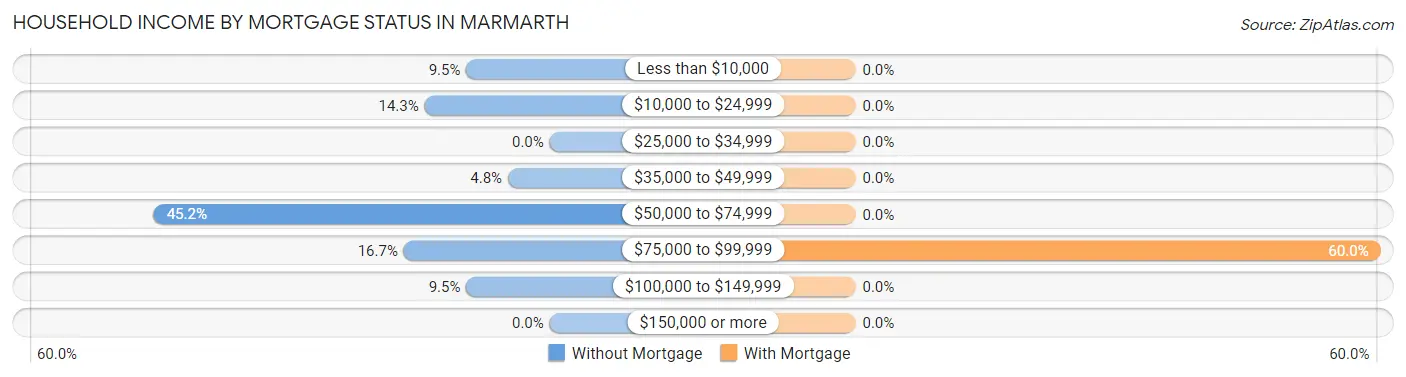
| Household Income | Without Mortgage | With Mortgage |
| Less than $10,000 | 4 (9.5%) | 0 (0.0%) |
| $10,000 to $24,999 | 6 (14.3%) | 0 (0.0%) |
| $25,000 to $34,999 | 0 (0.0%) | 0 (0.0%) |
| $35,000 to $49,999 | 2 (4.8%) | 0 (0.0%) |
| $50,000 to $74,999 | 19 (45.2%) | 0 (0.0%) |
| $75,000 to $99,999 | 7 (16.7%) | 3 (60.0%) |
| $100,000 to $149,999 | 4 (9.5%) | 0 (0.0%) |
| $150,000 or more | 0 (0.0%) | 0 (0.0%) |
| Total | 42 (100.0%) | 5 (100.0%) |
Property Value to Household Income Ratio in Marmarth
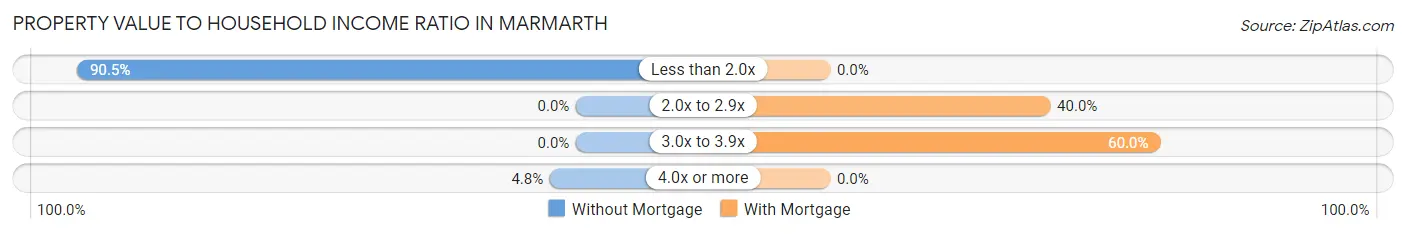
| Value-to-Income Ratio | Without Mortgage | With Mortgage |
| Less than 2.0x | 38 (90.5%) | 0 (0.0%) |
| 2.0x to 2.9x | 0 (0.0%) | 2 (40.0%) |
| 3.0x to 3.9x | 0 (0.0%) | 3 (60.0%) |
| 4.0x or more | 2 (4.8%) | 0 (0.0%) |
| Total | 42 (100.0%) | 5 (100.0%) |
Real Estate Taxes by Mortgage Status in Marmarth
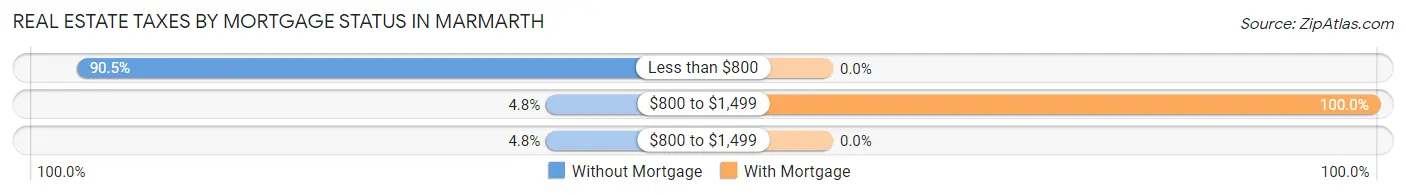
| Property Taxes | Without Mortgage | With Mortgage |
| Less than $800 | 38 (90.5%) | 0 (0.0%) |
| $800 to $1,499 | 2 (4.8%) | 5 (100.0%) |
| $800 to $1,499 | 2 (4.8%) | 0 (0.0%) |
| Total | 42 (100.0%) | 5 (100.0%) |
Health & Disability in Marmarth
Health Insurance Coverage by Age in Marmarth
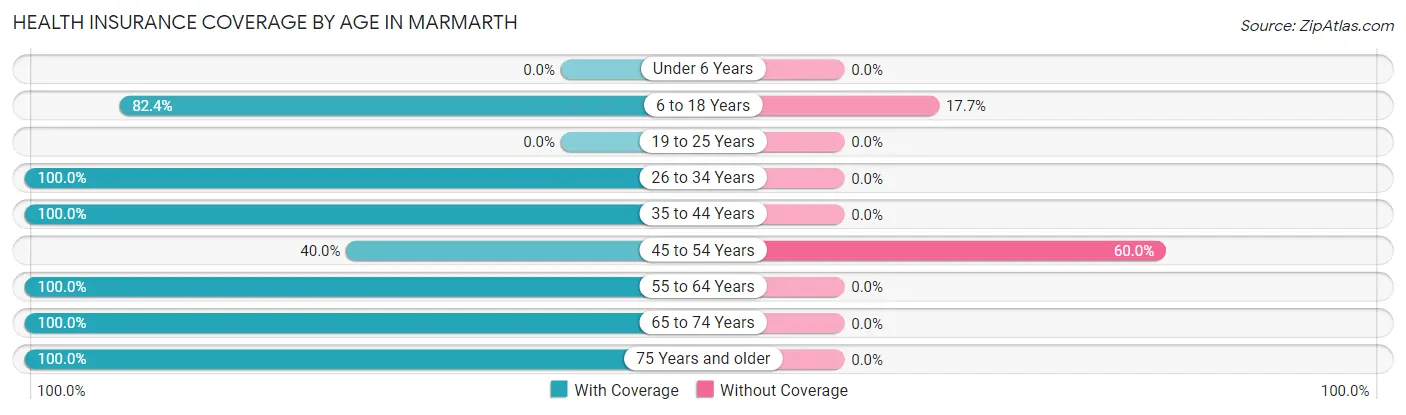
| Age Bracket | With Coverage | Without Coverage |
| Under 6 Years | 0 (0.0%) | 0 (0.0%) |
| 6 to 18 Years | 14 (82.4%) | 3 (17.6%) |
| 19 to 25 Years | 0 (0.0%) | 0 (0.0%) |
| 26 to 34 Years | 4 (100.0%) | 0 (0.0%) |
| 35 to 44 Years | 12 (100.0%) | 0 (0.0%) |
| 45 to 54 Years | 4 (40.0%) | 6 (60.0%) |
| 55 to 64 Years | 24 (100.0%) | 0 (0.0%) |
| 65 to 74 Years | 9 (100.0%) | 0 (0.0%) |
| 75 Years and older | 17 (100.0%) | 0 (0.0%) |
| Total | 84 (90.3%) | 9 (9.7%) |
Health Insurance Coverage by Citizenship Status in Marmarth
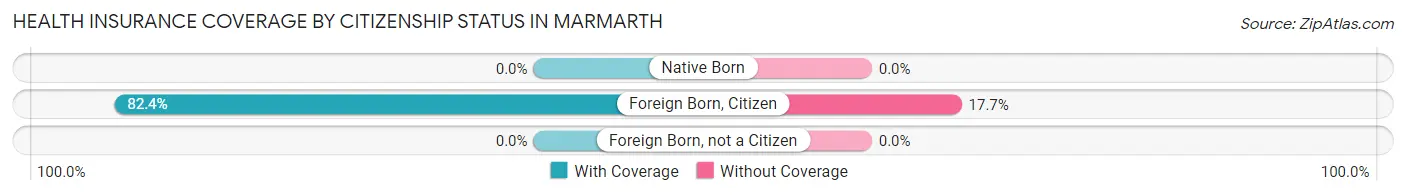
| Citizenship Status | With Coverage | Without Coverage |
| Native Born | 0 (0.0%) | 0 (0.0%) |
| Foreign Born, Citizen | 14 (82.4%) | 3 (17.6%) |
| Foreign Born, not a Citizen | 0 (0.0%) | 0 (0.0%) |
Health Insurance Coverage by Household Income in Marmarth
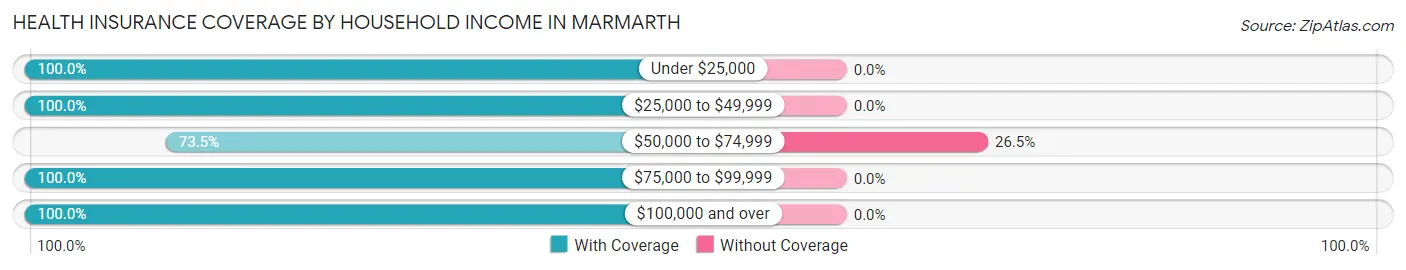
| Household Income | With Coverage | Without Coverage |
| Under $25,000 | 15 (100.0%) | 0 (0.0%) |
| $25,000 to $49,999 | 4 (100.0%) | 0 (0.0%) |
| $50,000 to $74,999 | 25 (73.5%) | 9 (26.5%) |
| $75,000 to $99,999 | 23 (100.0%) | 0 (0.0%) |
| $100,000 and over | 17 (100.0%) | 0 (0.0%) |
Public vs Private Health Insurance Coverage by Age in Marmarth
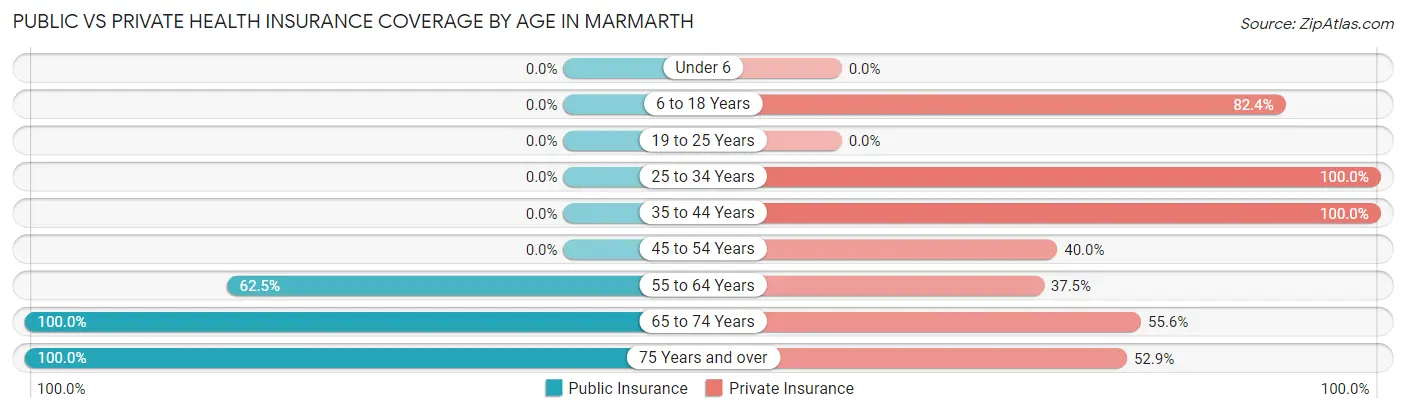
| Age Bracket | Public Insurance | Private Insurance |
| Under 6 | 0 (0.0%) | 0 (0.0%) |
| 6 to 18 Years | 0 (0.0%) | 14 (82.4%) |
| 19 to 25 Years | 0 (0.0%) | 0 (0.0%) |
| 25 to 34 Years | 0 (0.0%) | 4 (100.0%) |
| 35 to 44 Years | 0 (0.0%) | 12 (100.0%) |
| 45 to 54 Years | 0 (0.0%) | 4 (40.0%) |
| 55 to 64 Years | 15 (62.5%) | 9 (37.5%) |
| 65 to 74 Years | 9 (100.0%) | 5 (55.6%) |
| 75 Years and over | 17 (100.0%) | 9 (52.9%) |
| Total | 41 (44.1%) | 57 (61.3%) |
Disability Status by Sex by Age in Marmarth
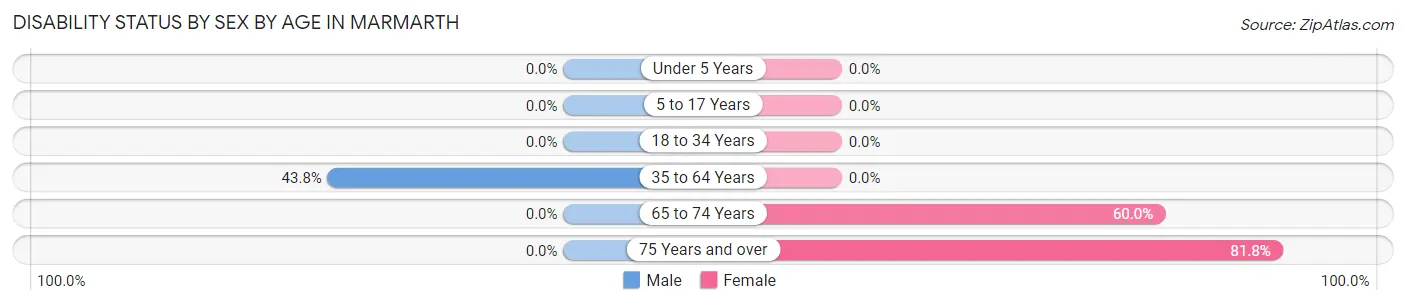
| Age Bracket | Male | Female |
| Under 5 Years | 0 (0.0%) | 0 (0.0%) |
| 5 to 17 Years | 0 (0.0%) | 0 (0.0%) |
| 18 to 34 Years | 0 (0.0%) | 0 (0.0%) |
| 35 to 64 Years | 14 (43.8%) | 0 (0.0%) |
| 65 to 74 Years | 0 (0.0%) | 3 (60.0%) |
| 75 Years and over | 0 (0.0%) | 9 (81.8%) |
Disability Class by Sex by Age in Marmarth
Disability Class: Hearing Difficulty
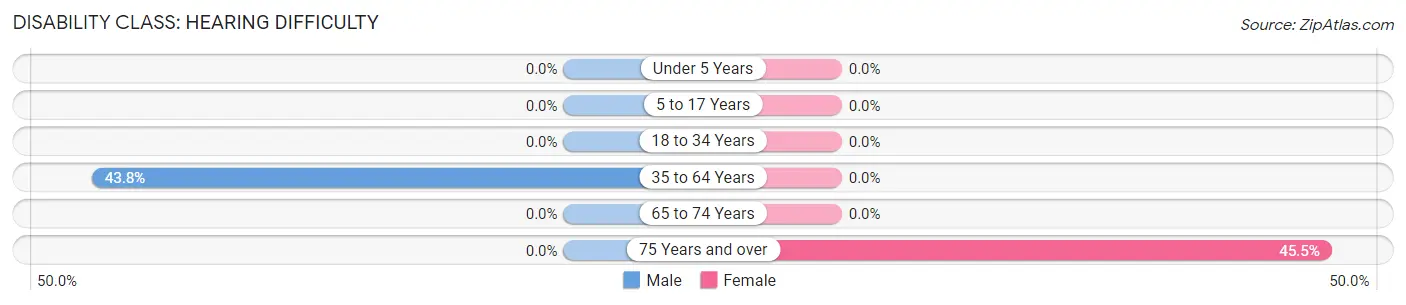
| Age Bracket | Male | Female |
| Under 5 Years | 0 (0.0%) | 0 (0.0%) |
| 5 to 17 Years | 0 (0.0%) | 0 (0.0%) |
| 18 to 34 Years | 0 (0.0%) | 0 (0.0%) |
| 35 to 64 Years | 14 (43.8%) | 0 (0.0%) |
| 65 to 74 Years | 0 (0.0%) | 0 (0.0%) |
| 75 Years and over | 0 (0.0%) | 5 (45.5%) |
Disability Class: Vision Difficulty
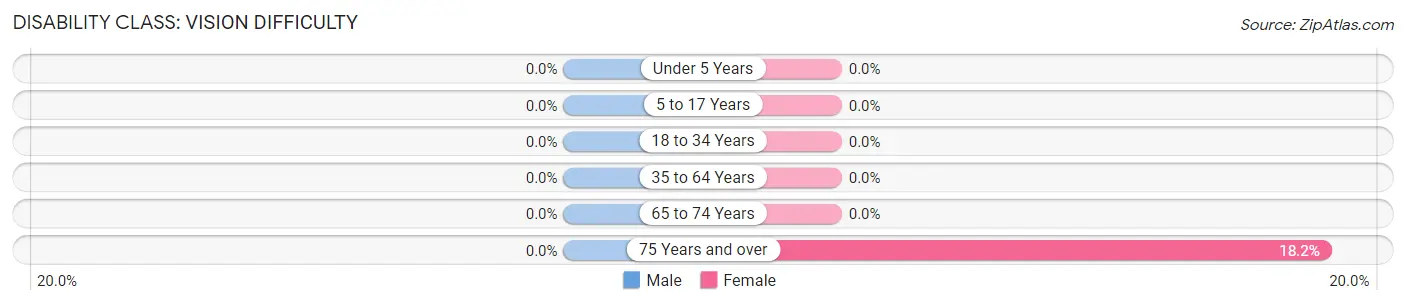
| Age Bracket | Male | Female |
| Under 5 Years | 0 (0.0%) | 0 (0.0%) |
| 5 to 17 Years | 0 (0.0%) | 0 (0.0%) |
| 18 to 34 Years | 0 (0.0%) | 0 (0.0%) |
| 35 to 64 Years | 0 (0.0%) | 0 (0.0%) |
| 65 to 74 Years | 0 (0.0%) | 0 (0.0%) |
| 75 Years and over | 0 (0.0%) | 2 (18.2%) |
Disability Class: Cognitive Difficulty
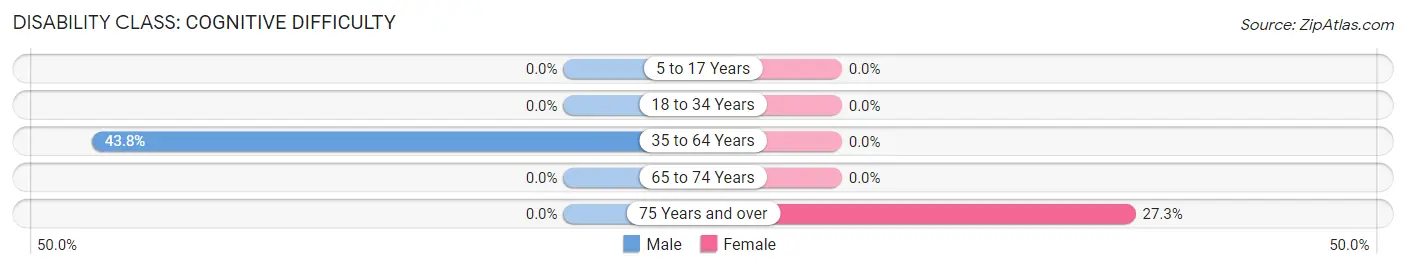
| Age Bracket | Male | Female |
| 5 to 17 Years | 0 (0.0%) | 0 (0.0%) |
| 18 to 34 Years | 0 (0.0%) | 0 (0.0%) |
| 35 to 64 Years | 14 (43.8%) | 0 (0.0%) |
| 65 to 74 Years | 0 (0.0%) | 0 (0.0%) |
| 75 Years and over | 0 (0.0%) | 3 (27.3%) |
Disability Class: Ambulatory Difficulty
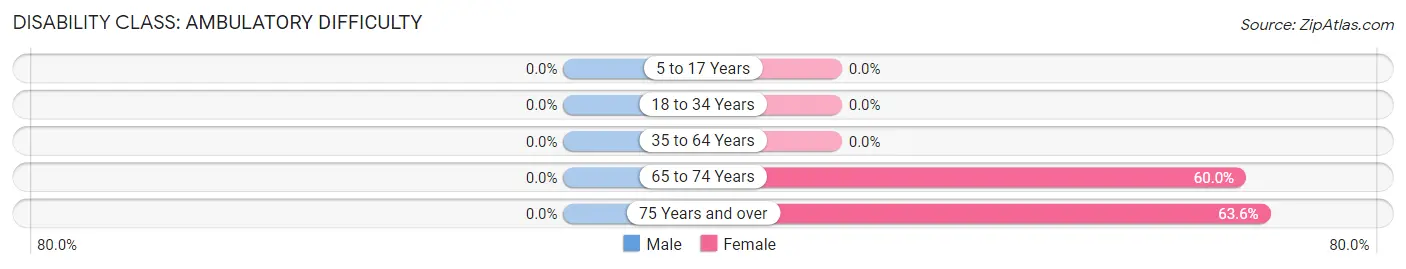
| Age Bracket | Male | Female |
| 5 to 17 Years | 0 (0.0%) | 0 (0.0%) |
| 18 to 34 Years | 0 (0.0%) | 0 (0.0%) |
| 35 to 64 Years | 0 (0.0%) | 0 (0.0%) |
| 65 to 74 Years | 0 (0.0%) | 3 (60.0%) |
| 75 Years and over | 0 (0.0%) | 7 (63.6%) |
Disability Class: Self-Care Difficulty
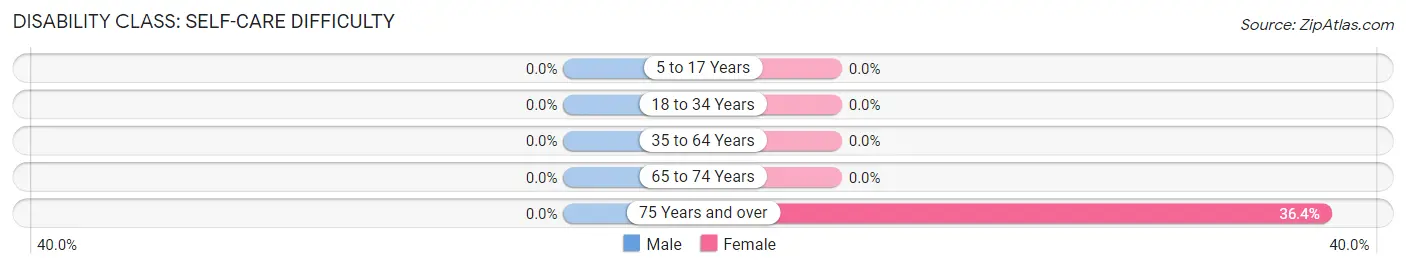
| Age Bracket | Male | Female |
| 5 to 17 Years | 0 (0.0%) | 0 (0.0%) |
| 18 to 34 Years | 0 (0.0%) | 0 (0.0%) |
| 35 to 64 Years | 0 (0.0%) | 0 (0.0%) |
| 65 to 74 Years | 0 (0.0%) | 0 (0.0%) |
| 75 Years and over | 0 (0.0%) | 4 (36.4%) |
Technology Access in Marmarth
Computing Device Access in Marmarth
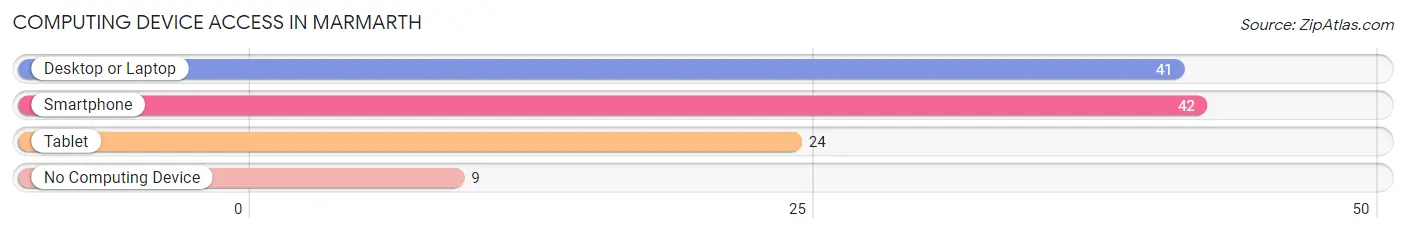
| Device Type | # Households | % Households |
| Desktop or Laptop | 41 | 74.6% |
| Smartphone | 42 | 76.4% |
| Tablet | 24 | 43.6% |
| No Computing Device | 9 | 16.4% |
| Total | 55 | 100.0% |
Internet Access in Marmarth
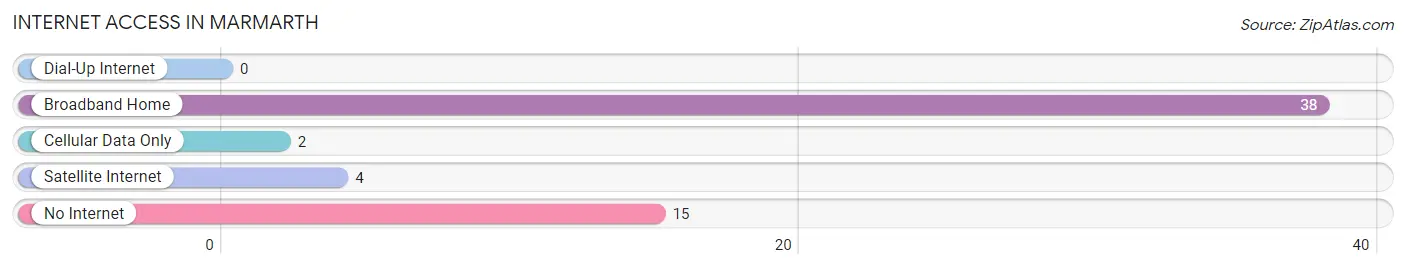
| Internet Type | # Households | % Households |
| Dial-Up Internet | 0 | 0.0% |
| Broadband Home | 38 | 69.1% |
| Cellular Data Only | 2 | 3.6% |
| Satellite Internet | 4 | 7.3% |
| No Internet | 15 | 27.3% |
| Total | 55 | 100.0% |
Marmarth Summary
Marmarth is a small town located in Slope County, North Dakota. It is situated in the southwestern part of the state, approximately 40 miles from the Montana border. The town was founded in 1910 and has a population of approximately 200 people.
Geography
Marmarth is located in the Badlands region of North Dakota. The town is situated on the Little Missouri River, which is a tributary of the Missouri River. The town is surrounded by rolling hills and grasslands, and is located in the heart of the North Dakota Badlands. The town is located at an elevation of 2,400 feet above sea level.
The climate in Marmarth is semi-arid, with hot summers and cold winters. The average annual temperature is around 50 degrees Fahrenheit. The average annual precipitation is around 16 inches.
Economy
The economy of Marmarth is largely based on agriculture. The town is home to several farms and ranches, which produce a variety of crops and livestock. The town also has a small manufacturing sector, which produces a variety of products, including furniture, clothing, and food products.
The town also has a small tourism industry, which is centered around the nearby Badlands National Park. The park attracts visitors from all over the world, and provides a variety of recreational activities, such as hiking, camping, and wildlife viewing.
Demographics
As of the 2010 census, the population of Marmarth was 200 people. The racial makeup of the town was 97.5% White, 0.5% Native American, 0.5% Asian, and 1.5% from two or more races. The median household income was $37,500, and the median family income was $41,250.
The town is served by the Marmarth Public School District, which consists of one elementary school and one high school. The town also has a public library, a post office, and a few small businesses.
Marmarth is a small town with a rich history and a unique culture. The town is home to a variety of people, from ranchers and farmers to tourists and business owners. The town is a great place to live, work, and play, and is a great example of the beauty and diversity of North Dakota.
Common Questions
What is Per Capita Income in Marmarth?
Per Capita income in Marmarth is $41,583.
What is the Median Family Income in Marmarth?
Median Family Income in Marmarth is $59,196.
What is the Median Household income in Marmarth?
Median Household Income in Marmarth is $58,661.
What is Income or Wage Gap in Marmarth?
Income or Wage Gap in Marmarth is 56.4%.
Women in Marmarth earn 43.6 cents for every dollar earned by a man.
What is Inequality or Gini Index in Marmarth?
Inequality or Gini Index in Marmarth is 0.40.
What is the Total Population of Marmarth?
Total Population of Marmarth is 93.
What is the Total Male Population of Marmarth?
Total Male Population of Marmarth is 56.
What is the Total Female Population of Marmarth?
Total Female Population of Marmarth is 37.
What is the Ratio of Males per 100 Females in Marmarth?
There are 151.35 Males per 100 Females in Marmarth.
What is the Ratio of Females per 100 Males in Marmarth?
There are 66.07 Females per 100 Males in Marmarth.
What is the Median Population Age in Marmarth?
Median Population Age in Marmarth is 58.5 Years.
What is the Average Family Size in Marmarth
Average Family Size in Marmarth is 2.3 People.
What is the Average Household Size in Marmarth
Average Household Size in Marmarth is 1.7 People.
How Large is the Labor Force in Marmarth?
There are 38 People in the Labor Forcein in Marmarth.
What is the Percentage of People in the Labor Force in Marmarth?
50.0% of People are in the Labor Force in Marmarth.
What is the Unemployment Rate in Marmarth?
Unemployment Rate in Marmarth is 2.6%.