Leonard, ND Map & Demographics
Leonard Map
Leonard Overview
$38,920
PER CAPITA INCOME
$78,750
AVG FAMILY INCOME
$70,313
AVG HOUSEHOLD INCOME
28.4%
WAGE / INCOME GAP [ % ]
71.6¢/ $1
WAGE / INCOME GAP [ $ ]
0.42
INEQUALITY / GINI INDEX
260
TOTAL POPULATION
127
MALE POPULATION
133
FEMALE POPULATION
95.49
MALES / 100 FEMALES
104.72
FEMALES / 100 MALES
47.3
MEDIAN AGE
2.8
AVG FAMILY SIZE
2.3
AVG HOUSEHOLD SIZE
143
LABOR FORCE [ PEOPLE ]
68.8%
PERCENT IN LABOR FORCE
5.6%
UNEMPLOYMENT RATE
Leonard Zip Codes
Leonard Area Codes
Income in Leonard
Income Overview in Leonard
Per Capita Income in Leonard is $38,920, while median incomes of families and households are $78,750 and $70,313 respectively.
| Characteristic | Number | Measure |
| Per Capita Income | 260 | $38,920 |
| Median Family Income | 80 | $78,750 |
| Mean Family Income | 80 | $106,359 |
| Median Household Income | 113 | $70,313 |
| Mean Household Income | 113 | $88,155 |
| Income Deficit | 80 | $0 |
| Wage / Income Gap (%) | 260 | 28.36% |
| Wage / Income Gap ($) | 260 | 71.64¢ per $1 |
| Gini / Inequality Index | 260 | 0.42 |
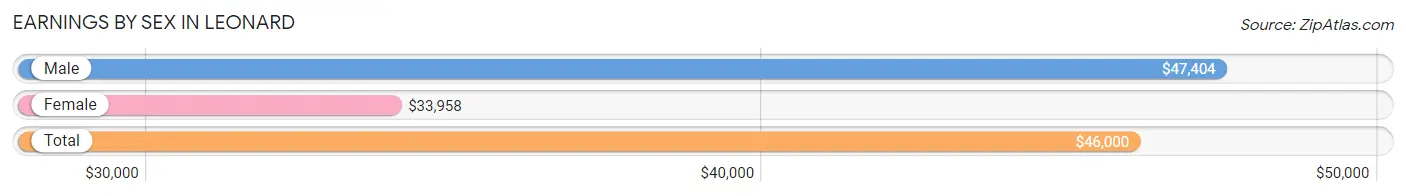
Earnings by Sex in Leonard
Average Earnings in Leonard are $46,000, $47,404 for men and $33,958 for women, a difference of 28.4%.
| Sex | Number | Average Earnings |
| Male | 73 (51.4%) | $47,404 |
| Female | 69 (48.6%) | $33,958 |
| Total | 142 (100.0%) | $46,000 |
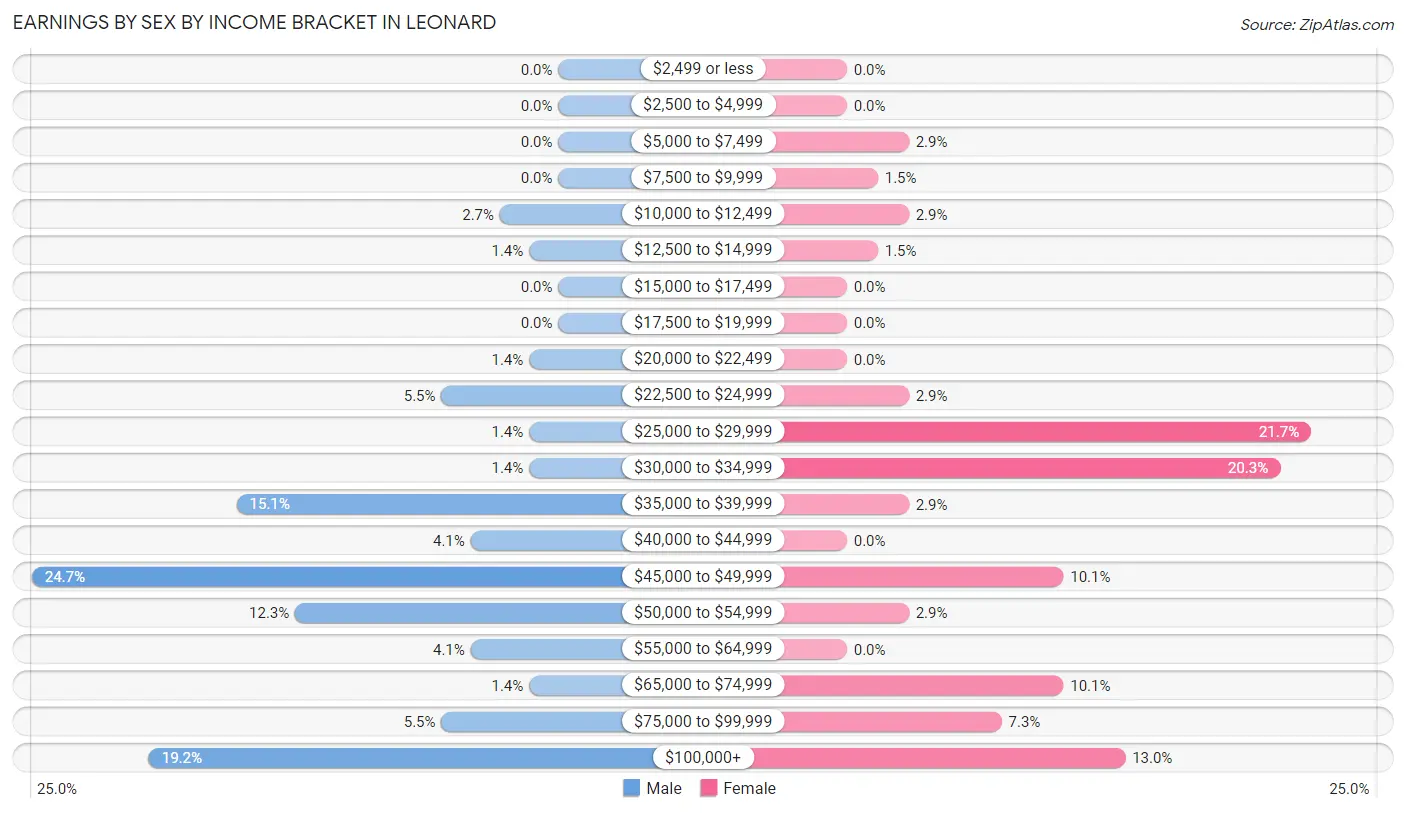
Earnings by Sex by Income Bracket in Leonard
The most common earnings brackets in Leonard are $45,000 to $49,999 for men (18 | 24.7%) and $25,000 to $29,999 for women (15 | 21.7%).
| Income | Male | Female |
| $2,499 or less | 0 (0.0%) | 0 (0.0%) |
| $2,500 to $4,999 | 0 (0.0%) | 0 (0.0%) |
| $5,000 to $7,499 | 0 (0.0%) | 2 (2.9%) |
| $7,500 to $9,999 | 0 (0.0%) | 1 (1.5%) |
| $10,000 to $12,499 | 2 (2.7%) | 2 (2.9%) |
| $12,500 to $14,999 | 1 (1.4%) | 1 (1.5%) |
| $15,000 to $17,499 | 0 (0.0%) | 0 (0.0%) |
| $17,500 to $19,999 | 0 (0.0%) | 0 (0.0%) |
| $20,000 to $22,499 | 1 (1.4%) | 0 (0.0%) |
| $22,500 to $24,999 | 4 (5.5%) | 2 (2.9%) |
| $25,000 to $29,999 | 1 (1.4%) | 15 (21.7%) |
| $30,000 to $34,999 | 1 (1.4%) | 14 (20.3%) |
| $35,000 to $39,999 | 11 (15.1%) | 2 (2.9%) |
| $40,000 to $44,999 | 3 (4.1%) | 0 (0.0%) |
| $45,000 to $49,999 | 18 (24.7%) | 7 (10.1%) |
| $50,000 to $54,999 | 9 (12.3%) | 2 (2.9%) |
| $55,000 to $64,999 | 3 (4.1%) | 0 (0.0%) |
| $65,000 to $74,999 | 1 (1.4%) | 7 (10.1%) |
| $75,000 to $99,999 | 4 (5.5%) | 5 (7.2%) |
| $100,000+ | 14 (19.2%) | 9 (13.0%) |
| Total | 73 (100.0%) | 69 (100.0%) |
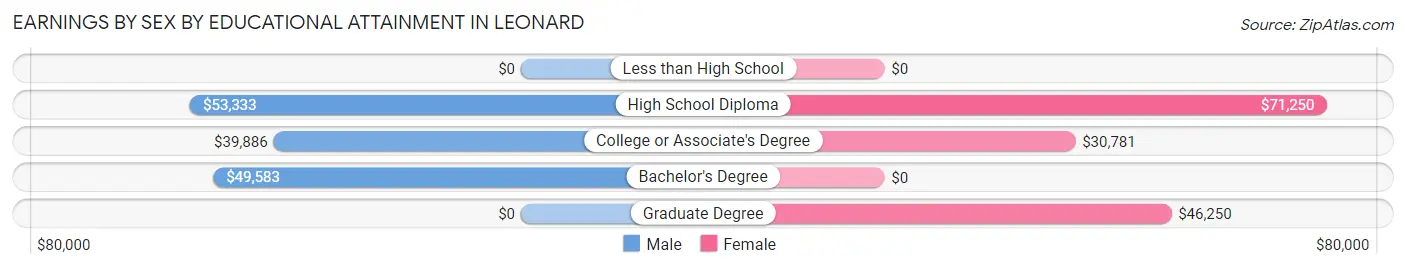
Earnings by Sex by Educational Attainment in Leonard
Average earnings in Leonard are $47,115 for men and $33,958 for women, a difference of 27.9%. Men with an educational attainment of high school diploma enjoy the highest average annual earnings of $53,333, while those with college or associate's degree education earn the least with $39,886. Women with an educational attainment of high school diploma earn the most with the average annual earnings of $71,250, while those with college or associate's degree education have the smallest earnings of $30,781.
| Educational Attainment | Male Income | Female Income |
| Less than High School | - | - |
| High School Diploma | $53,333 | $71,250 |
| College or Associate's Degree | $39,886 | $30,781 |
| Bachelor's Degree | $49,583 | $0 |
| Graduate Degree | - | - |
| Total | $47,115 | $33,958 |
Family Income in Leonard
Family Income Brackets in Leonard
According to the Leonard family income data, there are 27 families falling into the $75,000 to $99,999 income range, which is the most common income bracket and makes up 33.8% of all families.
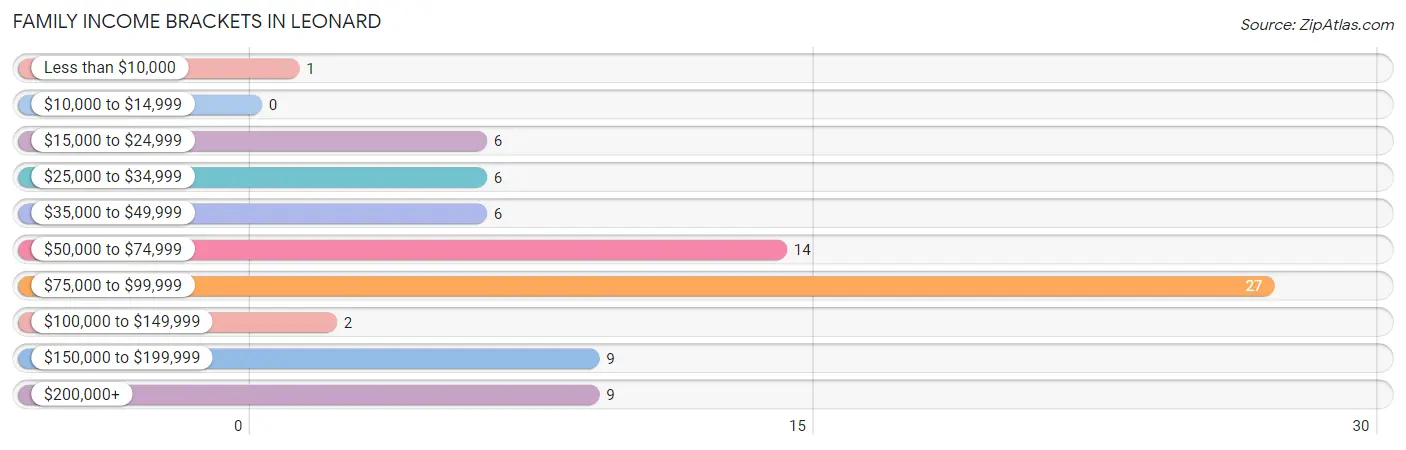
| Income Bracket | # Families | % Families |
| Less than $10,000 | 1 | 1.3% |
| $10,000 to $14,999 | 0 | 0.0% |
| $15,000 to $24,999 | 6 | 7.5% |
| $25,000 to $34,999 | 6 | 7.5% |
| $35,000 to $49,999 | 6 | 7.5% |
| $50,000 to $74,999 | 14 | 17.5% |
| $75,000 to $99,999 | 27 | 33.8% |
| $100,000 to $149,999 | 2 | 2.5% |
| $150,000 to $199,999 | 9 | 11.3% |
| $200,000+ | 9 | 11.3% |
Family Income by Famaliy Size in Leonard
4-person families (16 | 20.0%) account for the highest median family income in Leonard with $80,750 per family, while 2-person families (38 | 47.5%) have the highest median income of $30,312 per family member.
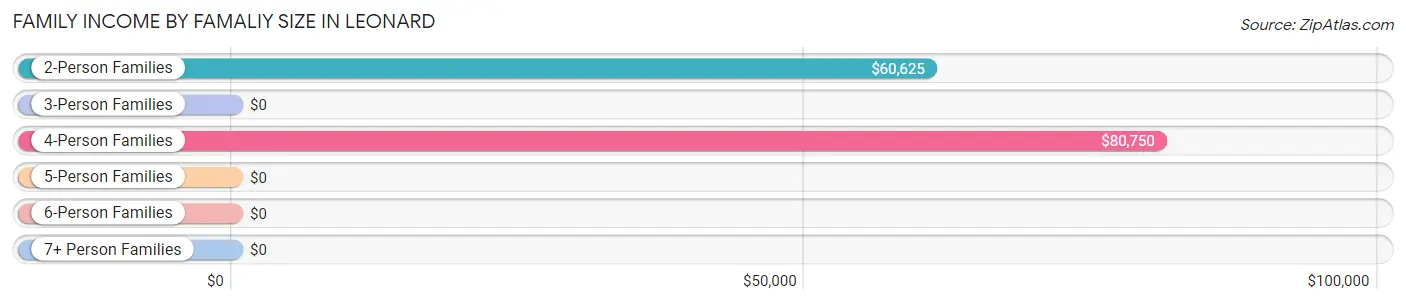
| Income Bracket | # Families | Median Income |
| 2-Person Families | 38 (47.5%) | $60,625 |
| 3-Person Families | 22 (27.5%) | $0 |
| 4-Person Families | 16 (20.0%) | $80,750 |
| 5-Person Families | 4 (5.0%) | $0 |
| 6-Person Families | 0 (0.0%) | $0 |
| 7+ Person Families | 0 (0.0%) | $0 |
| Total | 80 (100.0%) | $78,750 |
Family Income by Number of Earners in Leonard
The median family income in Leonard is $78,750, with families comprising 3+ earners (8) having the highest median family income of $250,001, while families with no earners (17) have the lowest median family income of $41,250, accounting for 10.0% and 21.2% of families, respectively.
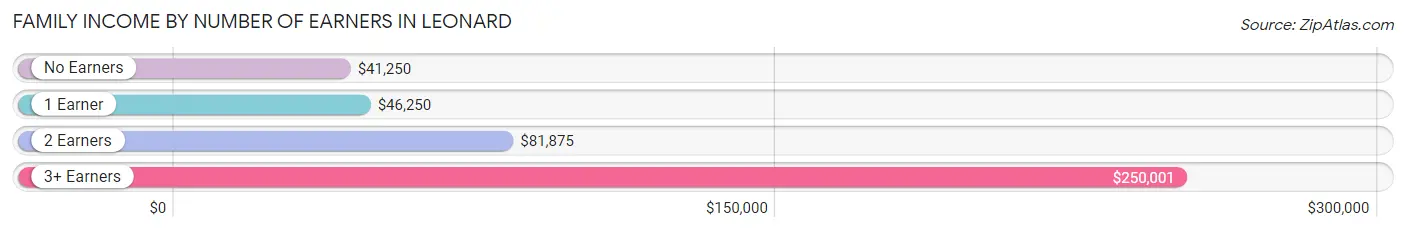
| Number of Earners | # Families | Median Income |
| No Earners | 17 (21.2%) | $41,250 |
| 1 Earner | 14 (17.5%) | $46,250 |
| 2 Earners | 41 (51.2%) | $81,875 |
| 3+ Earners | 8 (10.0%) | $250,001 |
| Total | 80 (100.0%) | $78,750 |
Household Income in Leonard
Household Income Brackets in Leonard
With 28 households falling in the category, the $75,000 to $99,999 income range is the most frequent in Leonard, accounting for 24.8% of all households. In contrast, only 1 households (0.9%) fall into the $10,000 to $14,999 income bracket, making it the least populous group.
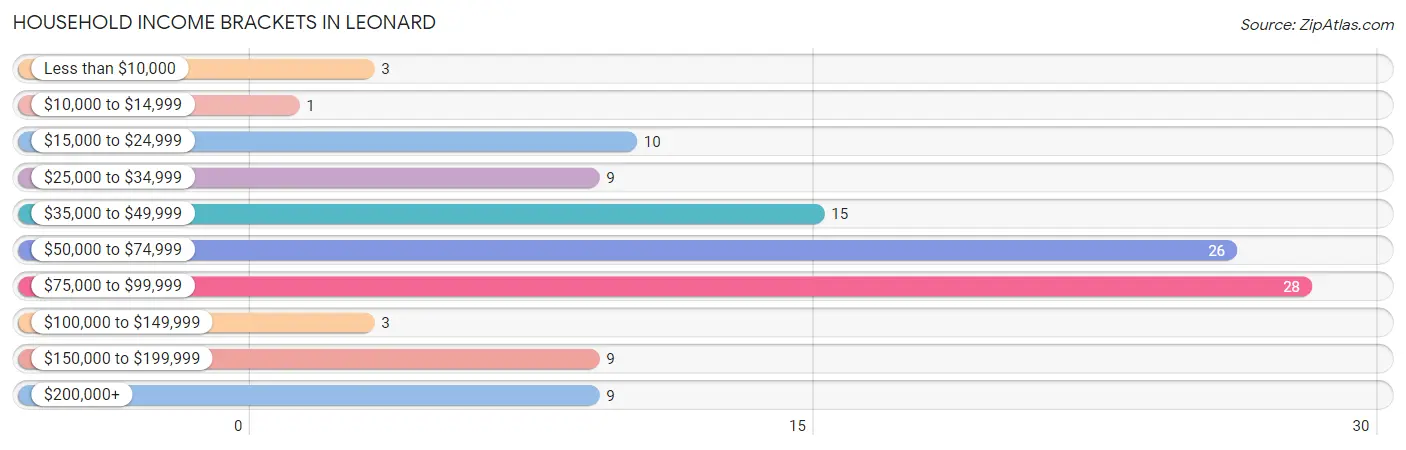
| Income Bracket | # Households | % Households |
| Less than $10,000 | 3 | 2.7% |
| $10,000 to $14,999 | 1 | 0.9% |
| $15,000 to $24,999 | 10 | 8.8% |
| $25,000 to $34,999 | 9 | 8.0% |
| $35,000 to $49,999 | 15 | 13.3% |
| $50,000 to $74,999 | 26 | 23.0% |
| $75,000 to $99,999 | 28 | 24.8% |
| $100,000 to $149,999 | 3 | 2.7% |
| $150,000 to $199,999 | 9 | 8.0% |
| $200,000+ | 9 | 8.0% |
Household Income by Householder Age in Leonard
The median household income in Leonard is $70,313, with the highest median household income of $81,500 found in the 45 to 64 years age bracket for the primary householder. A total of 44 households (38.9%) fall into this category. Meanwhile, the 15 to 24 years age bracket for the primary householder has the lowest median household income of $0, with 3 households (2.6%) in this group.
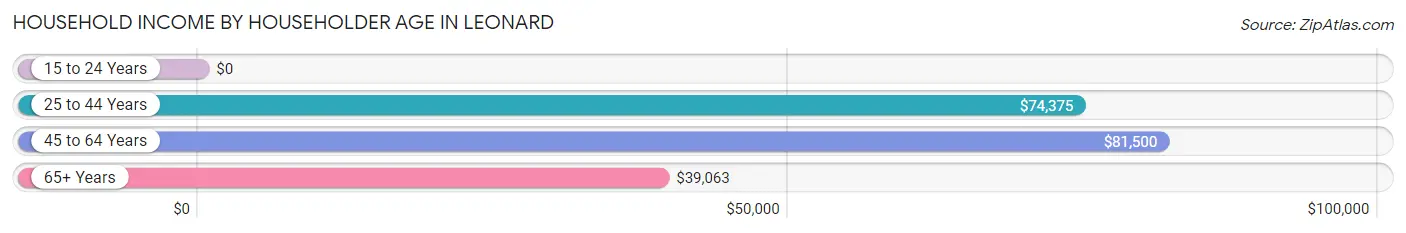
| Income Bracket | # Households | Median Income |
| 15 to 24 Years | 3 (2.6%) | $0 |
| 25 to 44 Years | 31 (27.4%) | $74,375 |
| 45 to 64 Years | 44 (38.9%) | $81,500 |
| 65+ Years | 35 (31.0%) | $39,063 |
| Total | 113 (100.0%) | $70,313 |
Poverty in Leonard
Income Below Poverty by Sex and Age in Leonard
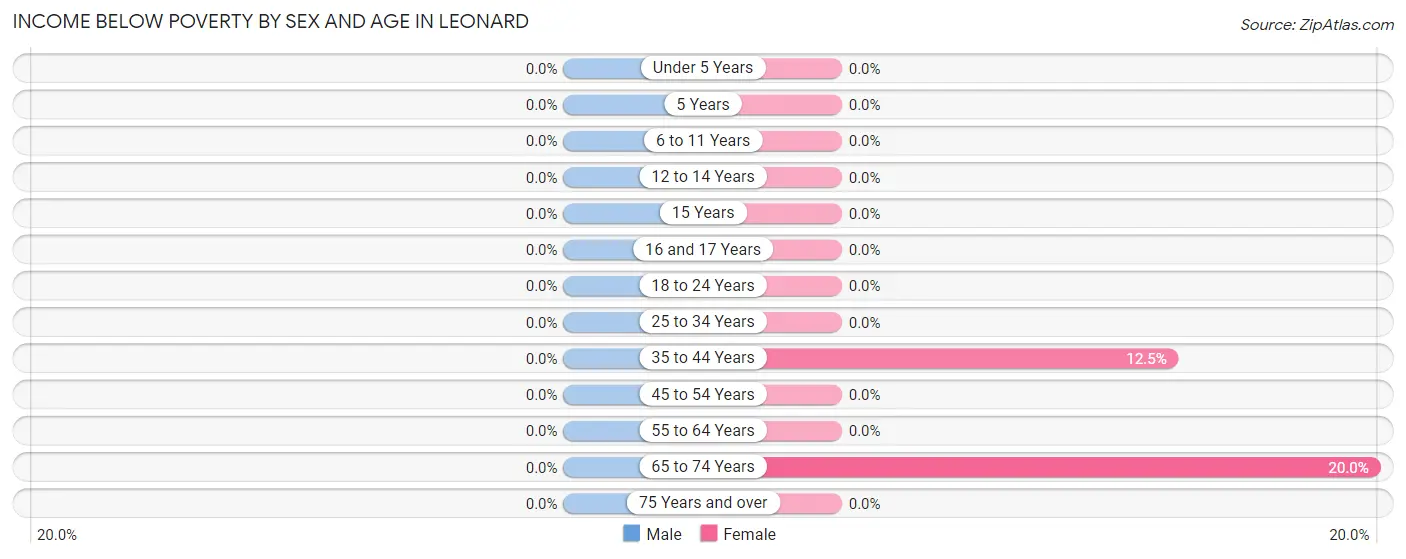
| Age Bracket | Male | Female |
| Under 5 Years | 0 (0.0%) | 0 (0.0%) |
| 5 Years | 0 (0.0%) | 0 (0.0%) |
| 6 to 11 Years | 0 (0.0%) | 0 (0.0%) |
| 12 to 14 Years | 0 (0.0%) | 0 (0.0%) |
| 15 Years | 0 (0.0%) | 0 (0.0%) |
| 16 and 17 Years | 0 (0.0%) | 0 (0.0%) |
| 18 to 24 Years | 0 (0.0%) | 0 (0.0%) |
| 25 to 34 Years | 0 (0.0%) | 0 (0.0%) |
| 35 to 44 Years | 0 (0.0%) | 2 (12.5%) |
| 45 to 54 Years | 0 (0.0%) | 0 (0.0%) |
| 55 to 64 Years | 0 (0.0%) | 0 (0.0%) |
| 65 to 74 Years | 0 (0.0%) | 4 (20.0%) |
| 75 Years and over | 0 (0.0%) | 0 (0.0%) |
| Total | 0 (0.0%) | 6 (4.5%) |
Income Above Poverty by Sex and Age in Leonard
According to the poverty statistics in Leonard, males aged under 5 years and females aged under 5 years are the age groups that are most secure financially, with 100.0% of males and 100.0% of females in these age groups living above the poverty line.
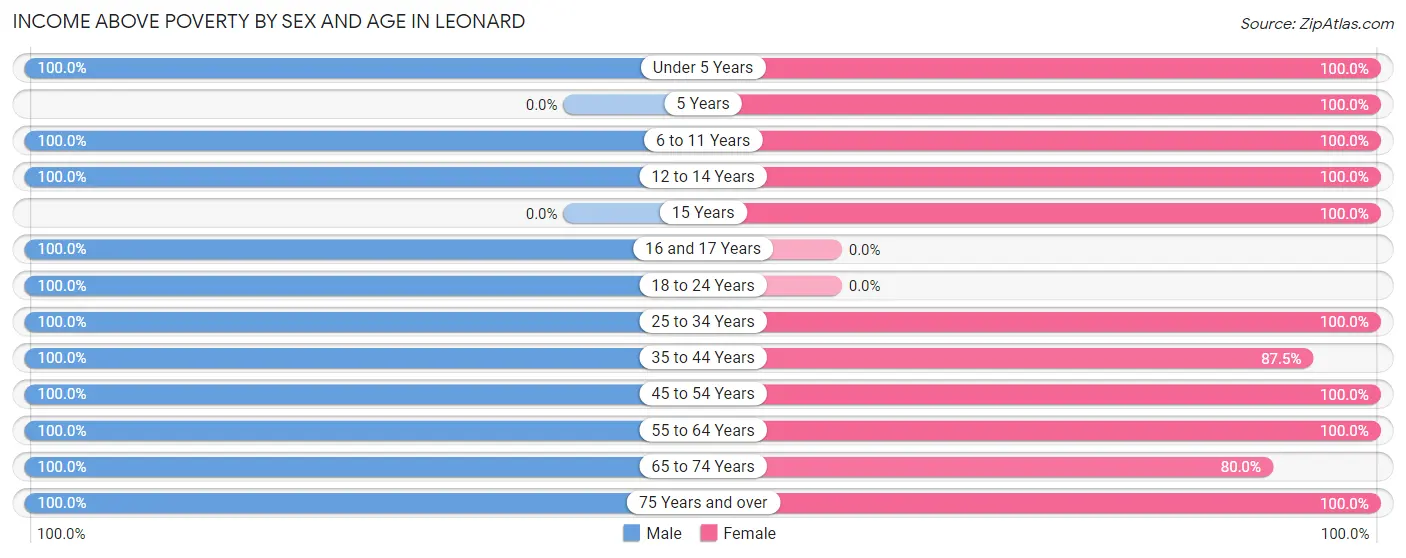
| Age Bracket | Male | Female |
| Under 5 Years | 4 (100.0%) | 7 (100.0%) |
| 5 Years | 0 (0.0%) | 3 (100.0%) |
| 6 to 11 Years | 10 (100.0%) | 15 (100.0%) |
| 12 to 14 Years | 5 (100.0%) | 7 (100.0%) |
| 15 Years | 0 (0.0%) | 1 (100.0%) |
| 16 and 17 Years | 2 (100.0%) | 0 (0.0%) |
| 18 to 24 Years | 3 (100.0%) | 0 (0.0%) |
| 25 to 34 Years | 17 (100.0%) | 18 (100.0%) |
| 35 to 44 Years | 14 (100.0%) | 14 (87.5%) |
| 45 to 54 Years | 27 (100.0%) | 24 (100.0%) |
| 55 to 64 Years | 17 (100.0%) | 17 (100.0%) |
| 65 to 74 Years | 14 (100.0%) | 16 (80.0%) |
| 75 Years and over | 14 (100.0%) | 5 (100.0%) |
| Total | 127 (100.0%) | 127 (95.5%) |
Income Below Poverty Among Married-Couple Families in Leonard
The poverty statistics for married-couple families in Leonard show that 1.3% or 1 of the total 75 families live below the poverty line. Families with no children have the highest poverty rate of 2.3%, comprising of 1 families. On the other hand, families with 1 or 2 children have the lowest poverty rate of 0.0%, which includes 0 families.
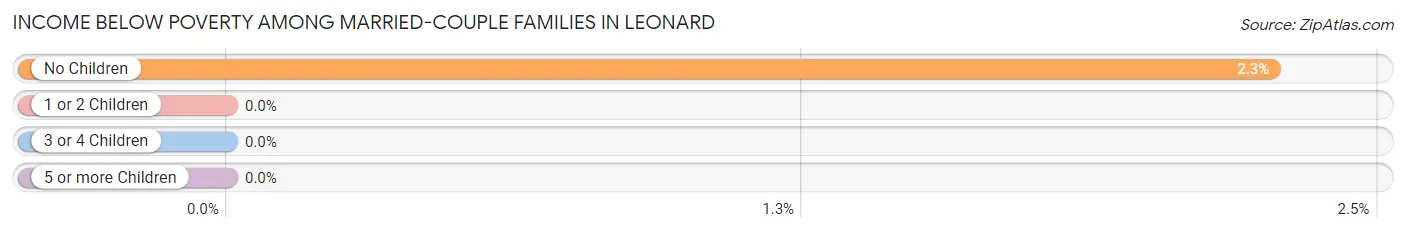
| Children | Above Poverty | Below Poverty |
| No Children | 43 (97.7%) | 1 (2.3%) |
| 1 or 2 Children | 27 (100.0%) | 0 (0.0%) |
| 3 or 4 Children | 4 (100.0%) | 0 (0.0%) |
| 5 or more Children | 0 (0.0%) | 0 (0.0%) |
| Total | 74 (98.7%) | 1 (1.3%) |
Income Below Poverty Among Single-Parent Households in Leonard
| Children | Single Father | Single Mother |
| No Children | 0 (0.0%) | 0 (0.0%) |
| 1 or 2 Children | 0 (0.0%) | 0 (0.0%) |
| 3 or 4 Children | 0 (0.0%) | 0 (0.0%) |
| 5 or more Children | 0 (0.0%) | 0 (0.0%) |
| Total | 0 (0.0%) | 0 (0.0%) |
Income Below Poverty Among Married-Couple vs Single-Parent Households in Leonard
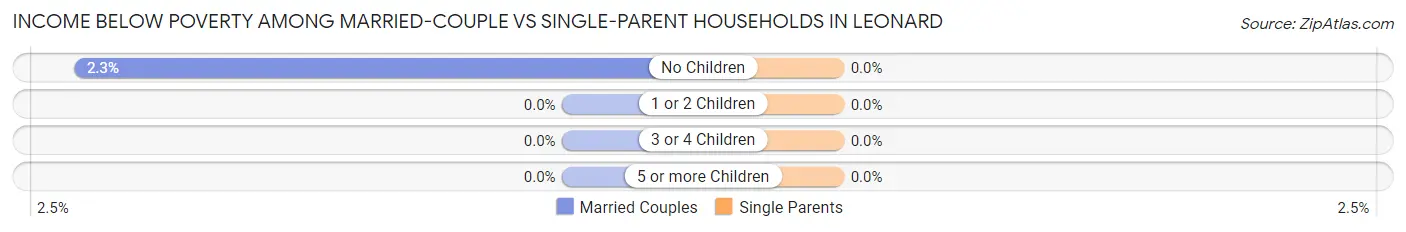
| Children | Married-Couple Families | Single-Parent Households |
| No Children | 1 (2.3%) | 0 (0.0%) |
| 1 or 2 Children | 0 (0.0%) | 0 (0.0%) |
| 3 or 4 Children | 0 (0.0%) | 0 (0.0%) |
| 5 or more Children | 0 (0.0%) | 0 (0.0%) |
| Total | 1 (1.3%) | 0 (0.0%) |
Race in Leonard
The most populous races in Leonard are White / Caucasian (252 | 96.9%), Two or more Races (5 | 1.9%), and Some other Race (2 | 0.8%).
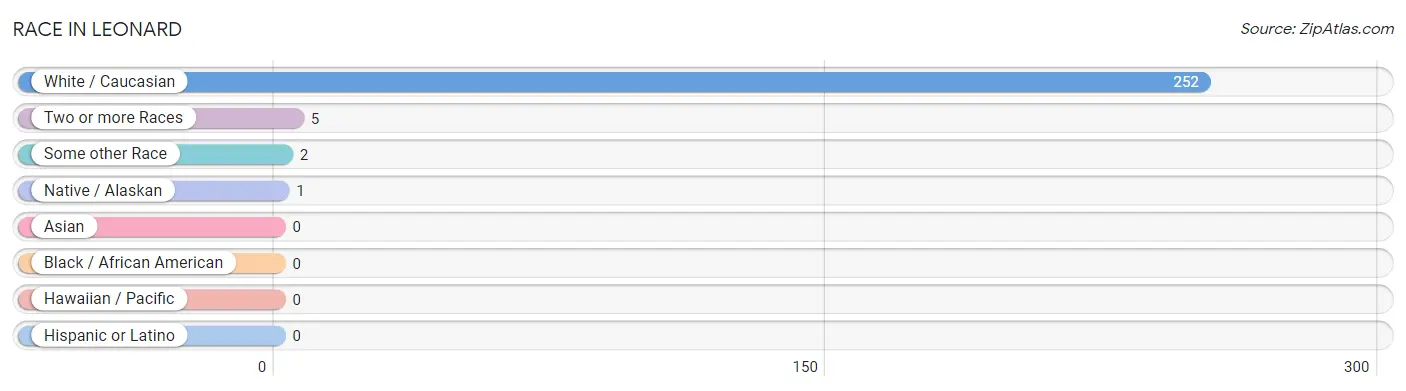
| Race | # Population | % Population |
| Asian | 0 | 0.0% |
| Black / African American | 0 | 0.0% |
| Hawaiian / Pacific | 0 | 0.0% |
| Hispanic or Latino | 0 | 0.0% |
| Native / Alaskan | 1 | 0.4% |
| White / Caucasian | 252 | 96.9% |
| Two or more Races | 5 | 1.9% |
| Some other Race | 2 | 0.8% |
| Total | 260 | 100.0% |
Ancestry in Leonard
The most populous ancestries reported in Leonard are German (132 | 50.8%), Norwegian (126 | 48.5%), Swedish (14 | 5.4%), English (12 | 4.6%), and Irish (10 | 3.8%), together accounting for 113.1% of all Leonard residents.
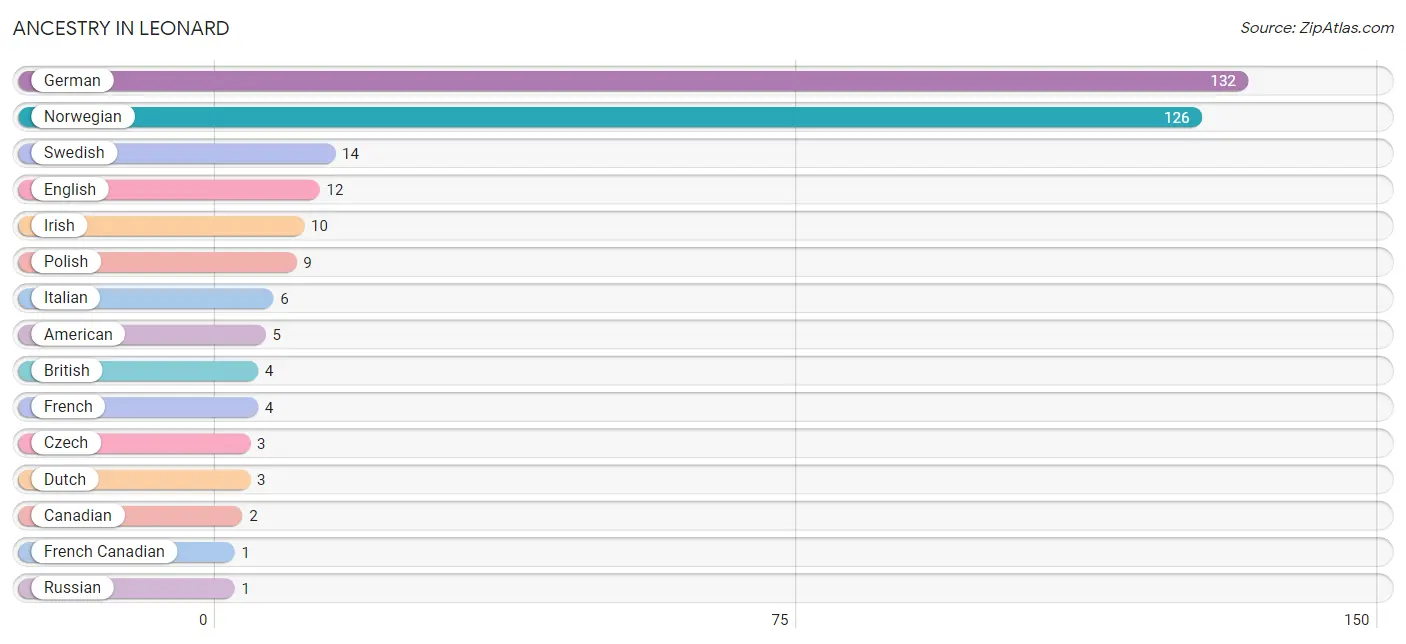
| Ancestry | # Population | % Population |
| American | 5 | 1.9% |
| British | 4 | 1.5% |
| Canadian | 2 | 0.8% |
| Czech | 3 | 1.1% |
| Dutch | 3 | 1.1% |
| English | 12 | 4.6% |
| French | 4 | 1.5% |
| French Canadian | 1 | 0.4% |
| German | 132 | 50.8% |
| Irish | 10 | 3.8% |
| Italian | 6 | 2.3% |
| Norwegian | 126 | 48.5% |
| Polish | 9 | 3.5% |
| Russian | 1 | 0.4% |
| Scandinavian | 1 | 0.4% |
| Scottish | 1 | 0.4% |
| Swedish | 14 | 5.4% | View All 17 Rows |
Immigrants in Leonard

| Immigration Origin | # Population | % Population | View All 0 Rows |
Sex and Age in Leonard
Sex and Age in Leonard
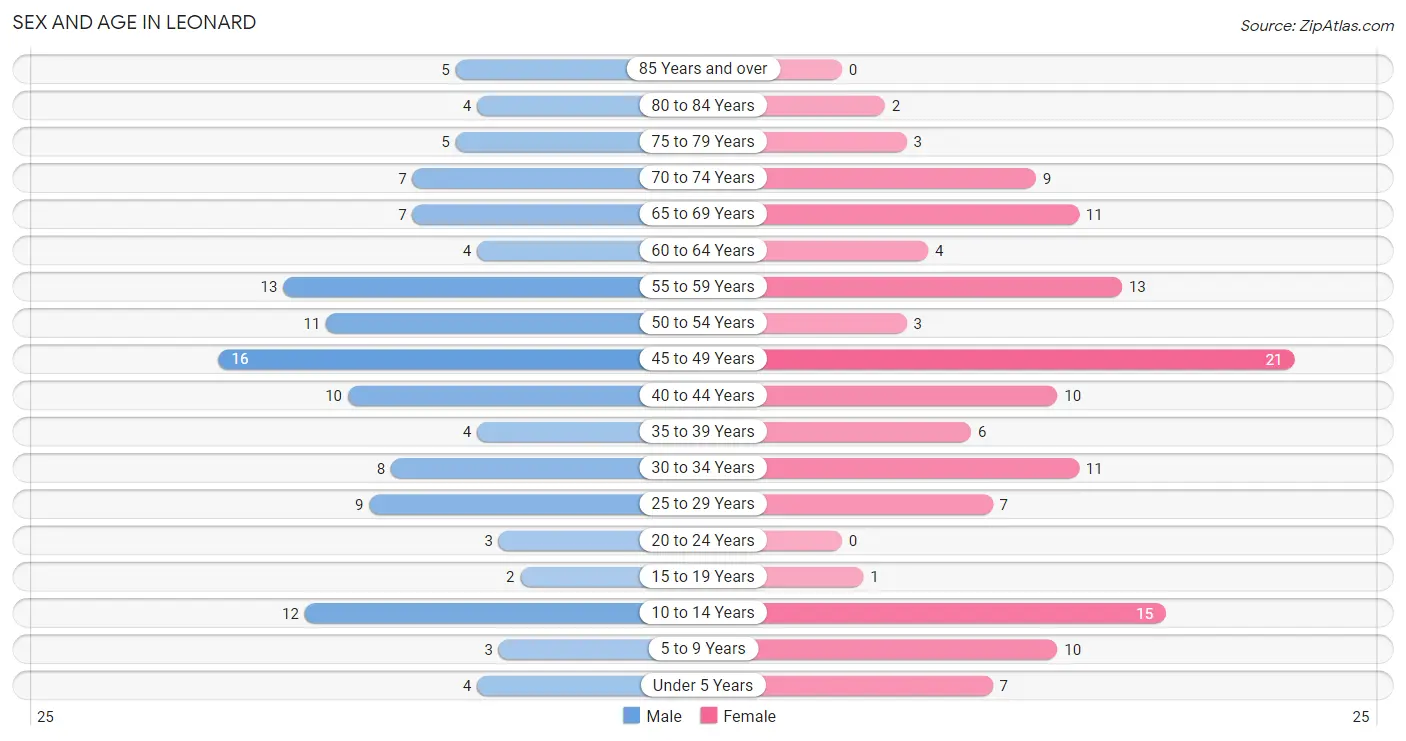
The most populous age groups in Leonard are 45 to 49 Years (16 | 12.6%) for men and 45 to 49 Years (21 | 15.8%) for women.
| Age Bracket | Male | Female |
| Under 5 Years | 4 (3.2%) | 7 (5.3%) |
| 5 to 9 Years | 3 (2.4%) | 10 (7.5%) |
| 10 to 14 Years | 12 (9.5%) | 15 (11.3%) |
| 15 to 19 Years | 2 (1.6%) | 1 (0.7%) |
| 20 to 24 Years | 3 (2.4%) | 0 (0.0%) |
| 25 to 29 Years | 9 (7.1%) | 7 (5.3%) |
| 30 to 34 Years | 8 (6.3%) | 11 (8.3%) |
| 35 to 39 Years | 4 (3.2%) | 6 (4.5%) |
| 40 to 44 Years | 10 (7.9%) | 10 (7.5%) |
| 45 to 49 Years | 16 (12.6%) | 21 (15.8%) |
| 50 to 54 Years | 11 (8.7%) | 3 (2.3%) |
| 55 to 59 Years | 13 (10.2%) | 13 (9.8%) |
| 60 to 64 Years | 4 (3.2%) | 4 (3.0%) |
| 65 to 69 Years | 7 (5.5%) | 11 (8.3%) |
| 70 to 74 Years | 7 (5.5%) | 9 (6.8%) |
| 75 to 79 Years | 5 (3.9%) | 3 (2.3%) |
| 80 to 84 Years | 4 (3.2%) | 2 (1.5%) |
| 85 Years and over | 5 (3.9%) | 0 (0.0%) |
| Total | 127 (100.0%) | 133 (100.0%) |
Families and Households in Leonard
Median Family Size in Leonard
The median family size in Leonard is 2.81 persons per family, with married-couple families (75 | 93.8%) accounting for the largest median family size of 2.84 persons per family. On the other hand, single male/father families (1 | 1.3%) represent the smallest median family size with 2.00 persons per family.
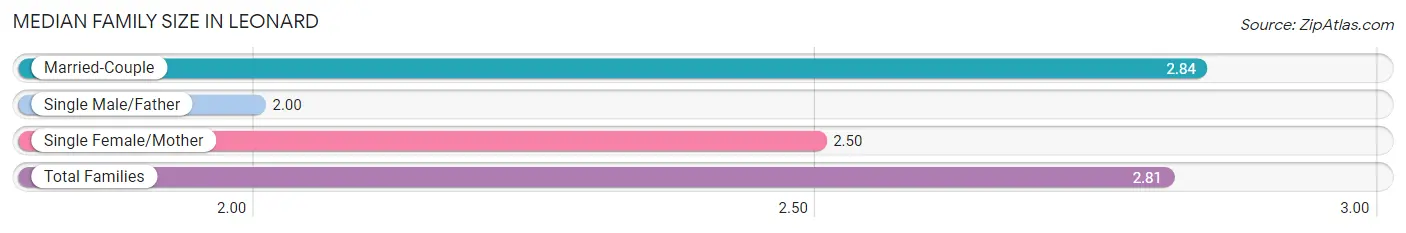
| Family Type | # Families | Family Size |
| Married-Couple | 75 (93.8%) | 2.84 |
| Single Male/Father | 1 (1.3%) | 2.00 |
| Single Female/Mother | 4 (5.0%) | 2.50 |
| Total Families | 80 (100.0%) | 2.81 |
Median Household Size in Leonard
The median household size in Leonard is 2.30 persons per household, with married-couple households (75 | 66.4%) accounting for the largest median household size of 2.84 persons per household. non-family households (33 | 29.2%) represent the smallest median household size with 1.03 persons per household.
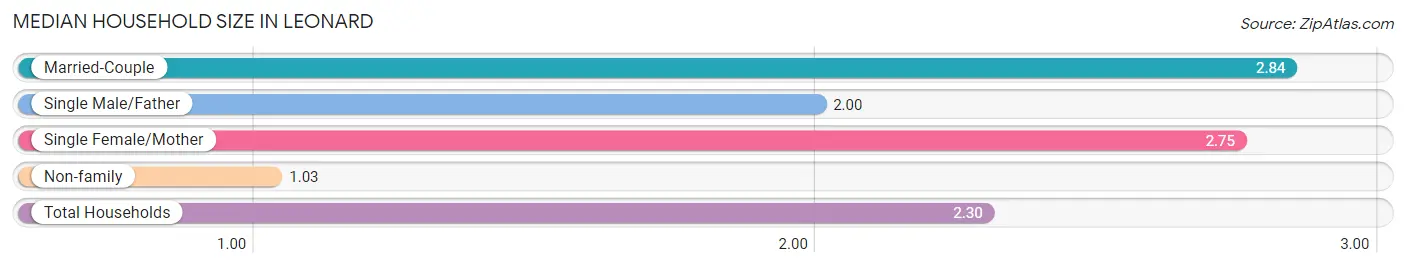
| Household Type | # Households | Household Size |
| Married-Couple | 75 (66.4%) | 2.84 |
| Single Male/Father | 1 (0.9%) | 2.00 |
| Single Female/Mother | 4 (3.5%) | 2.75 |
| Non-family | 33 (29.2%) | 1.03 |
| Total Households | 113 (100.0%) | 2.30 |
Household Size by Marriage Status in Leonard
Out of a total of 113 households in Leonard, 80 (70.8%) are family households, while 33 (29.2%) are nonfamily households. The most numerous type of family households are 2-person households, comprising 38, and the most common type of nonfamily households are 1-person households, comprising 32.
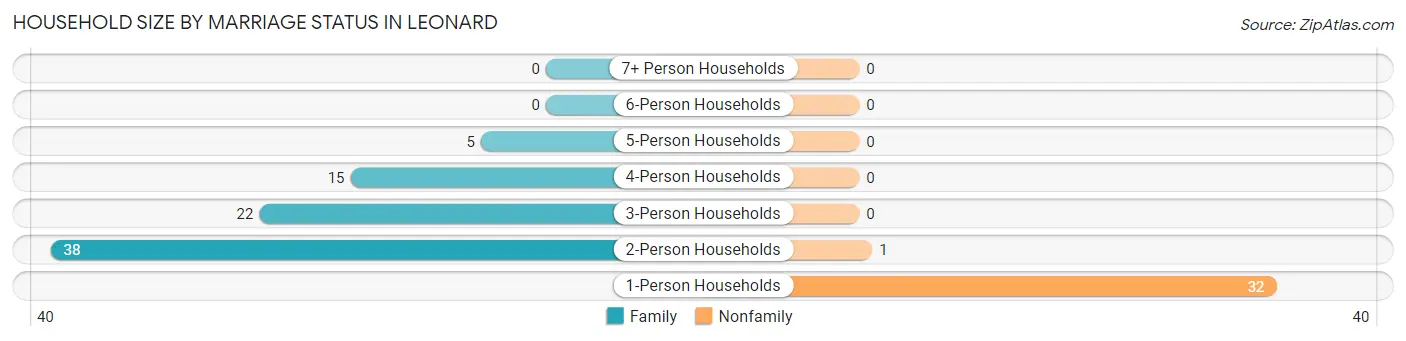
| Household Size | Family Households | Nonfamily Households |
| 1-Person Households | - | 32 (28.3%) |
| 2-Person Households | 38 (33.6%) | 1 (0.9%) |
| 3-Person Households | 22 (19.5%) | 0 (0.0%) |
| 4-Person Households | 15 (13.3%) | 0 (0.0%) |
| 5-Person Households | 5 (4.4%) | 0 (0.0%) |
| 6-Person Households | 0 (0.0%) | 0 (0.0%) |
| 7+ Person Households | 0 (0.0%) | 0 (0.0%) |
| Total | 80 (70.8%) | 33 (29.2%) |
Female Fertility in Leonard
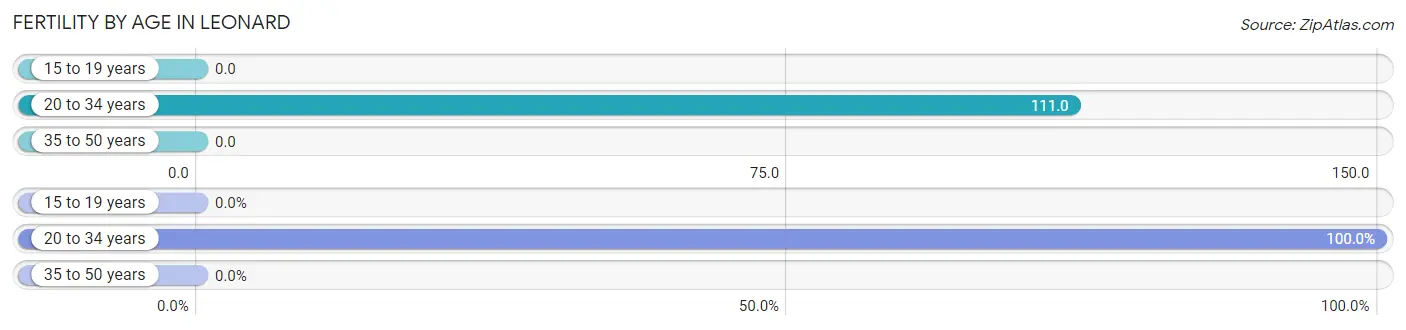
Fertility by Age in Leonard
Average fertility rate in Leonard is 36.0 births per 1,000 women. Women in the age bracket of 20 to 34 years have the highest fertility rate with 111.0 births per 1,000 women. Women in the age bracket of 20 to 34 years acount for 100.0% of all women with births.
| Age Bracket | Women with Births | Births / 1,000 Women |
| 15 to 19 years | 0 (0.0%) | 0.0 |
| 20 to 34 years | 2 (100.0%) | 111.0 |
| 35 to 50 years | 0 (0.0%) | 0.0 |
| Total | 2 (100.0%) | 36.0 |
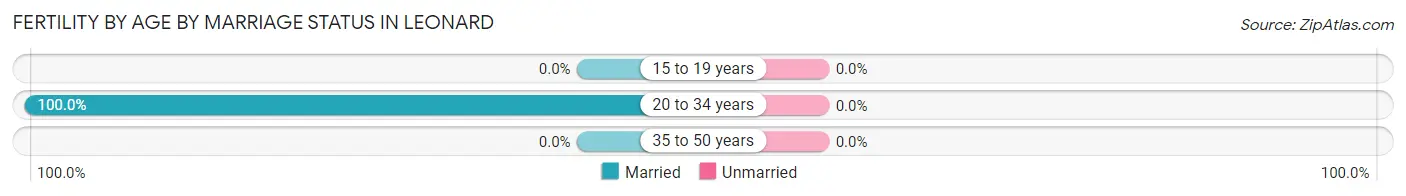
Fertility by Age by Marriage Status in Leonard
| Age Bracket | Married | Unmarried |
| 15 to 19 years | 0 (0.0%) | 0 (0.0%) |
| 20 to 34 years | 2 (100.0%) | 0 (0.0%) |
| 35 to 50 years | 0 (0.0%) | 0 (0.0%) |
| Total | 2 (100.0%) | 0 (0.0%) |
Fertility by Education in Leonard
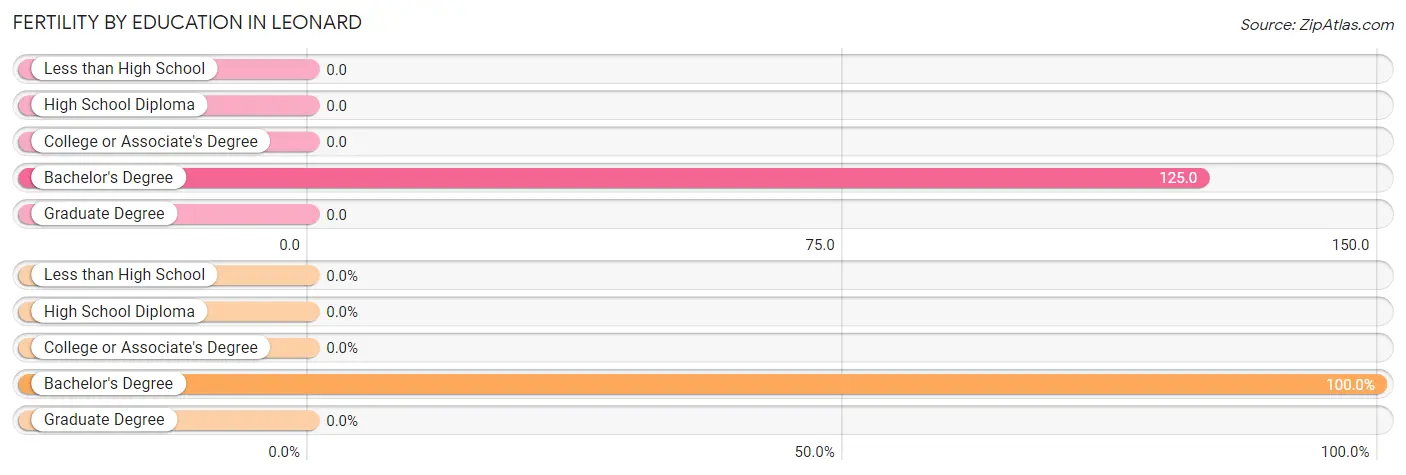
| Educational Attainment | Women with Births | Births / 1,000 Women |
| Less than High School | 0 (0.0%) | 0.0 |
| High School Diploma | 0 (0.0%) | 0.0 |
| College or Associate's Degree | 0 (0.0%) | 0.0 |
| Bachelor's Degree | 2 (100.0%) | 125.0 |
| Graduate Degree | 0 (0.0%) | 0.0 |
| Total | 2 (100.0%) | 36.0 |
Fertility by Education by Marriage Status in Leonard
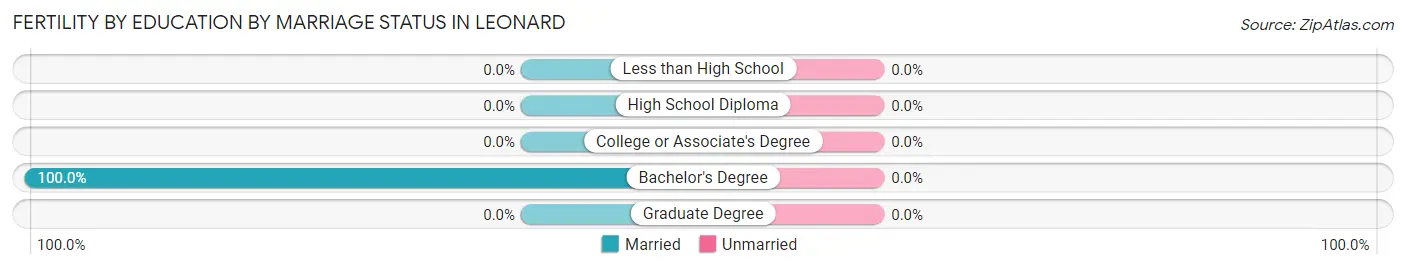
| Educational Attainment | Married | Unmarried |
| Less than High School | 0 (0.0%) | 0 (0.0%) |
| High School Diploma | 0 (0.0%) | 0 (0.0%) |
| College or Associate's Degree | 0 (0.0%) | 0 (0.0%) |
| Bachelor's Degree | 2 (100.0%) | 0 (0.0%) |
| Graduate Degree | 0 (0.0%) | 0 (0.0%) |
| Total | 2 (100.0%) | 0 (0.0%) |
Employment Characteristics in Leonard
Employment by Class of Employer in Leonard
Among the 132 employed individuals in Leonard, private company employees (75 | 56.8%), self-employed (incorporated) (27 | 20.4%), and not-for-profit organizations (14 | 10.6%) make up the most common classes of employment.
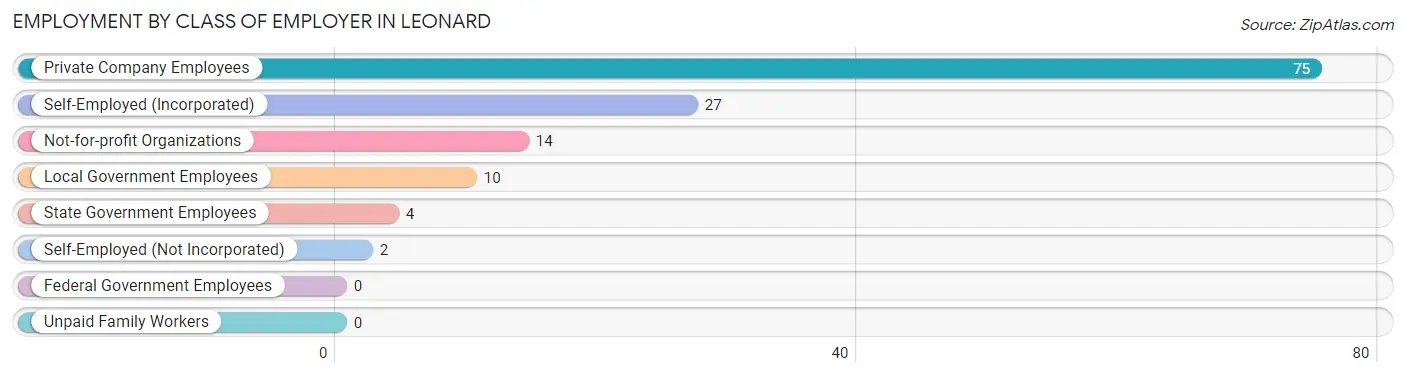
| Employer Class | # Employees | % Employees |
| Private Company Employees | 75 | 56.8% |
| Self-Employed (Incorporated) | 27 | 20.4% |
| Self-Employed (Not Incorporated) | 2 | 1.5% |
| Not-for-profit Organizations | 14 | 10.6% |
| Local Government Employees | 10 | 7.6% |
| State Government Employees | 4 | 3.0% |
| Federal Government Employees | 0 | 0.0% |
| Unpaid Family Workers | 0 | 0.0% |
| Total | 132 | 100.0% |
Employment Status by Age in Leonard
According to the labor force statistics for Leonard, out of the total population over 16 years of age (208), 68.8% or 143 individuals are in the labor force, with 5.6% or 8 of them unemployed. The age group with the highest labor force participation rate is 20 to 24 years, with 100.0% or 3 individuals in the labor force. Within the labor force, the 55 to 59 years age range has the highest percentage of unemployed individuals, with 29.2% or 7 of them being unemployed.
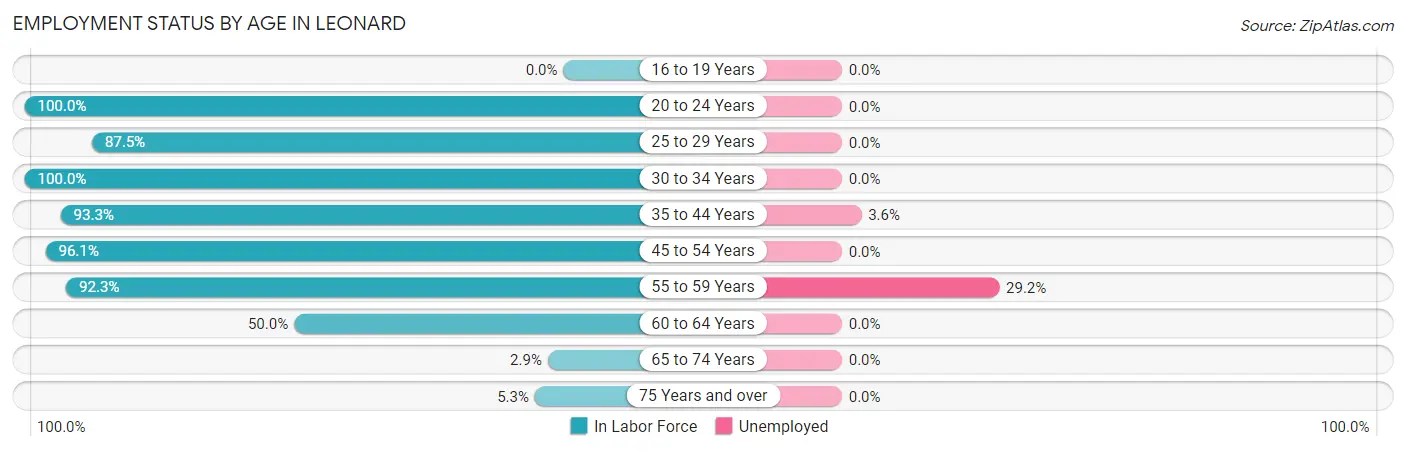
| Age Bracket | In Labor Force | Unemployed |
| 16 to 19 Years | 0 (0.0%) | 0 (0.0%) |
| 20 to 24 Years | 3 (100.0%) | 0 (0.0%) |
| 25 to 29 Years | 14 (87.5%) | 0 (0.0%) |
| 30 to 34 Years | 19 (100.0%) | 0 (0.0%) |
| 35 to 44 Years | 28 (93.3%) | 1 (3.6%) |
| 45 to 54 Years | 49 (96.1%) | 0 (0.0%) |
| 55 to 59 Years | 24 (92.3%) | 7 (29.2%) |
| 60 to 64 Years | 4 (50.0%) | 0 (0.0%) |
| 65 to 74 Years | 1 (2.9%) | 0 (0.0%) |
| 75 Years and over | 1 (5.3%) | 0 (0.0%) |
| Total | 143 (68.8%) | 8 (5.6%) |
Employment Status by Educational Attainment in Leonard
According to labor force statistics for Leonard, 92.0% of individuals (138) out of the total population between 25 and 64 years of age (150) are in the labor force, with 5.8% or 8 of them being unemployed. The group with the highest labor force participation rate are those with the educational attainment of less than high school, with 100.0% or 10 individuals in the labor force. Within the labor force, individuals with less than high school education have the highest percentage of unemployment, with 50.0% or 5 of them being unemployed.
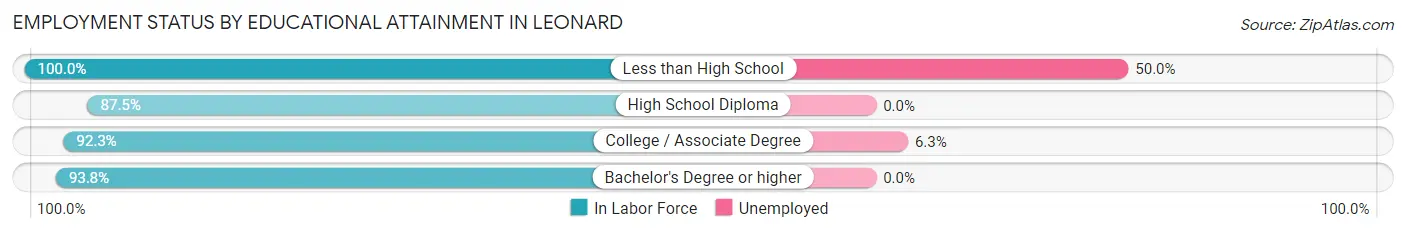
| Educational Attainment | In Labor Force | Unemployed |
| Less than High School | 10 (100.0%) | 5 (50.0%) |
| High School Diploma | 35 (87.5%) | 0 (0.0%) |
| College / Associate Degree | 48 (92.3%) | 3 (6.3%) |
| Bachelor's Degree or higher | 45 (93.8%) | 0 (0.0%) |
| Total | 138 (92.0%) | 9 (5.8%) |
Employment Occupations by Sex in Leonard
Management, Business, Science and Arts Occupations
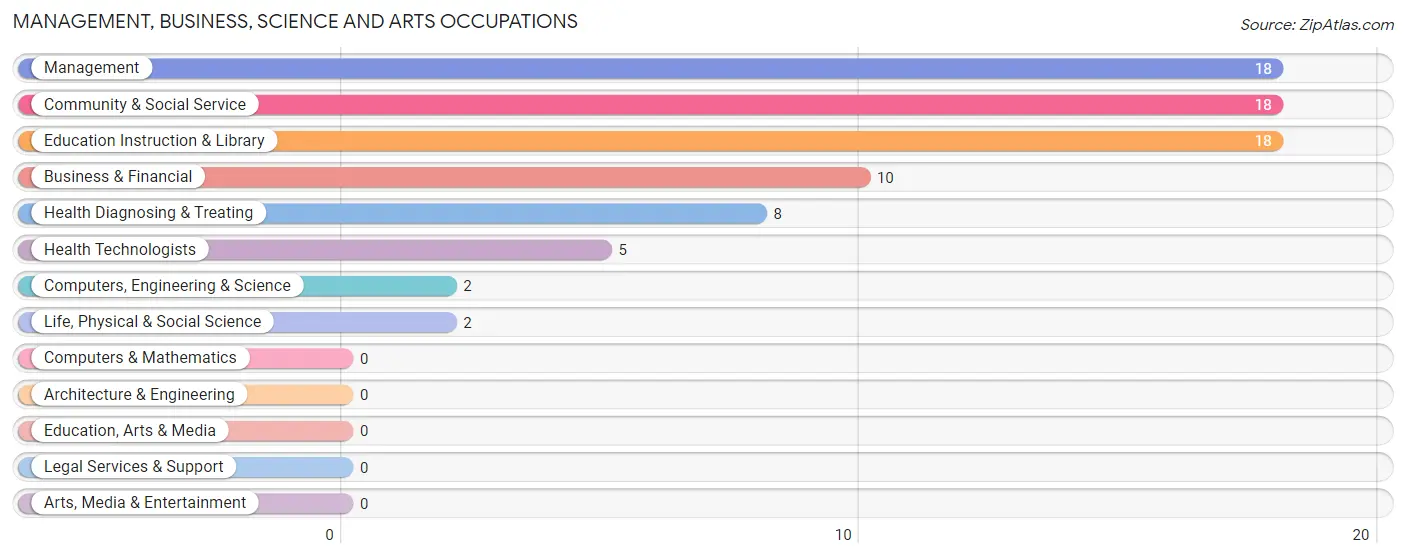
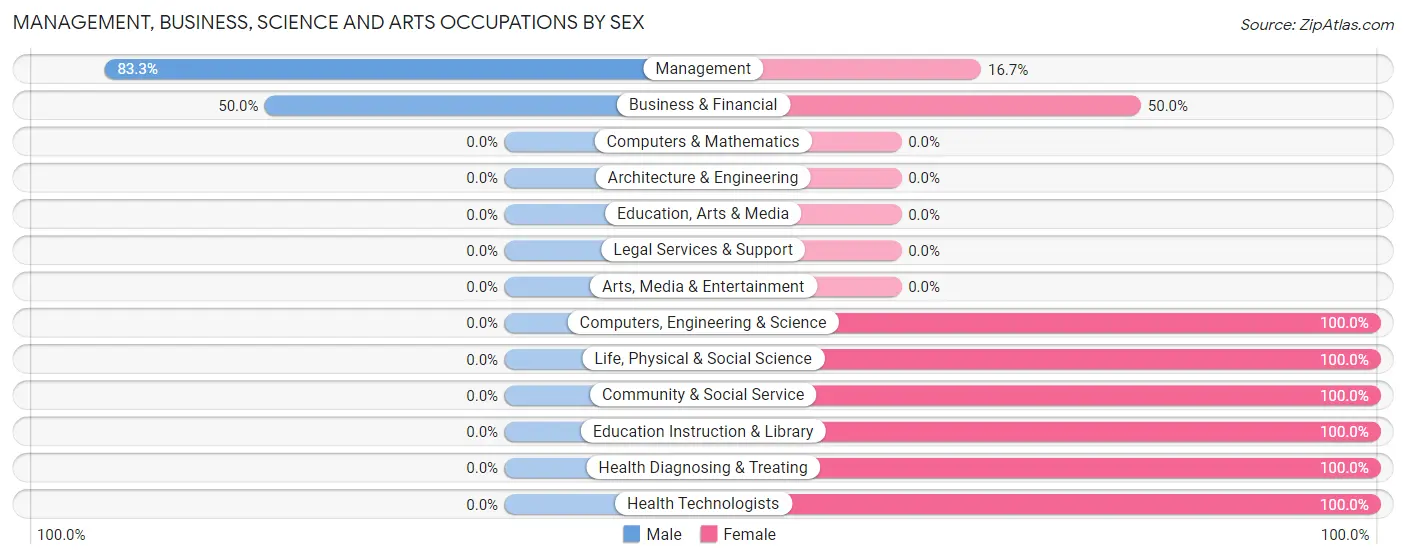
The most common Management, Business, Science and Arts occupations in Leonard are Management (18 | 13.3%), Community & Social Service (18 | 13.3%), Education Instruction & Library (18 | 13.3%), Business & Financial (10 | 7.4%), and Health Diagnosing & Treating (8 | 5.9%).
Management, Business, Science and Arts Occupations by Sex
Within the Management, Business, Science and Arts occupations in Leonard, the most male-oriented occupations are Management (83.3%), and Business & Financial (50.0%), while the most female-oriented occupations are Computers, Engineering & Science (100.0%), Life, Physical & Social Science (100.0%), and Community & Social Service (100.0%).
| Occupation | Male | Female |
| Management | 15 (83.3%) | 3 (16.7%) |
| Business & Financial | 5 (50.0%) | 5 (50.0%) |
| Computers, Engineering & Science | 0 (0.0%) | 2 (100.0%) |
| Computers & Mathematics | 0 (0.0%) | 0 (0.0%) |
| Architecture & Engineering | 0 (0.0%) | 0 (0.0%) |
| Life, Physical & Social Science | 0 (0.0%) | 2 (100.0%) |
| Community & Social Service | 0 (0.0%) | 18 (100.0%) |
| Education, Arts & Media | 0 (0.0%) | 0 (0.0%) |
| Legal Services & Support | 0 (0.0%) | 0 (0.0%) |
| Education Instruction & Library | 0 (0.0%) | 18 (100.0%) |
| Arts, Media & Entertainment | 0 (0.0%) | 0 (0.0%) |
| Health Diagnosing & Treating | 0 (0.0%) | 8 (100.0%) |
| Health Technologists | 0 (0.0%) | 5 (100.0%) |
| Total (Category) | 20 (35.7%) | 36 (64.3%) |
| Total (Overall) | 70 (51.8%) | 65 (48.1%) |
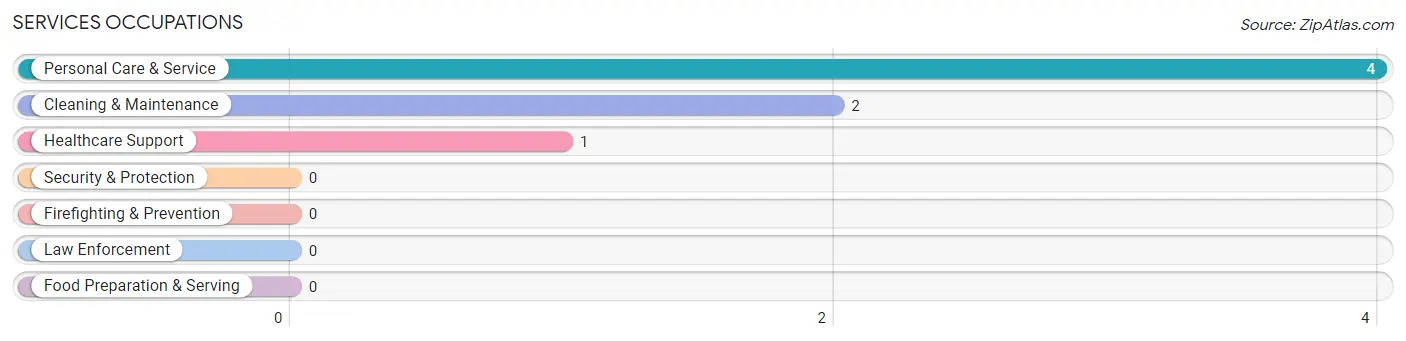
Services Occupations
The most common Services occupations in Leonard are Personal Care & Service (4 | 3.0%), Cleaning & Maintenance (2 | 1.5%), and Healthcare Support (1 | 0.7%).
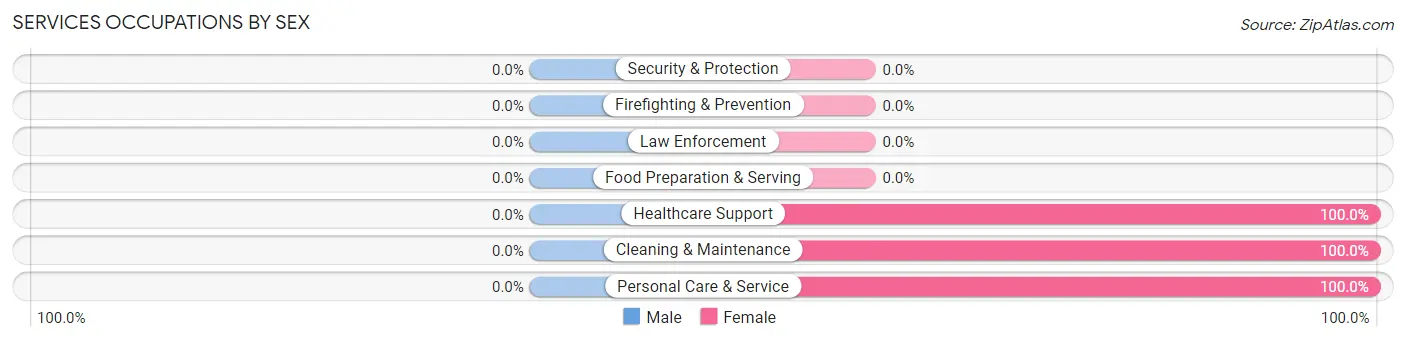
Services Occupations by Sex
| Occupation | Male | Female |
| Healthcare Support | 0 (0.0%) | 1 (100.0%) |
| Security & Protection | 0 (0.0%) | 0 (0.0%) |
| Firefighting & Prevention | 0 (0.0%) | 0 (0.0%) |
| Law Enforcement | 0 (0.0%) | 0 (0.0%) |
| Food Preparation & Serving | 0 (0.0%) | 0 (0.0%) |
| Cleaning & Maintenance | 0 (0.0%) | 2 (100.0%) |
| Personal Care & Service | 0 (0.0%) | 4 (100.0%) |
| Total (Category) | 0 (0.0%) | 7 (100.0%) |
| Total (Overall) | 70 (51.8%) | 65 (48.1%) |
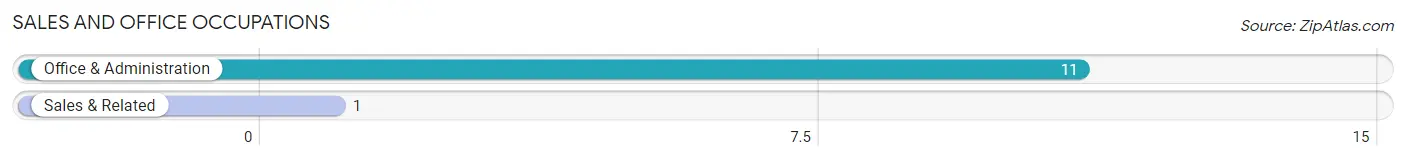
Sales and Office Occupations
The most common Sales and Office occupations in Leonard are Office & Administration (11 | 8.2%), and Sales & Related (1 | 0.7%).
Sales and Office Occupations by Sex
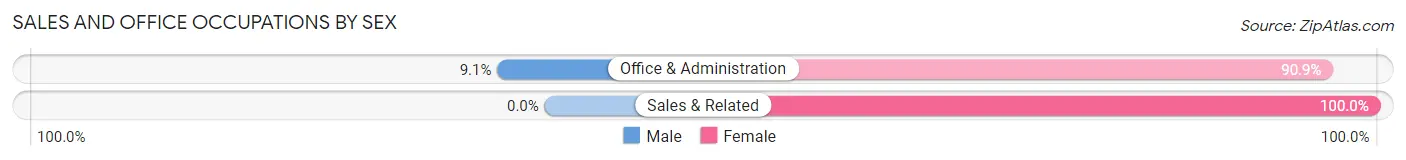
| Occupation | Male | Female |
| Sales & Related | 0 (0.0%) | 1 (100.0%) |
| Office & Administration | 1 (9.1%) | 10 (90.9%) |
| Total (Category) | 1 (8.3%) | 11 (91.7%) |
| Total (Overall) | 70 (51.8%) | 65 (48.1%) |
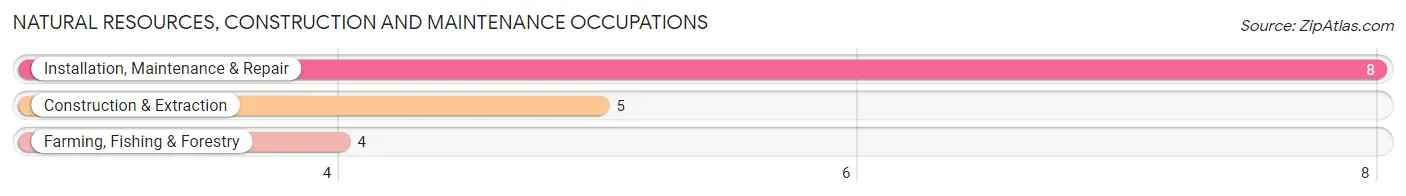
Natural Resources, Construction and Maintenance Occupations
The most common Natural Resources, Construction and Maintenance occupations in Leonard are Installation, Maintenance & Repair (8 | 5.9%), Construction & Extraction (5 | 3.7%), and Farming, Fishing & Forestry (4 | 3.0%).
Natural Resources, Construction and Maintenance Occupations by Sex
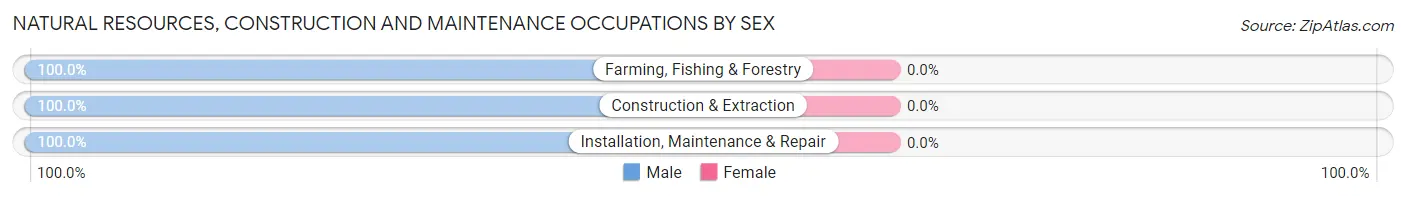
| Occupation | Male | Female |
| Farming, Fishing & Forestry | 4 (100.0%) | 0 (0.0%) |
| Construction & Extraction | 5 (100.0%) | 0 (0.0%) |
| Installation, Maintenance & Repair | 8 (100.0%) | 0 (0.0%) |
| Total (Category) | 17 (100.0%) | 0 (0.0%) |
| Total (Overall) | 70 (51.8%) | 65 (48.1%) |
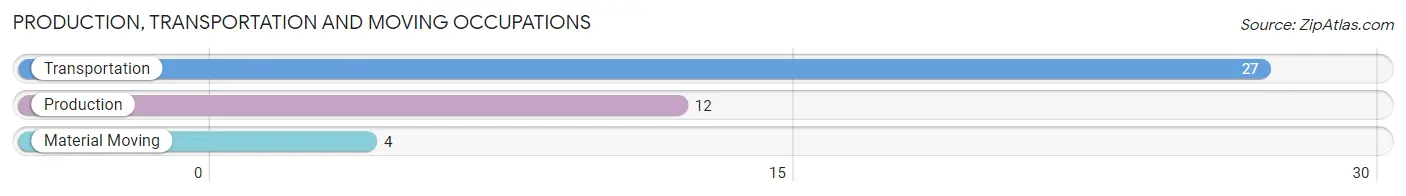
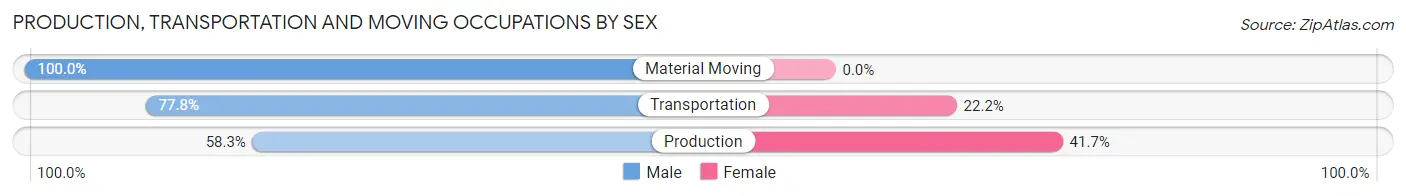
Production, Transportation and Moving Occupations
The most common Production, Transportation and Moving occupations in Leonard are Transportation (27 | 20.0%), Production (12 | 8.9%), and Material Moving (4 | 3.0%).
Production, Transportation and Moving Occupations by Sex
| Occupation | Male | Female |
| Production | 7 (58.3%) | 5 (41.7%) |
| Transportation | 21 (77.8%) | 6 (22.2%) |
| Material Moving | 4 (100.0%) | 0 (0.0%) |
| Total (Category) | 32 (74.4%) | 11 (25.6%) |
| Total (Overall) | 70 (51.8%) | 65 (48.1%) |
Employment Industries by Sex in Leonard
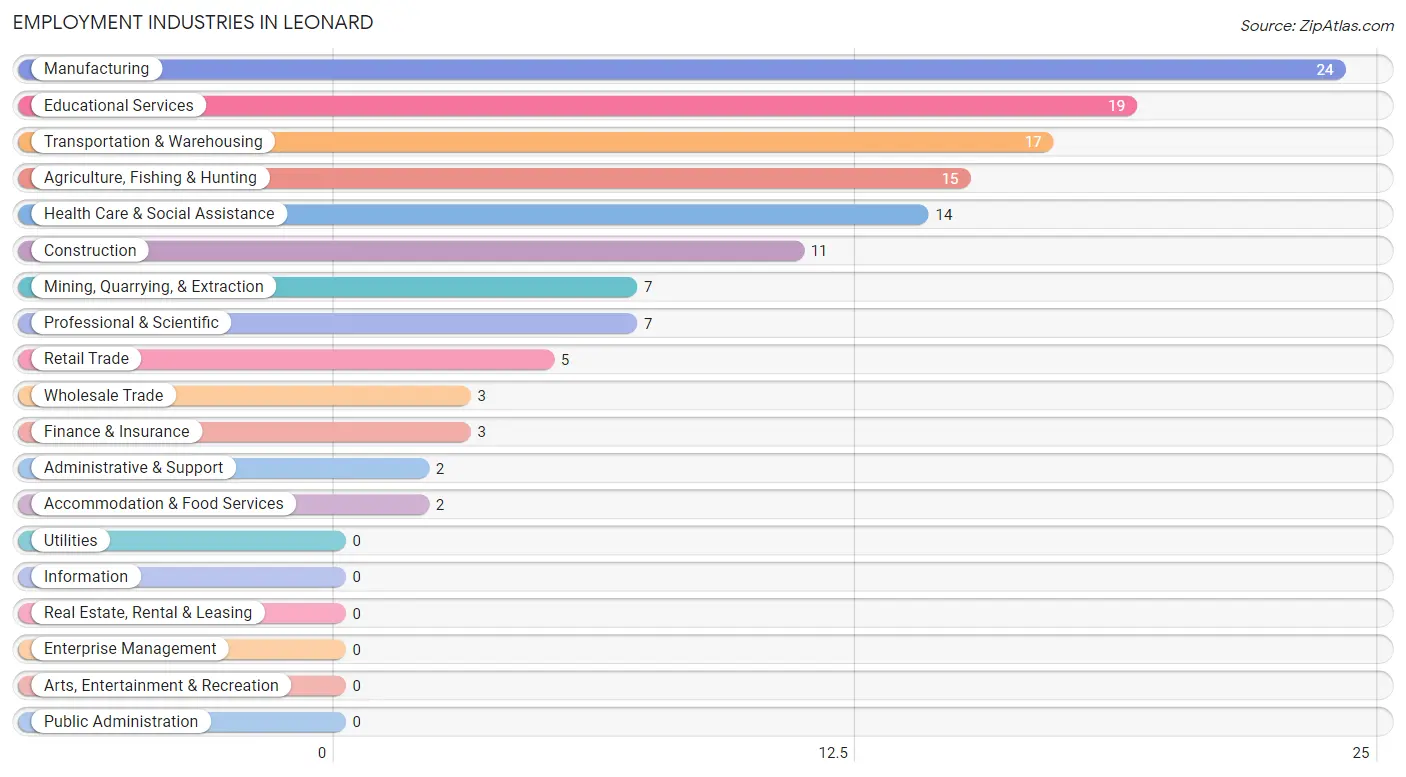
Employment Industries in Leonard
The major employment industries in Leonard include Manufacturing (24 | 17.8%), Educational Services (19 | 14.1%), Transportation & Warehousing (17 | 12.6%), Agriculture, Fishing & Hunting (15 | 11.1%), and Health Care & Social Assistance (14 | 10.4%).
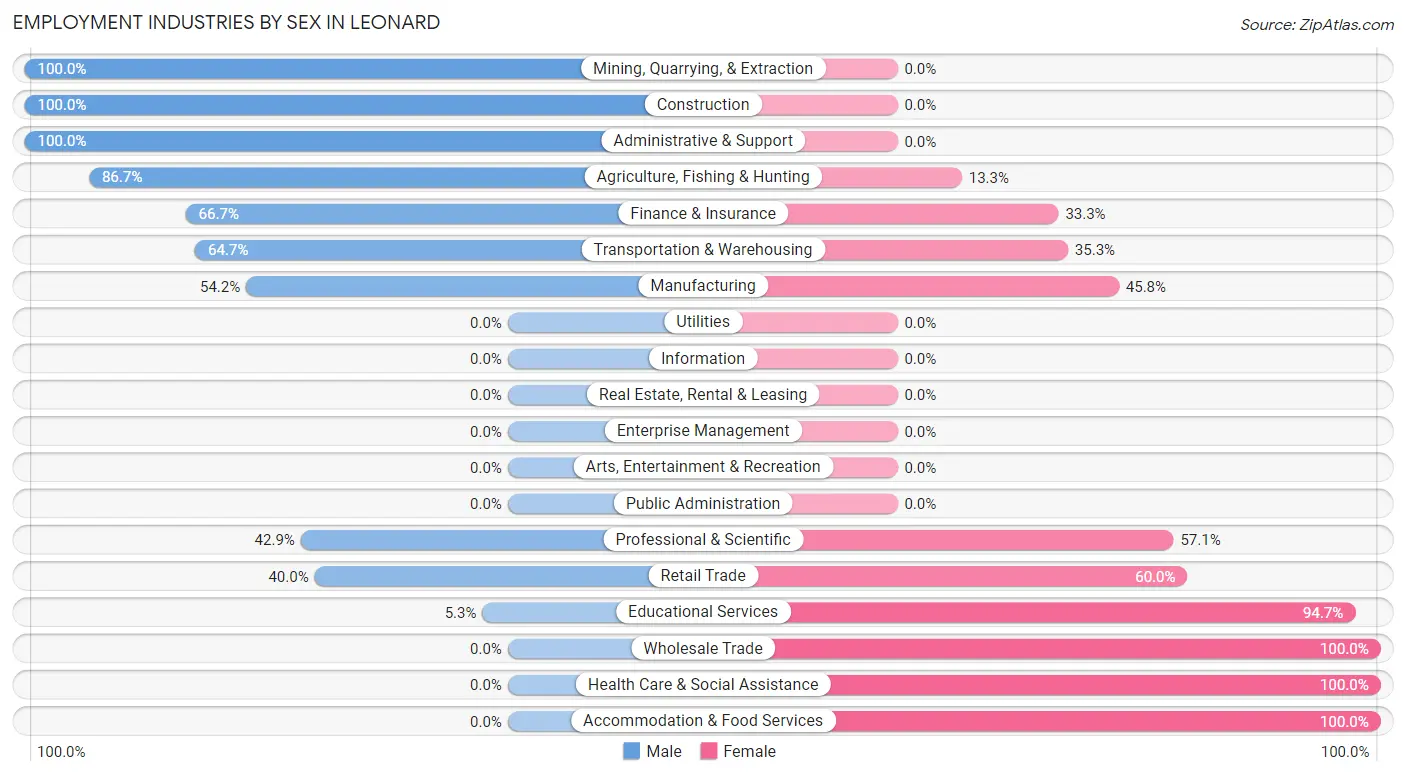
Employment Industries by Sex in Leonard
The Leonard industries that see more men than women are Mining, Quarrying, & Extraction (100.0%), Construction (100.0%), and Administrative & Support (100.0%), whereas the industries that tend to have a higher number of women are Wholesale Trade (100.0%), Health Care & Social Assistance (100.0%), and Accommodation & Food Services (100.0%).
| Industry | Male | Female |
| Agriculture, Fishing & Hunting | 13 (86.7%) | 2 (13.3%) |
| Mining, Quarrying, & Extraction | 7 (100.0%) | 0 (0.0%) |
| Construction | 11 (100.0%) | 0 (0.0%) |
| Manufacturing | 13 (54.2%) | 11 (45.8%) |
| Wholesale Trade | 0 (0.0%) | 3 (100.0%) |
| Retail Trade | 2 (40.0%) | 3 (60.0%) |
| Transportation & Warehousing | 11 (64.7%) | 6 (35.3%) |
| Utilities | 0 (0.0%) | 0 (0.0%) |
| Information | 0 (0.0%) | 0 (0.0%) |
| Finance & Insurance | 2 (66.7%) | 1 (33.3%) |
| Real Estate, Rental & Leasing | 0 (0.0%) | 0 (0.0%) |
| Professional & Scientific | 3 (42.9%) | 4 (57.1%) |
| Enterprise Management | 0 (0.0%) | 0 (0.0%) |
| Administrative & Support | 2 (100.0%) | 0 (0.0%) |
| Educational Services | 1 (5.3%) | 18 (94.7%) |
| Health Care & Social Assistance | 0 (0.0%) | 14 (100.0%) |
| Arts, Entertainment & Recreation | 0 (0.0%) | 0 (0.0%) |
| Accommodation & Food Services | 0 (0.0%) | 2 (100.0%) |
| Public Administration | 0 (0.0%) | 0 (0.0%) |
| Total | 70 (51.8%) | 65 (48.1%) |
Education in Leonard
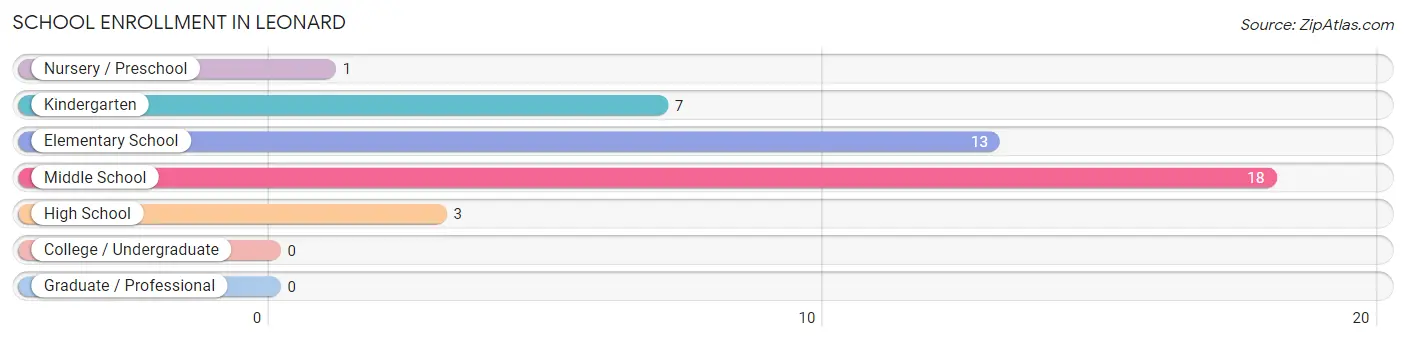
School Enrollment in Leonard
The most common levels of schooling among the 42 students in Leonard are middle school (18 | 42.9%), elementary school (13 | 30.9%), and kindergarten (7 | 16.7%).
| School Level | # Students | % Students |
| Nursery / Preschool | 1 | 2.4% |
| Kindergarten | 7 | 16.7% |
| Elementary School | 13 | 30.9% |
| Middle School | 18 | 42.9% |
| High School | 3 | 7.1% |
| College / Undergraduate | 0 | 0.0% |
| Graduate / Professional | 0 | 0.0% |
| Total | 42 | 100.0% |
School Enrollment by Age by Funding Source in Leonard
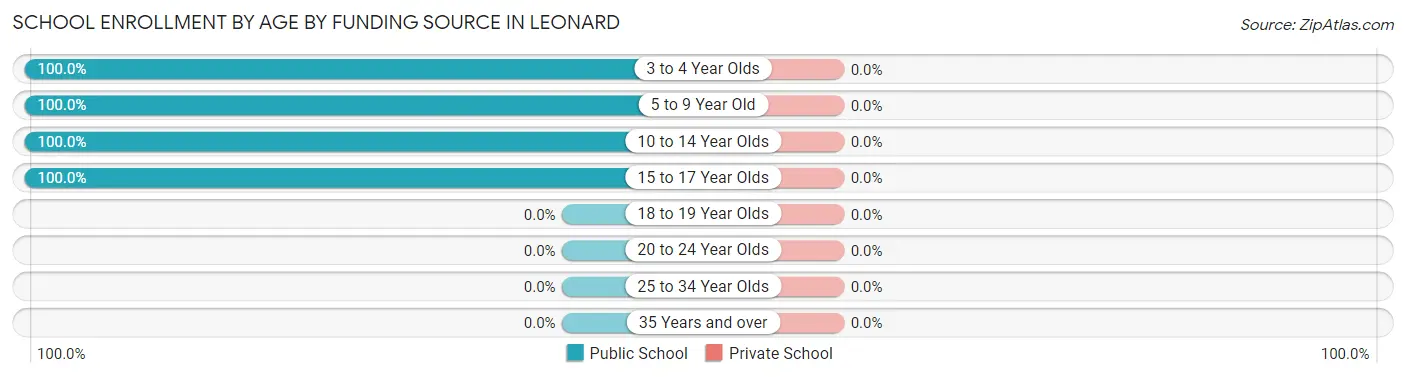
| Age Bracket | Public School | Private School |
| 3 to 4 Year Olds | 1 (100.0%) | 0 (0.0%) |
| 5 to 9 Year Old | 11 (100.0%) | 0 (0.0%) |
| 10 to 14 Year Olds | 27 (100.0%) | 0 (0.0%) |
| 15 to 17 Year Olds | 3 (100.0%) | 0 (0.0%) |
| 18 to 19 Year Olds | 0 (0.0%) | 0 (0.0%) |
| 20 to 24 Year Olds | 0 (0.0%) | 0 (0.0%) |
| 25 to 34 Year Olds | 0 (0.0%) | 0 (0.0%) |
| 35 Years and over | 0 (0.0%) | 0 (0.0%) |
| Total | 42 (100.0%) | 0 (0.0%) |
Educational Attainment by Field of Study in Leonard
Business (18 | 31.6%), science & technology (13 | 22.8%), bio, nature & agricultural (9 | 15.8%), arts & humanities (6 | 10.5%), and visual & performing arts (4 | 7.0%) are the most common fields of study among 57 individuals in Leonard who have obtained a bachelor's degree or higher.
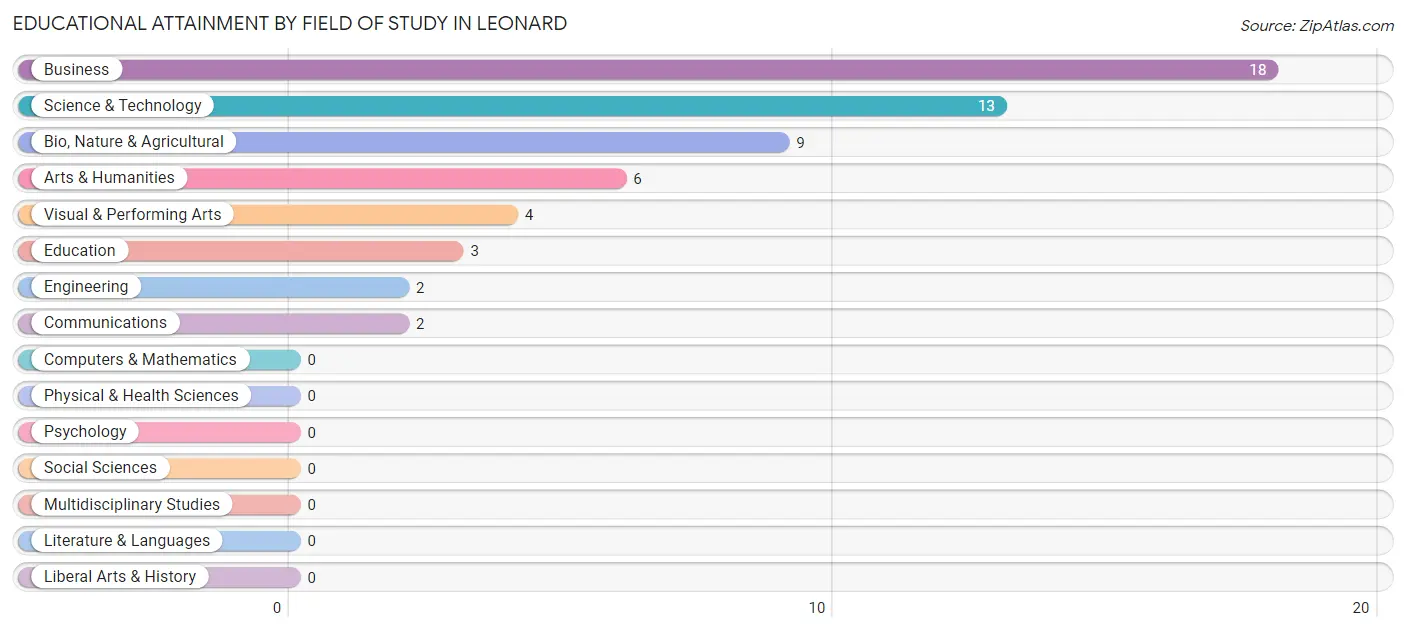
| Field of Study | # Graduates | % Graduates |
| Computers & Mathematics | 0 | 0.0% |
| Bio, Nature & Agricultural | 9 | 15.8% |
| Physical & Health Sciences | 0 | 0.0% |
| Psychology | 0 | 0.0% |
| Social Sciences | 0 | 0.0% |
| Engineering | 2 | 3.5% |
| Multidisciplinary Studies | 0 | 0.0% |
| Science & Technology | 13 | 22.8% |
| Business | 18 | 31.6% |
| Education | 3 | 5.3% |
| Literature & Languages | 0 | 0.0% |
| Liberal Arts & History | 0 | 0.0% |
| Visual & Performing Arts | 4 | 7.0% |
| Communications | 2 | 3.5% |
| Arts & Humanities | 6 | 10.5% |
| Total | 57 | 100.0% |
Transportation & Commute in Leonard
Vehicle Availability by Sex in Leonard
The most prevalent vehicle ownership categories in Leonard are males with 3 vehicles (27, accounting for 40.3%) and females with 3 vehicles (27, making up 41.5%).
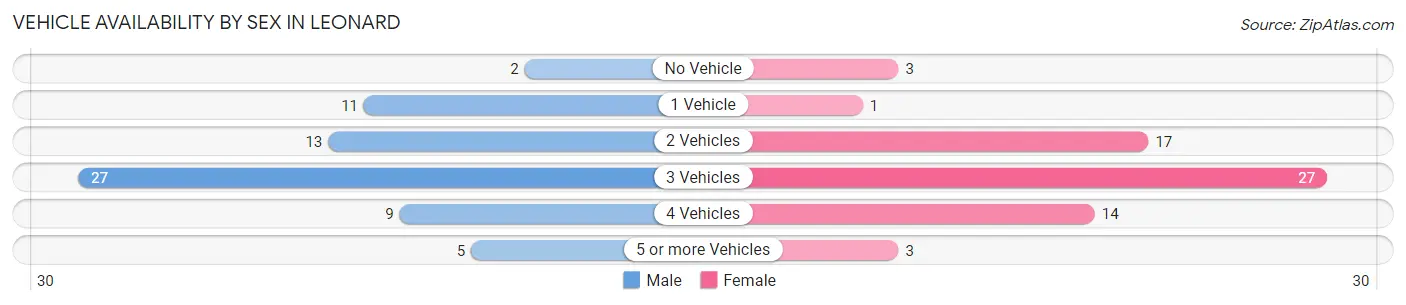
| Vehicles Available | Male | Female |
| No Vehicle | 2 (3.0%) | 3 (4.6%) |
| 1 Vehicle | 11 (16.4%) | 1 (1.5%) |
| 2 Vehicles | 13 (19.4%) | 17 (26.2%) |
| 3 Vehicles | 27 (40.3%) | 27 (41.5%) |
| 4 Vehicles | 9 (13.4%) | 14 (21.5%) |
| 5 or more Vehicles | 5 (7.5%) | 3 (4.6%) |
| Total | 67 (100.0%) | 65 (100.0%) |
Commute Time in Leonard
The most frequently occuring commute durations in Leonard are 45 to 59 minutes (24 commuters, 19.1%), 15 to 19 minutes (22 commuters, 17.5%), and 35 to 39 minutes (19 commuters, 15.1%).
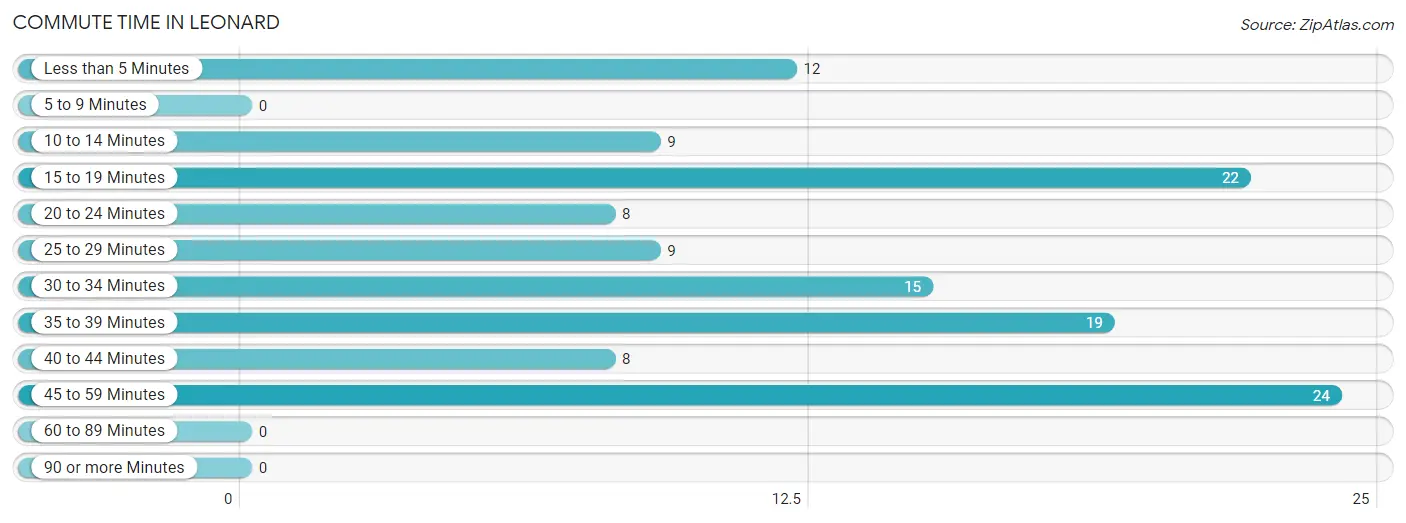
| Commute Time | # Commuters | % Commuters |
| Less than 5 Minutes | 12 | 9.5% |
| 5 to 9 Minutes | 0 | 0.0% |
| 10 to 14 Minutes | 9 | 7.1% |
| 15 to 19 Minutes | 22 | 17.5% |
| 20 to 24 Minutes | 8 | 6.4% |
| 25 to 29 Minutes | 9 | 7.1% |
| 30 to 34 Minutes | 15 | 11.9% |
| 35 to 39 Minutes | 19 | 15.1% |
| 40 to 44 Minutes | 8 | 6.4% |
| 45 to 59 Minutes | 24 | 19.1% |
| 60 to 89 Minutes | 0 | 0.0% |
| 90 or more Minutes | 0 | 0.0% |
Commute Time by Sex in Leonard
The most common commute times in Leonard are 15 to 19 minutes (17 commuters, 25.4%) for males and 35 to 39 minutes (15 commuters, 25.4%) for females.
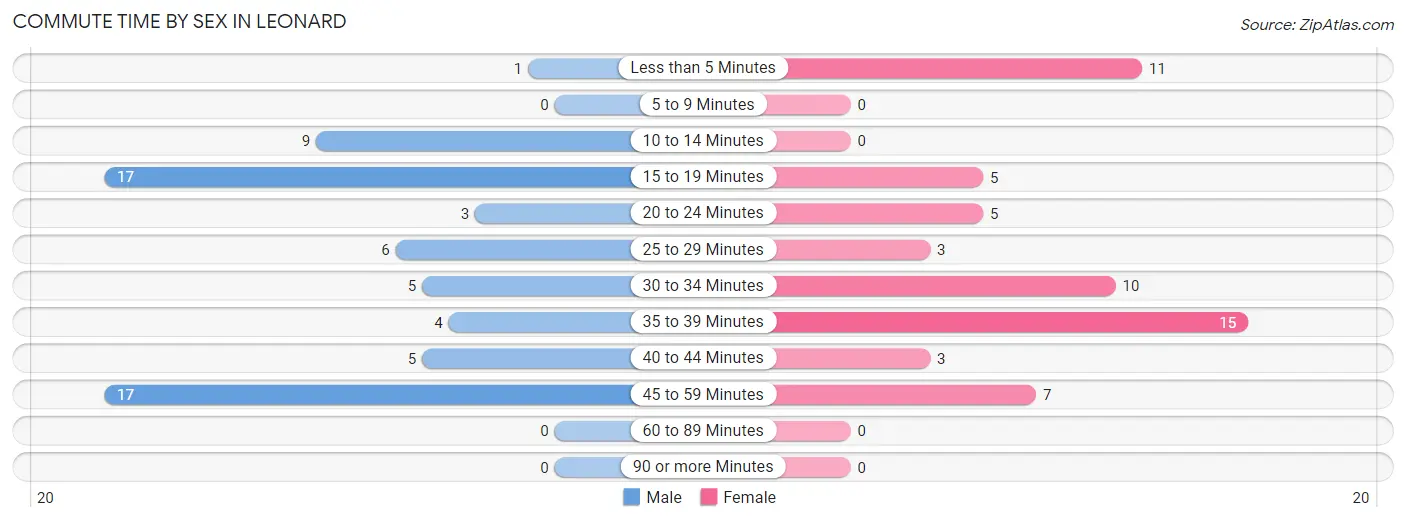
| Commute Time | Male | Female |
| Less than 5 Minutes | 1 (1.5%) | 11 (18.6%) |
| 5 to 9 Minutes | 0 (0.0%) | 0 (0.0%) |
| 10 to 14 Minutes | 9 (13.4%) | 0 (0.0%) |
| 15 to 19 Minutes | 17 (25.4%) | 5 (8.5%) |
| 20 to 24 Minutes | 3 (4.5%) | 5 (8.5%) |
| 25 to 29 Minutes | 6 (9.0%) | 3 (5.1%) |
| 30 to 34 Minutes | 5 (7.5%) | 10 (17.0%) |
| 35 to 39 Minutes | 4 (6.0%) | 15 (25.4%) |
| 40 to 44 Minutes | 5 (7.5%) | 3 (5.1%) |
| 45 to 59 Minutes | 17 (25.4%) | 7 (11.9%) |
| 60 to 89 Minutes | 0 (0.0%) | 0 (0.0%) |
| 90 or more Minutes | 0 (0.0%) | 0 (0.0%) |
Time of Departure to Work by Sex in Leonard
The most frequent times of departure to work in Leonard are 7:30 AM to 7:59 AM (25, 37.3%) for males and 7:00 AM to 7:29 AM (18, 30.5%) for females.
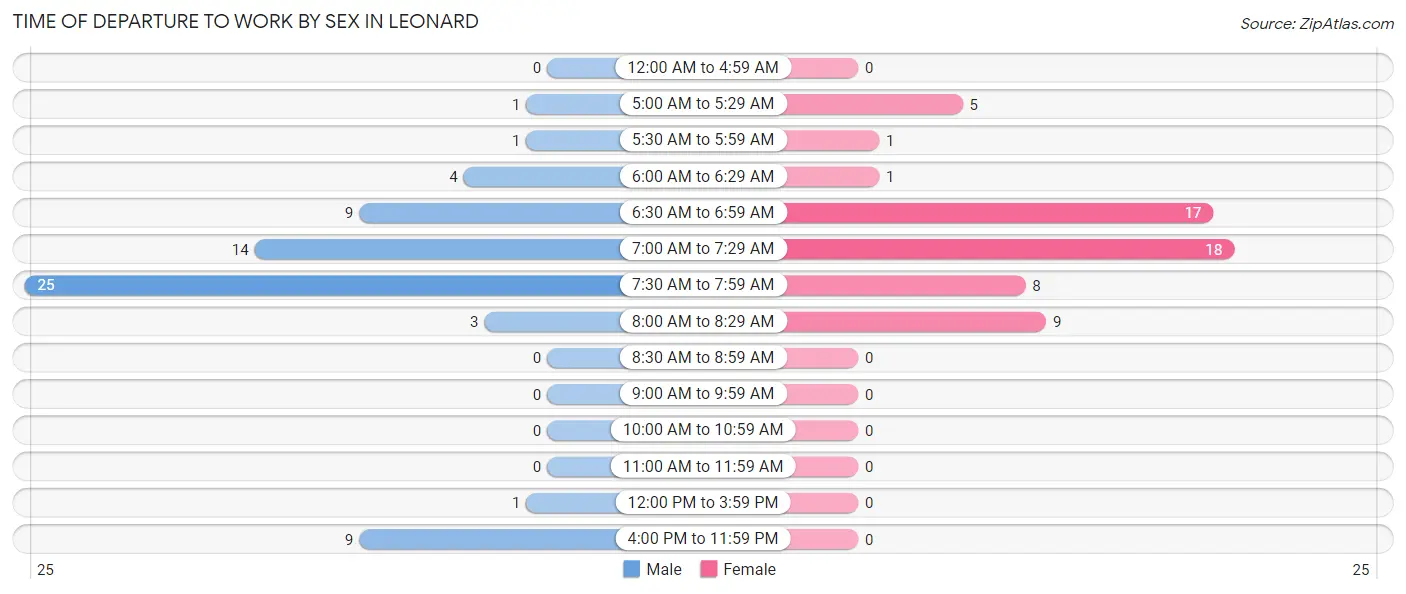
| Time of Departure | Male | Female |
| 12:00 AM to 4:59 AM | 0 (0.0%) | 0 (0.0%) |
| 5:00 AM to 5:29 AM | 1 (1.5%) | 5 (8.5%) |
| 5:30 AM to 5:59 AM | 1 (1.5%) | 1 (1.7%) |
| 6:00 AM to 6:29 AM | 4 (6.0%) | 1 (1.7%) |
| 6:30 AM to 6:59 AM | 9 (13.4%) | 17 (28.8%) |
| 7:00 AM to 7:29 AM | 14 (20.9%) | 18 (30.5%) |
| 7:30 AM to 7:59 AM | 25 (37.3%) | 8 (13.6%) |
| 8:00 AM to 8:29 AM | 3 (4.5%) | 9 (15.2%) |
| 8:30 AM to 8:59 AM | 0 (0.0%) | 0 (0.0%) |
| 9:00 AM to 9:59 AM | 0 (0.0%) | 0 (0.0%) |
| 10:00 AM to 10:59 AM | 0 (0.0%) | 0 (0.0%) |
| 11:00 AM to 11:59 AM | 0 (0.0%) | 0 (0.0%) |
| 12:00 PM to 3:59 PM | 1 (1.5%) | 0 (0.0%) |
| 4:00 PM to 11:59 PM | 9 (13.4%) | 0 (0.0%) |
| Total | 67 (100.0%) | 59 (100.0%) |
Housing Occupancy in Leonard
Occupancy by Ownership in Leonard
Of the total 113 dwellings in Leonard, owner-occupied units account for 91 (80.5%), while renter-occupied units make up 22 (19.5%).
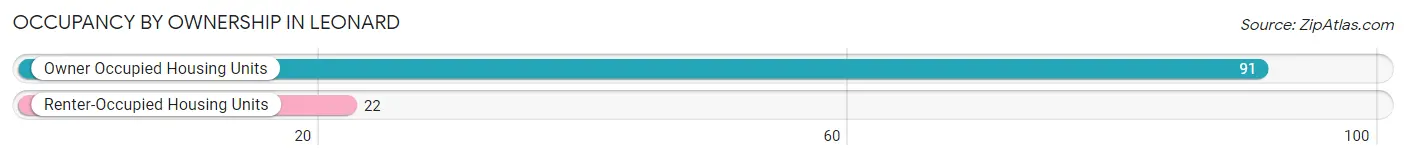
| Occupancy | # Housing Units | % Housing Units |
| Owner Occupied Housing Units | 91 | 80.5% |
| Renter-Occupied Housing Units | 22 | 19.5% |
| Total Occupied Housing Units | 113 | 100.0% |
Occupancy by Household Size in Leonard
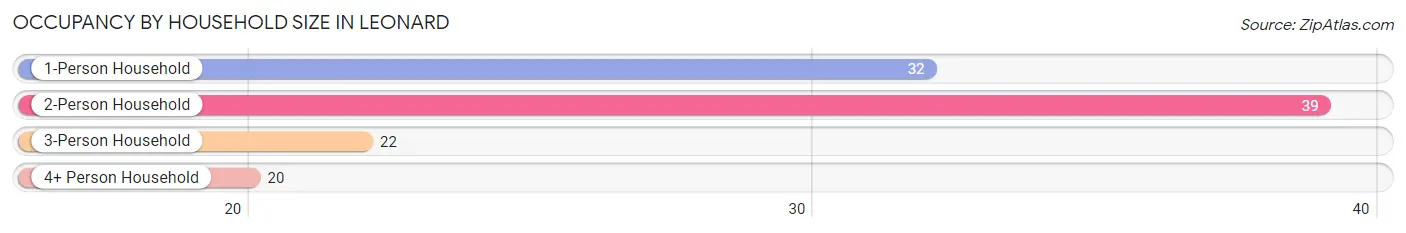
| Household Size | # Housing Units | % Housing Units |
| 1-Person Household | 32 | 28.3% |
| 2-Person Household | 39 | 34.5% |
| 3-Person Household | 22 | 19.5% |
| 4+ Person Household | 20 | 17.7% |
| Total Housing Units | 113 | 100.0% |
Occupancy by Ownership by Household Size in Leonard
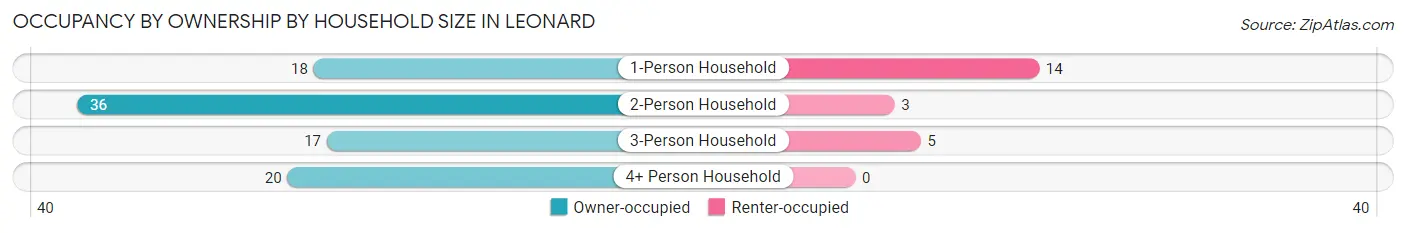
| Household Size | Owner-occupied | Renter-occupied |
| 1-Person Household | 18 (56.2%) | 14 (43.8%) |
| 2-Person Household | 36 (92.3%) | 3 (7.7%) |
| 3-Person Household | 17 (77.3%) | 5 (22.7%) |
| 4+ Person Household | 20 (100.0%) | 0 (0.0%) |
| Total Housing Units | 91 (80.5%) | 22 (19.5%) |
Occupancy by Educational Attainment in Leonard
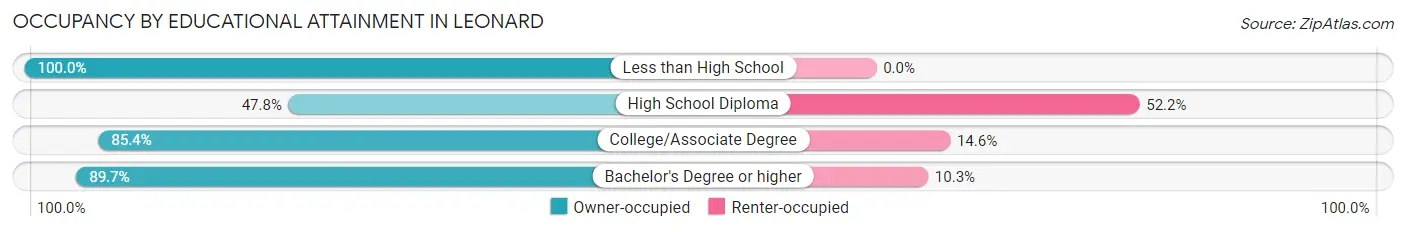
| Household Size | Owner-occupied | Renter-occupied |
| Less than High School | 10 (100.0%) | 0 (0.0%) |
| High School Diploma | 11 (47.8%) | 12 (52.2%) |
| College/Associate Degree | 35 (85.4%) | 6 (14.6%) |
| Bachelor's Degree or higher | 35 (89.7%) | 4 (10.3%) |
Occupancy by Age of Householder in Leonard
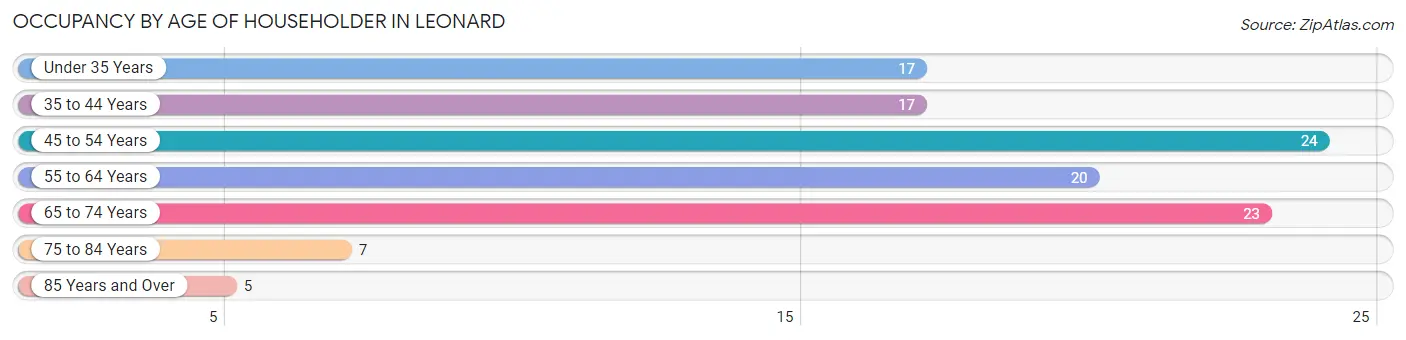
| Age Bracket | # Households | % Households |
| Under 35 Years | 17 | 15.0% |
| 35 to 44 Years | 17 | 15.0% |
| 45 to 54 Years | 24 | 21.2% |
| 55 to 64 Years | 20 | 17.7% |
| 65 to 74 Years | 23 | 20.3% |
| 75 to 84 Years | 7 | 6.2% |
| 85 Years and Over | 5 | 4.4% |
| Total | 113 | 100.0% |
Housing Finances in Leonard
Median Income by Occupancy in Leonard
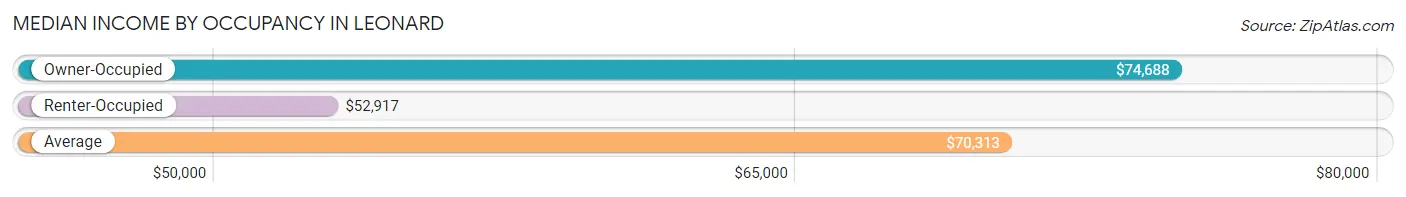
| Occupancy Type | # Households | Median Income |
| Owner-Occupied | 91 (80.5%) | $74,688 |
| Renter-Occupied | 22 (19.5%) | $52,917 |
| Average | 113 (100.0%) | $70,313 |
Occupancy by Householder Income Bracket in Leonard
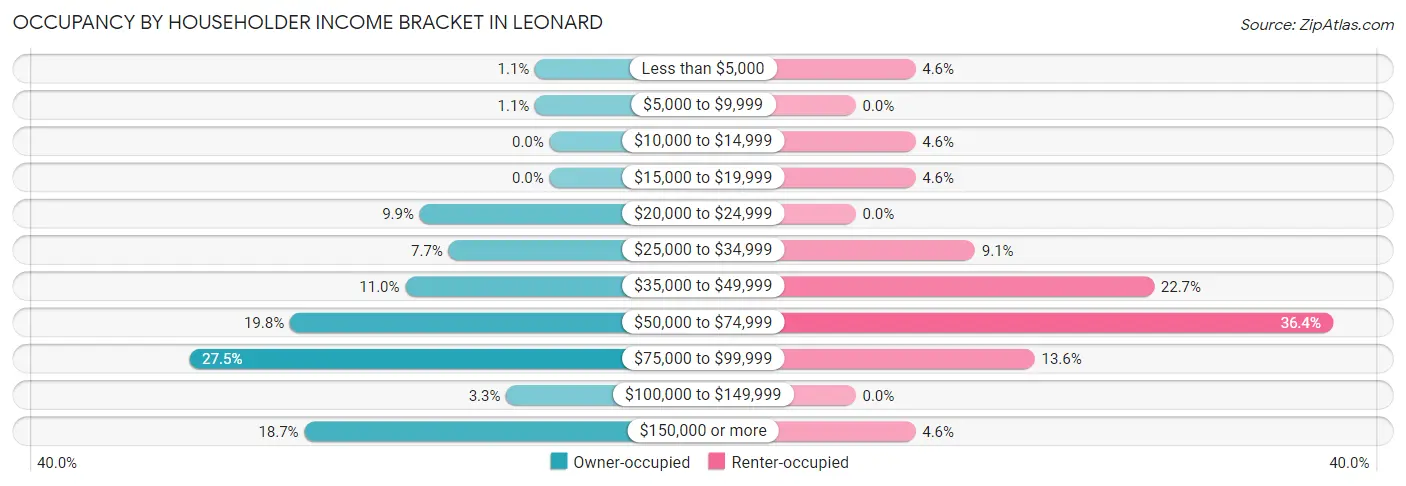
| Income Bracket | Owner-occupied | Renter-occupied |
| Less than $5,000 | 1 (1.1%) | 1 (4.5%) |
| $5,000 to $9,999 | 1 (1.1%) | 0 (0.0%) |
| $10,000 to $14,999 | 0 (0.0%) | 1 (4.5%) |
| $15,000 to $19,999 | 0 (0.0%) | 1 (4.5%) |
| $20,000 to $24,999 | 9 (9.9%) | 0 (0.0%) |
| $25,000 to $34,999 | 7 (7.7%) | 2 (9.1%) |
| $35,000 to $49,999 | 10 (11.0%) | 5 (22.7%) |
| $50,000 to $74,999 | 18 (19.8%) | 8 (36.4%) |
| $75,000 to $99,999 | 25 (27.5%) | 3 (13.6%) |
| $100,000 to $149,999 | 3 (3.3%) | 0 (0.0%) |
| $150,000 or more | 17 (18.7%) | 1 (4.5%) |
| Total | 91 (100.0%) | 22 (100.0%) |
Monthly Housing Cost Tiers in Leonard
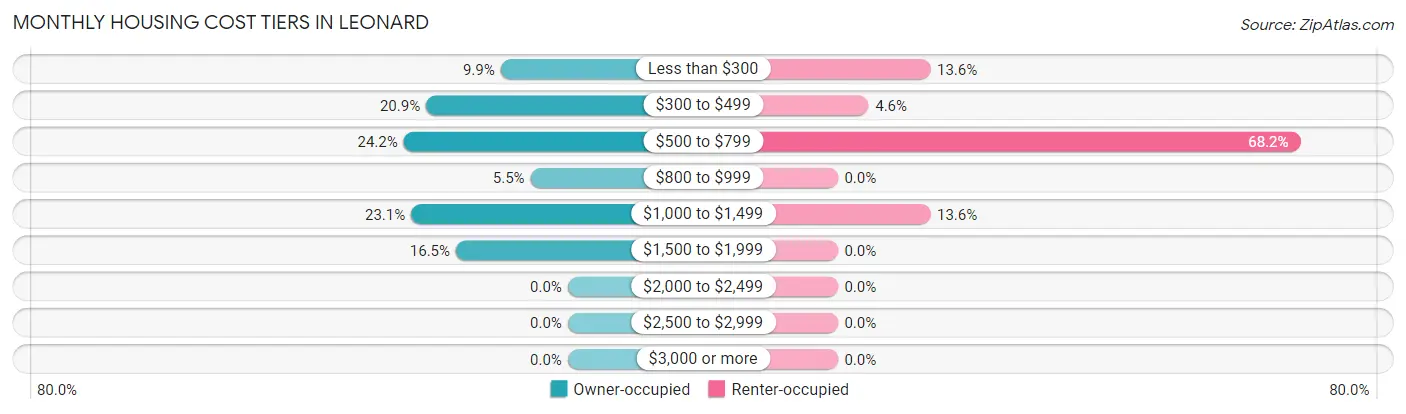
| Monthly Cost | Owner-occupied | Renter-occupied |
| Less than $300 | 9 (9.9%) | 3 (13.6%) |
| $300 to $499 | 19 (20.9%) | 1 (4.5%) |
| $500 to $799 | 22 (24.2%) | 15 (68.2%) |
| $800 to $999 | 5 (5.5%) | 0 (0.0%) |
| $1,000 to $1,499 | 21 (23.1%) | 3 (13.6%) |
| $1,500 to $1,999 | 15 (16.5%) | 0 (0.0%) |
| $2,000 to $2,499 | 0 (0.0%) | 0 (0.0%) |
| $2,500 to $2,999 | 0 (0.0%) | 0 (0.0%) |
| $3,000 or more | 0 (0.0%) | 0 (0.0%) |
| Total | 91 (100.0%) | 22 (100.0%) |
Physical Housing Characteristics in Leonard
Housing Structures in Leonard
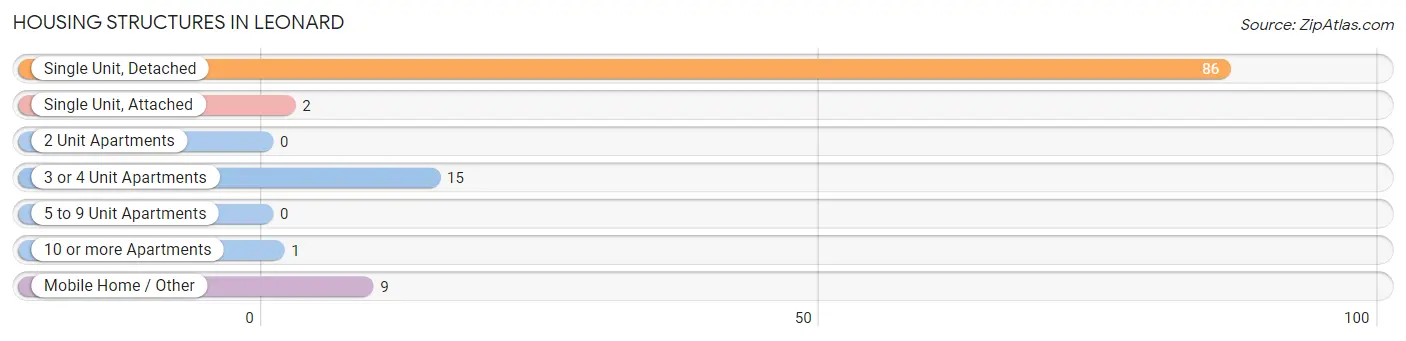
| Structure Type | # Housing Units | % Housing Units |
| Single Unit, Detached | 86 | 76.1% |
| Single Unit, Attached | 2 | 1.8% |
| 2 Unit Apartments | 0 | 0.0% |
| 3 or 4 Unit Apartments | 15 | 13.3% |
| 5 to 9 Unit Apartments | 0 | 0.0% |
| 10 or more Apartments | 1 | 0.9% |
| Mobile Home / Other | 9 | 8.0% |
| Total | 113 | 100.0% |
Housing Structures by Occupancy in Leonard
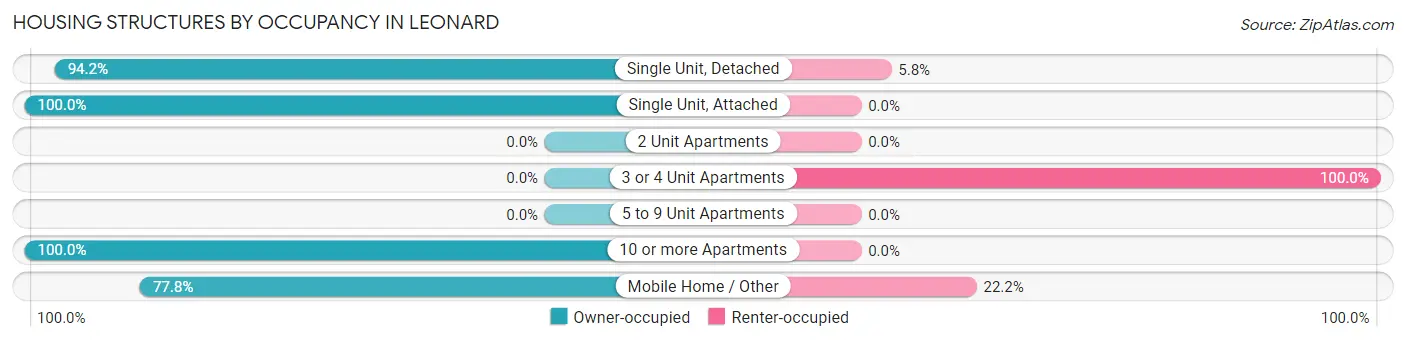
| Structure Type | Owner-occupied | Renter-occupied |
| Single Unit, Detached | 81 (94.2%) | 5 (5.8%) |
| Single Unit, Attached | 2 (100.0%) | 0 (0.0%) |
| 2 Unit Apartments | 0 (0.0%) | 0 (0.0%) |
| 3 or 4 Unit Apartments | 0 (0.0%) | 15 (100.0%) |
| 5 to 9 Unit Apartments | 0 (0.0%) | 0 (0.0%) |
| 10 or more Apartments | 1 (100.0%) | 0 (0.0%) |
| Mobile Home / Other | 7 (77.8%) | 2 (22.2%) |
| Total | 91 (80.5%) | 22 (19.5%) |
Housing Structures by Number of Rooms in Leonard
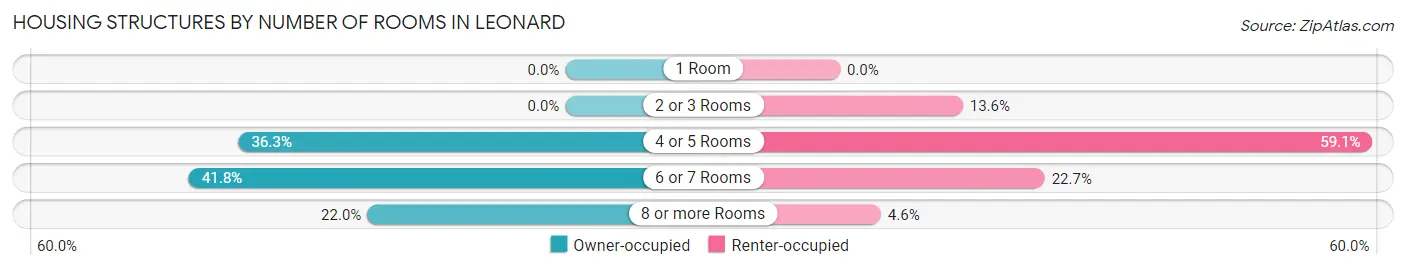
| Number of Rooms | Owner-occupied | Renter-occupied |
| 1 Room | 0 (0.0%) | 0 (0.0%) |
| 2 or 3 Rooms | 0 (0.0%) | 3 (13.6%) |
| 4 or 5 Rooms | 33 (36.3%) | 13 (59.1%) |
| 6 or 7 Rooms | 38 (41.8%) | 5 (22.7%) |
| 8 or more Rooms | 20 (22.0%) | 1 (4.5%) |
| Total | 91 (100.0%) | 22 (100.0%) |
Housing Structure by Heating Type in Leonard
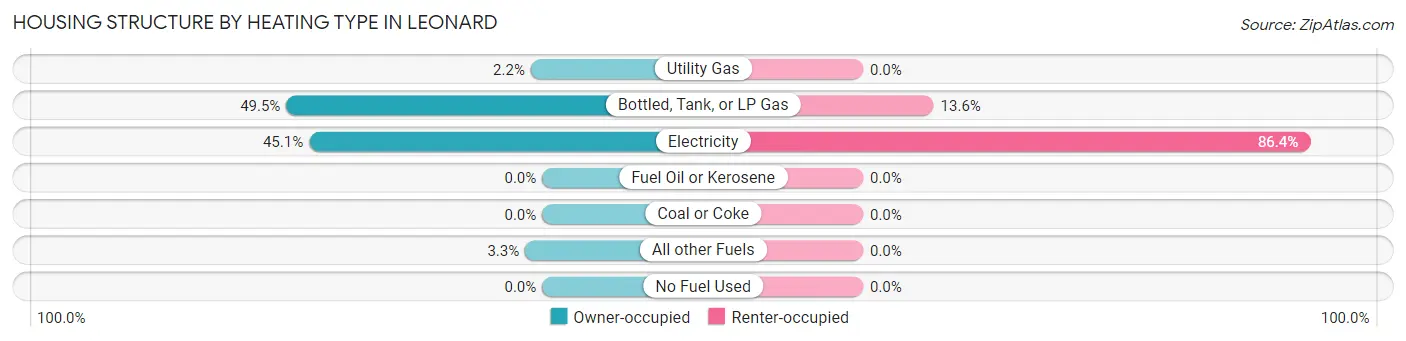
| Heating Type | Owner-occupied | Renter-occupied |
| Utility Gas | 2 (2.2%) | 0 (0.0%) |
| Bottled, Tank, or LP Gas | 45 (49.4%) | 3 (13.6%) |
| Electricity | 41 (45.1%) | 19 (86.4%) |
| Fuel Oil or Kerosene | 0 (0.0%) | 0 (0.0%) |
| Coal or Coke | 0 (0.0%) | 0 (0.0%) |
| All other Fuels | 3 (3.3%) | 0 (0.0%) |
| No Fuel Used | 0 (0.0%) | 0 (0.0%) |
| Total | 91 (100.0%) | 22 (100.0%) |
Household Vehicle Usage in Leonard
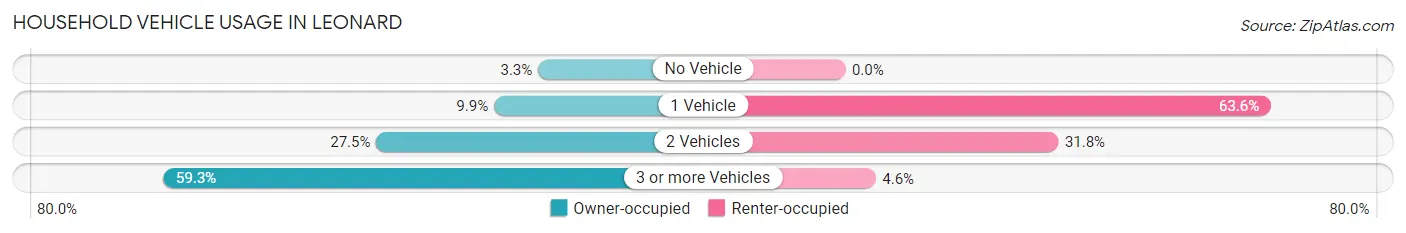
| Vehicles per Household | Owner-occupied | Renter-occupied |
| No Vehicle | 3 (3.3%) | 0 (0.0%) |
| 1 Vehicle | 9 (9.9%) | 14 (63.6%) |
| 2 Vehicles | 25 (27.5%) | 7 (31.8%) |
| 3 or more Vehicles | 54 (59.3%) | 1 (4.5%) |
| Total | 91 (100.0%) | 22 (100.0%) |
Real Estate & Mortgages in Leonard
Real Estate and Mortgage Overview in Leonard
| Characteristic | Without Mortgage | With Mortgage |
| Housing Units | 45 | 46 |
| Median Property Value | $131,900 | $157,800 |
| Median Household Income | $40,625 | $14 |
| Monthly Housing Costs | $445 | $0 |
| Real Estate Taxes | $1,125 | $0 |
Property Value by Mortgage Status in Leonard
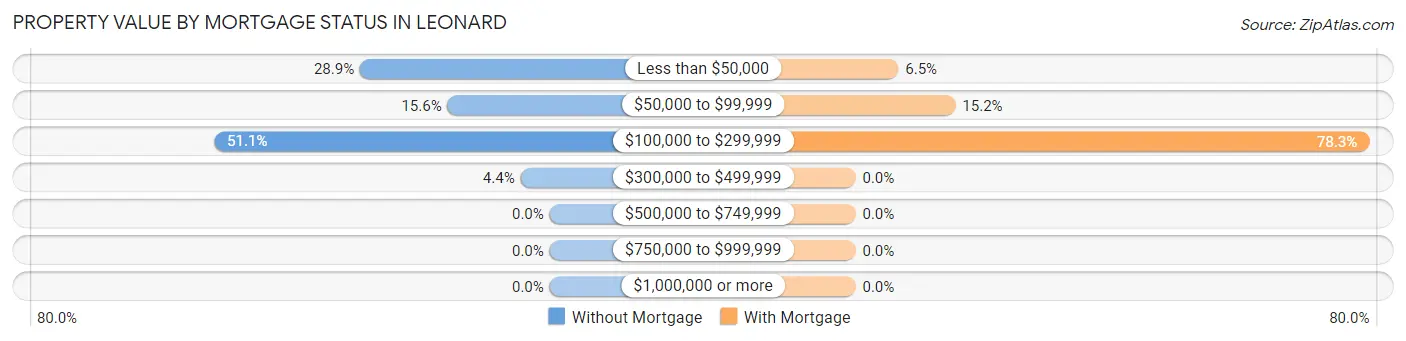
| Property Value | Without Mortgage | With Mortgage |
| Less than $50,000 | 13 (28.9%) | 3 (6.5%) |
| $50,000 to $99,999 | 7 (15.6%) | 7 (15.2%) |
| $100,000 to $299,999 | 23 (51.1%) | 36 (78.3%) |
| $300,000 to $499,999 | 2 (4.4%) | 0 (0.0%) |
| $500,000 to $749,999 | 0 (0.0%) | 0 (0.0%) |
| $750,000 to $999,999 | 0 (0.0%) | 0 (0.0%) |
| $1,000,000 or more | 0 (0.0%) | 0 (0.0%) |
| Total | 45 (100.0%) | 46 (100.0%) |
Household Income by Mortgage Status in Leonard
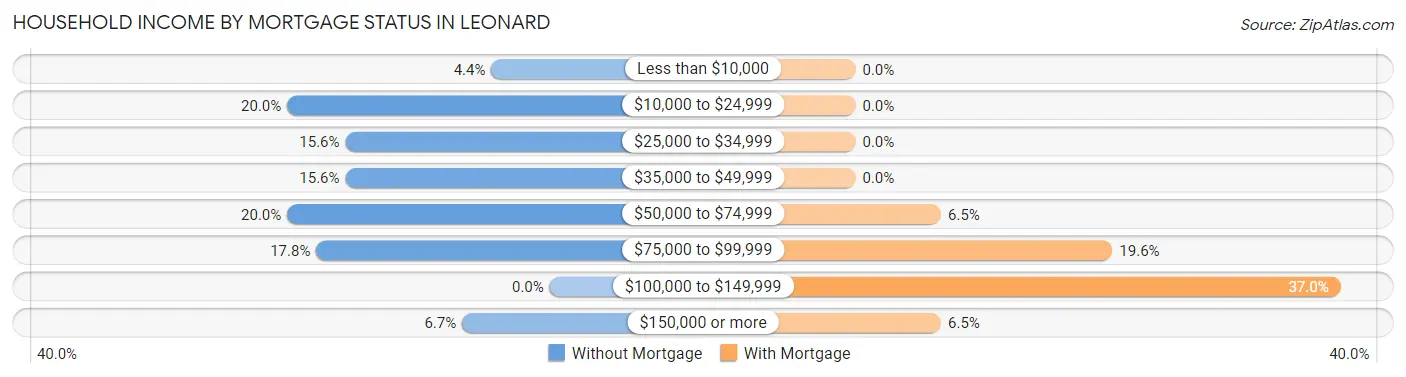
| Household Income | Without Mortgage | With Mortgage |
| Less than $10,000 | 2 (4.4%) | 0 (0.0%) |
| $10,000 to $24,999 | 9 (20.0%) | 0 (0.0%) |
| $25,000 to $34,999 | 7 (15.6%) | 0 (0.0%) |
| $35,000 to $49,999 | 7 (15.6%) | 0 (0.0%) |
| $50,000 to $74,999 | 9 (20.0%) | 3 (6.5%) |
| $75,000 to $99,999 | 8 (17.8%) | 9 (19.6%) |
| $100,000 to $149,999 | 0 (0.0%) | 17 (37.0%) |
| $150,000 or more | 3 (6.7%) | 3 (6.5%) |
| Total | 45 (100.0%) | 46 (100.0%) |
Property Value to Household Income Ratio in Leonard
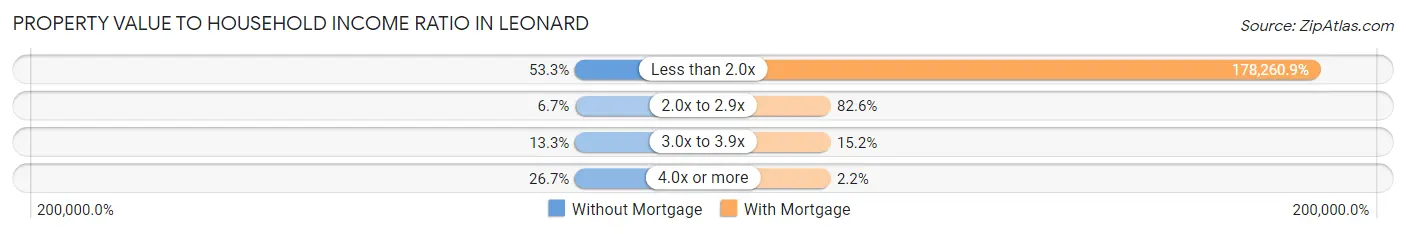
| Value-to-Income Ratio | Without Mortgage | With Mortgage |
| Less than 2.0x | 24 (53.3%) | 82,000 (178,260.9%) |
| 2.0x to 2.9x | 3 (6.7%) | 38 (82.6%) |
| 3.0x to 3.9x | 6 (13.3%) | 7 (15.2%) |
| 4.0x or more | 12 (26.7%) | 1 (2.2%) |
| Total | 45 (100.0%) | 46 (100.0%) |
Real Estate Taxes by Mortgage Status in Leonard
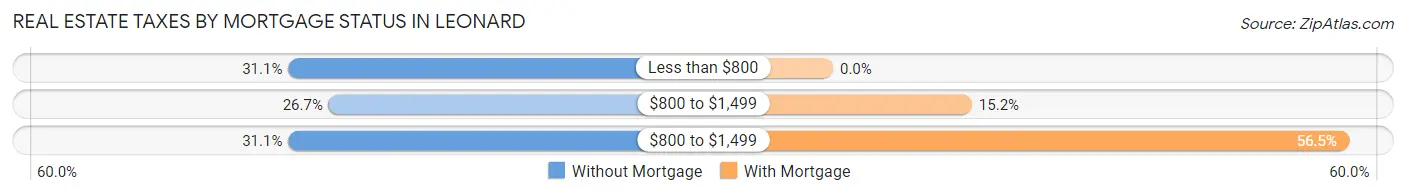
| Property Taxes | Without Mortgage | With Mortgage |
| Less than $800 | 14 (31.1%) | 0 (0.0%) |
| $800 to $1,499 | 12 (26.7%) | 7 (15.2%) |
| $800 to $1,499 | 14 (31.1%) | 26 (56.5%) |
| Total | 45 (100.0%) | 46 (100.0%) |
Health & Disability in Leonard
Health Insurance Coverage by Age in Leonard
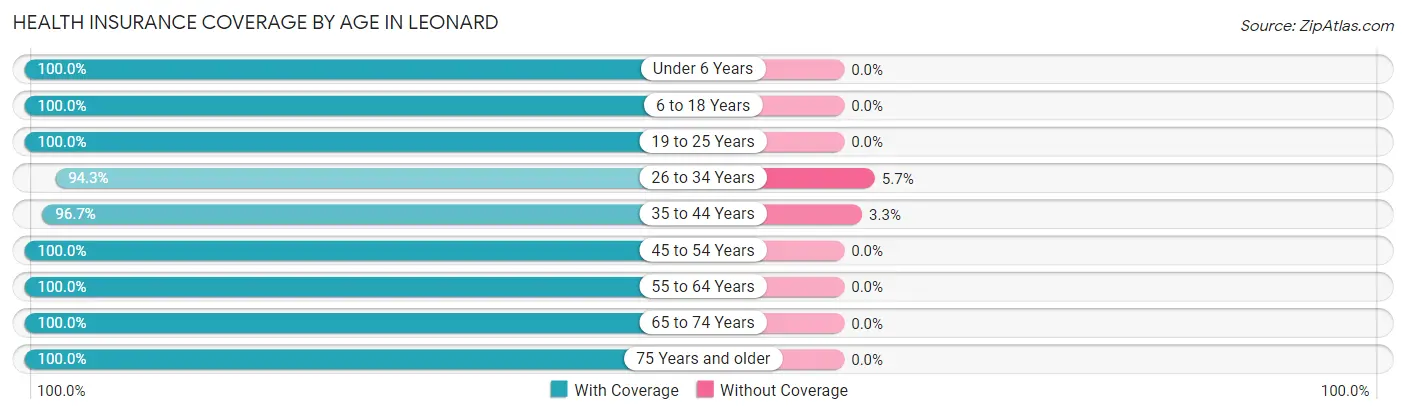
| Age Bracket | With Coverage | Without Coverage |
| Under 6 Years | 14 (100.0%) | 0 (0.0%) |
| 6 to 18 Years | 40 (100.0%) | 0 (0.0%) |
| 19 to 25 Years | 3 (100.0%) | 0 (0.0%) |
| 26 to 34 Years | 33 (94.3%) | 2 (5.7%) |
| 35 to 44 Years | 29 (96.7%) | 1 (3.3%) |
| 45 to 54 Years | 51 (100.0%) | 0 (0.0%) |
| 55 to 64 Years | 34 (100.0%) | 0 (0.0%) |
| 65 to 74 Years | 34 (100.0%) | 0 (0.0%) |
| 75 Years and older | 19 (100.0%) | 0 (0.0%) |
| Total | 257 (98.9%) | 3 (1.1%) |
Health Insurance Coverage by Citizenship Status in Leonard
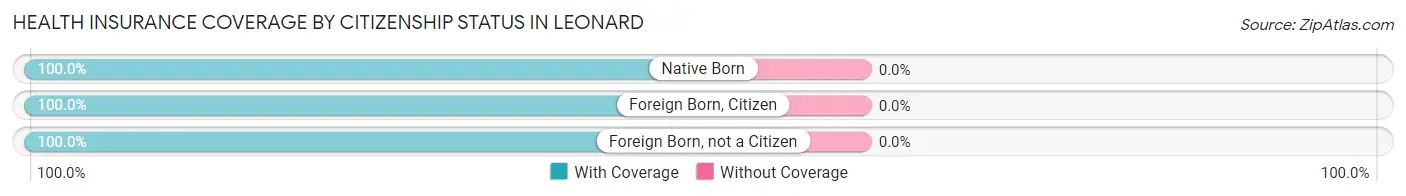
| Citizenship Status | With Coverage | Without Coverage |
| Native Born | 14 (100.0%) | 0 (0.0%) |
| Foreign Born, Citizen | 40 (100.0%) | 0 (0.0%) |
| Foreign Born, not a Citizen | 3 (100.0%) | 0 (0.0%) |
Health Insurance Coverage by Household Income in Leonard
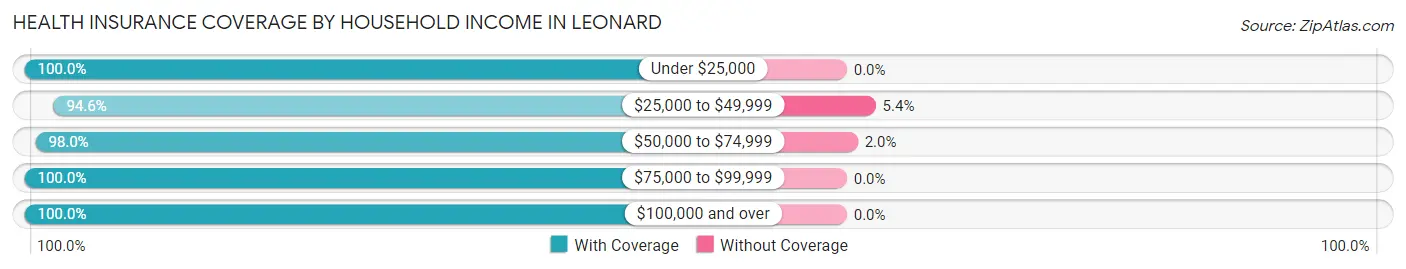
| Household Income | With Coverage | Without Coverage |
| Under $25,000 | 22 (100.0%) | 0 (0.0%) |
| $25,000 to $49,999 | 35 (94.6%) | 2 (5.4%) |
| $50,000 to $74,999 | 48 (98.0%) | 1 (2.0%) |
| $75,000 to $99,999 | 95 (100.0%) | 0 (0.0%) |
| $100,000 and over | 57 (100.0%) | 0 (0.0%) |
Public vs Private Health Insurance Coverage by Age in Leonard
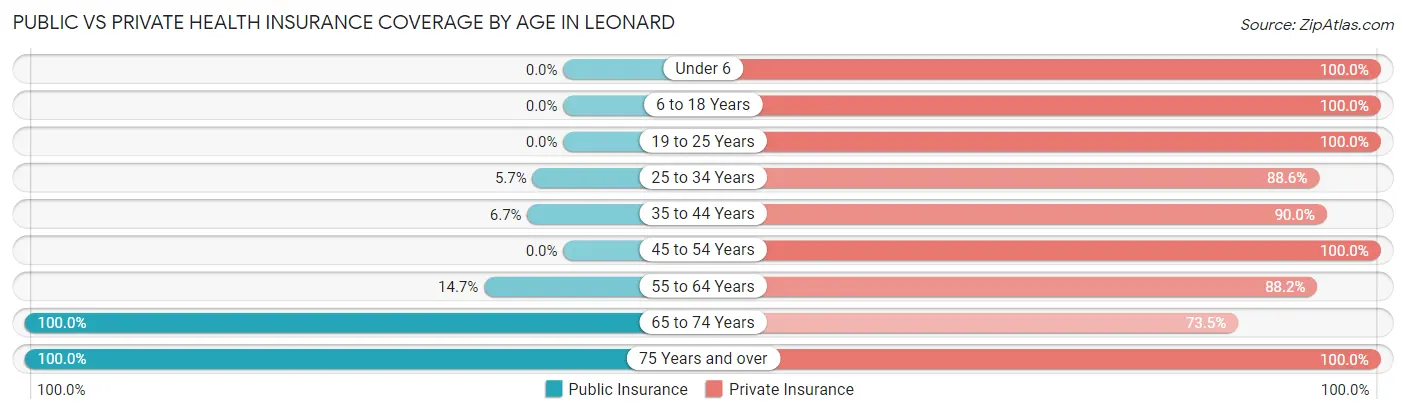
| Age Bracket | Public Insurance | Private Insurance |
| Under 6 | 0 (0.0%) | 14 (100.0%) |
| 6 to 18 Years | 0 (0.0%) | 40 (100.0%) |
| 19 to 25 Years | 0 (0.0%) | 3 (100.0%) |
| 25 to 34 Years | 2 (5.7%) | 31 (88.6%) |
| 35 to 44 Years | 2 (6.7%) | 27 (90.0%) |
| 45 to 54 Years | 0 (0.0%) | 51 (100.0%) |
| 55 to 64 Years | 5 (14.7%) | 30 (88.2%) |
| 65 to 74 Years | 34 (100.0%) | 25 (73.5%) |
| 75 Years and over | 19 (100.0%) | 19 (100.0%) |
| Total | 62 (23.8%) | 240 (92.3%) |
Disability Status by Sex by Age in Leonard
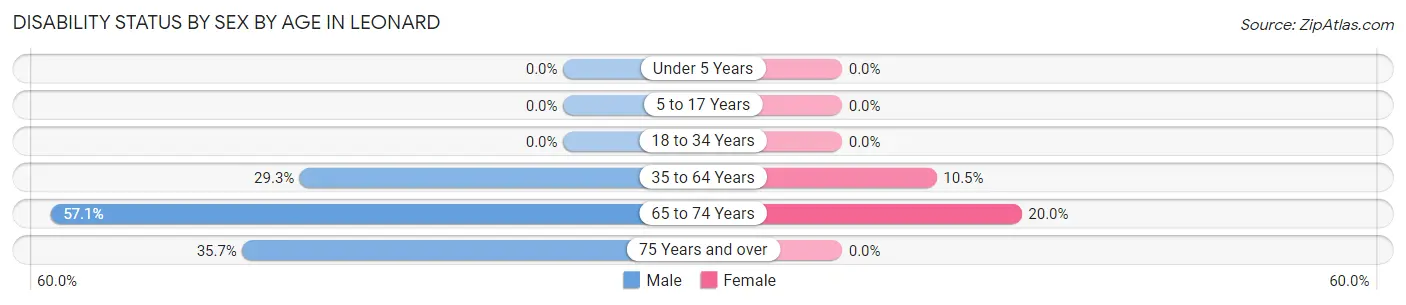
| Age Bracket | Male | Female |
| Under 5 Years | 0 (0.0%) | 0 (0.0%) |
| 5 to 17 Years | 0 (0.0%) | 0 (0.0%) |
| 18 to 34 Years | 0 (0.0%) | 0 (0.0%) |
| 35 to 64 Years | 17 (29.3%) | 6 (10.5%) |
| 65 to 74 Years | 8 (57.1%) | 4 (20.0%) |
| 75 Years and over | 5 (35.7%) | 0 (0.0%) |
Disability Class by Sex by Age in Leonard
Disability Class: Hearing Difficulty
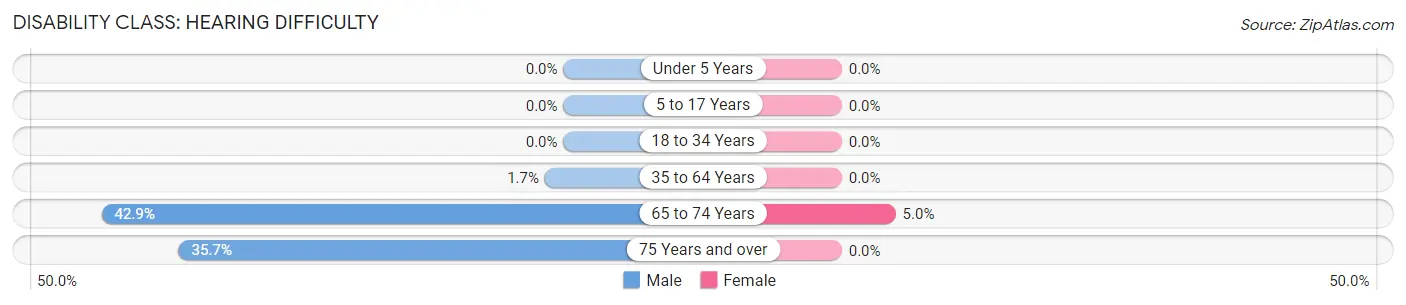
| Age Bracket | Male | Female |
| Under 5 Years | 0 (0.0%) | 0 (0.0%) |
| 5 to 17 Years | 0 (0.0%) | 0 (0.0%) |
| 18 to 34 Years | 0 (0.0%) | 0 (0.0%) |
| 35 to 64 Years | 1 (1.7%) | 0 (0.0%) |
| 65 to 74 Years | 6 (42.9%) | 1 (5.0%) |
| 75 Years and over | 5 (35.7%) | 0 (0.0%) |
Disability Class: Vision Difficulty
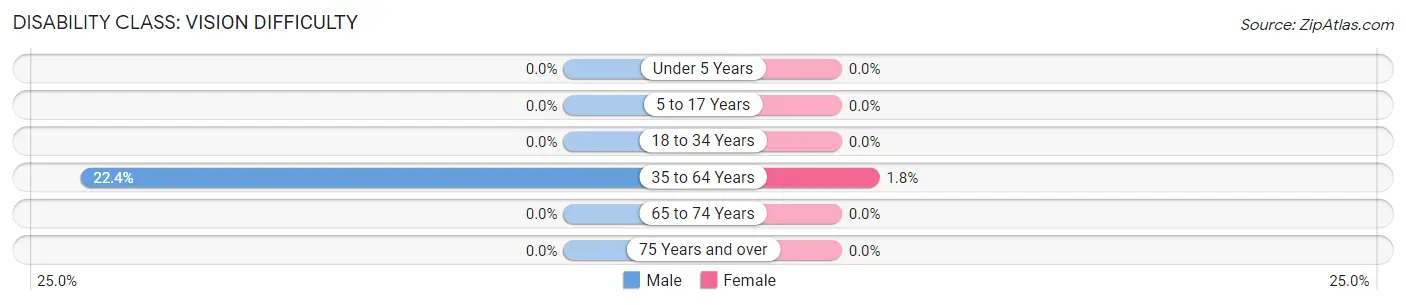
| Age Bracket | Male | Female |
| Under 5 Years | 0 (0.0%) | 0 (0.0%) |
| 5 to 17 Years | 0 (0.0%) | 0 (0.0%) |
| 18 to 34 Years | 0 (0.0%) | 0 (0.0%) |
| 35 to 64 Years | 13 (22.4%) | 1 (1.8%) |
| 65 to 74 Years | 0 (0.0%) | 0 (0.0%) |
| 75 Years and over | 0 (0.0%) | 0 (0.0%) |
Disability Class: Cognitive Difficulty
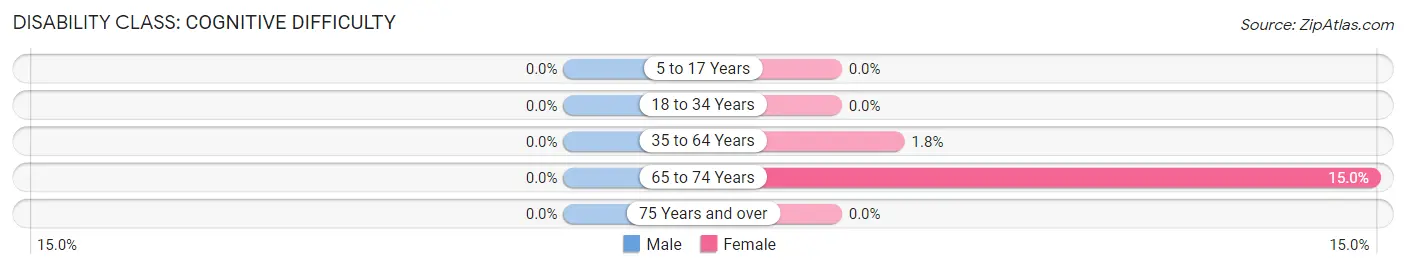
| Age Bracket | Male | Female |
| 5 to 17 Years | 0 (0.0%) | 0 (0.0%) |
| 18 to 34 Years | 0 (0.0%) | 0 (0.0%) |
| 35 to 64 Years | 0 (0.0%) | 1 (1.8%) |
| 65 to 74 Years | 0 (0.0%) | 3 (15.0%) |
| 75 Years and over | 0 (0.0%) | 0 (0.0%) |
Disability Class: Ambulatory Difficulty
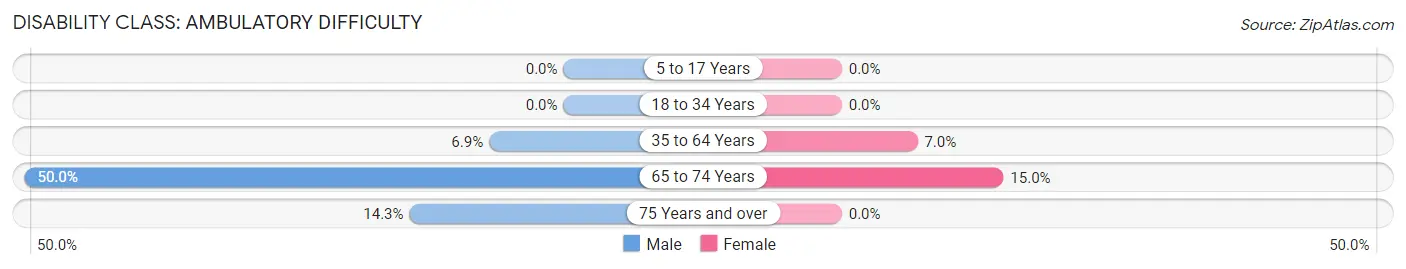
| Age Bracket | Male | Female |
| 5 to 17 Years | 0 (0.0%) | 0 (0.0%) |
| 18 to 34 Years | 0 (0.0%) | 0 (0.0%) |
| 35 to 64 Years | 4 (6.9%) | 4 (7.0%) |
| 65 to 74 Years | 7 (50.0%) | 3 (15.0%) |
| 75 Years and over | 2 (14.3%) | 0 (0.0%) |
Disability Class: Self-Care Difficulty
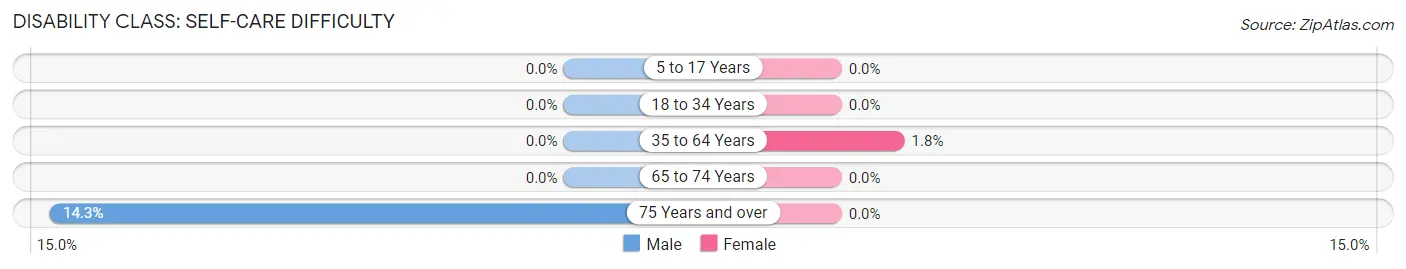
| Age Bracket | Male | Female |
| 5 to 17 Years | 0 (0.0%) | 0 (0.0%) |
| 18 to 34 Years | 0 (0.0%) | 0 (0.0%) |
| 35 to 64 Years | 0 (0.0%) | 1 (1.8%) |
| 65 to 74 Years | 0 (0.0%) | 0 (0.0%) |
| 75 Years and over | 2 (14.3%) | 0 (0.0%) |
Technology Access in Leonard
Computing Device Access in Leonard
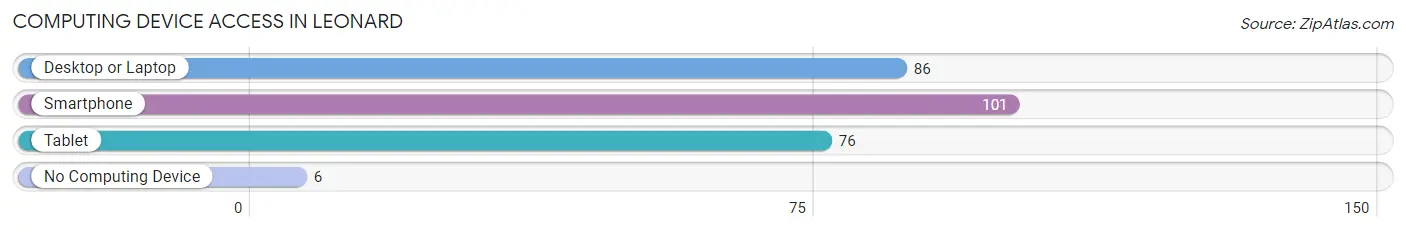
| Device Type | # Households | % Households |
| Desktop or Laptop | 86 | 76.1% |
| Smartphone | 101 | 89.4% |
| Tablet | 76 | 67.3% |
| No Computing Device | 6 | 5.3% |
| Total | 113 | 100.0% |
Internet Access in Leonard
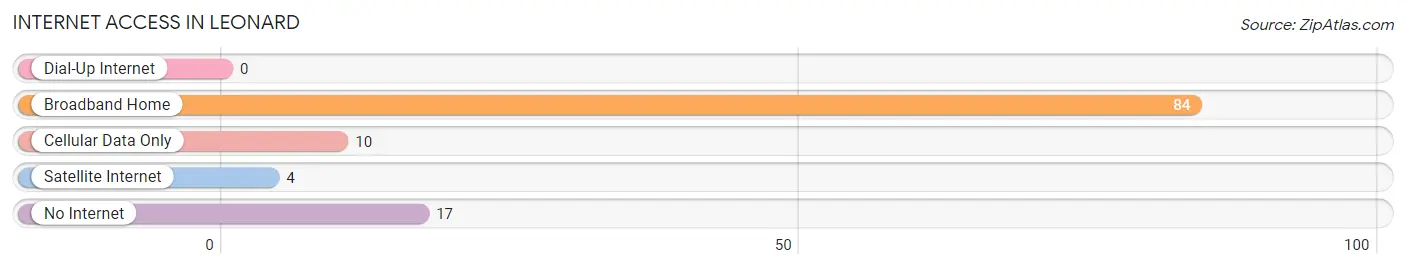
| Internet Type | # Households | % Households |
| Dial-Up Internet | 0 | 0.0% |
| Broadband Home | 84 | 74.3% |
| Cellular Data Only | 10 | 8.8% |
| Satellite Internet | 4 | 3.5% |
| No Internet | 17 | 15.0% |
| Total | 113 | 100.0% |
Leonard Summary
Leonard is a small city located in the state of North Dakota, in the United States. It is situated in the southeastern corner of the state, in the Red River Valley. The city is located in the county of Grand Forks, and is part of the Grand Forks metropolitan area. The population of Leonard was estimated to be 1,093 in 2019.
History
The area that is now Leonard was first settled in 1881 by a group of Norwegian immigrants. The city was named after Leonard Larson, one of the original settlers. The city was incorporated in 1883, and the first post office was established in 1884.
In the early 1900s, Leonard was a thriving agricultural community. The city was home to several grain elevators, a creamery, a flour mill, and a lumber yard. The city also had a bank, a hotel, and several stores.
In the 1950s, the city began to experience a decline in population as people moved away to larger cities. The city's population dropped from 1,400 in 1950 to just over 1,000 in 2019.
Geography
Leonard is located in the Red River Valley, in the southeastern corner of North Dakota. The city is situated on the banks of the Red River, which forms the border between North Dakota and Minnesota. The city is located about 25 miles south of Grand Forks, and about 50 miles north of Fargo.
The city has a total area of 0.9 square miles, all of which is land. The terrain is mostly flat, with some rolling hills in the area. The climate is continental, with cold winters and hot summers.
Economy
The economy of Leonard is largely based on agriculture. The city is home to several grain elevators, and the surrounding area is used for farming and ranching. The city also has a few small businesses, including a grocery store, a hardware store, and a restaurant.
The city is also home to a few manufacturing companies, including a furniture manufacturer and a plastics manufacturer. The city is also home to a few small technology companies.
Demographics
As of 2019, the population of Leonard was estimated to be 1,093. The population is predominantly white, with a small minority population. The median household income is $45,000, and the median home value is $125,000.
The city has a low unemployment rate, and the majority of the population is employed in the agricultural and manufacturing industries. The city also has a small but growing technology sector.
Conclusion
Leonard is a small city located in the southeastern corner of North Dakota. The city has a long history, and was once a thriving agricultural community. Today, the city is home to several grain elevators, manufacturing companies, and small businesses. The population of Leonard is predominantly white, with a median household income of $45,000 and a median home value of $125,000. The city has a low unemployment rate, and the majority of the population is employed in the agricultural and manufacturing industries.
Common Questions
What is Per Capita Income in Leonard?
Per Capita income in Leonard is $38,920.
What is the Median Family Income in Leonard?
Median Family Income in Leonard is $78,750.
What is the Median Household income in Leonard?
Median Household Income in Leonard is $70,313.
What is Income or Wage Gap in Leonard?
Income or Wage Gap in Leonard is 28.4%.
Women in Leonard earn 71.6 cents for every dollar earned by a man.
What is Inequality or Gini Index in Leonard?
Inequality or Gini Index in Leonard is 0.42.
What is the Total Population of Leonard?
Total Population of Leonard is 260.
What is the Total Male Population of Leonard?
Total Male Population of Leonard is 127.
What is the Total Female Population of Leonard?
Total Female Population of Leonard is 133.
What is the Ratio of Males per 100 Females in Leonard?
There are 95.49 Males per 100 Females in Leonard.
What is the Ratio of Females per 100 Males in Leonard?
There are 104.72 Females per 100 Males in Leonard.
What is the Median Population Age in Leonard?
Median Population Age in Leonard is 47.3 Years.
What is the Average Family Size in Leonard
Average Family Size in Leonard is 2.8 People.
What is the Average Household Size in Leonard
Average Household Size in Leonard is 2.3 People.
How Large is the Labor Force in Leonard?
There are 143 People in the Labor Forcein in Leonard.
What is the Percentage of People in the Labor Force in Leonard?
68.8% of People are in the Labor Force in Leonard.
What is the Unemployment Rate in Leonard?
Unemployment Rate in Leonard is 5.6%.