Crary, ND Map & Demographics
Crary Map
Crary Overview
$32,085
PER CAPITA INCOME
$110,139
AVG FAMILY INCOME
$92,500
AVG HOUSEHOLD INCOME
31.0%
WAGE / INCOME GAP [ % ]
69.0¢/ $1
WAGE / INCOME GAP [ $ ]
0.32
INEQUALITY / GINI INDEX
107
TOTAL POPULATION
60
MALE POPULATION
47
FEMALE POPULATION
127.66
MALES / 100 FEMALES
78.33
FEMALES / 100 MALES
38.2
MEDIAN AGE
3.4
AVG FAMILY SIZE
2.8
AVG HOUSEHOLD SIZE
64
LABOR FORCE [ PEOPLE ]
80.0%
PERCENT IN LABOR FORCE
Crary Zip Codes
Crary Area Codes
Income in Crary
Income Overview in Crary
Per Capita Income in Crary is $32,085, while median incomes of families and households are $110,139 and $92,500 respectively.
| Characteristic | Number | Measure |
| Per Capita Income | 107 | $32,085 |
| Median Family Income | 27 | $110,139 |
| Mean Family Income | 27 | $90,744 |
| Median Household Income | 38 | $92,500 |
| Mean Household Income | 38 | $93,737 |
| Income Deficit | 27 | $0 |
| Wage / Income Gap (%) | 107 | 30.97% |
| Wage / Income Gap ($) | 107 | 69.03¢ per $1 |
| Gini / Inequality Index | 107 | 0.32 |
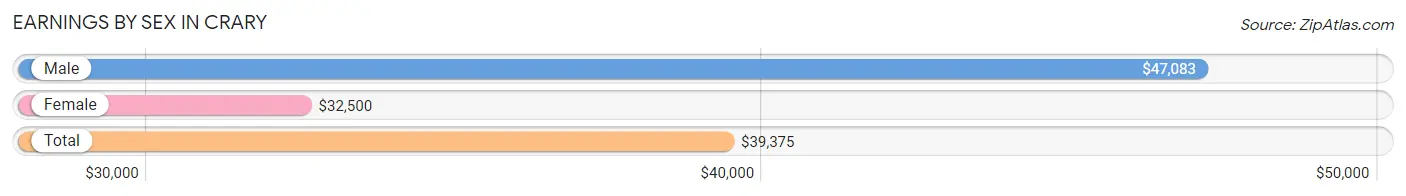
Earnings by Sex in Crary
Average Earnings in Crary are $39,375, $47,083 for men and $32,500 for women, a difference of 31.0%.
| Sex | Number | Average Earnings |
| Male | 43 (64.2%) | $47,083 |
| Female | 24 (35.8%) | $32,500 |
| Total | 67 (100.0%) | $39,375 |
Earnings by Sex by Income Bracket in Crary
The most common earnings brackets in Crary are $2,499 or less for men (11 | 25.6%) and $25,000 to $29,999 for women (9 | 37.5%).

| Income | Male | Female |
| $2,499 or less | 11 (25.6%) | 1 (4.2%) |
| $2,500 to $4,999 | 0 (0.0%) | 0 (0.0%) |
| $5,000 to $7,499 | 2 (4.6%) | 0 (0.0%) |
| $7,500 to $9,999 | 0 (0.0%) | 0 (0.0%) |
| $10,000 to $12,499 | 1 (2.3%) | 1 (4.2%) |
| $12,500 to $14,999 | 1 (2.3%) | 0 (0.0%) |
| $15,000 to $17,499 | 0 (0.0%) | 0 (0.0%) |
| $17,500 to $19,999 | 0 (0.0%) | 1 (4.2%) |
| $20,000 to $22,499 | 0 (0.0%) | 0 (0.0%) |
| $22,500 to $24,999 | 0 (0.0%) | 0 (0.0%) |
| $25,000 to $29,999 | 0 (0.0%) | 9 (37.5%) |
| $30,000 to $34,999 | 3 (7.0%) | 0 (0.0%) |
| $35,000 to $39,999 | 0 (0.0%) | 4 (16.7%) |
| $40,000 to $44,999 | 1 (2.3%) | 2 (8.3%) |
| $45,000 to $49,999 | 3 (7.0%) | 0 (0.0%) |
| $50,000 to $54,999 | 2 (4.6%) | 1 (4.2%) |
| $55,000 to $64,999 | 5 (11.6%) | 2 (8.3%) |
| $65,000 to $74,999 | 2 (4.6%) | 0 (0.0%) |
| $75,000 to $99,999 | 10 (23.3%) | 0 (0.0%) |
| $100,000+ | 2 (4.6%) | 3 (12.5%) |
| Total | 43 (100.0%) | 24 (100.0%) |
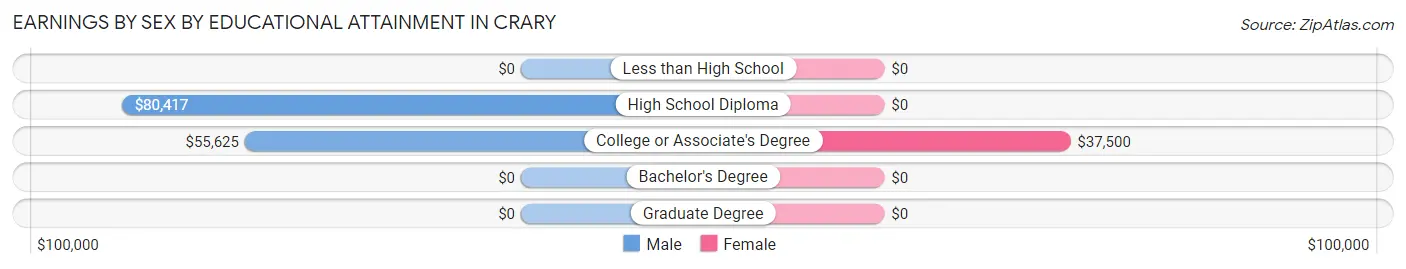
Earnings by Sex by Educational Attainment in Crary
Average earnings in Crary are $57,917 for men and $36,250 for women, a difference of 37.4%. Men with an educational attainment of high school diploma enjoy the highest average annual earnings of $80,417, while those with college or associate's degree education earn the least with $55,625. Women with an educational attainment of college or associate's degree earn the most with the average annual earnings of $37,500, while those with college or associate's degree education have the smallest earnings of $37,500.
| Educational Attainment | Male Income | Female Income |
| Less than High School | - | - |
| High School Diploma | $80,417 | $0 |
| College or Associate's Degree | $55,625 | $37,500 |
| Bachelor's Degree | - | - |
| Graduate Degree | - | - |
| Total | $57,917 | $36,250 |
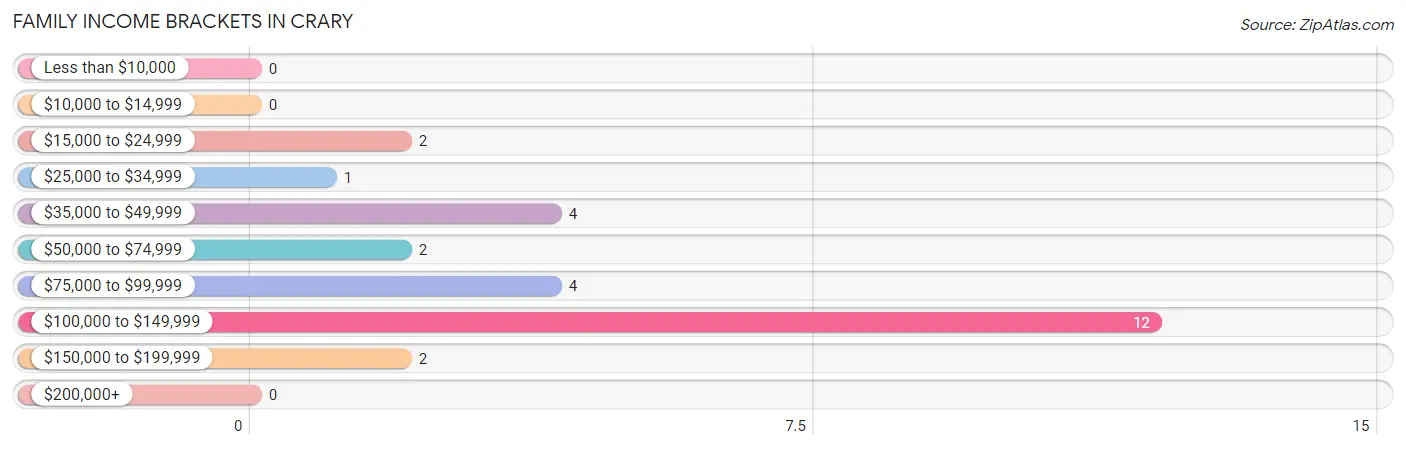
Family Income in Crary
Family Income Brackets in Crary
According to the Crary family income data, there are 12 families falling into the $100,000 to $149,999 income range, which is the most common income bracket and makes up 44.4% of all families.
| Income Bracket | # Families | % Families |
| Less than $10,000 | 0 | 0.0% |
| $10,000 to $14,999 | 0 | 0.0% |
| $15,000 to $24,999 | 2 | 7.4% |
| $25,000 to $34,999 | 1 | 3.7% |
| $35,000 to $49,999 | 4 | 14.8% |
| $50,000 to $74,999 | 2 | 7.4% |
| $75,000 to $99,999 | 4 | 14.8% |
| $100,000 to $149,999 | 12 | 44.4% |
| $150,000 to $199,999 | 2 | 7.4% |
| $200,000+ | 0 | 0.0% |
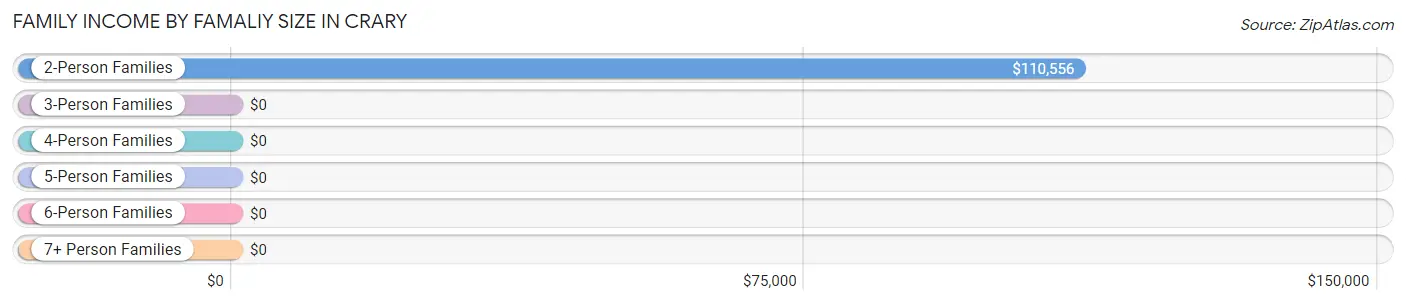
Family Income by Famaliy Size in Crary
2-person families (14 | 51.8%) account for the highest median family income in Crary with $110,556 per family, while 2-person families (14 | 51.8%) have the highest median income of $55,278 per family member.
| Income Bracket | # Families | Median Income |
| 2-Person Families | 14 (51.8%) | $110,556 |
| 3-Person Families | 6 (22.2%) | $0 |
| 4-Person Families | 1 (3.7%) | $0 |
| 5-Person Families | 3 (11.1%) | $0 |
| 6-Person Families | 0 (0.0%) | $0 |
| 7+ Person Families | 3 (11.1%) | $0 |
| Total | 27 (100.0%) | $110,139 |
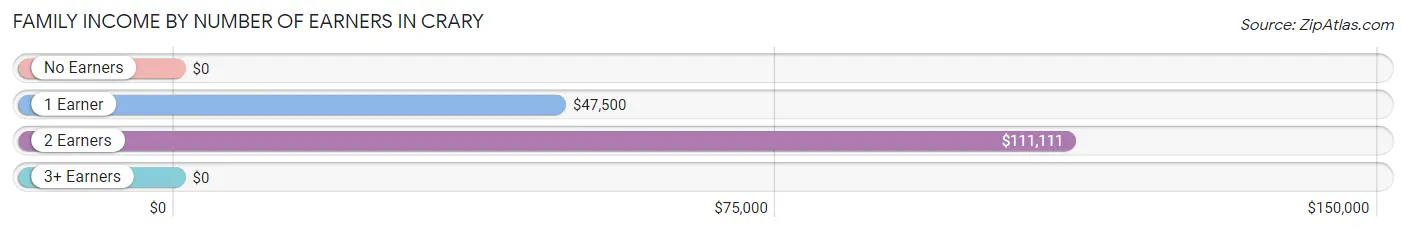
Family Income by Number of Earners in Crary
| Number of Earners | # Families | Median Income |
| No Earners | 2 (7.4%) | $0 |
| 1 Earner | 6 (22.2%) | $47,500 |
| 2 Earners | 16 (59.3%) | $111,111 |
| 3+ Earners | 3 (11.1%) | $0 |
| Total | 27 (100.0%) | $110,139 |
Household Income in Crary
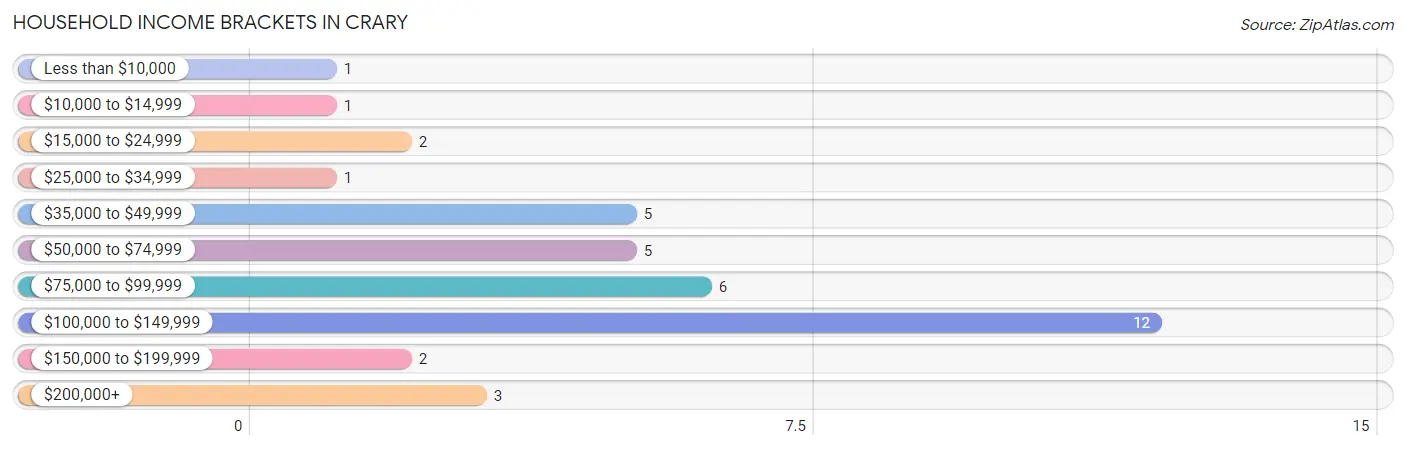
Household Income Brackets in Crary
With 12 households falling in the category, the $100,000 to $149,999 income range is the most frequent in Crary, accounting for 31.6% of all households. In contrast, only 1 households (2.6%) fall into the less than $10,000 income bracket, making it the least populous group.
| Income Bracket | # Households | % Households |
| Less than $10,000 | 1 | 2.6% |
| $10,000 to $14,999 | 1 | 2.6% |
| $15,000 to $24,999 | 2 | 5.3% |
| $25,000 to $34,999 | 1 | 2.6% |
| $35,000 to $49,999 | 5 | 13.2% |
| $50,000 to $74,999 | 5 | 13.2% |
| $75,000 to $99,999 | 6 | 15.8% |
| $100,000 to $149,999 | 12 | 31.6% |
| $150,000 to $199,999 | 2 | 5.3% |
| $200,000+ | 3 | 7.9% |
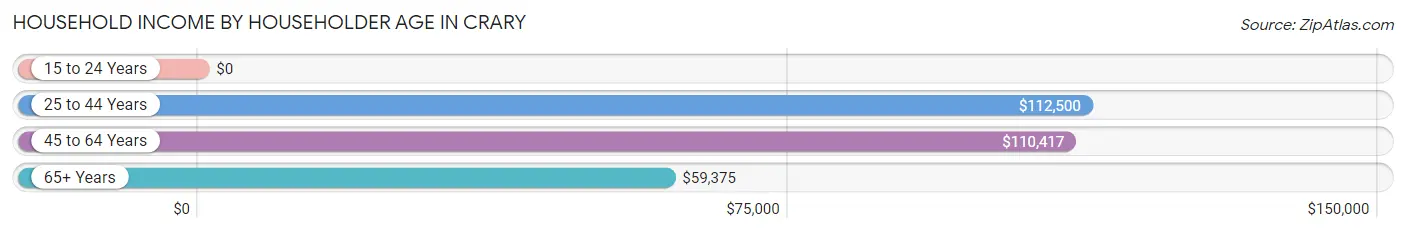
Household Income by Householder Age in Crary
The median household income in Crary is $92,500, with the highest median household income of $112,500 found in the 25 to 44 years age bracket for the primary householder. A total of 12 households (31.6%) fall into this category.
| Income Bracket | # Households | Median Income |
| 15 to 24 Years | 0 (0.0%) | $0 |
| 25 to 44 Years | 12 (31.6%) | $112,500 |
| 45 to 64 Years | 19 (50.0%) | $110,417 |
| 65+ Years | 7 (18.4%) | $59,375 |
| Total | 38 (100.0%) | $92,500 |
Poverty in Crary
Income Below Poverty by Sex and Age in Crary
With 3.3% poverty level for males and 8.5% for females among the residents of Crary, 25 to 34 year old males and 75 year old and over females are the most vulnerable to poverty, with 1 males (33.3%) and 1 females (50.0%) in their respective age groups living below the poverty level.
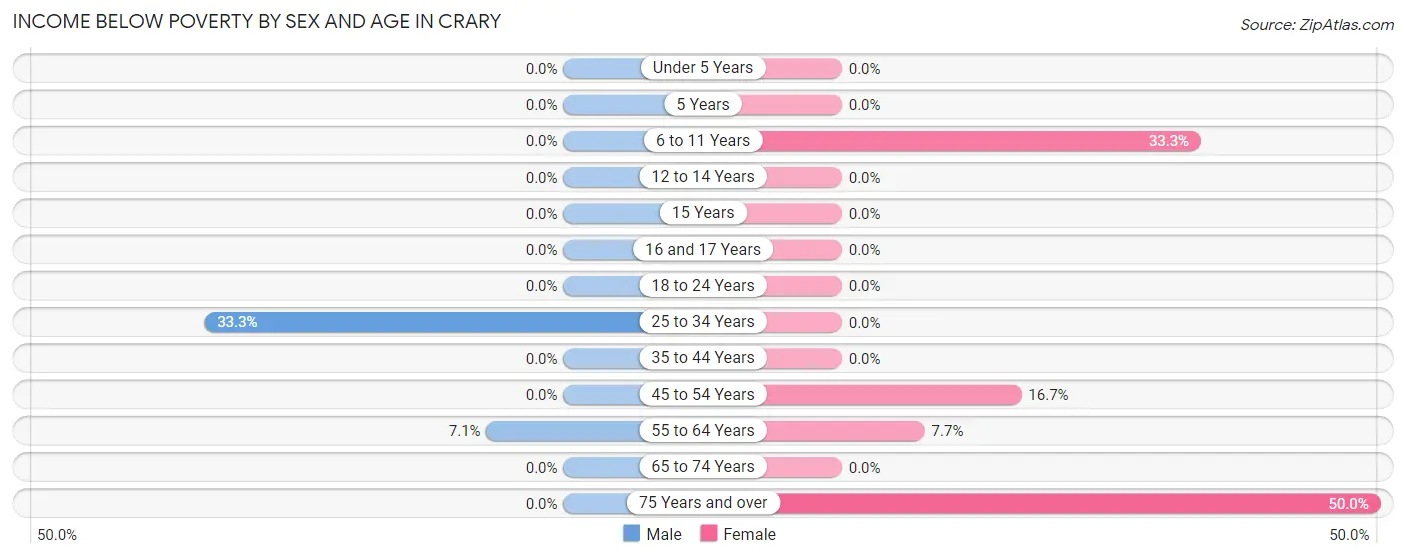
| Age Bracket | Male | Female |
| Under 5 Years | 0 (0.0%) | 0 (0.0%) |
| 5 Years | 0 (0.0%) | 0 (0.0%) |
| 6 to 11 Years | 0 (0.0%) | 1 (33.3%) |
| 12 to 14 Years | 0 (0.0%) | 0 (0.0%) |
| 15 Years | 0 (0.0%) | 0 (0.0%) |
| 16 and 17 Years | 0 (0.0%) | 0 (0.0%) |
| 18 to 24 Years | 0 (0.0%) | 0 (0.0%) |
| 25 to 34 Years | 1 (33.3%) | 0 (0.0%) |
| 35 to 44 Years | 0 (0.0%) | 0 (0.0%) |
| 45 to 54 Years | 0 (0.0%) | 1 (16.7%) |
| 55 to 64 Years | 1 (7.1%) | 1 (7.7%) |
| 65 to 74 Years | 0 (0.0%) | 0 (0.0%) |
| 75 Years and over | 0 (0.0%) | 1 (50.0%) |
| Total | 2 (3.3%) | 4 (8.5%) |
Income Above Poverty by Sex and Age in Crary
According to the poverty statistics in Crary, males aged under 5 years and females aged under 5 years are the age groups that are most secure financially, with 100.0% of males and 100.0% of females in these age groups living above the poverty line.
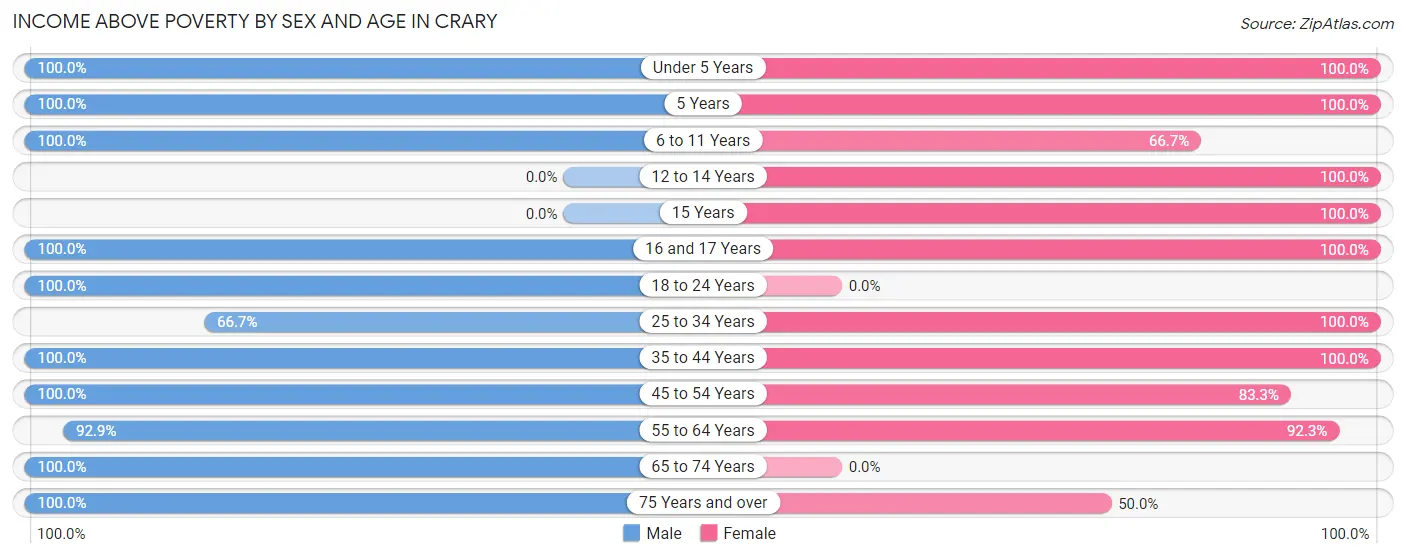
| Age Bracket | Male | Female |
| Under 5 Years | 8 (100.0%) | 2 (100.0%) |
| 5 Years | 1 (100.0%) | 1 (100.0%) |
| 6 to 11 Years | 3 (100.0%) | 2 (66.7%) |
| 12 to 14 Years | 0 (0.0%) | 7 (100.0%) |
| 15 Years | 0 (0.0%) | 2 (100.0%) |
| 16 and 17 Years | 1 (100.0%) | 3 (100.0%) |
| 18 to 24 Years | 14 (100.0%) | 0 (0.0%) |
| 25 to 34 Years | 2 (66.7%) | 4 (100.0%) |
| 35 to 44 Years | 6 (100.0%) | 4 (100.0%) |
| 45 to 54 Years | 5 (100.0%) | 5 (83.3%) |
| 55 to 64 Years | 13 (92.9%) | 12 (92.3%) |
| 65 to 74 Years | 4 (100.0%) | 0 (0.0%) |
| 75 Years and over | 1 (100.0%) | 1 (50.0%) |
| Total | 58 (96.7%) | 43 (91.5%) |
Income Below Poverty Among Married-Couple Families in Crary
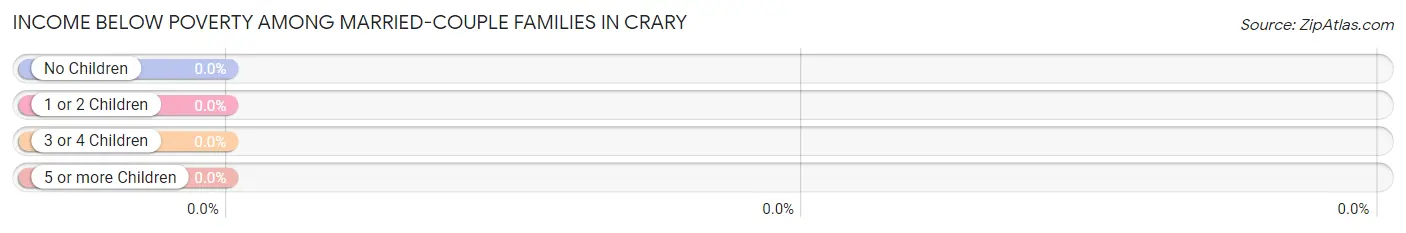
| Children | Above Poverty | Below Poverty |
| No Children | 11 (100.0%) | 0 (0.0%) |
| 1 or 2 Children | 5 (100.0%) | 0 (0.0%) |
| 3 or 4 Children | 6 (100.0%) | 0 (0.0%) |
| 5 or more Children | 0 (0.0%) | 0 (0.0%) |
| Total | 22 (100.0%) | 0 (0.0%) |
Income Below Poverty Among Single-Parent Households in Crary
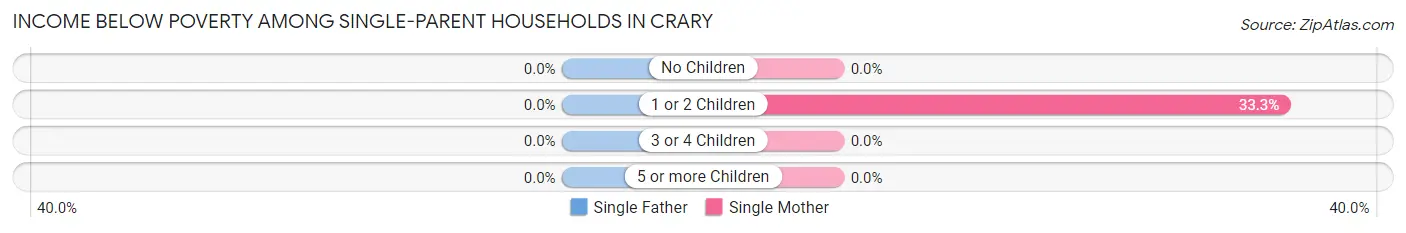
| Children | Single Father | Single Mother |
| No Children | 0 (0.0%) | 0 (0.0%) |
| 1 or 2 Children | 0 (0.0%) | 1 (33.3%) |
| 3 or 4 Children | 0 (0.0%) | 0 (0.0%) |
| 5 or more Children | 0 (0.0%) | 0 (0.0%) |
| Total | 0 (0.0%) | 1 (33.3%) |
Income Below Poverty Among Married-Couple vs Single-Parent Households in Crary
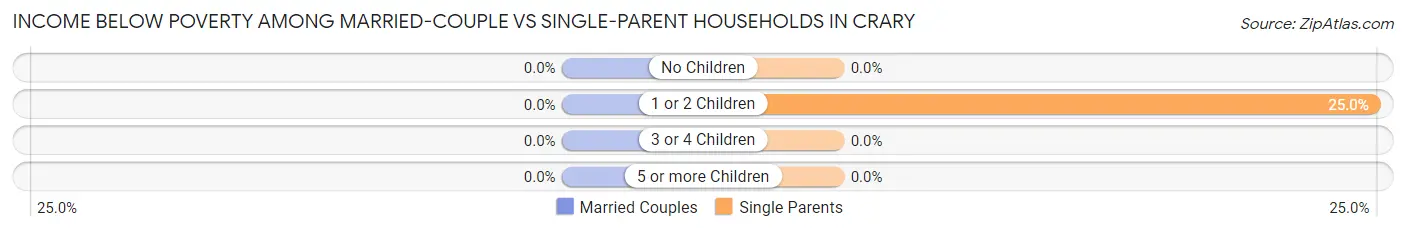
| Children | Married-Couple Families | Single-Parent Households |
| No Children | 0 (0.0%) | 0 (0.0%) |
| 1 or 2 Children | 0 (0.0%) | 1 (25.0%) |
| 3 or 4 Children | 0 (0.0%) | 0 (0.0%) |
| 5 or more Children | 0 (0.0%) | 0 (0.0%) |
| Total | 0 (0.0%) | 1 (20.0%) |
Race in Crary
The most populous races in Crary are White / Caucasian (70 | 65.4%), Two or more Races (25 | 23.4%), and Hispanic or Latino (9 | 8.4%).
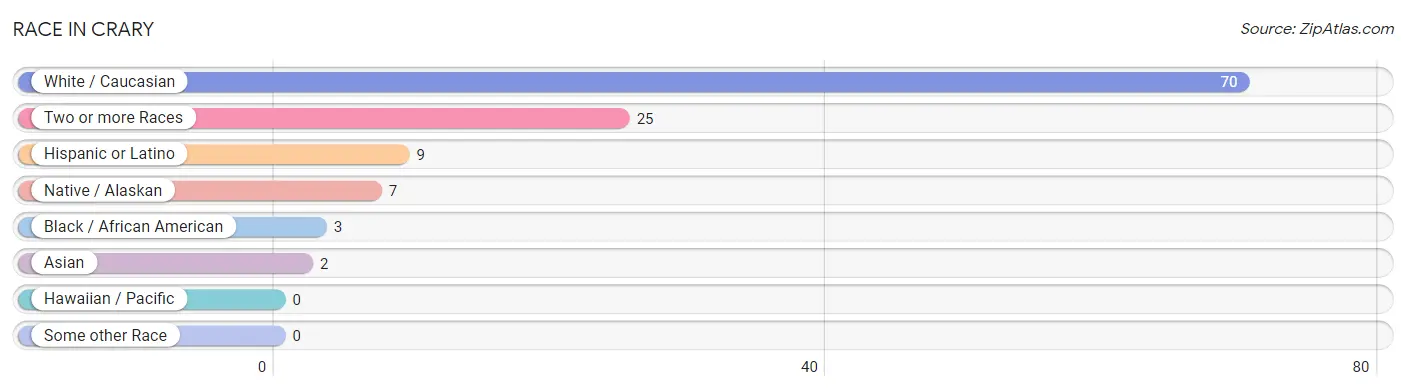
| Race | # Population | % Population |
| Asian | 2 | 1.9% |
| Black / African American | 3 | 2.8% |
| Hawaiian / Pacific | 0 | 0.0% |
| Hispanic or Latino | 9 | 8.4% |
| Native / Alaskan | 7 | 6.5% |
| White / Caucasian | 70 | 65.4% |
| Two or more Races | 25 | 23.4% |
| Some other Race | 0 | 0.0% |
| Total | 107 | 100.0% |
Ancestry in Crary
The most populous ancestries reported in Crary are German (35 | 32.7%), Norwegian (21 | 19.6%), Puerto Rican (9 | 8.4%), Sioux (8 | 7.5%), and Czech (7 | 6.5%), together accounting for 74.8% of all Crary residents.
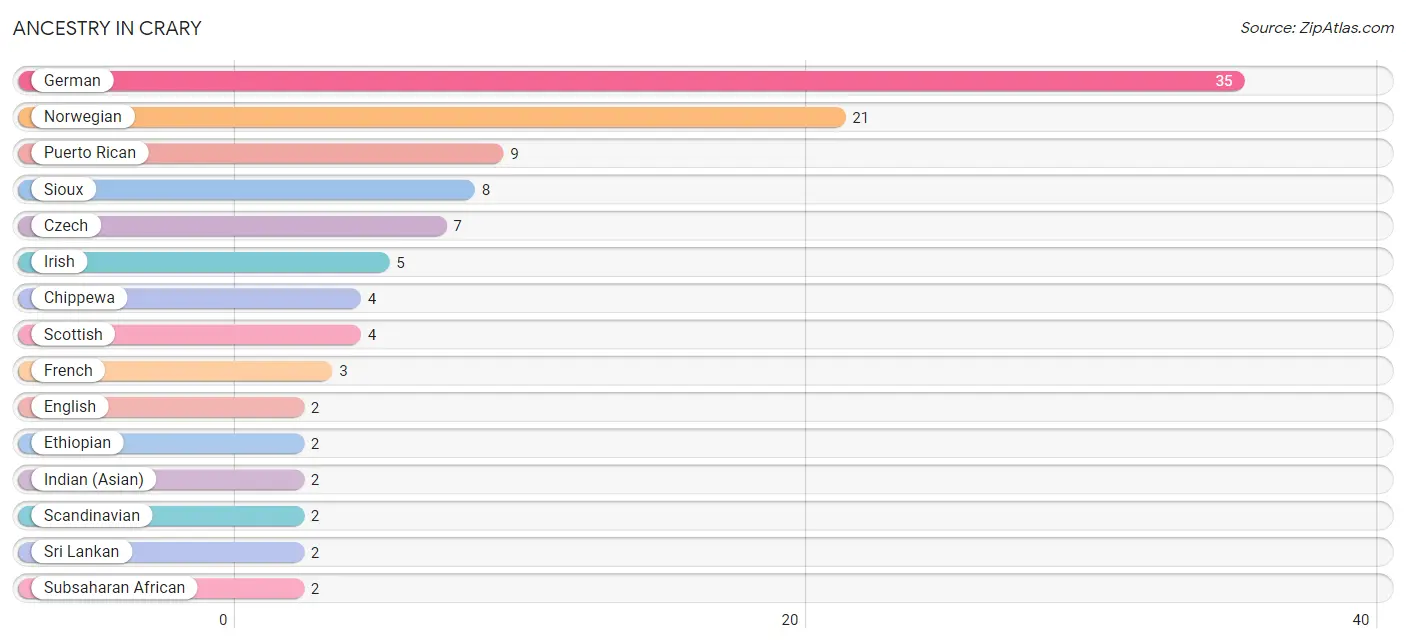
| Ancestry | # Population | % Population |
| American | 1 | 0.9% |
| Austrian | 1 | 0.9% |
| Chippewa | 4 | 3.7% |
| Czech | 7 | 6.5% |
| English | 2 | 1.9% |
| Ethiopian | 2 | 1.9% |
| French | 3 | 2.8% |
| French Canadian | 1 | 0.9% |
| German | 35 | 32.7% |
| Indian (Asian) | 2 | 1.9% |
| Irish | 5 | 4.7% |
| Norwegian | 21 | 19.6% |
| Puerto Rican | 9 | 8.4% |
| Russian | 1 | 0.9% |
| Scandinavian | 2 | 1.9% |
| Scottish | 4 | 3.7% |
| Sioux | 8 | 7.5% |
| Sri Lankan | 2 | 1.9% |
| Subsaharan African | 2 | 1.9% |
| Swedish | 1 | 0.9% |
| Swiss | 2 | 1.9% | View All 21 Rows |
Immigrants in Crary
The most numerous immigrant groups reported in Crary came from Africa (2 | 1.9%), Asia (2 | 1.9%), China (2 | 1.9%), Eastern Africa (2 | 1.9%), and Eastern Asia (2 | 1.9%), together accounting for 9.3% of all Crary residents.
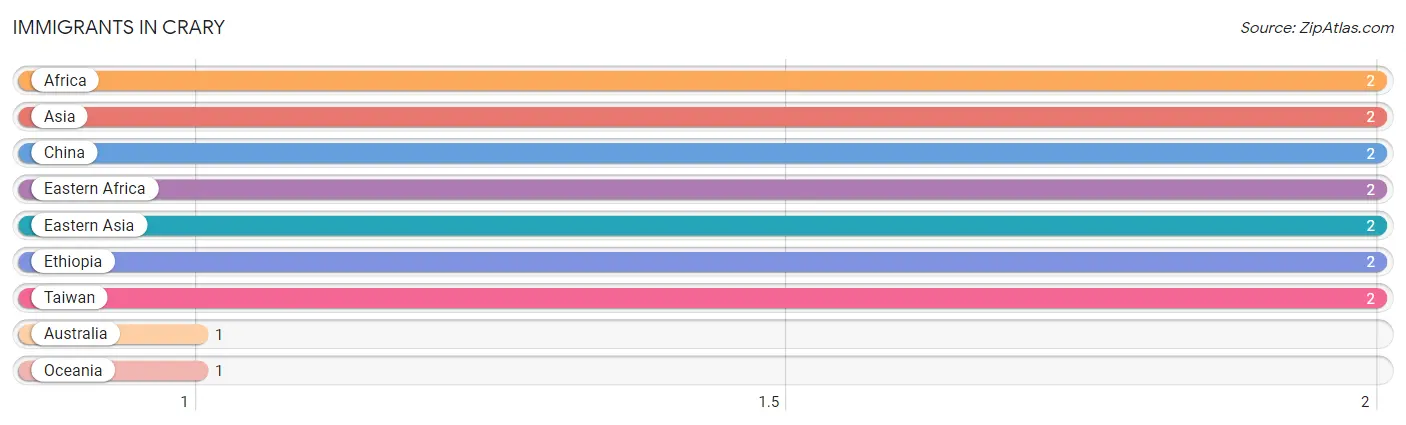
| Immigration Origin | # Population | % Population |
| Africa | 2 | 1.9% |
| Asia | 2 | 1.9% |
| Australia | 1 | 0.9% |
| China | 2 | 1.9% |
| Eastern Africa | 2 | 1.9% |
| Eastern Asia | 2 | 1.9% |
| Ethiopia | 2 | 1.9% |
| Oceania | 1 | 0.9% |
| Taiwan | 2 | 1.9% | View All 9 Rows |
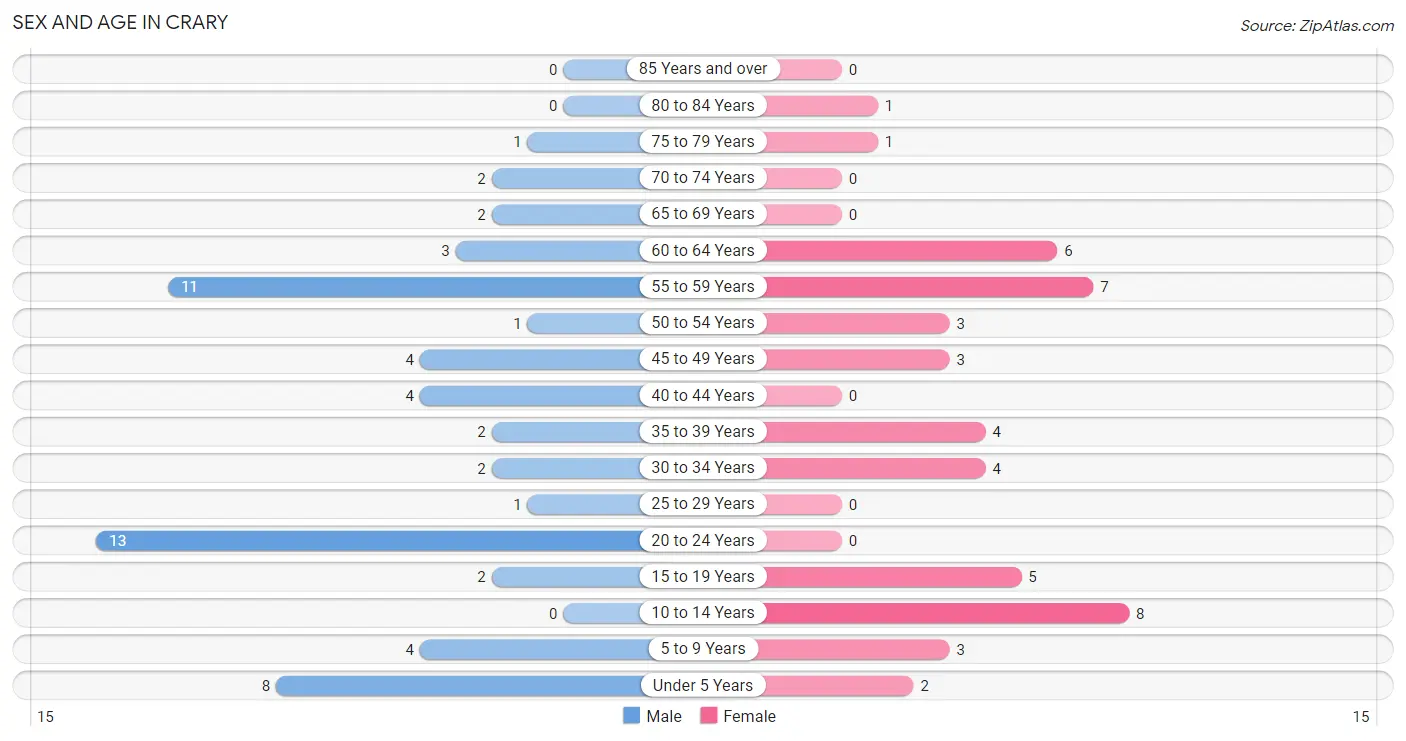
Sex and Age in Crary
Sex and Age in Crary
The most populous age groups in Crary are 20 to 24 Years (13 | 21.7%) for men and 10 to 14 Years (8 | 17.0%) for women.
| Age Bracket | Male | Female |
| Under 5 Years | 8 (13.3%) | 2 (4.3%) |
| 5 to 9 Years | 4 (6.7%) | 3 (6.4%) |
| 10 to 14 Years | 0 (0.0%) | 8 (17.0%) |
| 15 to 19 Years | 2 (3.3%) | 5 (10.6%) |
| 20 to 24 Years | 13 (21.7%) | 0 (0.0%) |
| 25 to 29 Years | 1 (1.7%) | 0 (0.0%) |
| 30 to 34 Years | 2 (3.3%) | 4 (8.5%) |
| 35 to 39 Years | 2 (3.3%) | 4 (8.5%) |
| 40 to 44 Years | 4 (6.7%) | 0 (0.0%) |
| 45 to 49 Years | 4 (6.7%) | 3 (6.4%) |
| 50 to 54 Years | 1 (1.7%) | 3 (6.4%) |
| 55 to 59 Years | 11 (18.3%) | 7 (14.9%) |
| 60 to 64 Years | 3 (5.0%) | 6 (12.8%) |
| 65 to 69 Years | 2 (3.3%) | 0 (0.0%) |
| 70 to 74 Years | 2 (3.3%) | 0 (0.0%) |
| 75 to 79 Years | 1 (1.7%) | 1 (2.1%) |
| 80 to 84 Years | 0 (0.0%) | 1 (2.1%) |
| 85 Years and over | 0 (0.0%) | 0 (0.0%) |
| Total | 60 (100.0%) | 47 (100.0%) |
Families and Households in Crary
Median Family Size in Crary
The median family size in Crary is 3.37 persons per family, with single female/mother families (3 | 11.1%) accounting for the largest median family size of 3.67 persons per family. On the other hand, single male/father families (2 | 7.4%) represent the smallest median family size with 2.00 persons per family.
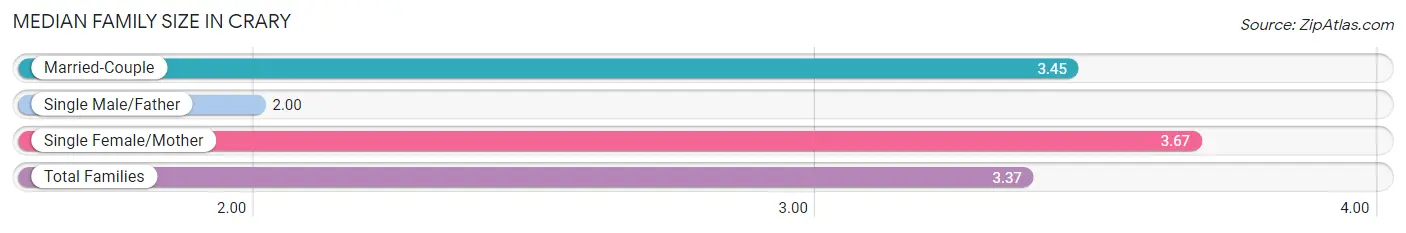
| Family Type | # Families | Family Size |
| Married-Couple | 22 (81.5%) | 3.45 |
| Single Male/Father | 2 (7.4%) | 2.00 |
| Single Female/Mother | 3 (11.1%) | 3.67 |
| Total Families | 27 (100.0%) | 3.37 |
Median Household Size in Crary
The median household size in Crary is 2.82 persons per household, with single female/mother households (3 | 7.9%) accounting for the largest median household size of 3.67 persons per household. non-family households (11 | 28.9%) represent the smallest median household size with 1.45 persons per household.
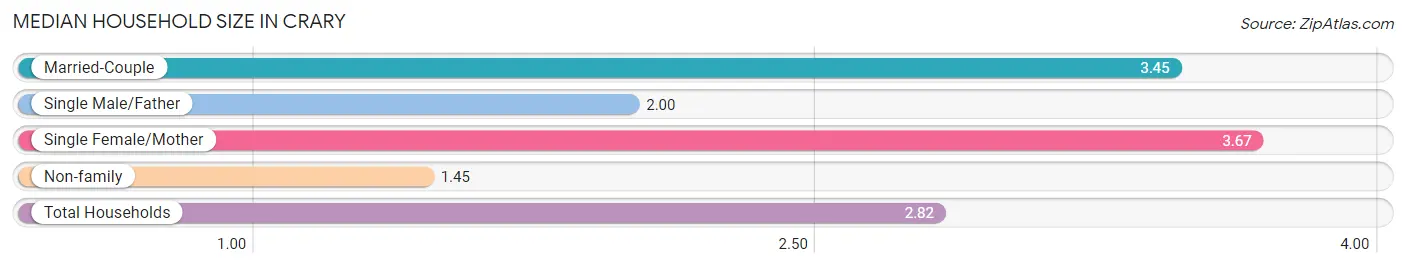
| Household Type | # Households | Household Size |
| Married-Couple | 22 (57.9%) | 3.45 |
| Single Male/Father | 2 (5.3%) | 2.00 |
| Single Female/Mother | 3 (7.9%) | 3.67 |
| Non-family | 11 (28.9%) | 1.45 |
| Total Households | 38 (100.0%) | 2.82 |
Household Size by Marriage Status in Crary
Out of a total of 38 households in Crary, 27 (71.1%) are family households, while 11 (28.9%) are nonfamily households. The most numerous type of family households are 2-person households, comprising 14, and the most common type of nonfamily households are 2-person households, comprising 6.
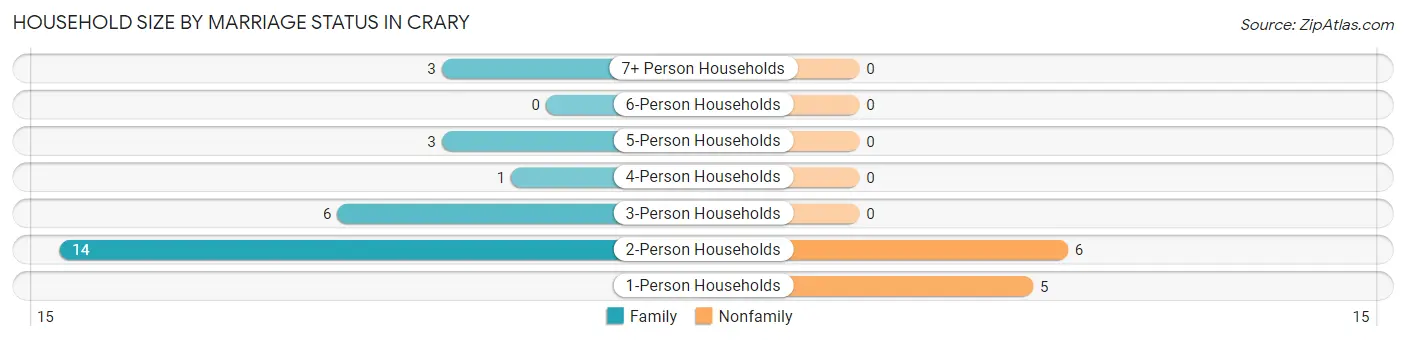
| Household Size | Family Households | Nonfamily Households |
| 1-Person Households | - | 5 (13.2%) |
| 2-Person Households | 14 (36.8%) | 6 (15.8%) |
| 3-Person Households | 6 (15.8%) | 0 (0.0%) |
| 4-Person Households | 1 (2.6%) | 0 (0.0%) |
| 5-Person Households | 3 (7.9%) | 0 (0.0%) |
| 6-Person Households | 0 (0.0%) | 0 (0.0%) |
| 7+ Person Households | 3 (7.9%) | 0 (0.0%) |
| Total | 27 (71.1%) | 11 (28.9%) |
Female Fertility in Crary
Fertility by Age in Crary
Average fertility rate in Crary is 222.0 births per 1,000 women. Women in the age bracket of 20 to 34 years have the highest fertility rate with 1,000.0 births per 1,000 women. Women in the age bracket of 20 to 34 years acount for 100.0% of all women with births.
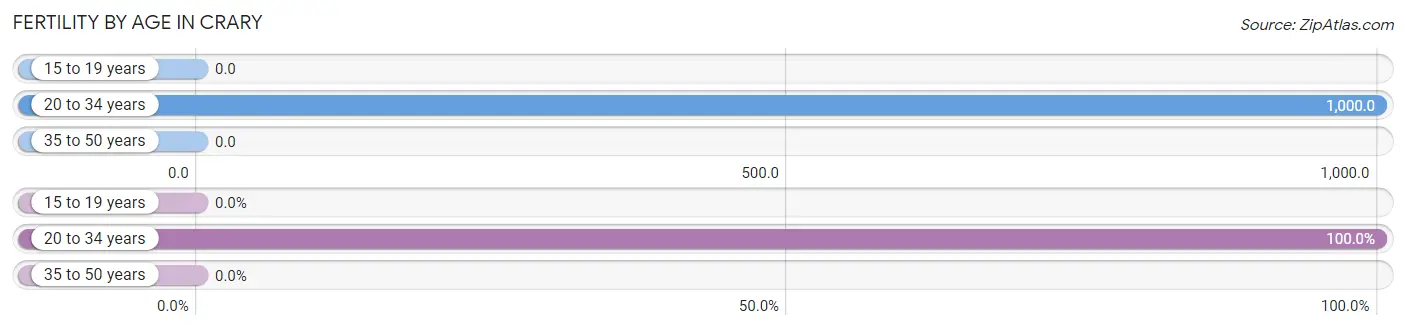
| Age Bracket | Women with Births | Births / 1,000 Women |
| 15 to 19 years | 0 (0.0%) | 0.0 |
| 20 to 34 years | 4 (100.0%) | 1,000.0 |
| 35 to 50 years | 0 (0.0%) | 0.0 |
| Total | 4 (100.0%) | 222.0 |
Fertility by Age by Marriage Status in Crary
75.0% of women with births (4) in Crary are married. The highest percentage of unmarried women with births falls into 20 to 34 years age bracket with 25.0% of them unmarried at the time of birth, while the lowest percentage of unmarried women with births belong to 20 to 34 years age bracket with 25.0% of them unmarried.
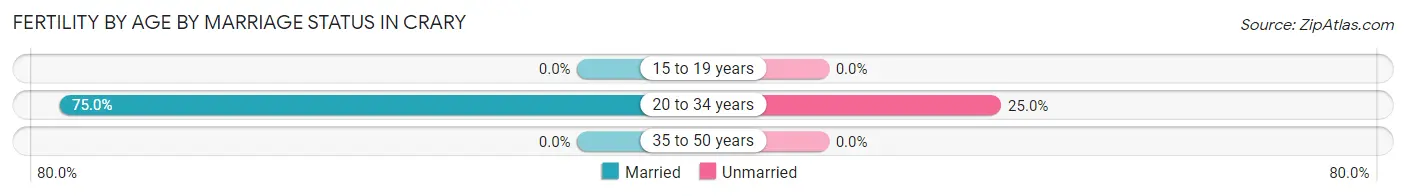
| Age Bracket | Married | Unmarried |
| 15 to 19 years | 0 (0.0%) | 0 (0.0%) |
| 20 to 34 years | 3 (75.0%) | 1 (25.0%) |
| 35 to 50 years | 0 (0.0%) | 0 (0.0%) |
| Total | 3 (75.0%) | 1 (25.0%) |
Fertility by Education in Crary
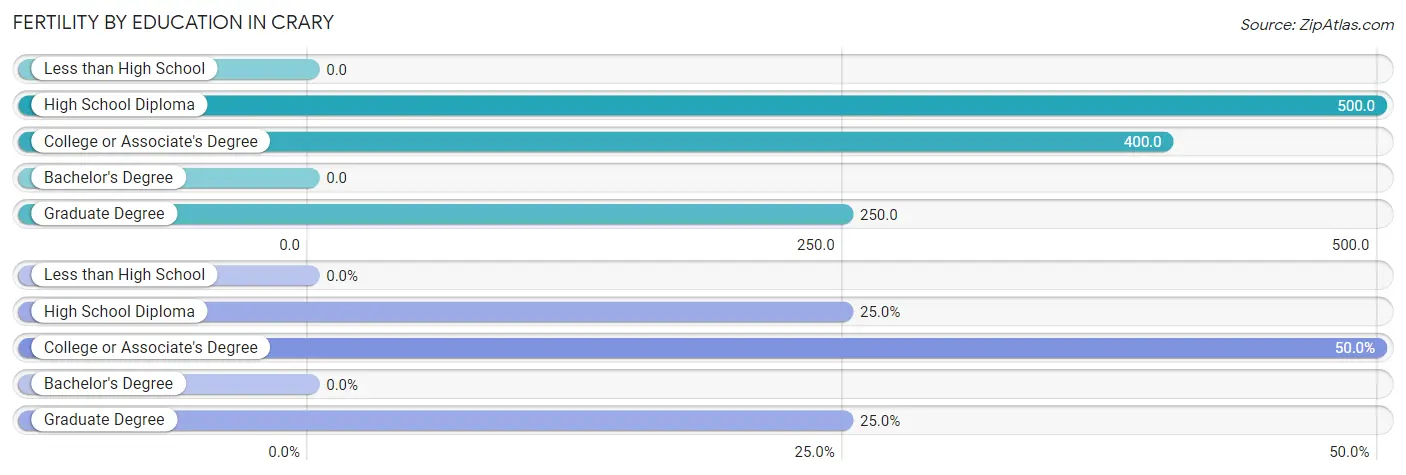
| Educational Attainment | Women with Births | Births / 1,000 Women |
| Less than High School | 0 (0.0%) | 0.0 |
| High School Diploma | 1 (25.0%) | 500.0 |
| College or Associate's Degree | 2 (50.0%) | 400.0 |
| Bachelor's Degree | 0 (0.0%) | 0.0 |
| Graduate Degree | 1 (25.0%) | 250.0 |
| Total | 4 (100.0%) | 222.0 |
Fertility by Education by Marriage Status in Crary
25.0% of women with births in Crary are unmarried. Women with the educational attainment of college or associate's degree are most likely to be married with 100.0% of them married at childbirth, while women with the educational attainment of high school diploma are least likely to be married with 100.0% of them unmarried at childbirth.
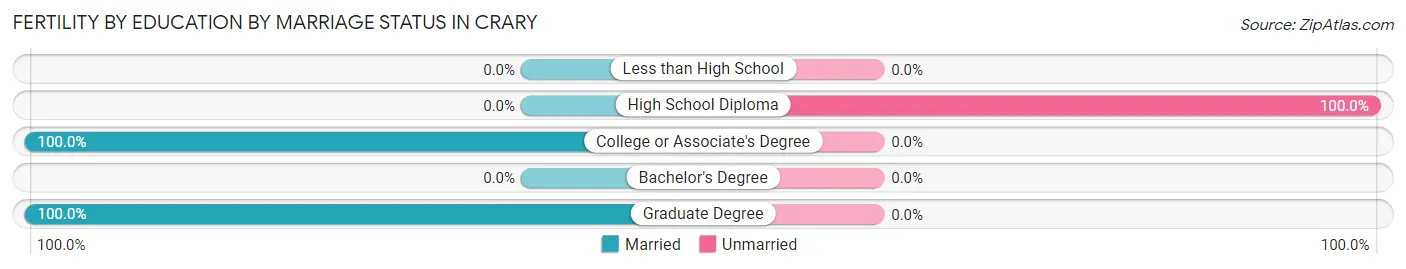
| Educational Attainment | Married | Unmarried |
| Less than High School | 0 (0.0%) | 0 (0.0%) |
| High School Diploma | 0 (0.0%) | 1 (100.0%) |
| College or Associate's Degree | 2 (100.0%) | 0 (0.0%) |
| Bachelor's Degree | 0 (0.0%) | 0 (0.0%) |
| Graduate Degree | 1 (100.0%) | 0 (0.0%) |
| Total | 3 (75.0%) | 1 (25.0%) |
Employment Characteristics in Crary
Employment by Class of Employer in Crary
Among the 64 employed individuals in Crary, private company employees (29 | 45.3%), not-for-profit organizations (13 | 20.3%), and federal government employees (10 | 15.6%) make up the most common classes of employment.
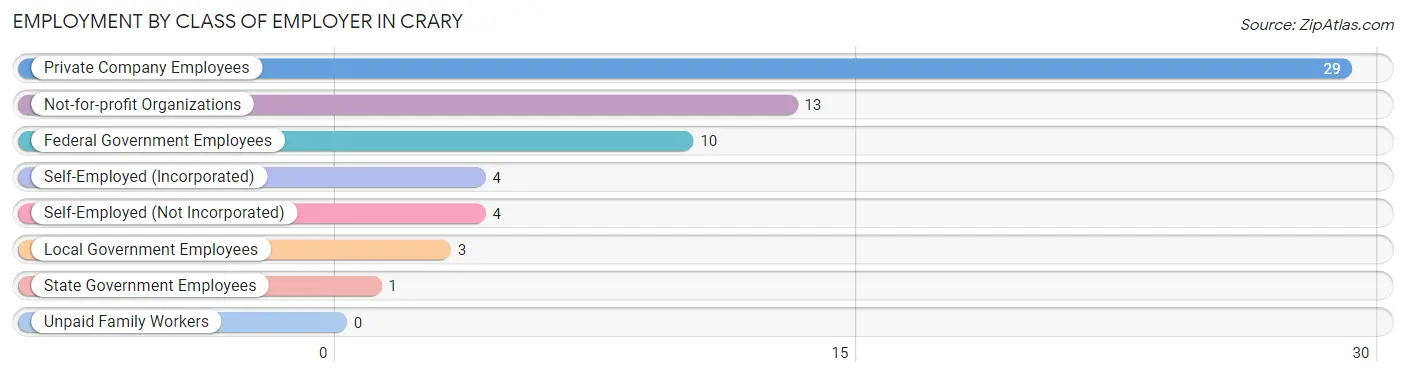
| Employer Class | # Employees | % Employees |
| Private Company Employees | 29 | 45.3% |
| Self-Employed (Incorporated) | 4 | 6.2% |
| Self-Employed (Not Incorporated) | 4 | 6.2% |
| Not-for-profit Organizations | 13 | 20.3% |
| Local Government Employees | 3 | 4.7% |
| State Government Employees | 1 | 1.6% |
| Federal Government Employees | 10 | 15.6% |
| Unpaid Family Workers | 0 | 0.0% |
| Total | 64 | 100.0% |
Employment Status by Age in Crary
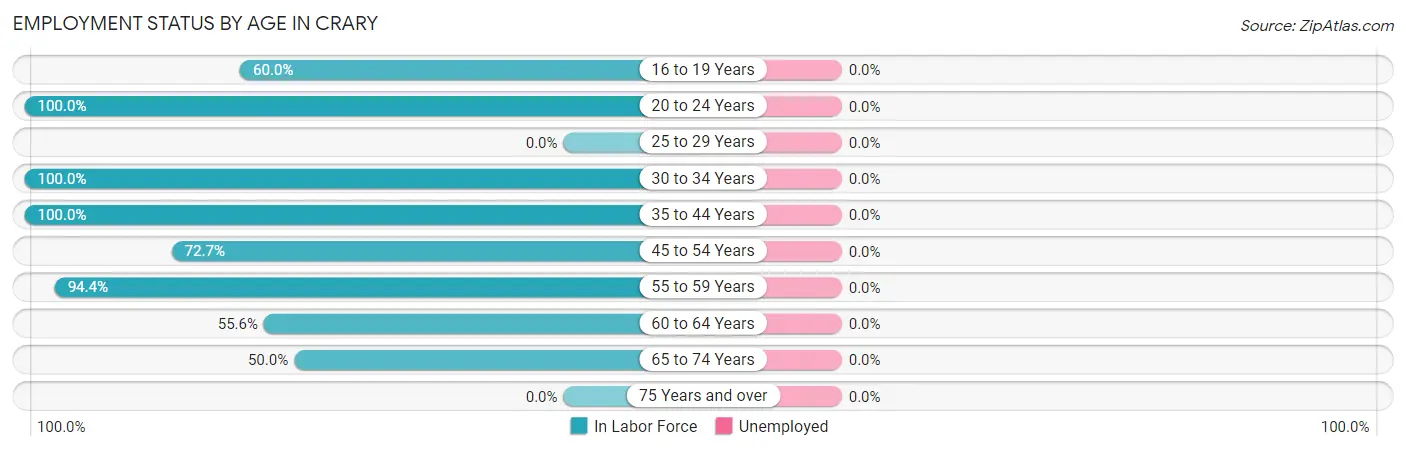
| Age Bracket | In Labor Force | Unemployed |
| 16 to 19 Years | 3 (60.0%) | 0 (0.0%) |
| 20 to 24 Years | 13 (100.0%) | 0 (0.0%) |
| 25 to 29 Years | 0 (0.0%) | 0 (0.0%) |
| 30 to 34 Years | 6 (100.0%) | 0 (0.0%) |
| 35 to 44 Years | 10 (100.0%) | 0 (0.0%) |
| 45 to 54 Years | 8 (72.7%) | 0 (0.0%) |
| 55 to 59 Years | 17 (94.4%) | 0 (0.0%) |
| 60 to 64 Years | 5 (55.6%) | 0 (0.0%) |
| 65 to 74 Years | 2 (50.0%) | 0 (0.0%) |
| 75 Years and over | 0 (0.0%) | 0 (0.0%) |
| Total | 64 (80.0%) | 0 (0.0%) |
Employment Status by Educational Attainment in Crary
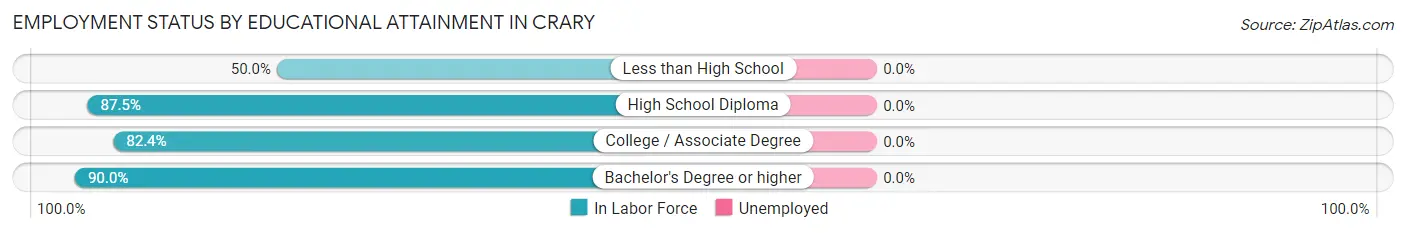
| Educational Attainment | In Labor Force | Unemployed |
| Less than High School | 2 (50.0%) | 0 (0.0%) |
| High School Diploma | 21 (87.5%) | 0 (0.0%) |
| College / Associate Degree | 14 (82.4%) | 0 (0.0%) |
| Bachelor's Degree or higher | 9 (90.0%) | 0 (0.0%) |
| Total | 46 (83.6%) | 0 (0.0%) |
Employment Occupations by Sex in Crary
Management, Business, Science and Arts Occupations
The most common Management, Business, Science and Arts occupations in Crary are Community & Social Service (7 | 12.7%), Education Instruction & Library (4 | 7.3%), Management (3 | 5.4%), Business & Financial (3 | 5.4%), and Computers, Engineering & Science (3 | 5.4%).
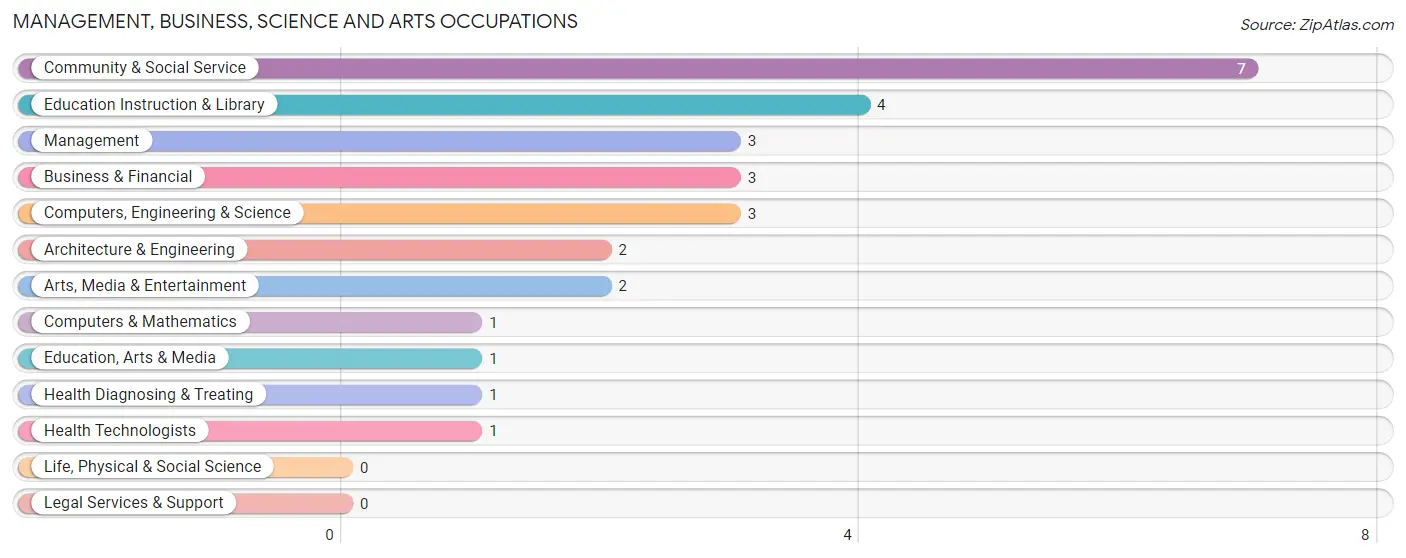
Management, Business, Science and Arts Occupations by Sex
Within the Management, Business, Science and Arts occupations in Crary, the most male-oriented occupations are Management (100.0%), Architecture & Engineering (100.0%), and Computers, Engineering & Science (66.7%), while the most female-oriented occupations are Business & Financial (100.0%), Computers & Mathematics (100.0%), and Education, Arts & Media (100.0%).
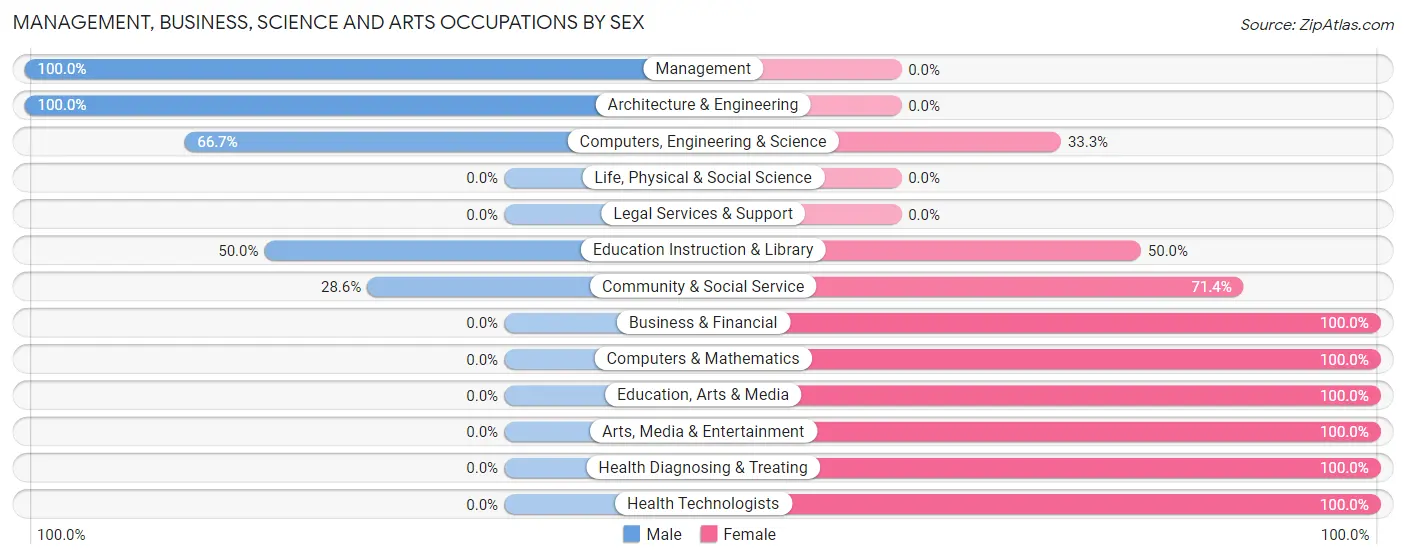
| Occupation | Male | Female |
| Management | 3 (100.0%) | 0 (0.0%) |
| Business & Financial | 0 (0.0%) | 3 (100.0%) |
| Computers, Engineering & Science | 2 (66.7%) | 1 (33.3%) |
| Computers & Mathematics | 0 (0.0%) | 1 (100.0%) |
| Architecture & Engineering | 2 (100.0%) | 0 (0.0%) |
| Life, Physical & Social Science | 0 (0.0%) | 0 (0.0%) |
| Community & Social Service | 2 (28.6%) | 5 (71.4%) |
| Education, Arts & Media | 0 (0.0%) | 1 (100.0%) |
| Legal Services & Support | 0 (0.0%) | 0 (0.0%) |
| Education Instruction & Library | 2 (50.0%) | 2 (50.0%) |
| Arts, Media & Entertainment | 0 (0.0%) | 2 (100.0%) |
| Health Diagnosing & Treating | 0 (0.0%) | 1 (100.0%) |
| Health Technologists | 0 (0.0%) | 1 (100.0%) |
| Total (Category) | 7 (41.2%) | 10 (58.8%) |
| Total (Overall) | 31 (56.4%) | 24 (43.6%) |
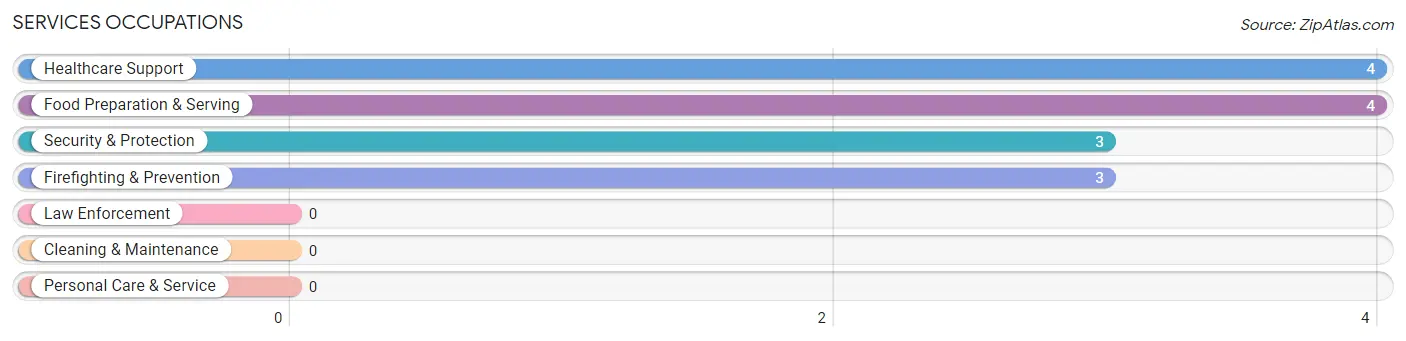
Services Occupations
The most common Services occupations in Crary are Healthcare Support (4 | 7.3%), Food Preparation & Serving (4 | 7.3%), Security & Protection (3 | 5.4%), and Firefighting & Prevention (3 | 5.4%).
Services Occupations by Sex
Within the Services occupations in Crary, the most male-oriented occupations are Security & Protection (100.0%), Firefighting & Prevention (100.0%), and Food Preparation & Serving (75.0%), while the most female-oriented occupations are Healthcare Support (100.0%), and Food Preparation & Serving (25.0%).
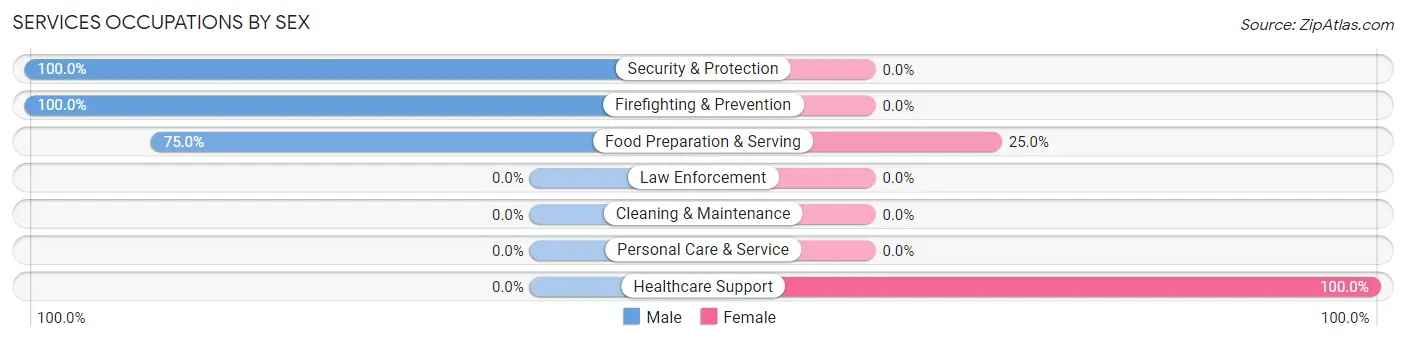
| Occupation | Male | Female |
| Healthcare Support | 0 (0.0%) | 4 (100.0%) |
| Security & Protection | 3 (100.0%) | 0 (0.0%) |
| Firefighting & Prevention | 3 (100.0%) | 0 (0.0%) |
| Law Enforcement | 0 (0.0%) | 0 (0.0%) |
| Food Preparation & Serving | 3 (75.0%) | 1 (25.0%) |
| Cleaning & Maintenance | 0 (0.0%) | 0 (0.0%) |
| Personal Care & Service | 0 (0.0%) | 0 (0.0%) |
| Total (Category) | 6 (54.5%) | 5 (45.5%) |
| Total (Overall) | 31 (56.4%) | 24 (43.6%) |
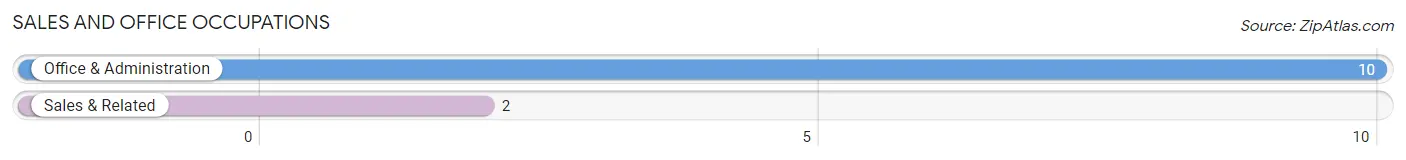
Sales and Office Occupations
The most common Sales and Office occupations in Crary are Office & Administration (10 | 18.2%), and Sales & Related (2 | 3.6%).
Sales and Office Occupations by Sex
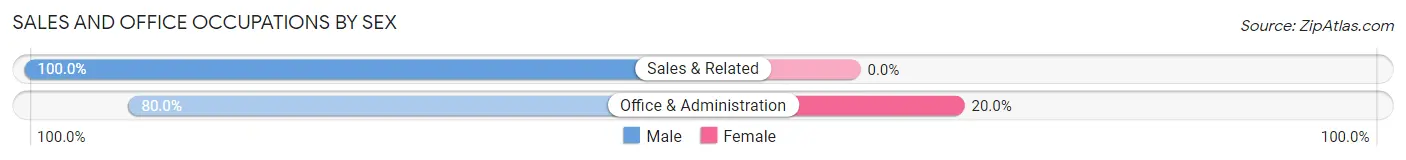
| Occupation | Male | Female |
| Sales & Related | 2 (100.0%) | 0 (0.0%) |
| Office & Administration | 8 (80.0%) | 2 (20.0%) |
| Total (Category) | 10 (83.3%) | 2 (16.7%) |
| Total (Overall) | 31 (56.4%) | 24 (43.6%) |
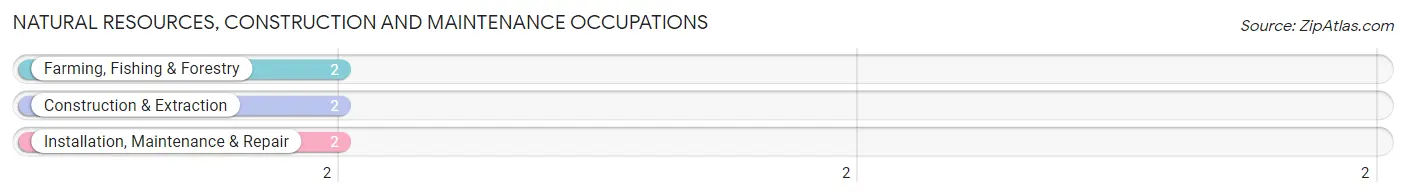
Natural Resources, Construction and Maintenance Occupations
The most common Natural Resources, Construction and Maintenance occupations in Crary are Farming, Fishing & Forestry (2 | 3.6%), Construction & Extraction (2 | 3.6%), and Installation, Maintenance & Repair (2 | 3.6%).
Natural Resources, Construction and Maintenance Occupations by Sex
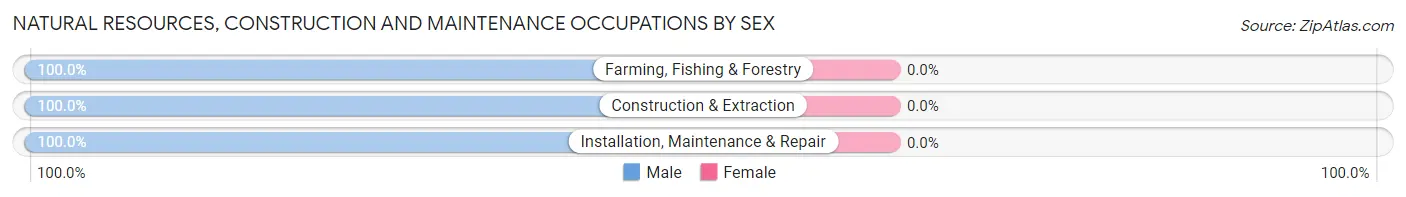
| Occupation | Male | Female |
| Farming, Fishing & Forestry | 2 (100.0%) | 0 (0.0%) |
| Construction & Extraction | 2 (100.0%) | 0 (0.0%) |
| Installation, Maintenance & Repair | 2 (100.0%) | 0 (0.0%) |
| Total (Category) | 6 (100.0%) | 0 (0.0%) |
| Total (Overall) | 31 (56.4%) | 24 (43.6%) |
Production, Transportation and Moving Occupations
The most common Production, Transportation and Moving occupations in Crary are , and Material Moving (9 | 16.4%).
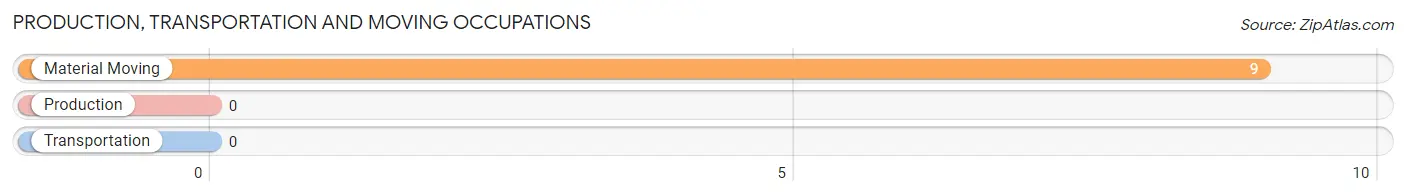
Production, Transportation and Moving Occupations by Sex
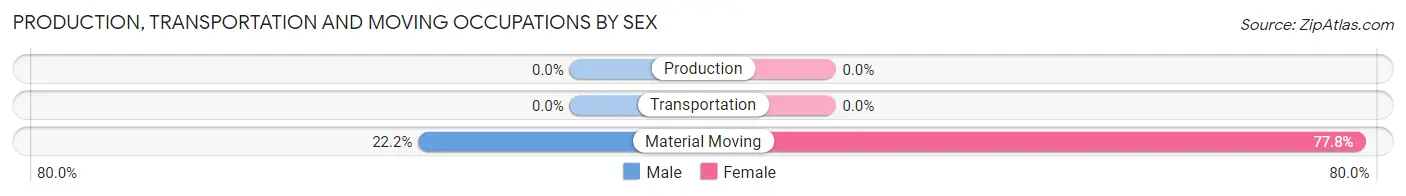
| Occupation | Male | Female |
| Production | 0 (0.0%) | 0 (0.0%) |
| Transportation | 0 (0.0%) | 0 (0.0%) |
| Material Moving | 2 (22.2%) | 7 (77.8%) |
| Total (Category) | 2 (22.2%) | 7 (77.8%) |
| Total (Overall) | 31 (56.4%) | 24 (43.6%) |
Employment Industries by Sex in Crary
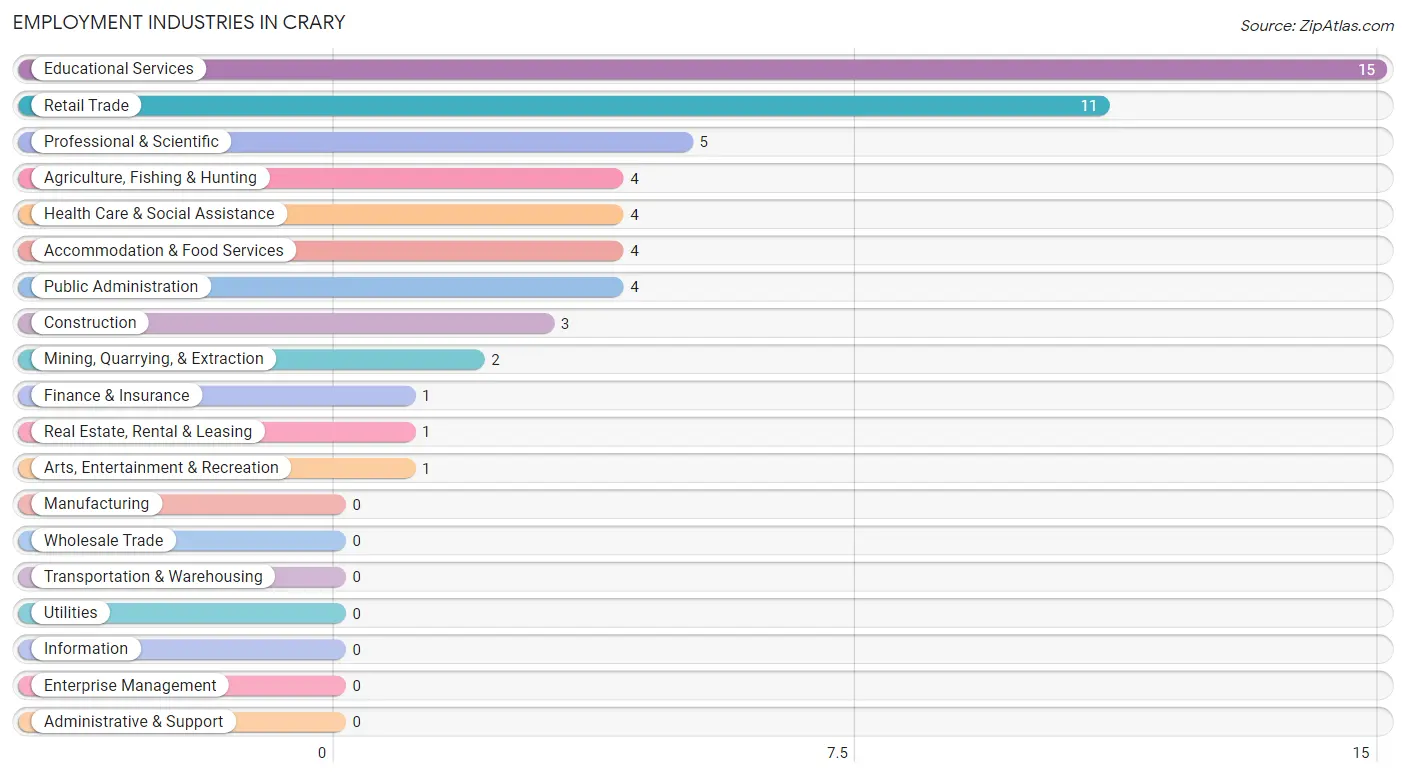
Employment Industries in Crary
The major employment industries in Crary include Educational Services (15 | 27.3%), Retail Trade (11 | 20.0%), Professional & Scientific (5 | 9.1%), Agriculture, Fishing & Hunting (4 | 7.3%), and Health Care & Social Assistance (4 | 7.3%).
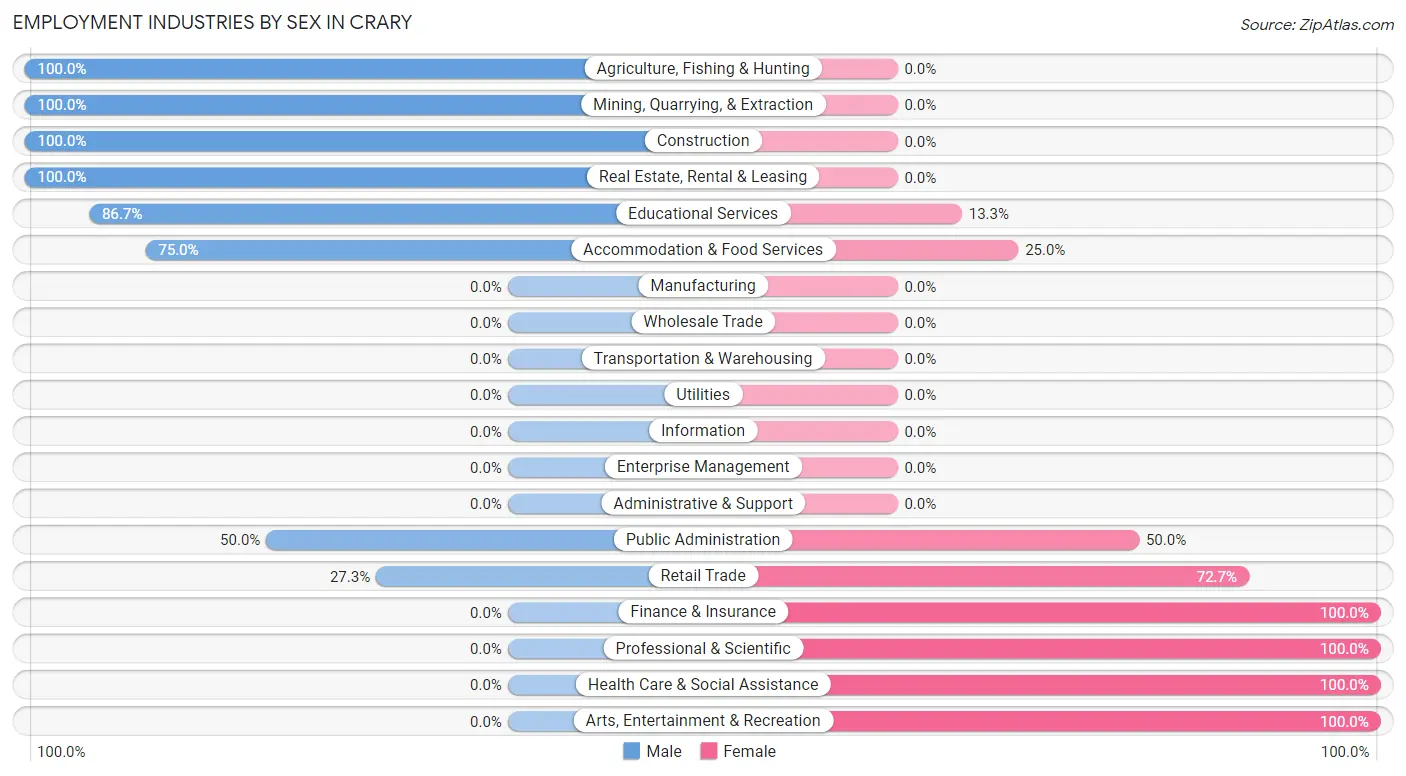
Employment Industries by Sex in Crary
The Crary industries that see more men than women are Agriculture, Fishing & Hunting (100.0%), Mining, Quarrying, & Extraction (100.0%), and Construction (100.0%), whereas the industries that tend to have a higher number of women are Finance & Insurance (100.0%), Professional & Scientific (100.0%), and Health Care & Social Assistance (100.0%).
| Industry | Male | Female |
| Agriculture, Fishing & Hunting | 4 (100.0%) | 0 (0.0%) |
| Mining, Quarrying, & Extraction | 2 (100.0%) | 0 (0.0%) |
| Construction | 3 (100.0%) | 0 (0.0%) |
| Manufacturing | 0 (0.0%) | 0 (0.0%) |
| Wholesale Trade | 0 (0.0%) | 0 (0.0%) |
| Retail Trade | 3 (27.3%) | 8 (72.7%) |
| Transportation & Warehousing | 0 (0.0%) | 0 (0.0%) |
| Utilities | 0 (0.0%) | 0 (0.0%) |
| Information | 0 (0.0%) | 0 (0.0%) |
| Finance & Insurance | 0 (0.0%) | 1 (100.0%) |
| Real Estate, Rental & Leasing | 1 (100.0%) | 0 (0.0%) |
| Professional & Scientific | 0 (0.0%) | 5 (100.0%) |
| Enterprise Management | 0 (0.0%) | 0 (0.0%) |
| Administrative & Support | 0 (0.0%) | 0 (0.0%) |
| Educational Services | 13 (86.7%) | 2 (13.3%) |
| Health Care & Social Assistance | 0 (0.0%) | 4 (100.0%) |
| Arts, Entertainment & Recreation | 0 (0.0%) | 1 (100.0%) |
| Accommodation & Food Services | 3 (75.0%) | 1 (25.0%) |
| Public Administration | 2 (50.0%) | 2 (50.0%) |
| Total | 31 (56.4%) | 24 (43.6%) |
Education in Crary
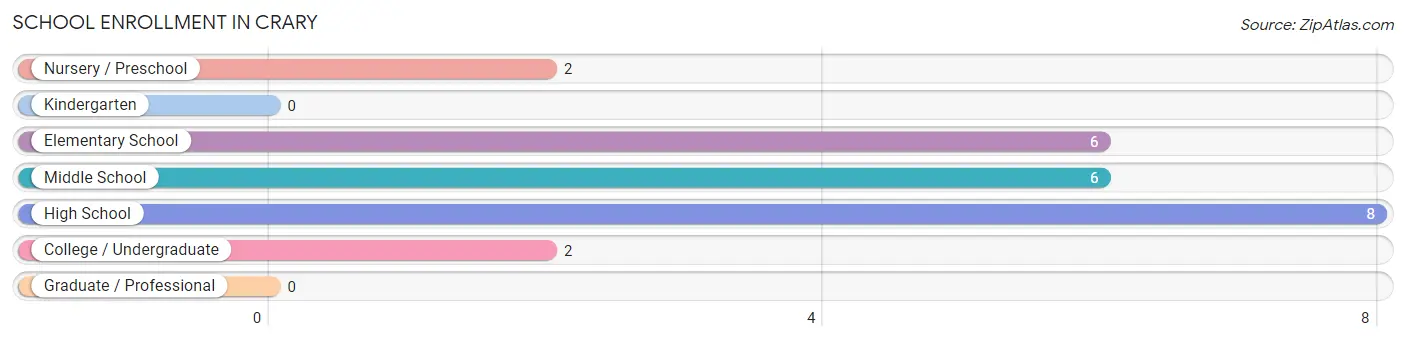
School Enrollment in Crary
The most common levels of schooling among the 24 students in Crary are high school (8 | 33.3%), elementary school (6 | 25.0%), and middle school (6 | 25.0%).
| School Level | # Students | % Students |
| Nursery / Preschool | 2 | 8.3% |
| Kindergarten | 0 | 0.0% |
| Elementary School | 6 | 25.0% |
| Middle School | 6 | 25.0% |
| High School | 8 | 33.3% |
| College / Undergraduate | 2 | 8.3% |
| Graduate / Professional | 0 | 0.0% |
| Total | 24 | 100.0% |
School Enrollment by Age by Funding Source in Crary
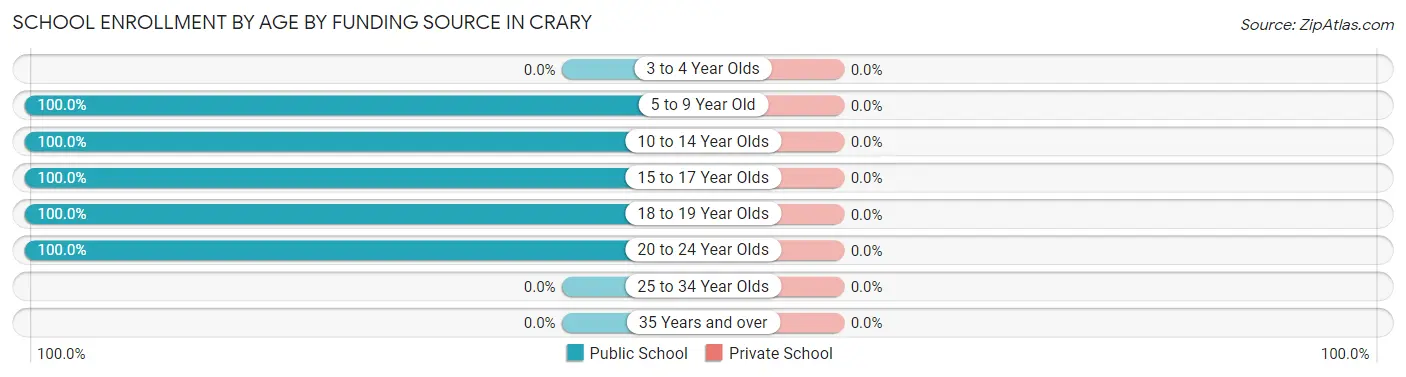
| Age Bracket | Public School | Private School |
| 3 to 4 Year Olds | 0 (0.0%) | 0 (0.0%) |
| 5 to 9 Year Old | 7 (100.0%) | 0 (0.0%) |
| 10 to 14 Year Olds | 8 (100.0%) | 0 (0.0%) |
| 15 to 17 Year Olds | 6 (100.0%) | 0 (0.0%) |
| 18 to 19 Year Olds | 1 (100.0%) | 0 (0.0%) |
| 20 to 24 Year Olds | 2 (100.0%) | 0 (0.0%) |
| 25 to 34 Year Olds | 0 (0.0%) | 0 (0.0%) |
| 35 Years and over | 0 (0.0%) | 0 (0.0%) |
| Total | 24 (100.0%) | 0 (0.0%) |
Educational Attainment by Field of Study in Crary
Business (4 | 33.3%), education (4 | 33.3%), liberal arts & history (2 | 16.7%), engineering (1 | 8.3%), and science & technology (1 | 8.3%) are the most common fields of study among 12 individuals in Crary who have obtained a bachelor's degree or higher.
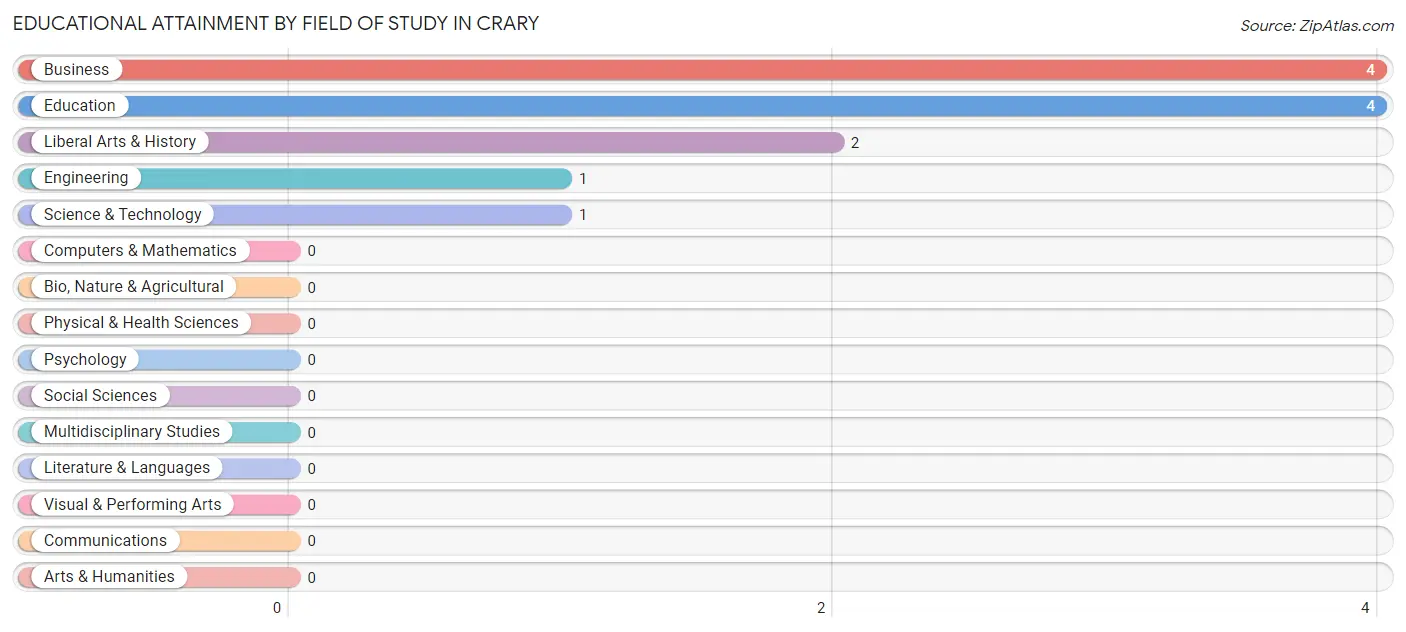
| Field of Study | # Graduates | % Graduates |
| Computers & Mathematics | 0 | 0.0% |
| Bio, Nature & Agricultural | 0 | 0.0% |
| Physical & Health Sciences | 0 | 0.0% |
| Psychology | 0 | 0.0% |
| Social Sciences | 0 | 0.0% |
| Engineering | 1 | 8.3% |
| Multidisciplinary Studies | 0 | 0.0% |
| Science & Technology | 1 | 8.3% |
| Business | 4 | 33.3% |
| Education | 4 | 33.3% |
| Literature & Languages | 0 | 0.0% |
| Liberal Arts & History | 2 | 16.7% |
| Visual & Performing Arts | 0 | 0.0% |
| Communications | 0 | 0.0% |
| Arts & Humanities | 0 | 0.0% |
| Total | 12 | 100.0% |
Transportation & Commute in Crary
Vehicle Availability by Sex in Crary
The most prevalent vehicle ownership categories in Crary are males with 3 vehicles (15, accounting for 37.5%) and females with 3 vehicles (11, making up 62.5%).
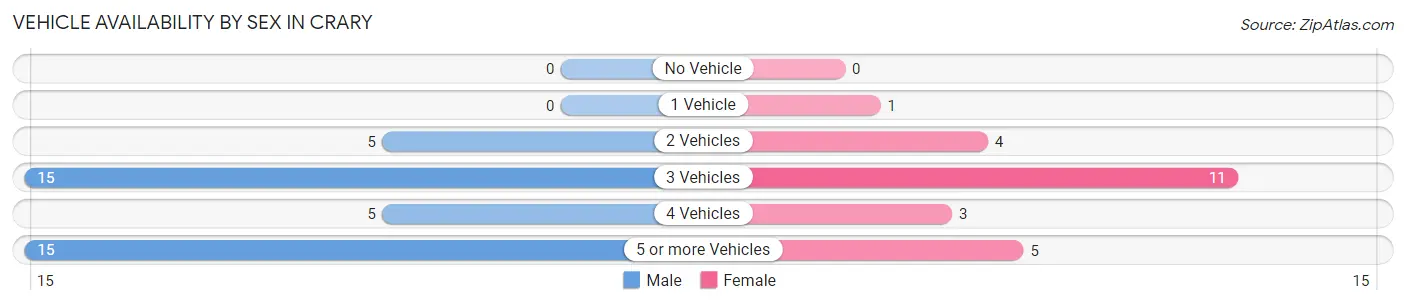
| Vehicles Available | Male | Female |
| No Vehicle | 0 (0.0%) | 0 (0.0%) |
| 1 Vehicle | 0 (0.0%) | 1 (4.2%) |
| 2 Vehicles | 5 (12.5%) | 4 (16.7%) |
| 3 Vehicles | 15 (37.5%) | 11 (45.8%) |
| 4 Vehicles | 5 (12.5%) | 3 (12.5%) |
| 5 or more Vehicles | 15 (37.5%) | 5 (20.8%) |
| Total | 40 (100.0%) | 24 (100.0%) |
Commute Time in Crary
The most frequently occuring commute durations in Crary are 15 to 19 minutes (20 commuters, 31.2%), 25 to 29 minutes (13 commuters, 20.3%), and 10 to 14 minutes (8 commuters, 12.5%).
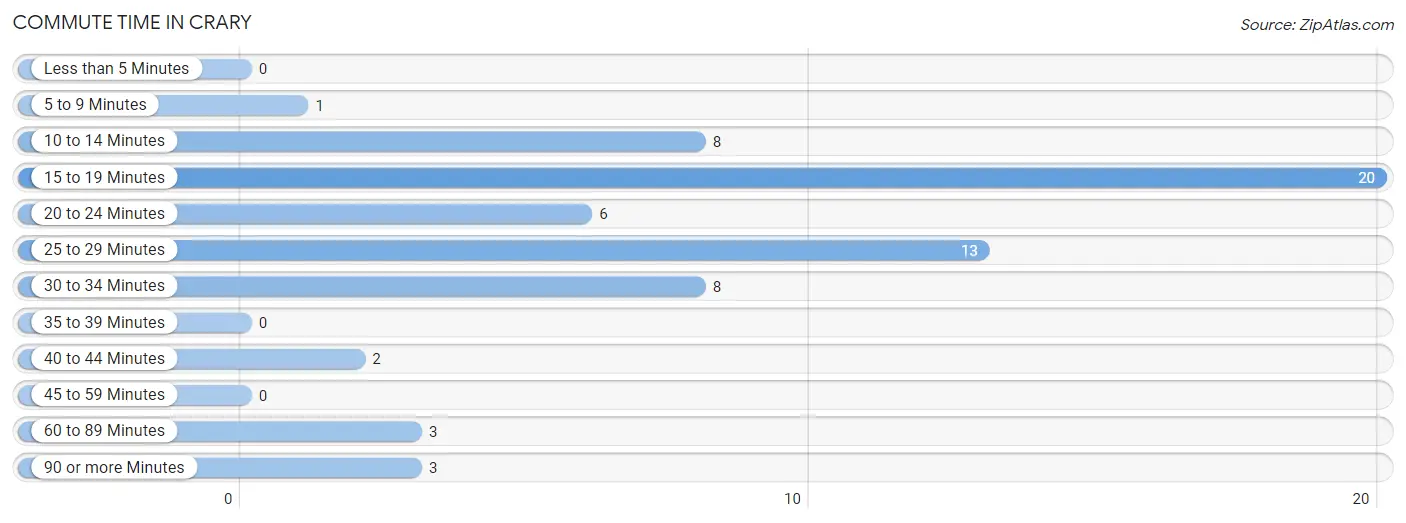
| Commute Time | # Commuters | % Commuters |
| Less than 5 Minutes | 0 | 0.0% |
| 5 to 9 Minutes | 1 | 1.6% |
| 10 to 14 Minutes | 8 | 12.5% |
| 15 to 19 Minutes | 20 | 31.2% |
| 20 to 24 Minutes | 6 | 9.4% |
| 25 to 29 Minutes | 13 | 20.3% |
| 30 to 34 Minutes | 8 | 12.5% |
| 35 to 39 Minutes | 0 | 0.0% |
| 40 to 44 Minutes | 2 | 3.1% |
| 45 to 59 Minutes | 0 | 0.0% |
| 60 to 89 Minutes | 3 | 4.7% |
| 90 or more Minutes | 3 | 4.7% |
Commute Time by Sex in Crary
The most common commute times in Crary are 15 to 19 minutes (14 commuters, 35.0%) for males and 10 to 14 minutes (8 commuters, 33.3%) for females.
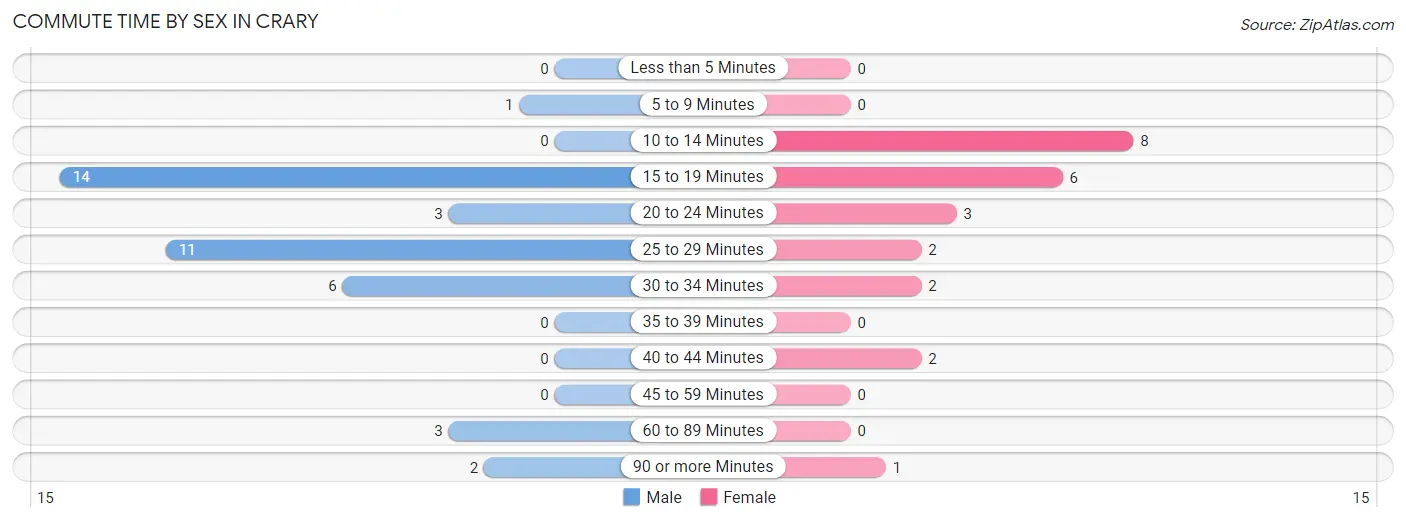
| Commute Time | Male | Female |
| Less than 5 Minutes | 0 (0.0%) | 0 (0.0%) |
| 5 to 9 Minutes | 1 (2.5%) | 0 (0.0%) |
| 10 to 14 Minutes | 0 (0.0%) | 8 (33.3%) |
| 15 to 19 Minutes | 14 (35.0%) | 6 (25.0%) |
| 20 to 24 Minutes | 3 (7.5%) | 3 (12.5%) |
| 25 to 29 Minutes | 11 (27.5%) | 2 (8.3%) |
| 30 to 34 Minutes | 6 (15.0%) | 2 (8.3%) |
| 35 to 39 Minutes | 0 (0.0%) | 0 (0.0%) |
| 40 to 44 Minutes | 0 (0.0%) | 2 (8.3%) |
| 45 to 59 Minutes | 0 (0.0%) | 0 (0.0%) |
| 60 to 89 Minutes | 3 (7.5%) | 0 (0.0%) |
| 90 or more Minutes | 2 (5.0%) | 1 (4.2%) |
Time of Departure to Work by Sex in Crary
The most frequent times of departure to work in Crary are 6:00 AM to 6:29 AM (12, 30.0%) for males and 7:00 AM to 7:29 AM (12, 50.0%) for females.
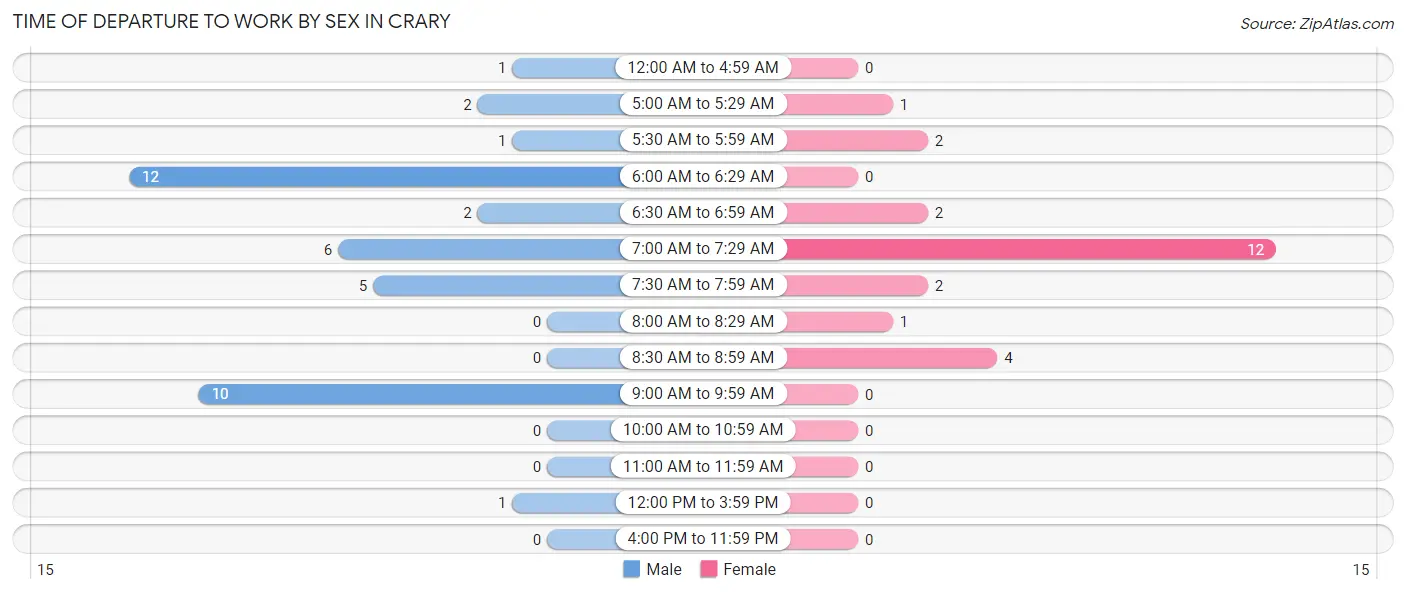
| Time of Departure | Male | Female |
| 12:00 AM to 4:59 AM | 1 (2.5%) | 0 (0.0%) |
| 5:00 AM to 5:29 AM | 2 (5.0%) | 1 (4.2%) |
| 5:30 AM to 5:59 AM | 1 (2.5%) | 2 (8.3%) |
| 6:00 AM to 6:29 AM | 12 (30.0%) | 0 (0.0%) |
| 6:30 AM to 6:59 AM | 2 (5.0%) | 2 (8.3%) |
| 7:00 AM to 7:29 AM | 6 (15.0%) | 12 (50.0%) |
| 7:30 AM to 7:59 AM | 5 (12.5%) | 2 (8.3%) |
| 8:00 AM to 8:29 AM | 0 (0.0%) | 1 (4.2%) |
| 8:30 AM to 8:59 AM | 0 (0.0%) | 4 (16.7%) |
| 9:00 AM to 9:59 AM | 10 (25.0%) | 0 (0.0%) |
| 10:00 AM to 10:59 AM | 0 (0.0%) | 0 (0.0%) |
| 11:00 AM to 11:59 AM | 0 (0.0%) | 0 (0.0%) |
| 12:00 PM to 3:59 PM | 1 (2.5%) | 0 (0.0%) |
| 4:00 PM to 11:59 PM | 0 (0.0%) | 0 (0.0%) |
| Total | 40 (100.0%) | 24 (100.0%) |
Housing Occupancy in Crary
Occupancy by Ownership in Crary
Of the total 38 dwellings in Crary, owner-occupied units account for 36 (94.7%), while renter-occupied units make up 2 (5.3%).
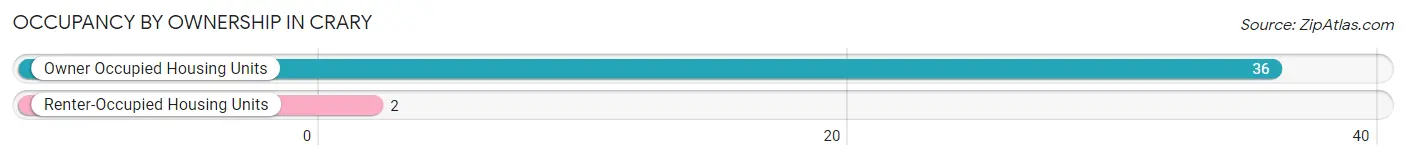
| Occupancy | # Housing Units | % Housing Units |
| Owner Occupied Housing Units | 36 | 94.7% |
| Renter-Occupied Housing Units | 2 | 5.3% |
| Total Occupied Housing Units | 38 | 100.0% |
Occupancy by Household Size in Crary
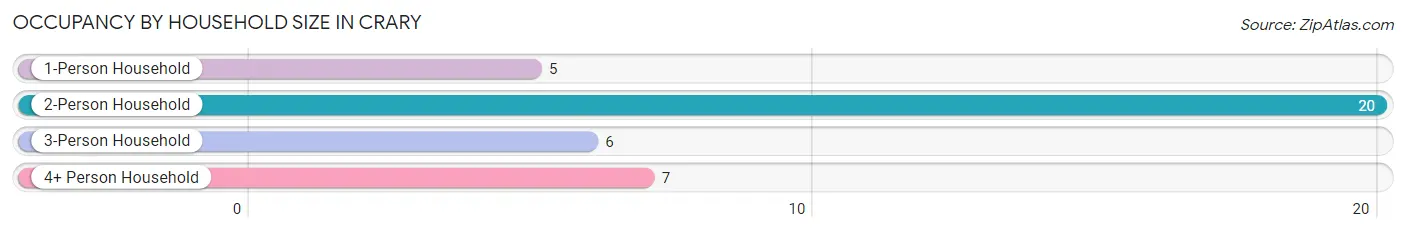
| Household Size | # Housing Units | % Housing Units |
| 1-Person Household | 5 | 13.2% |
| 2-Person Household | 20 | 52.6% |
| 3-Person Household | 6 | 15.8% |
| 4+ Person Household | 7 | 18.4% |
| Total Housing Units | 38 | 100.0% |
Occupancy by Ownership by Household Size in Crary
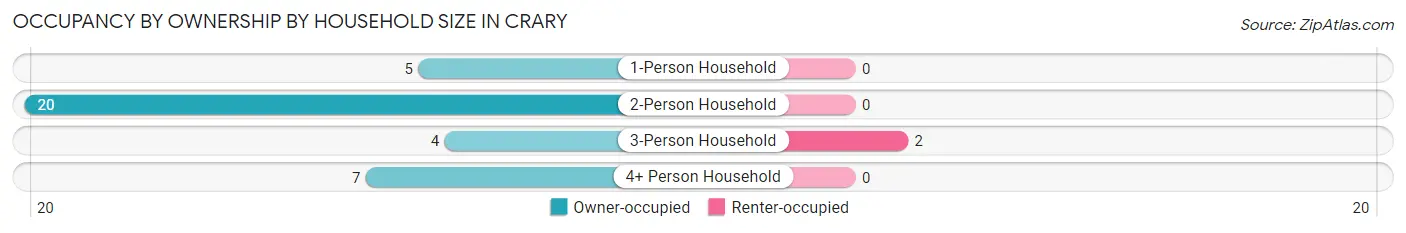
| Household Size | Owner-occupied | Renter-occupied |
| 1-Person Household | 5 (100.0%) | 0 (0.0%) |
| 2-Person Household | 20 (100.0%) | 0 (0.0%) |
| 3-Person Household | 4 (66.7%) | 2 (33.3%) |
| 4+ Person Household | 7 (100.0%) | 0 (0.0%) |
| Total Housing Units | 36 (94.7%) | 2 (5.3%) |
Occupancy by Educational Attainment in Crary
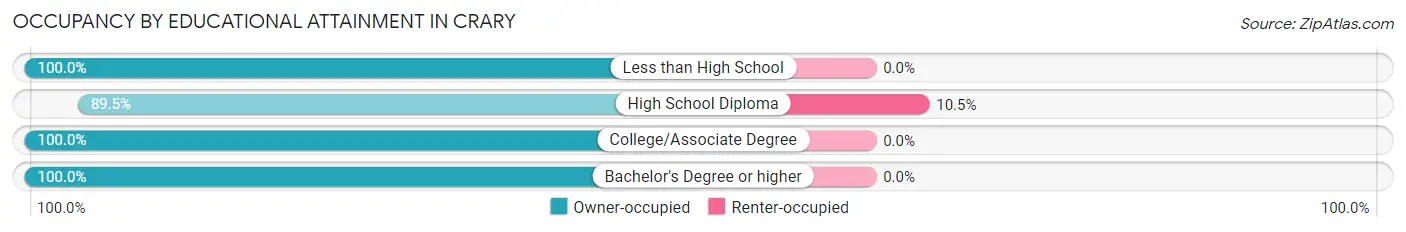
| Household Size | Owner-occupied | Renter-occupied |
| Less than High School | 1 (100.0%) | 0 (0.0%) |
| High School Diploma | 17 (89.5%) | 2 (10.5%) |
| College/Associate Degree | 10 (100.0%) | 0 (0.0%) |
| Bachelor's Degree or higher | 8 (100.0%) | 0 (0.0%) |
Occupancy by Age of Householder in Crary
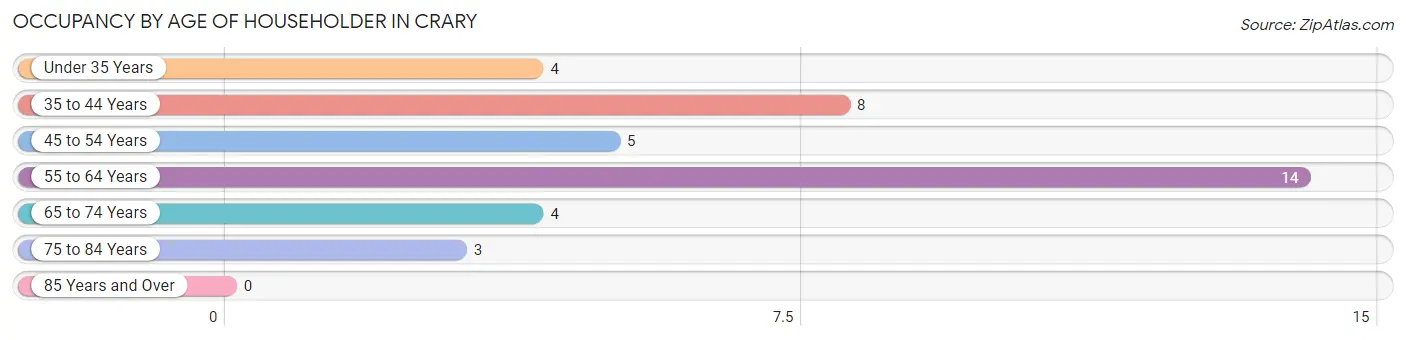
| Age Bracket | # Households | % Households |
| Under 35 Years | 4 | 10.5% |
| 35 to 44 Years | 8 | 21.0% |
| 45 to 54 Years | 5 | 13.2% |
| 55 to 64 Years | 14 | 36.8% |
| 65 to 74 Years | 4 | 10.5% |
| 75 to 84 Years | 3 | 7.9% |
| 85 Years and Over | 0 | 0.0% |
| Total | 38 | 100.0% |
Housing Finances in Crary
Median Income by Occupancy in Crary
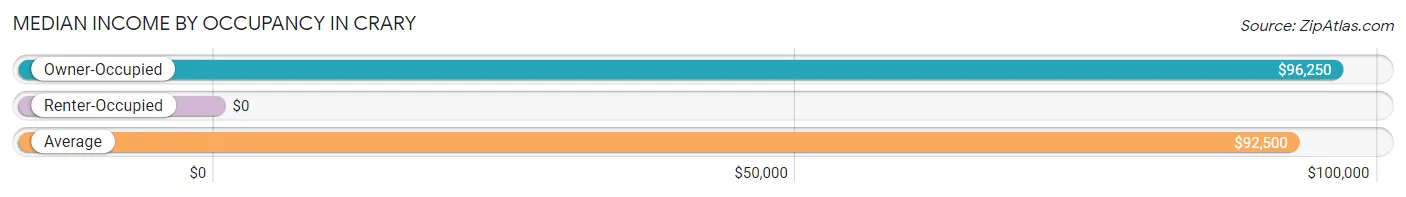
| Occupancy Type | # Households | Median Income |
| Owner-Occupied | 36 (94.7%) | $96,250 |
| Renter-Occupied | 2 (5.3%) | $0 |
| Average | 38 (100.0%) | $92,500 |
Occupancy by Householder Income Bracket in Crary
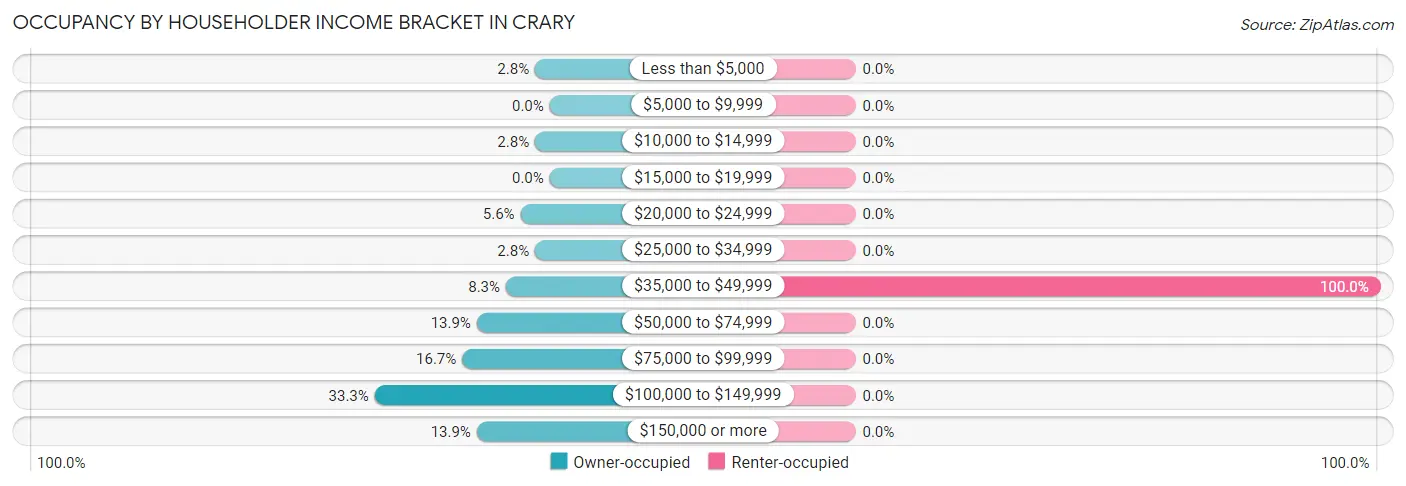
| Income Bracket | Owner-occupied | Renter-occupied |
| Less than $5,000 | 1 (2.8%) | 0 (0.0%) |
| $5,000 to $9,999 | 0 (0.0%) | 0 (0.0%) |
| $10,000 to $14,999 | 1 (2.8%) | 0 (0.0%) |
| $15,000 to $19,999 | 0 (0.0%) | 0 (0.0%) |
| $20,000 to $24,999 | 2 (5.6%) | 0 (0.0%) |
| $25,000 to $34,999 | 1 (2.8%) | 0 (0.0%) |
| $35,000 to $49,999 | 3 (8.3%) | 2 (100.0%) |
| $50,000 to $74,999 | 5 (13.9%) | 0 (0.0%) |
| $75,000 to $99,999 | 6 (16.7%) | 0 (0.0%) |
| $100,000 to $149,999 | 12 (33.3%) | 0 (0.0%) |
| $150,000 or more | 5 (13.9%) | 0 (0.0%) |
| Total | 36 (100.0%) | 2 (100.0%) |
Monthly Housing Cost Tiers in Crary
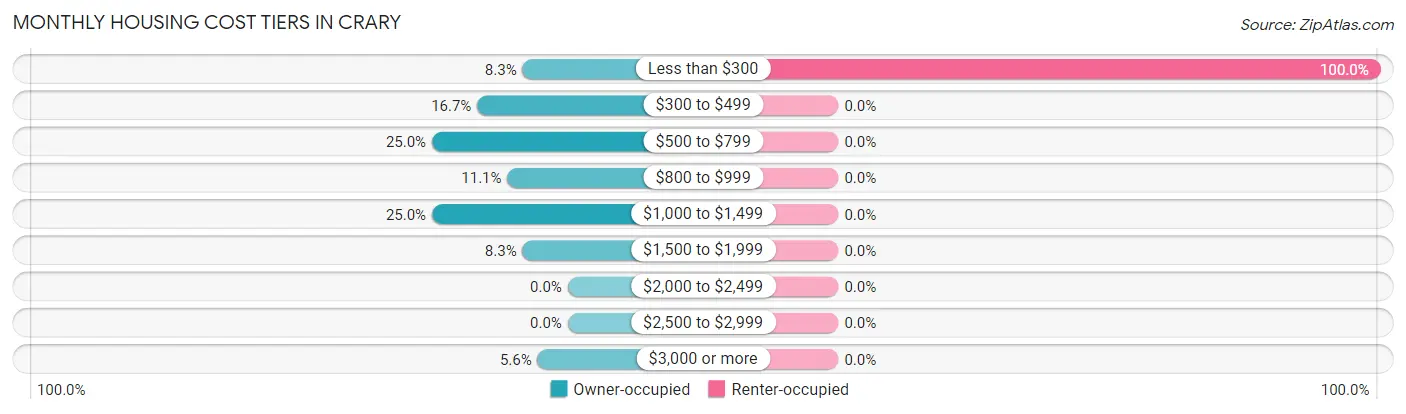
| Monthly Cost | Owner-occupied | Renter-occupied |
| Less than $300 | 3 (8.3%) | 2 (100.0%) |
| $300 to $499 | 6 (16.7%) | 0 (0.0%) |
| $500 to $799 | 9 (25.0%) | 0 (0.0%) |
| $800 to $999 | 4 (11.1%) | 0 (0.0%) |
| $1,000 to $1,499 | 9 (25.0%) | 0 (0.0%) |
| $1,500 to $1,999 | 3 (8.3%) | 0 (0.0%) |
| $2,000 to $2,499 | 0 (0.0%) | 0 (0.0%) |
| $2,500 to $2,999 | 0 (0.0%) | 0 (0.0%) |
| $3,000 or more | 2 (5.6%) | 0 (0.0%) |
| Total | 36 (100.0%) | 2 (100.0%) |
Physical Housing Characteristics in Crary
Housing Structures in Crary
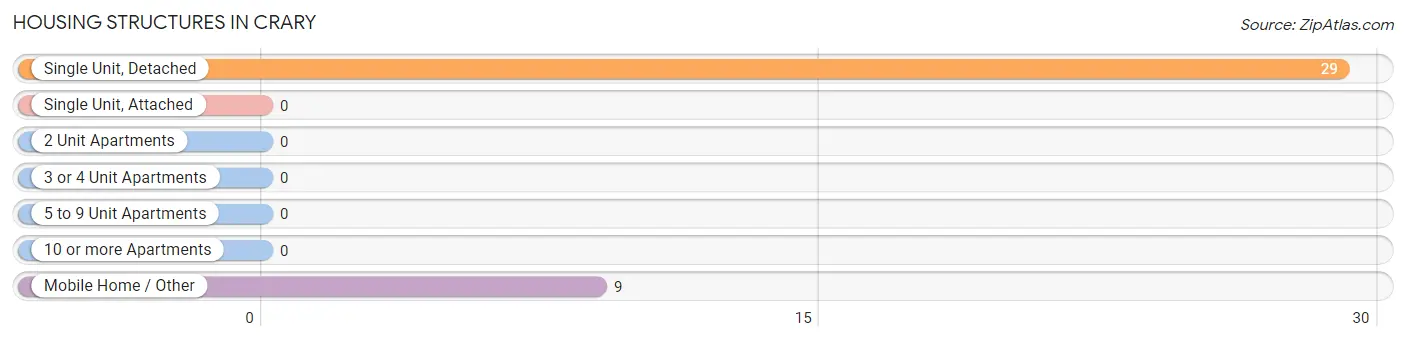
| Structure Type | # Housing Units | % Housing Units |
| Single Unit, Detached | 29 | 76.3% |
| Single Unit, Attached | 0 | 0.0% |
| 2 Unit Apartments | 0 | 0.0% |
| 3 or 4 Unit Apartments | 0 | 0.0% |
| 5 to 9 Unit Apartments | 0 | 0.0% |
| 10 or more Apartments | 0 | 0.0% |
| Mobile Home / Other | 9 | 23.7% |
| Total | 38 | 100.0% |
Housing Structures by Occupancy in Crary
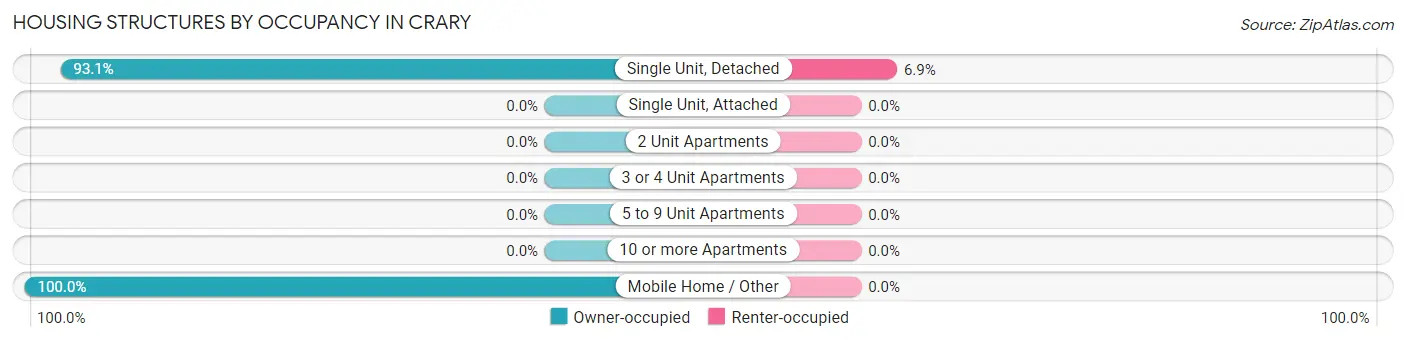
| Structure Type | Owner-occupied | Renter-occupied |
| Single Unit, Detached | 27 (93.1%) | 2 (6.9%) |
| Single Unit, Attached | 0 (0.0%) | 0 (0.0%) |
| 2 Unit Apartments | 0 (0.0%) | 0 (0.0%) |
| 3 or 4 Unit Apartments | 0 (0.0%) | 0 (0.0%) |
| 5 to 9 Unit Apartments | 0 (0.0%) | 0 (0.0%) |
| 10 or more Apartments | 0 (0.0%) | 0 (0.0%) |
| Mobile Home / Other | 9 (100.0%) | 0 (0.0%) |
| Total | 36 (94.7%) | 2 (5.3%) |
Housing Structures by Number of Rooms in Crary
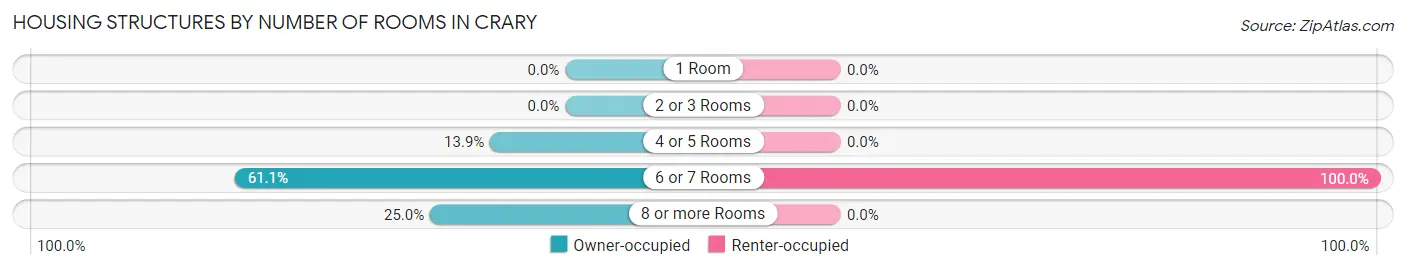
| Number of Rooms | Owner-occupied | Renter-occupied |
| 1 Room | 0 (0.0%) | 0 (0.0%) |
| 2 or 3 Rooms | 0 (0.0%) | 0 (0.0%) |
| 4 or 5 Rooms | 5 (13.9%) | 0 (0.0%) |
| 6 or 7 Rooms | 22 (61.1%) | 2 (100.0%) |
| 8 or more Rooms | 9 (25.0%) | 0 (0.0%) |
| Total | 36 (100.0%) | 2 (100.0%) |
Housing Structure by Heating Type in Crary
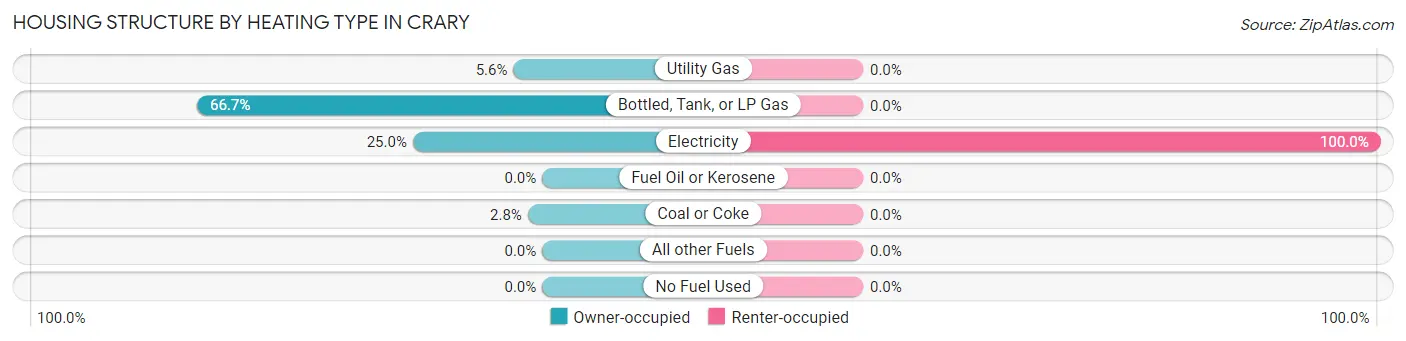
| Heating Type | Owner-occupied | Renter-occupied |
| Utility Gas | 2 (5.6%) | 0 (0.0%) |
| Bottled, Tank, or LP Gas | 24 (66.7%) | 0 (0.0%) |
| Electricity | 9 (25.0%) | 2 (100.0%) |
| Fuel Oil or Kerosene | 0 (0.0%) | 0 (0.0%) |
| Coal or Coke | 1 (2.8%) | 0 (0.0%) |
| All other Fuels | 0 (0.0%) | 0 (0.0%) |
| No Fuel Used | 0 (0.0%) | 0 (0.0%) |
| Total | 36 (100.0%) | 2 (100.0%) |
Household Vehicle Usage in Crary
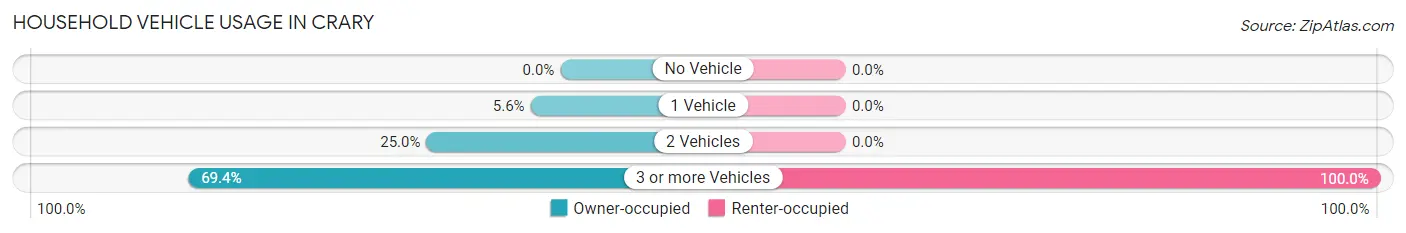
| Vehicles per Household | Owner-occupied | Renter-occupied |
| No Vehicle | 0 (0.0%) | 0 (0.0%) |
| 1 Vehicle | 2 (5.6%) | 0 (0.0%) |
| 2 Vehicles | 9 (25.0%) | 0 (0.0%) |
| 3 or more Vehicles | 25 (69.4%) | 2 (100.0%) |
| Total | 36 (100.0%) | 2 (100.0%) |
Real Estate & Mortgages in Crary
Real Estate and Mortgage Overview in Crary
| Characteristic | Without Mortgage | With Mortgage |
| Housing Units | 19 | 17 |
| Median Property Value | $51,700 | $275,000 |
| Median Household Income | $63,750 | $2 |
| Monthly Housing Costs | $513 | $2 |
| Real Estate Taxes | $525 | $0 |
Property Value by Mortgage Status in Crary
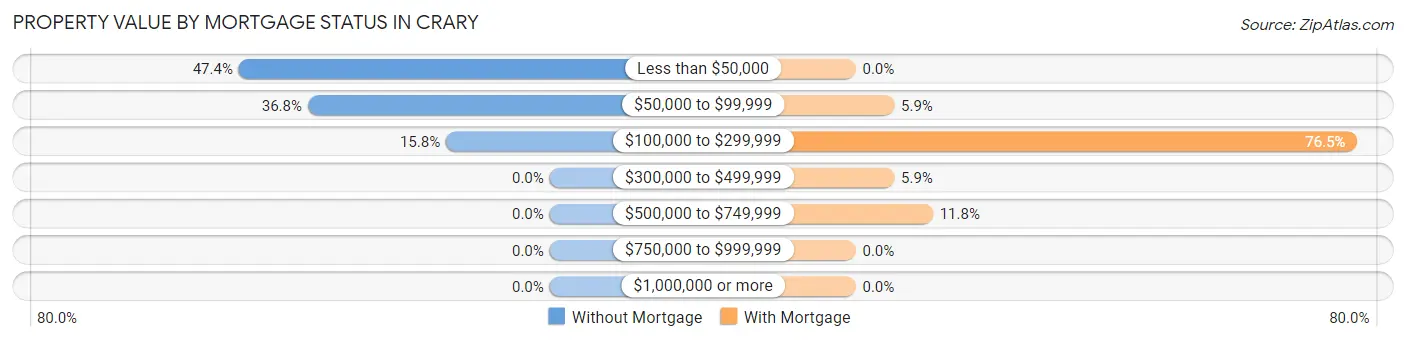
| Property Value | Without Mortgage | With Mortgage |
| Less than $50,000 | 9 (47.4%) | 0 (0.0%) |
| $50,000 to $99,999 | 7 (36.8%) | 1 (5.9%) |
| $100,000 to $299,999 | 3 (15.8%) | 13 (76.5%) |
| $300,000 to $499,999 | 0 (0.0%) | 1 (5.9%) |
| $500,000 to $749,999 | 0 (0.0%) | 2 (11.8%) |
| $750,000 to $999,999 | 0 (0.0%) | 0 (0.0%) |
| $1,000,000 or more | 0 (0.0%) | 0 (0.0%) |
| Total | 19 (100.0%) | 17 (100.0%) |
Household Income by Mortgage Status in Crary
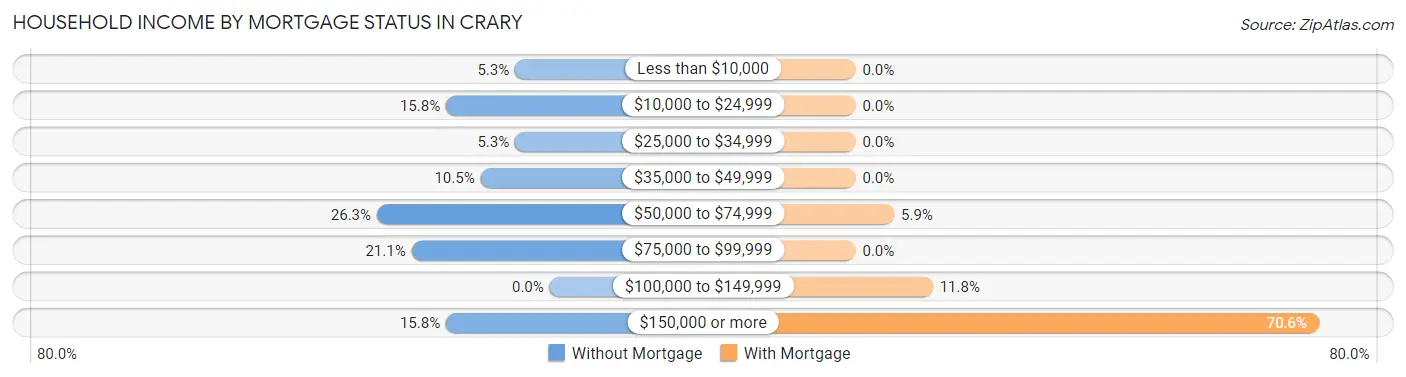
| Household Income | Without Mortgage | With Mortgage |
| Less than $10,000 | 1 (5.3%) | 0 (0.0%) |
| $10,000 to $24,999 | 3 (15.8%) | 0 (0.0%) |
| $25,000 to $34,999 | 1 (5.3%) | 0 (0.0%) |
| $35,000 to $49,999 | 2 (10.5%) | 0 (0.0%) |
| $50,000 to $74,999 | 5 (26.3%) | 1 (5.9%) |
| $75,000 to $99,999 | 4 (21.0%) | 0 (0.0%) |
| $100,000 to $149,999 | 0 (0.0%) | 2 (11.8%) |
| $150,000 or more | 3 (15.8%) | 12 (70.6%) |
| Total | 19 (100.0%) | 17 (100.0%) |
Property Value to Household Income Ratio in Crary
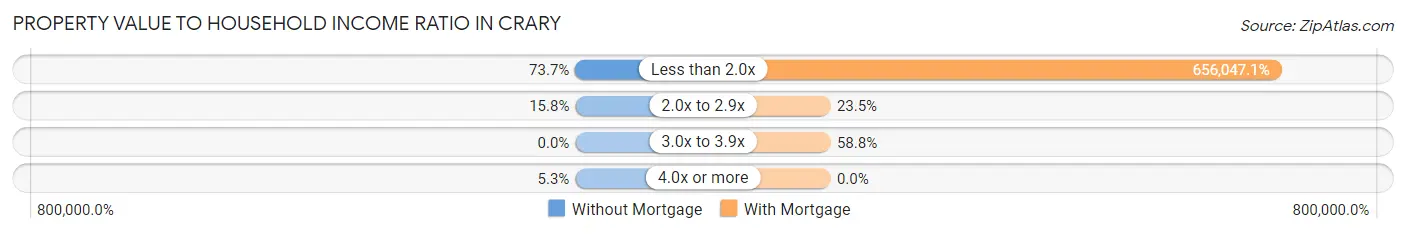
| Value-to-Income Ratio | Without Mortgage | With Mortgage |
| Less than 2.0x | 14 (73.7%) | 111,528 (656,047.1%) |
| 2.0x to 2.9x | 3 (15.8%) | 4 (23.5%) |
| 3.0x to 3.9x | 0 (0.0%) | 10 (58.8%) |
| 4.0x or more | 1 (5.3%) | 0 (0.0%) |
| Total | 19 (100.0%) | 17 (100.0%) |
Real Estate Taxes by Mortgage Status in Crary
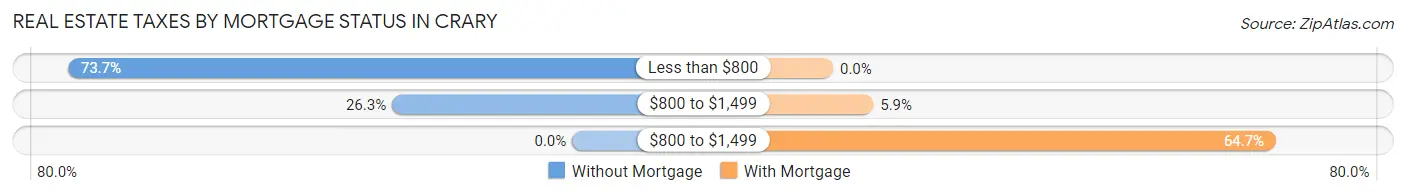
| Property Taxes | Without Mortgage | With Mortgage |
| Less than $800 | 14 (73.7%) | 0 (0.0%) |
| $800 to $1,499 | 5 (26.3%) | 1 (5.9%) |
| $800 to $1,499 | 0 (0.0%) | 11 (64.7%) |
| Total | 19 (100.0%) | 17 (100.0%) |
Health & Disability in Crary
Health Insurance Coverage by Age in Crary
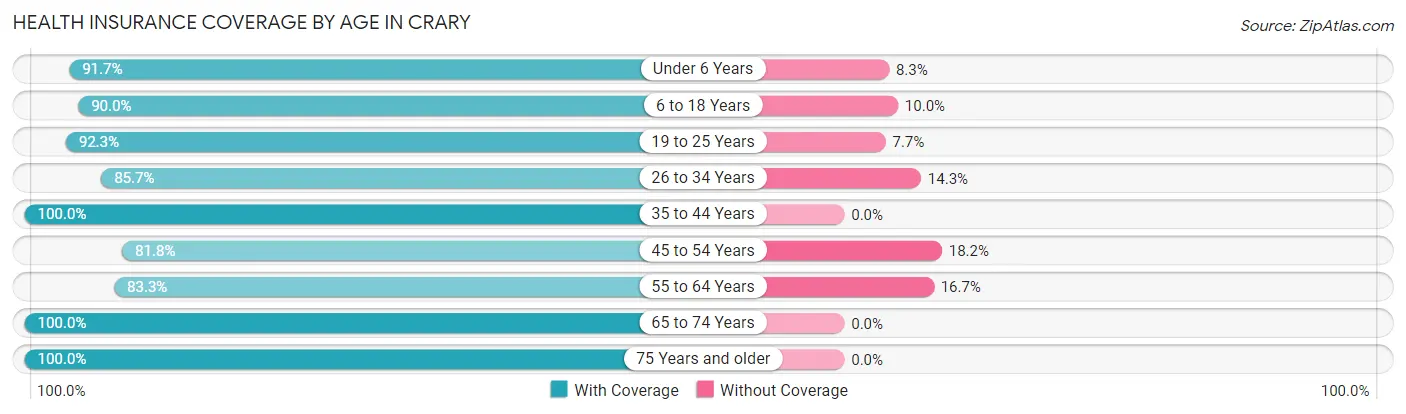
| Age Bracket | With Coverage | Without Coverage |
| Under 6 Years | 11 (91.7%) | 1 (8.3%) |
| 6 to 18 Years | 18 (90.0%) | 2 (10.0%) |
| 19 to 25 Years | 12 (92.3%) | 1 (7.7%) |
| 26 to 34 Years | 6 (85.7%) | 1 (14.3%) |
| 35 to 44 Years | 10 (100.0%) | 0 (0.0%) |
| 45 to 54 Years | 9 (81.8%) | 2 (18.2%) |
| 55 to 64 Years | 15 (83.3%) | 3 (16.7%) |
| 65 to 74 Years | 4 (100.0%) | 0 (0.0%) |
| 75 Years and older | 3 (100.0%) | 0 (0.0%) |
| Total | 88 (89.8%) | 10 (10.2%) |
Health Insurance Coverage by Citizenship Status in Crary
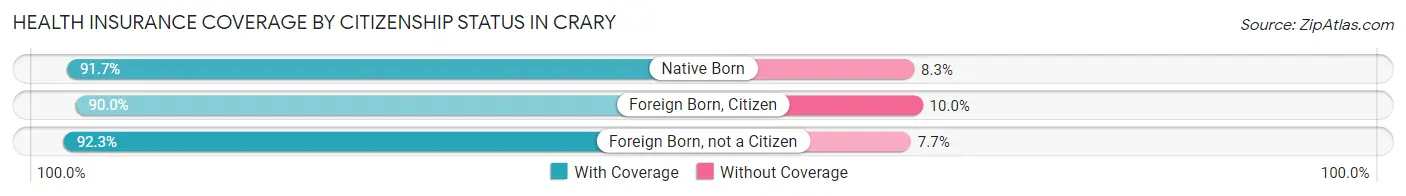
| Citizenship Status | With Coverage | Without Coverage |
| Native Born | 11 (91.7%) | 1 (8.3%) |
| Foreign Born, Citizen | 18 (90.0%) | 2 (10.0%) |
| Foreign Born, not a Citizen | 12 (92.3%) | 1 (7.7%) |
Health Insurance Coverage by Household Income in Crary
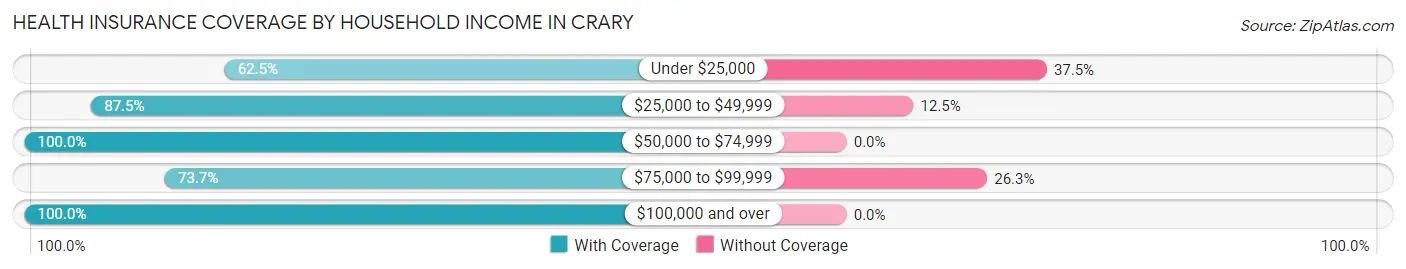
| Household Income | With Coverage | Without Coverage |
| Under $25,000 | 5 (62.5%) | 3 (37.5%) |
| $25,000 to $49,999 | 14 (87.5%) | 2 (12.5%) |
| $50,000 to $74,999 | 10 (100.0%) | 0 (0.0%) |
| $75,000 to $99,999 | 14 (73.7%) | 5 (26.3%) |
| $100,000 and over | 45 (100.0%) | 0 (0.0%) |
Public vs Private Health Insurance Coverage by Age in Crary
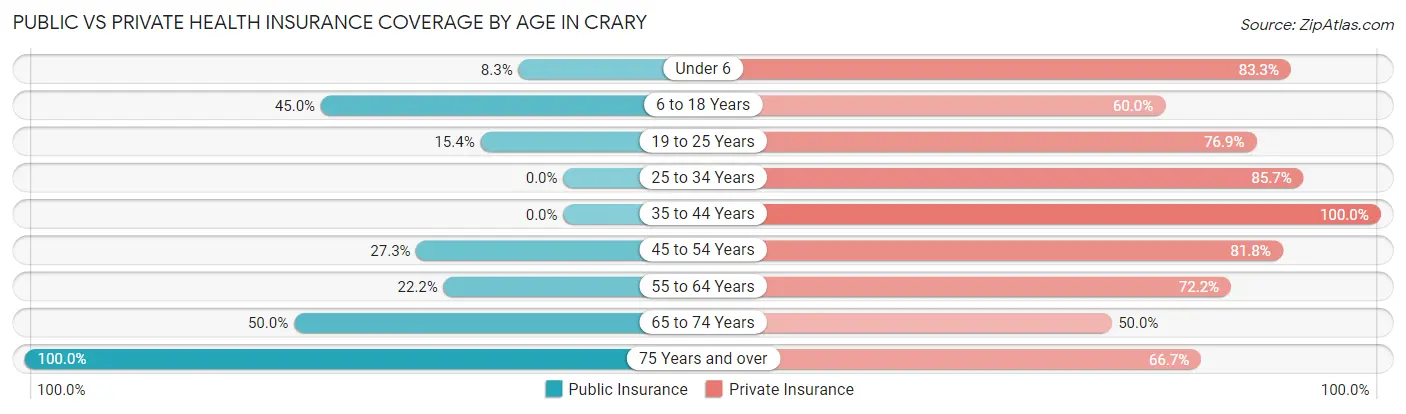
| Age Bracket | Public Insurance | Private Insurance |
| Under 6 | 1 (8.3%) | 10 (83.3%) |
| 6 to 18 Years | 9 (45.0%) | 12 (60.0%) |
| 19 to 25 Years | 2 (15.4%) | 10 (76.9%) |
| 25 to 34 Years | 0 (0.0%) | 6 (85.7%) |
| 35 to 44 Years | 0 (0.0%) | 10 (100.0%) |
| 45 to 54 Years | 3 (27.3%) | 9 (81.8%) |
| 55 to 64 Years | 4 (22.2%) | 13 (72.2%) |
| 65 to 74 Years | 2 (50.0%) | 2 (50.0%) |
| 75 Years and over | 3 (100.0%) | 2 (66.7%) |
| Total | 24 (24.5%) | 74 (75.5%) |
Disability Status by Sex by Age in Crary
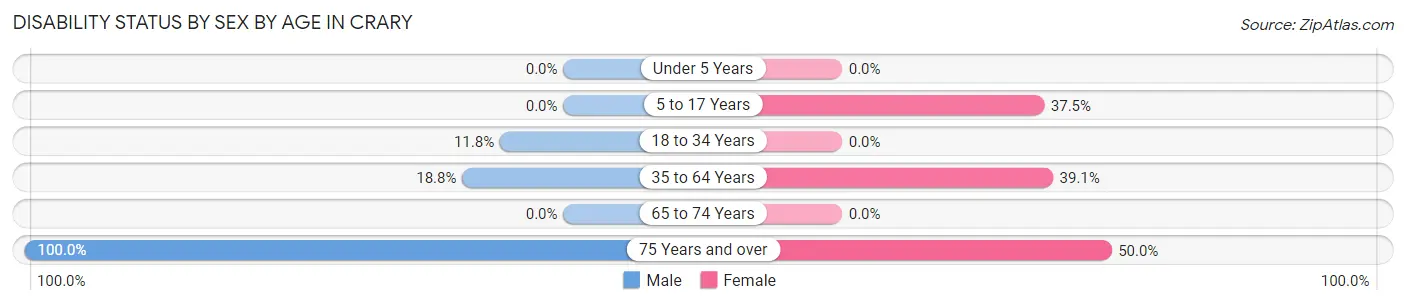
| Age Bracket | Male | Female |
| Under 5 Years | 0 (0.0%) | 0 (0.0%) |
| 5 to 17 Years | 0 (0.0%) | 6 (37.5%) |
| 18 to 34 Years | 2 (11.8%) | 0 (0.0%) |
| 35 to 64 Years | 3 (18.8%) | 9 (39.1%) |
| 65 to 74 Years | 0 (0.0%) | 0 (0.0%) |
| 75 Years and over | 1 (100.0%) | 1 (50.0%) |
Disability Class by Sex by Age in Crary
Disability Class: Hearing Difficulty
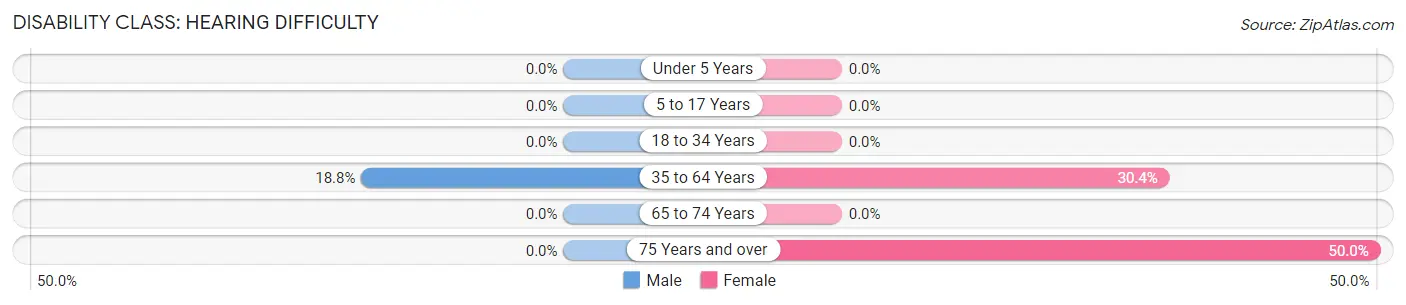
| Age Bracket | Male | Female |
| Under 5 Years | 0 (0.0%) | 0 (0.0%) |
| 5 to 17 Years | 0 (0.0%) | 0 (0.0%) |
| 18 to 34 Years | 0 (0.0%) | 0 (0.0%) |
| 35 to 64 Years | 3 (18.8%) | 7 (30.4%) |
| 65 to 74 Years | 0 (0.0%) | 0 (0.0%) |
| 75 Years and over | 0 (0.0%) | 1 (50.0%) |
Disability Class: Vision Difficulty
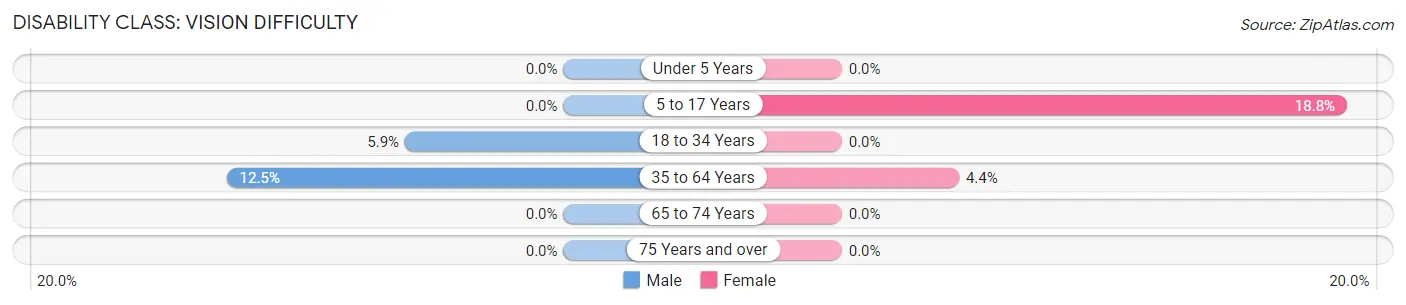
| Age Bracket | Male | Female |
| Under 5 Years | 0 (0.0%) | 0 (0.0%) |
| 5 to 17 Years | 0 (0.0%) | 3 (18.8%) |
| 18 to 34 Years | 1 (5.9%) | 0 (0.0%) |
| 35 to 64 Years | 2 (12.5%) | 1 (4.3%) |
| 65 to 74 Years | 0 (0.0%) | 0 (0.0%) |
| 75 Years and over | 0 (0.0%) | 0 (0.0%) |
Disability Class: Cognitive Difficulty
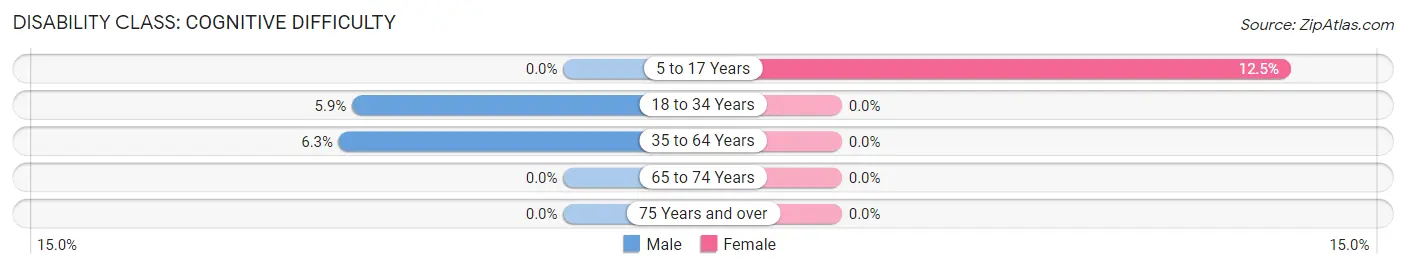
| Age Bracket | Male | Female |
| 5 to 17 Years | 0 (0.0%) | 2 (12.5%) |
| 18 to 34 Years | 1 (5.9%) | 0 (0.0%) |
| 35 to 64 Years | 1 (6.2%) | 0 (0.0%) |
| 65 to 74 Years | 0 (0.0%) | 0 (0.0%) |
| 75 Years and over | 0 (0.0%) | 0 (0.0%) |
Disability Class: Ambulatory Difficulty
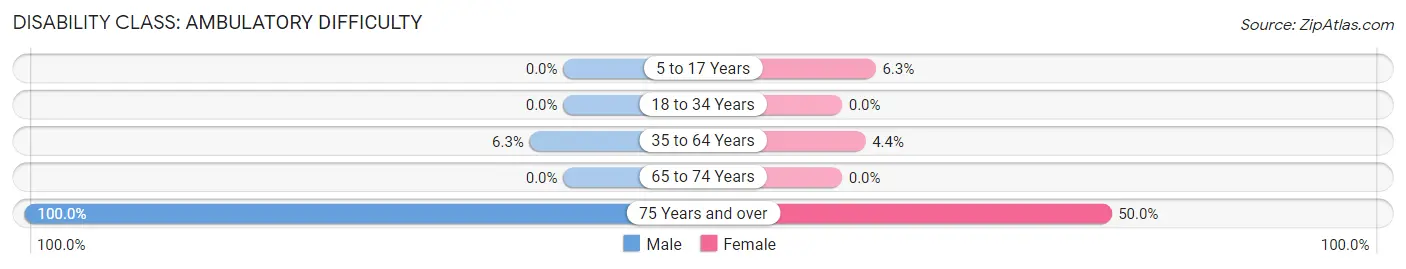
| Age Bracket | Male | Female |
| 5 to 17 Years | 0 (0.0%) | 1 (6.2%) |
| 18 to 34 Years | 0 (0.0%) | 0 (0.0%) |
| 35 to 64 Years | 1 (6.2%) | 1 (4.3%) |
| 65 to 74 Years | 0 (0.0%) | 0 (0.0%) |
| 75 Years and over | 1 (100.0%) | 1 (50.0%) |
Disability Class: Self-Care Difficulty
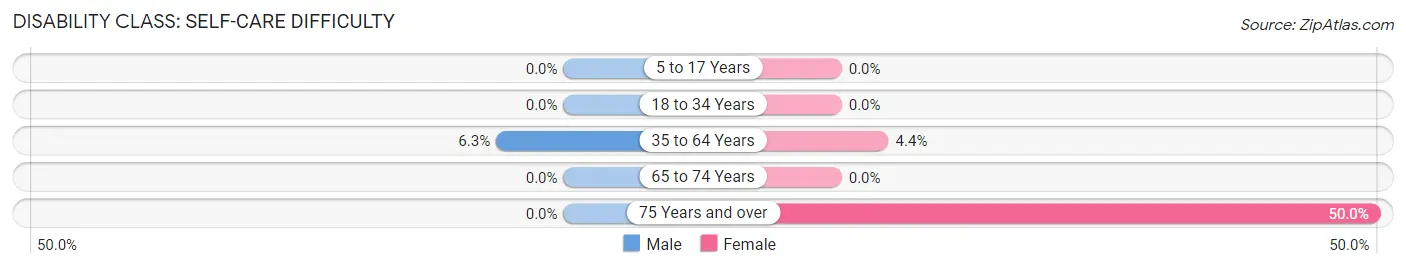
| Age Bracket | Male | Female |
| 5 to 17 Years | 0 (0.0%) | 0 (0.0%) |
| 18 to 34 Years | 0 (0.0%) | 0 (0.0%) |
| 35 to 64 Years | 1 (6.2%) | 1 (4.3%) |
| 65 to 74 Years | 0 (0.0%) | 0 (0.0%) |
| 75 Years and over | 0 (0.0%) | 1 (50.0%) |
Technology Access in Crary
Computing Device Access in Crary
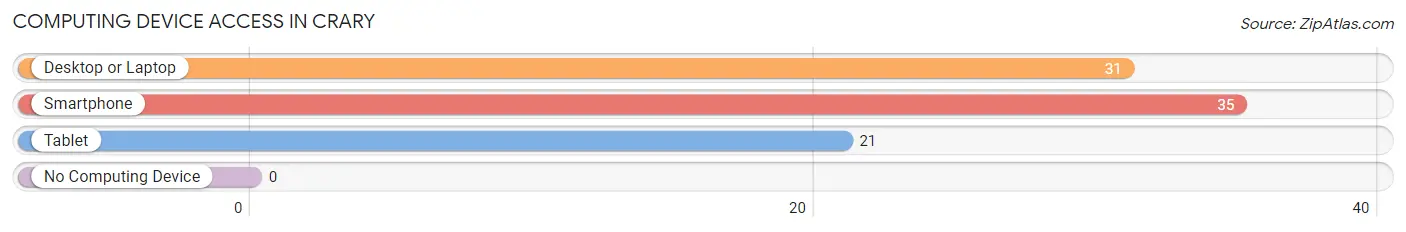
| Device Type | # Households | % Households |
| Desktop or Laptop | 31 | 81.6% |
| Smartphone | 35 | 92.1% |
| Tablet | 21 | 55.3% |
| No Computing Device | 0 | 0.0% |
| Total | 38 | 100.0% |
Internet Access in Crary
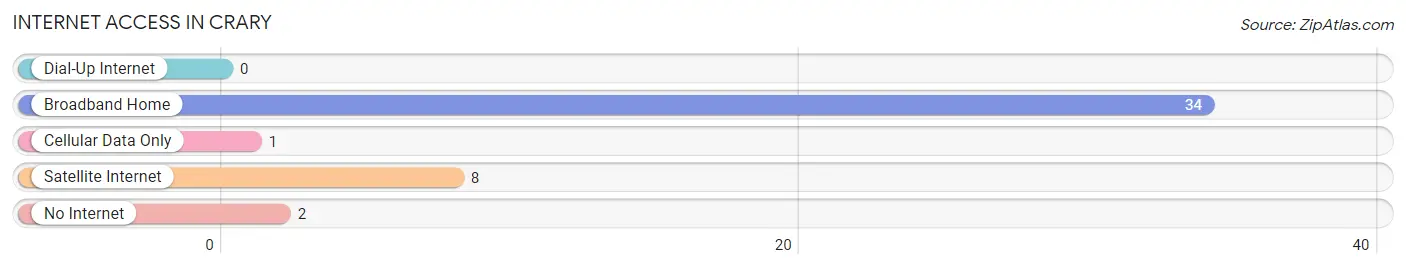
| Internet Type | # Households | % Households |
| Dial-Up Internet | 0 | 0.0% |
| Broadband Home | 34 | 89.5% |
| Cellular Data Only | 1 | 2.6% |
| Satellite Internet | 8 | 21.0% |
| No Internet | 2 | 5.3% |
| Total | 38 | 100.0% |
Crary Summary
Crary is a small city located in the northeastern corner of North Dakota, United States. It is situated in the county of Walsh, and is part of the Grand Forks metropolitan area. The city has a population of approximately 1,000 people, and is the county seat of Walsh County.
History
Crary was founded in 1882 by the Northern Pacific Railroad. The city was named after the railroad's president, William Crary. The city was incorporated in 1883, and the first post office was established in 1884.
The city was initially a farming and ranching community, but in the early 1900s, the city began to develop into a commercial center. The city was home to a number of businesses, including a bank, a hotel, a lumberyard, and a general store.
In the 1950s, the city began to experience a population decline due to the decline of the railroad industry. However, in the late 1970s, the city began to experience a resurgence in population due to the development of the nearby Grand Forks Air Force Base.
Geography
Crary is located in the northeastern corner of North Dakota, in the county of Walsh. The city is situated on the banks of the Red River of the North, and is part of the Grand Forks metropolitan area. The city has a total area of 1.2 square miles, all of which is land.
The city has a humid continental climate, with cold winters and hot summers. The average annual temperature is 45°F, and the average annual precipitation is 22 inches.
Economy
The economy of Crary is largely based on agriculture and tourism. The city is home to a number of farms, and the surrounding area is known for its production of wheat, barley, and other grains. The city is also home to a number of tourist attractions, including the Walsh County Museum, the Red River Valley Museum, and the Walsh County Historical Society.
The city is also home to a number of businesses, including a bank, a hotel, a lumberyard, and a general store. The city is also home to a number of manufacturing companies, including a furniture manufacturer, a plastics manufacturer, and a metal fabrication company.
Demographics
As of the 2010 census, the population of Crary was 1,000 people. The racial makeup of the city was 97.2% White, 0.7% African American, 0.3% Native American, 0.3% Asian, 0.1% Pacific Islander, 0.3% from other races, and 1.3% from two or more races. The median household income was $37,500, and the median family income was $45,000.
The city is home to a number of churches, including the United Methodist Church, the Lutheran Church, and the Catholic Church. The city is also home to a number of schools, including the Crary Elementary School, the Crary Middle School, and the Crary High School.
Common Questions
What is Per Capita Income in Crary?
Per Capita income in Crary is $32,085.
What is the Median Family Income in Crary?
Median Family Income in Crary is $110,139.
What is the Median Household income in Crary?
Median Household Income in Crary is $92,500.
What is Income or Wage Gap in Crary?
Income or Wage Gap in Crary is 31.0%.
Women in Crary earn 69.0 cents for every dollar earned by a man.
What is Inequality or Gini Index in Crary?
Inequality or Gini Index in Crary is 0.32.
What is the Total Population of Crary?
Total Population of Crary is 107.
What is the Total Male Population of Crary?
Total Male Population of Crary is 60.
What is the Total Female Population of Crary?
Total Female Population of Crary is 47.
What is the Ratio of Males per 100 Females in Crary?
There are 127.66 Males per 100 Females in Crary.
What is the Ratio of Females per 100 Males in Crary?
There are 78.33 Females per 100 Males in Crary.
What is the Median Population Age in Crary?
Median Population Age in Crary is 38.2 Years.
What is the Average Family Size in Crary
Average Family Size in Crary is 3.4 People.
What is the Average Household Size in Crary
Average Household Size in Crary is 2.8 People.
How Large is the Labor Force in Crary?
There are 64 People in the Labor Forcein in Crary.
What is the Percentage of People in the Labor Force in Crary?
80.0% of People are in the Labor Force in Crary.