Courtenay, ND Map & Demographics
Courtenay Map
Courtenay Overview
$26,238
PER CAPITA INCOME
$51,250
AVG FAMILY INCOME
$50,938
AVG HOUSEHOLD INCOME
37.3%
WAGE / INCOME GAP [ % ]
62.7¢/ $1
WAGE / INCOME GAP [ $ ]
0.19
INEQUALITY / GINI INDEX
53
TOTAL POPULATION
27
MALE POPULATION
26
FEMALE POPULATION
103.85
MALES / 100 FEMALES
96.30
FEMALES / 100 MALES
60.8
MEDIAN AGE
3.0
AVG FAMILY SIZE
2.1
AVG HOUSEHOLD SIZE
17
LABOR FORCE [ PEOPLE ]
38.6%
PERCENT IN LABOR FORCE
Courtenay Zip Codes
Courtenay Area Codes
Income in Courtenay
Income Overview in Courtenay
Per Capita Income in Courtenay is $26,238, while median incomes of families and households are $51,250 and $50,938 respectively.
| Characteristic | Number | Measure |
| Per Capita Income | 53 | $26,238 |
| Median Family Income | 14 | $51,250 |
| Mean Family Income | 14 | $57,907 |
| Median Household Income | 25 | $50,938 |
| Mean Household Income | 25 | $53,772 |
| Income Deficit | 14 | $0 |
| Wage / Income Gap (%) | 53 | 37.31% |
| Wage / Income Gap ($) | 53 | 62.69¢ per $1 |
| Gini / Inequality Index | 53 | 0.19 |
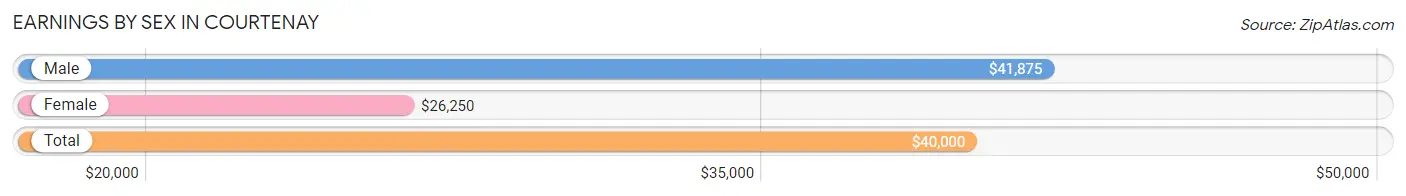
Earnings by Sex in Courtenay
Average Earnings in Courtenay are $40,000, $41,875 for men and $26,250 for women, a difference of 37.3%.
| Sex | Number | Average Earnings |
| Male | 14 (70.0%) | $41,875 |
| Female | 6 (30.0%) | $26,250 |
| Total | 20 (100.0%) | $40,000 |
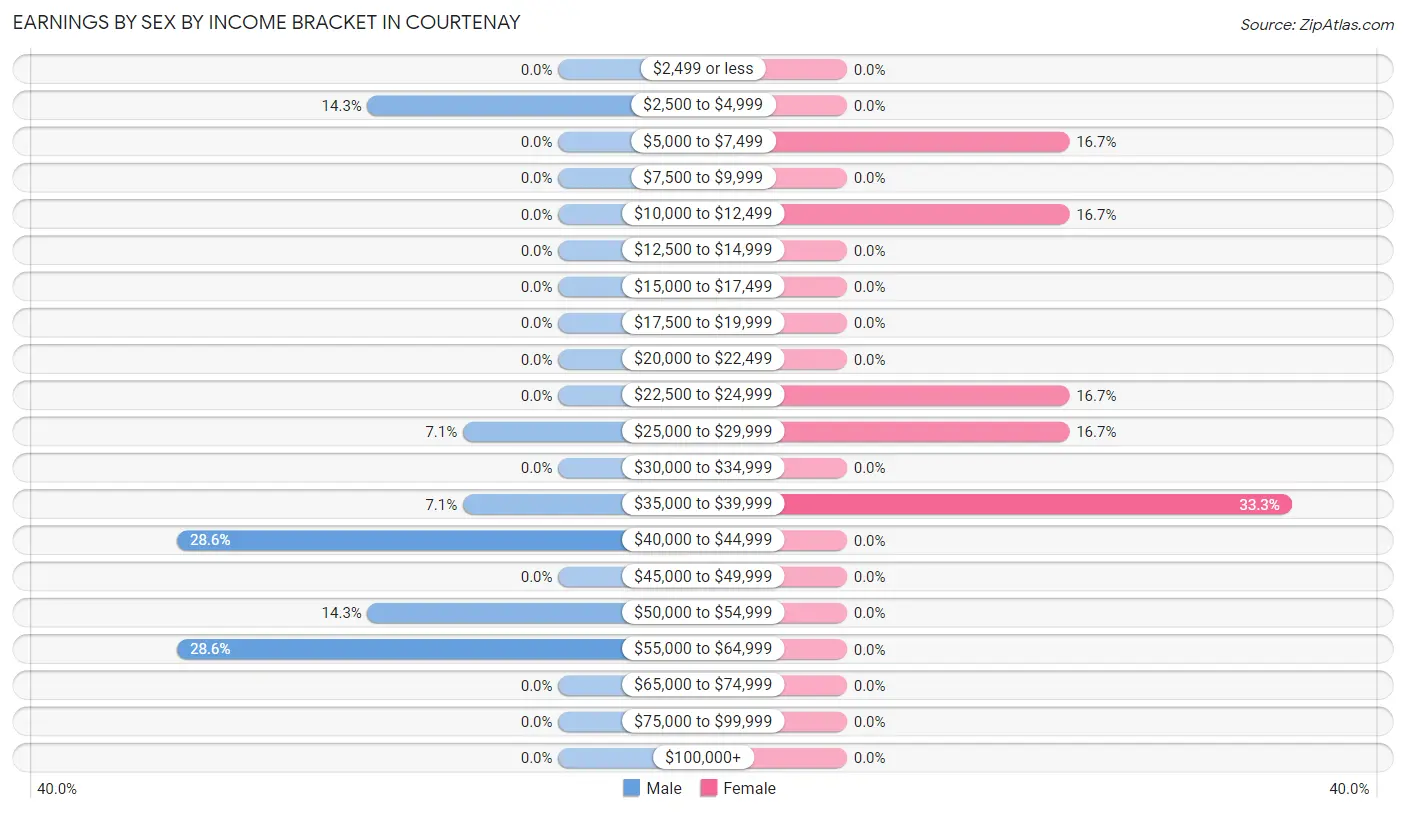
Earnings by Sex by Income Bracket in Courtenay
The most common earnings brackets in Courtenay are $40,000 to $44,999 for men (4 | 28.6%) and $35,000 to $39,999 for women (2 | 33.3%).
| Income | Male | Female |
| $2,499 or less | 0 (0.0%) | 0 (0.0%) |
| $2,500 to $4,999 | 2 (14.3%) | 0 (0.0%) |
| $5,000 to $7,499 | 0 (0.0%) | 1 (16.7%) |
| $7,500 to $9,999 | 0 (0.0%) | 0 (0.0%) |
| $10,000 to $12,499 | 0 (0.0%) | 1 (16.7%) |
| $12,500 to $14,999 | 0 (0.0%) | 0 (0.0%) |
| $15,000 to $17,499 | 0 (0.0%) | 0 (0.0%) |
| $17,500 to $19,999 | 0 (0.0%) | 0 (0.0%) |
| $20,000 to $22,499 | 0 (0.0%) | 0 (0.0%) |
| $22,500 to $24,999 | 0 (0.0%) | 1 (16.7%) |
| $25,000 to $29,999 | 1 (7.1%) | 1 (16.7%) |
| $30,000 to $34,999 | 0 (0.0%) | 0 (0.0%) |
| $35,000 to $39,999 | 1 (7.1%) | 2 (33.3%) |
| $40,000 to $44,999 | 4 (28.6%) | 0 (0.0%) |
| $45,000 to $49,999 | 0 (0.0%) | 0 (0.0%) |
| $50,000 to $54,999 | 2 (14.3%) | 0 (0.0%) |
| $55,000 to $64,999 | 4 (28.6%) | 0 (0.0%) |
| $65,000 to $74,999 | 0 (0.0%) | 0 (0.0%) |
| $75,000 to $99,999 | 0 (0.0%) | 0 (0.0%) |
| $100,000+ | 0 (0.0%) | 0 (0.0%) |
| Total | 14 (100.0%) | 6 (100.0%) |
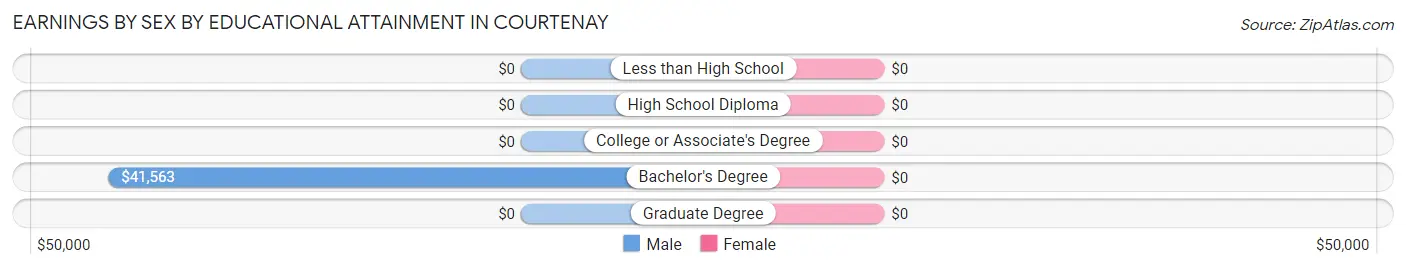
Earnings by Sex by Educational Attainment in Courtenay
| Educational Attainment | Male Income | Female Income |
| Less than High School | - | - |
| High School Diploma | - | - |
| College or Associate's Degree | - | - |
| Bachelor's Degree | $41,563 | $0 |
| Graduate Degree | - | - |
| Total | $42,188 | $28,750 |
Family Income in Courtenay
Family Income Brackets in Courtenay
According to the Courtenay family income data, there are 5 families falling into the $25,000 to $34,999 income range, which is the most common income bracket and makes up 35.7% of all families.
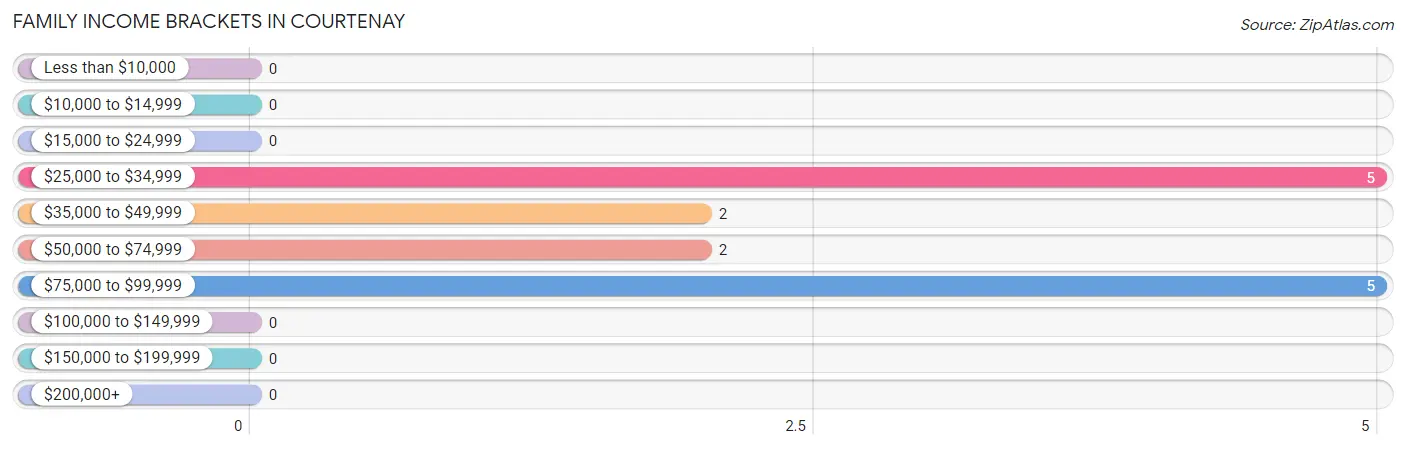
| Income Bracket | # Families | % Families |
| Less than $10,000 | 0 | 0.0% |
| $10,000 to $14,999 | 0 | 0.0% |
| $15,000 to $24,999 | 0 | 0.0% |
| $25,000 to $34,999 | 5 | 35.7% |
| $35,000 to $49,999 | 2 | 14.3% |
| $50,000 to $74,999 | 2 | 14.3% |
| $75,000 to $99,999 | 5 | 35.7% |
| $100,000 to $149,999 | 0 | 0.0% |
| $150,000 to $199,999 | 0 | 0.0% |
| $200,000+ | 0 | 0.0% |
Family Income by Famaliy Size in Courtenay
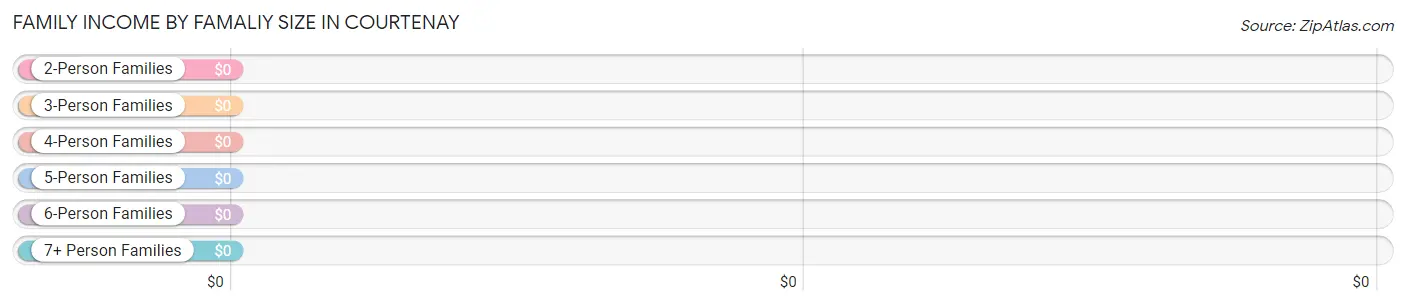
| Income Bracket | # Families | Median Income |
| 2-Person Families | 10 (71.4%) | $0 |
| 3-Person Families | 1 (7.1%) | $0 |
| 4-Person Families | 2 (14.3%) | $0 |
| 5-Person Families | 1 (7.1%) | $0 |
| 6-Person Families | 0 (0.0%) | $0 |
| 7+ Person Families | 0 (0.0%) | $0 |
| Total | 14 (100.0%) | $51,250 |
Family Income by Number of Earners in Courtenay
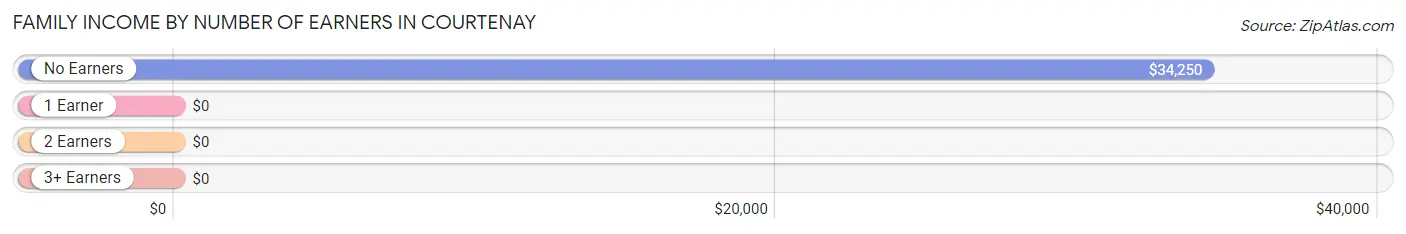
| Number of Earners | # Families | Median Income |
| No Earners | 7 (50.0%) | $34,250 |
| 1 Earner | 4 (28.6%) | $0 |
| 2 Earners | 2 (14.3%) | $0 |
| 3+ Earners | 1 (7.1%) | $0 |
| Total | 14 (100.0%) | $51,250 |
Household Income in Courtenay
Household Income Brackets in Courtenay
With 9 households falling in the category, the $50,000 to $74,999 income range is the most frequent in Courtenay, accounting for 36.0% of all households.
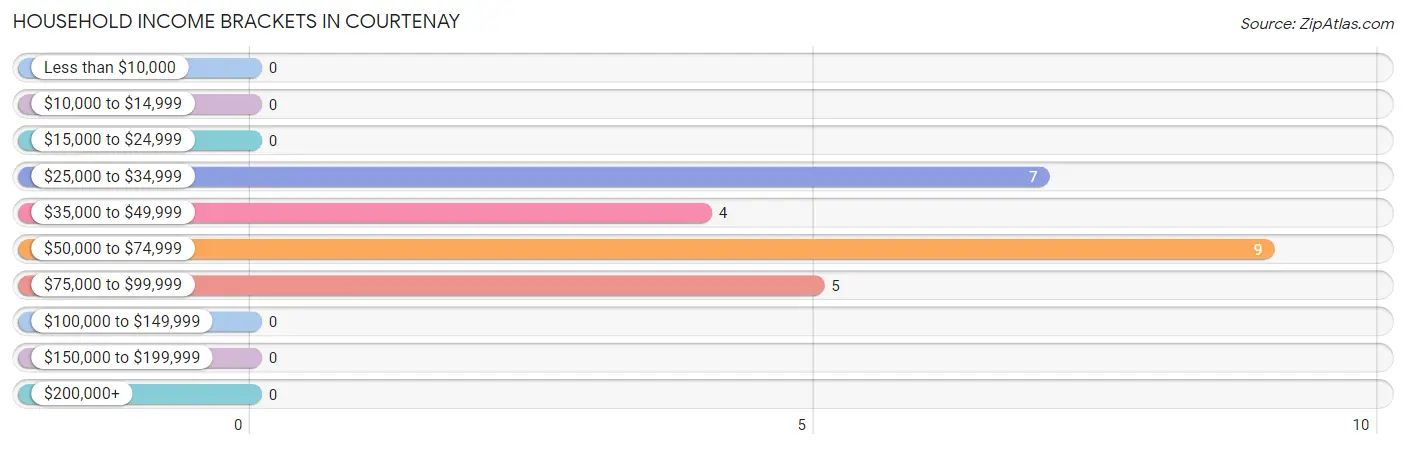
| Income Bracket | # Households | % Households |
| Less than $10,000 | 0 | 0.0% |
| $10,000 to $14,999 | 0 | 0.0% |
| $15,000 to $24,999 | 0 | 0.0% |
| $25,000 to $34,999 | 7 | 28.0% |
| $35,000 to $49,999 | 4 | 16.0% |
| $50,000 to $74,999 | 9 | 36.0% |
| $75,000 to $99,999 | 5 | 20.0% |
| $100,000 to $149,999 | 0 | 0.0% |
| $150,000 to $199,999 | 0 | 0.0% |
| $200,000+ | 0 | 0.0% |
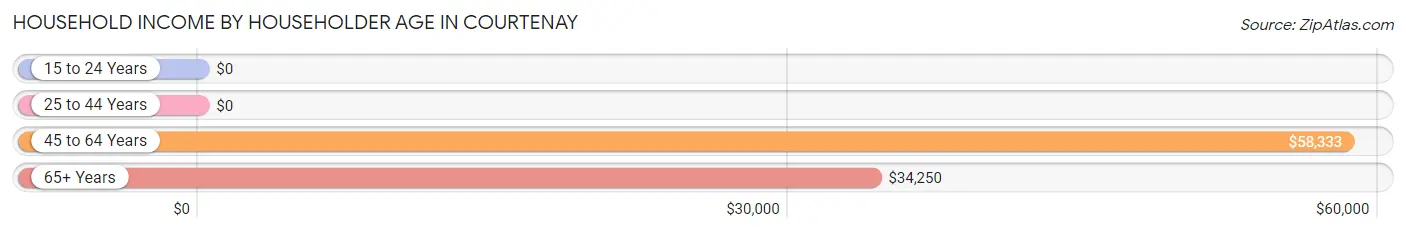
Household Income by Householder Age in Courtenay
The median household income in Courtenay is $50,938, with the highest median household income of $58,333 found in the 45 to 64 years age bracket for the primary householder. A total of 12 households (48.0%) fall into this category.
| Income Bracket | # Households | Median Income |
| 15 to 24 Years | 0 (0.0%) | $0 |
| 25 to 44 Years | 2 (8.0%) | $0 |
| 45 to 64 Years | 12 (48.0%) | $58,333 |
| 65+ Years | 11 (44.0%) | $34,250 |
| Total | 25 (100.0%) | $50,938 |
Poverty in Courtenay
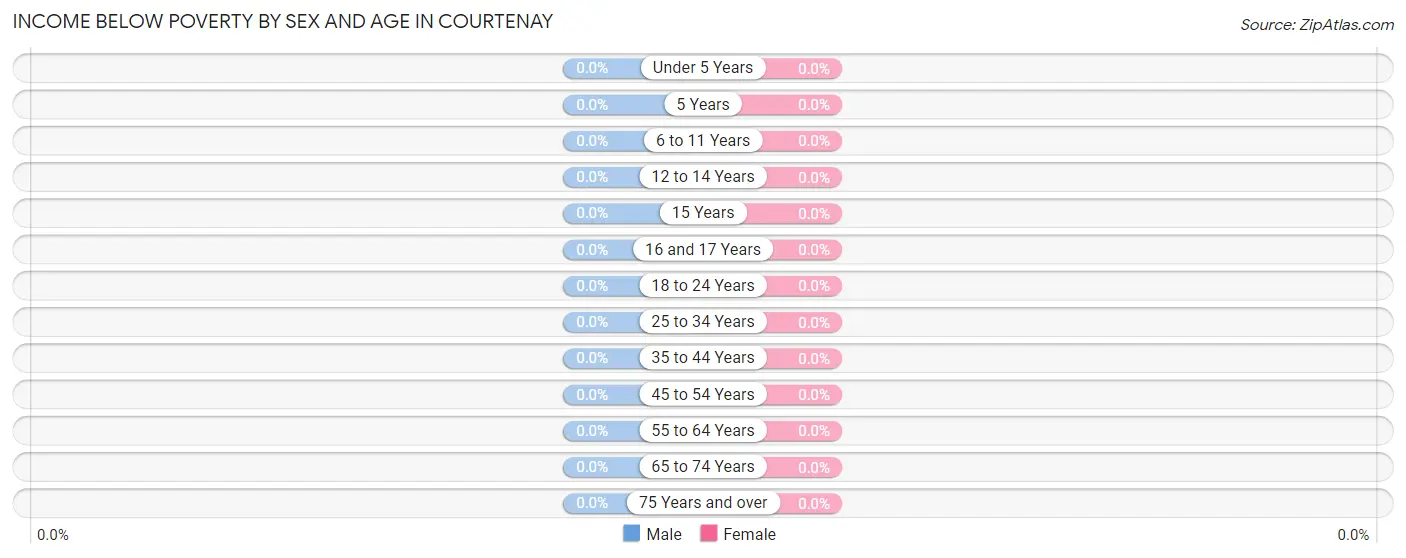
Income Below Poverty by Sex and Age in Courtenay
| Age Bracket | Male | Female |
| Under 5 Years | 0 (0.0%) | 0 (0.0%) |
| 5 Years | 0 (0.0%) | 0 (0.0%) |
| 6 to 11 Years | 0 (0.0%) | 0 (0.0%) |
| 12 to 14 Years | 0 (0.0%) | 0 (0.0%) |
| 15 Years | 0 (0.0%) | 0 (0.0%) |
| 16 and 17 Years | 0 (0.0%) | 0 (0.0%) |
| 18 to 24 Years | 0 (0.0%) | 0 (0.0%) |
| 25 to 34 Years | 0 (0.0%) | 0 (0.0%) |
| 35 to 44 Years | 0 (0.0%) | 0 (0.0%) |
| 45 to 54 Years | 0 (0.0%) | 0 (0.0%) |
| 55 to 64 Years | 0 (0.0%) | 0 (0.0%) |
| 65 to 74 Years | 0 (0.0%) | 0 (0.0%) |
| 75 Years and over | 0 (0.0%) | 0 (0.0%) |
| Total | 0 (0.0%) | 0 (0.0%) |
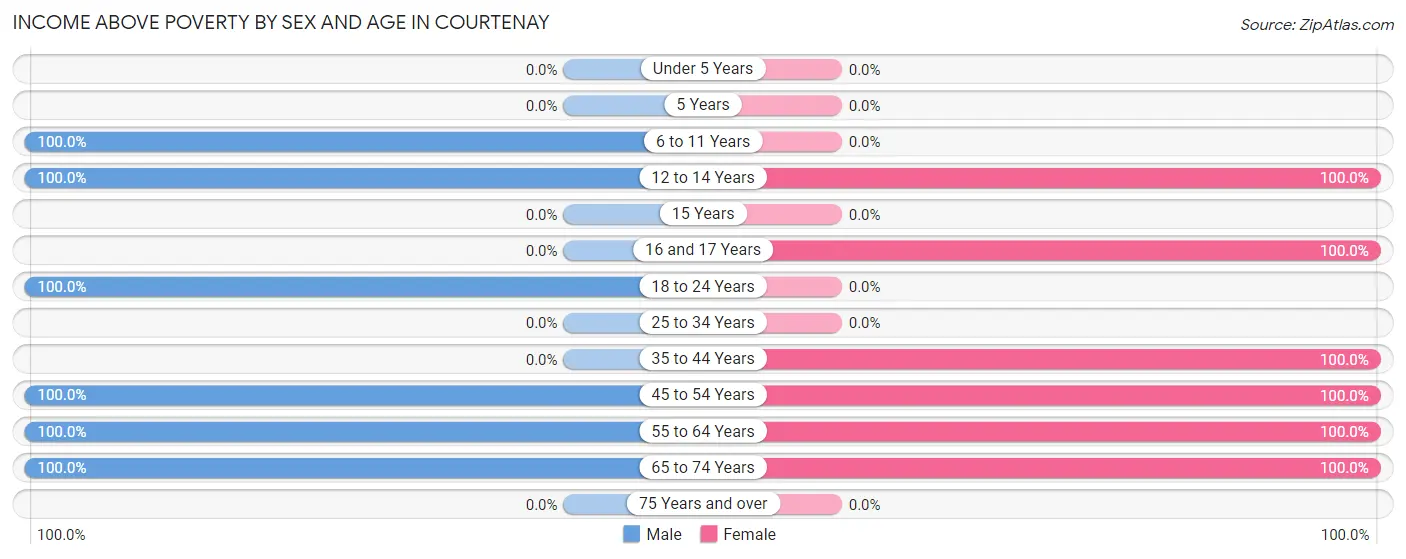
Income Above Poverty by Sex and Age in Courtenay
According to the poverty statistics in Courtenay, males aged 6 to 11 years and females aged 12 to 14 years are the age groups that are most secure financially, with 100.0% of males and 100.0% of females in these age groups living above the poverty line.
| Age Bracket | Male | Female |
| Under 5 Years | 0 (0.0%) | 0 (0.0%) |
| 5 Years | 0 (0.0%) | 0 (0.0%) |
| 6 to 11 Years | 3 (100.0%) | 0 (0.0%) |
| 12 to 14 Years | 2 (100.0%) | 4 (100.0%) |
| 15 Years | 0 (0.0%) | 0 (0.0%) |
| 16 and 17 Years | 0 (0.0%) | 1 (100.0%) |
| 18 to 24 Years | 3 (100.0%) | 0 (0.0%) |
| 25 to 34 Years | 0 (0.0%) | 0 (0.0%) |
| 35 to 44 Years | 0 (0.0%) | 2 (100.0%) |
| 45 to 54 Years | 5 (100.0%) | 1 (100.0%) |
| 55 to 64 Years | 7 (100.0%) | 4 (100.0%) |
| 65 to 74 Years | 7 (100.0%) | 14 (100.0%) |
| 75 Years and over | 0 (0.0%) | 0 (0.0%) |
| Total | 27 (100.0%) | 26 (100.0%) |
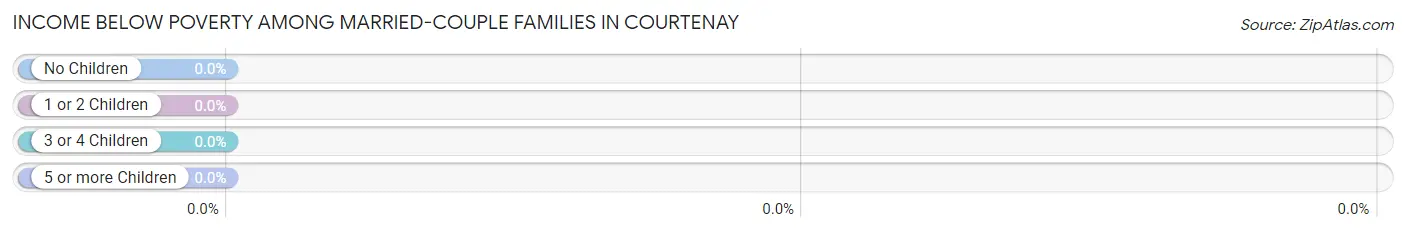
Income Below Poverty Among Married-Couple Families in Courtenay
| Children | Above Poverty | Below Poverty |
| No Children | 10 (100.0%) | 0 (0.0%) |
| 1 or 2 Children | 2 (100.0%) | 0 (0.0%) |
| 3 or 4 Children | 0 (0.0%) | 0 (0.0%) |
| 5 or more Children | 0 (0.0%) | 0 (0.0%) |
| Total | 12 (100.0%) | 0 (0.0%) |
Income Below Poverty Among Single-Parent Households in Courtenay
| Children | Single Father | Single Mother |
| No Children | 0 (0.0%) | 0 (0.0%) |
| 1 or 2 Children | 0 (0.0%) | 0 (0.0%) |
| 3 or 4 Children | 0 (0.0%) | 0 (0.0%) |
| 5 or more Children | 0 (0.0%) | 0 (0.0%) |
| Total | 0 (0.0%) | 0 (0.0%) |
Income Below Poverty Among Married-Couple vs Single-Parent Households in Courtenay
| Children | Married-Couple Families | Single-Parent Households |
| No Children | 0 (0.0%) | 0 (0.0%) |
| 1 or 2 Children | 0 (0.0%) | 0 (0.0%) |
| 3 or 4 Children | 0 (0.0%) | 0 (0.0%) |
| 5 or more Children | 0 (0.0%) | 0 (0.0%) |
| Total | 0 (0.0%) | 0 (0.0%) |
Race in Courtenay
The most populous races in Courtenay are , and White / Caucasian (53 | 100.0%).
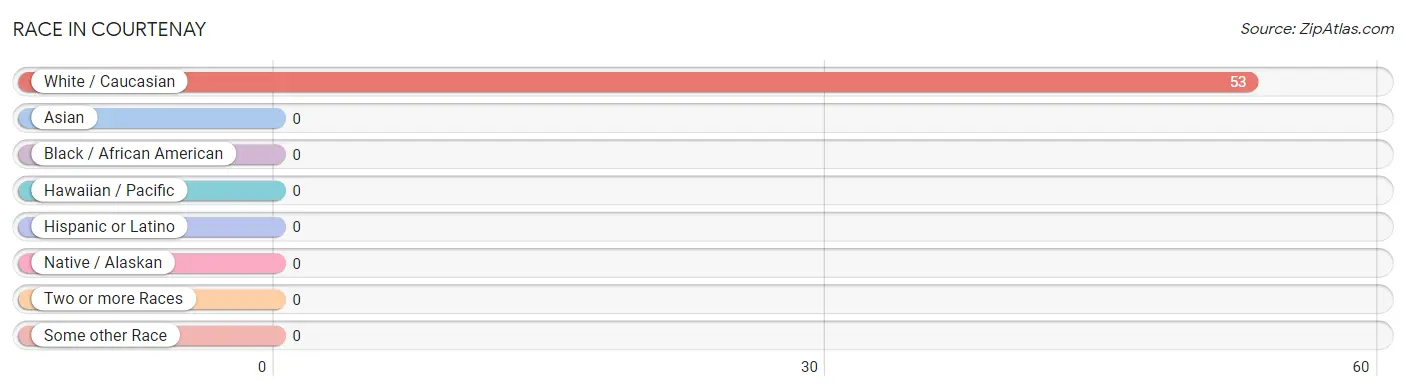
| Race | # Population | % Population |
| Asian | 0 | 0.0% |
| Black / African American | 0 | 0.0% |
| Hawaiian / Pacific | 0 | 0.0% |
| Hispanic or Latino | 0 | 0.0% |
| Native / Alaskan | 0 | 0.0% |
| White / Caucasian | 53 | 100.0% |
| Two or more Races | 0 | 0.0% |
| Some other Race | 0 | 0.0% |
| Total | 53 | 100.0% |
Ancestry in Courtenay
The most populous ancestries reported in Courtenay are German (17 | 32.1%), English (8 | 15.1%), Norwegian (8 | 15.1%), Polish (8 | 15.1%), and French (5 | 9.4%), together accounting for 86.8% of all Courtenay residents.
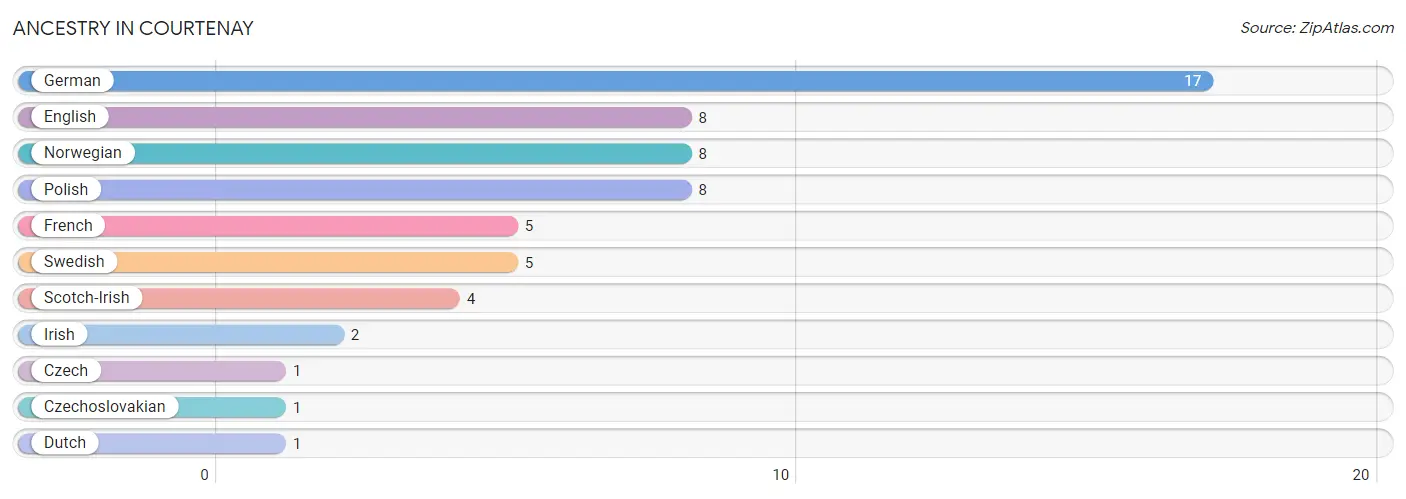
| Ancestry | # Population | % Population |
| Czech | 1 | 1.9% |
| Czechoslovakian | 1 | 1.9% |
| Dutch | 1 | 1.9% |
| English | 8 | 15.1% |
| French | 5 | 9.4% |
| German | 17 | 32.1% |
| Irish | 2 | 3.8% |
| Norwegian | 8 | 15.1% |
| Polish | 8 | 15.1% |
| Scotch-Irish | 4 | 7.5% |
| Swedish | 5 | 9.4% | View All 11 Rows |
Immigrants in Courtenay

| Immigration Origin | # Population | % Population | View All 0 Rows |
Sex and Age in Courtenay
Sex and Age in Courtenay
The most populous age groups in Courtenay are 70 to 74 Years (5 | 18.5%) for men and 65 to 69 Years (10 | 38.5%) for women.
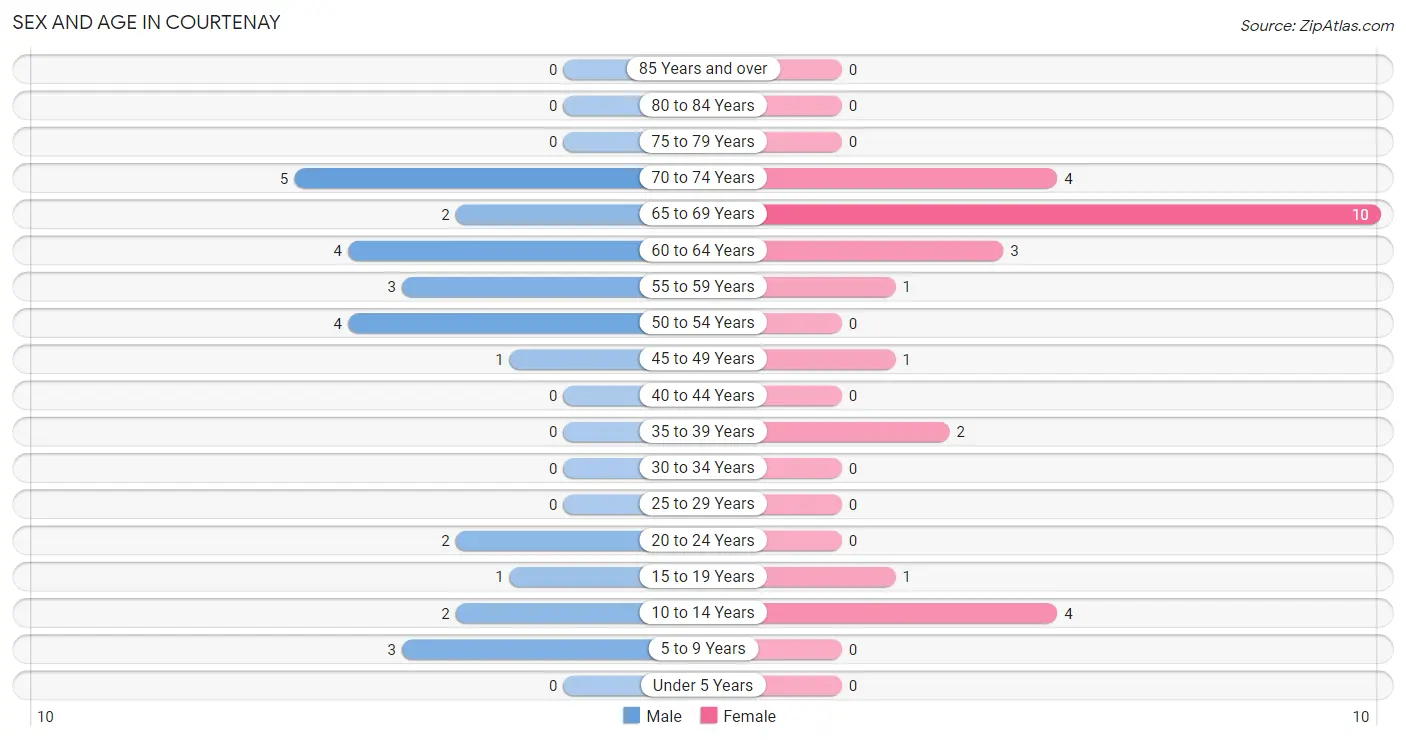
| Age Bracket | Male | Female |
| Under 5 Years | 0 (0.0%) | 0 (0.0%) |
| 5 to 9 Years | 3 (11.1%) | 0 (0.0%) |
| 10 to 14 Years | 2 (7.4%) | 4 (15.4%) |
| 15 to 19 Years | 1 (3.7%) | 1 (3.8%) |
| 20 to 24 Years | 2 (7.4%) | 0 (0.0%) |
| 25 to 29 Years | 0 (0.0%) | 0 (0.0%) |
| 30 to 34 Years | 0 (0.0%) | 0 (0.0%) |
| 35 to 39 Years | 0 (0.0%) | 2 (7.7%) |
| 40 to 44 Years | 0 (0.0%) | 0 (0.0%) |
| 45 to 49 Years | 1 (3.7%) | 1 (3.8%) |
| 50 to 54 Years | 4 (14.8%) | 0 (0.0%) |
| 55 to 59 Years | 3 (11.1%) | 1 (3.8%) |
| 60 to 64 Years | 4 (14.8%) | 3 (11.5%) |
| 65 to 69 Years | 2 (7.4%) | 10 (38.5%) |
| 70 to 74 Years | 5 (18.5%) | 4 (15.4%) |
| 75 to 79 Years | 0 (0.0%) | 0 (0.0%) |
| 80 to 84 Years | 0 (0.0%) | 0 (0.0%) |
| 85 Years and over | 0 (0.0%) | 0 (0.0%) |
| Total | 27 (100.0%) | 26 (100.0%) |
Families and Households in Courtenay
Median Family Size in Courtenay
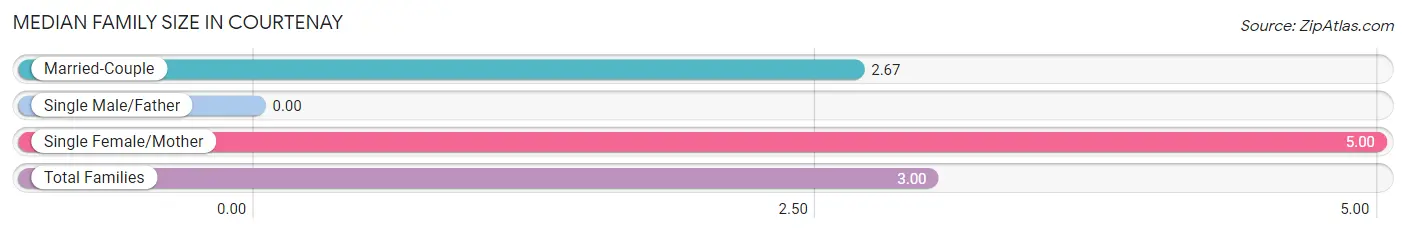
| Family Type | # Families | Family Size |
| Married-Couple | 12 (85.7%) | 2.67 |
| Single Male/Father | 0 (0.0%) | - |
| Single Female/Mother | 2 (14.3%) | 5.00 |
| Total Families | 14 (100.0%) | 3.00 |
Median Household Size in Courtenay
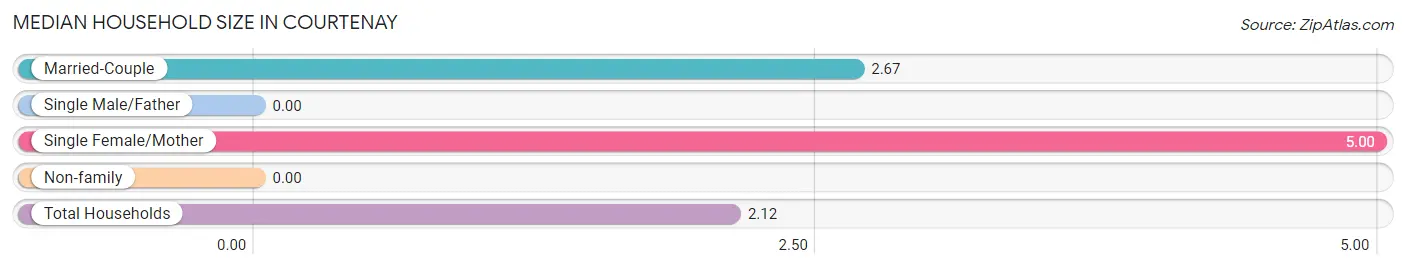
| Household Type | # Households | Household Size |
| Married-Couple | 12 (48.0%) | 2.67 |
| Single Male/Father | 0 (0.0%) | - |
| Single Female/Mother | 2 (8.0%) | 5.00 |
| Non-family | 11 (44.0%) | - |
| Total Households | 25 (100.0%) | 2.12 |
Household Size by Marriage Status in Courtenay
Out of a total of 25 households in Courtenay, 14 (56.0%) are family households, while 11 (44.0%) are nonfamily households. The most numerous type of family households are 2-person households, comprising 10, and the most common type of nonfamily households are 1-person households, comprising 11.
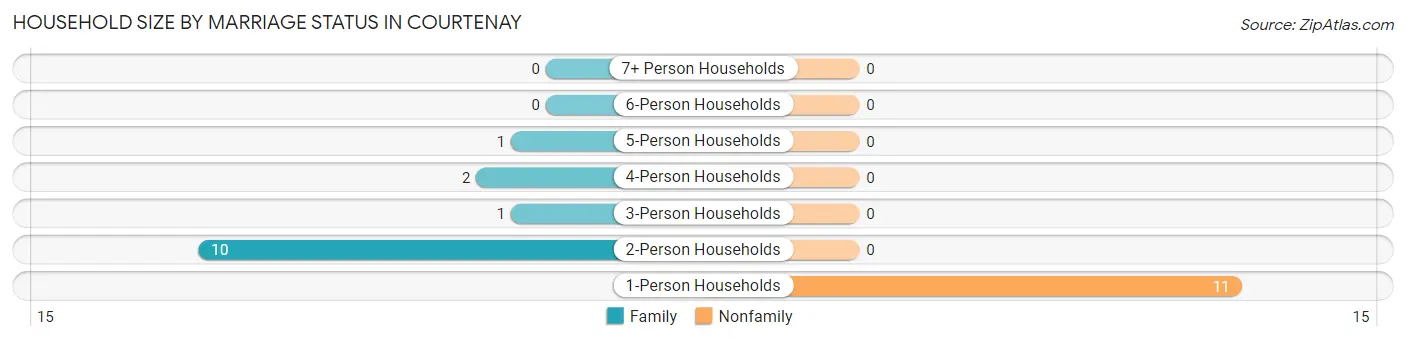
| Household Size | Family Households | Nonfamily Households |
| 1-Person Households | - | 11 (44.0%) |
| 2-Person Households | 10 (40.0%) | 0 (0.0%) |
| 3-Person Households | 1 (4.0%) | 0 (0.0%) |
| 4-Person Households | 2 (8.0%) | 0 (0.0%) |
| 5-Person Households | 1 (4.0%) | 0 (0.0%) |
| 6-Person Households | 0 (0.0%) | 0 (0.0%) |
| 7+ Person Households | 0 (0.0%) | 0 (0.0%) |
| Total | 14 (56.0%) | 11 (44.0%) |
Female Fertility in Courtenay
Fertility by Age in Courtenay
| Age Bracket | Women with Births | Births / 1,000 Women |
| 15 to 19 years | 0 (0.0%) | 0.0 |
| 20 to 34 years | 0 (0.0%) | 0.0 |
| 35 to 50 years | 0 (0.0%) | 0.0 |
| Total | 0 (0.0%) | 0.0 |
Fertility by Age by Marriage Status in Courtenay
| Age Bracket | Married | Unmarried |
| 15 to 19 years | 0 (0.0%) | 0 (0.0%) |
| 20 to 34 years | 0 (0.0%) | 0 (0.0%) |
| 35 to 50 years | 0 (0.0%) | 0 (0.0%) |
| Total | 0 (0.0%) | 0 (0.0%) |
Fertility by Education in Courtenay
| Educational Attainment | Women with Births | Births / 1,000 Women |
| Less than High School | 0 (0.0%) | 0.0 |
| High School Diploma | 0 (0.0%) | 0.0 |
| College or Associate's Degree | 0 (0.0%) | 0.0 |
| Bachelor's Degree | 0 (0.0%) | 0.0 |
| Graduate Degree | 0 (0.0%) | 0.0 |
| Total | 0 (0.0%) | 0.0 |
Fertility by Education by Marriage Status in Courtenay
| Educational Attainment | Married | Unmarried |
| Less than High School | 0 (0.0%) | 0 (0.0%) |
| High School Diploma | 0 (0.0%) | 0 (0.0%) |
| College or Associate's Degree | 0 (0.0%) | 0 (0.0%) |
| Bachelor's Degree | 0 (0.0%) | 0 (0.0%) |
| Graduate Degree | 0 (0.0%) | 0 (0.0%) |
| Total | 0 (0.0%) | 0 (0.0%) |
Employment Characteristics in Courtenay
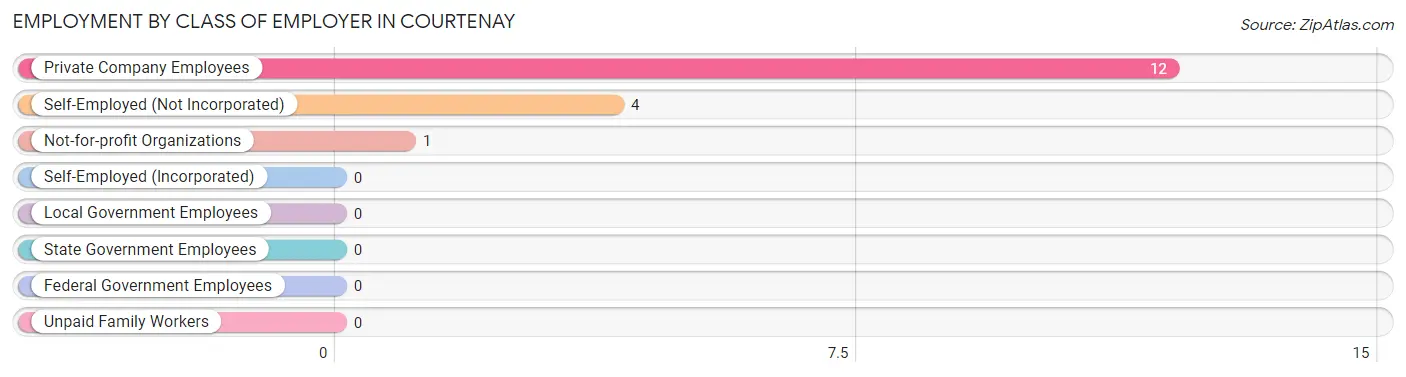
Employment by Class of Employer in Courtenay
Among the 17 employed individuals in Courtenay, private company employees (12 | 70.6%), self-employed (not incorporated) (4 | 23.5%), and not-for-profit organizations (1 | 5.9%) make up the most common classes of employment.
| Employer Class | # Employees | % Employees |
| Private Company Employees | 12 | 70.6% |
| Self-Employed (Incorporated) | 0 | 0.0% |
| Self-Employed (Not Incorporated) | 4 | 23.5% |
| Not-for-profit Organizations | 1 | 5.9% |
| Local Government Employees | 0 | 0.0% |
| State Government Employees | 0 | 0.0% |
| Federal Government Employees | 0 | 0.0% |
| Unpaid Family Workers | 0 | 0.0% |
| Total | 17 | 100.0% |
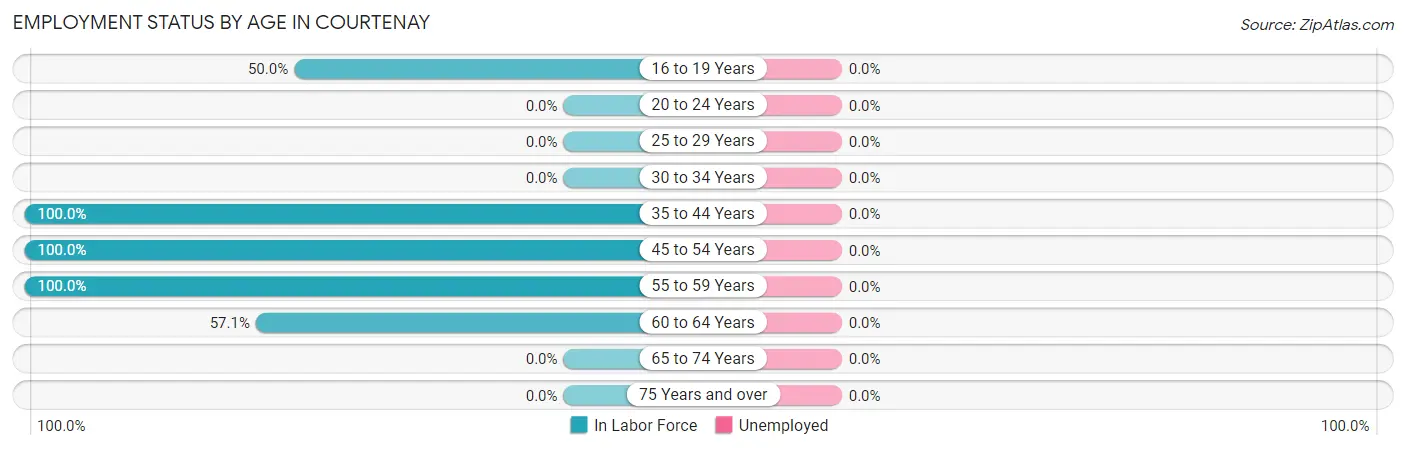
Employment Status by Age in Courtenay
| Age Bracket | In Labor Force | Unemployed |
| 16 to 19 Years | 1 (50.0%) | 0 (0.0%) |
| 20 to 24 Years | 0 (0.0%) | 0 (0.0%) |
| 25 to 29 Years | 0 (0.0%) | 0 (0.0%) |
| 30 to 34 Years | 0 (0.0%) | 0 (0.0%) |
| 35 to 44 Years | 2 (100.0%) | 0 (0.0%) |
| 45 to 54 Years | 6 (100.0%) | 0 (0.0%) |
| 55 to 59 Years | 4 (100.0%) | 0 (0.0%) |
| 60 to 64 Years | 4 (57.1%) | 0 (0.0%) |
| 65 to 74 Years | 0 (0.0%) | 0 (0.0%) |
| 75 Years and over | 0 (0.0%) | 0 (0.0%) |
| Total | 17 (38.6%) | 0 (0.0%) |
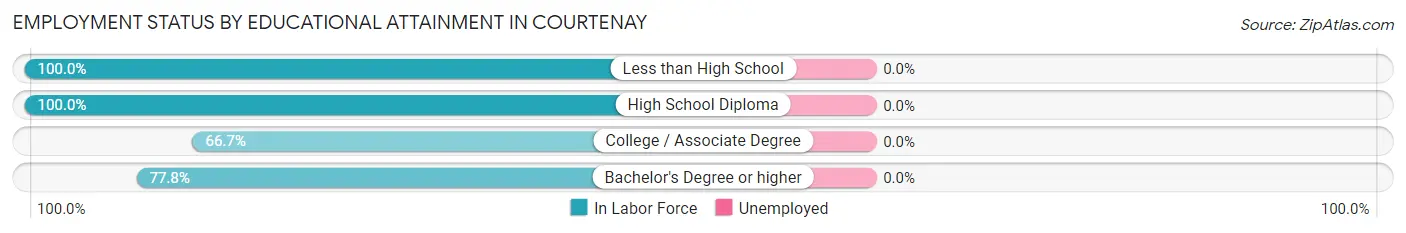
Employment Status by Educational Attainment in Courtenay
| Educational Attainment | In Labor Force | Unemployed |
| Less than High School | 3 (100.0%) | 0 (0.0%) |
| High School Diploma | 4 (100.0%) | 0 (0.0%) |
| College / Associate Degree | 2 (66.7%) | 0 (0.0%) |
| Bachelor's Degree or higher | 7 (77.8%) | 0 (0.0%) |
| Total | 16 (84.2%) | 0 (0.0%) |
Employment Occupations by Sex in Courtenay
Management, Business, Science and Arts Occupations
The most common Management, Business, Science and Arts occupations in Courtenay are , and Management (4 | 23.5%).
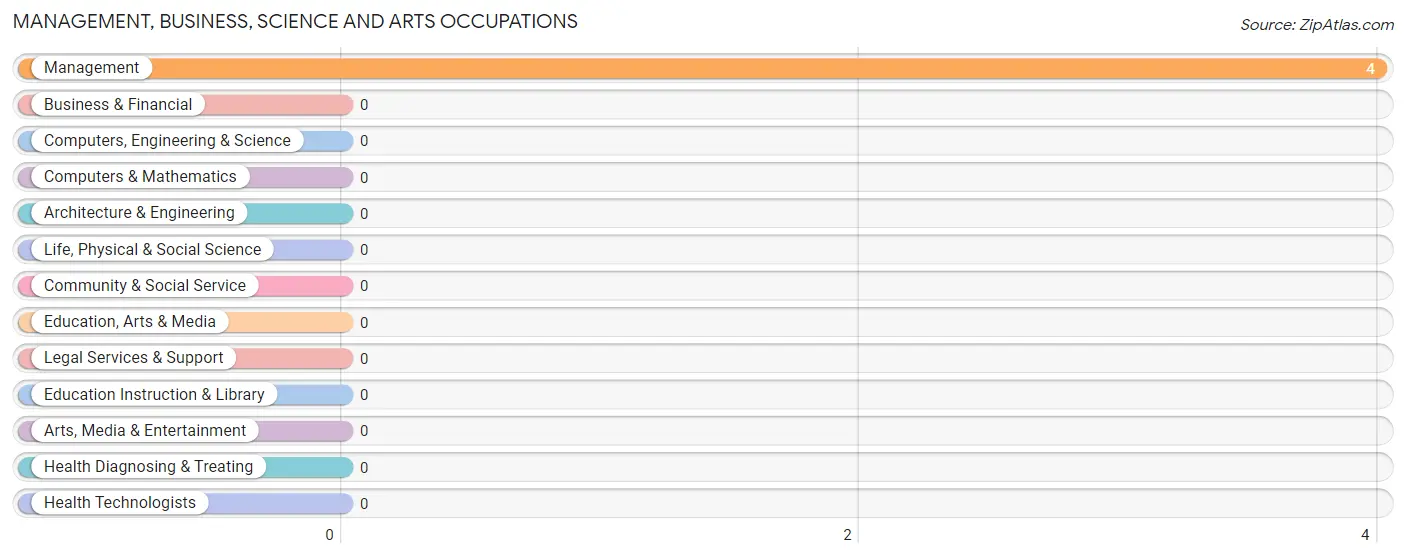
Management, Business, Science and Arts Occupations by Sex
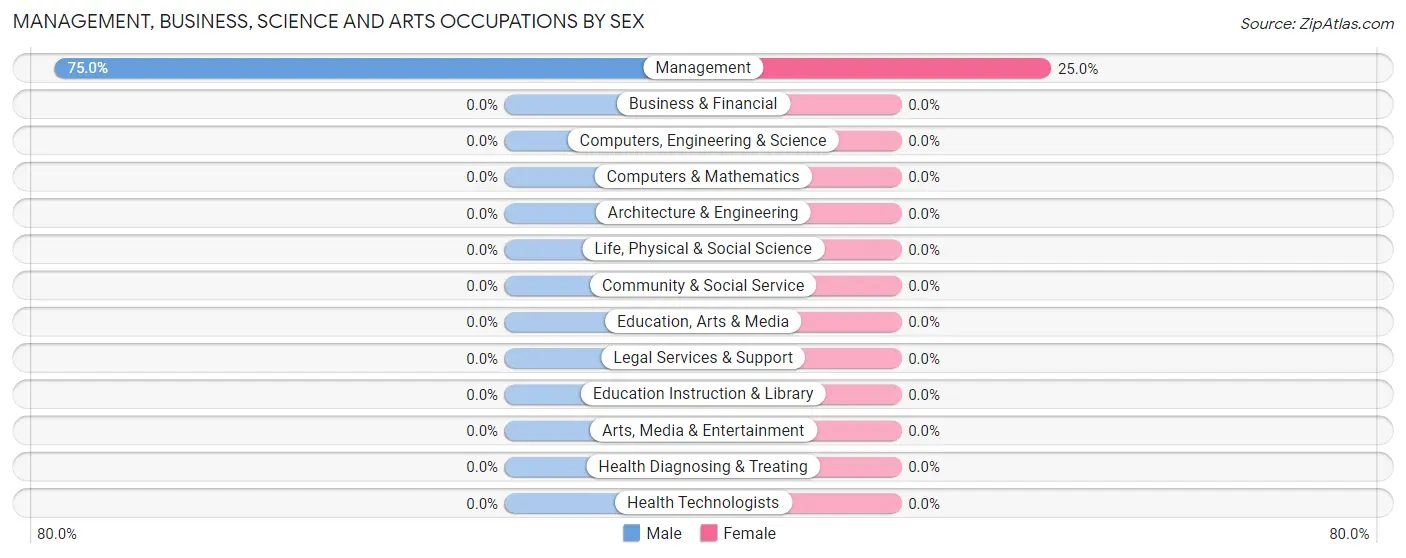
| Occupation | Male | Female |
| Management | 3 (75.0%) | 1 (25.0%) |
| Business & Financial | 0 (0.0%) | 0 (0.0%) |
| Computers, Engineering & Science | 0 (0.0%) | 0 (0.0%) |
| Computers & Mathematics | 0 (0.0%) | 0 (0.0%) |
| Architecture & Engineering | 0 (0.0%) | 0 (0.0%) |
| Life, Physical & Social Science | 0 (0.0%) | 0 (0.0%) |
| Community & Social Service | 0 (0.0%) | 0 (0.0%) |
| Education, Arts & Media | 0 (0.0%) | 0 (0.0%) |
| Legal Services & Support | 0 (0.0%) | 0 (0.0%) |
| Education Instruction & Library | 0 (0.0%) | 0 (0.0%) |
| Arts, Media & Entertainment | 0 (0.0%) | 0 (0.0%) |
| Health Diagnosing & Treating | 0 (0.0%) | 0 (0.0%) |
| Health Technologists | 0 (0.0%) | 0 (0.0%) |
| Total (Category) | 3 (75.0%) | 1 (25.0%) |
| Total (Overall) | 12 (70.6%) | 5 (29.4%) |
Services Occupations
The most common Services occupations in Courtenay are , and Personal Care & Service (4 | 23.5%).
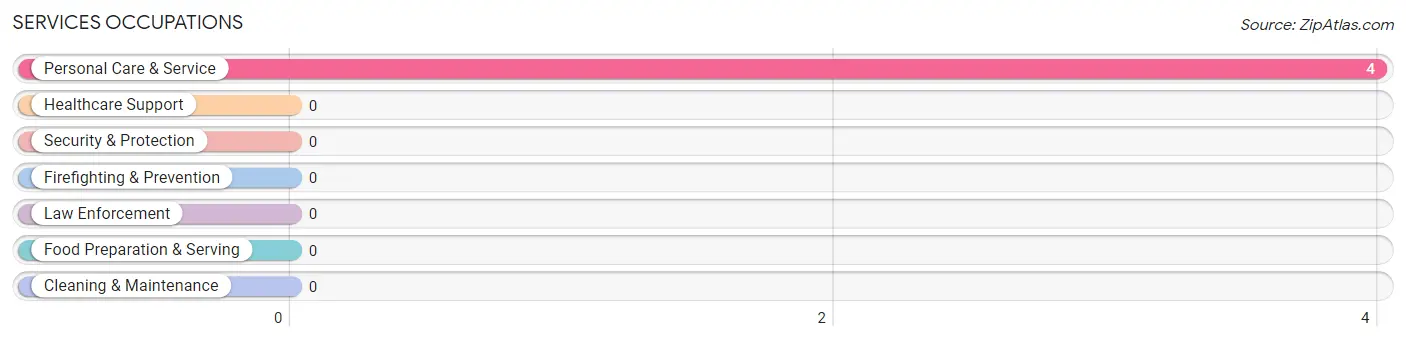
Services Occupations by Sex
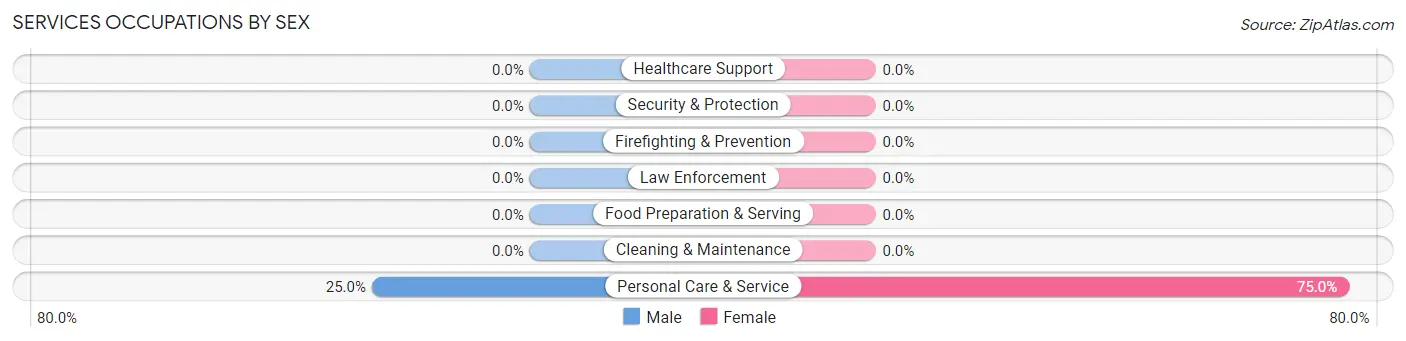
| Occupation | Male | Female |
| Healthcare Support | 0 (0.0%) | 0 (0.0%) |
| Security & Protection | 0 (0.0%) | 0 (0.0%) |
| Firefighting & Prevention | 0 (0.0%) | 0 (0.0%) |
| Law Enforcement | 0 (0.0%) | 0 (0.0%) |
| Food Preparation & Serving | 0 (0.0%) | 0 (0.0%) |
| Cleaning & Maintenance | 0 (0.0%) | 0 (0.0%) |
| Personal Care & Service | 1 (25.0%) | 3 (75.0%) |
| Total (Category) | 1 (25.0%) | 3 (75.0%) |
| Total (Overall) | 12 (70.6%) | 5 (29.4%) |
Sales and Office Occupations
The most common Sales and Office occupations in Courtenay are , and Sales & Related (1 | 5.9%).
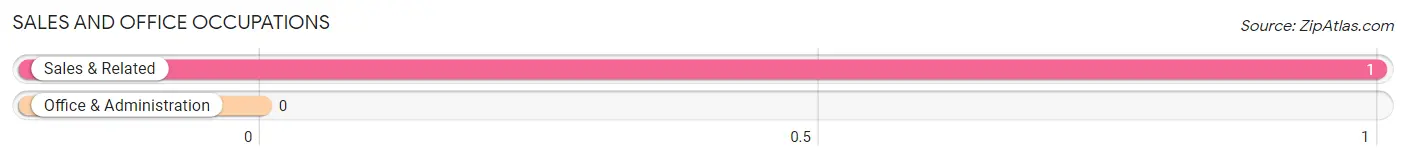
Sales and Office Occupations by Sex
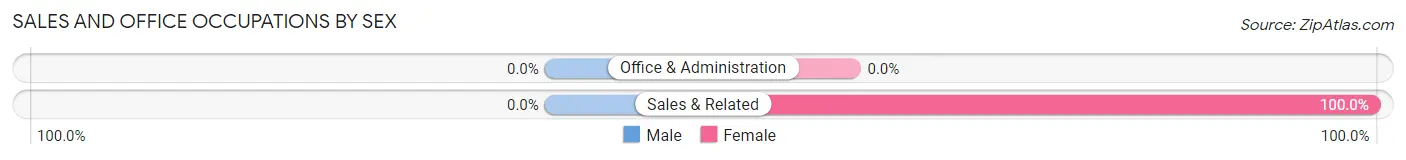
| Occupation | Male | Female |
| Sales & Related | 0 (0.0%) | 1 (100.0%) |
| Office & Administration | 0 (0.0%) | 0 (0.0%) |
| Total (Category) | 0 (0.0%) | 1 (100.0%) |
| Total (Overall) | 12 (70.6%) | 5 (29.4%) |
Natural Resources, Construction and Maintenance Occupations
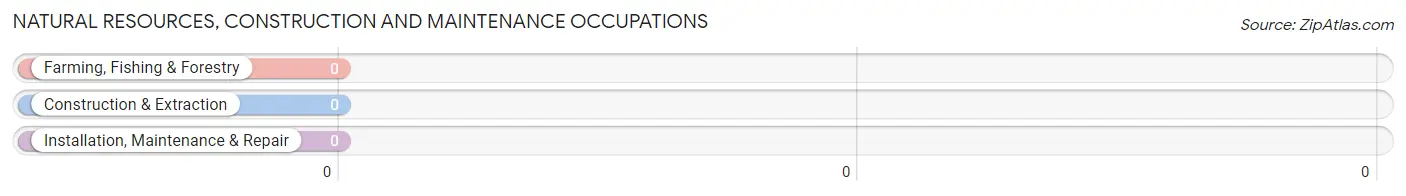
Natural Resources, Construction and Maintenance Occupations by Sex
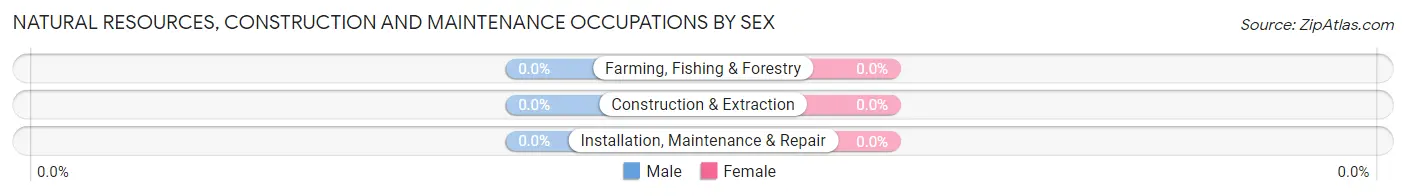
| Occupation | Male | Female |
| Farming, Fishing & Forestry | 0 (0.0%) | 0 (0.0%) |
| Construction & Extraction | 0 (0.0%) | 0 (0.0%) |
| Installation, Maintenance & Repair | 0 (0.0%) | 0 (0.0%) |
| Total (Category) | 0 (0.0%) | 0 (0.0%) |
| Total (Overall) | 12 (70.6%) | 5 (29.4%) |
Production, Transportation and Moving Occupations
The most common Production, Transportation and Moving occupations in Courtenay are Transportation (4 | 23.5%), Material Moving (3 | 17.6%), and Production (1 | 5.9%).
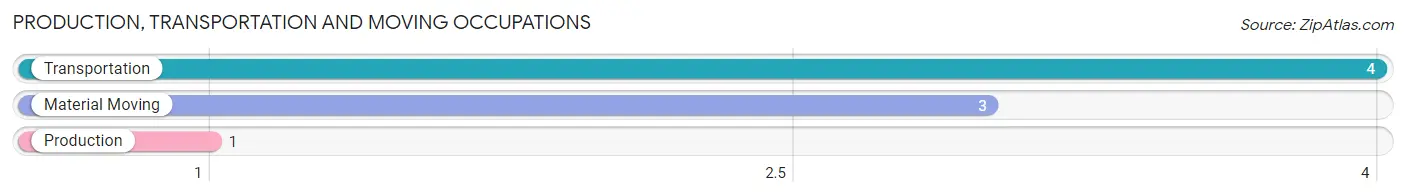
Production, Transportation and Moving Occupations by Sex
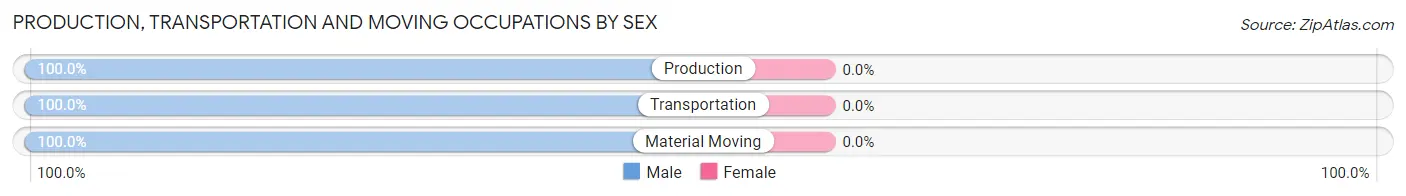
| Occupation | Male | Female |
| Production | 1 (100.0%) | 0 (0.0%) |
| Transportation | 4 (100.0%) | 0 (0.0%) |
| Material Moving | 3 (100.0%) | 0 (0.0%) |
| Total (Category) | 8 (100.0%) | 0 (0.0%) |
| Total (Overall) | 12 (70.6%) | 5 (29.4%) |
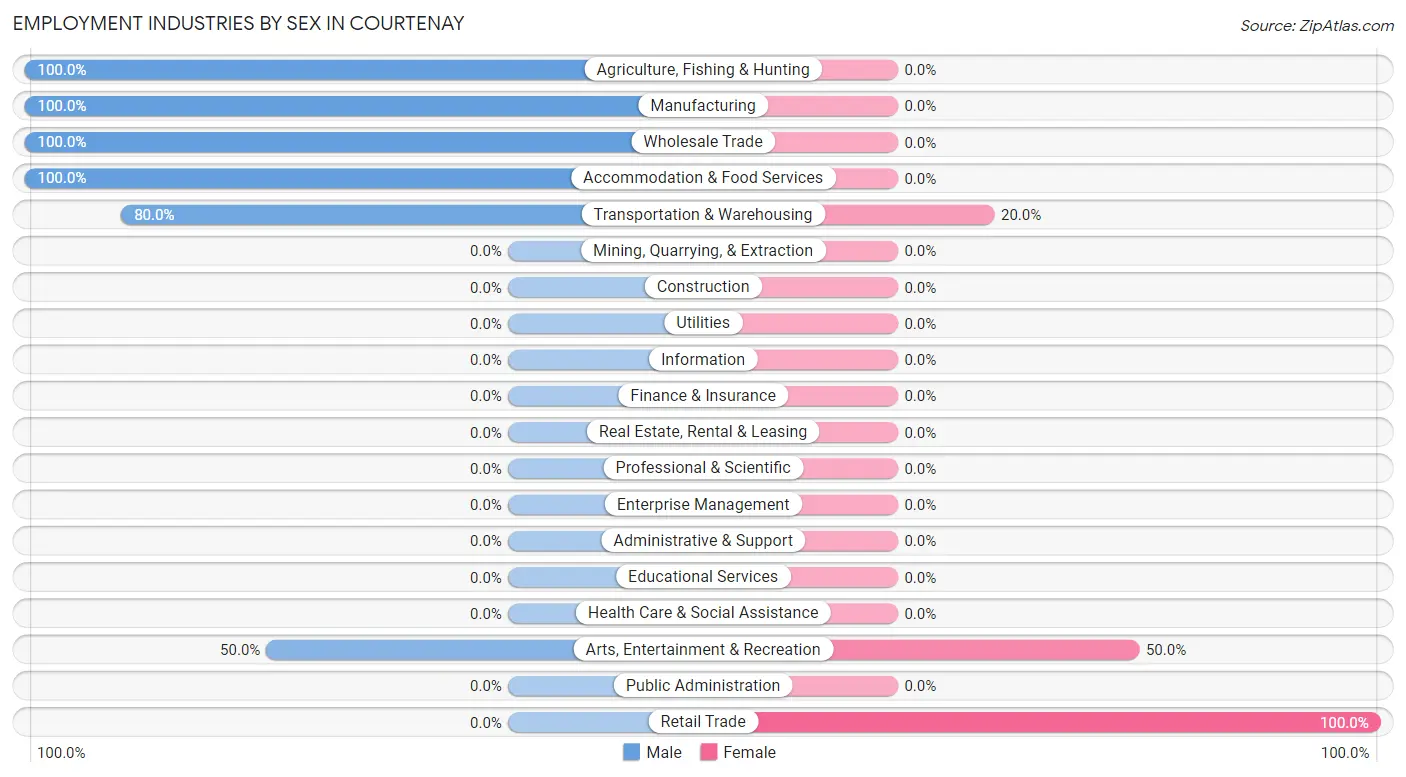
Employment Industries by Sex in Courtenay
Employment Industries in Courtenay
The major employment industries in Courtenay include Transportation & Warehousing (5 | 29.4%), Wholesale Trade (3 | 17.6%), Agriculture, Fishing & Hunting (2 | 11.8%), Arts, Entertainment & Recreation (2 | 11.8%), and Manufacturing (1 | 5.9%).
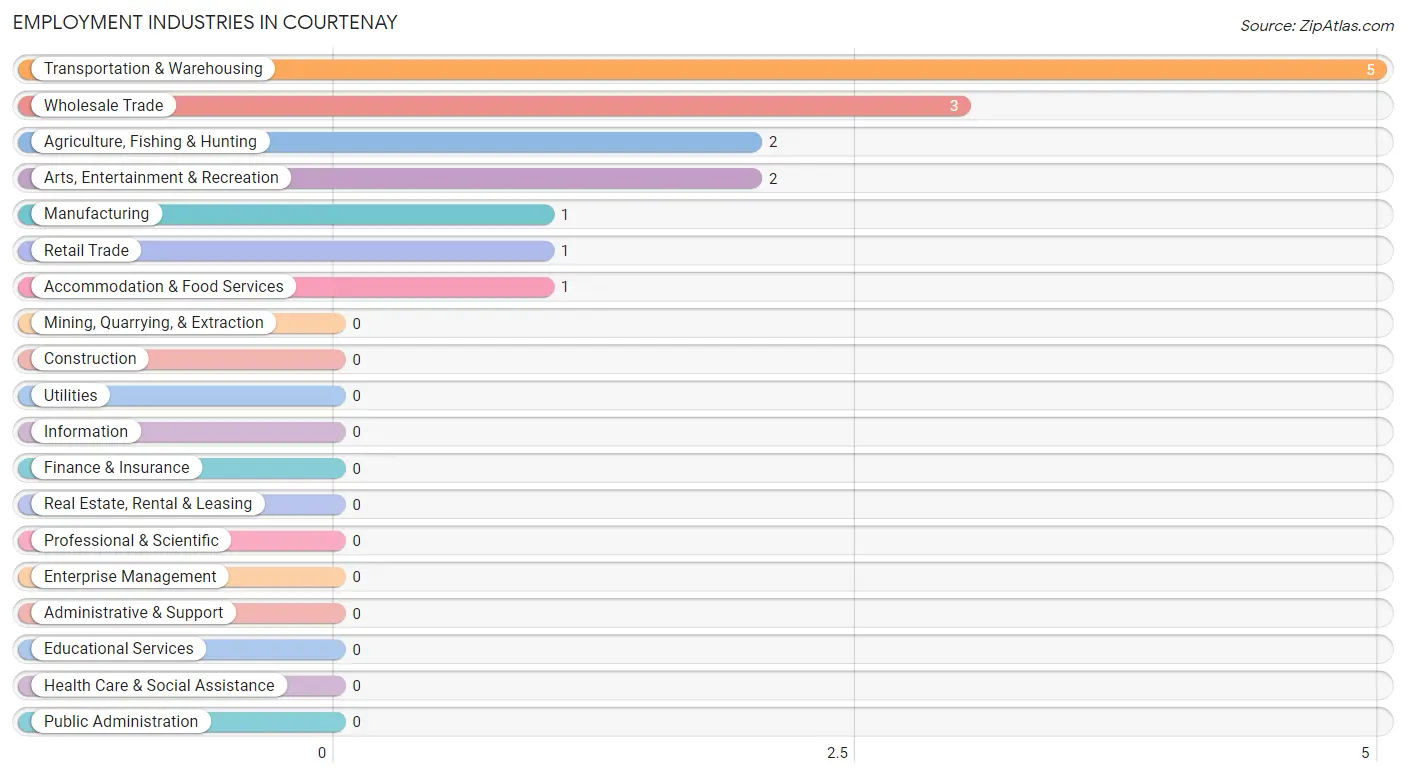
Employment Industries by Sex in Courtenay
The Courtenay industries that see more men than women are Agriculture, Fishing & Hunting (100.0%), Manufacturing (100.0%), and Wholesale Trade (100.0%), whereas the industries that tend to have a higher number of women are Retail Trade (100.0%), Arts, Entertainment & Recreation (50.0%), and Transportation & Warehousing (20.0%).
| Industry | Male | Female |
| Agriculture, Fishing & Hunting | 2 (100.0%) | 0 (0.0%) |
| Mining, Quarrying, & Extraction | 0 (0.0%) | 0 (0.0%) |
| Construction | 0 (0.0%) | 0 (0.0%) |
| Manufacturing | 1 (100.0%) | 0 (0.0%) |
| Wholesale Trade | 3 (100.0%) | 0 (0.0%) |
| Retail Trade | 0 (0.0%) | 1 (100.0%) |
| Transportation & Warehousing | 4 (80.0%) | 1 (20.0%) |
| Utilities | 0 (0.0%) | 0 (0.0%) |
| Information | 0 (0.0%) | 0 (0.0%) |
| Finance & Insurance | 0 (0.0%) | 0 (0.0%) |
| Real Estate, Rental & Leasing | 0 (0.0%) | 0 (0.0%) |
| Professional & Scientific | 0 (0.0%) | 0 (0.0%) |
| Enterprise Management | 0 (0.0%) | 0 (0.0%) |
| Administrative & Support | 0 (0.0%) | 0 (0.0%) |
| Educational Services | 0 (0.0%) | 0 (0.0%) |
| Health Care & Social Assistance | 0 (0.0%) | 0 (0.0%) |
| Arts, Entertainment & Recreation | 1 (50.0%) | 1 (50.0%) |
| Accommodation & Food Services | 1 (100.0%) | 0 (0.0%) |
| Public Administration | 0 (0.0%) | 0 (0.0%) |
| Total | 12 (70.6%) | 5 (29.4%) |
Education in Courtenay
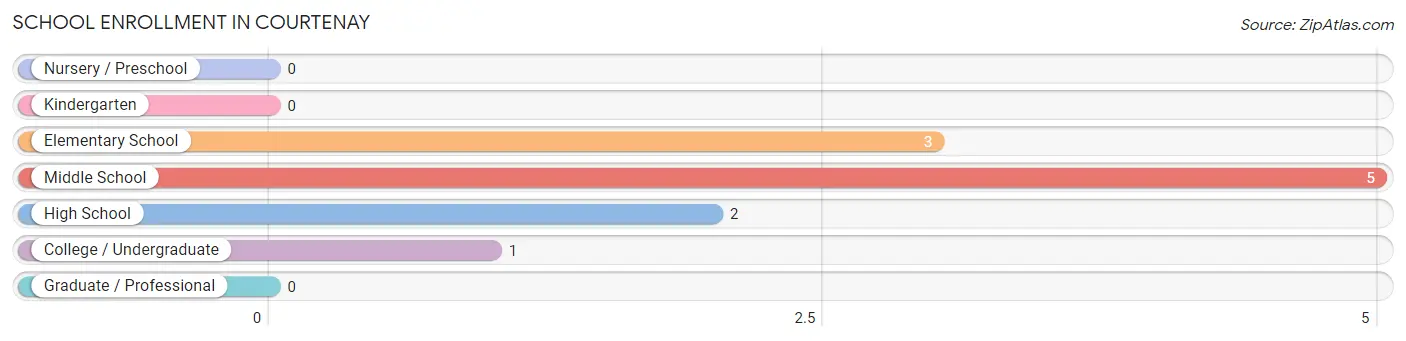
School Enrollment in Courtenay
The most common levels of schooling among the 11 students in Courtenay are middle school (5 | 45.5%), elementary school (3 | 27.3%), and high school (2 | 18.2%).
| School Level | # Students | % Students |
| Nursery / Preschool | 0 | 0.0% |
| Kindergarten | 0 | 0.0% |
| Elementary School | 3 | 27.3% |
| Middle School | 5 | 45.5% |
| High School | 2 | 18.2% |
| College / Undergraduate | 1 | 9.1% |
| Graduate / Professional | 0 | 0.0% |
| Total | 11 | 100.0% |
School Enrollment by Age by Funding Source in Courtenay
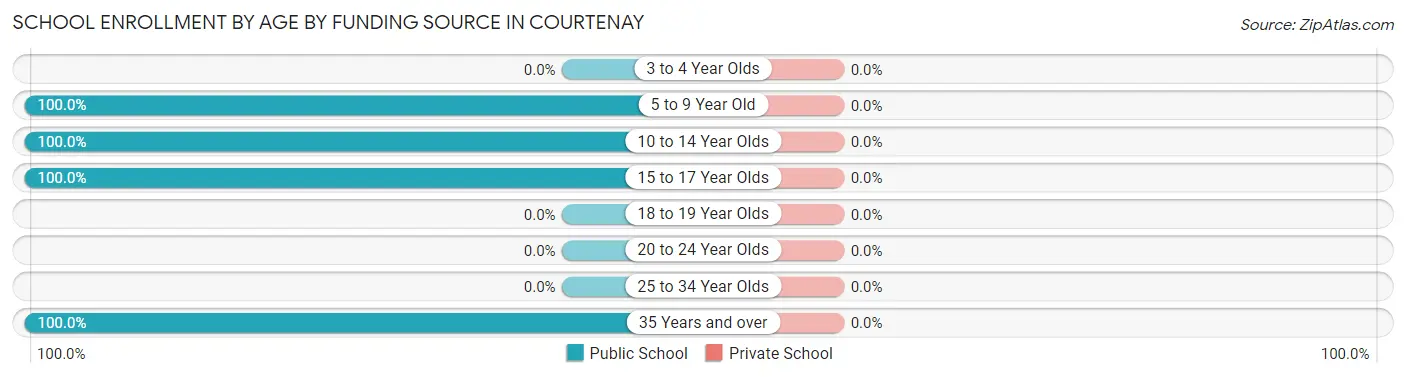
| Age Bracket | Public School | Private School |
| 3 to 4 Year Olds | 0 (0.0%) | 0 (0.0%) |
| 5 to 9 Year Old | 3 (100.0%) | 0 (0.0%) |
| 10 to 14 Year Olds | 6 (100.0%) | 0 (0.0%) |
| 15 to 17 Year Olds | 1 (100.0%) | 0 (0.0%) |
| 18 to 19 Year Olds | 0 (0.0%) | 0 (0.0%) |
| 20 to 24 Year Olds | 0 (0.0%) | 0 (0.0%) |
| 25 to 34 Year Olds | 0 (0.0%) | 0 (0.0%) |
| 35 Years and over | 1 (100.0%) | 0 (0.0%) |
| Total | 11 (100.0%) | 0 (0.0%) |
Educational Attainment by Field of Study in Courtenay
Science & technology (8 | 42.1%), education (6 | 31.6%), bio, nature & agricultural (2 | 10.5%), physical & health sciences (2 | 10.5%), and business (1 | 5.3%) are the most common fields of study among 19 individuals in Courtenay who have obtained a bachelor's degree or higher.
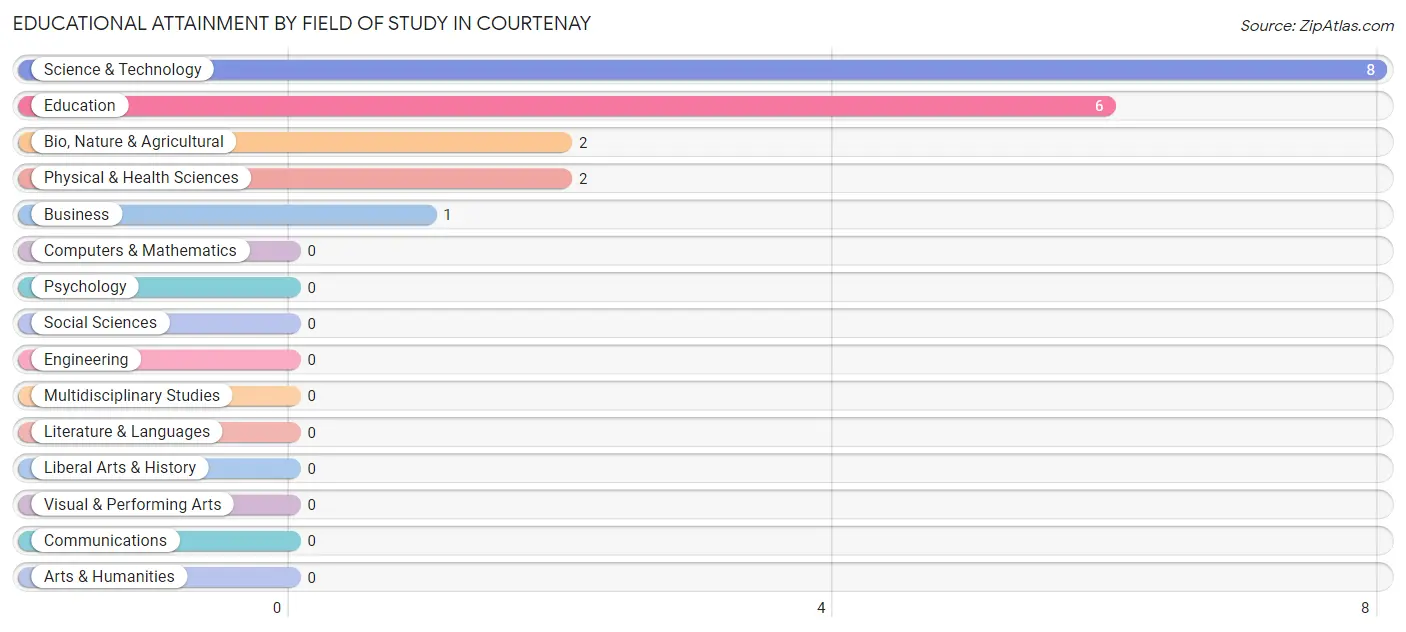
| Field of Study | # Graduates | % Graduates |
| Computers & Mathematics | 0 | 0.0% |
| Bio, Nature & Agricultural | 2 | 10.5% |
| Physical & Health Sciences | 2 | 10.5% |
| Psychology | 0 | 0.0% |
| Social Sciences | 0 | 0.0% |
| Engineering | 0 | 0.0% |
| Multidisciplinary Studies | 0 | 0.0% |
| Science & Technology | 8 | 42.1% |
| Business | 1 | 5.3% |
| Education | 6 | 31.6% |
| Literature & Languages | 0 | 0.0% |
| Liberal Arts & History | 0 | 0.0% |
| Visual & Performing Arts | 0 | 0.0% |
| Communications | 0 | 0.0% |
| Arts & Humanities | 0 | 0.0% |
| Total | 19 | 100.0% |
Transportation & Commute in Courtenay
Vehicle Availability by Sex in Courtenay
The most prevalent vehicle ownership categories in Courtenay are males with 1 vehicle (7, accounting for 58.3%) and females with 1 vehicle (2, making up 140.0%).
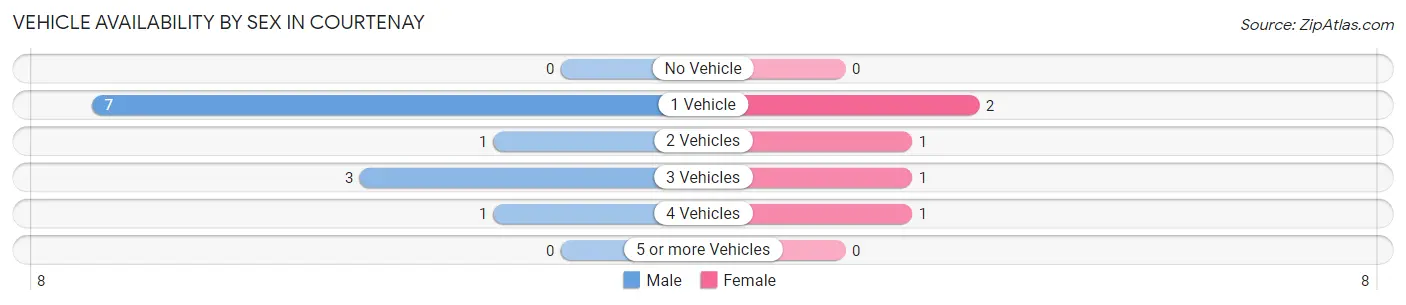
| Vehicles Available | Male | Female |
| No Vehicle | 0 (0.0%) | 0 (0.0%) |
| 1 Vehicle | 7 (58.3%) | 2 (40.0%) |
| 2 Vehicles | 1 (8.3%) | 1 (20.0%) |
| 3 Vehicles | 3 (25.0%) | 1 (20.0%) |
| 4 Vehicles | 1 (8.3%) | 1 (20.0%) |
| 5 or more Vehicles | 0 (0.0%) | 0 (0.0%) |
| Total | 12 (100.0%) | 5 (100.0%) |
Commute Time in Courtenay
The most frequently occuring commute durations in Courtenay are 40 to 44 minutes (5 commuters, 29.4%), 5 to 9 minutes (3 commuters, 17.6%), and 35 to 39 minutes (3 commuters, 17.6%).
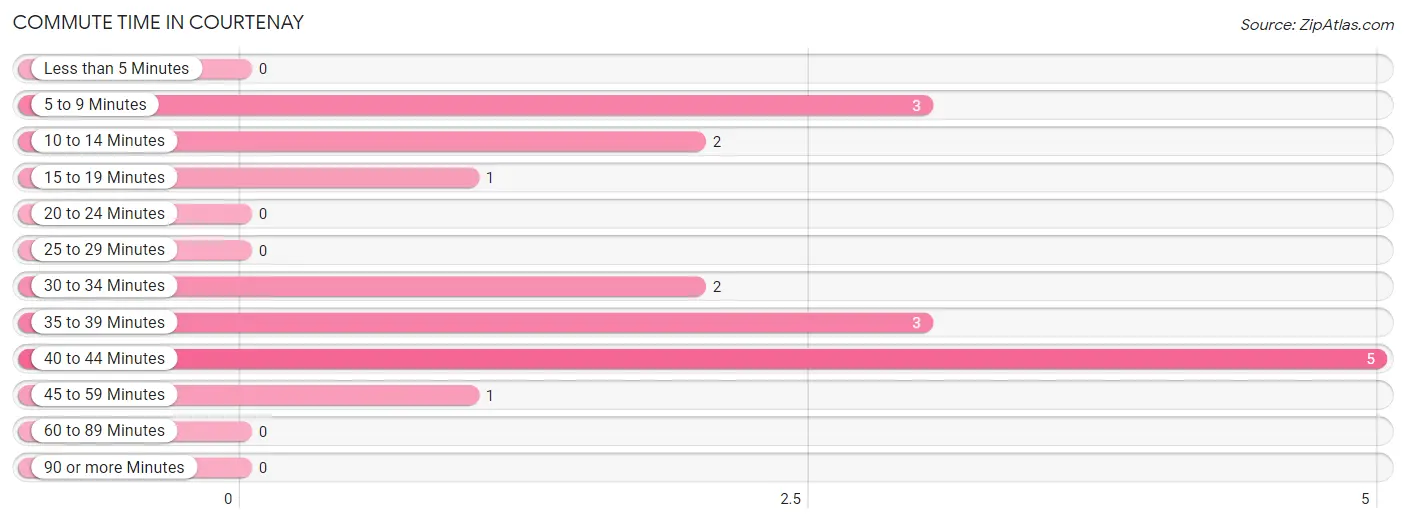
| Commute Time | # Commuters | % Commuters |
| Less than 5 Minutes | 0 | 0.0% |
| 5 to 9 Minutes | 3 | 17.6% |
| 10 to 14 Minutes | 2 | 11.8% |
| 15 to 19 Minutes | 1 | 5.9% |
| 20 to 24 Minutes | 0 | 0.0% |
| 25 to 29 Minutes | 0 | 0.0% |
| 30 to 34 Minutes | 2 | 11.8% |
| 35 to 39 Minutes | 3 | 17.6% |
| 40 to 44 Minutes | 5 | 29.4% |
| 45 to 59 Minutes | 1 | 5.9% |
| 60 to 89 Minutes | 0 | 0.0% |
| 90 or more Minutes | 0 | 0.0% |
Commute Time by Sex in Courtenay
The most common commute times in Courtenay are 40 to 44 minutes (5 commuters, 41.7%) for males and 35 to 39 minutes (3 commuters, 60.0%) for females.
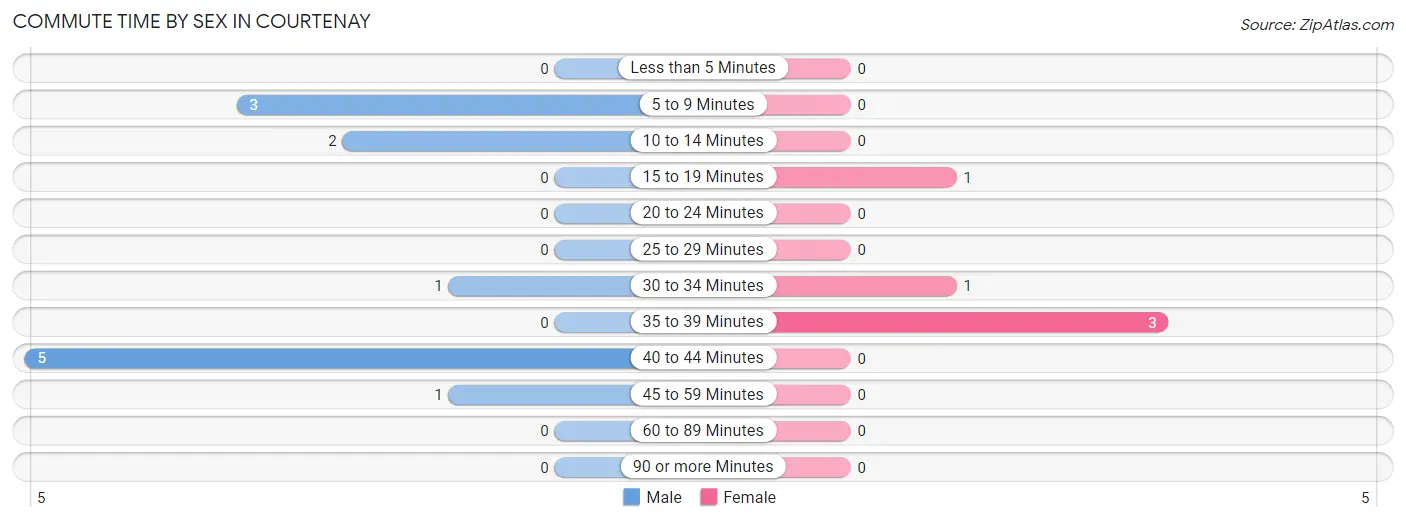
| Commute Time | Male | Female |
| Less than 5 Minutes | 0 (0.0%) | 0 (0.0%) |
| 5 to 9 Minutes | 3 (25.0%) | 0 (0.0%) |
| 10 to 14 Minutes | 2 (16.7%) | 0 (0.0%) |
| 15 to 19 Minutes | 0 (0.0%) | 1 (20.0%) |
| 20 to 24 Minutes | 0 (0.0%) | 0 (0.0%) |
| 25 to 29 Minutes | 0 (0.0%) | 0 (0.0%) |
| 30 to 34 Minutes | 1 (8.3%) | 1 (20.0%) |
| 35 to 39 Minutes | 0 (0.0%) | 3 (60.0%) |
| 40 to 44 Minutes | 5 (41.7%) | 0 (0.0%) |
| 45 to 59 Minutes | 1 (8.3%) | 0 (0.0%) |
| 60 to 89 Minutes | 0 (0.0%) | 0 (0.0%) |
| 90 or more Minutes | 0 (0.0%) | 0 (0.0%) |
Time of Departure to Work by Sex in Courtenay
The most frequent times of departure to work in Courtenay are 8:30 AM to 8:59 AM (4, 33.3%) for males and 8:00 AM to 8:29 AM (2, 40.0%) for females.
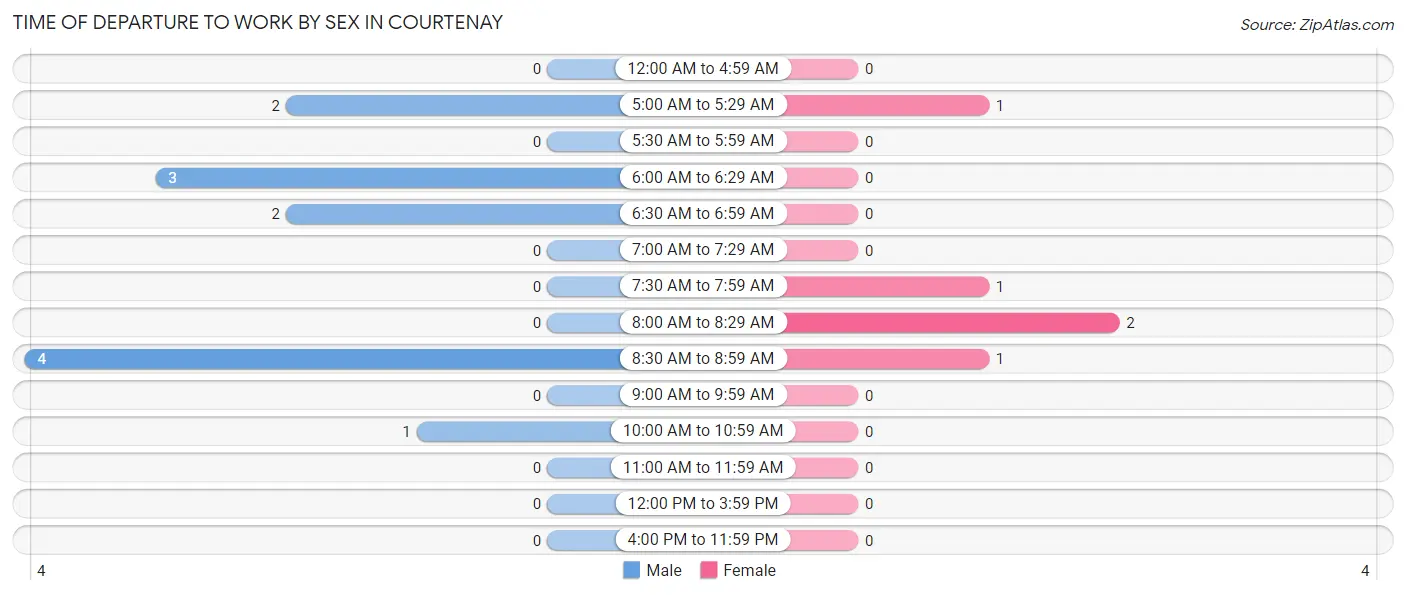
| Time of Departure | Male | Female |
| 12:00 AM to 4:59 AM | 0 (0.0%) | 0 (0.0%) |
| 5:00 AM to 5:29 AM | 2 (16.7%) | 1 (20.0%) |
| 5:30 AM to 5:59 AM | 0 (0.0%) | 0 (0.0%) |
| 6:00 AM to 6:29 AM | 3 (25.0%) | 0 (0.0%) |
| 6:30 AM to 6:59 AM | 2 (16.7%) | 0 (0.0%) |
| 7:00 AM to 7:29 AM | 0 (0.0%) | 0 (0.0%) |
| 7:30 AM to 7:59 AM | 0 (0.0%) | 1 (20.0%) |
| 8:00 AM to 8:29 AM | 0 (0.0%) | 2 (40.0%) |
| 8:30 AM to 8:59 AM | 4 (33.3%) | 1 (20.0%) |
| 9:00 AM to 9:59 AM | 0 (0.0%) | 0 (0.0%) |
| 10:00 AM to 10:59 AM | 1 (8.3%) | 0 (0.0%) |
| 11:00 AM to 11:59 AM | 0 (0.0%) | 0 (0.0%) |
| 12:00 PM to 3:59 PM | 0 (0.0%) | 0 (0.0%) |
| 4:00 PM to 11:59 PM | 0 (0.0%) | 0 (0.0%) |
| Total | 12 (100.0%) | 5 (100.0%) |
Housing Occupancy in Courtenay
Occupancy by Ownership in Courtenay
Of the total 25 dwellings in Courtenay, owner-occupied units account for 25 (100.0%), while renter-occupied units make up 0 (0.0%).
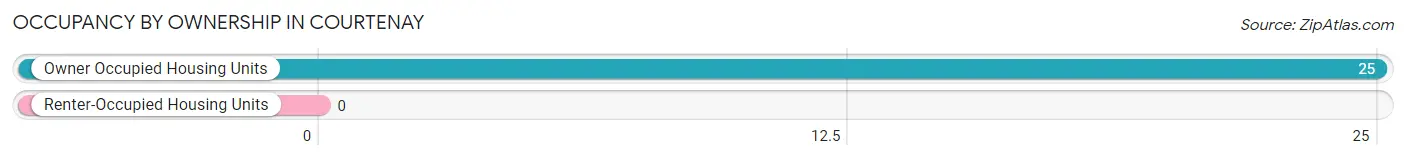
| Occupancy | # Housing Units | % Housing Units |
| Owner Occupied Housing Units | 25 | 100.0% |
| Renter-Occupied Housing Units | 0 | 0.0% |
| Total Occupied Housing Units | 25 | 100.0% |
Occupancy by Household Size in Courtenay
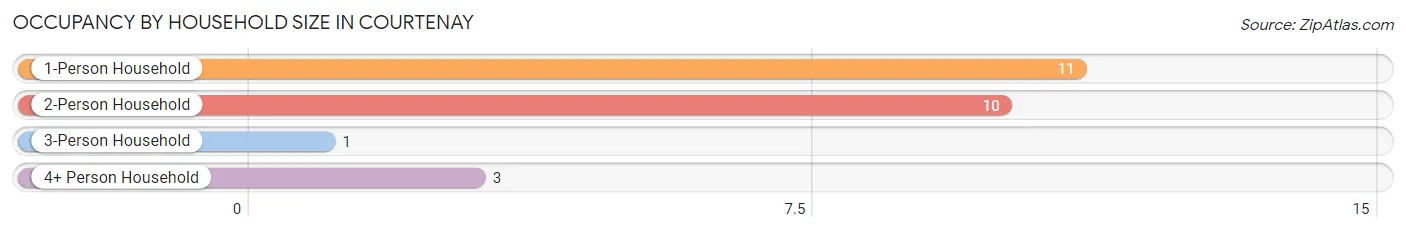
| Household Size | # Housing Units | % Housing Units |
| 1-Person Household | 11 | 44.0% |
| 2-Person Household | 10 | 40.0% |
| 3-Person Household | 1 | 4.0% |
| 4+ Person Household | 3 | 12.0% |
| Total Housing Units | 25 | 100.0% |
Occupancy by Ownership by Household Size in Courtenay
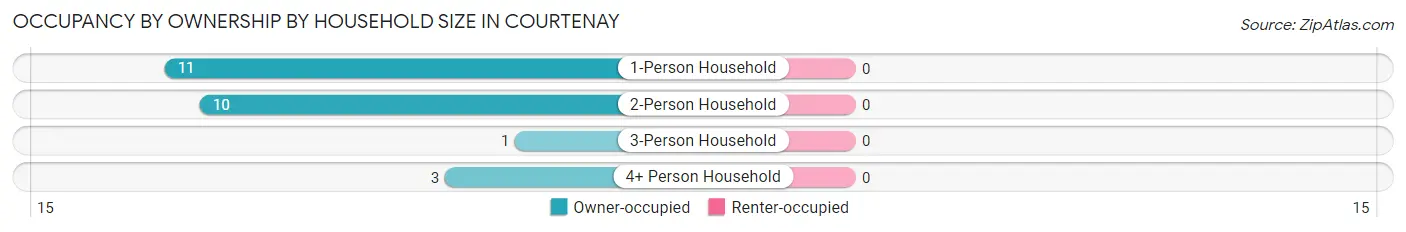
| Household Size | Owner-occupied | Renter-occupied |
| 1-Person Household | 11 (100.0%) | 0 (0.0%) |
| 2-Person Household | 10 (100.0%) | 0 (0.0%) |
| 3-Person Household | 1 (100.0%) | 0 (0.0%) |
| 4+ Person Household | 3 (100.0%) | 0 (0.0%) |
| Total Housing Units | 25 (100.0%) | 0 (0.0%) |
Occupancy by Educational Attainment in Courtenay
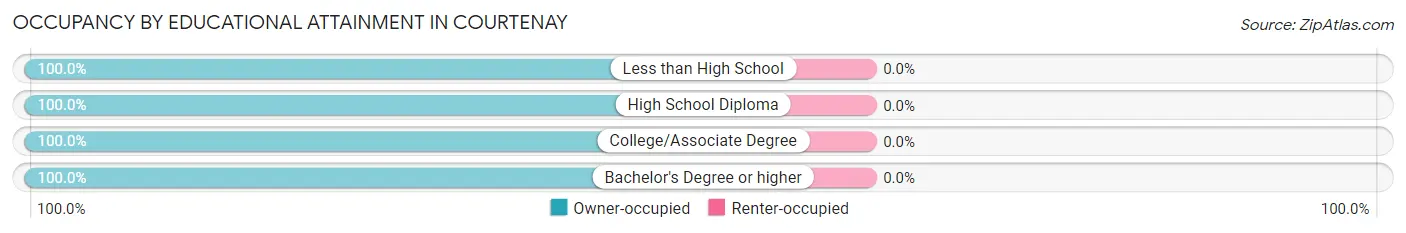
| Household Size | Owner-occupied | Renter-occupied |
| Less than High School | 8 (100.0%) | 0 (0.0%) |
| High School Diploma | 7 (100.0%) | 0 (0.0%) |
| College/Associate Degree | 2 (100.0%) | 0 (0.0%) |
| Bachelor's Degree or higher | 8 (100.0%) | 0 (0.0%) |
Occupancy by Age of Householder in Courtenay
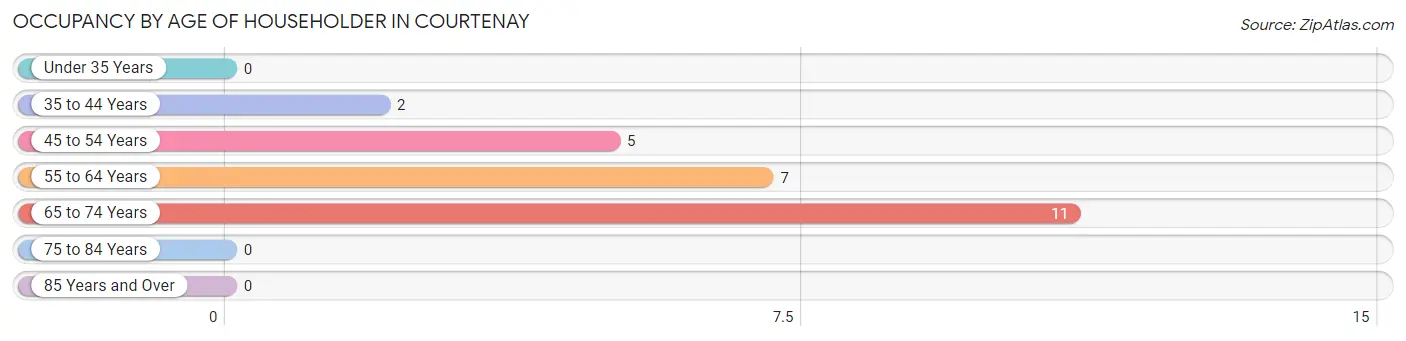
| Age Bracket | # Households | % Households |
| Under 35 Years | 0 | 0.0% |
| 35 to 44 Years | 2 | 8.0% |
| 45 to 54 Years | 5 | 20.0% |
| 55 to 64 Years | 7 | 28.0% |
| 65 to 74 Years | 11 | 44.0% |
| 75 to 84 Years | 0 | 0.0% |
| 85 Years and Over | 0 | 0.0% |
| Total | 25 | 100.0% |
Housing Finances in Courtenay
Median Income by Occupancy in Courtenay
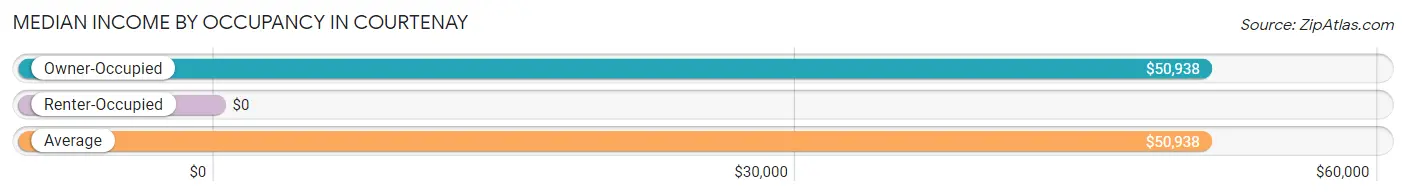
| Occupancy Type | # Households | Median Income |
| Owner-Occupied | 25 (100.0%) | $50,938 |
| Renter-Occupied | 0 (0.0%) | $0 |
| Average | 25 (100.0%) | $50,938 |
Occupancy by Householder Income Bracket in Courtenay
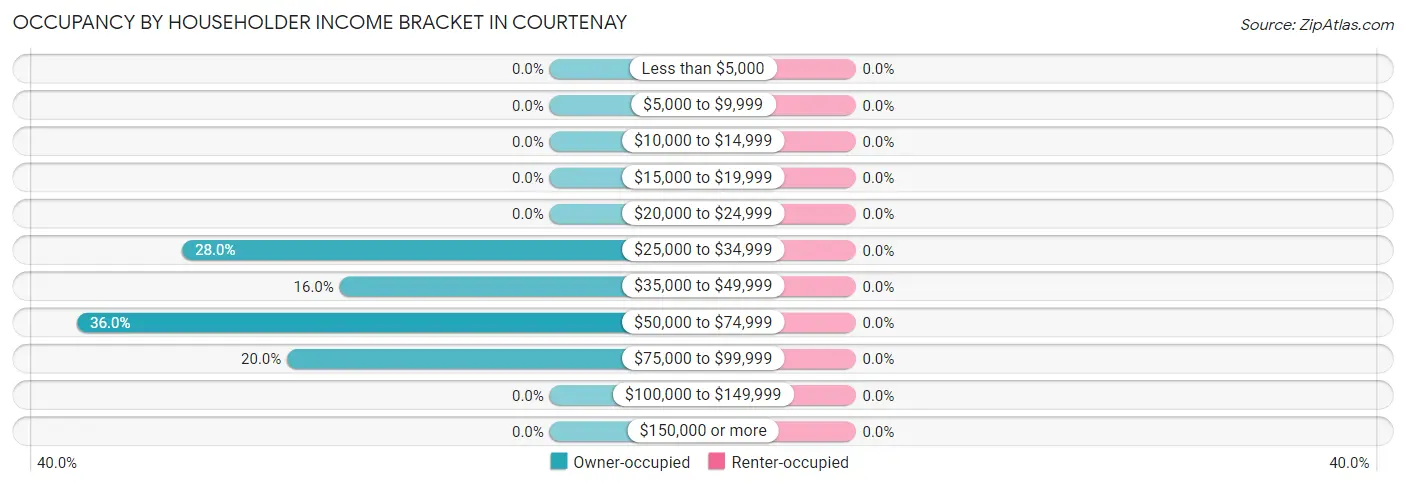
| Income Bracket | Owner-occupied | Renter-occupied |
| Less than $5,000 | 0 (0.0%) | 0 (0.0%) |
| $5,000 to $9,999 | 0 (0.0%) | 0 (0.0%) |
| $10,000 to $14,999 | 0 (0.0%) | 0 (0.0%) |
| $15,000 to $19,999 | 0 (0.0%) | 0 (0.0%) |
| $20,000 to $24,999 | 0 (0.0%) | 0 (0.0%) |
| $25,000 to $34,999 | 7 (28.0%) | 0 (0.0%) |
| $35,000 to $49,999 | 4 (16.0%) | 0 (0.0%) |
| $50,000 to $74,999 | 9 (36.0%) | 0 (0.0%) |
| $75,000 to $99,999 | 5 (20.0%) | 0 (0.0%) |
| $100,000 to $149,999 | 0 (0.0%) | 0 (0.0%) |
| $150,000 or more | 0 (0.0%) | 0 (0.0%) |
| Total | 25 (100.0%) | 0 (0.0%) |
Monthly Housing Cost Tiers in Courtenay
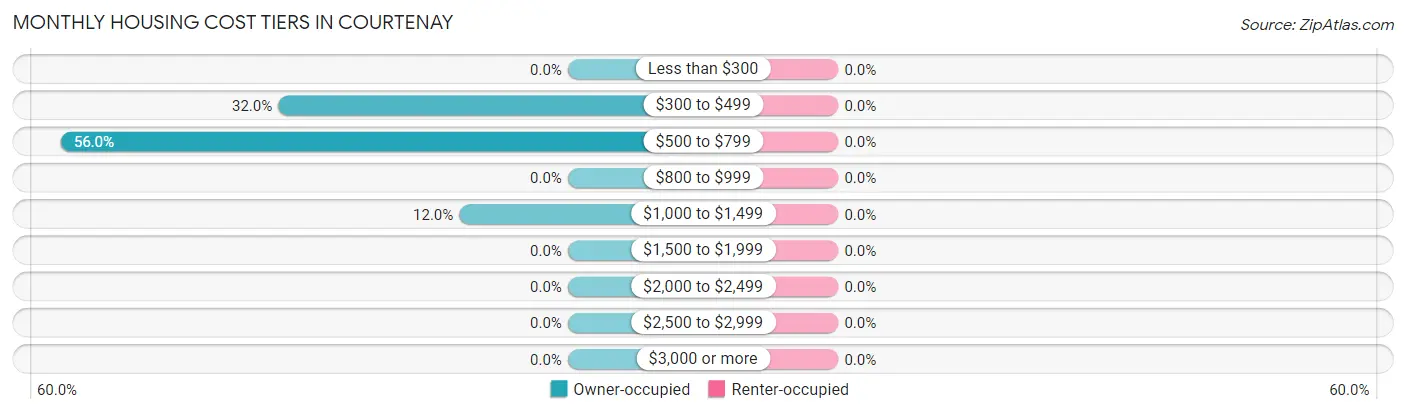
| Monthly Cost | Owner-occupied | Renter-occupied |
| Less than $300 | 0 (0.0%) | 0 (0.0%) |
| $300 to $499 | 8 (32.0%) | 0 (0.0%) |
| $500 to $799 | 14 (56.0%) | 0 (0.0%) |
| $800 to $999 | 0 (0.0%) | 0 (0.0%) |
| $1,000 to $1,499 | 3 (12.0%) | 0 (0.0%) |
| $1,500 to $1,999 | 0 (0.0%) | 0 (0.0%) |
| $2,000 to $2,499 | 0 (0.0%) | 0 (0.0%) |
| $2,500 to $2,999 | 0 (0.0%) | 0 (0.0%) |
| $3,000 or more | 0 (0.0%) | 0 (0.0%) |
| Total | 25 (100.0%) | 0 (0.0%) |
Physical Housing Characteristics in Courtenay
Housing Structures in Courtenay
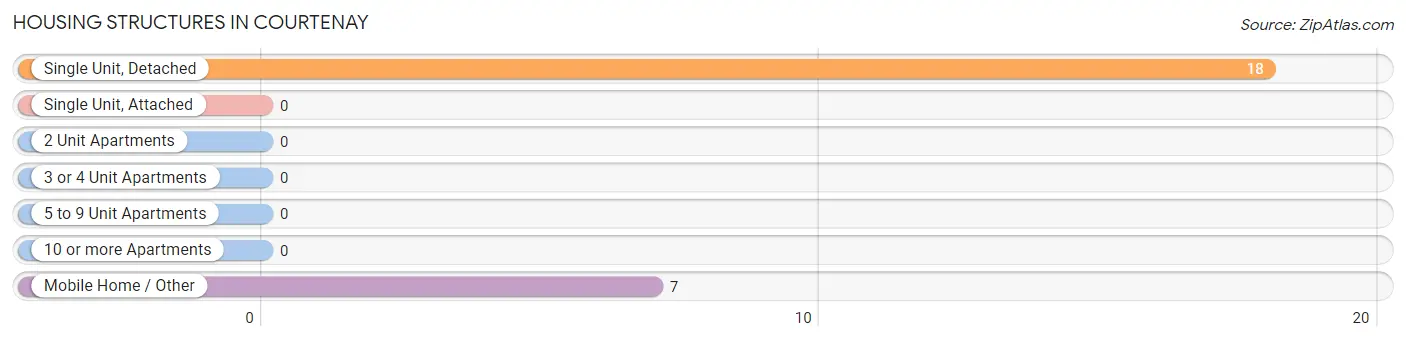
| Structure Type | # Housing Units | % Housing Units |
| Single Unit, Detached | 18 | 72.0% |
| Single Unit, Attached | 0 | 0.0% |
| 2 Unit Apartments | 0 | 0.0% |
| 3 or 4 Unit Apartments | 0 | 0.0% |
| 5 to 9 Unit Apartments | 0 | 0.0% |
| 10 or more Apartments | 0 | 0.0% |
| Mobile Home / Other | 7 | 28.0% |
| Total | 25 | 100.0% |
Housing Structures by Occupancy in Courtenay
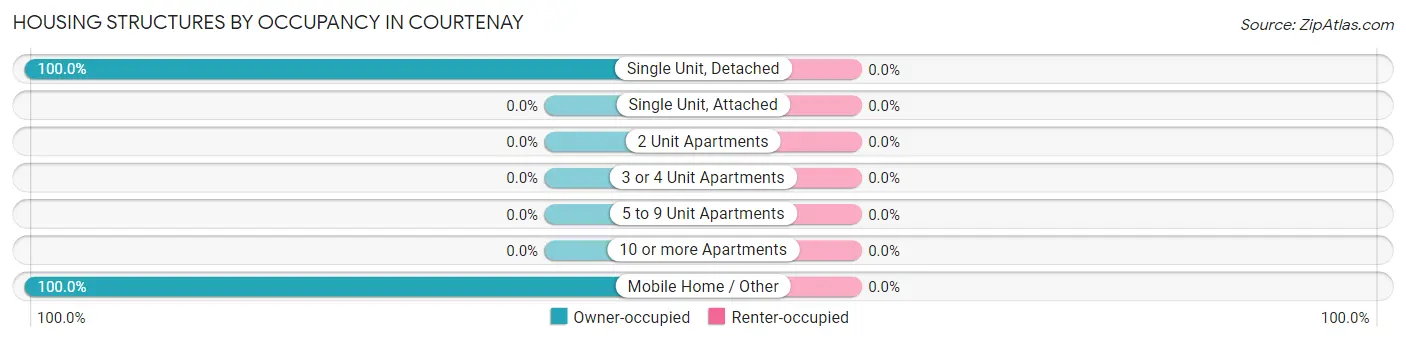
| Structure Type | Owner-occupied | Renter-occupied |
| Single Unit, Detached | 18 (100.0%) | 0 (0.0%) |
| Single Unit, Attached | 0 (0.0%) | 0 (0.0%) |
| 2 Unit Apartments | 0 (0.0%) | 0 (0.0%) |
| 3 or 4 Unit Apartments | 0 (0.0%) | 0 (0.0%) |
| 5 to 9 Unit Apartments | 0 (0.0%) | 0 (0.0%) |
| 10 or more Apartments | 0 (0.0%) | 0 (0.0%) |
| Mobile Home / Other | 7 (100.0%) | 0 (0.0%) |
| Total | 25 (100.0%) | 0 (0.0%) |
Housing Structures by Number of Rooms in Courtenay
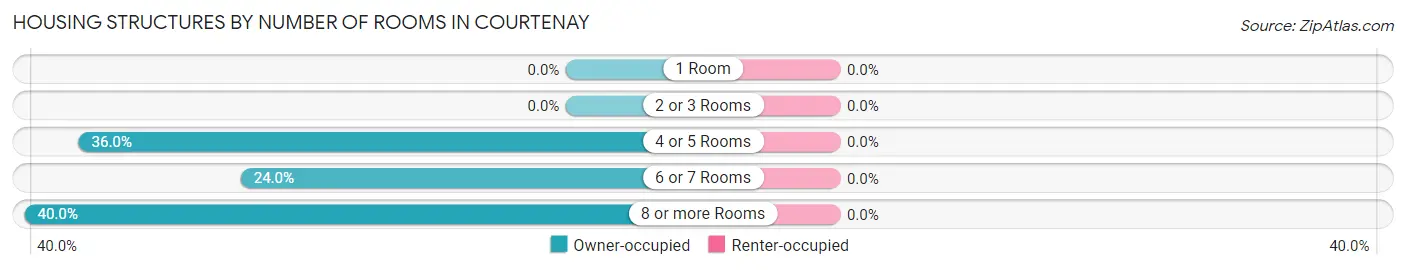
| Number of Rooms | Owner-occupied | Renter-occupied |
| 1 Room | 0 (0.0%) | 0 (0.0%) |
| 2 or 3 Rooms | 0 (0.0%) | 0 (0.0%) |
| 4 or 5 Rooms | 9 (36.0%) | 0 (0.0%) |
| 6 or 7 Rooms | 6 (24.0%) | 0 (0.0%) |
| 8 or more Rooms | 10 (40.0%) | 0 (0.0%) |
| Total | 25 (100.0%) | 0 (0.0%) |
Housing Structure by Heating Type in Courtenay
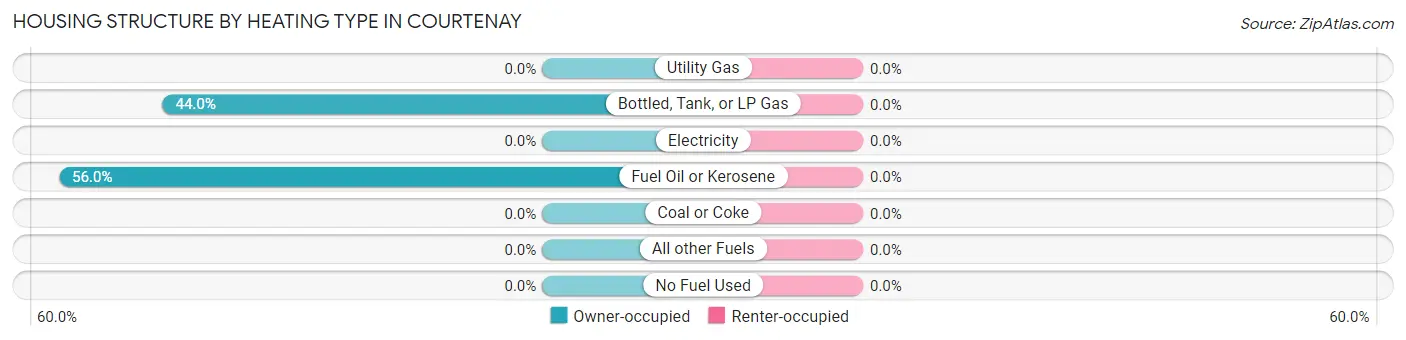
| Heating Type | Owner-occupied | Renter-occupied |
| Utility Gas | 0 (0.0%) | 0 (0.0%) |
| Bottled, Tank, or LP Gas | 11 (44.0%) | 0 (0.0%) |
| Electricity | 0 (0.0%) | 0 (0.0%) |
| Fuel Oil or Kerosene | 14 (56.0%) | 0 (0.0%) |
| Coal or Coke | 0 (0.0%) | 0 (0.0%) |
| All other Fuels | 0 (0.0%) | 0 (0.0%) |
| No Fuel Used | 0 (0.0%) | 0 (0.0%) |
| Total | 25 (100.0%) | 0 (0.0%) |
Household Vehicle Usage in Courtenay
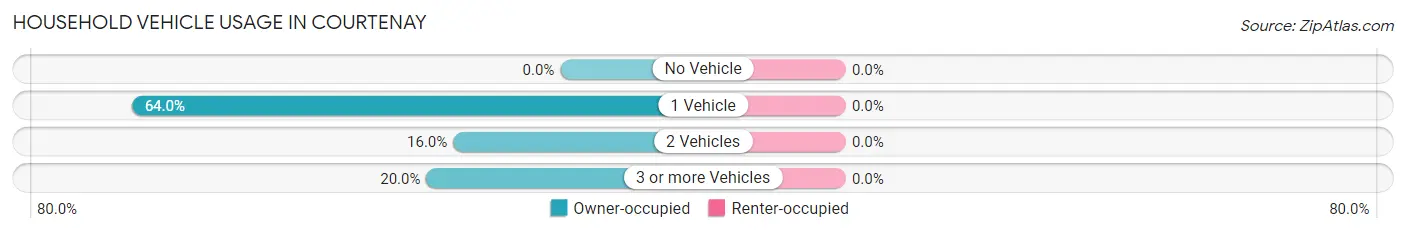
| Vehicles per Household | Owner-occupied | Renter-occupied |
| No Vehicle | 0 (0.0%) | 0 (0.0%) |
| 1 Vehicle | 16 (64.0%) | 0 (0.0%) |
| 2 Vehicles | 4 (16.0%) | 0 (0.0%) |
| 3 or more Vehicles | 5 (20.0%) | 0 (0.0%) |
| Total | 25 (100.0%) | 0 (0.0%) |
Real Estate & Mortgages in Courtenay
Real Estate and Mortgage Overview in Courtenay
| Characteristic | Without Mortgage | With Mortgage |
| Housing Units | 21 | 4 |
| Median Property Value | $134,400 | $0 |
| Median Household Income | $49,583 | $0 |
| Monthly Housing Costs | $563 | $0 |
| Real Estate Taxes | $771 | $0 |
Property Value by Mortgage Status in Courtenay
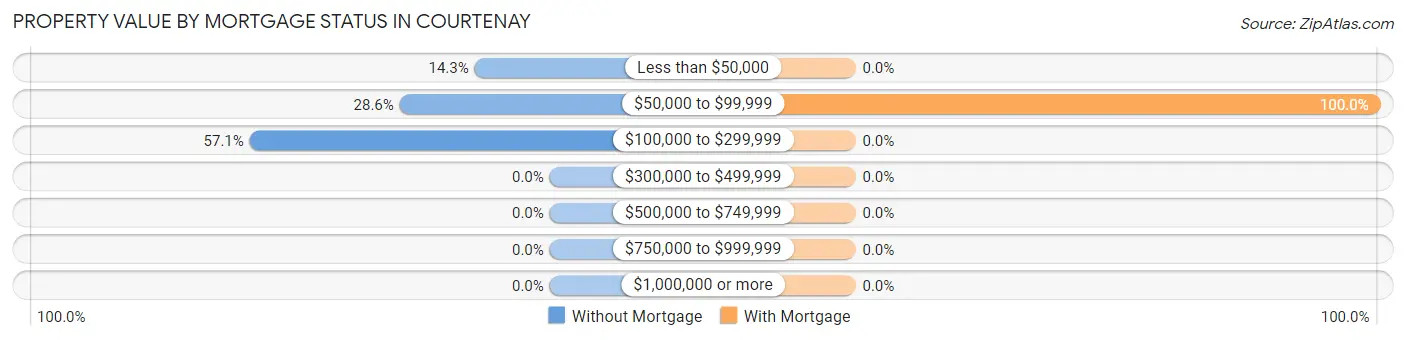
| Property Value | Without Mortgage | With Mortgage |
| Less than $50,000 | 3 (14.3%) | 0 (0.0%) |
| $50,000 to $99,999 | 6 (28.6%) | 4 (100.0%) |
| $100,000 to $299,999 | 12 (57.1%) | 0 (0.0%) |
| $300,000 to $499,999 | 0 (0.0%) | 0 (0.0%) |
| $500,000 to $749,999 | 0 (0.0%) | 0 (0.0%) |
| $750,000 to $999,999 | 0 (0.0%) | 0 (0.0%) |
| $1,000,000 or more | 0 (0.0%) | 0 (0.0%) |
| Total | 21 (100.0%) | 4 (100.0%) |
Household Income by Mortgage Status in Courtenay
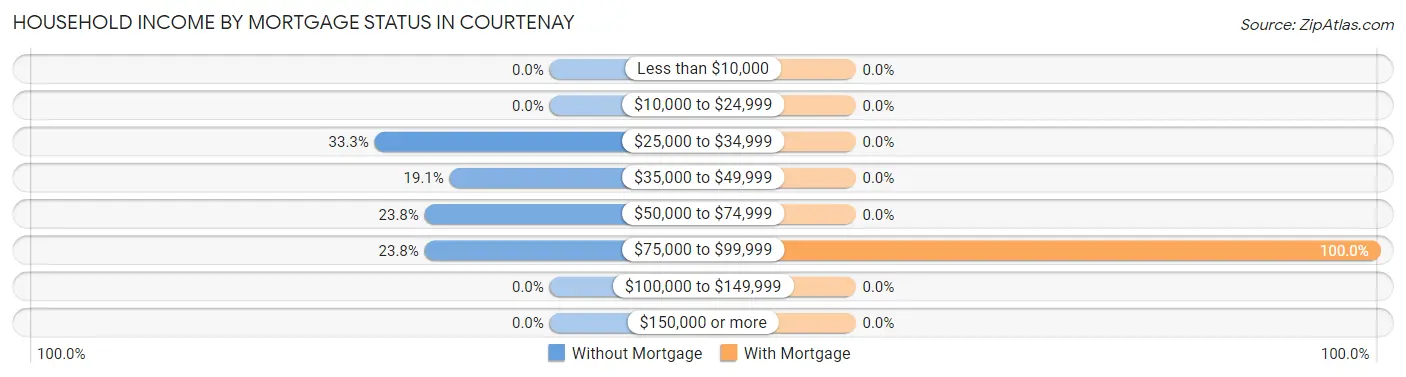
| Household Income | Without Mortgage | With Mortgage |
| Less than $10,000 | 0 (0.0%) | 0 (0.0%) |
| $10,000 to $24,999 | 0 (0.0%) | 0 (0.0%) |
| $25,000 to $34,999 | 7 (33.3%) | 0 (0.0%) |
| $35,000 to $49,999 | 4 (19.1%) | 0 (0.0%) |
| $50,000 to $74,999 | 5 (23.8%) | 0 (0.0%) |
| $75,000 to $99,999 | 5 (23.8%) | 4 (100.0%) |
| $100,000 to $149,999 | 0 (0.0%) | 0 (0.0%) |
| $150,000 or more | 0 (0.0%) | 0 (0.0%) |
| Total | 21 (100.0%) | 4 (100.0%) |
Property Value to Household Income Ratio in Courtenay
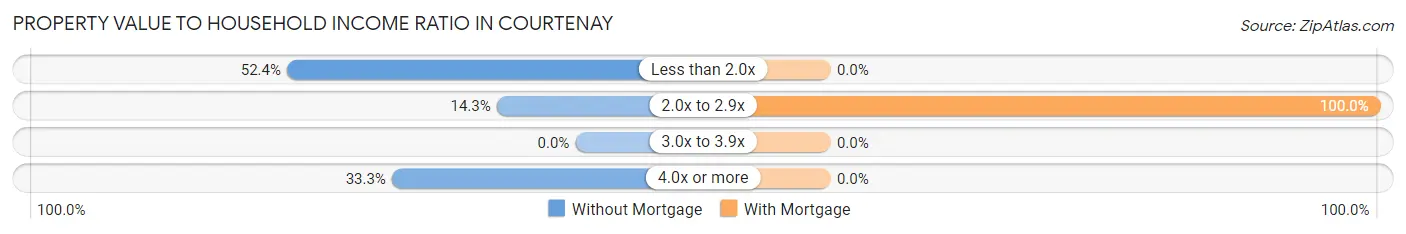
| Value-to-Income Ratio | Without Mortgage | With Mortgage |
| Less than 2.0x | 11 (52.4%) | 0 (0.0%) |
| 2.0x to 2.9x | 3 (14.3%) | 4 (100.0%) |
| 3.0x to 3.9x | 0 (0.0%) | 0 (0.0%) |
| 4.0x or more | 7 (33.3%) | 0 (0.0%) |
| Total | 21 (100.0%) | 4 (100.0%) |
Real Estate Taxes by Mortgage Status in Courtenay
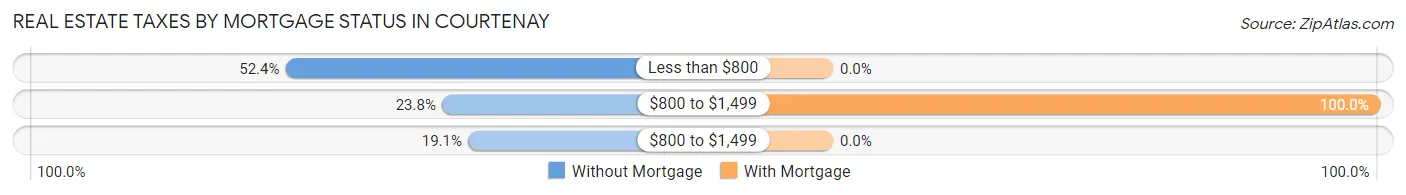
| Property Taxes | Without Mortgage | With Mortgage |
| Less than $800 | 11 (52.4%) | 0 (0.0%) |
| $800 to $1,499 | 5 (23.8%) | 4 (100.0%) |
| $800 to $1,499 | 4 (19.1%) | 0 (0.0%) |
| Total | 21 (100.0%) | 4 (100.0%) |
Health & Disability in Courtenay
Health Insurance Coverage by Age in Courtenay
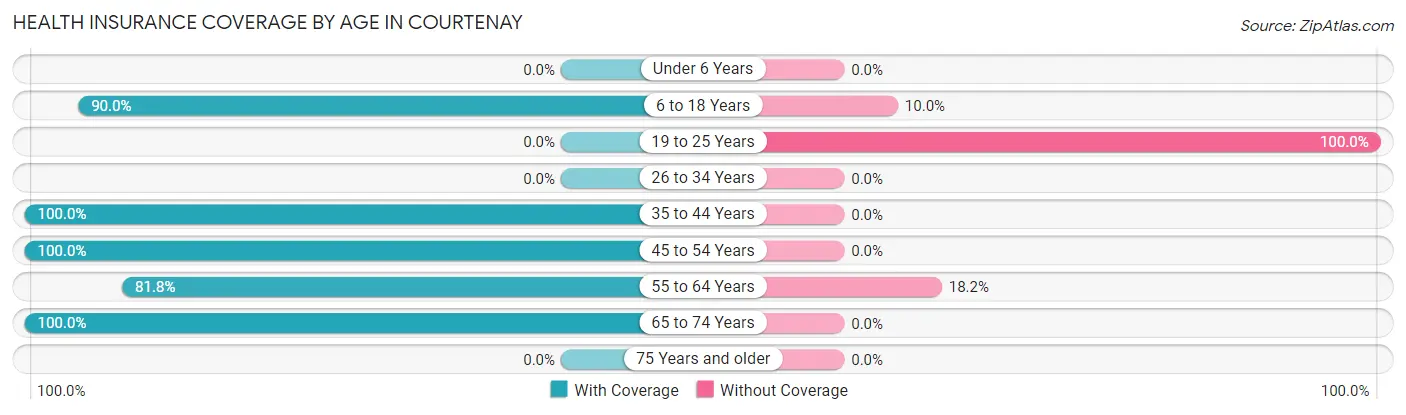
| Age Bracket | With Coverage | Without Coverage |
| Under 6 Years | 0 (0.0%) | 0 (0.0%) |
| 6 to 18 Years | 9 (90.0%) | 1 (10.0%) |
| 19 to 25 Years | 0 (0.0%) | 3 (100.0%) |
| 26 to 34 Years | 0 (0.0%) | 0 (0.0%) |
| 35 to 44 Years | 2 (100.0%) | 0 (0.0%) |
| 45 to 54 Years | 6 (100.0%) | 0 (0.0%) |
| 55 to 64 Years | 9 (81.8%) | 2 (18.2%) |
| 65 to 74 Years | 21 (100.0%) | 0 (0.0%) |
| 75 Years and older | 0 (0.0%) | 0 (0.0%) |
| Total | 47 (88.7%) | 6 (11.3%) |
Health Insurance Coverage by Citizenship Status in Courtenay
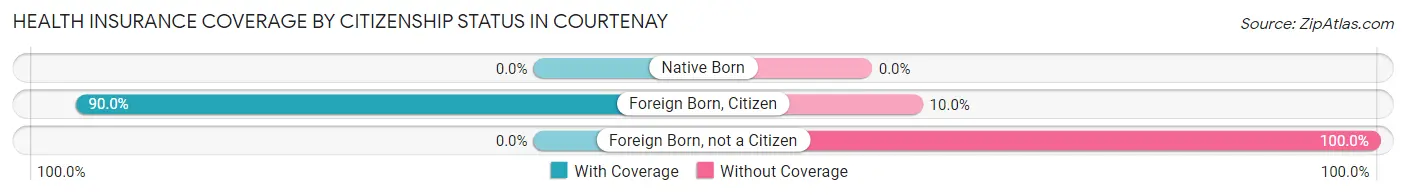
| Citizenship Status | With Coverage | Without Coverage |
| Native Born | 0 (0.0%) | 0 (0.0%) |
| Foreign Born, Citizen | 9 (90.0%) | 1 (10.0%) |
| Foreign Born, not a Citizen | 0 (0.0%) | 3 (100.0%) |
Health Insurance Coverage by Household Income in Courtenay
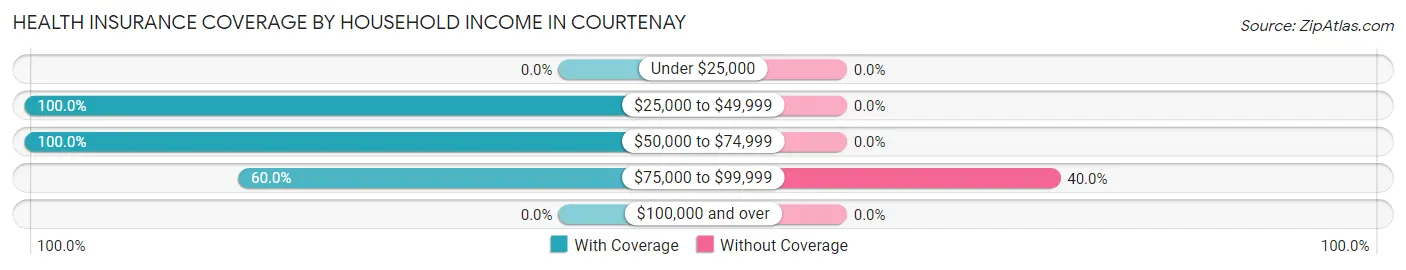
| Household Income | With Coverage | Without Coverage |
| Under $25,000 | 0 (0.0%) | 0 (0.0%) |
| $25,000 to $49,999 | 21 (100.0%) | 0 (0.0%) |
| $50,000 to $74,999 | 17 (100.0%) | 0 (0.0%) |
| $75,000 to $99,999 | 9 (60.0%) | 6 (40.0%) |
| $100,000 and over | 0 (0.0%) | 0 (0.0%) |
Public vs Private Health Insurance Coverage by Age in Courtenay
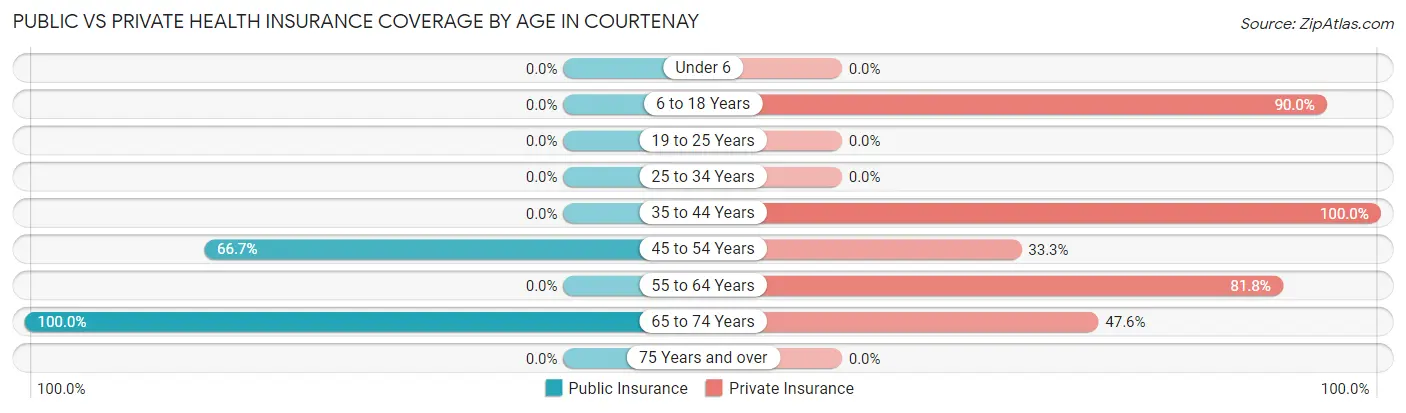
| Age Bracket | Public Insurance | Private Insurance |
| Under 6 | 0 (0.0%) | 0 (0.0%) |
| 6 to 18 Years | 0 (0.0%) | 9 (90.0%) |
| 19 to 25 Years | 0 (0.0%) | 0 (0.0%) |
| 25 to 34 Years | 0 (0.0%) | 0 (0.0%) |
| 35 to 44 Years | 0 (0.0%) | 2 (100.0%) |
| 45 to 54 Years | 4 (66.7%) | 2 (33.3%) |
| 55 to 64 Years | 0 (0.0%) | 9 (81.8%) |
| 65 to 74 Years | 21 (100.0%) | 10 (47.6%) |
| 75 Years and over | 0 (0.0%) | 0 (0.0%) |
| Total | 25 (47.2%) | 32 (60.4%) |
Disability Status by Sex by Age in Courtenay
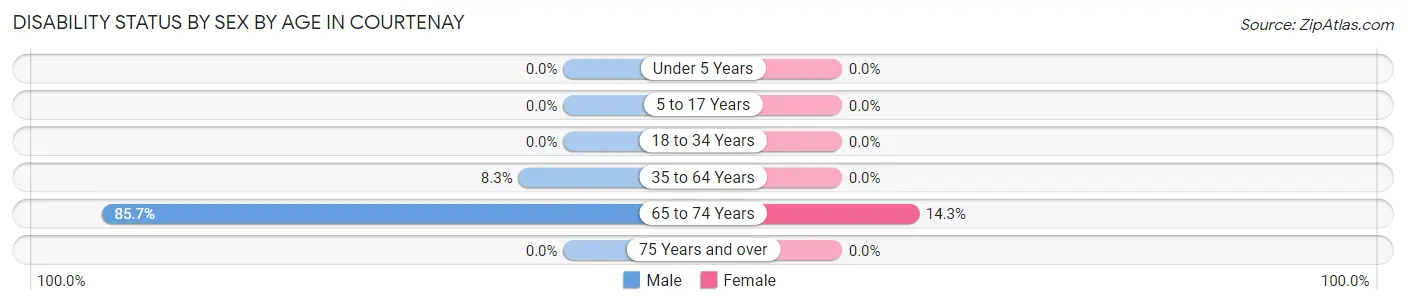
| Age Bracket | Male | Female |
| Under 5 Years | 0 (0.0%) | 0 (0.0%) |
| 5 to 17 Years | 0 (0.0%) | 0 (0.0%) |
| 18 to 34 Years | 0 (0.0%) | 0 (0.0%) |
| 35 to 64 Years | 1 (8.3%) | 0 (0.0%) |
| 65 to 74 Years | 6 (85.7%) | 2 (14.3%) |
| 75 Years and over | 0 (0.0%) | 0 (0.0%) |
Disability Class by Sex by Age in Courtenay
Disability Class: Hearing Difficulty
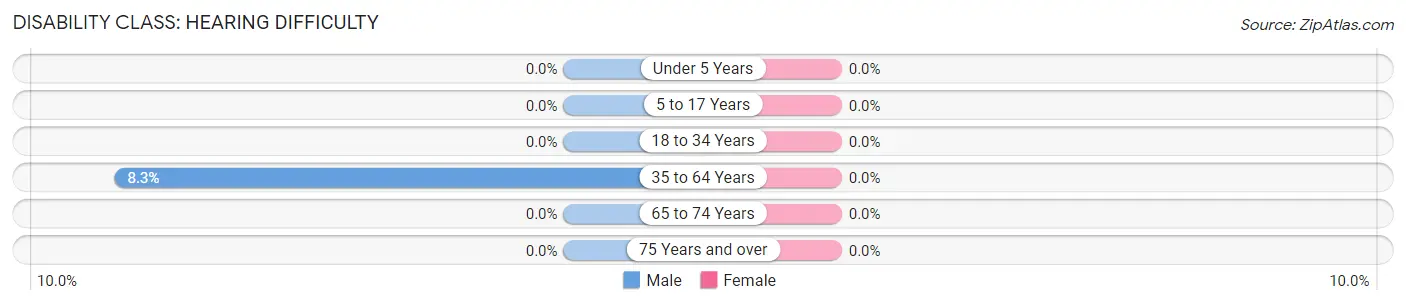
| Age Bracket | Male | Female |
| Under 5 Years | 0 (0.0%) | 0 (0.0%) |
| 5 to 17 Years | 0 (0.0%) | 0 (0.0%) |
| 18 to 34 Years | 0 (0.0%) | 0 (0.0%) |
| 35 to 64 Years | 1 (8.3%) | 0 (0.0%) |
| 65 to 74 Years | 0 (0.0%) | 0 (0.0%) |
| 75 Years and over | 0 (0.0%) | 0 (0.0%) |
Disability Class: Vision Difficulty
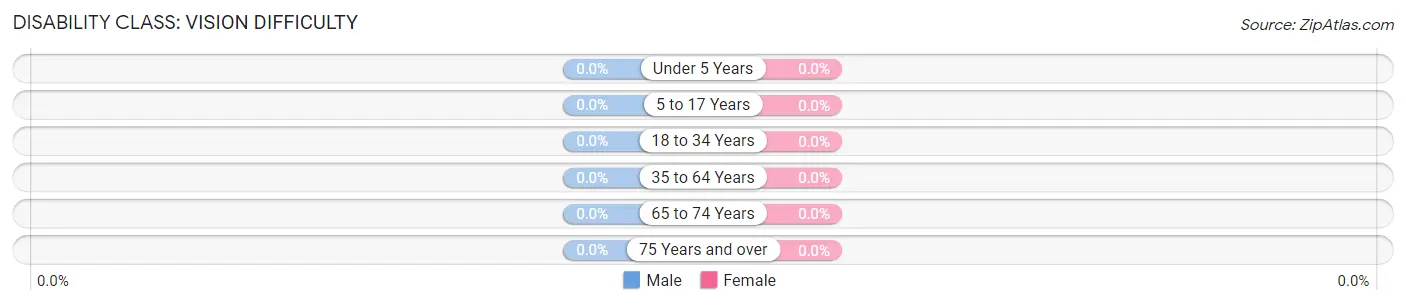
| Age Bracket | Male | Female |
| Under 5 Years | 0 (0.0%) | 0 (0.0%) |
| 5 to 17 Years | 0 (0.0%) | 0 (0.0%) |
| 18 to 34 Years | 0 (0.0%) | 0 (0.0%) |
| 35 to 64 Years | 0 (0.0%) | 0 (0.0%) |
| 65 to 74 Years | 0 (0.0%) | 0 (0.0%) |
| 75 Years and over | 0 (0.0%) | 0 (0.0%) |
Disability Class: Cognitive Difficulty
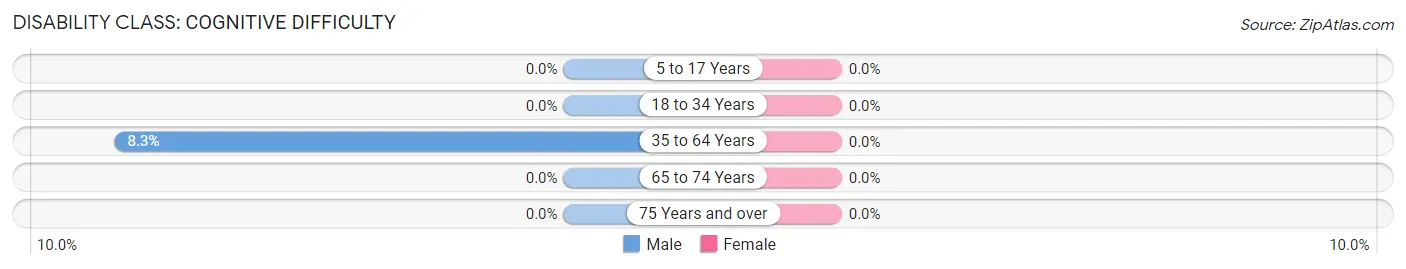
| Age Bracket | Male | Female |
| 5 to 17 Years | 0 (0.0%) | 0 (0.0%) |
| 18 to 34 Years | 0 (0.0%) | 0 (0.0%) |
| 35 to 64 Years | 1 (8.3%) | 0 (0.0%) |
| 65 to 74 Years | 0 (0.0%) | 0 (0.0%) |
| 75 Years and over | 0 (0.0%) | 0 (0.0%) |
Disability Class: Ambulatory Difficulty
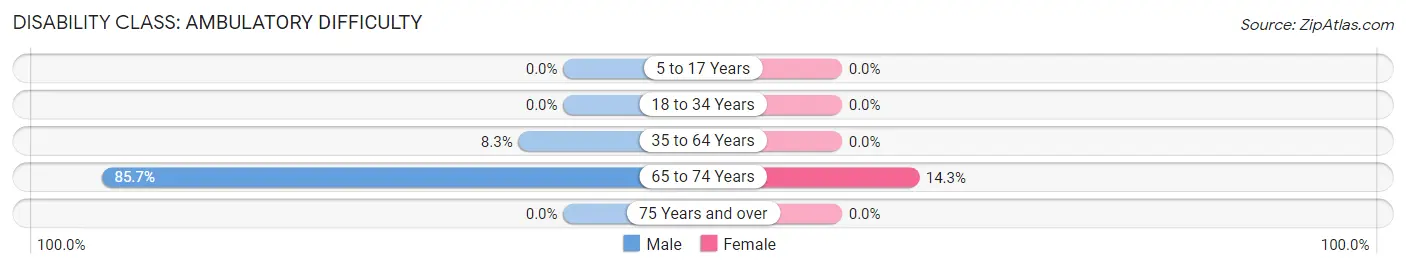
| Age Bracket | Male | Female |
| 5 to 17 Years | 0 (0.0%) | 0 (0.0%) |
| 18 to 34 Years | 0 (0.0%) | 0 (0.0%) |
| 35 to 64 Years | 1 (8.3%) | 0 (0.0%) |
| 65 to 74 Years | 6 (85.7%) | 2 (14.3%) |
| 75 Years and over | 0 (0.0%) | 0 (0.0%) |
Disability Class: Self-Care Difficulty
| Age Bracket | Male | Female |
| 5 to 17 Years | 0 (0.0%) | 0 (0.0%) |
| 18 to 34 Years | 0 (0.0%) | 0 (0.0%) |
| 35 to 64 Years | 0 (0.0%) | 0 (0.0%) |
| 65 to 74 Years | 0 (0.0%) | 0 (0.0%) |
| 75 Years and over | 0 (0.0%) | 0 (0.0%) |
Technology Access in Courtenay
Computing Device Access in Courtenay
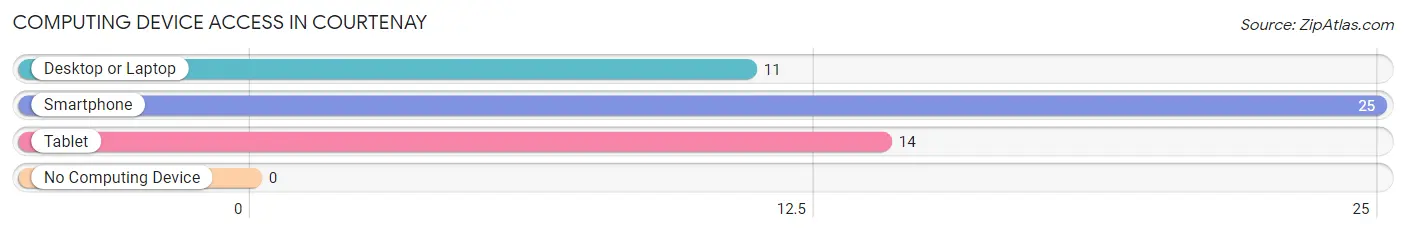
| Device Type | # Households | % Households |
| Desktop or Laptop | 11 | 44.0% |
| Smartphone | 25 | 100.0% |
| Tablet | 14 | 56.0% |
| No Computing Device | 0 | 0.0% |
| Total | 25 | 100.0% |
Internet Access in Courtenay
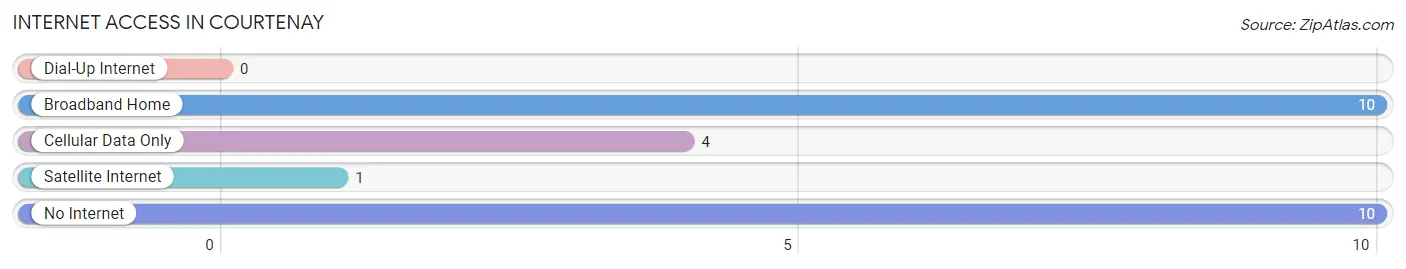
| Internet Type | # Households | % Households |
| Dial-Up Internet | 0 | 0.0% |
| Broadband Home | 10 | 40.0% |
| Cellular Data Only | 4 | 16.0% |
| Satellite Internet | 1 | 4.0% |
| No Internet | 10 | 40.0% |
| Total | 25 | 100.0% |
Courtenay Summary
Courtenay is a small city located in the southeastern corner of North Dakota, United States. It is the county seat of Griggs County and is located on the Sheyenne River. The city was founded in 1881 and was named after the first postmaster, William Courtenay. The population of Courtenay was estimated to be 545 in 2020.
Geography
Courtenay is located in the Red River Valley, a flat, fertile region of the Great Plains. The city is situated on the Sheyenne River, which flows through the city and is a tributary of the Red River. The city is located in the Central Time Zone and has a humid continental climate, with hot summers and cold winters.
Economy
The economy of Courtenay is largely based on agriculture. The city is home to several grain elevators, as well as a number of small businesses. The city is also home to a number of manufacturing companies, including a furniture factory and a plastics factory.
Demographics
As of the 2010 census, the population of Courtenay was 545, with a population density of 1,092 people per square mile. The median age of the population was 43.7 years, and the median household income was $41,250. The racial makeup of the city was 97.3% White, 0.7% African American, 0.2% Native American, 0.2% Asian, 0.2% from other races, and 1.6% from two or more races.
History
Courtenay was founded in 1881 and was named after the first postmaster, William Courtenay. The city was incorporated in 1883 and was the county seat of Griggs County. The city was a major stop on the Great Northern Railway, and the city's economy was largely based on agriculture and the railroad.
In the early 20th century, Courtenay was a major center for the production of wheat and other grains. The city was also home to a number of manufacturing companies, including a furniture factory and a plastics factory.
In the late 20th century, Courtenay experienced a decline in population as many of its residents moved away in search of better economic opportunities. However, the city has seen a resurgence in recent years, with a number of new businesses opening in the city.
Conclusion
Courtenay is a small city located in the southeastern corner of North Dakota, United States. It is the county seat of Griggs County and is located on the Sheyenne River. The city was founded in 1881 and was named after the first postmaster, William Courtenay. The population of Courtenay was estimated to be 545 in 2020. The economy of Courtenay is largely based on agriculture, and the city is home to several grain elevators, as well as a number of small businesses and manufacturing companies. The city has experienced a decline in population in recent years, but has seen a resurgence in recent years with the opening of new businesses.
Common Questions
What is Per Capita Income in Courtenay?
Per Capita income in Courtenay is $26,238.
What is the Median Family Income in Courtenay?
Median Family Income in Courtenay is $51,250.
What is the Median Household income in Courtenay?
Median Household Income in Courtenay is $50,938.
What is Income or Wage Gap in Courtenay?
Income or Wage Gap in Courtenay is 37.3%.
Women in Courtenay earn 62.7 cents for every dollar earned by a man.
What is Inequality or Gini Index in Courtenay?
Inequality or Gini Index in Courtenay is 0.19.
What is the Total Population of Courtenay?
Total Population of Courtenay is 53.
What is the Total Male Population of Courtenay?
Total Male Population of Courtenay is 27.
What is the Total Female Population of Courtenay?
Total Female Population of Courtenay is 26.
What is the Ratio of Males per 100 Females in Courtenay?
There are 103.85 Males per 100 Females in Courtenay.
What is the Ratio of Females per 100 Males in Courtenay?
There are 96.30 Females per 100 Males in Courtenay.
What is the Median Population Age in Courtenay?
Median Population Age in Courtenay is 60.8 Years.
What is the Average Family Size in Courtenay
Average Family Size in Courtenay is 3.0 People.
What is the Average Household Size in Courtenay
Average Household Size in Courtenay is 2.1 People.
How Large is the Labor Force in Courtenay?
There are 17 People in the Labor Forcein in Courtenay.
What is the Percentage of People in the Labor Force in Courtenay?
38.6% of People are in the Labor Force in Courtenay.