Cogswell, ND Map & Demographics
Cogswell Map
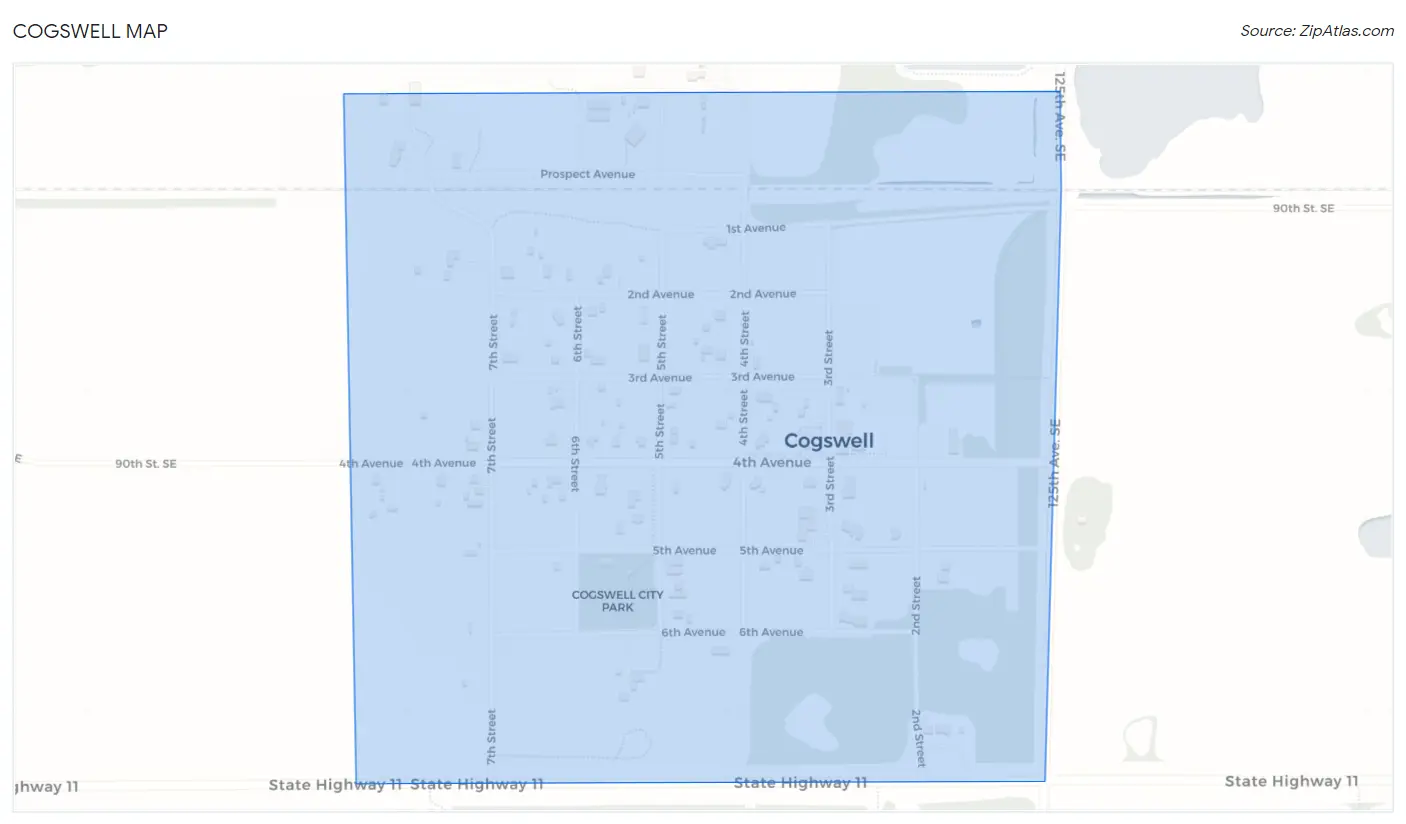
Cogswell Overview
$33,524
PER CAPITA INCOME
$93,333
AVG FAMILY INCOME
$68,750
AVG HOUSEHOLD INCOME
0.32
INEQUALITY / GINI INDEX
113
TOTAL POPULATION
69
MALE POPULATION
44
FEMALE POPULATION
156.82
MALES / 100 FEMALES
63.77
FEMALES / 100 MALES
57.5
MEDIAN AGE
2.6
AVG FAMILY SIZE
2.2
AVG HOUSEHOLD SIZE
64
LABOR FORCE [ PEOPLE ]
56.6%
PERCENT IN LABOR FORCE
3.1%
UNEMPLOYMENT RATE
Cogswell Zip Codes
Cogswell Area Codes
Income in Cogswell
Income Overview in Cogswell
Per Capita Income in Cogswell is $33,524, while median incomes of families and households are $93,333 and $68,750 respectively.
| Characteristic | Number | Measure |
| Per Capita Income | 113 | $33,524 |
| Median Family Income | 36 | $93,333 |
| Mean Family Income | 36 | $96,317 |
| Median Household Income | 52 | $68,750 |
| Mean Household Income | 52 | $78,140 |
| Income Deficit | 36 | $0 |
| Wage / Income Gap (%) | 113 | 0.00% |
| Wage / Income Gap ($) | 113 | 100.00¢ per $1 |
| Gini / Inequality Index | 113 | 0.32 |
Earnings by Sex in Cogswell
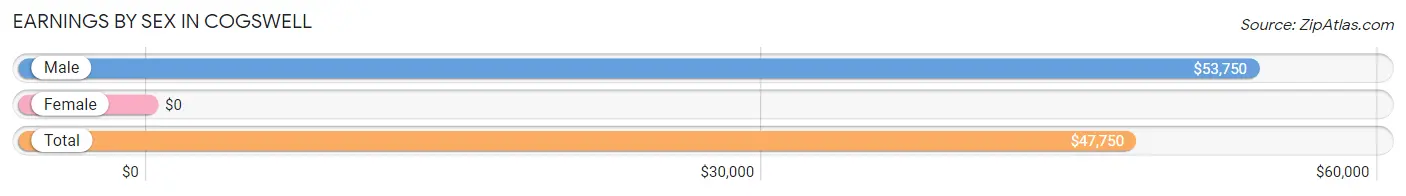
| Sex | Number | Average Earnings |
| Male | 34 (50.7%) | $53,750 |
| Female | 33 (49.2%) | $0 |
| Total | 67 (100.0%) | $47,750 |
Earnings by Sex by Income Bracket in Cogswell
The most common earnings brackets in Cogswell are $75,000 to $99,999 for men (8 | 23.5%) and $45,000 to $49,999 for women (13 | 39.4%).
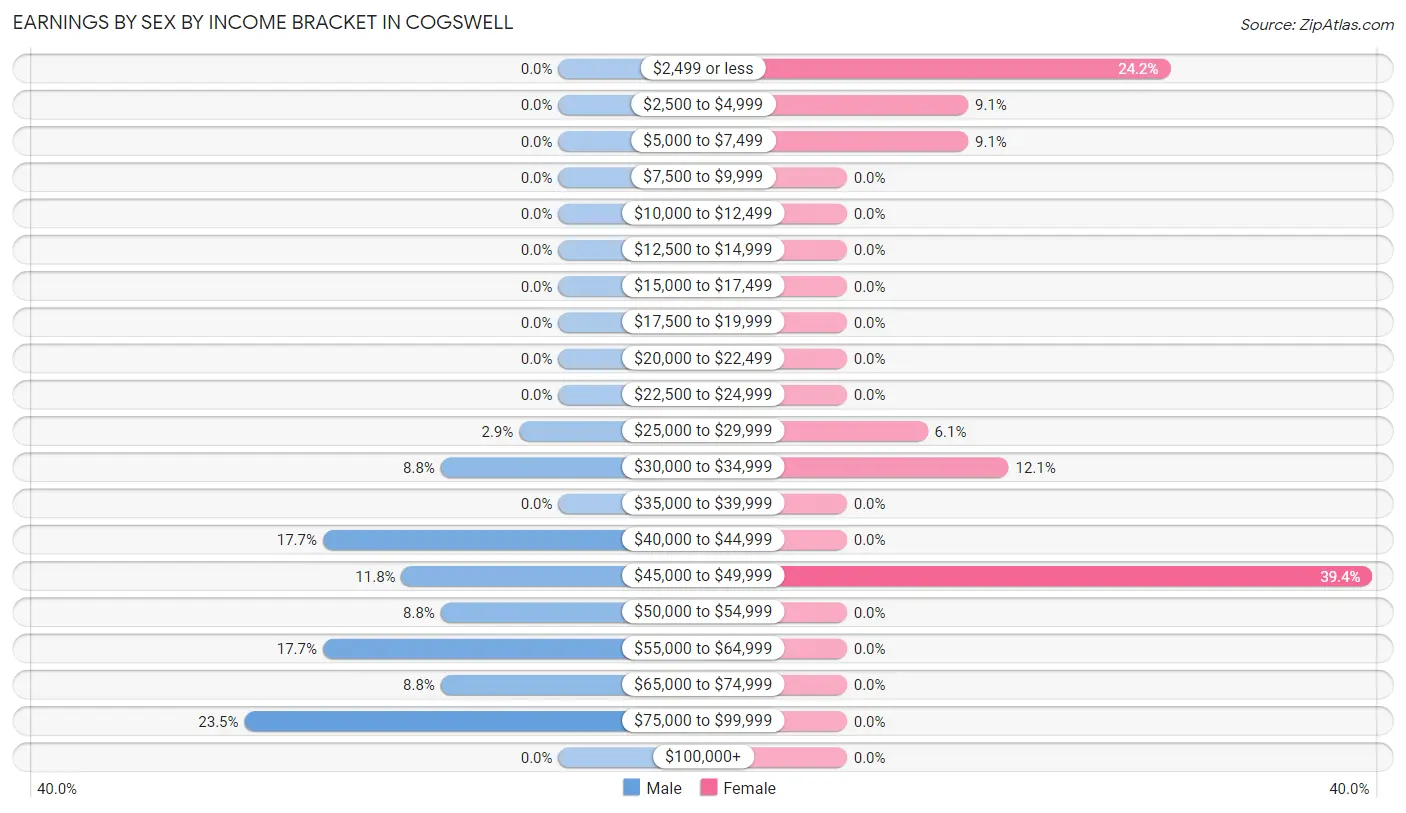
| Income | Male | Female |
| $2,499 or less | 0 (0.0%) | 8 (24.2%) |
| $2,500 to $4,999 | 0 (0.0%) | 3 (9.1%) |
| $5,000 to $7,499 | 0 (0.0%) | 3 (9.1%) |
| $7,500 to $9,999 | 0 (0.0%) | 0 (0.0%) |
| $10,000 to $12,499 | 0 (0.0%) | 0 (0.0%) |
| $12,500 to $14,999 | 0 (0.0%) | 0 (0.0%) |
| $15,000 to $17,499 | 0 (0.0%) | 0 (0.0%) |
| $17,500 to $19,999 | 0 (0.0%) | 0 (0.0%) |
| $20,000 to $22,499 | 0 (0.0%) | 0 (0.0%) |
| $22,500 to $24,999 | 0 (0.0%) | 0 (0.0%) |
| $25,000 to $29,999 | 1 (2.9%) | 2 (6.1%) |
| $30,000 to $34,999 | 3 (8.8%) | 4 (12.1%) |
| $35,000 to $39,999 | 0 (0.0%) | 0 (0.0%) |
| $40,000 to $44,999 | 6 (17.6%) | 0 (0.0%) |
| $45,000 to $49,999 | 4 (11.8%) | 13 (39.4%) |
| $50,000 to $54,999 | 3 (8.8%) | 0 (0.0%) |
| $55,000 to $64,999 | 6 (17.6%) | 0 (0.0%) |
| $65,000 to $74,999 | 3 (8.8%) | 0 (0.0%) |
| $75,000 to $99,999 | 8 (23.5%) | 0 (0.0%) |
| $100,000+ | 0 (0.0%) | 0 (0.0%) |
| Total | 34 (100.0%) | 33 (100.0%) |
Earnings by Sex by Educational Attainment in Cogswell
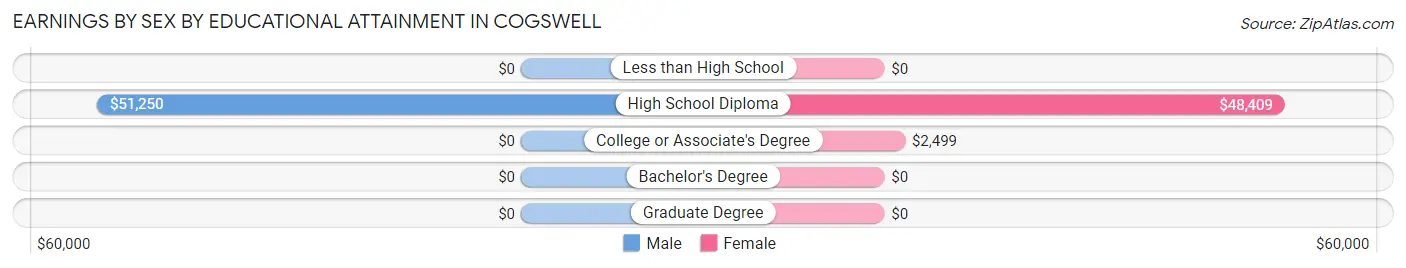
| Educational Attainment | Male Income | Female Income |
| Less than High School | - | - |
| High School Diploma | $51,250 | $48,409 |
| College or Associate's Degree | - | - |
| Bachelor's Degree | - | - |
| Graduate Degree | - | - |
| Total | $55,208 | $0 |
Family Income in Cogswell
Family Income Brackets in Cogswell
According to the Cogswell family income data, there are 10 families falling into the $75,000 to $99,999 income range, which is the most common income bracket and makes up 27.8% of all families.
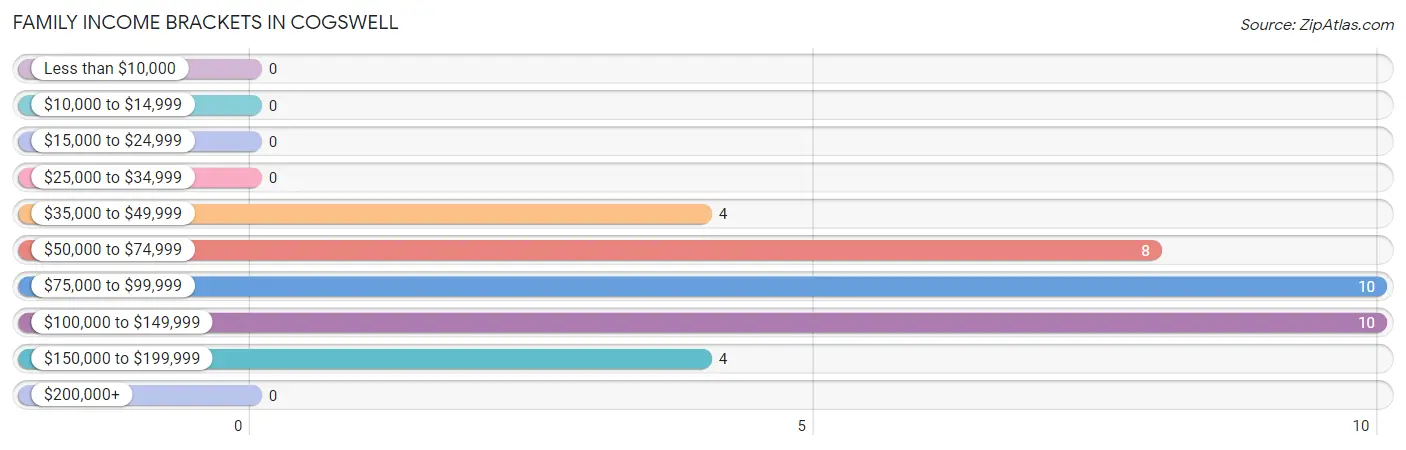
| Income Bracket | # Families | % Families |
| Less than $10,000 | 0 | 0.0% |
| $10,000 to $14,999 | 0 | 0.0% |
| $15,000 to $24,999 | 0 | 0.0% |
| $25,000 to $34,999 | 0 | 0.0% |
| $35,000 to $49,999 | 4 | 11.1% |
| $50,000 to $74,999 | 8 | 22.2% |
| $75,000 to $99,999 | 10 | 27.8% |
| $100,000 to $149,999 | 10 | 27.8% |
| $150,000 to $199,999 | 4 | 11.1% |
| $200,000+ | 0 | 0.0% |
Family Income by Famaliy Size in Cogswell
3-person families (14 | 38.9%) account for the highest median family income in Cogswell with $128,250 per family, while 3-person families (14 | 38.9%) have the highest median income of $42,750 per family member.
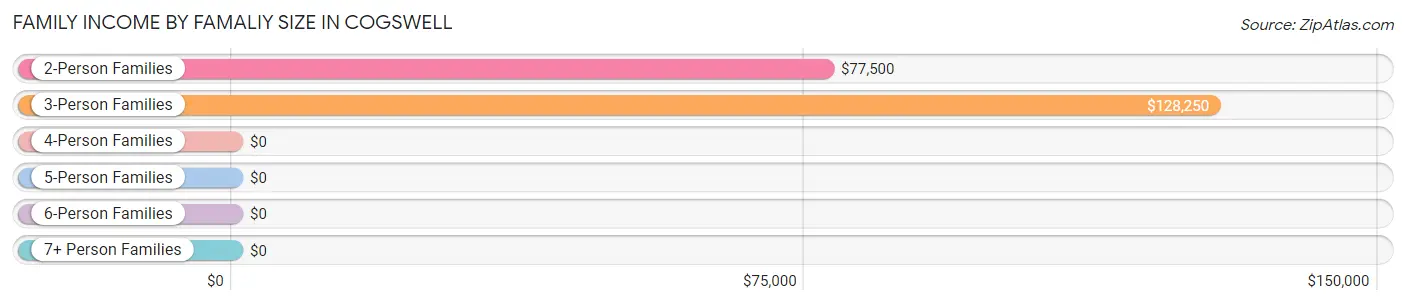
| Income Bracket | # Families | Median Income |
| 2-Person Families | 22 (61.1%) | $77,500 |
| 3-Person Families | 14 (38.9%) | $128,250 |
| 4-Person Families | 0 (0.0%) | $0 |
| 5-Person Families | 0 (0.0%) | $0 |
| 6-Person Families | 0 (0.0%) | $0 |
| 7+ Person Families | 0 (0.0%) | $0 |
| Total | 36 (100.0%) | $93,333 |
Family Income by Number of Earners in Cogswell
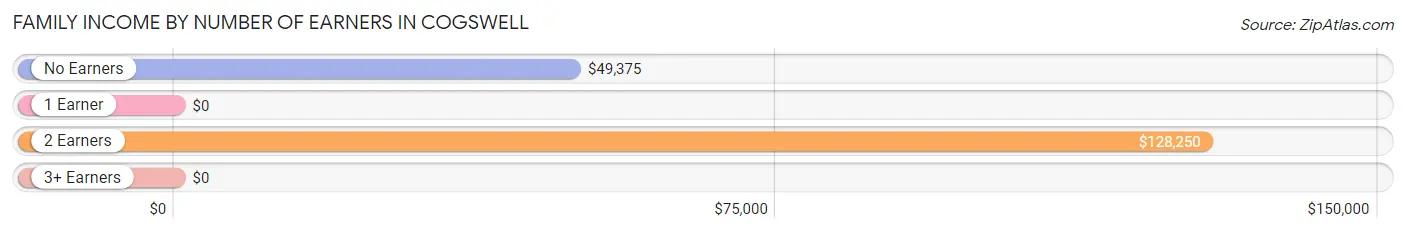
| Number of Earners | # Families | Median Income |
| No Earners | 6 (16.7%) | $49,375 |
| 1 Earner | 6 (16.7%) | $0 |
| 2 Earners | 22 (61.1%) | $128,250 |
| 3+ Earners | 2 (5.6%) | $0 |
| Total | 36 (100.0%) | $93,333 |
Household Income in Cogswell
Household Income Brackets in Cogswell
With 12 households falling in the category, the $75,000 to $99,999 income range is the most frequent in Cogswell, accounting for 23.1% of all households.
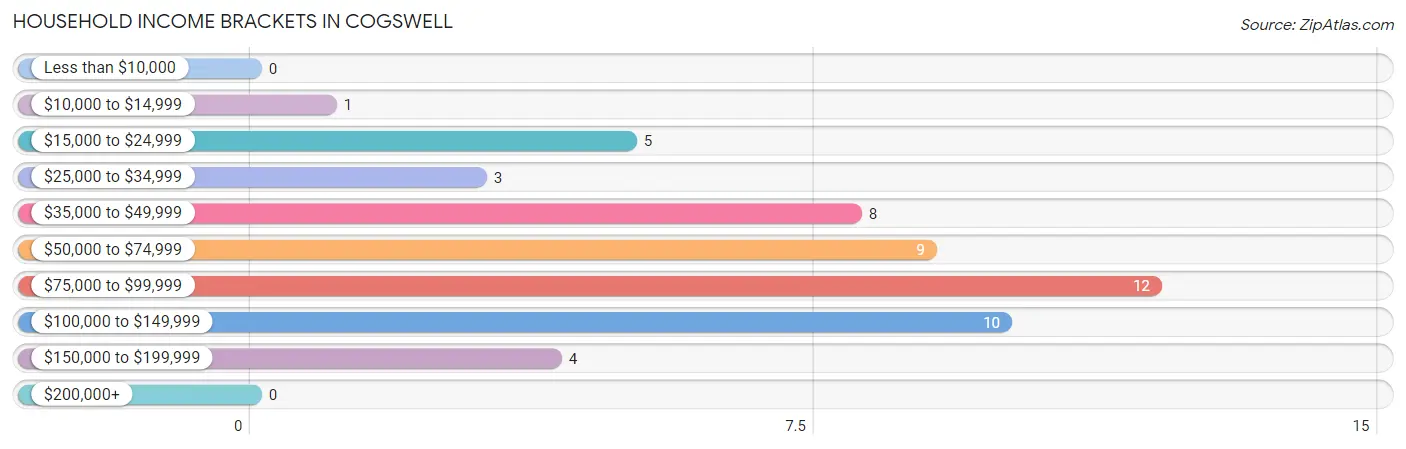
| Income Bracket | # Households | % Households |
| Less than $10,000 | 0 | 0.0% |
| $10,000 to $14,999 | 1 | 1.9% |
| $15,000 to $24,999 | 5 | 9.6% |
| $25,000 to $34,999 | 3 | 5.8% |
| $35,000 to $49,999 | 8 | 15.4% |
| $50,000 to $74,999 | 9 | 17.3% |
| $75,000 to $99,999 | 12 | 23.1% |
| $100,000 to $149,999 | 10 | 19.2% |
| $150,000 to $199,999 | 4 | 7.7% |
| $200,000+ | 0 | 0.0% |
Household Income by Householder Age in Cogswell
The median household income in Cogswell is $68,750, with the highest median household income of $86,250 found in the 45 to 64 years age bracket for the primary householder. A total of 30 households (57.7%) fall into this category. Meanwhile, the 15 to 24 years age bracket for the primary householder has the lowest median household income of $0, with 1 households (1.9%) in this group.
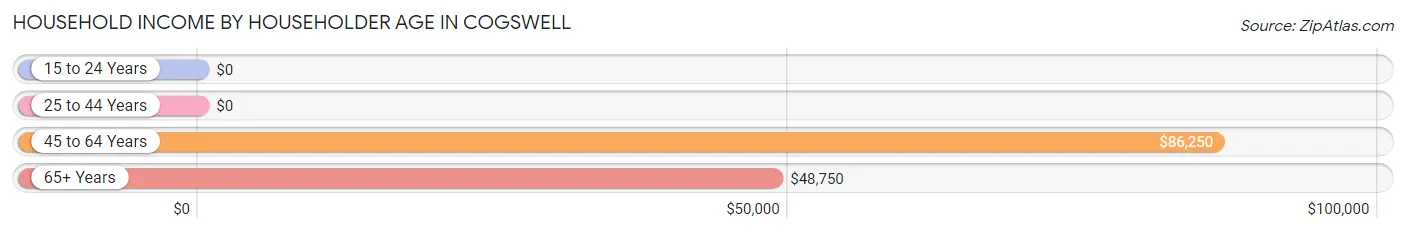
| Income Bracket | # Households | Median Income |
| 15 to 24 Years | 1 (1.9%) | $0 |
| 25 to 44 Years | 5 (9.6%) | $0 |
| 45 to 64 Years | 30 (57.7%) | $86,250 |
| 65+ Years | 16 (30.8%) | $48,750 |
| Total | 52 (100.0%) | $68,750 |
Poverty in Cogswell
Income Below Poverty by Sex and Age in Cogswell
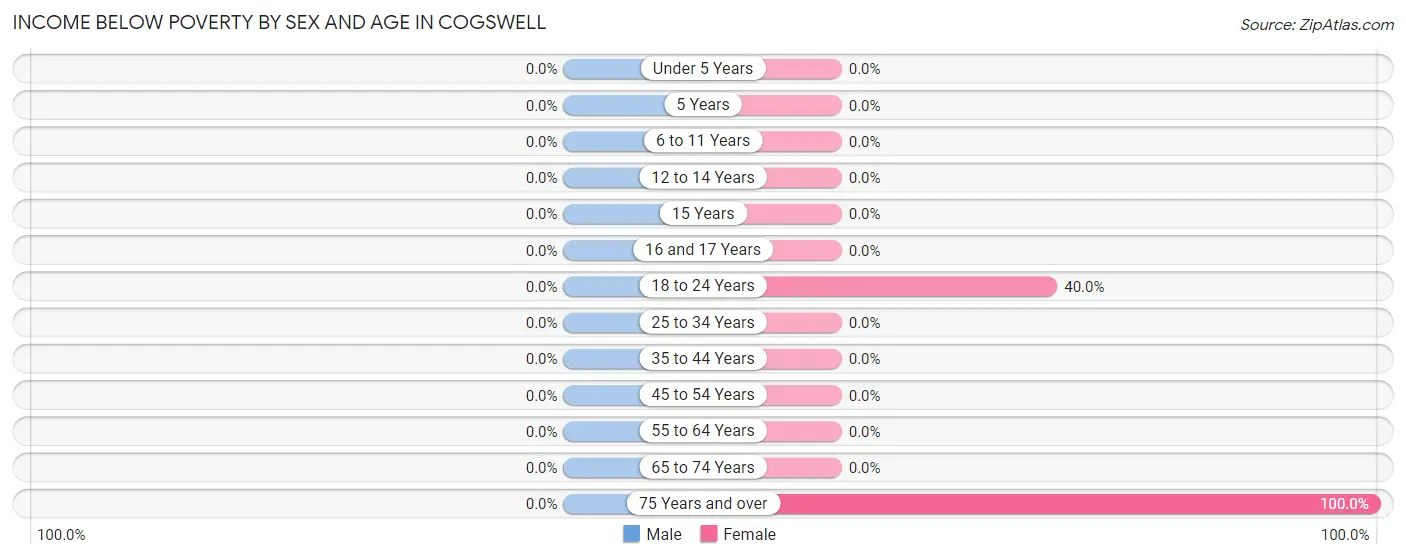
| Age Bracket | Male | Female |
| Under 5 Years | 0 (0.0%) | 0 (0.0%) |
| 5 Years | 0 (0.0%) | 0 (0.0%) |
| 6 to 11 Years | 0 (0.0%) | 0 (0.0%) |
| 12 to 14 Years | 0 (0.0%) | 0 (0.0%) |
| 15 Years | 0 (0.0%) | 0 (0.0%) |
| 16 and 17 Years | 0 (0.0%) | 0 (0.0%) |
| 18 to 24 Years | 0 (0.0%) | 2 (40.0%) |
| 25 to 34 Years | 0 (0.0%) | 0 (0.0%) |
| 35 to 44 Years | 0 (0.0%) | 0 (0.0%) |
| 45 to 54 Years | 0 (0.0%) | 0 (0.0%) |
| 55 to 64 Years | 0 (0.0%) | 0 (0.0%) |
| 65 to 74 Years | 0 (0.0%) | 0 (0.0%) |
| 75 Years and over | 0 (0.0%) | 1 (100.0%) |
| Total | 0 (0.0%) | 3 (6.8%) |
Income Above Poverty by Sex and Age in Cogswell
According to the poverty statistics in Cogswell, males aged 16 and 17 years and females aged 45 to 54 years are the age groups that are most secure financially, with 100.0% of males and 100.0% of females in these age groups living above the poverty line.

| Age Bracket | Male | Female |
| Under 5 Years | 0 (0.0%) | 0 (0.0%) |
| 5 Years | 0 (0.0%) | 0 (0.0%) |
| 6 to 11 Years | 0 (0.0%) | 0 (0.0%) |
| 12 to 14 Years | 0 (0.0%) | 0 (0.0%) |
| 15 Years | 0 (0.0%) | 0 (0.0%) |
| 16 and 17 Years | 24 (100.0%) | 0 (0.0%) |
| 18 to 24 Years | 1 (100.0%) | 3 (60.0%) |
| 25 to 34 Years | 4 (100.0%) | 0 (0.0%) |
| 35 to 44 Years | 2 (100.0%) | 0 (0.0%) |
| 45 to 54 Years | 8 (100.0%) | 2 (100.0%) |
| 55 to 64 Years | 15 (100.0%) | 25 (100.0%) |
| 65 to 74 Years | 12 (100.0%) | 11 (100.0%) |
| 75 Years and over | 3 (100.0%) | 0 (0.0%) |
| Total | 69 (100.0%) | 41 (93.2%) |
Income Below Poverty Among Married-Couple Families in Cogswell
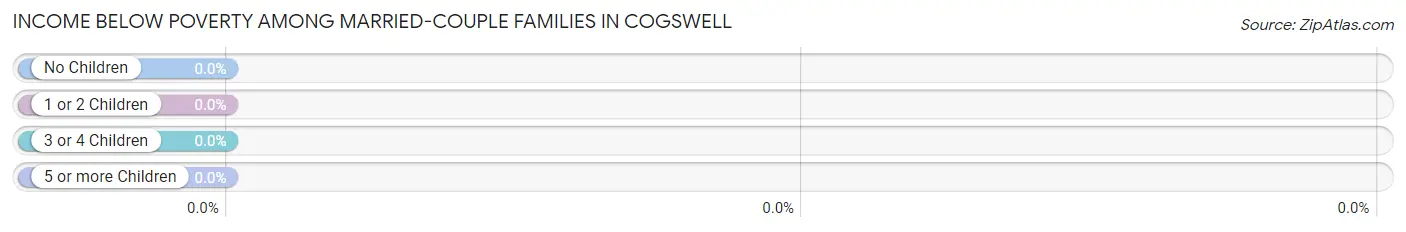
| Children | Above Poverty | Below Poverty |
| No Children | 25 (100.0%) | 0 (0.0%) |
| 1 or 2 Children | 10 (100.0%) | 0 (0.0%) |
| 3 or 4 Children | 0 (0.0%) | 0 (0.0%) |
| 5 or more Children | 0 (0.0%) | 0 (0.0%) |
| Total | 35 (100.0%) | 0 (0.0%) |
Income Below Poverty Among Single-Parent Households in Cogswell
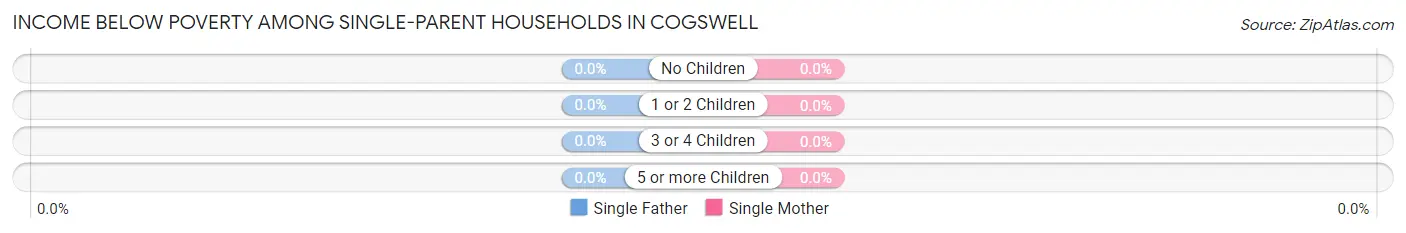
| Children | Single Father | Single Mother |
| No Children | 0 (0.0%) | 0 (0.0%) |
| 1 or 2 Children | 0 (0.0%) | 0 (0.0%) |
| 3 or 4 Children | 0 (0.0%) | 0 (0.0%) |
| 5 or more Children | 0 (0.0%) | 0 (0.0%) |
| Total | 0 (0.0%) | 0 (0.0%) |
Income Below Poverty Among Married-Couple vs Single-Parent Households in Cogswell
| Children | Married-Couple Families | Single-Parent Households |
| No Children | 0 (0.0%) | 0 (0.0%) |
| 1 or 2 Children | 0 (0.0%) | 0 (0.0%) |
| 3 or 4 Children | 0 (0.0%) | 0 (0.0%) |
| 5 or more Children | 0 (0.0%) | 0 (0.0%) |
| Total | 0 (0.0%) | 0 (0.0%) |
Race in Cogswell
The most populous races in Cogswell are White / Caucasian (81 | 71.7%), Two or more Races (30 | 26.6%), and Native / Alaskan (2 | 1.8%).
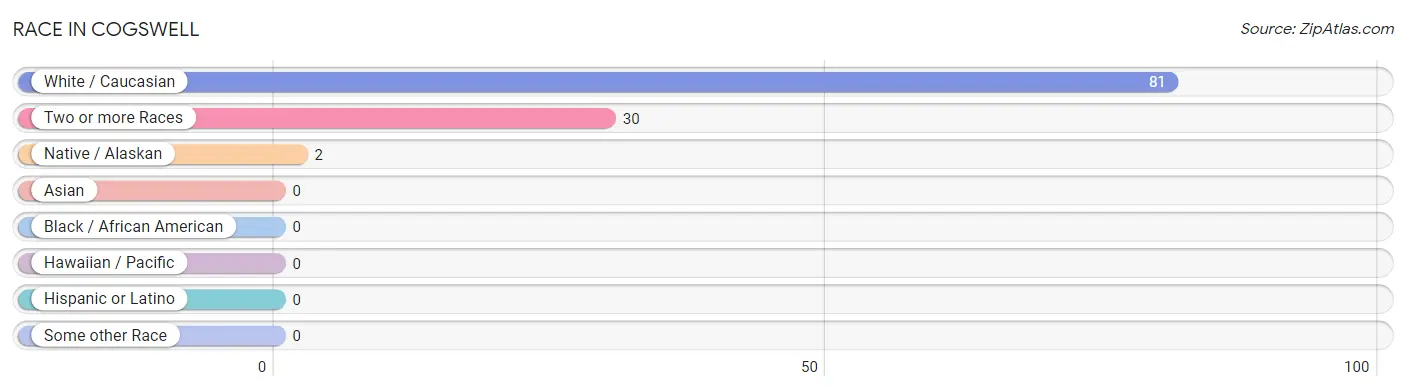
| Race | # Population | % Population |
| Asian | 0 | 0.0% |
| Black / African American | 0 | 0.0% |
| Hawaiian / Pacific | 0 | 0.0% |
| Hispanic or Latino | 0 | 0.0% |
| Native / Alaskan | 2 | 1.8% |
| White / Caucasian | 81 | 71.7% |
| Two or more Races | 30 | 26.6% |
| Some other Race | 0 | 0.0% |
| Total | 113 | 100.0% |
Ancestry in Cogswell
The most populous ancestries reported in Cogswell are German (72 | 63.7%), Norwegian (32 | 28.3%), Swedish (10 | 8.8%), Irish (9 | 8.0%), and Polish (6 | 5.3%), together accounting for 114.2% of all Cogswell residents.
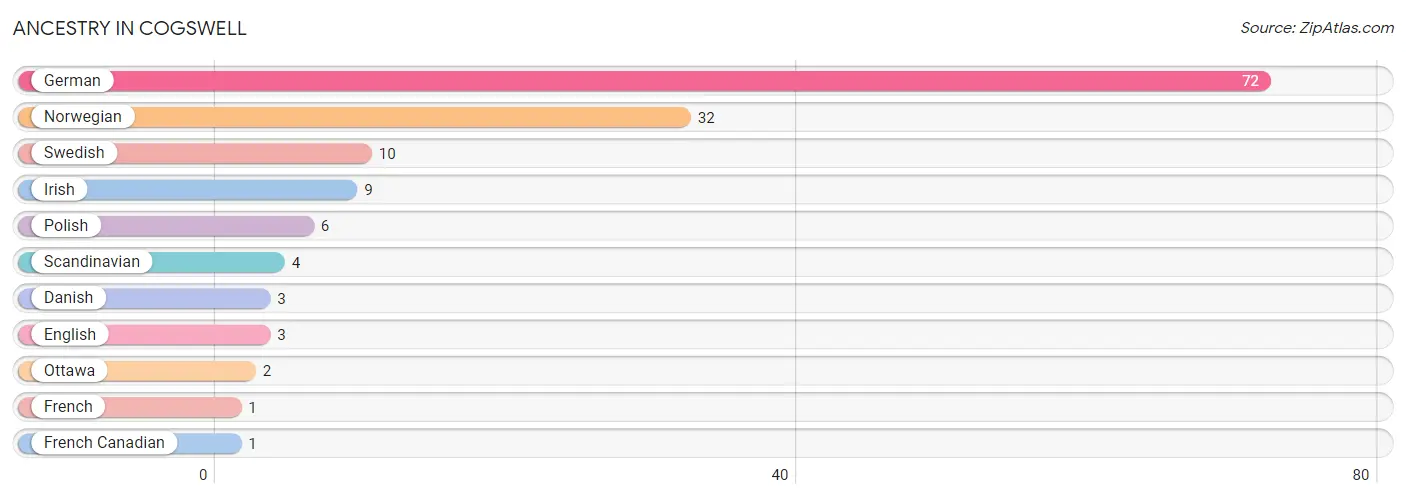
| Ancestry | # Population | % Population |
| Danish | 3 | 2.6% |
| English | 3 | 2.6% |
| French | 1 | 0.9% |
| French Canadian | 1 | 0.9% |
| German | 72 | 63.7% |
| Irish | 9 | 8.0% |
| Norwegian | 32 | 28.3% |
| Ottawa | 2 | 1.8% |
| Polish | 6 | 5.3% |
| Scandinavian | 4 | 3.5% |
| Swedish | 10 | 8.8% | View All 11 Rows |
Immigrants in Cogswell
The most numerous immigrant groups reported in Cogswell came from Europe (4 | 3.5%), Germany (4 | 3.5%), and Western Europe (4 | 3.5%), together accounting for 10.6% of all Cogswell residents.
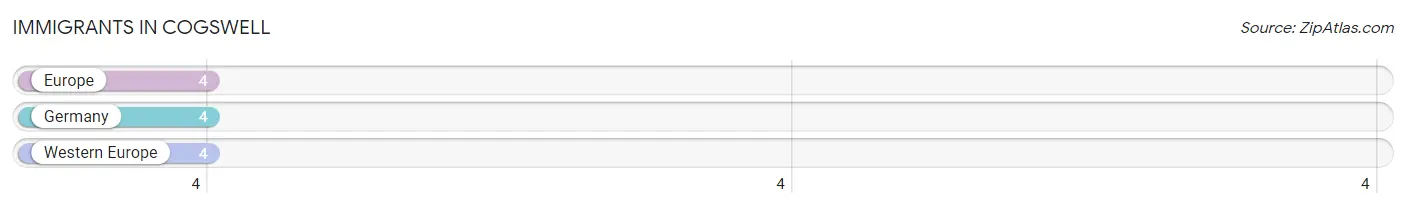
| Immigration Origin | # Population | % Population |
| Europe | 4 | 3.5% |
| Germany | 4 | 3.5% |
| Western Europe | 4 | 3.5% | View All 3 Rows |
Sex and Age in Cogswell
Sex and Age in Cogswell
The most populous age groups in Cogswell are 15 to 19 Years (24 | 34.8%) for men and 55 to 59 Years (17 | 38.6%) for women.
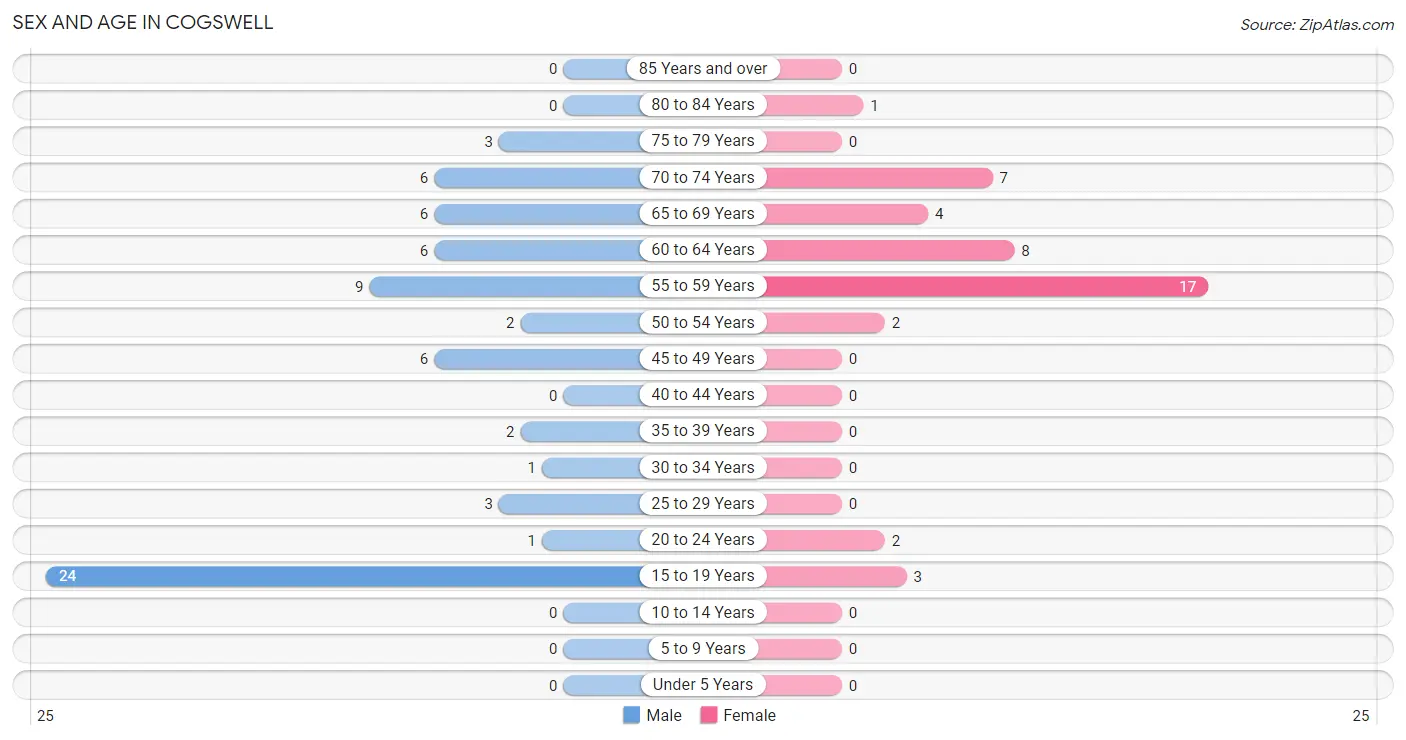
| Age Bracket | Male | Female |
| Under 5 Years | 0 (0.0%) | 0 (0.0%) |
| 5 to 9 Years | 0 (0.0%) | 0 (0.0%) |
| 10 to 14 Years | 0 (0.0%) | 0 (0.0%) |
| 15 to 19 Years | 24 (34.8%) | 3 (6.8%) |
| 20 to 24 Years | 1 (1.5%) | 2 (4.5%) |
| 25 to 29 Years | 3 (4.3%) | 0 (0.0%) |
| 30 to 34 Years | 1 (1.5%) | 0 (0.0%) |
| 35 to 39 Years | 2 (2.9%) | 0 (0.0%) |
| 40 to 44 Years | 0 (0.0%) | 0 (0.0%) |
| 45 to 49 Years | 6 (8.7%) | 0 (0.0%) |
| 50 to 54 Years | 2 (2.9%) | 2 (4.5%) |
| 55 to 59 Years | 9 (13.0%) | 17 (38.6%) |
| 60 to 64 Years | 6 (8.7%) | 8 (18.2%) |
| 65 to 69 Years | 6 (8.7%) | 4 (9.1%) |
| 70 to 74 Years | 6 (8.7%) | 7 (15.9%) |
| 75 to 79 Years | 3 (4.3%) | 0 (0.0%) |
| 80 to 84 Years | 0 (0.0%) | 1 (2.3%) |
| 85 Years and over | 0 (0.0%) | 0 (0.0%) |
| Total | 69 (100.0%) | 44 (100.0%) |
Families and Households in Cogswell
Median Family Size in Cogswell
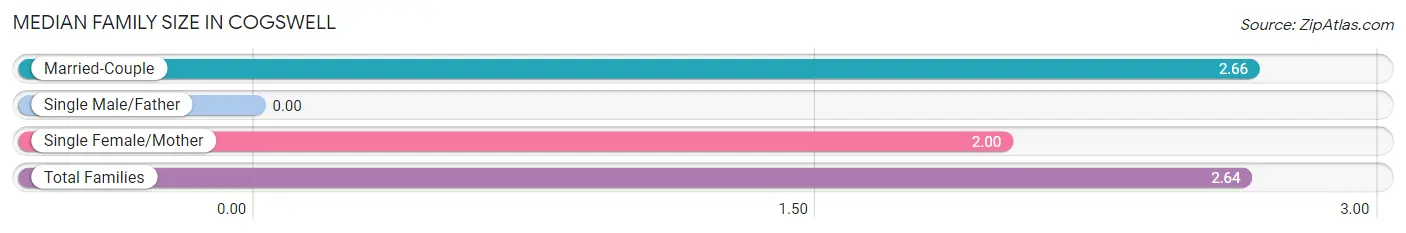
| Family Type | # Families | Family Size |
| Married-Couple | 35 (97.2%) | 2.66 |
| Single Male/Father | 0 (0.0%) | - |
| Single Female/Mother | 1 (2.8%) | 2.00 |
| Total Families | 36 (100.0%) | 2.64 |
Median Household Size in Cogswell
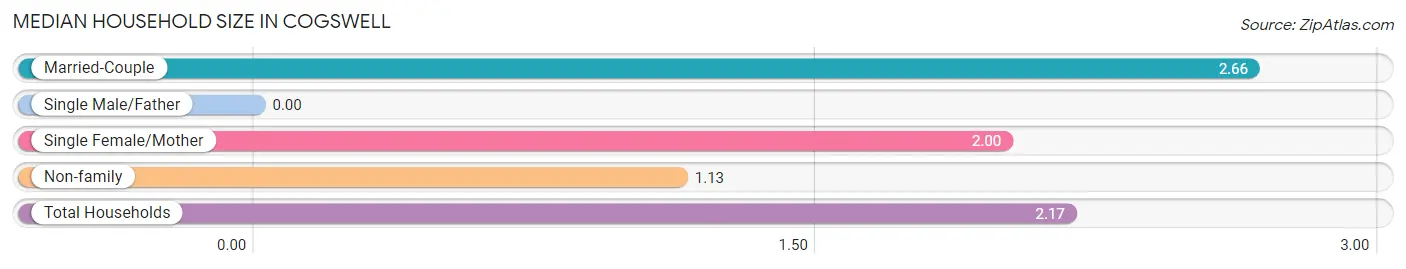
| Household Type | # Households | Household Size |
| Married-Couple | 35 (67.3%) | 2.66 |
| Single Male/Father | 0 (0.0%) | - |
| Single Female/Mother | 1 (1.9%) | 2.00 |
| Non-family | 16 (30.8%) | 1.13 |
| Total Households | 52 (100.0%) | 2.17 |
Household Size by Marriage Status in Cogswell
Out of a total of 52 households in Cogswell, 36 (69.2%) are family households, while 16 (30.8%) are nonfamily households. The most numerous type of family households are 2-person households, comprising 22, and the most common type of nonfamily households are 1-person households, comprising 15.
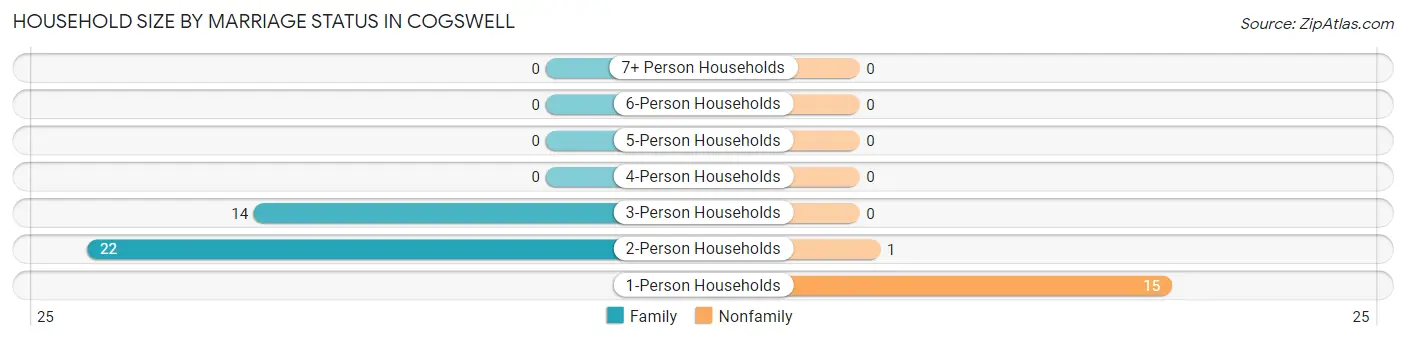
| Household Size | Family Households | Nonfamily Households |
| 1-Person Households | - | 15 (28.8%) |
| 2-Person Households | 22 (42.3%) | 1 (1.9%) |
| 3-Person Households | 14 (26.9%) | 0 (0.0%) |
| 4-Person Households | 0 (0.0%) | 0 (0.0%) |
| 5-Person Households | 0 (0.0%) | 0 (0.0%) |
| 6-Person Households | 0 (0.0%) | 0 (0.0%) |
| 7+ Person Households | 0 (0.0%) | 0 (0.0%) |
| Total | 36 (69.2%) | 16 (30.8%) |
Female Fertility in Cogswell
Fertility by Age in Cogswell
| Age Bracket | Women with Births | Births / 1,000 Women |
| 15 to 19 years | 0 (0.0%) | 0.0 |
| 20 to 34 years | 0 (0.0%) | 0.0 |
| 35 to 50 years | 0 (0.0%) | 0.0 |
| Total | 0 (0.0%) | 0.0 |
Fertility by Age by Marriage Status in Cogswell
| Age Bracket | Married | Unmarried |
| 15 to 19 years | 0 (0.0%) | 0 (0.0%) |
| 20 to 34 years | 0 (0.0%) | 0 (0.0%) |
| 35 to 50 years | 0 (0.0%) | 0 (0.0%) |
| Total | 0 (0.0%) | 0 (0.0%) |
Fertility by Education in Cogswell
| Educational Attainment | Women with Births | Births / 1,000 Women |
| Less than High School | 0 (0.0%) | 0.0 |
| High School Diploma | 0 (0.0%) | 0.0 |
| College or Associate's Degree | 0 (0.0%) | 0.0 |
| Bachelor's Degree | 0 (0.0%) | 0.0 |
| Graduate Degree | 0 (0.0%) | 0.0 |
| Total | 0 (0.0%) | 0.0 |
Fertility by Education by Marriage Status in Cogswell
| Educational Attainment | Married | Unmarried |
| Less than High School | 0 (0.0%) | 0 (0.0%) |
| High School Diploma | 0 (0.0%) | 0 (0.0%) |
| College or Associate's Degree | 0 (0.0%) | 0 (0.0%) |
| Bachelor's Degree | 0 (0.0%) | 0 (0.0%) |
| Graduate Degree | 0 (0.0%) | 0 (0.0%) |
| Total | 0 (0.0%) | 0 (0.0%) |
Employment Characteristics in Cogswell
Employment by Class of Employer in Cogswell
Among the 62 employed individuals in Cogswell, private company employees (35 | 56.5%), local government employees (16 | 25.8%), and self-employed (not incorporated) (7 | 11.3%) make up the most common classes of employment.
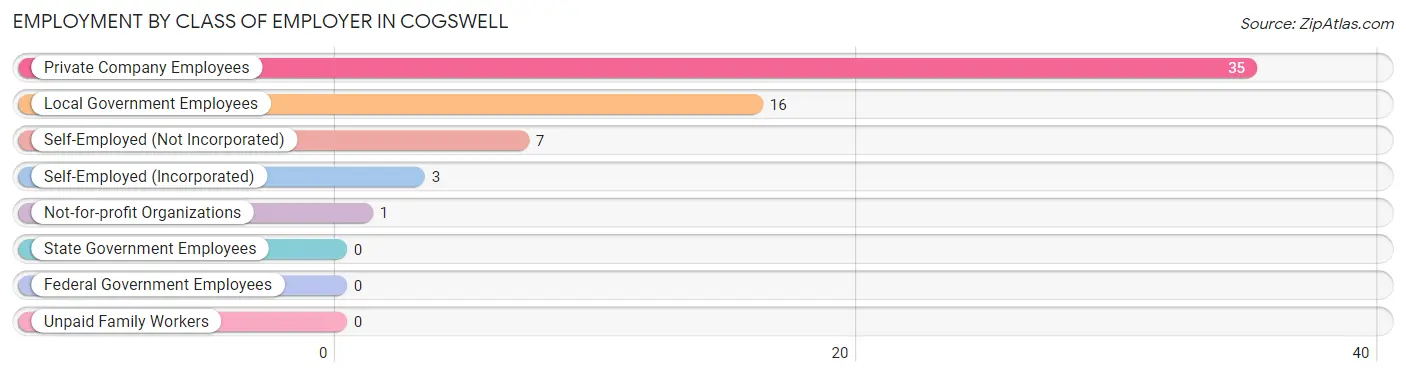
| Employer Class | # Employees | % Employees |
| Private Company Employees | 35 | 56.5% |
| Self-Employed (Incorporated) | 3 | 4.8% |
| Self-Employed (Not Incorporated) | 7 | 11.3% |
| Not-for-profit Organizations | 1 | 1.6% |
| Local Government Employees | 16 | 25.8% |
| State Government Employees | 0 | 0.0% |
| Federal Government Employees | 0 | 0.0% |
| Unpaid Family Workers | 0 | 0.0% |
| Total | 62 | 100.0% |
Employment Status by Age in Cogswell
According to the labor force statistics for Cogswell, out of the total population over 16 years of age (113), 56.6% or 64 individuals are in the labor force, with 3.1% or 2 of them unemployed. The age group with the highest labor force participation rate is 20 to 24 years, with 100.0% or 3 individuals in the labor force. Within the labor force, the 20 to 24 years age range has the highest percentage of unemployed individuals, with 66.7% or 2 of them being unemployed.
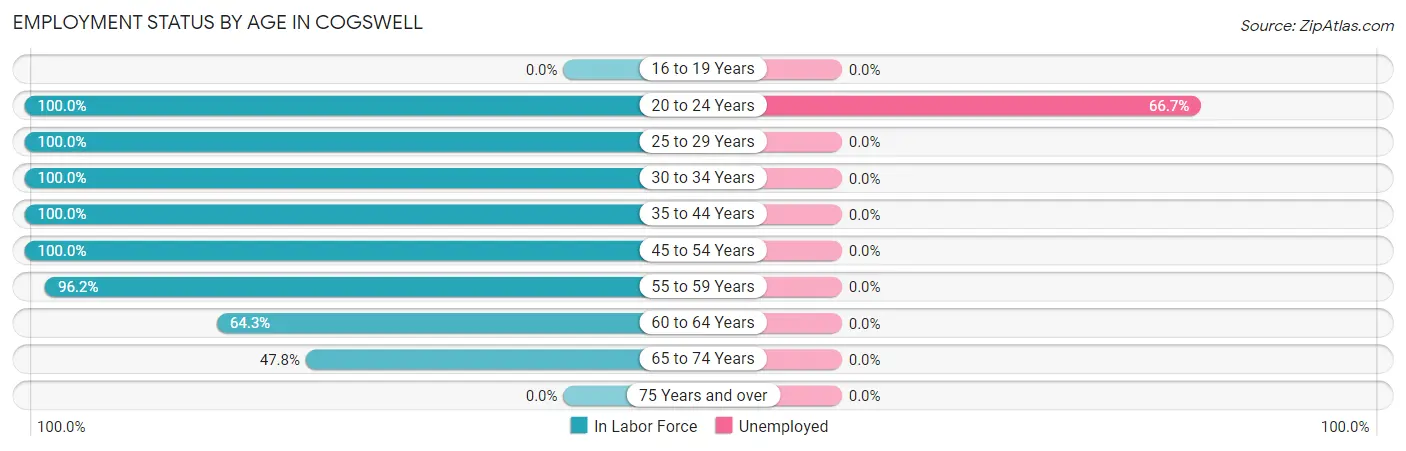
| Age Bracket | In Labor Force | Unemployed |
| 16 to 19 Years | 0 (0.0%) | 0 (0.0%) |
| 20 to 24 Years | 3 (100.0%) | 2 (66.7%) |
| 25 to 29 Years | 3 (100.0%) | 0 (0.0%) |
| 30 to 34 Years | 1 (100.0%) | 0 (0.0%) |
| 35 to 44 Years | 2 (100.0%) | 0 (0.0%) |
| 45 to 54 Years | 10 (100.0%) | 0 (0.0%) |
| 55 to 59 Years | 25 (96.2%) | 0 (0.0%) |
| 60 to 64 Years | 9 (64.3%) | 0 (0.0%) |
| 65 to 74 Years | 11 (47.8%) | 0 (0.0%) |
| 75 Years and over | 0 (0.0%) | 0 (0.0%) |
| Total | 64 (56.6%) | 2 (3.1%) |
Employment Status by Educational Attainment in Cogswell
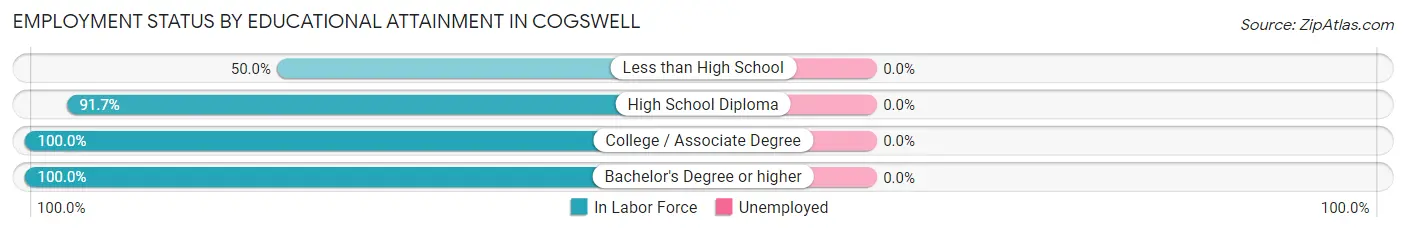
| Educational Attainment | In Labor Force | Unemployed |
| Less than High School | 3 (50.0%) | 0 (0.0%) |
| High School Diploma | 33 (91.7%) | 0 (0.0%) |
| College / Associate Degree | 12 (100.0%) | 0 (0.0%) |
| Bachelor's Degree or higher | 2 (100.0%) | 0 (0.0%) |
| Total | 50 (89.3%) | 0 (0.0%) |
Employment Occupations by Sex in Cogswell
Management, Business, Science and Arts Occupations
The most common Management, Business, Science and Arts occupations in Cogswell are Management (23 | 37.1%), and Business & Financial (5 | 8.1%).
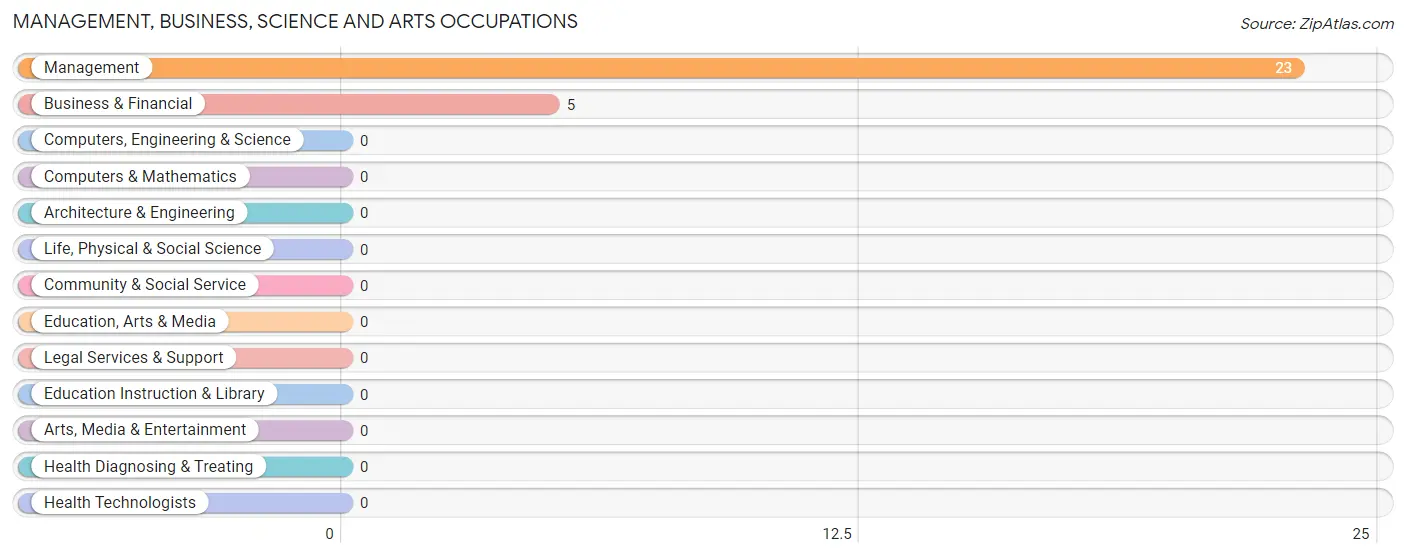
Management, Business, Science and Arts Occupations by Sex
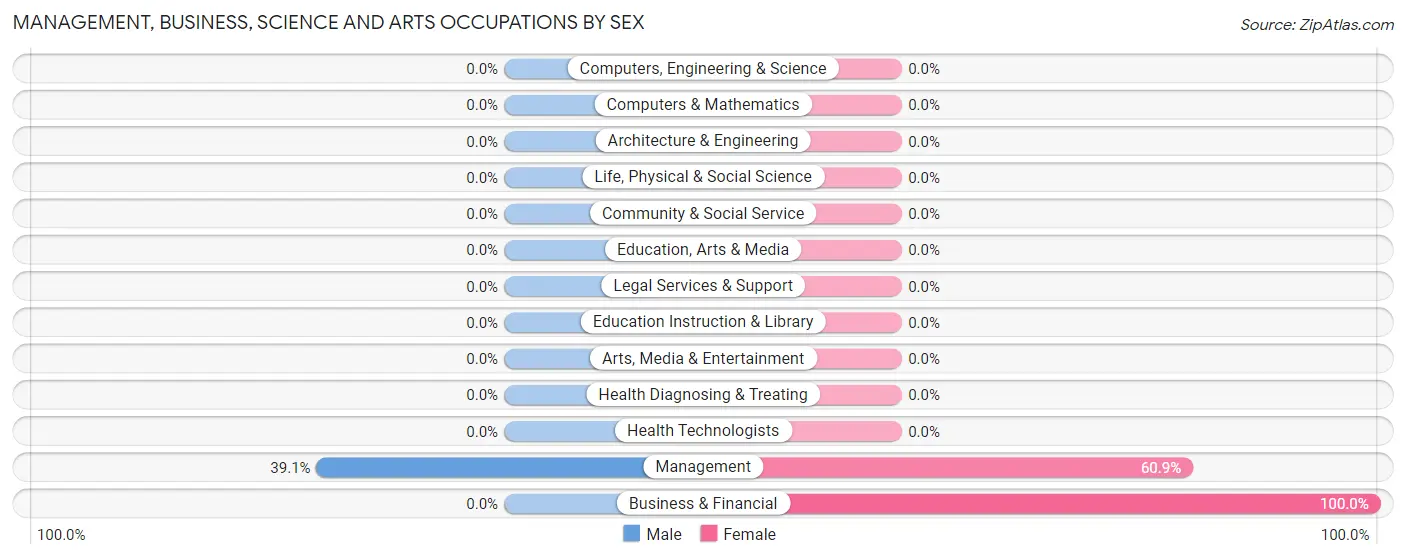
| Occupation | Male | Female |
| Management | 9 (39.1%) | 14 (60.9%) |
| Business & Financial | 0 (0.0%) | 5 (100.0%) |
| Computers, Engineering & Science | 0 (0.0%) | 0 (0.0%) |
| Computers & Mathematics | 0 (0.0%) | 0 (0.0%) |
| Architecture & Engineering | 0 (0.0%) | 0 (0.0%) |
| Life, Physical & Social Science | 0 (0.0%) | 0 (0.0%) |
| Community & Social Service | 0 (0.0%) | 0 (0.0%) |
| Education, Arts & Media | 0 (0.0%) | 0 (0.0%) |
| Legal Services & Support | 0 (0.0%) | 0 (0.0%) |
| Education Instruction & Library | 0 (0.0%) | 0 (0.0%) |
| Arts, Media & Entertainment | 0 (0.0%) | 0 (0.0%) |
| Health Diagnosing & Treating | 0 (0.0%) | 0 (0.0%) |
| Health Technologists | 0 (0.0%) | 0 (0.0%) |
| Total (Category) | 9 (32.1%) | 19 (67.9%) |
| Total (Overall) | 34 (54.8%) | 28 (45.2%) |
Services Occupations
The most common Services occupations in Cogswell are Cleaning & Maintenance (2 | 3.2%), and Food Preparation & Serving (1 | 1.6%).
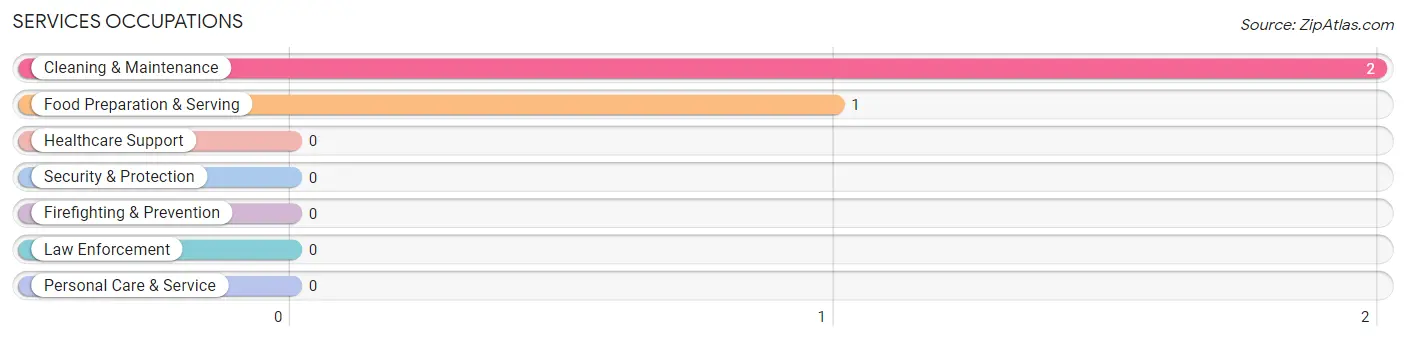
Services Occupations by Sex
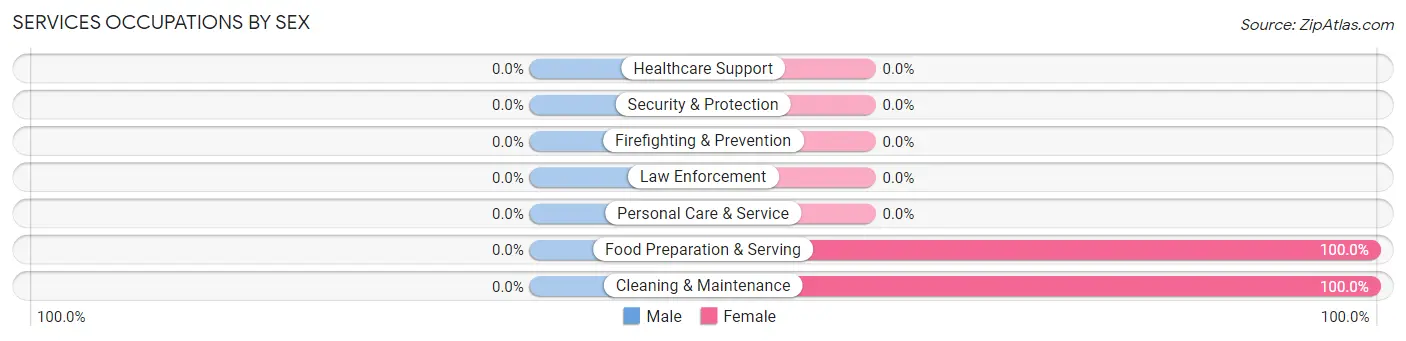
| Occupation | Male | Female |
| Healthcare Support | 0 (0.0%) | 0 (0.0%) |
| Security & Protection | 0 (0.0%) | 0 (0.0%) |
| Firefighting & Prevention | 0 (0.0%) | 0 (0.0%) |
| Law Enforcement | 0 (0.0%) | 0 (0.0%) |
| Food Preparation & Serving | 0 (0.0%) | 1 (100.0%) |
| Cleaning & Maintenance | 0 (0.0%) | 2 (100.0%) |
| Personal Care & Service | 0 (0.0%) | 0 (0.0%) |
| Total (Category) | 0 (0.0%) | 3 (100.0%) |
| Total (Overall) | 34 (54.8%) | 28 (45.2%) |
Sales and Office Occupations
The most common Sales and Office occupations in Cogswell are Office & Administration (4 | 6.5%), and Sales & Related (2 | 3.2%).
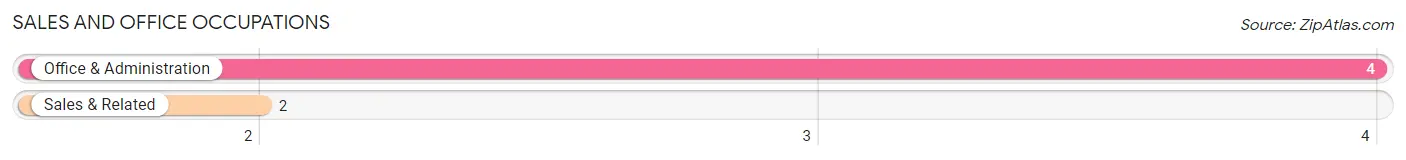
Sales and Office Occupations by Sex
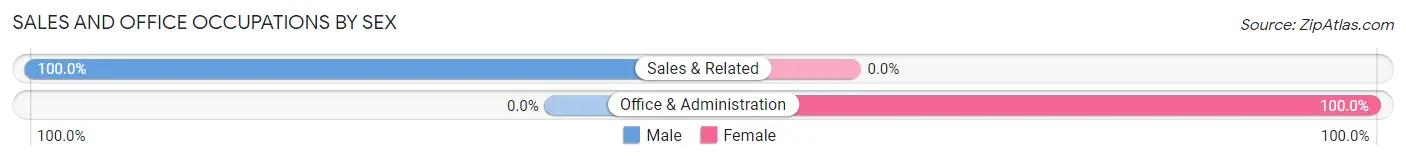
| Occupation | Male | Female |
| Sales & Related | 2 (100.0%) | 0 (0.0%) |
| Office & Administration | 0 (0.0%) | 4 (100.0%) |
| Total (Category) | 2 (33.3%) | 4 (66.7%) |
| Total (Overall) | 34 (54.8%) | 28 (45.2%) |
Natural Resources, Construction and Maintenance Occupations
The most common Natural Resources, Construction and Maintenance occupations in Cogswell are Construction & Extraction (14 | 22.6%), Installation, Maintenance & Repair (2 | 3.2%), and Farming, Fishing & Forestry (1 | 1.6%).
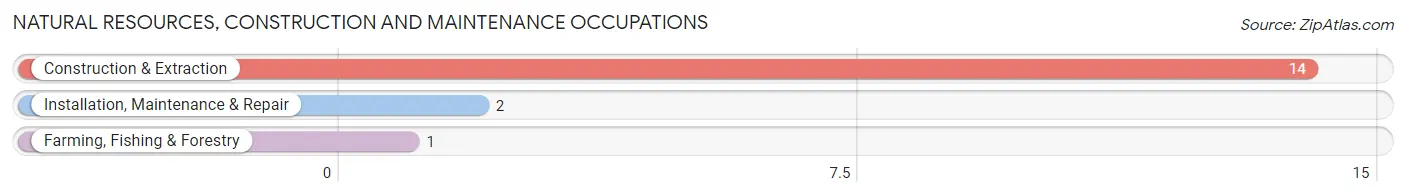
Natural Resources, Construction and Maintenance Occupations by Sex
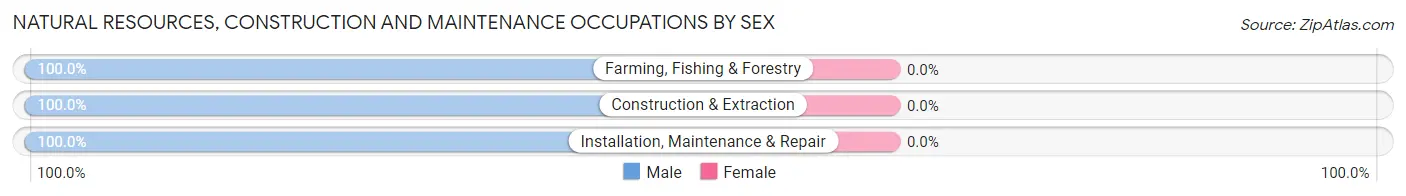
| Occupation | Male | Female |
| Farming, Fishing & Forestry | 1 (100.0%) | 0 (0.0%) |
| Construction & Extraction | 14 (100.0%) | 0 (0.0%) |
| Installation, Maintenance & Repair | 2 (100.0%) | 0 (0.0%) |
| Total (Category) | 17 (100.0%) | 0 (0.0%) |
| Total (Overall) | 34 (54.8%) | 28 (45.2%) |
Production, Transportation and Moving Occupations
The most common Production, Transportation and Moving occupations in Cogswell are Production (6 | 9.7%), and Transportation (2 | 3.2%).
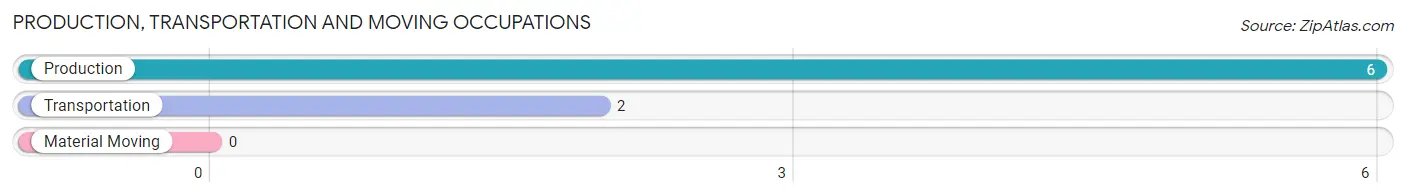
Production, Transportation and Moving Occupations by Sex
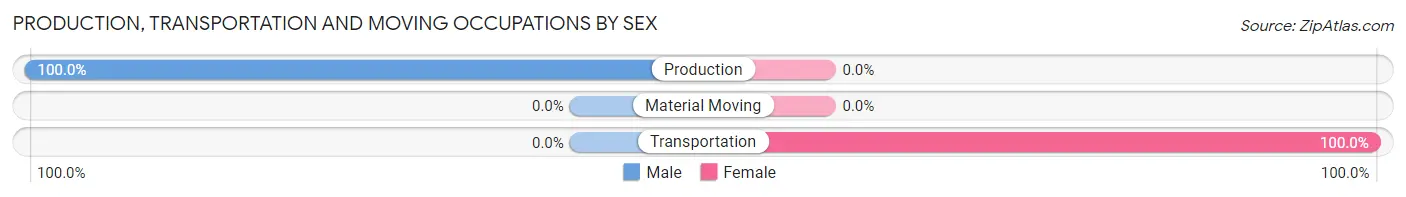
| Occupation | Male | Female |
| Production | 6 (100.0%) | 0 (0.0%) |
| Transportation | 0 (0.0%) | 2 (100.0%) |
| Material Moving | 0 (0.0%) | 0 (0.0%) |
| Total (Category) | 6 (75.0%) | 2 (25.0%) |
| Total (Overall) | 34 (54.8%) | 28 (45.2%) |
Employment Industries by Sex in Cogswell
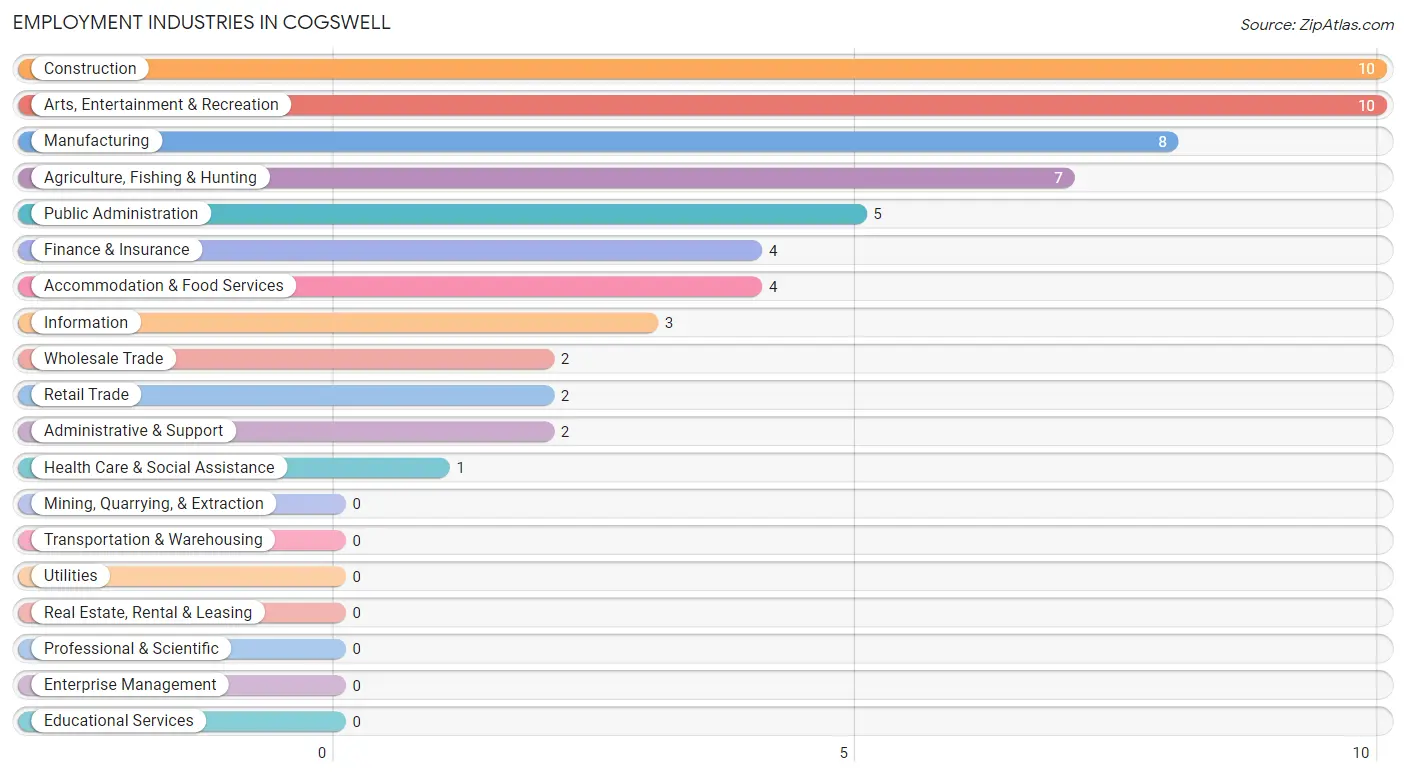
Employment Industries in Cogswell
The major employment industries in Cogswell include Construction (10 | 16.1%), Arts, Entertainment & Recreation (10 | 16.1%), Manufacturing (8 | 12.9%), Agriculture, Fishing & Hunting (7 | 11.3%), and Public Administration (5 | 8.1%).
Employment Industries by Sex in Cogswell
The Cogswell industries that see more men than women are Agriculture, Fishing & Hunting (100.0%), Construction (100.0%), and Wholesale Trade (100.0%), whereas the industries that tend to have a higher number of women are Finance & Insurance (100.0%), Administrative & Support (100.0%), and Health Care & Social Assistance (100.0%).
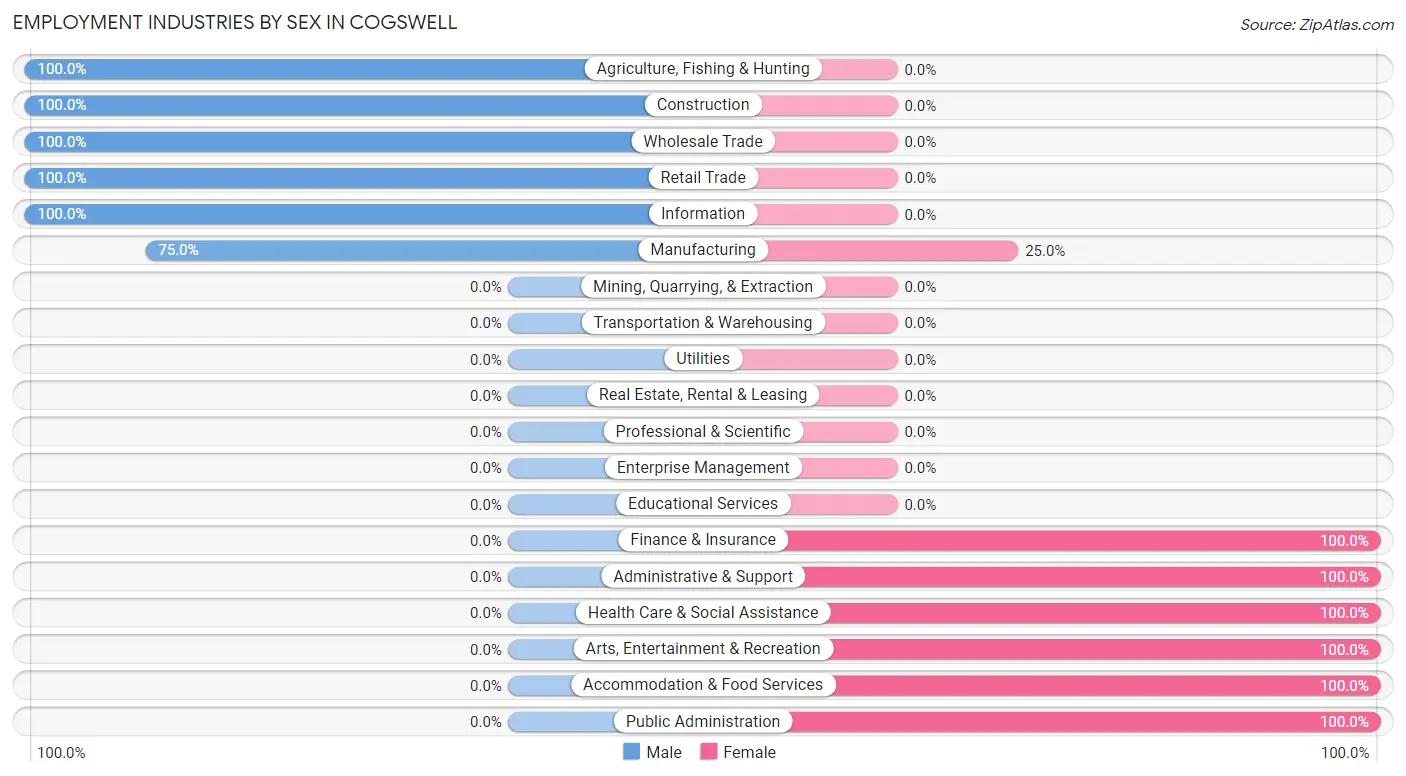
| Industry | Male | Female |
| Agriculture, Fishing & Hunting | 7 (100.0%) | 0 (0.0%) |
| Mining, Quarrying, & Extraction | 0 (0.0%) | 0 (0.0%) |
| Construction | 10 (100.0%) | 0 (0.0%) |
| Manufacturing | 6 (75.0%) | 2 (25.0%) |
| Wholesale Trade | 2 (100.0%) | 0 (0.0%) |
| Retail Trade | 2 (100.0%) | 0 (0.0%) |
| Transportation & Warehousing | 0 (0.0%) | 0 (0.0%) |
| Utilities | 0 (0.0%) | 0 (0.0%) |
| Information | 3 (100.0%) | 0 (0.0%) |
| Finance & Insurance | 0 (0.0%) | 4 (100.0%) |
| Real Estate, Rental & Leasing | 0 (0.0%) | 0 (0.0%) |
| Professional & Scientific | 0 (0.0%) | 0 (0.0%) |
| Enterprise Management | 0 (0.0%) | 0 (0.0%) |
| Administrative & Support | 0 (0.0%) | 2 (100.0%) |
| Educational Services | 0 (0.0%) | 0 (0.0%) |
| Health Care & Social Assistance | 0 (0.0%) | 1 (100.0%) |
| Arts, Entertainment & Recreation | 0 (0.0%) | 10 (100.0%) |
| Accommodation & Food Services | 0 (0.0%) | 4 (100.0%) |
| Public Administration | 0 (0.0%) | 5 (100.0%) |
| Total | 34 (54.8%) | 28 (45.2%) |
Education in Cogswell
School Enrollment in Cogswell
The most common levels of schooling among the 29 students in Cogswell are high school (24 | 82.8%), and college / undergraduate (5 | 17.2%).
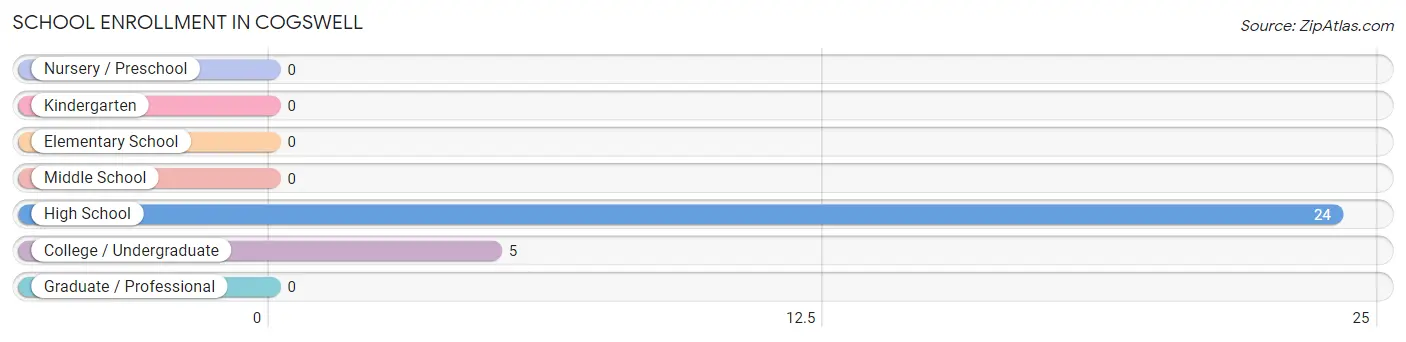
| School Level | # Students | % Students |
| Nursery / Preschool | 0 | 0.0% |
| Kindergarten | 0 | 0.0% |
| Elementary School | 0 | 0.0% |
| Middle School | 0 | 0.0% |
| High School | 24 | 82.8% |
| College / Undergraduate | 5 | 17.2% |
| Graduate / Professional | 0 | 0.0% |
| Total | 29 | 100.0% |
School Enrollment by Age by Funding Source in Cogswell
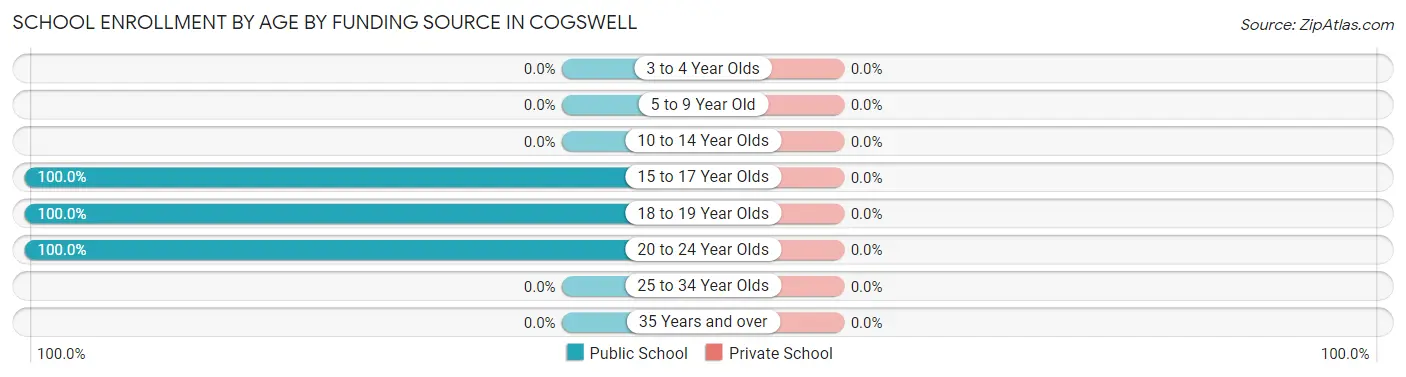
| Age Bracket | Public School | Private School |
| 3 to 4 Year Olds | 0 (0.0%) | 0 (0.0%) |
| 5 to 9 Year Old | 0 (0.0%) | 0 (0.0%) |
| 10 to 14 Year Olds | 0 (0.0%) | 0 (0.0%) |
| 15 to 17 Year Olds | 24 (100.0%) | 0 (0.0%) |
| 18 to 19 Year Olds | 3 (100.0%) | 0 (0.0%) |
| 20 to 24 Year Olds | 2 (100.0%) | 0 (0.0%) |
| 25 to 34 Year Olds | 0 (0.0%) | 0 (0.0%) |
| 35 Years and over | 0 (0.0%) | 0 (0.0%) |
| Total | 29 (100.0%) | 0 (0.0%) |
Educational Attainment by Field of Study in Cogswell
, and science & technology (3 | 100.0%) are the most common fields of study among 3 individuals in Cogswell who have obtained a bachelor's degree or higher.
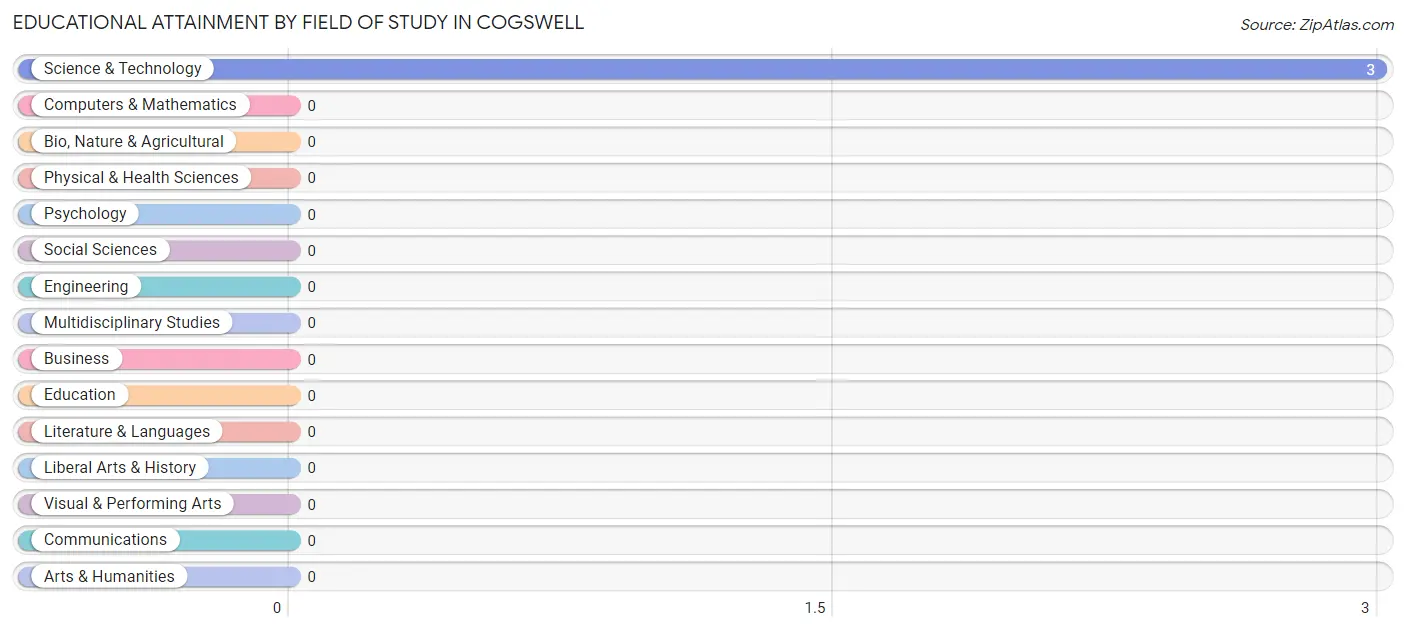
| Field of Study | # Graduates | % Graduates |
| Computers & Mathematics | 0 | 0.0% |
| Bio, Nature & Agricultural | 0 | 0.0% |
| Physical & Health Sciences | 0 | 0.0% |
| Psychology | 0 | 0.0% |
| Social Sciences | 0 | 0.0% |
| Engineering | 0 | 0.0% |
| Multidisciplinary Studies | 0 | 0.0% |
| Science & Technology | 3 | 100.0% |
| Business | 0 | 0.0% |
| Education | 0 | 0.0% |
| Literature & Languages | 0 | 0.0% |
| Liberal Arts & History | 0 | 0.0% |
| Visual & Performing Arts | 0 | 0.0% |
| Communications | 0 | 0.0% |
| Arts & Humanities | 0 | 0.0% |
| Total | 3 | 100.0% |
Transportation & Commute in Cogswell
Vehicle Availability by Sex in Cogswell
The most prevalent vehicle ownership categories in Cogswell are males with 2 vehicles (16, accounting for 47.1%) and females with 2 vehicles (10, making up 57.1%).
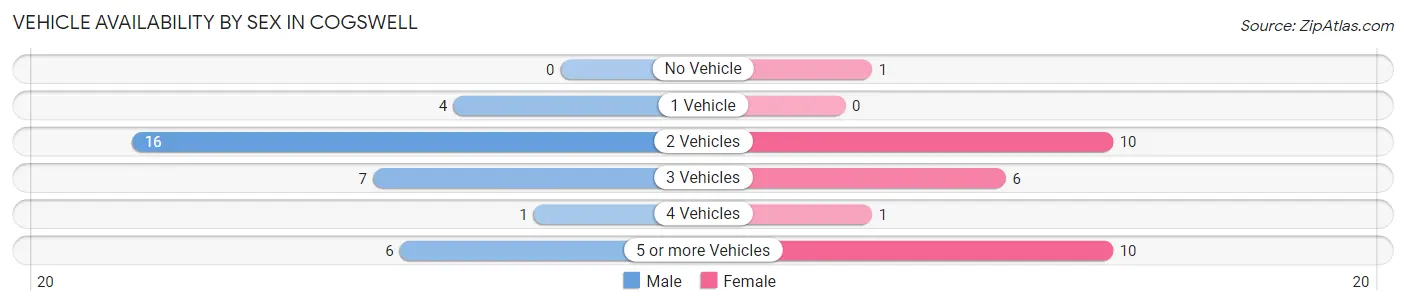
| Vehicles Available | Male | Female |
| No Vehicle | 0 (0.0%) | 1 (3.6%) |
| 1 Vehicle | 4 (11.8%) | 0 (0.0%) |
| 2 Vehicles | 16 (47.1%) | 10 (35.7%) |
| 3 Vehicles | 7 (20.6%) | 6 (21.4%) |
| 4 Vehicles | 1 (2.9%) | 1 (3.6%) |
| 5 or more Vehicles | 6 (17.6%) | 10 (35.7%) |
| Total | 34 (100.0%) | 28 (100.0%) |
Commute Time in Cogswell
The most frequently occuring commute durations in Cogswell are 20 to 24 minutes (17 commuters, 28.8%), 10 to 14 minutes (10 commuters, 17.0%), and 15 to 19 minutes (6 commuters, 10.2%).
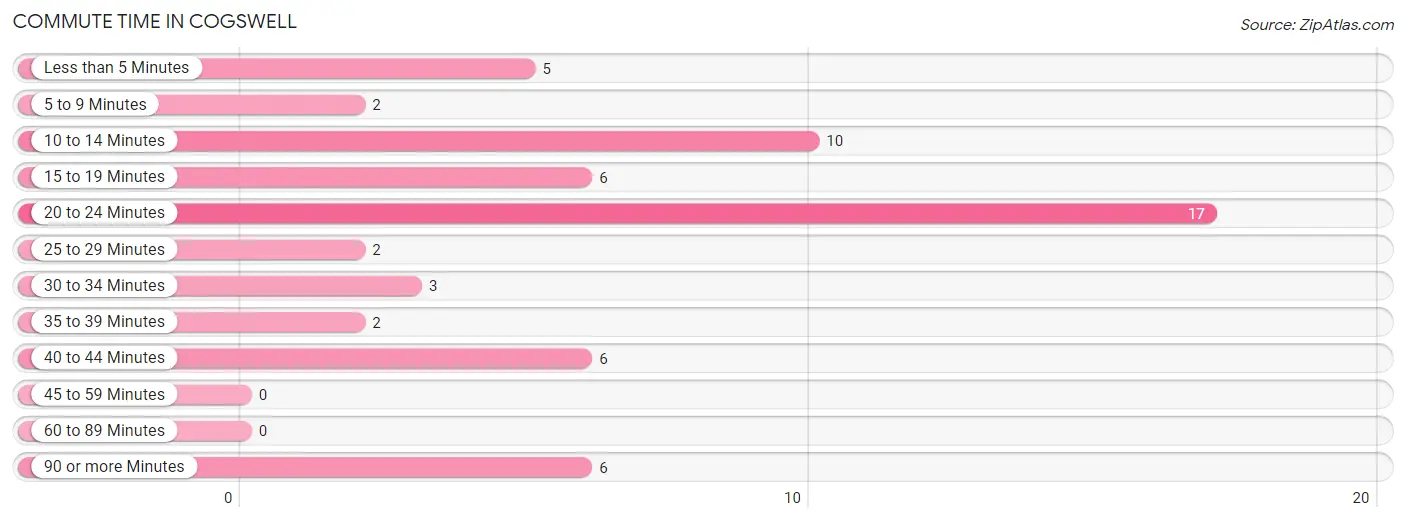
| Commute Time | # Commuters | % Commuters |
| Less than 5 Minutes | 5 | 8.5% |
| 5 to 9 Minutes | 2 | 3.4% |
| 10 to 14 Minutes | 10 | 17.0% |
| 15 to 19 Minutes | 6 | 10.2% |
| 20 to 24 Minutes | 17 | 28.8% |
| 25 to 29 Minutes | 2 | 3.4% |
| 30 to 34 Minutes | 3 | 5.1% |
| 35 to 39 Minutes | 2 | 3.4% |
| 40 to 44 Minutes | 6 | 10.2% |
| 45 to 59 Minutes | 0 | 0.0% |
| 60 to 89 Minutes | 0 | 0.0% |
| 90 or more Minutes | 6 | 10.2% |
Commute Time by Sex in Cogswell
The most common commute times in Cogswell are 20 to 24 minutes (7 commuters, 22.6%) for males and 20 to 24 minutes (10 commuters, 35.7%) for females.
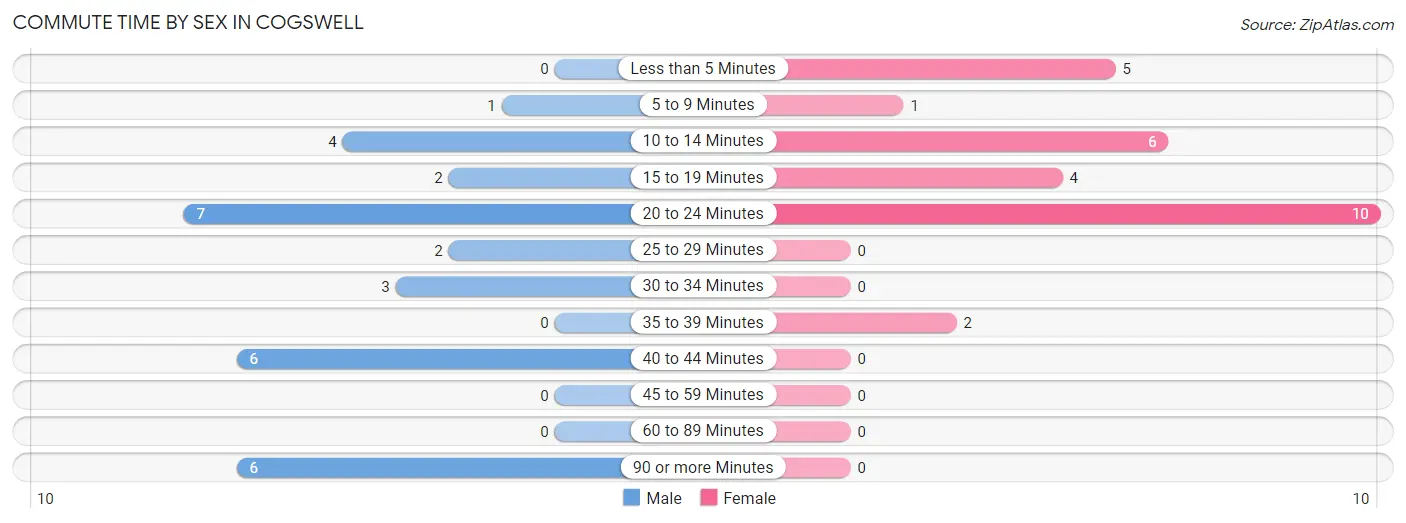
| Commute Time | Male | Female |
| Less than 5 Minutes | 0 (0.0%) | 5 (17.9%) |
| 5 to 9 Minutes | 1 (3.2%) | 1 (3.6%) |
| 10 to 14 Minutes | 4 (12.9%) | 6 (21.4%) |
| 15 to 19 Minutes | 2 (6.5%) | 4 (14.3%) |
| 20 to 24 Minutes | 7 (22.6%) | 10 (35.7%) |
| 25 to 29 Minutes | 2 (6.5%) | 0 (0.0%) |
| 30 to 34 Minutes | 3 (9.7%) | 0 (0.0%) |
| 35 to 39 Minutes | 0 (0.0%) | 2 (7.1%) |
| 40 to 44 Minutes | 6 (19.4%) | 0 (0.0%) |
| 45 to 59 Minutes | 0 (0.0%) | 0 (0.0%) |
| 60 to 89 Minutes | 0 (0.0%) | 0 (0.0%) |
| 90 or more Minutes | 6 (19.4%) | 0 (0.0%) |
Time of Departure to Work by Sex in Cogswell
The most frequent times of departure to work in Cogswell are 7:00 AM to 7:29 AM (13, 41.9%) for males and 9:00 AM to 9:59 AM (10, 35.7%) for females.
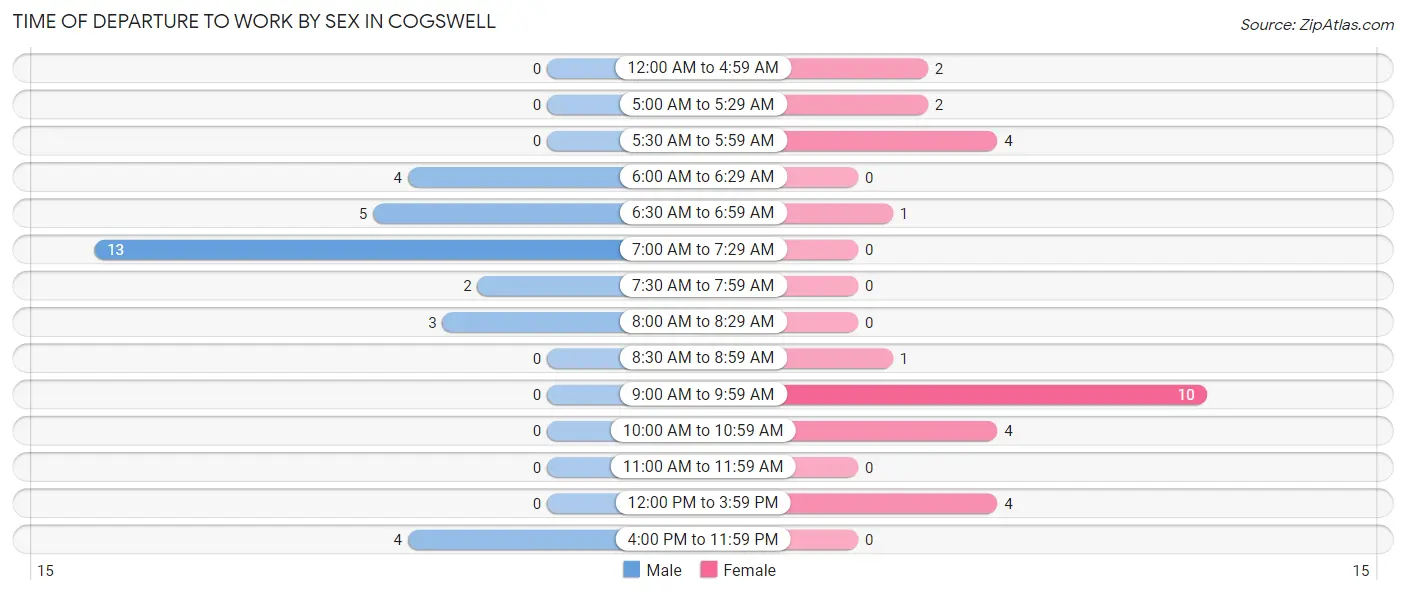
| Time of Departure | Male | Female |
| 12:00 AM to 4:59 AM | 0 (0.0%) | 2 (7.1%) |
| 5:00 AM to 5:29 AM | 0 (0.0%) | 2 (7.1%) |
| 5:30 AM to 5:59 AM | 0 (0.0%) | 4 (14.3%) |
| 6:00 AM to 6:29 AM | 4 (12.9%) | 0 (0.0%) |
| 6:30 AM to 6:59 AM | 5 (16.1%) | 1 (3.6%) |
| 7:00 AM to 7:29 AM | 13 (41.9%) | 0 (0.0%) |
| 7:30 AM to 7:59 AM | 2 (6.5%) | 0 (0.0%) |
| 8:00 AM to 8:29 AM | 3 (9.7%) | 0 (0.0%) |
| 8:30 AM to 8:59 AM | 0 (0.0%) | 1 (3.6%) |
| 9:00 AM to 9:59 AM | 0 (0.0%) | 10 (35.7%) |
| 10:00 AM to 10:59 AM | 0 (0.0%) | 4 (14.3%) |
| 11:00 AM to 11:59 AM | 0 (0.0%) | 0 (0.0%) |
| 12:00 PM to 3:59 PM | 0 (0.0%) | 4 (14.3%) |
| 4:00 PM to 11:59 PM | 4 (12.9%) | 0 (0.0%) |
| Total | 31 (100.0%) | 28 (100.0%) |
Housing Occupancy in Cogswell
Occupancy by Ownership in Cogswell
Of the total 52 dwellings in Cogswell, owner-occupied units account for 41 (78.8%), while renter-occupied units make up 11 (21.1%).
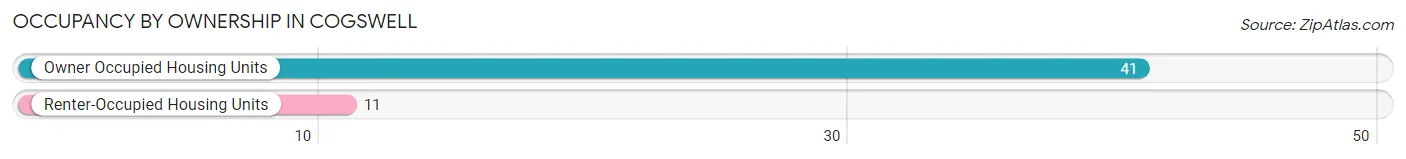
| Occupancy | # Housing Units | % Housing Units |
| Owner Occupied Housing Units | 41 | 78.8% |
| Renter-Occupied Housing Units | 11 | 21.1% |
| Total Occupied Housing Units | 52 | 100.0% |
Occupancy by Household Size in Cogswell
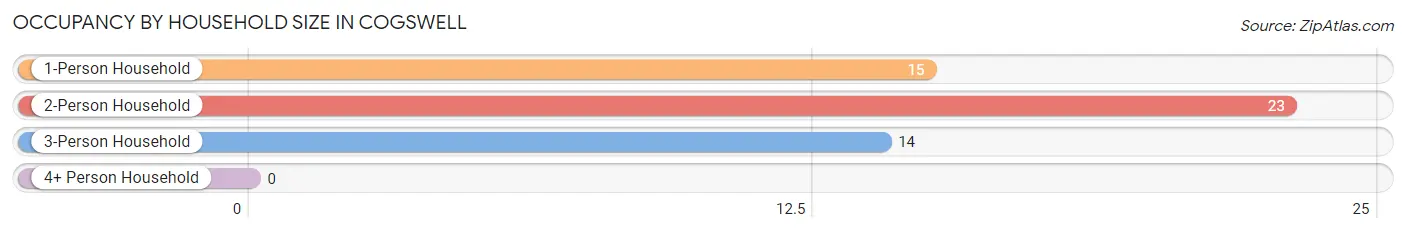
| Household Size | # Housing Units | % Housing Units |
| 1-Person Household | 15 | 28.8% |
| 2-Person Household | 23 | 44.2% |
| 3-Person Household | 14 | 26.9% |
| 4+ Person Household | 0 | 0.0% |
| Total Housing Units | 52 | 100.0% |
Occupancy by Ownership by Household Size in Cogswell
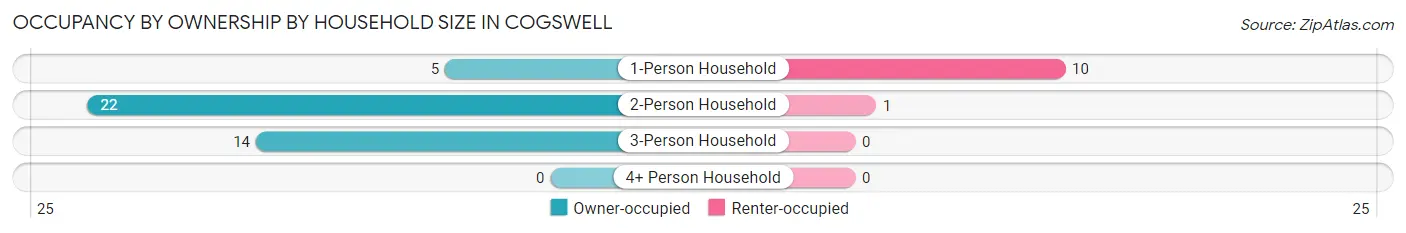
| Household Size | Owner-occupied | Renter-occupied |
| 1-Person Household | 5 (33.3%) | 10 (66.7%) |
| 2-Person Household | 22 (95.7%) | 1 (4.3%) |
| 3-Person Household | 14 (100.0%) | 0 (0.0%) |
| 4+ Person Household | 0 (0.0%) | 0 (0.0%) |
| Total Housing Units | 41 (78.8%) | 11 (21.1%) |
Occupancy by Educational Attainment in Cogswell
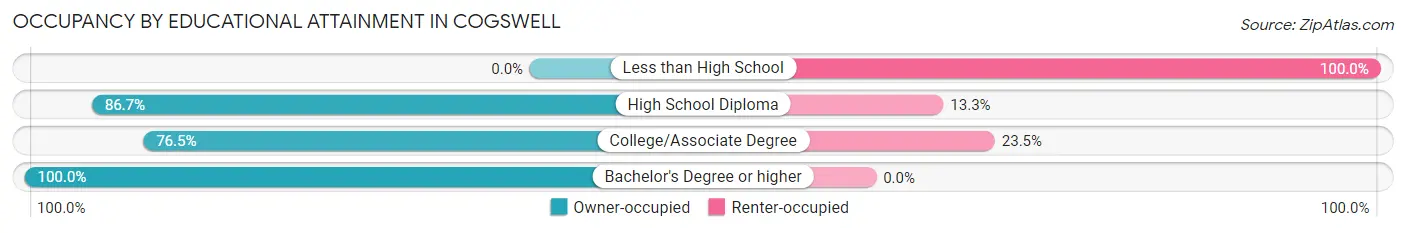
| Household Size | Owner-occupied | Renter-occupied |
| Less than High School | 0 (0.0%) | 3 (100.0%) |
| High School Diploma | 26 (86.7%) | 4 (13.3%) |
| College/Associate Degree | 13 (76.5%) | 4 (23.5%) |
| Bachelor's Degree or higher | 2 (100.0%) | 0 (0.0%) |
Occupancy by Age of Householder in Cogswell
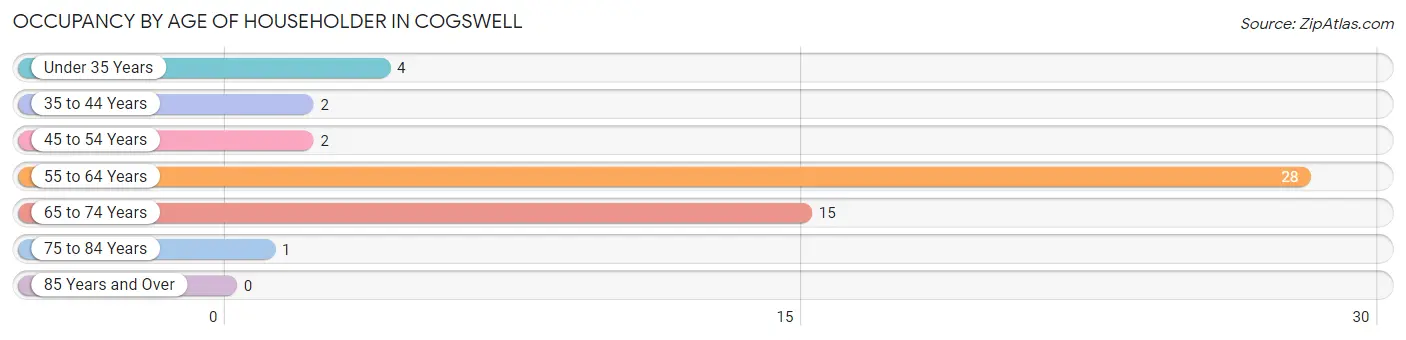
| Age Bracket | # Households | % Households |
| Under 35 Years | 4 | 7.7% |
| 35 to 44 Years | 2 | 3.8% |
| 45 to 54 Years | 2 | 3.8% |
| 55 to 64 Years | 28 | 53.8% |
| 65 to 74 Years | 15 | 28.8% |
| 75 to 84 Years | 1 | 1.9% |
| 85 Years and Over | 0 | 0.0% |
| Total | 52 | 100.0% |
Housing Finances in Cogswell
Median Income by Occupancy in Cogswell
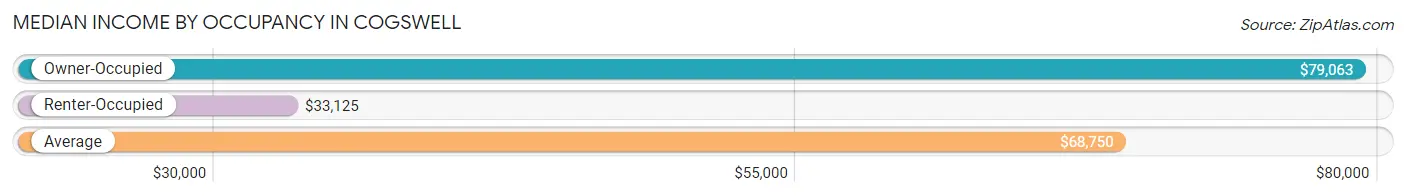
| Occupancy Type | # Households | Median Income |
| Owner-Occupied | 41 (78.8%) | $79,063 |
| Renter-Occupied | 11 (21.1%) | $33,125 |
| Average | 52 (100.0%) | $68,750 |
Occupancy by Householder Income Bracket in Cogswell
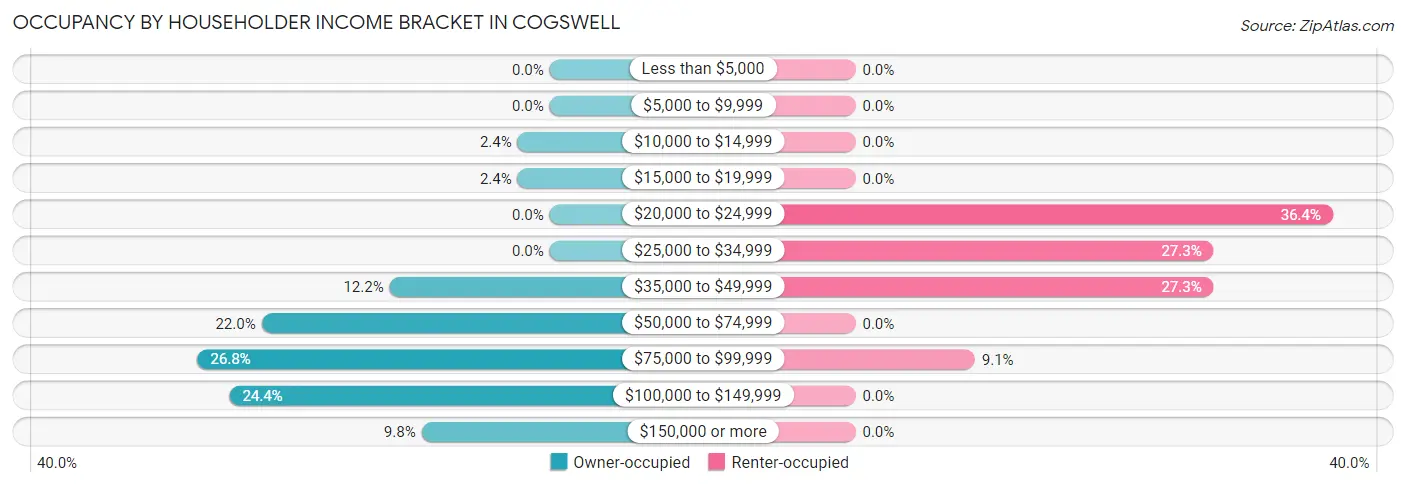
| Income Bracket | Owner-occupied | Renter-occupied |
| Less than $5,000 | 0 (0.0%) | 0 (0.0%) |
| $5,000 to $9,999 | 0 (0.0%) | 0 (0.0%) |
| $10,000 to $14,999 | 1 (2.4%) | 0 (0.0%) |
| $15,000 to $19,999 | 1 (2.4%) | 0 (0.0%) |
| $20,000 to $24,999 | 0 (0.0%) | 4 (36.4%) |
| $25,000 to $34,999 | 0 (0.0%) | 3 (27.3%) |
| $35,000 to $49,999 | 5 (12.2%) | 3 (27.3%) |
| $50,000 to $74,999 | 9 (22.0%) | 0 (0.0%) |
| $75,000 to $99,999 | 11 (26.8%) | 1 (9.1%) |
| $100,000 to $149,999 | 10 (24.4%) | 0 (0.0%) |
| $150,000 or more | 4 (9.8%) | 0 (0.0%) |
| Total | 41 (100.0%) | 11 (100.0%) |
Monthly Housing Cost Tiers in Cogswell
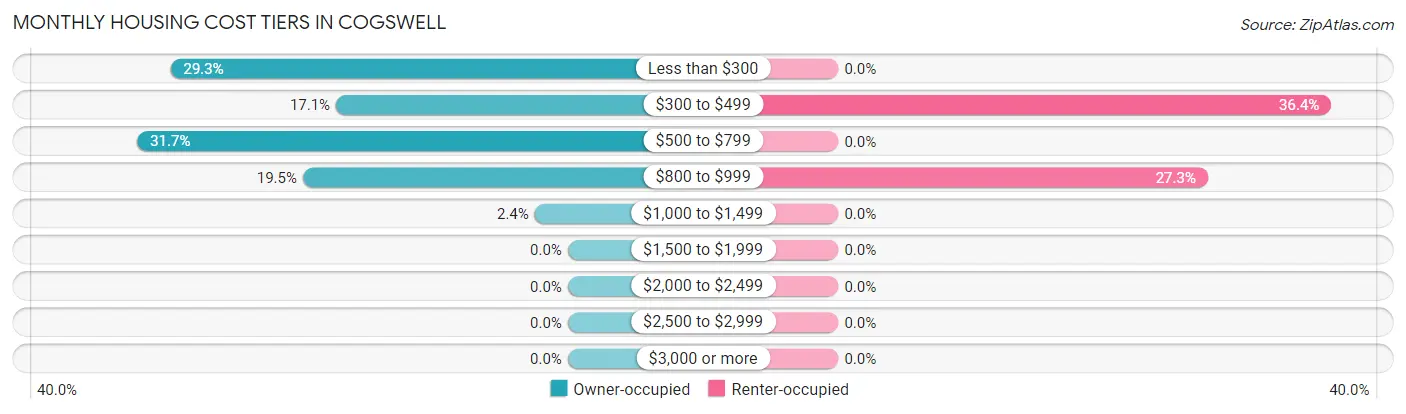
| Monthly Cost | Owner-occupied | Renter-occupied |
| Less than $300 | 12 (29.3%) | 0 (0.0%) |
| $300 to $499 | 7 (17.1%) | 4 (36.4%) |
| $500 to $799 | 13 (31.7%) | 0 (0.0%) |
| $800 to $999 | 8 (19.5%) | 3 (27.3%) |
| $1,000 to $1,499 | 1 (2.4%) | 0 (0.0%) |
| $1,500 to $1,999 | 0 (0.0%) | 0 (0.0%) |
| $2,000 to $2,499 | 0 (0.0%) | 0 (0.0%) |
| $2,500 to $2,999 | 0 (0.0%) | 0 (0.0%) |
| $3,000 or more | 0 (0.0%) | 0 (0.0%) |
| Total | 41 (100.0%) | 11 (100.0%) |
Physical Housing Characteristics in Cogswell
Housing Structures in Cogswell
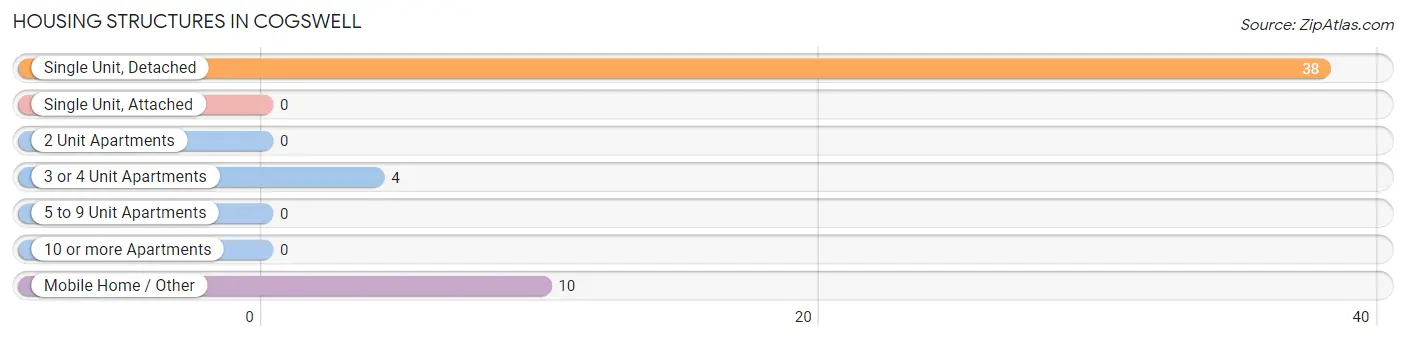
| Structure Type | # Housing Units | % Housing Units |
| Single Unit, Detached | 38 | 73.1% |
| Single Unit, Attached | 0 | 0.0% |
| 2 Unit Apartments | 0 | 0.0% |
| 3 or 4 Unit Apartments | 4 | 7.7% |
| 5 to 9 Unit Apartments | 0 | 0.0% |
| 10 or more Apartments | 0 | 0.0% |
| Mobile Home / Other | 10 | 19.2% |
| Total | 52 | 100.0% |
Housing Structures by Occupancy in Cogswell
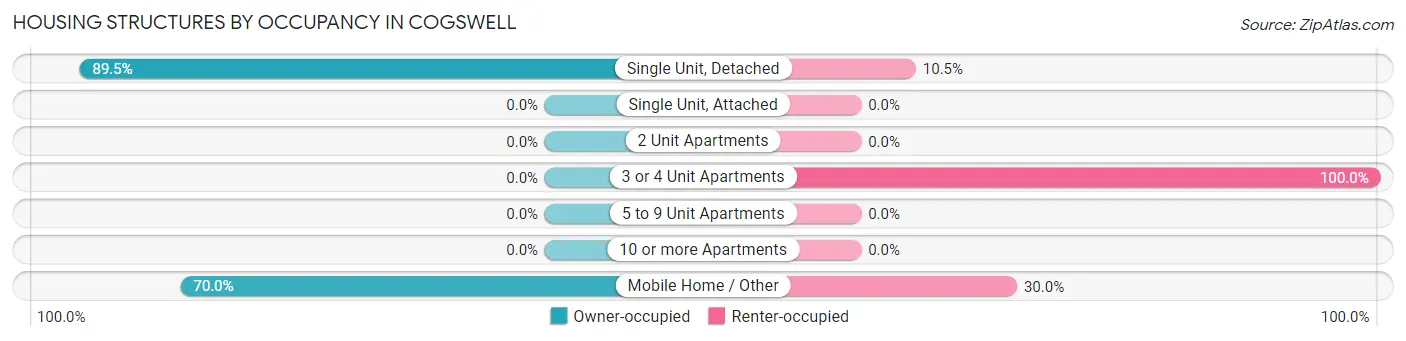
| Structure Type | Owner-occupied | Renter-occupied |
| Single Unit, Detached | 34 (89.5%) | 4 (10.5%) |
| Single Unit, Attached | 0 (0.0%) | 0 (0.0%) |
| 2 Unit Apartments | 0 (0.0%) | 0 (0.0%) |
| 3 or 4 Unit Apartments | 0 (0.0%) | 4 (100.0%) |
| 5 to 9 Unit Apartments | 0 (0.0%) | 0 (0.0%) |
| 10 or more Apartments | 0 (0.0%) | 0 (0.0%) |
| Mobile Home / Other | 7 (70.0%) | 3 (30.0%) |
| Total | 41 (78.8%) | 11 (21.1%) |
Housing Structures by Number of Rooms in Cogswell
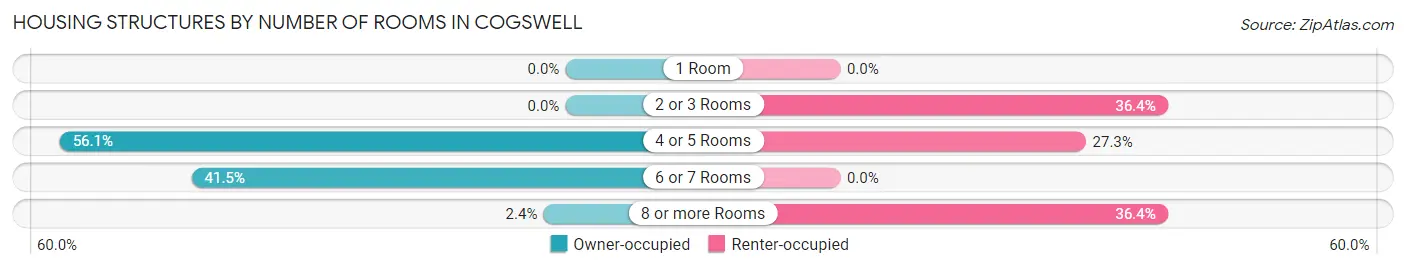
| Number of Rooms | Owner-occupied | Renter-occupied |
| 1 Room | 0 (0.0%) | 0 (0.0%) |
| 2 or 3 Rooms | 0 (0.0%) | 4 (36.4%) |
| 4 or 5 Rooms | 23 (56.1%) | 3 (27.3%) |
| 6 or 7 Rooms | 17 (41.5%) | 0 (0.0%) |
| 8 or more Rooms | 1 (2.4%) | 4 (36.4%) |
| Total | 41 (100.0%) | 11 (100.0%) |
Housing Structure by Heating Type in Cogswell
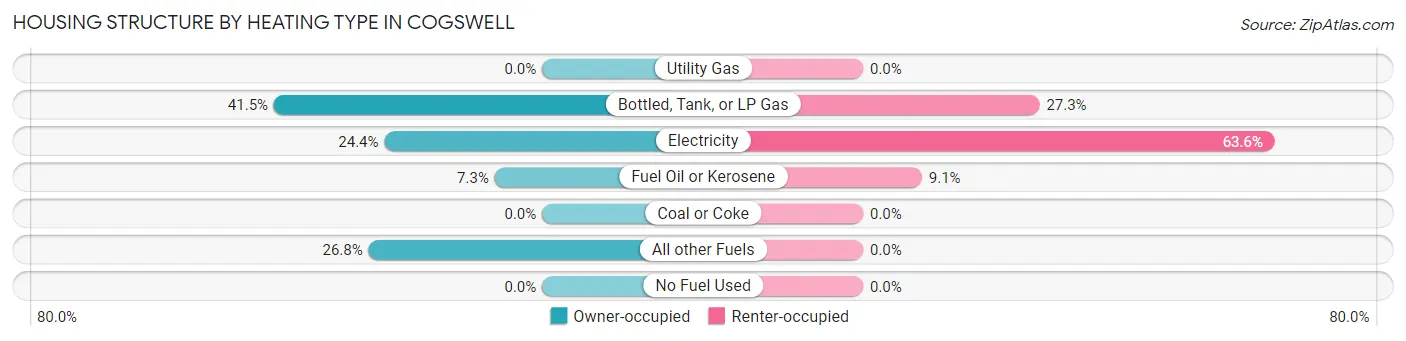
| Heating Type | Owner-occupied | Renter-occupied |
| Utility Gas | 0 (0.0%) | 0 (0.0%) |
| Bottled, Tank, or LP Gas | 17 (41.5%) | 3 (27.3%) |
| Electricity | 10 (24.4%) | 7 (63.6%) |
| Fuel Oil or Kerosene | 3 (7.3%) | 1 (9.1%) |
| Coal or Coke | 0 (0.0%) | 0 (0.0%) |
| All other Fuels | 11 (26.8%) | 0 (0.0%) |
| No Fuel Used | 0 (0.0%) | 0 (0.0%) |
| Total | 41 (100.0%) | 11 (100.0%) |
Household Vehicle Usage in Cogswell
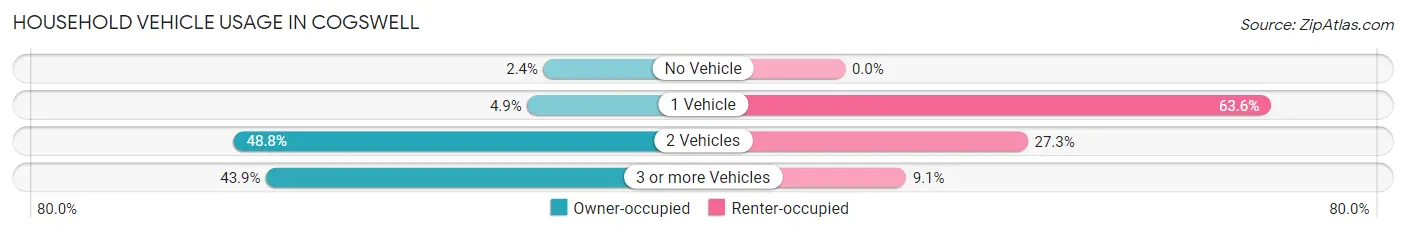
| Vehicles per Household | Owner-occupied | Renter-occupied |
| No Vehicle | 1 (2.4%) | 0 (0.0%) |
| 1 Vehicle | 2 (4.9%) | 7 (63.6%) |
| 2 Vehicles | 20 (48.8%) | 3 (27.3%) |
| 3 or more Vehicles | 18 (43.9%) | 1 (9.1%) |
| Total | 41 (100.0%) | 11 (100.0%) |
Real Estate & Mortgages in Cogswell
Real Estate and Mortgage Overview in Cogswell
| Characteristic | Without Mortgage | With Mortgage |
| Housing Units | 39 | 2 |
| Median Property Value | $37,800 | $0 |
| Median Household Income | $78,438 | $0 |
| Monthly Housing Costs | $505 | $0 |
| Real Estate Taxes | $582 | $0 |
Property Value by Mortgage Status in Cogswell
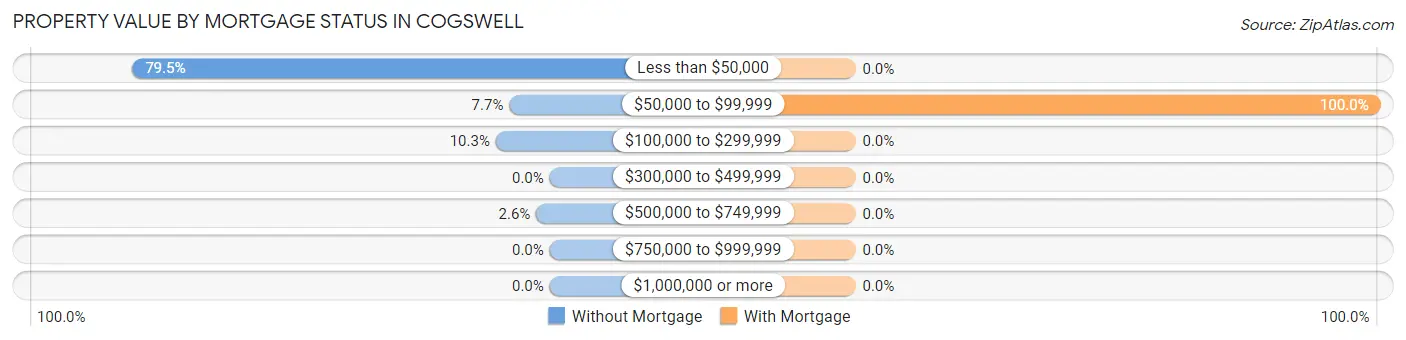
| Property Value | Without Mortgage | With Mortgage |
| Less than $50,000 | 31 (79.5%) | 0 (0.0%) |
| $50,000 to $99,999 | 3 (7.7%) | 2 (100.0%) |
| $100,000 to $299,999 | 4 (10.3%) | 0 (0.0%) |
| $300,000 to $499,999 | 0 (0.0%) | 0 (0.0%) |
| $500,000 to $749,999 | 1 (2.6%) | 0 (0.0%) |
| $750,000 to $999,999 | 0 (0.0%) | 0 (0.0%) |
| $1,000,000 or more | 0 (0.0%) | 0 (0.0%) |
| Total | 39 (100.0%) | 2 (100.0%) |
Household Income by Mortgage Status in Cogswell
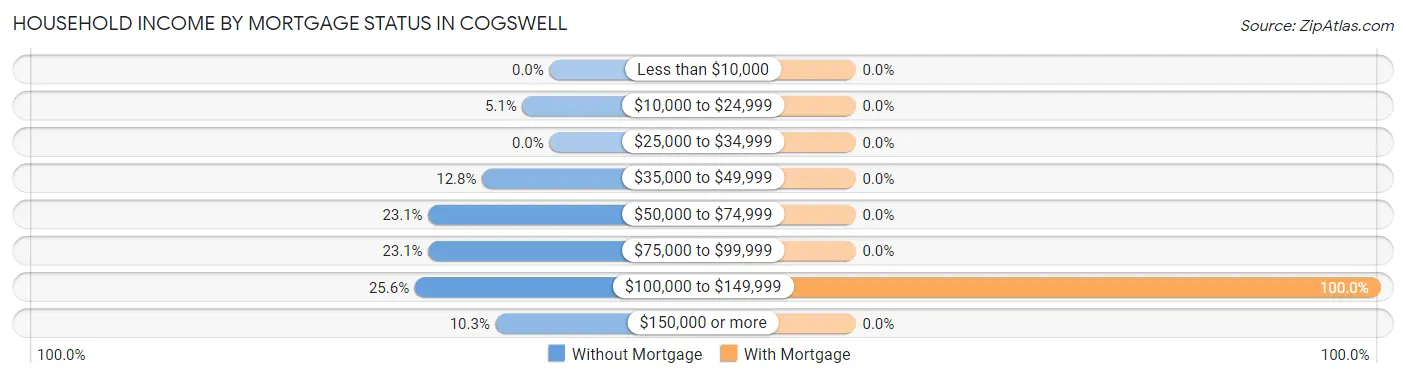
| Household Income | Without Mortgage | With Mortgage |
| Less than $10,000 | 0 (0.0%) | 0 (0.0%) |
| $10,000 to $24,999 | 2 (5.1%) | 0 (0.0%) |
| $25,000 to $34,999 | 0 (0.0%) | 0 (0.0%) |
| $35,000 to $49,999 | 5 (12.8%) | 0 (0.0%) |
| $50,000 to $74,999 | 9 (23.1%) | 0 (0.0%) |
| $75,000 to $99,999 | 9 (23.1%) | 0 (0.0%) |
| $100,000 to $149,999 | 10 (25.6%) | 2 (100.0%) |
| $150,000 or more | 4 (10.3%) | 0 (0.0%) |
| Total | 39 (100.0%) | 2 (100.0%) |
Property Value to Household Income Ratio in Cogswell
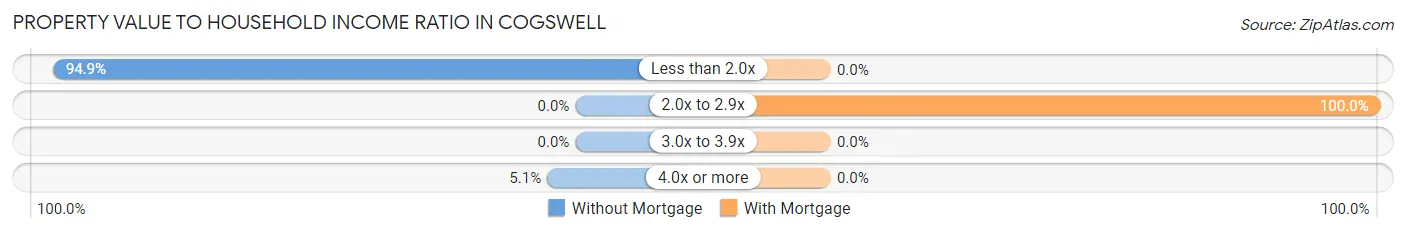
| Value-to-Income Ratio | Without Mortgage | With Mortgage |
| Less than 2.0x | 37 (94.9%) | 0 (0.0%) |
| 2.0x to 2.9x | 0 (0.0%) | 2 (100.0%) |
| 3.0x to 3.9x | 0 (0.0%) | 0 (0.0%) |
| 4.0x or more | 2 (5.1%) | 0 (0.0%) |
| Total | 39 (100.0%) | 2 (100.0%) |
Real Estate Taxes by Mortgage Status in Cogswell
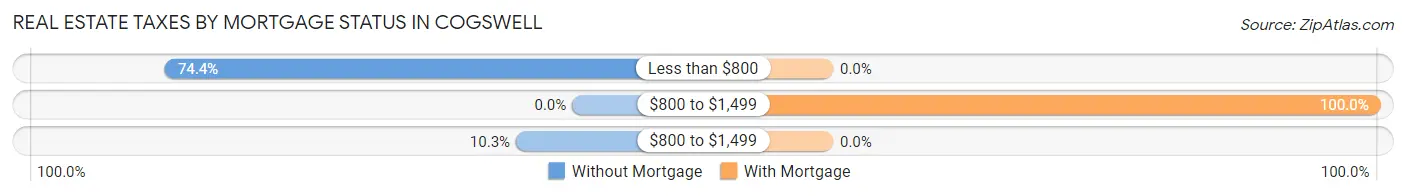
| Property Taxes | Without Mortgage | With Mortgage |
| Less than $800 | 29 (74.4%) | 0 (0.0%) |
| $800 to $1,499 | 0 (0.0%) | 2 (100.0%) |
| $800 to $1,499 | 4 (10.3%) | 0 (0.0%) |
| Total | 39 (100.0%) | 2 (100.0%) |
Health & Disability in Cogswell
Health Insurance Coverage by Age in Cogswell
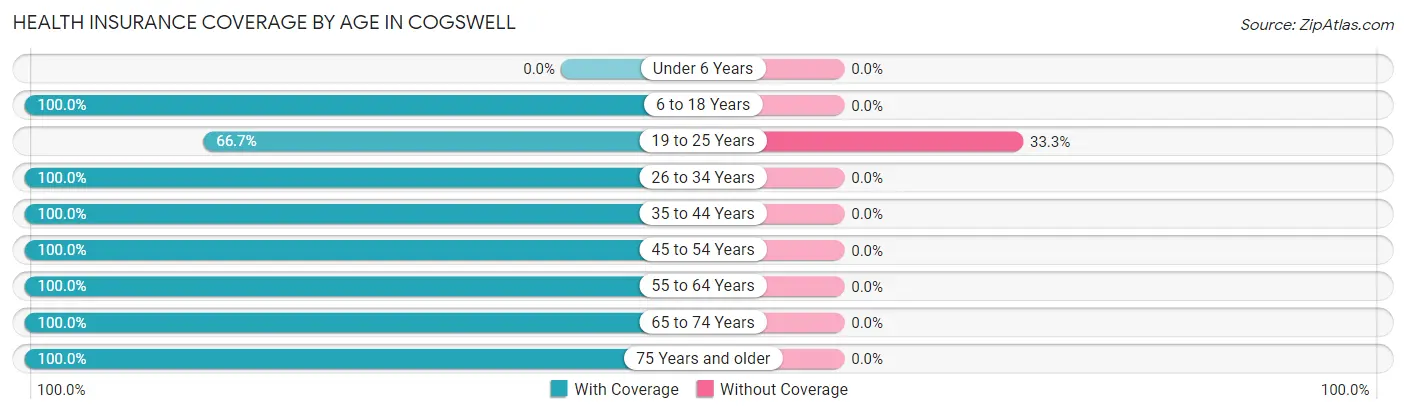
| Age Bracket | With Coverage | Without Coverage |
| Under 6 Years | 0 (0.0%) | 0 (0.0%) |
| 6 to 18 Years | 24 (100.0%) | 0 (0.0%) |
| 19 to 25 Years | 6 (66.7%) | 3 (33.3%) |
| 26 to 34 Years | 1 (100.0%) | 0 (0.0%) |
| 35 to 44 Years | 2 (100.0%) | 0 (0.0%) |
| 45 to 54 Years | 10 (100.0%) | 0 (0.0%) |
| 55 to 64 Years | 40 (100.0%) | 0 (0.0%) |
| 65 to 74 Years | 23 (100.0%) | 0 (0.0%) |
| 75 Years and older | 4 (100.0%) | 0 (0.0%) |
| Total | 110 (97.4%) | 3 (2.6%) |
Health Insurance Coverage by Citizenship Status in Cogswell
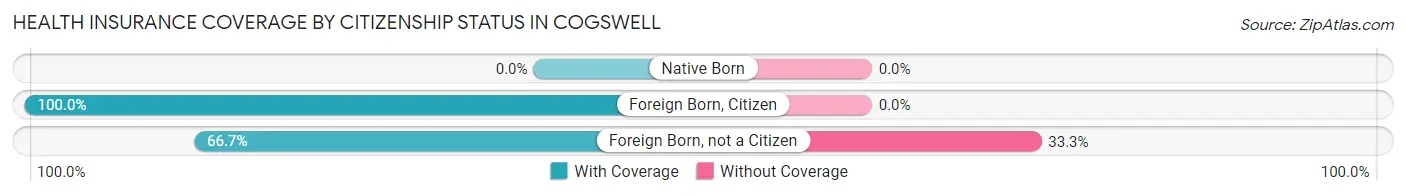
| Citizenship Status | With Coverage | Without Coverage |
| Native Born | 0 (0.0%) | 0 (0.0%) |
| Foreign Born, Citizen | 24 (100.0%) | 0 (0.0%) |
| Foreign Born, not a Citizen | 6 (66.7%) | 3 (33.3%) |
Health Insurance Coverage by Household Income in Cogswell
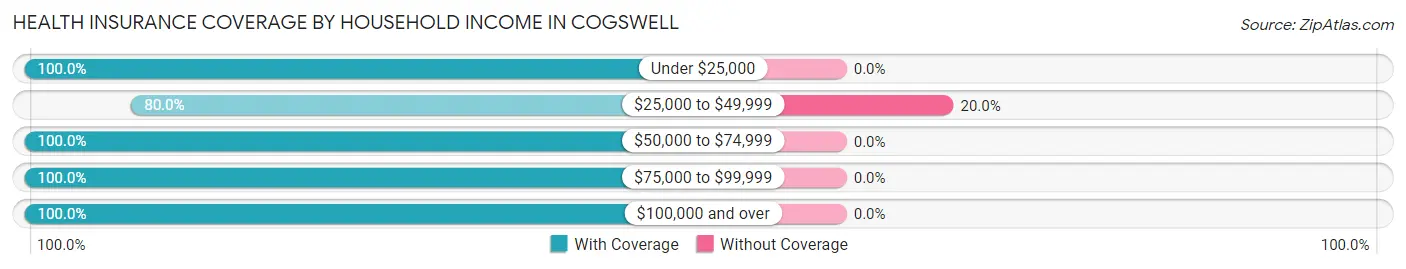
| Household Income | With Coverage | Without Coverage |
| Under $25,000 | 6 (100.0%) | 0 (0.0%) |
| $25,000 to $49,999 | 12 (80.0%) | 3 (20.0%) |
| $50,000 to $74,999 | 18 (100.0%) | 0 (0.0%) |
| $75,000 to $99,999 | 24 (100.0%) | 0 (0.0%) |
| $100,000 and over | 50 (100.0%) | 0 (0.0%) |
Public vs Private Health Insurance Coverage by Age in Cogswell
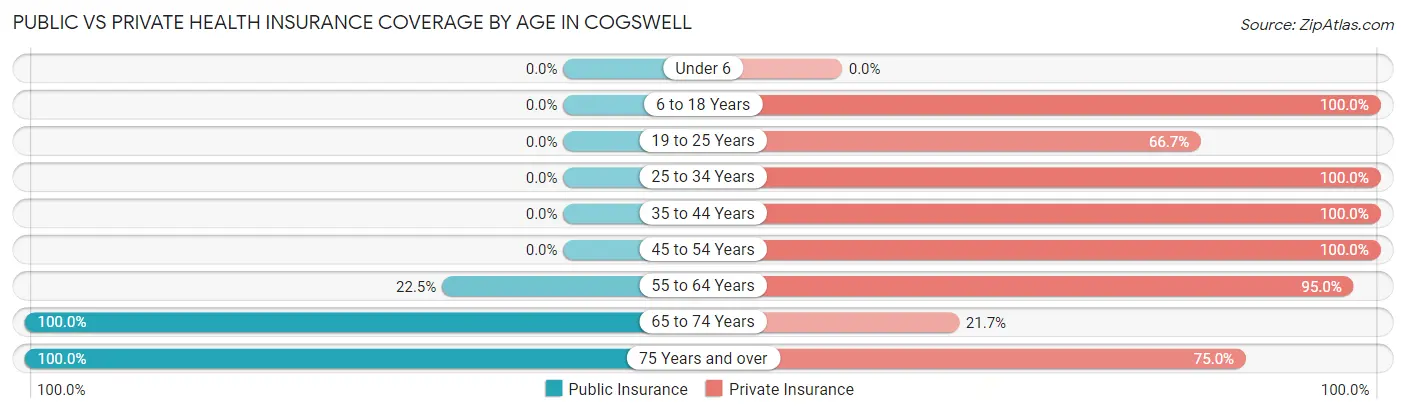
| Age Bracket | Public Insurance | Private Insurance |
| Under 6 | 0 (0.0%) | 0 (0.0%) |
| 6 to 18 Years | 0 (0.0%) | 24 (100.0%) |
| 19 to 25 Years | 0 (0.0%) | 6 (66.7%) |
| 25 to 34 Years | 0 (0.0%) | 1 (100.0%) |
| 35 to 44 Years | 0 (0.0%) | 2 (100.0%) |
| 45 to 54 Years | 0 (0.0%) | 10 (100.0%) |
| 55 to 64 Years | 9 (22.5%) | 38 (95.0%) |
| 65 to 74 Years | 23 (100.0%) | 5 (21.7%) |
| 75 Years and over | 4 (100.0%) | 3 (75.0%) |
| Total | 36 (31.9%) | 89 (78.8%) |
Disability Status by Sex by Age in Cogswell
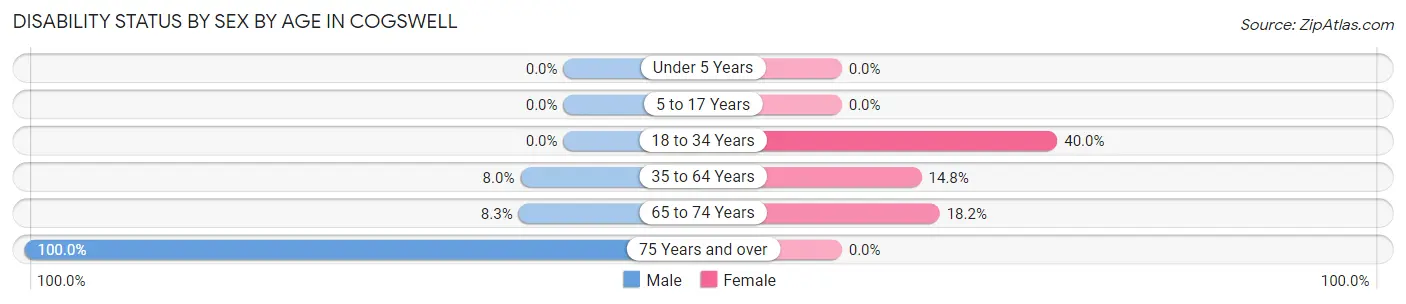
| Age Bracket | Male | Female |
| Under 5 Years | 0 (0.0%) | 0 (0.0%) |
| 5 to 17 Years | 0 (0.0%) | 0 (0.0%) |
| 18 to 34 Years | 0 (0.0%) | 2 (40.0%) |
| 35 to 64 Years | 2 (8.0%) | 4 (14.8%) |
| 65 to 74 Years | 1 (8.3%) | 2 (18.2%) |
| 75 Years and over | 3 (100.0%) | 0 (0.0%) |
Disability Class by Sex by Age in Cogswell
Disability Class: Hearing Difficulty
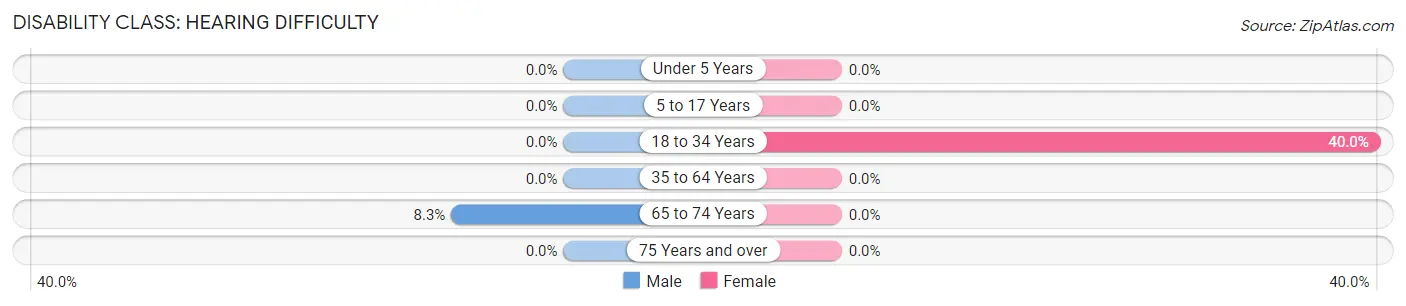
| Age Bracket | Male | Female |
| Under 5 Years | 0 (0.0%) | 0 (0.0%) |
| 5 to 17 Years | 0 (0.0%) | 0 (0.0%) |
| 18 to 34 Years | 0 (0.0%) | 2 (40.0%) |
| 35 to 64 Years | 0 (0.0%) | 0 (0.0%) |
| 65 to 74 Years | 1 (8.3%) | 0 (0.0%) |
| 75 Years and over | 0 (0.0%) | 0 (0.0%) |
Disability Class: Vision Difficulty
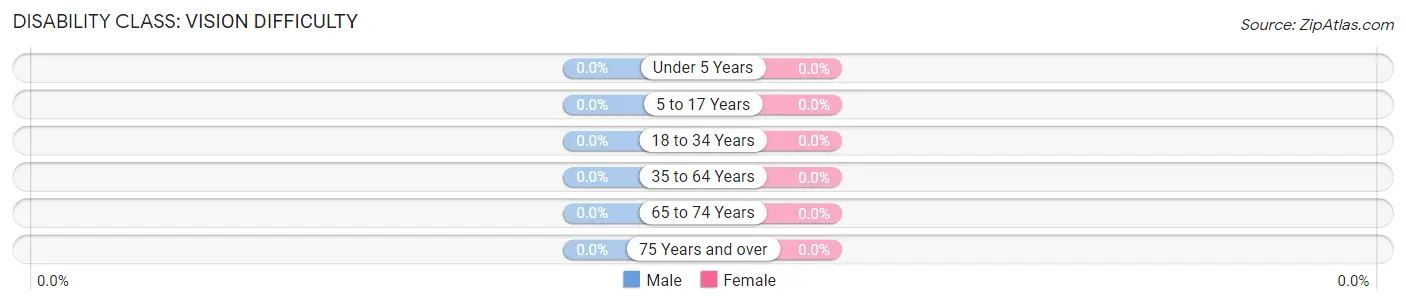
| Age Bracket | Male | Female |
| Under 5 Years | 0 (0.0%) | 0 (0.0%) |
| 5 to 17 Years | 0 (0.0%) | 0 (0.0%) |
| 18 to 34 Years | 0 (0.0%) | 0 (0.0%) |
| 35 to 64 Years | 0 (0.0%) | 0 (0.0%) |
| 65 to 74 Years | 0 (0.0%) | 0 (0.0%) |
| 75 Years and over | 0 (0.0%) | 0 (0.0%) |
Disability Class: Cognitive Difficulty
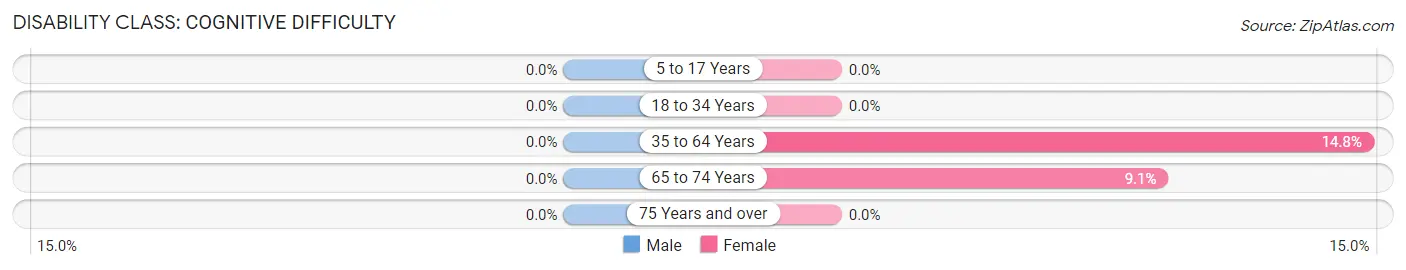
| Age Bracket | Male | Female |
| 5 to 17 Years | 0 (0.0%) | 0 (0.0%) |
| 18 to 34 Years | 0 (0.0%) | 0 (0.0%) |
| 35 to 64 Years | 0 (0.0%) | 4 (14.8%) |
| 65 to 74 Years | 0 (0.0%) | 1 (9.1%) |
| 75 Years and over | 0 (0.0%) | 0 (0.0%) |
Disability Class: Ambulatory Difficulty
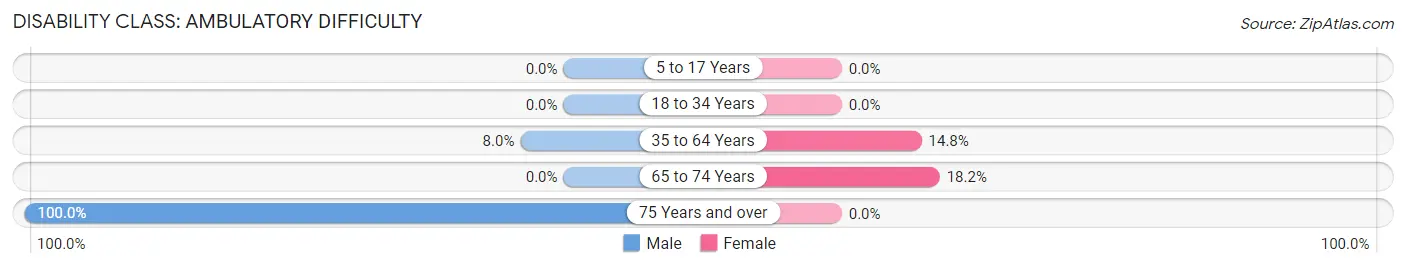
| Age Bracket | Male | Female |
| 5 to 17 Years | 0 (0.0%) | 0 (0.0%) |
| 18 to 34 Years | 0 (0.0%) | 0 (0.0%) |
| 35 to 64 Years | 2 (8.0%) | 4 (14.8%) |
| 65 to 74 Years | 0 (0.0%) | 2 (18.2%) |
| 75 Years and over | 3 (100.0%) | 0 (0.0%) |
Disability Class: Self-Care Difficulty
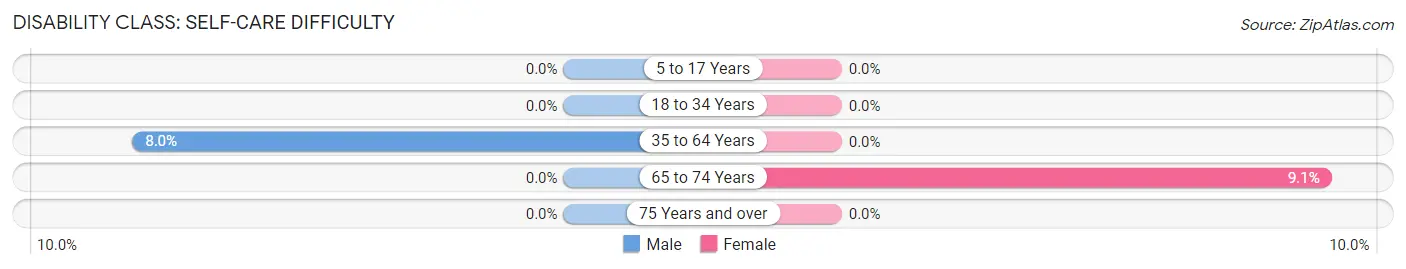
| Age Bracket | Male | Female |
| 5 to 17 Years | 0 (0.0%) | 0 (0.0%) |
| 18 to 34 Years | 0 (0.0%) | 0 (0.0%) |
| 35 to 64 Years | 2 (8.0%) | 0 (0.0%) |
| 65 to 74 Years | 0 (0.0%) | 1 (9.1%) |
| 75 Years and over | 0 (0.0%) | 0 (0.0%) |
Technology Access in Cogswell
Computing Device Access in Cogswell
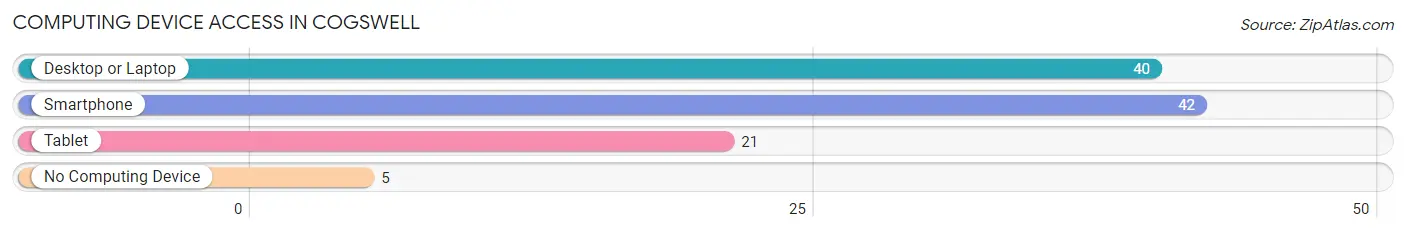
| Device Type | # Households | % Households |
| Desktop or Laptop | 40 | 76.9% |
| Smartphone | 42 | 80.8% |
| Tablet | 21 | 40.4% |
| No Computing Device | 5 | 9.6% |
| Total | 52 | 100.0% |
Internet Access in Cogswell
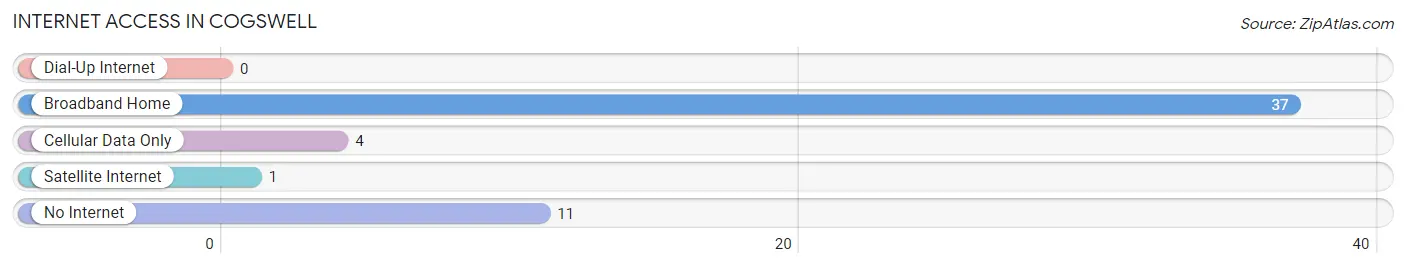
| Internet Type | # Households | % Households |
| Dial-Up Internet | 0 | 0.0% |
| Broadband Home | 37 | 71.2% |
| Cellular Data Only | 4 | 7.7% |
| Satellite Internet | 1 | 1.9% |
| No Internet | 11 | 21.1% |
| Total | 52 | 100.0% |
Cogswell Summary
Cogswell is a small city located in southeastern North Dakota, in the United States. It is the county seat of Richland County and is situated along the Sheyenne River. The city has a population of approximately 1,000 people and is part of the Wahpeton-Breckenridge Micropolitan Statistical Area.
History
The area that is now Cogswell was first settled in 1882 by a group of Norwegian immigrants. The city was named after the Cogswell family, who were among the first settlers. The city was officially incorporated in 1887.
In the early 1900s, Cogswell was a thriving agricultural community. The city was home to several grain elevators, a creamery, a flour mill, and a lumber yard. The city also had a railroad station, which was used to transport goods and passengers.
In the 1950s, Cogswell began to experience a decline in population as people moved away from rural areas in search of better job opportunities. The city’s population has remained relatively stable since then, with a slight increase in recent years.
Geography
Cogswell is located in southeastern North Dakota, in the United States. It is situated along the Sheyenne River, which flows through the city. The city is located approximately 30 miles east of the state capital, Bismarck.
The city has a total area of 1.2 square miles, all of which is land. The city is located in a flat, open area, with no major hills or mountains. The climate is characterized by cold winters and hot summers.
Economy
The economy of Cogswell is largely based on agriculture. The city is home to several grain elevators, a creamery, and a flour mill. The city also has a few small businesses, including a grocery store, a hardware store, and a few restaurants.
The city is also home to a few manufacturing companies, including a furniture factory and a plastics factory. The city is also home to a few small technology companies, which provide software and web development services.
Demographics
As of the 2010 census, the population of Cogswell was 1,000 people. The racial makeup of the city was 97.2% White, 0.7% African American, 0.3% Native American, 0.2% Asian, 0.1% Pacific Islander, and 1.5% from other races.
The median household income in Cogswell was $41,250, and the median family income was $48,750. The per capita income was $19,945. About 8.3% of the population was below the poverty line.
Cogswell is a small city with a rich history and a strong agricultural economy. The city has a diverse population and a variety of businesses and industries. The city is a great place to live and work, and offers a unique quality of life.
Common Questions
What is Per Capita Income in Cogswell?
Per Capita income in Cogswell is $33,524.
What is the Median Family Income in Cogswell?
Median Family Income in Cogswell is $93,333.
What is the Median Household income in Cogswell?
Median Household Income in Cogswell is $68,750.
What is Inequality or Gini Index in Cogswell?
Inequality or Gini Index in Cogswell is 0.32.
What is the Total Population of Cogswell?
Total Population of Cogswell is 113.
What is the Total Male Population of Cogswell?
Total Male Population of Cogswell is 69.
What is the Total Female Population of Cogswell?
Total Female Population of Cogswell is 44.
What is the Ratio of Males per 100 Females in Cogswell?
There are 156.82 Males per 100 Females in Cogswell.
What is the Ratio of Females per 100 Males in Cogswell?
There are 63.77 Females per 100 Males in Cogswell.
What is the Median Population Age in Cogswell?
Median Population Age in Cogswell is 57.5 Years.
What is the Average Family Size in Cogswell
Average Family Size in Cogswell is 2.6 People.
What is the Average Household Size in Cogswell
Average Household Size in Cogswell is 2.2 People.
How Large is the Labor Force in Cogswell?
There are 64 People in the Labor Forcein in Cogswell.
What is the Percentage of People in the Labor Force in Cogswell?
56.6% of People are in the Labor Force in Cogswell.
What is the Unemployment Rate in Cogswell?
Unemployment Rate in Cogswell is 3.1%.