Bowman, ND Map & Demographics
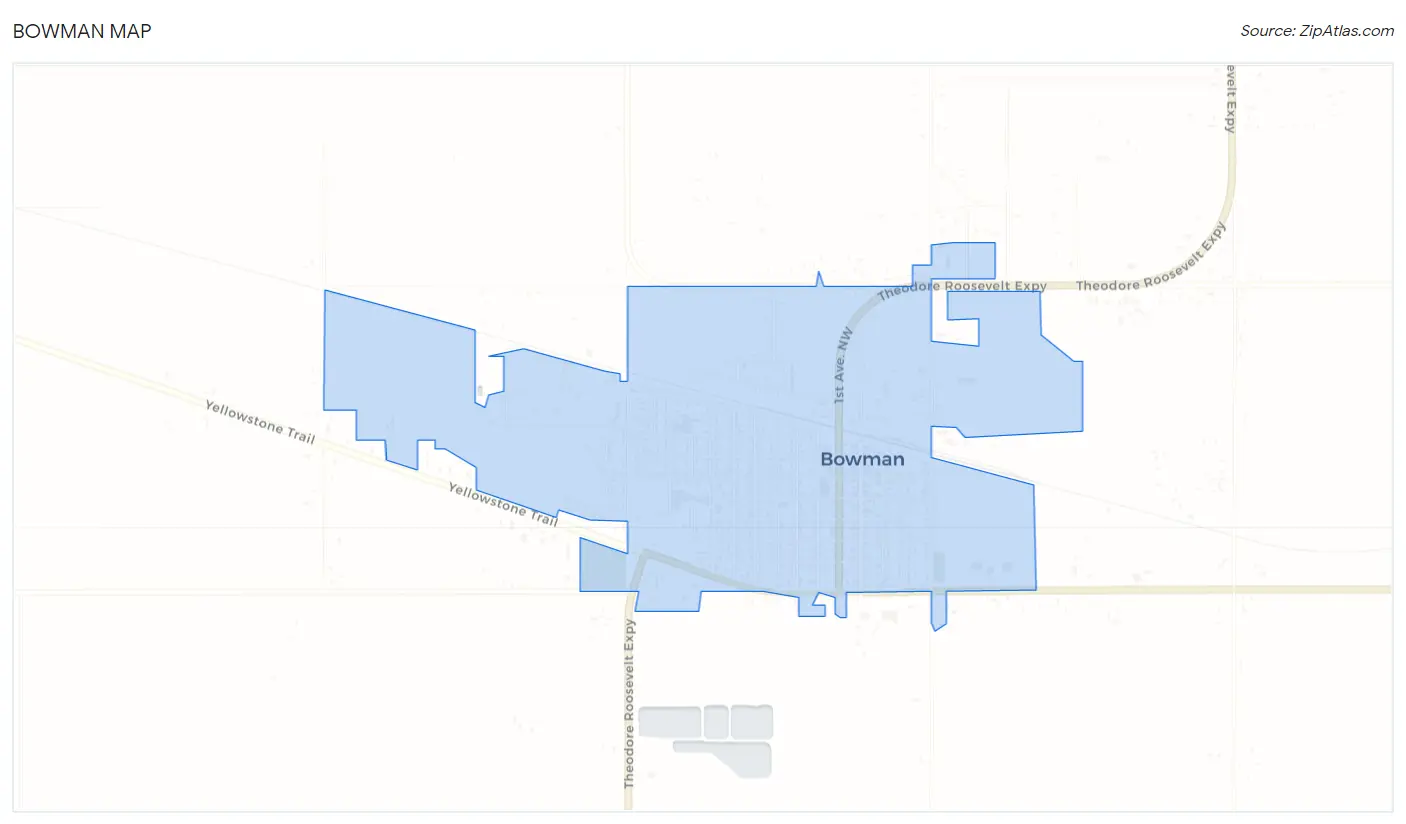
Bowman Map
Bowman Overview
$34,834
PER CAPITA INCOME
$95,556
AVG FAMILY INCOME
$73,309
AVG HOUSEHOLD INCOME
38.9%
WAGE / INCOME GAP [ % ]
61.1¢/ $1
WAGE / INCOME GAP [ $ ]
0.36
INEQUALITY / GINI INDEX
1,646
TOTAL POPULATION
798
MALE POPULATION
848
FEMALE POPULATION
94.10
MALES / 100 FEMALES
106.27
FEMALES / 100 MALES
38.5
MEDIAN AGE
3.4
AVG FAMILY SIZE
2.5
AVG HOUSEHOLD SIZE
866
LABOR FORCE [ PEOPLE ]
69.7%
PERCENT IN LABOR FORCE
4.4%
UNEMPLOYMENT RATE
Bowman Zip Codes
Bowman Area Codes
Income in Bowman
Income Overview in Bowman
Per Capita Income in Bowman is $34,834, while median incomes of families and households are $95,556 and $73,309 respectively.
| Characteristic | Number | Measure |
| Per Capita Income | 1,646 | $34,834 |
| Median Family Income | 356 | $95,556 |
| Mean Family Income | 356 | $99,885 |
| Median Household Income | 627 | $73,309 |
| Mean Household Income | 627 | $85,367 |
| Income Deficit | 356 | $0 |
| Wage / Income Gap (%) | 1,646 | 38.90% |
| Wage / Income Gap ($) | 1,646 | 61.10¢ per $1 |
| Gini / Inequality Index | 1,646 | 0.36 |
Earnings by Sex in Bowman
Average Earnings in Bowman are $46,429, $56,136 for men and $34,300 for women, a difference of 38.9%.
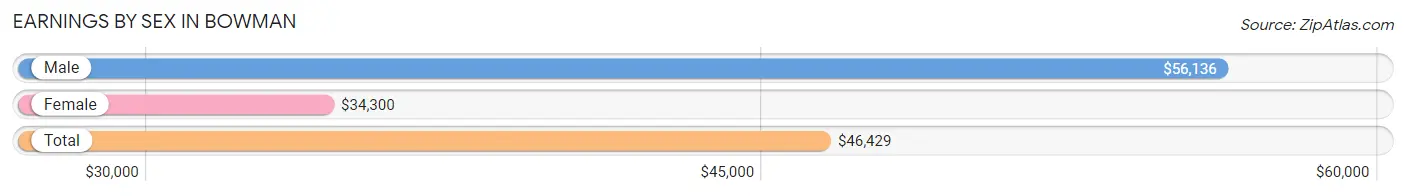
| Sex | Number | Average Earnings |
| Male | 486 (55.9%) | $56,136 |
| Female | 384 (44.1%) | $34,300 |
| Total | 870 (100.0%) | $46,429 |
Earnings by Sex by Income Bracket in Bowman
The most common earnings brackets in Bowman are $100,000+ for men (76 | 15.6%) and $30,000 to $34,999 for women (49 | 12.8%).
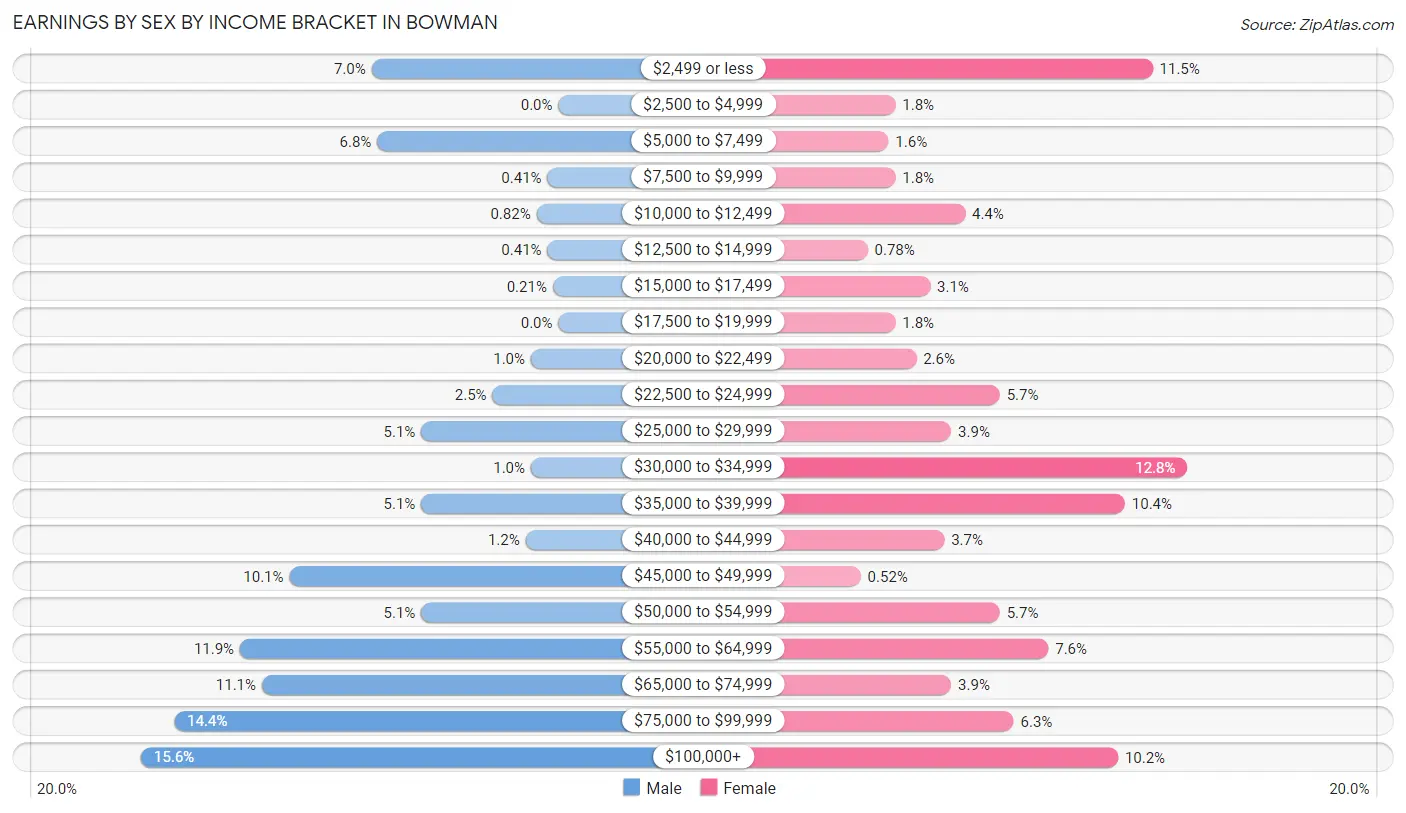
| Income | Male | Female |
| $2,499 or less | 34 (7.0%) | 44 (11.5%) |
| $2,500 to $4,999 | 0 (0.0%) | 7 (1.8%) |
| $5,000 to $7,499 | 33 (6.8%) | 6 (1.6%) |
| $7,500 to $9,999 | 2 (0.4%) | 7 (1.8%) |
| $10,000 to $12,499 | 4 (0.8%) | 17 (4.4%) |
| $12,500 to $14,999 | 2 (0.4%) | 3 (0.8%) |
| $15,000 to $17,499 | 1 (0.2%) | 12 (3.1%) |
| $17,500 to $19,999 | 0 (0.0%) | 7 (1.8%) |
| $20,000 to $22,499 | 5 (1.0%) | 10 (2.6%) |
| $22,500 to $24,999 | 12 (2.5%) | 22 (5.7%) |
| $25,000 to $29,999 | 25 (5.1%) | 15 (3.9%) |
| $30,000 to $34,999 | 5 (1.0%) | 49 (12.8%) |
| $35,000 to $39,999 | 25 (5.1%) | 40 (10.4%) |
| $40,000 to $44,999 | 6 (1.2%) | 14 (3.6%) |
| $45,000 to $49,999 | 49 (10.1%) | 2 (0.5%) |
| $50,000 to $54,999 | 25 (5.1%) | 22 (5.7%) |
| $55,000 to $64,999 | 58 (11.9%) | 29 (7.5%) |
| $65,000 to $74,999 | 54 (11.1%) | 15 (3.9%) |
| $75,000 to $99,999 | 70 (14.4%) | 24 (6.2%) |
| $100,000+ | 76 (15.6%) | 39 (10.2%) |
| Total | 486 (100.0%) | 384 (100.0%) |
Earnings by Sex by Educational Attainment in Bowman
Average earnings in Bowman are $59,167 for men and $38,558 for women, a difference of 34.8%. Men with an educational attainment of bachelor's degree enjoy the highest average annual earnings of $86,806, while those with college or associate's degree education earn the least with $46,810. Women with an educational attainment of bachelor's degree earn the most with the average annual earnings of $53,750, while those with less than high school education have the smallest earnings of $2,499.
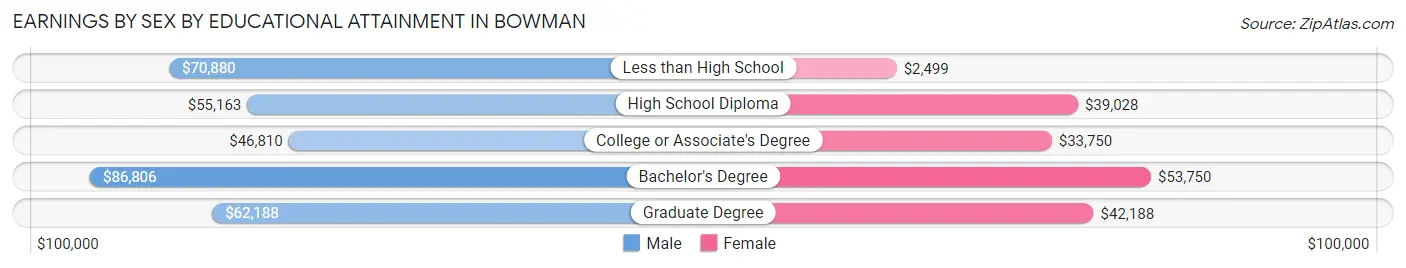
| Educational Attainment | Male Income | Female Income |
| Less than High School | $70,880 | $2,499 |
| High School Diploma | $55,163 | $39,028 |
| College or Associate's Degree | $46,810 | $33,750 |
| Bachelor's Degree | $86,806 | $53,750 |
| Graduate Degree | $62,188 | $42,188 |
| Total | $59,167 | $38,558 |
Family Income in Bowman
Family Income Brackets in Bowman
According to the Bowman family income data, there are 121 families falling into the $100,000 to $149,999 income range, which is the most common income bracket and makes up 34.0% of all families. Conversely, the $25,000 to $34,999 income bracket is the least frequent group with only 2 families (0.6%) belonging to this category.
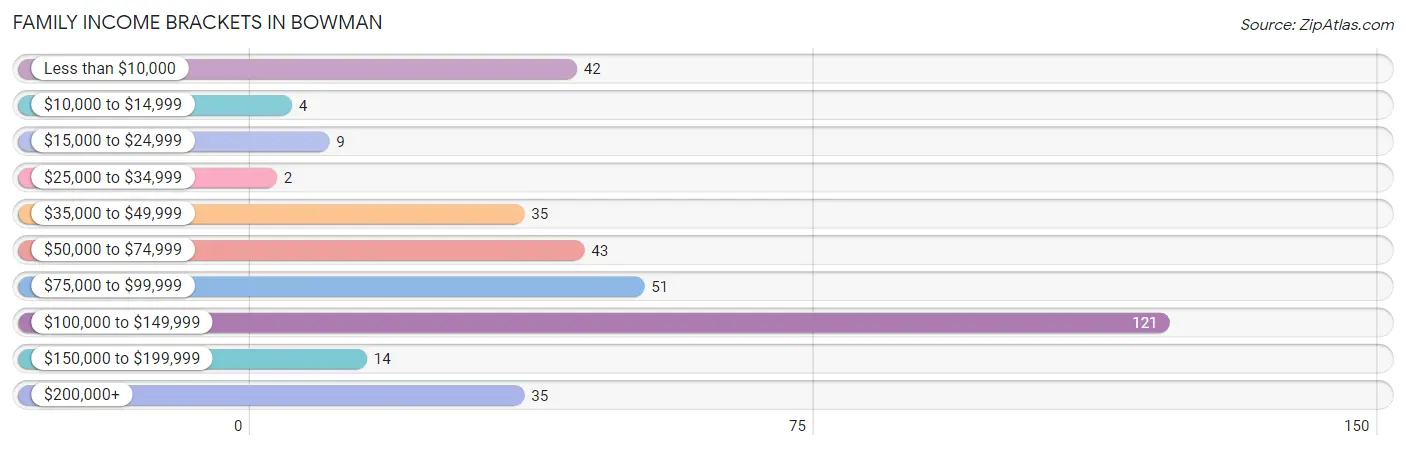
| Income Bracket | # Families | % Families |
| Less than $10,000 | 42 | 11.8% |
| $10,000 to $14,999 | 4 | 1.1% |
| $15,000 to $24,999 | 9 | 2.5% |
| $25,000 to $34,999 | 2 | 0.6% |
| $35,000 to $49,999 | 35 | 9.8% |
| $50,000 to $74,999 | 43 | 12.1% |
| $75,000 to $99,999 | 51 | 14.3% |
| $100,000 to $149,999 | 121 | 34.0% |
| $150,000 to $199,999 | 14 | 3.9% |
| $200,000+ | 35 | 9.8% |
Family Income by Famaliy Size in Bowman
5-person families (25 | 7.0%) account for the highest median family income in Bowman with $141,250 per family, while 2-person families (168 | 47.2%) have the highest median income of $43,416 per family member.
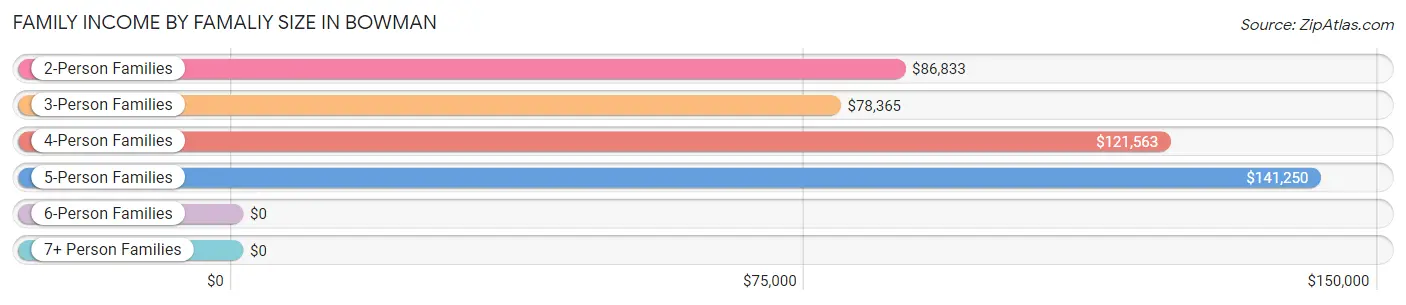
| Income Bracket | # Families | Median Income |
| 2-Person Families | 168 (47.2%) | $86,833 |
| 3-Person Families | 55 (15.4%) | $78,365 |
| 4-Person Families | 91 (25.6%) | $121,563 |
| 5-Person Families | 25 (7.0%) | $141,250 |
| 6-Person Families | 13 (3.6%) | $0 |
| 7+ Person Families | 4 (1.1%) | $0 |
| Total | 356 (100.0%) | $95,556 |
Family Income by Number of Earners in Bowman
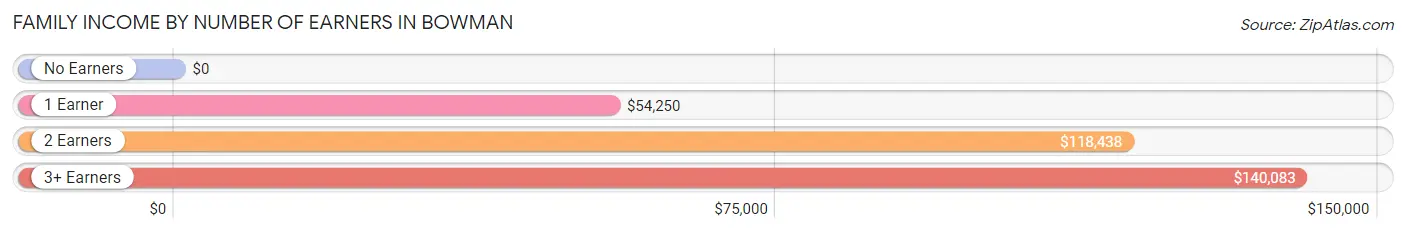
| Number of Earners | # Families | Median Income |
| No Earners | 53 (14.9%) | $0 |
| 1 Earner | 65 (18.3%) | $54,250 |
| 2 Earners | 195 (54.8%) | $118,438 |
| 3+ Earners | 43 (12.1%) | $140,083 |
| Total | 356 (100.0%) | $95,556 |
Household Income in Bowman
Household Income Brackets in Bowman
With 165 households falling in the category, the $100,000 to $149,999 income range is the most frequent in Bowman, accounting for 26.3% of all households. In contrast, only 2 households (0.3%) fall into the less than $10,000 income bracket, making it the least populous group.
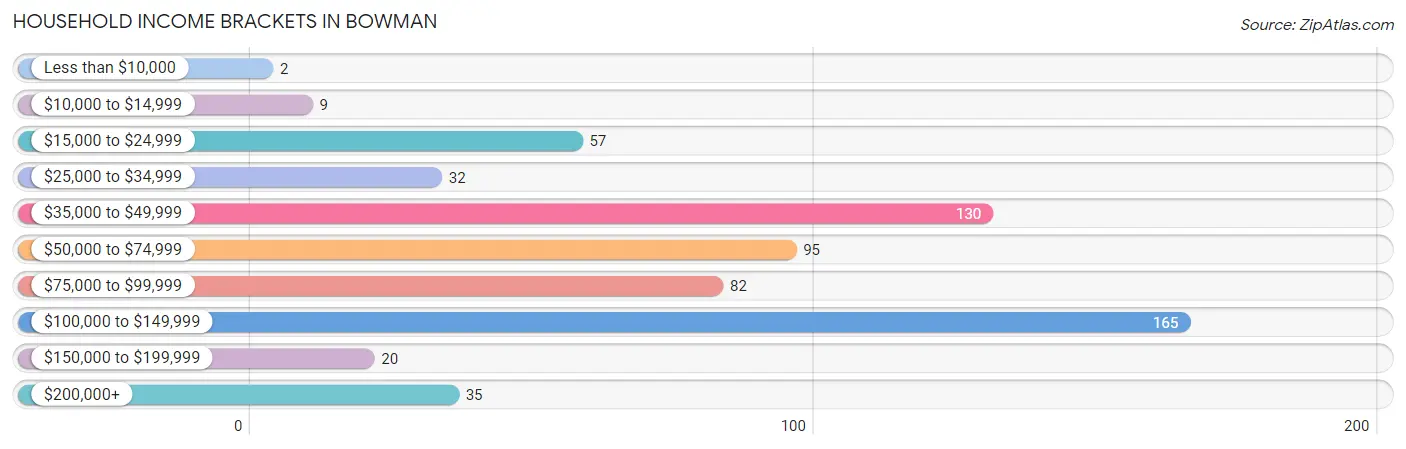
| Income Bracket | # Households | % Households |
| Less than $10,000 | 2 | 0.3% |
| $10,000 to $14,999 | 9 | 1.4% |
| $15,000 to $24,999 | 57 | 9.1% |
| $25,000 to $34,999 | 32 | 5.1% |
| $35,000 to $49,999 | 130 | 20.7% |
| $50,000 to $74,999 | 95 | 15.2% |
| $75,000 to $99,999 | 82 | 13.1% |
| $100,000 to $149,999 | 165 | 26.3% |
| $150,000 to $199,999 | 20 | 3.2% |
| $200,000+ | 35 | 5.6% |
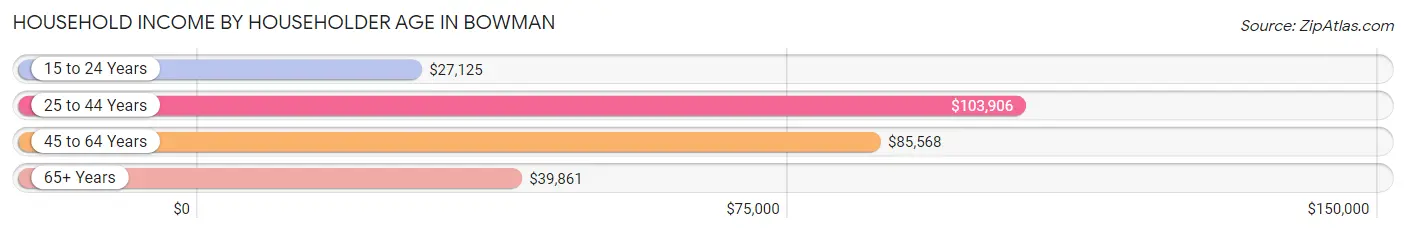
Household Income by Householder Age in Bowman
The median household income in Bowman is $73,309, with the highest median household income of $103,906 found in the 25 to 44 years age bracket for the primary householder. A total of 185 households (29.5%) fall into this category. Meanwhile, the 15 to 24 years age bracket for the primary householder has the lowest median household income of $27,125, with 57 households (9.1%) in this group.
| Income Bracket | # Households | Median Income |
| 15 to 24 Years | 57 (9.1%) | $27,125 |
| 25 to 44 Years | 185 (29.5%) | $103,906 |
| 45 to 64 Years | 205 (32.7%) | $85,568 |
| 65+ Years | 180 (28.7%) | $39,861 |
| Total | 627 (100.0%) | $73,309 |
Poverty in Bowman
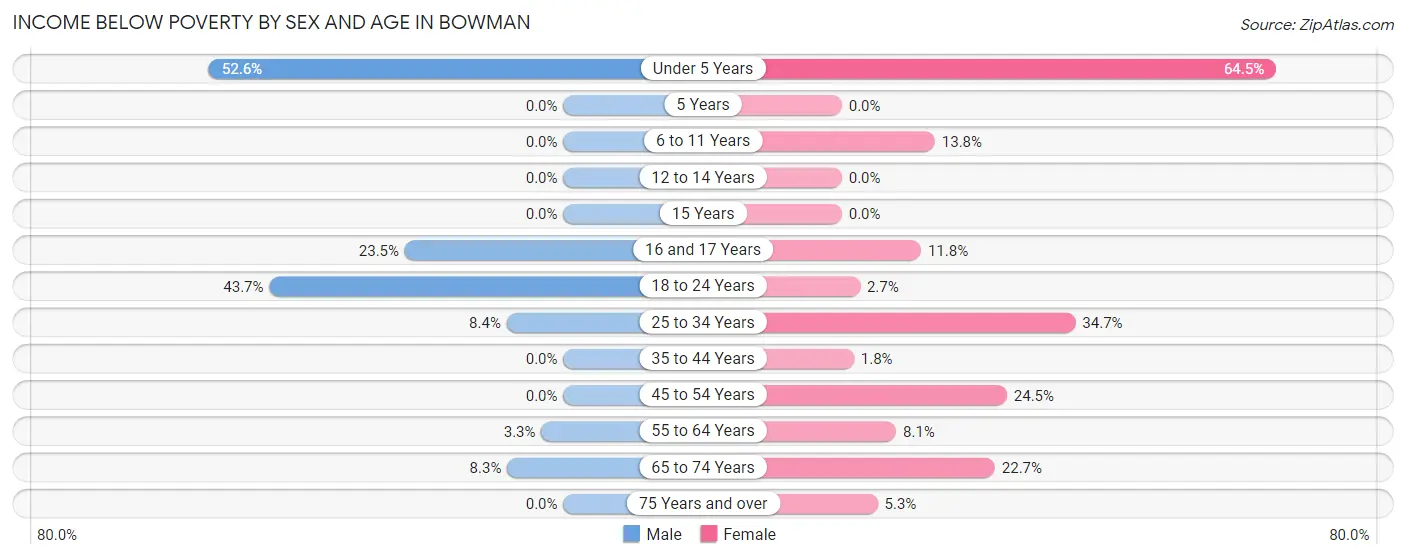
Income Below Poverty by Sex and Age in Bowman
With 9.5% poverty level for males and 17.0% for females among the residents of Bowman, under 5 year old males and under 5 year old females are the most vulnerable to poverty, with 20 males (52.6%) and 49 females (64.5%) in their respective age groups living below the poverty level.
| Age Bracket | Male | Female |
| Under 5 Years | 20 (52.6%) | 49 (64.5%) |
| 5 Years | 0 (0.0%) | 0 (0.0%) |
| 6 to 11 Years | 0 (0.0%) | 17 (13.8%) |
| 12 to 14 Years | 0 (0.0%) | 0 (0.0%) |
| 15 Years | 0 (0.0%) | 0 (0.0%) |
| 16 and 17 Years | 4 (23.5%) | 2 (11.8%) |
| 18 to 24 Years | 31 (43.7%) | 2 (2.7%) |
| 25 to 34 Years | 9 (8.4%) | 17 (34.7%) |
| 35 to 44 Years | 0 (0.0%) | 2 (1.8%) |
| 45 to 54 Years | 0 (0.0%) | 25 (24.5%) |
| 55 to 64 Years | 3 (3.3%) | 5 (8.1%) |
| 65 to 74 Years | 5 (8.3%) | 15 (22.7%) |
| 75 Years and over | 0 (0.0%) | 5 (5.3%) |
| Total | 72 (9.5%) | 139 (17.0%) |
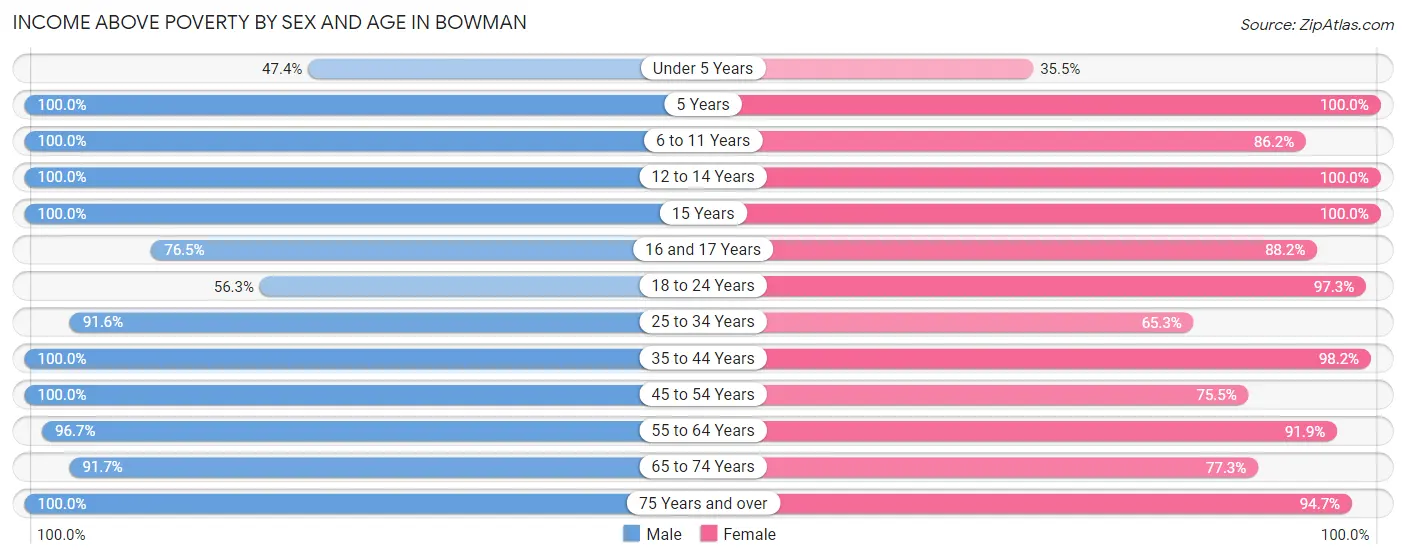
Income Above Poverty by Sex and Age in Bowman
According to the poverty statistics in Bowman, males aged 5 years and females aged 5 years are the age groups that are most secure financially, with 100.0% of males and 100.0% of females in these age groups living above the poverty line.
| Age Bracket | Male | Female |
| Under 5 Years | 18 (47.4%) | 27 (35.5%) |
| 5 Years | 34 (100.0%) | 2 (100.0%) |
| 6 to 11 Years | 52 (100.0%) | 106 (86.2%) |
| 12 to 14 Years | 28 (100.0%) | 25 (100.0%) |
| 15 Years | 12 (100.0%) | 14 (100.0%) |
| 16 and 17 Years | 13 (76.5%) | 15 (88.2%) |
| 18 to 24 Years | 40 (56.3%) | 72 (97.3%) |
| 25 to 34 Years | 98 (91.6%) | 32 (65.3%) |
| 35 to 44 Years | 130 (100.0%) | 110 (98.2%) |
| 45 to 54 Years | 81 (100.0%) | 77 (75.5%) |
| 55 to 64 Years | 89 (96.7%) | 57 (91.9%) |
| 65 to 74 Years | 55 (91.7%) | 51 (77.3%) |
| 75 Years and over | 37 (100.0%) | 89 (94.7%) |
| Total | 687 (90.5%) | 677 (83.0%) |
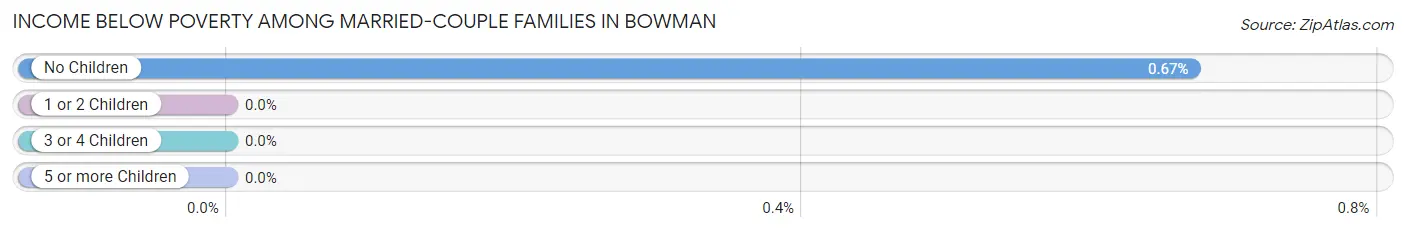
Income Below Poverty Among Married-Couple Families in Bowman
The poverty statistics for married-couple families in Bowman show that 0.4% or 1 of the total 246 families live below the poverty line. Families with no children have the highest poverty rate of 0.7%, comprising of 1 families. On the other hand, families with 1 or 2 children have the lowest poverty rate of 0.0%, which includes 0 families.
| Children | Above Poverty | Below Poverty |
| No Children | 148 (99.3%) | 1 (0.7%) |
| 1 or 2 Children | 74 (100.0%) | 0 (0.0%) |
| 3 or 4 Children | 19 (100.0%) | 0 (0.0%) |
| 5 or more Children | 4 (100.0%) | 0 (0.0%) |
| Total | 245 (99.6%) | 1 (0.4%) |
Income Below Poverty Among Single-Parent Households in Bowman
According to the poverty data in Bowman, 35.0% or 7 single-father households and 50.0% or 45 single-mother households are living below the poverty line. Among single-father households, those with 1 or 2 children have the highest poverty rate, with 7 households (100.0%) experiencing poverty. Likewise, among single-mother households, those with 3 or 4 children have the highest poverty rate, with 17 households (100.0%) falling below the poverty line.
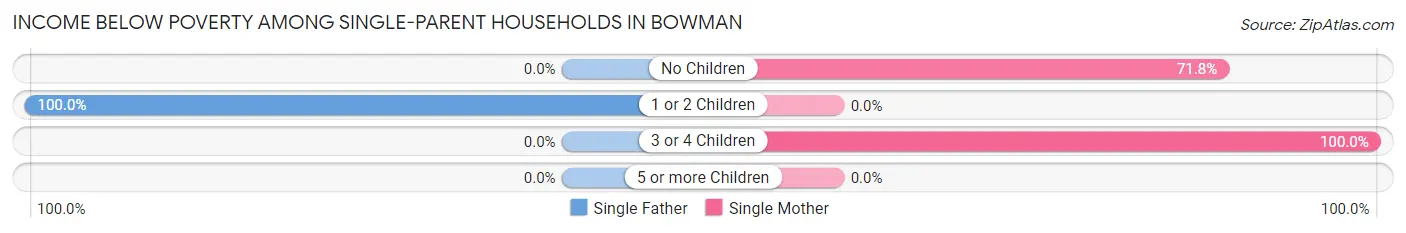
| Children | Single Father | Single Mother |
| No Children | 0 (0.0%) | 28 (71.8%) |
| 1 or 2 Children | 7 (100.0%) | 0 (0.0%) |
| 3 or 4 Children | 0 (0.0%) | 17 (100.0%) |
| 5 or more Children | 0 (0.0%) | 0 (0.0%) |
| Total | 7 (35.0%) | 45 (50.0%) |
Income Below Poverty Among Married-Couple vs Single-Parent Households in Bowman
The poverty data for Bowman shows that 1 of the married-couple family households (0.4%) and 52 of the single-parent households (47.3%) are living below the poverty level. Within the married-couple family households, those with no children have the highest poverty rate, with 1 households (0.7%) falling below the poverty line. Among the single-parent households, those with 3 or 4 children have the highest poverty rate, with 17 household (100.0%) living below poverty.
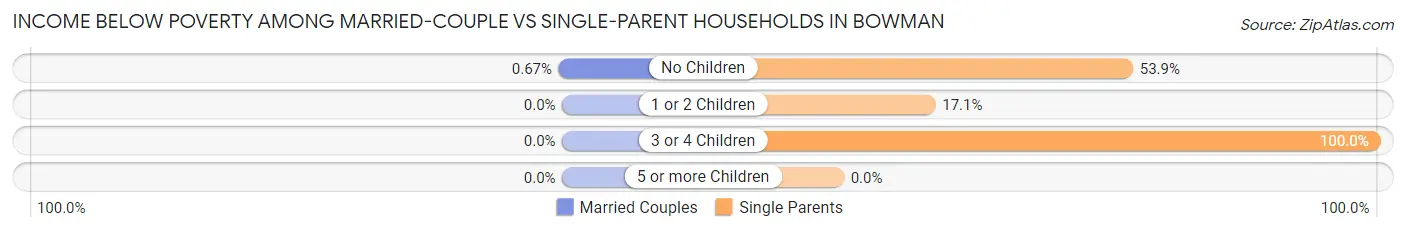
| Children | Married-Couple Families | Single-Parent Households |
| No Children | 1 (0.7%) | 28 (53.8%) |
| 1 or 2 Children | 0 (0.0%) | 7 (17.1%) |
| 3 or 4 Children | 0 (0.0%) | 17 (100.0%) |
| 5 or more Children | 0 (0.0%) | 0 (0.0%) |
| Total | 1 (0.4%) | 52 (47.3%) |
Race in Bowman
The most populous races in Bowman are White / Caucasian (1,503 | 91.3%), Hispanic or Latino (152 | 9.2%), and Native / Alaskan (63 | 3.8%).
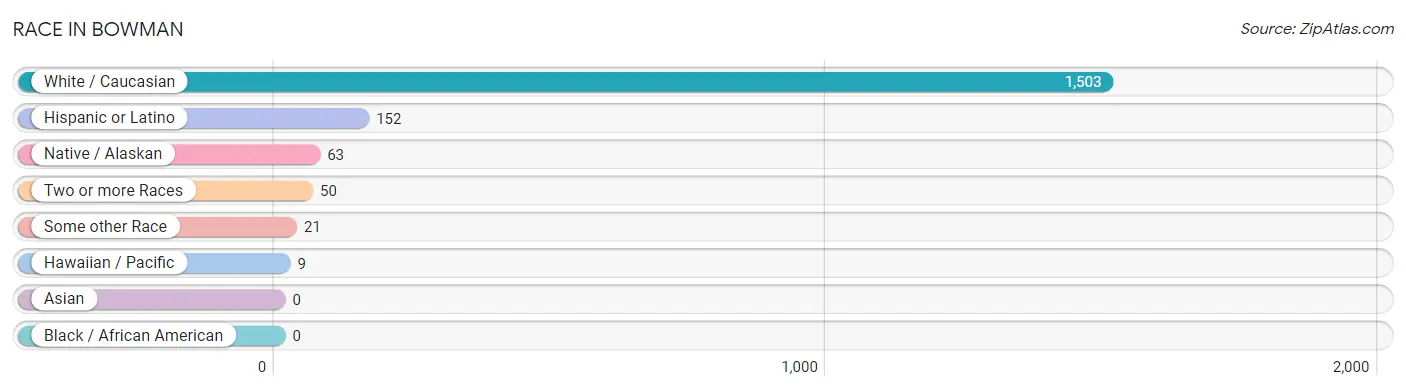
| Race | # Population | % Population |
| Asian | 0 | 0.0% |
| Black / African American | 0 | 0.0% |
| Hawaiian / Pacific | 9 | 0.5% |
| Hispanic or Latino | 152 | 9.2% |
| Native / Alaskan | 63 | 3.8% |
| White / Caucasian | 1,503 | 91.3% |
| Two or more Races | 50 | 3.0% |
| Some other Race | 21 | 1.3% |
| Total | 1,646 | 100.0% |
Ancestry in Bowman
The most populous ancestries reported in Bowman are German (490 | 29.8%), Norwegian (410 | 24.9%), Mexican (145 | 8.8%), Swedish (136 | 8.3%), and American (118 | 7.2%), together accounting for 78.9% of all Bowman residents.
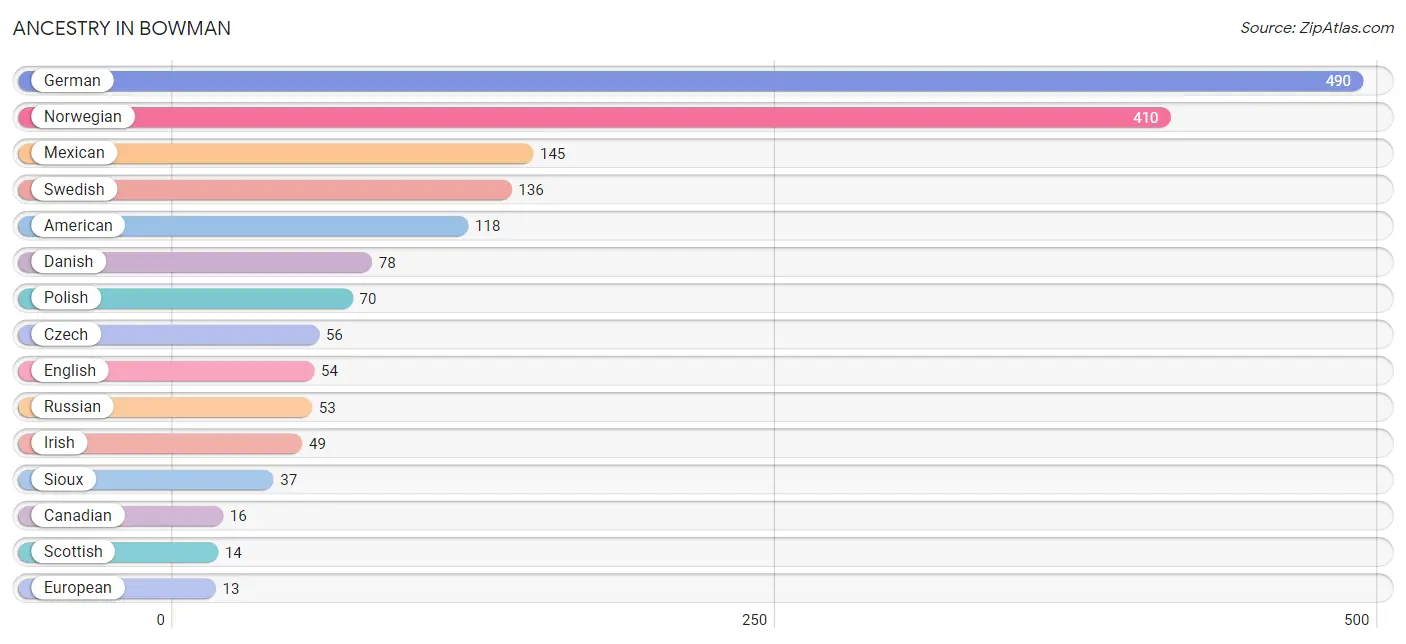
| Ancestry | # Population | % Population |
| American | 118 | 7.2% |
| Austrian | 2 | 0.1% |
| Canadian | 16 | 1.0% |
| Central American | 7 | 0.4% |
| Central American Indian | 2 | 0.1% |
| Cherokee | 2 | 0.1% |
| Czech | 56 | 3.4% |
| Danish | 78 | 4.7% |
| Dutch | 7 | 0.4% |
| English | 54 | 3.3% |
| European | 13 | 0.8% |
| Finnish | 10 | 0.6% |
| French | 4 | 0.2% |
| German | 490 | 29.8% |
| German Russian | 12 | 0.7% |
| Guatemalan | 2 | 0.1% |
| Hungarian | 6 | 0.4% |
| Irish | 49 | 3.0% |
| Italian | 5 | 0.3% |
| Mexican | 145 | 8.8% |
| Nicaraguan | 5 | 0.3% |
| Norwegian | 410 | 24.9% |
| Polish | 70 | 4.3% |
| Russian | 53 | 3.2% |
| Scandinavian | 3 | 0.2% |
| Scottish | 14 | 0.9% |
| Sioux | 37 | 2.2% |
| Swedish | 136 | 8.3% |
| Welsh | 2 | 0.1% | View All 29 Rows |
Immigrants in Bowman
The most numerous immigrant groups reported in Bowman came from Central America (17 | 1.0%), Latin America (17 | 1.0%), Mexico (15 | 0.9%), Europe (4 | 0.2%), and Italy (4 | 0.2%), together accounting for 3.5% of all Bowman residents.
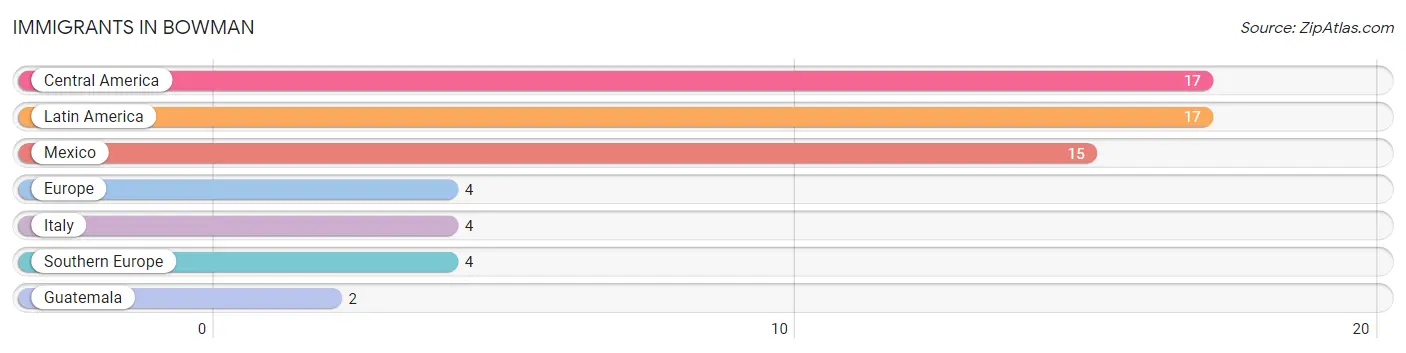
| Immigration Origin | # Population | % Population |
| Central America | 17 | 1.0% |
| Europe | 4 | 0.2% |
| Guatemala | 2 | 0.1% |
| Italy | 4 | 0.2% |
| Latin America | 17 | 1.0% |
| Mexico | 15 | 0.9% |
| Southern Europe | 4 | 0.2% | View All 7 Rows |
Sex and Age in Bowman
Sex and Age in Bowman
The most populous age groups in Bowman are 40 to 44 Years (87 | 10.9%) for men and 5 to 9 Years (90 | 10.6%) for women.
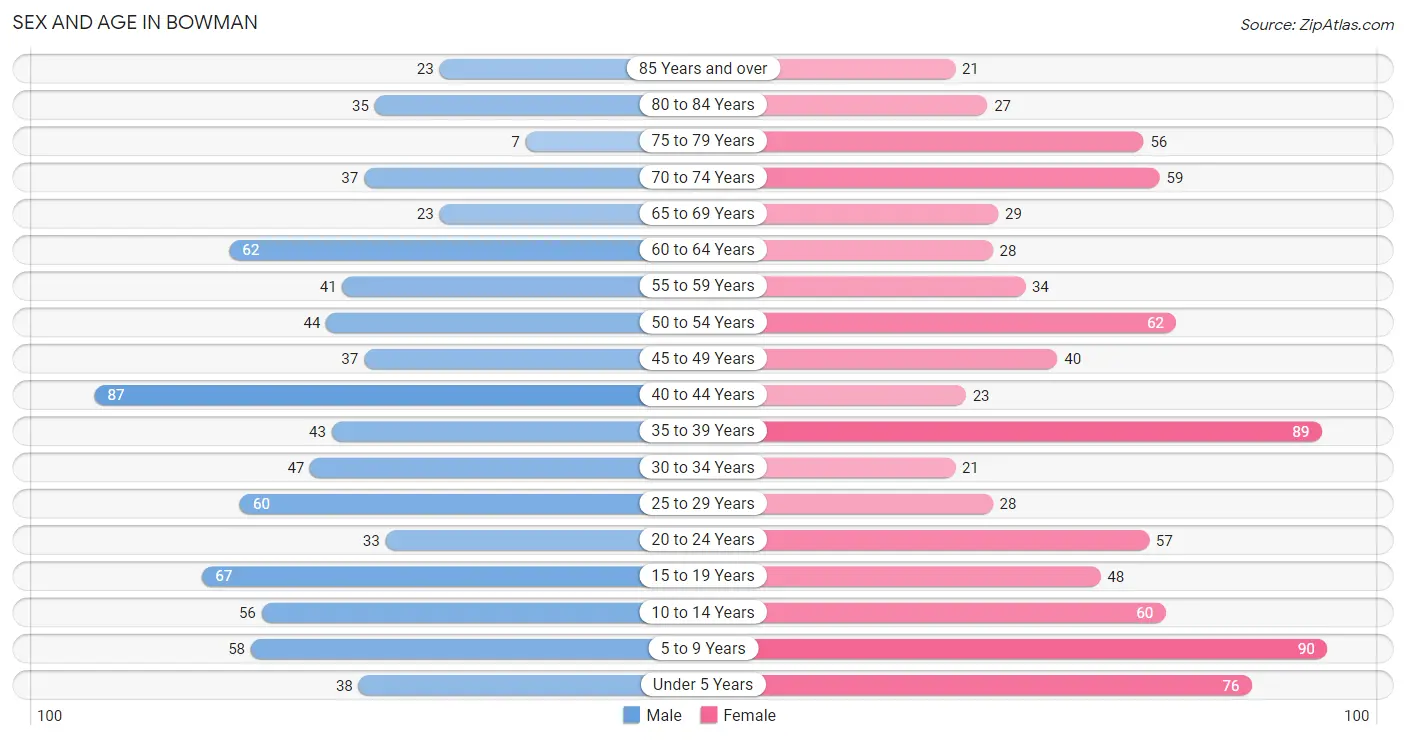
| Age Bracket | Male | Female |
| Under 5 Years | 38 (4.8%) | 76 (9.0%) |
| 5 to 9 Years | 58 (7.3%) | 90 (10.6%) |
| 10 to 14 Years | 56 (7.0%) | 60 (7.1%) |
| 15 to 19 Years | 67 (8.4%) | 48 (5.7%) |
| 20 to 24 Years | 33 (4.1%) | 57 (6.7%) |
| 25 to 29 Years | 60 (7.5%) | 28 (3.3%) |
| 30 to 34 Years | 47 (5.9%) | 21 (2.5%) |
| 35 to 39 Years | 43 (5.4%) | 89 (10.5%) |
| 40 to 44 Years | 87 (10.9%) | 23 (2.7%) |
| 45 to 49 Years | 37 (4.6%) | 40 (4.7%) |
| 50 to 54 Years | 44 (5.5%) | 62 (7.3%) |
| 55 to 59 Years | 41 (5.1%) | 34 (4.0%) |
| 60 to 64 Years | 62 (7.8%) | 28 (3.3%) |
| 65 to 69 Years | 23 (2.9%) | 29 (3.4%) |
| 70 to 74 Years | 37 (4.6%) | 59 (7.0%) |
| 75 to 79 Years | 7 (0.9%) | 56 (6.6%) |
| 80 to 84 Years | 35 (4.4%) | 27 (3.2%) |
| 85 Years and over | 23 (2.9%) | 21 (2.5%) |
| Total | 798 (100.0%) | 848 (100.0%) |
Families and Households in Bowman
Median Family Size in Bowman
The median family size in Bowman is 3.38 persons per family, with single male/father families (20 | 5.6%) accounting for the largest median family size of 3.9 persons per family. On the other hand, married-couple families (246 | 69.1%) represent the smallest median family size with 3.32 persons per family.
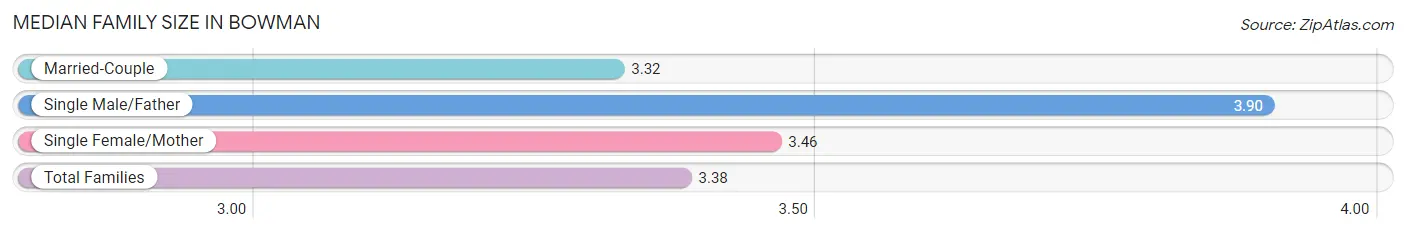
| Family Type | # Families | Family Size |
| Married-Couple | 246 (69.1%) | 3.32 |
| Single Male/Father | 20 (5.6%) | 3.90 |
| Single Female/Mother | 90 (25.3%) | 3.46 |
| Total Families | 356 (100.0%) | 3.38 |
Median Household Size in Bowman
The median household size in Bowman is 2.50 persons per household, with single female/mother households (90 | 14.3%) accounting for the largest median household size of 4.07 persons per household. non-family households (271 | 43.2%) represent the smallest median household size with 1.11 persons per household.
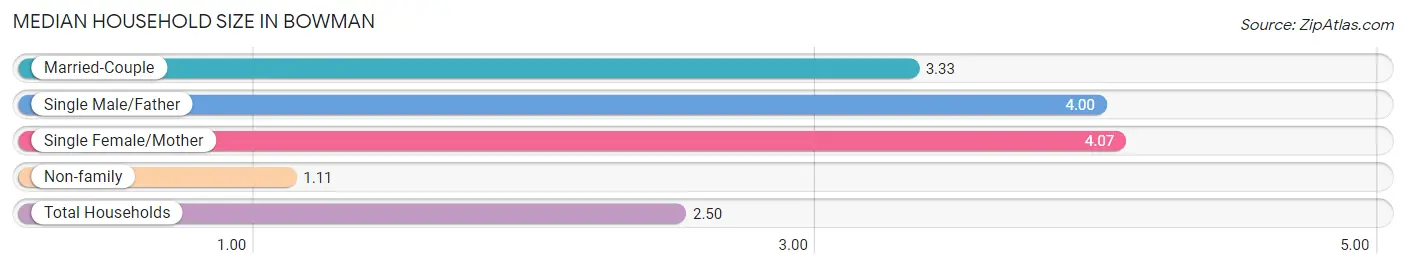
| Household Type | # Households | Household Size |
| Married-Couple | 246 (39.2%) | 3.33 |
| Single Male/Father | 20 (3.2%) | 4.00 |
| Single Female/Mother | 90 (14.3%) | 4.07 |
| Non-family | 271 (43.2%) | 1.11 |
| Total Households | 627 (100.0%) | 2.50 |
Household Size by Marriage Status in Bowman
Out of a total of 627 households in Bowman, 356 (56.8%) are family households, while 271 (43.2%) are nonfamily households. The most numerous type of family households are 2-person households, comprising 138, and the most common type of nonfamily households are 1-person households, comprising 247.
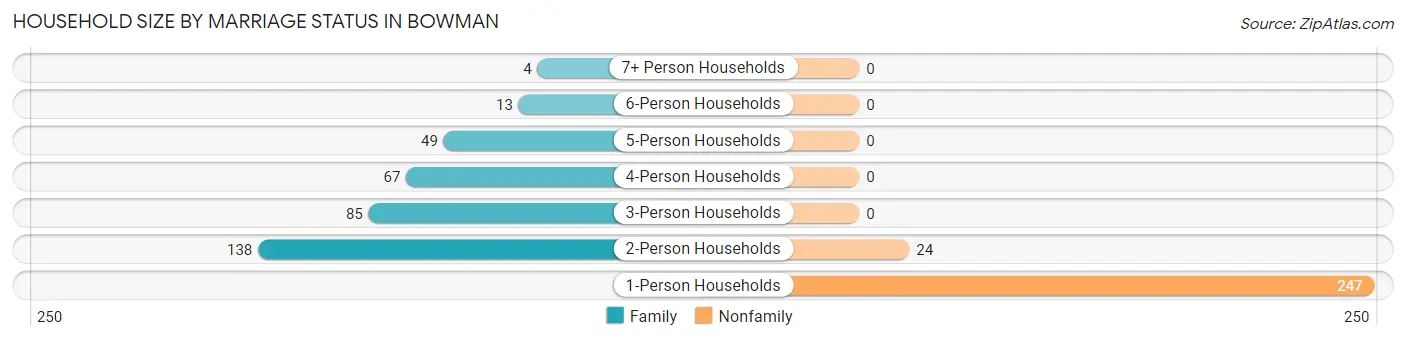
| Household Size | Family Households | Nonfamily Households |
| 1-Person Households | - | 247 (39.4%) |
| 2-Person Households | 138 (22.0%) | 24 (3.8%) |
| 3-Person Households | 85 (13.6%) | 0 (0.0%) |
| 4-Person Households | 67 (10.7%) | 0 (0.0%) |
| 5-Person Households | 49 (7.8%) | 0 (0.0%) |
| 6-Person Households | 13 (2.1%) | 0 (0.0%) |
| 7+ Person Households | 4 (0.6%) | 0 (0.0%) |
| Total | 356 (56.8%) | 271 (43.2%) |
Female Fertility in Bowman
Fertility by Age in Bowman
Average fertility rate in Bowman is 52.0 births per 1,000 women. Women in the age bracket of 35 to 50 years have the highest fertility rate with 75.0 births per 1,000 women. Women in the age bracket of 35 to 50 years acount for 76.5% of all women with births.
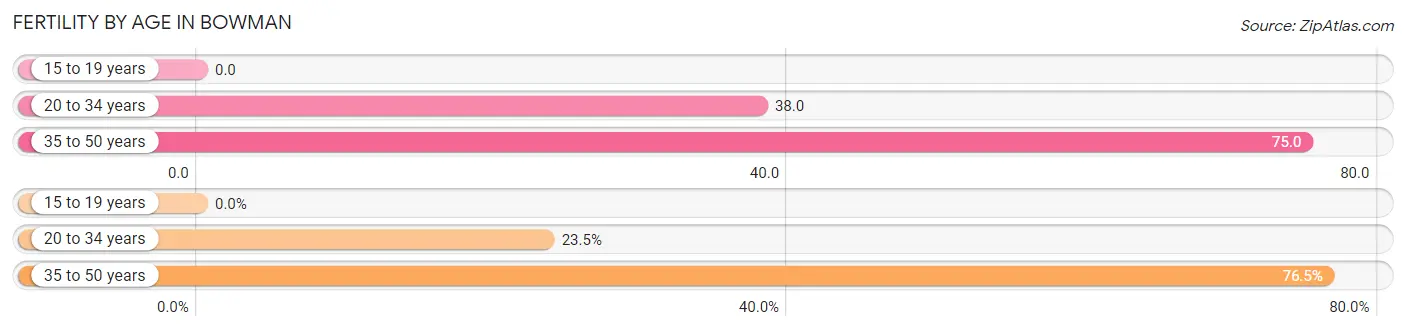
| Age Bracket | Women with Births | Births / 1,000 Women |
| 15 to 19 years | 0 (0.0%) | 0.0 |
| 20 to 34 years | 4 (23.5%) | 38.0 |
| 35 to 50 years | 13 (76.5%) | 75.0 |
| Total | 17 (100.0%) | 52.0 |
Fertility by Age by Marriage Status in Bowman
82.4% of women with births (17) in Bowman are married. The highest percentage of unmarried women with births falls into 20 to 34 years age bracket with 75.0% of them unmarried at the time of birth, while the lowest percentage of unmarried women with births belong to 35 to 50 years age bracket with 0.0% of them unmarried.
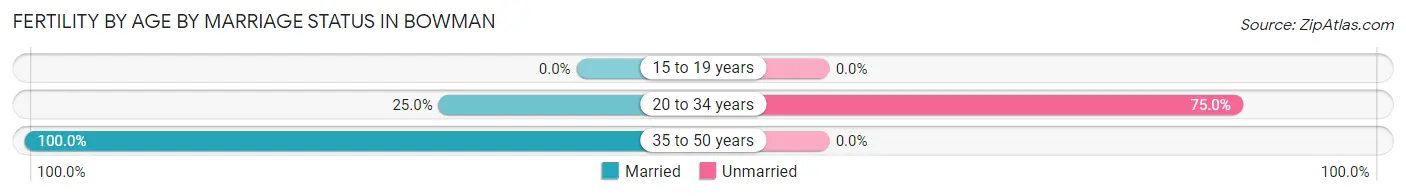
| Age Bracket | Married | Unmarried |
| 15 to 19 years | 0 (0.0%) | 0 (0.0%) |
| 20 to 34 years | 1 (25.0%) | 3 (75.0%) |
| 35 to 50 years | 13 (100.0%) | 0 (0.0%) |
| Total | 14 (82.4%) | 3 (17.6%) |
Fertility by Education in Bowman
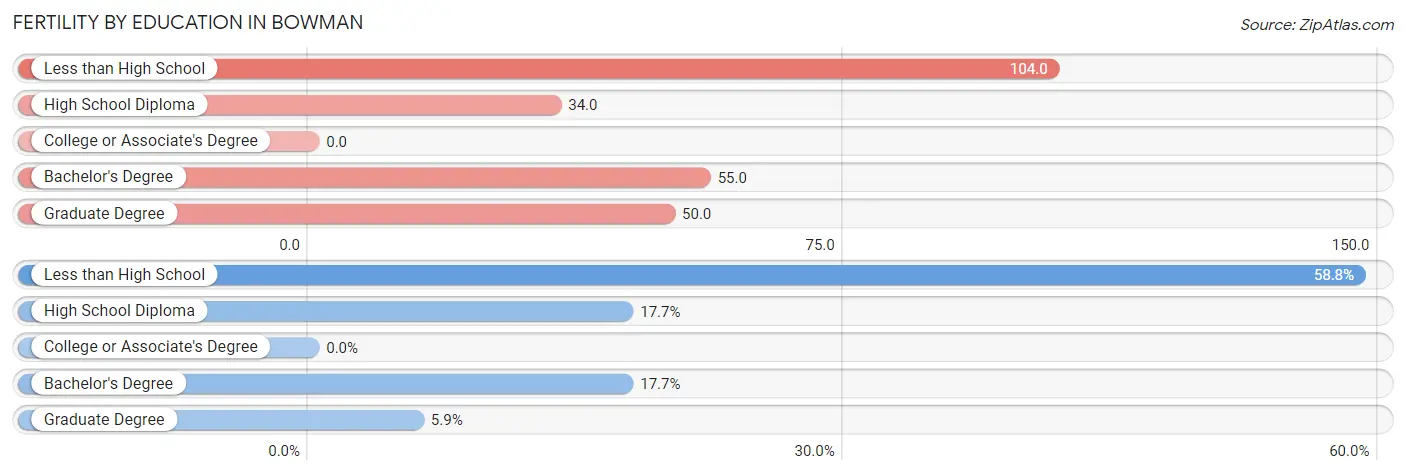
| Educational Attainment | Women with Births | Births / 1,000 Women |
| Less than High School | 10 (58.8%) | 104.0 |
| High School Diploma | 3 (17.6%) | 34.0 |
| College or Associate's Degree | 0 (0.0%) | 0.0 |
| Bachelor's Degree | 3 (17.6%) | 55.0 |
| Graduate Degree | 1 (5.9%) | 50.0 |
| Total | 17 (100.0%) | 52.0 |
Fertility by Education by Marriage Status in Bowman
17.6% of women with births in Bowman are unmarried. Women with the educational attainment of less than high school are most likely to be married with 100.0% of them married at childbirth, while women with the educational attainment of high school diploma are least likely to be married with 100.0% of them unmarried at childbirth.
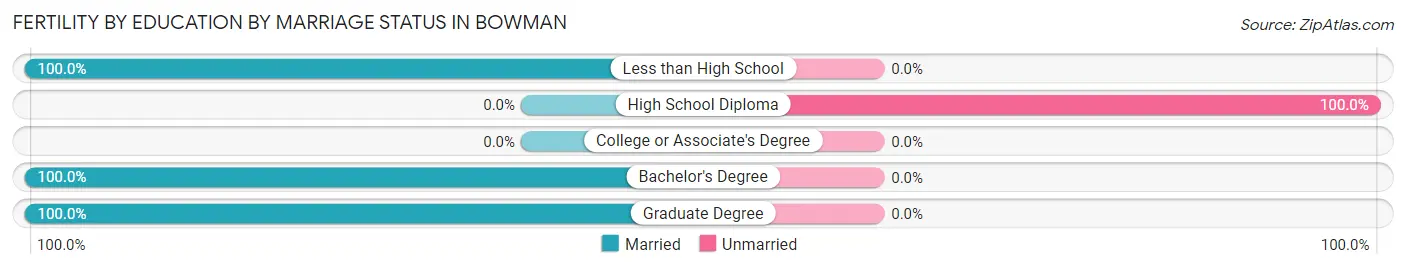
| Educational Attainment | Married | Unmarried |
| Less than High School | 10 (100.0%) | 0 (0.0%) |
| High School Diploma | 0 (0.0%) | 3 (100.0%) |
| College or Associate's Degree | 0 (0.0%) | 0 (0.0%) |
| Bachelor's Degree | 3 (100.0%) | 0 (0.0%) |
| Graduate Degree | 1 (100.0%) | 0 (0.0%) |
| Total | 14 (82.4%) | 3 (17.6%) |
Employment Characteristics in Bowman
Employment by Class of Employer in Bowman
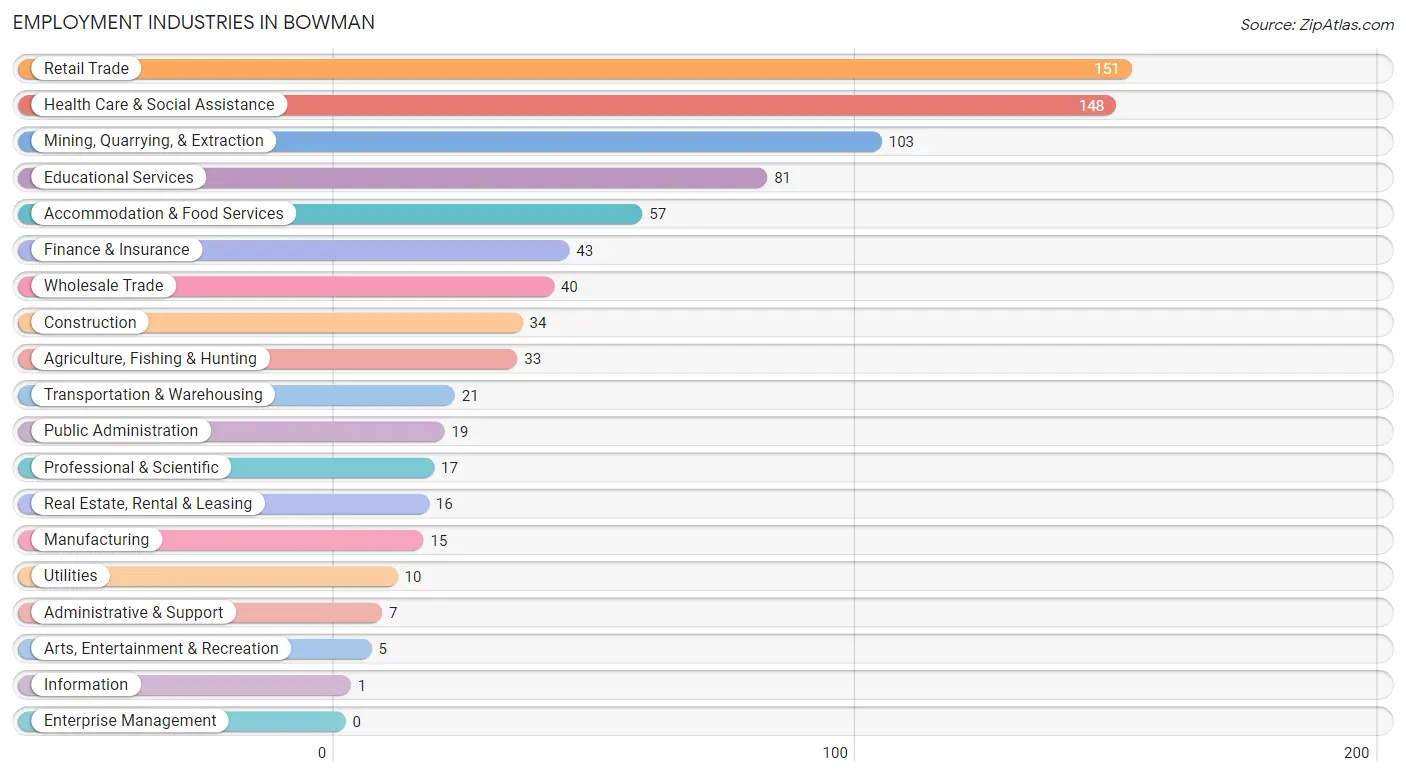
Among the 811 employed individuals in Bowman, private company employees (549 | 67.7%), not-for-profit organizations (105 | 13.0%), and local government employees (71 | 8.7%) make up the most common classes of employment.
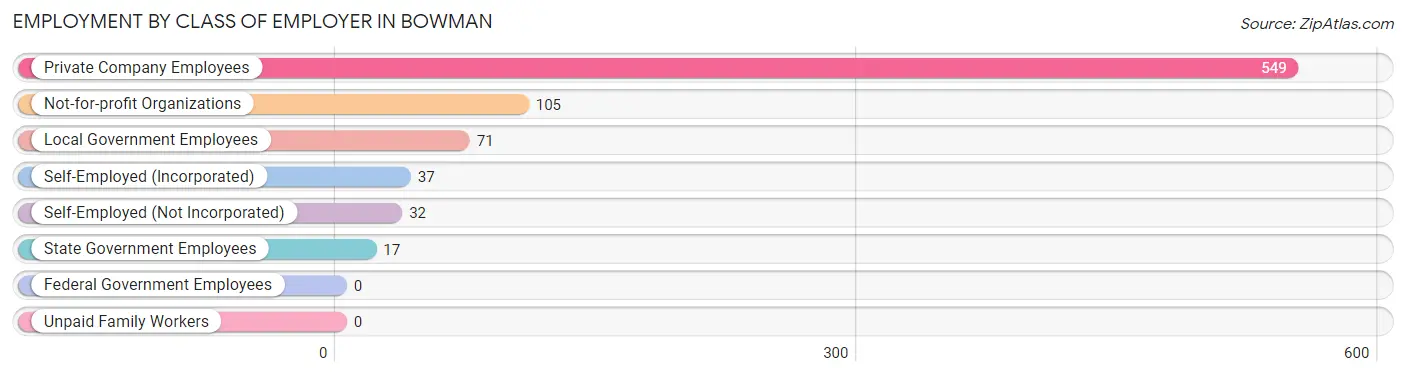
| Employer Class | # Employees | % Employees |
| Private Company Employees | 549 | 67.7% |
| Self-Employed (Incorporated) | 37 | 4.6% |
| Self-Employed (Not Incorporated) | 32 | 4.0% |
| Not-for-profit Organizations | 105 | 13.0% |
| Local Government Employees | 71 | 8.7% |
| State Government Employees | 17 | 2.1% |
| Federal Government Employees | 0 | 0.0% |
| Unpaid Family Workers | 0 | 0.0% |
| Total | 811 | 100.0% |
Employment Status by Age in Bowman
According to the labor force statistics for Bowman, out of the total population over 16 years of age (1,242), 69.7% or 866 individuals are in the labor force, with 4.4% or 38 of them unemployed. The age group with the highest labor force participation rate is 30 to 34 years, with 100.0% or 68 individuals in the labor force. Within the labor force, the 55 to 59 years age range has the highest percentage of unemployed individuals, with 20.3% or 14 of them being unemployed.
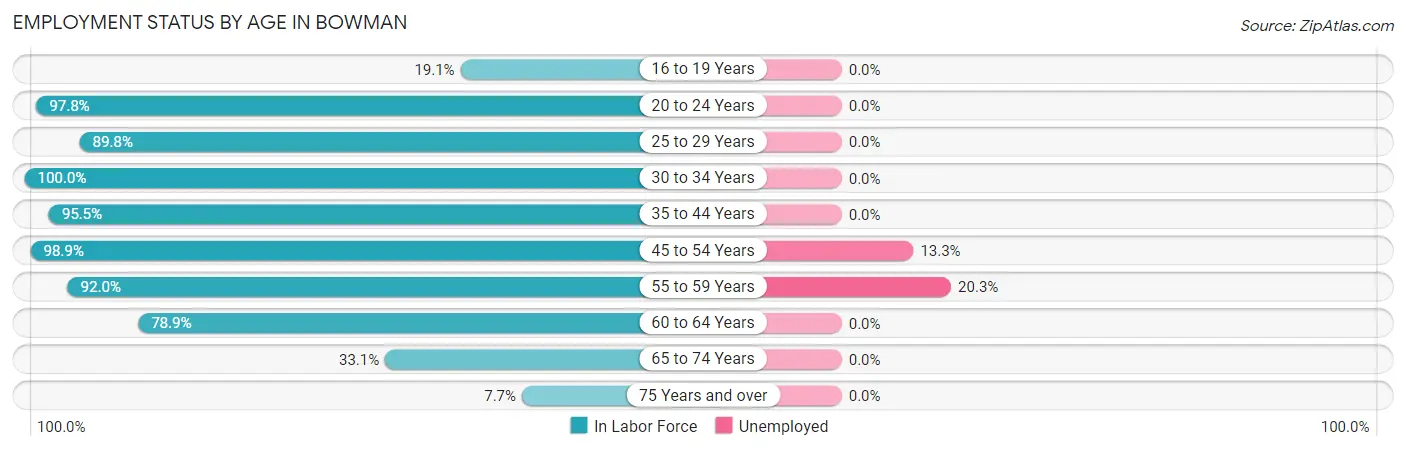
| Age Bracket | In Labor Force | Unemployed |
| 16 to 19 Years | 17 (19.1%) | 0 (0.0%) |
| 20 to 24 Years | 88 (97.8%) | 0 (0.0%) |
| 25 to 29 Years | 79 (89.8%) | 0 (0.0%) |
| 30 to 34 Years | 68 (100.0%) | 0 (0.0%) |
| 35 to 44 Years | 231 (95.5%) | 0 (0.0%) |
| 45 to 54 Years | 181 (98.9%) | 24 (13.3%) |
| 55 to 59 Years | 69 (92.0%) | 14 (20.3%) |
| 60 to 64 Years | 71 (78.9%) | 0 (0.0%) |
| 65 to 74 Years | 49 (33.1%) | 0 (0.0%) |
| 75 Years and over | 13 (7.7%) | 0 (0.0%) |
| Total | 866 (69.7%) | 38 (4.4%) |
Employment Status by Educational Attainment in Bowman
According to labor force statistics for Bowman, 93.7% of individuals (699) out of the total population between 25 and 64 years of age (746) are in the labor force, with 5.4% or 38 of them being unemployed. The group with the highest labor force participation rate are those with the educational attainment of bachelor's degree or higher, with 98.9% or 176 individuals in the labor force. Within the labor force, individuals with less than high school education have the highest percentage of unemployment, with 16.9% or 14 of them being unemployed.
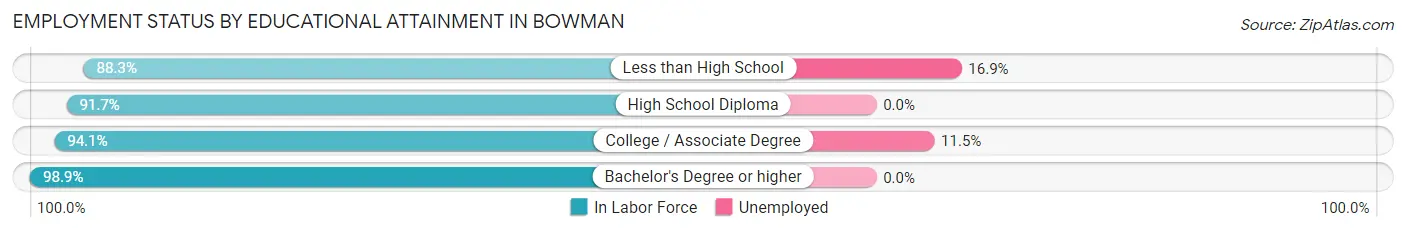
| Educational Attainment | In Labor Force | Unemployed |
| Less than High School | 83 (88.3%) | 16 (16.9%) |
| High School Diploma | 231 (91.7%) | 0 (0.0%) |
| College / Associate Degree | 209 (94.1%) | 26 (11.5%) |
| Bachelor's Degree or higher | 176 (98.9%) | 0 (0.0%) |
| Total | 699 (93.7%) | 40 (5.4%) |
Employment Occupations by Sex in Bowman
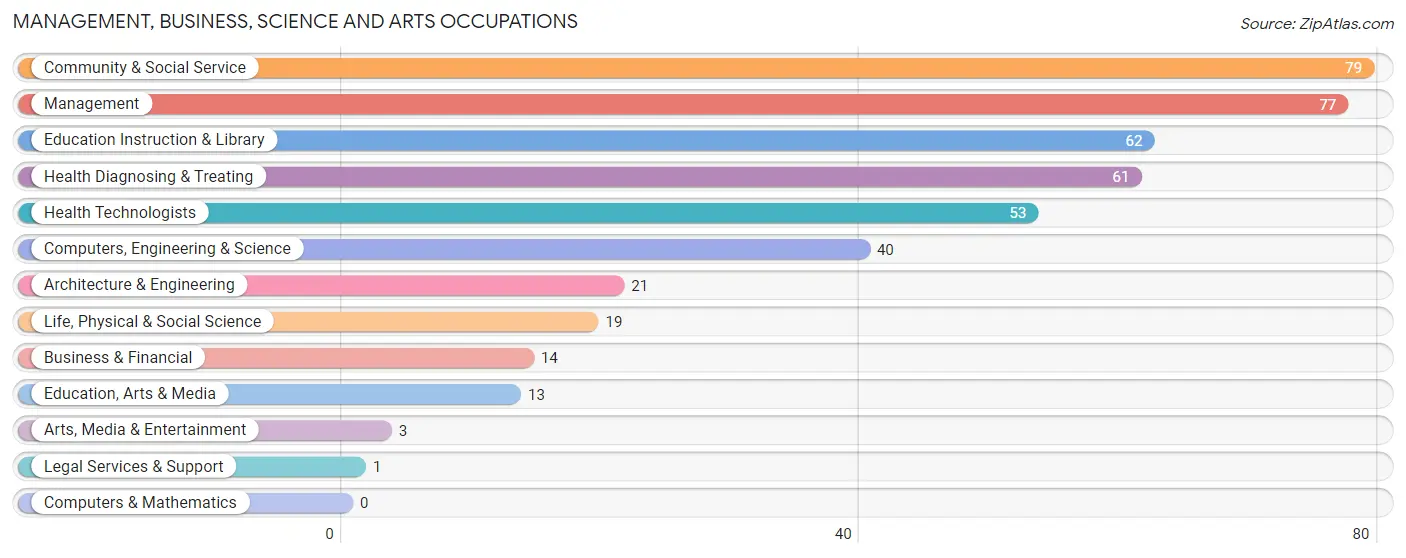
Management, Business, Science and Arts Occupations
The most common Management, Business, Science and Arts occupations in Bowman are Community & Social Service (79 | 9.5%), Management (77 | 9.3%), Education Instruction & Library (62 | 7.5%), Health Diagnosing & Treating (61 | 7.4%), and Health Technologists (53 | 6.4%).
Management, Business, Science and Arts Occupations by Sex
Within the Management, Business, Science and Arts occupations in Bowman, the most male-oriented occupations are Computers, Engineering & Science (100.0%), Architecture & Engineering (100.0%), and Life, Physical & Social Science (100.0%), while the most female-oriented occupations are Legal Services & Support (100.0%), Arts, Media & Entertainment (100.0%), and Health Technologists (75.5%).
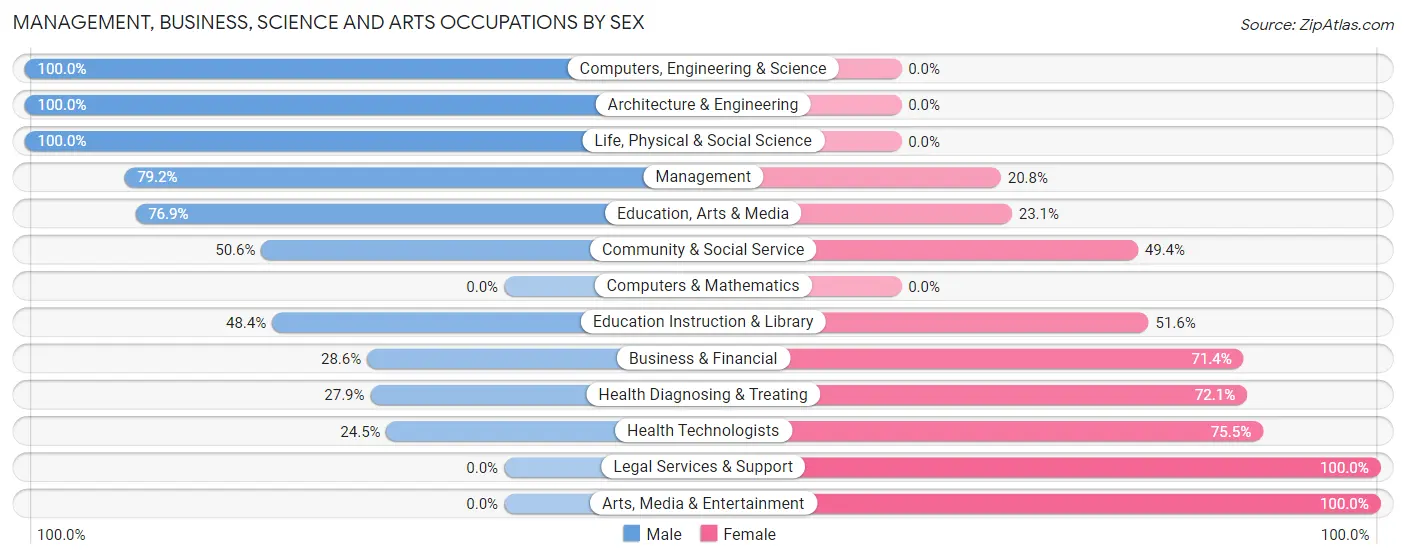
| Occupation | Male | Female |
| Management | 61 (79.2%) | 16 (20.8%) |
| Business & Financial | 4 (28.6%) | 10 (71.4%) |
| Computers, Engineering & Science | 40 (100.0%) | 0 (0.0%) |
| Computers & Mathematics | 0 (0.0%) | 0 (0.0%) |
| Architecture & Engineering | 21 (100.0%) | 0 (0.0%) |
| Life, Physical & Social Science | 19 (100.0%) | 0 (0.0%) |
| Community & Social Service | 40 (50.6%) | 39 (49.4%) |
| Education, Arts & Media | 10 (76.9%) | 3 (23.1%) |
| Legal Services & Support | 0 (0.0%) | 1 (100.0%) |
| Education Instruction & Library | 30 (48.4%) | 32 (51.6%) |
| Arts, Media & Entertainment | 0 (0.0%) | 3 (100.0%) |
| Health Diagnosing & Treating | 17 (27.9%) | 44 (72.1%) |
| Health Technologists | 13 (24.5%) | 40 (75.5%) |
| Total (Category) | 162 (59.8%) | 109 (40.2%) |
| Total (Overall) | 459 (55.4%) | 369 (44.6%) |
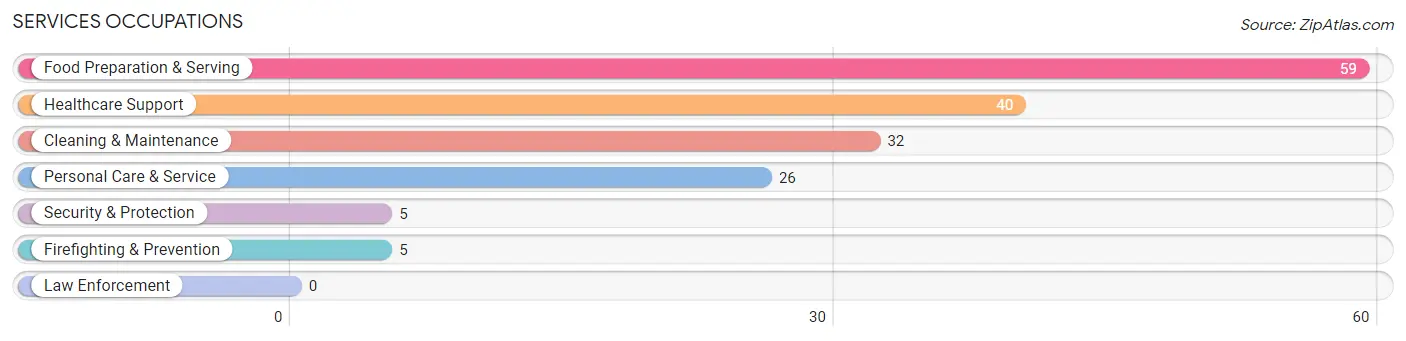
Services Occupations
The most common Services occupations in Bowman are Food Preparation & Serving (59 | 7.1%), Healthcare Support (40 | 4.8%), Cleaning & Maintenance (32 | 3.9%), Personal Care & Service (26 | 3.1%), and Security & Protection (5 | 0.6%).
Services Occupations by Sex
Within the Services occupations in Bowman, the most male-oriented occupations are Security & Protection (100.0%), Firefighting & Prevention (100.0%), and Cleaning & Maintenance (31.2%), while the most female-oriented occupations are Healthcare Support (100.0%), Personal Care & Service (100.0%), and Food Preparation & Serving (78.0%).
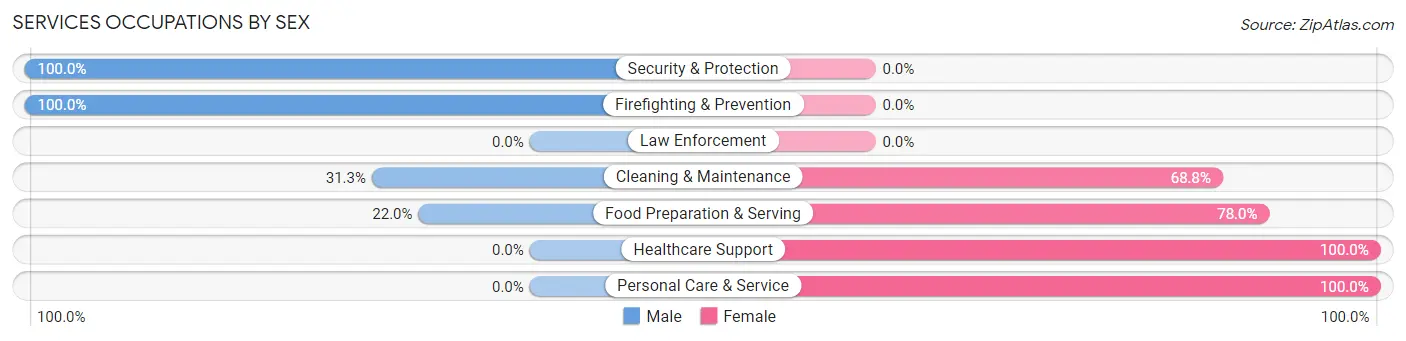
| Occupation | Male | Female |
| Healthcare Support | 0 (0.0%) | 40 (100.0%) |
| Security & Protection | 5 (100.0%) | 0 (0.0%) |
| Firefighting & Prevention | 5 (100.0%) | 0 (0.0%) |
| Law Enforcement | 0 (0.0%) | 0 (0.0%) |
| Food Preparation & Serving | 13 (22.0%) | 46 (78.0%) |
| Cleaning & Maintenance | 10 (31.2%) | 22 (68.8%) |
| Personal Care & Service | 0 (0.0%) | 26 (100.0%) |
| Total (Category) | 28 (17.3%) | 134 (82.7%) |
| Total (Overall) | 459 (55.4%) | 369 (44.6%) |
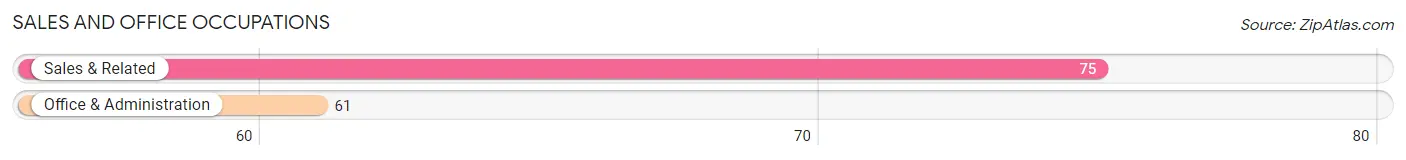
Sales and Office Occupations
The most common Sales and Office occupations in Bowman are Sales & Related (75 | 9.1%), and Office & Administration (61 | 7.4%).
Sales and Office Occupations by Sex
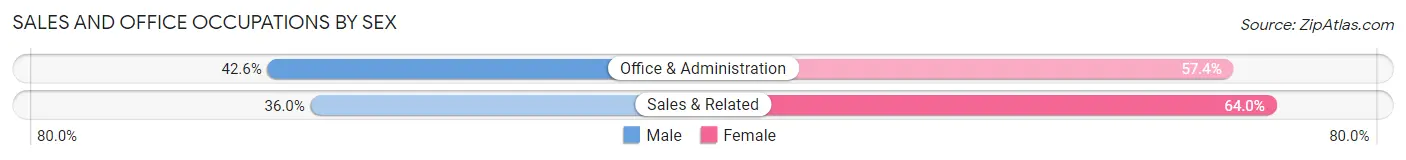
| Occupation | Male | Female |
| Sales & Related | 27 (36.0%) | 48 (64.0%) |
| Office & Administration | 26 (42.6%) | 35 (57.4%) |
| Total (Category) | 53 (39.0%) | 83 (61.0%) |
| Total (Overall) | 459 (55.4%) | 369 (44.6%) |
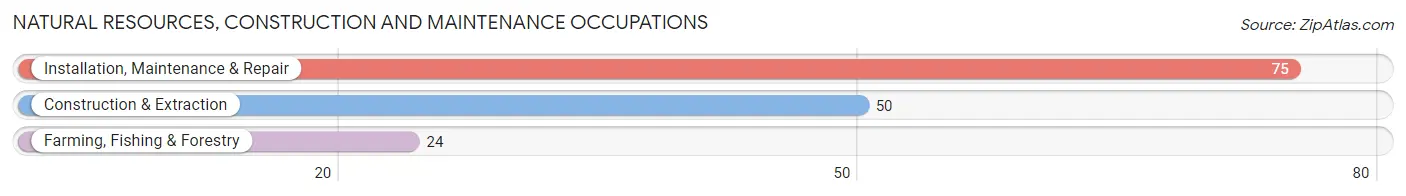
Natural Resources, Construction and Maintenance Occupations
The most common Natural Resources, Construction and Maintenance occupations in Bowman are Installation, Maintenance & Repair (75 | 9.1%), Construction & Extraction (50 | 6.0%), and Farming, Fishing & Forestry (24 | 2.9%).
Natural Resources, Construction and Maintenance Occupations by Sex
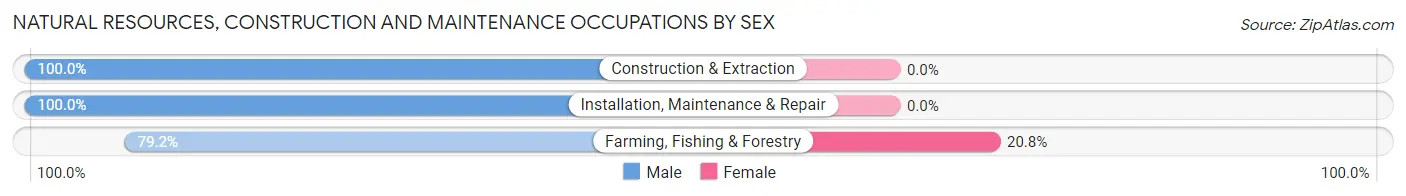
| Occupation | Male | Female |
| Farming, Fishing & Forestry | 19 (79.2%) | 5 (20.8%) |
| Construction & Extraction | 50 (100.0%) | 0 (0.0%) |
| Installation, Maintenance & Repair | 75 (100.0%) | 0 (0.0%) |
| Total (Category) | 144 (96.6%) | 5 (3.4%) |
| Total (Overall) | 459 (55.4%) | 369 (44.6%) |
Production, Transportation and Moving Occupations
The most common Production, Transportation and Moving occupations in Bowman are Material Moving (53 | 6.4%), Production (31 | 3.7%), and Transportation (26 | 3.1%).
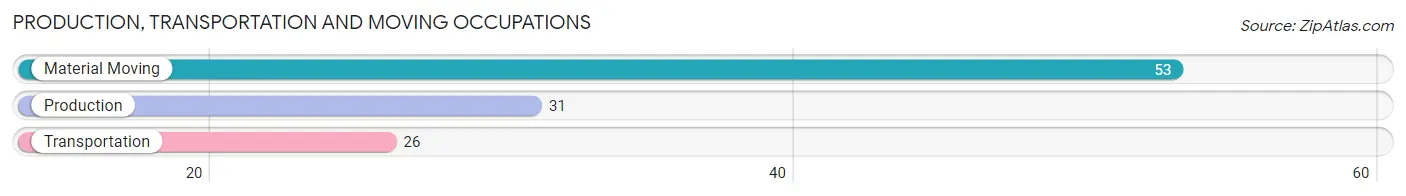
Production, Transportation and Moving Occupations by Sex
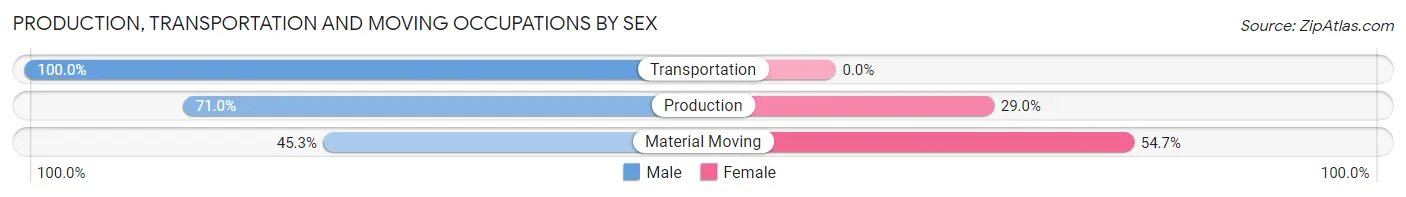
| Occupation | Male | Female |
| Production | 22 (71.0%) | 9 (29.0%) |
| Transportation | 26 (100.0%) | 0 (0.0%) |
| Material Moving | 24 (45.3%) | 29 (54.7%) |
| Total (Category) | 72 (65.4%) | 38 (34.5%) |
| Total (Overall) | 459 (55.4%) | 369 (44.6%) |
Employment Industries by Sex in Bowman
Employment Industries in Bowman
The major employment industries in Bowman include Retail Trade (151 | 18.2%), Health Care & Social Assistance (148 | 17.9%), Mining, Quarrying, & Extraction (103 | 12.4%), Educational Services (81 | 9.8%), and Accommodation & Food Services (57 | 6.9%).
Employment Industries by Sex in Bowman
The Bowman industries that see more men than women are Agriculture, Fishing & Hunting (100.0%), Construction (100.0%), and Manufacturing (100.0%), whereas the industries that tend to have a higher number of women are Information (100.0%), Arts, Entertainment & Recreation (100.0%), and Public Administration (89.5%).
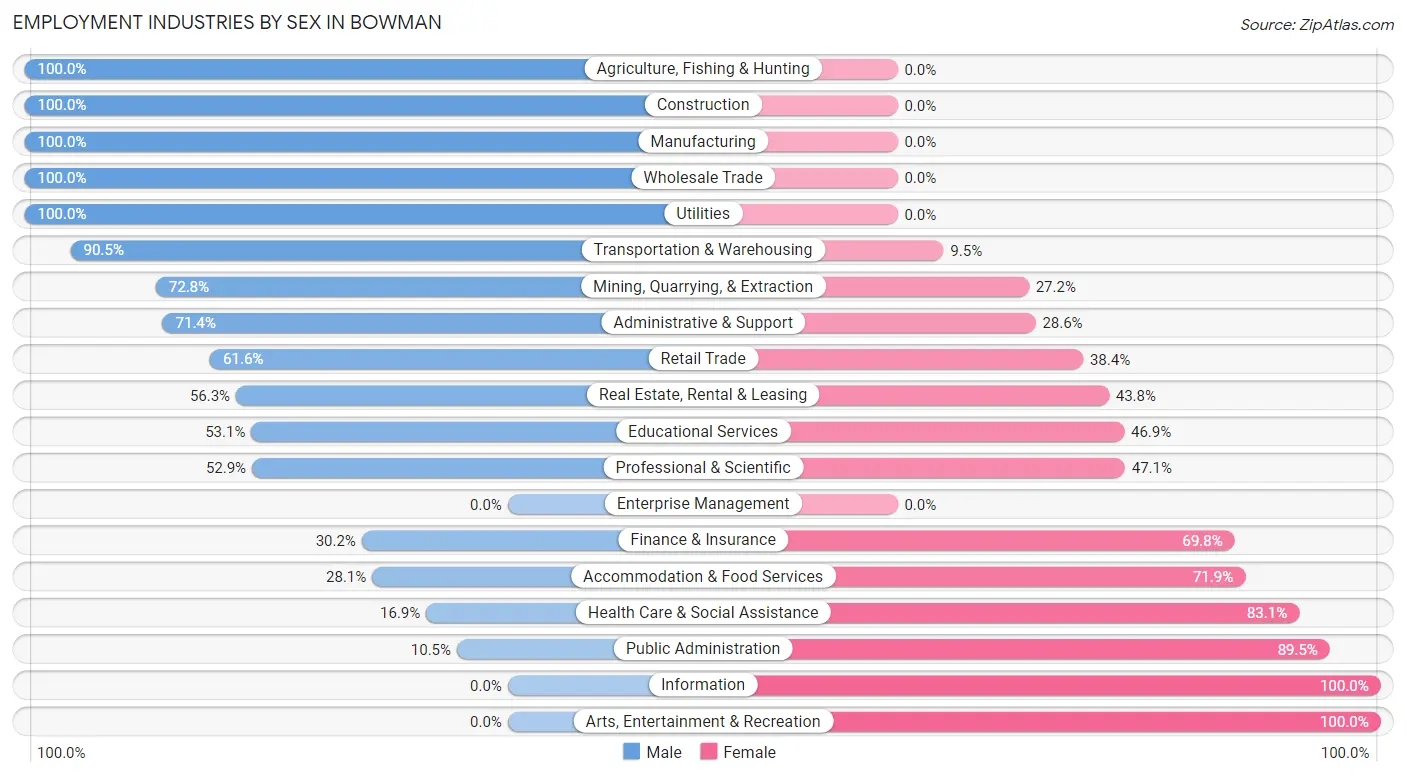
| Industry | Male | Female |
| Agriculture, Fishing & Hunting | 33 (100.0%) | 0 (0.0%) |
| Mining, Quarrying, & Extraction | 75 (72.8%) | 28 (27.2%) |
| Construction | 34 (100.0%) | 0 (0.0%) |
| Manufacturing | 15 (100.0%) | 0 (0.0%) |
| Wholesale Trade | 40 (100.0%) | 0 (0.0%) |
| Retail Trade | 93 (61.6%) | 58 (38.4%) |
| Transportation & Warehousing | 19 (90.5%) | 2 (9.5%) |
| Utilities | 10 (100.0%) | 0 (0.0%) |
| Information | 0 (0.0%) | 1 (100.0%) |
| Finance & Insurance | 13 (30.2%) | 30 (69.8%) |
| Real Estate, Rental & Leasing | 9 (56.2%) | 7 (43.8%) |
| Professional & Scientific | 9 (52.9%) | 8 (47.1%) |
| Enterprise Management | 0 (0.0%) | 0 (0.0%) |
| Administrative & Support | 5 (71.4%) | 2 (28.6%) |
| Educational Services | 43 (53.1%) | 38 (46.9%) |
| Health Care & Social Assistance | 25 (16.9%) | 123 (83.1%) |
| Arts, Entertainment & Recreation | 0 (0.0%) | 5 (100.0%) |
| Accommodation & Food Services | 16 (28.1%) | 41 (71.9%) |
| Public Administration | 2 (10.5%) | 17 (89.5%) |
| Total | 459 (55.4%) | 369 (44.6%) |
Education in Bowman
School Enrollment in Bowman
The most common levels of schooling among the 386 students in Bowman are elementary school (104 | 26.9%), middle school (94 | 24.3%), and high school (88 | 22.8%).
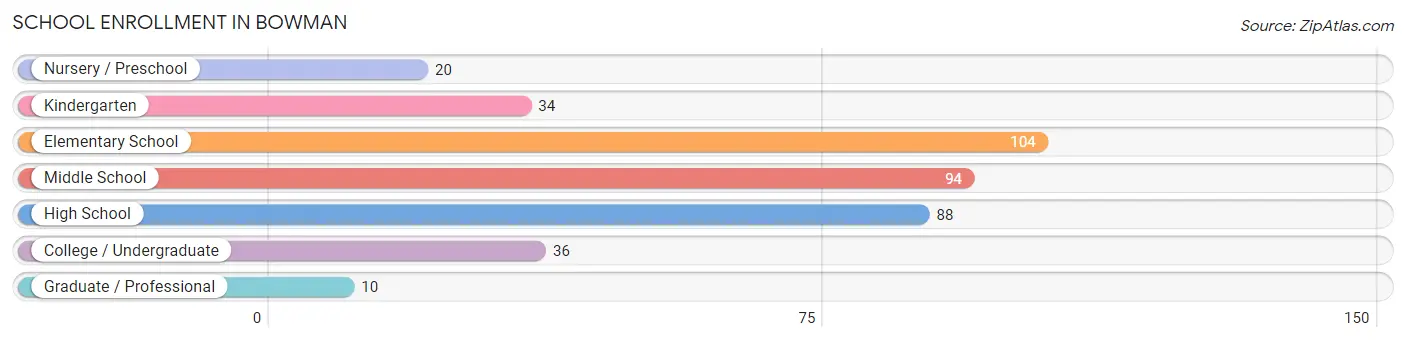
| School Level | # Students | % Students |
| Nursery / Preschool | 20 | 5.2% |
| Kindergarten | 34 | 8.8% |
| Elementary School | 104 | 26.9% |
| Middle School | 94 | 24.3% |
| High School | 88 | 22.8% |
| College / Undergraduate | 36 | 9.3% |
| Graduate / Professional | 10 | 2.6% |
| Total | 386 | 100.0% |
School Enrollment by Age by Funding Source in Bowman
Out of a total of 386 students who are enrolled in schools in Bowman, 11 (2.8%) attend a private institution, while the remaining 375 (97.2%) are enrolled in public schools. The age group of 35 years and over has the highest likelihood of being enrolled in private schools, with 9 (75.0% in the age bracket) enrolled. Conversely, the age group of 3 to 4 year olds has the lowest likelihood of being enrolled in a private school, with 10 (100.0% in the age bracket) attending a public institution.
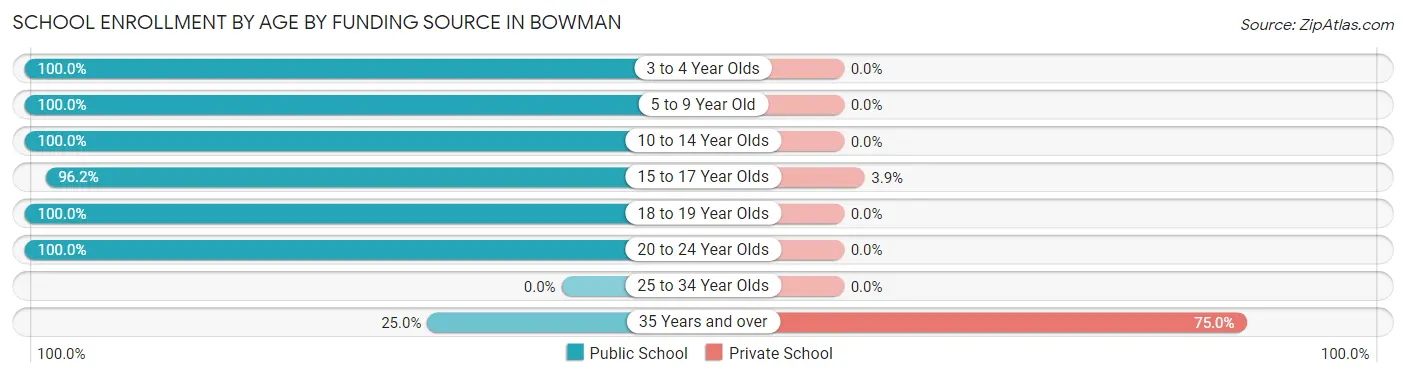
| Age Bracket | Public School | Private School |
| 3 to 4 Year Olds | 10 (100.0%) | 0 (0.0%) |
| 5 to 9 Year Old | 148 (100.0%) | 0 (0.0%) |
| 10 to 14 Year Olds | 99 (100.0%) | 0 (0.0%) |
| 15 to 17 Year Olds | 50 (96.2%) | 2 (3.8%) |
| 18 to 19 Year Olds | 55 (100.0%) | 0 (0.0%) |
| 20 to 24 Year Olds | 10 (100.0%) | 0 (0.0%) |
| 25 to 34 Year Olds | 0 (0.0%) | 0 (0.0%) |
| 35 Years and over | 3 (25.0%) | 9 (75.0%) |
| Total | 375 (97.2%) | 11 (2.8%) |
Educational Attainment by Field of Study in Bowman
Education (84 | 29.2%), science & technology (49 | 17.0%), business (46 | 16.0%), bio, nature & agricultural (35 | 12.1%), and engineering (20 | 6.9%) are the most common fields of study among 288 individuals in Bowman who have obtained a bachelor's degree or higher.
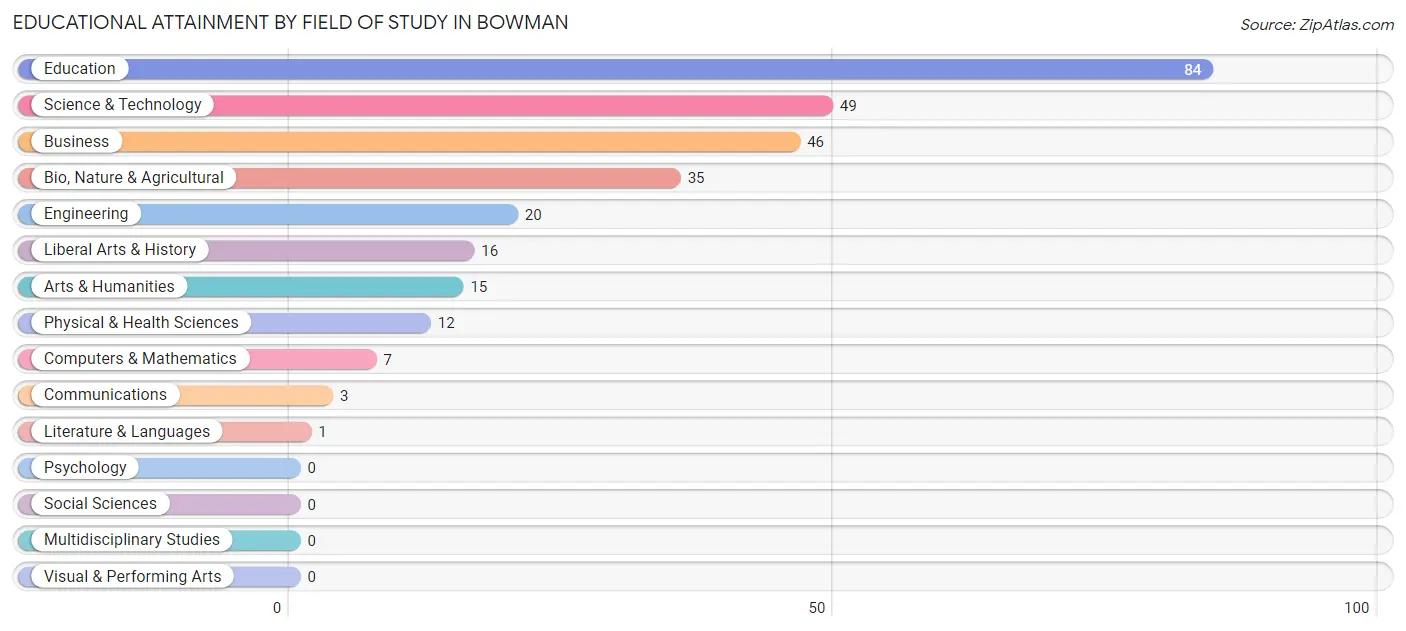
| Field of Study | # Graduates | % Graduates |
| Computers & Mathematics | 7 | 2.4% |
| Bio, Nature & Agricultural | 35 | 12.1% |
| Physical & Health Sciences | 12 | 4.2% |
| Psychology | 0 | 0.0% |
| Social Sciences | 0 | 0.0% |
| Engineering | 20 | 6.9% |
| Multidisciplinary Studies | 0 | 0.0% |
| Science & Technology | 49 | 17.0% |
| Business | 46 | 16.0% |
| Education | 84 | 29.2% |
| Literature & Languages | 1 | 0.4% |
| Liberal Arts & History | 16 | 5.6% |
| Visual & Performing Arts | 0 | 0.0% |
| Communications | 3 | 1.0% |
| Arts & Humanities | 15 | 5.2% |
| Total | 288 | 100.0% |
Transportation & Commute in Bowman
Vehicle Availability by Sex in Bowman
The most prevalent vehicle ownership categories in Bowman are males with 2 vehicles (152, accounting for 33.1%) and females with 2 vehicles (156, making up 43.2%).
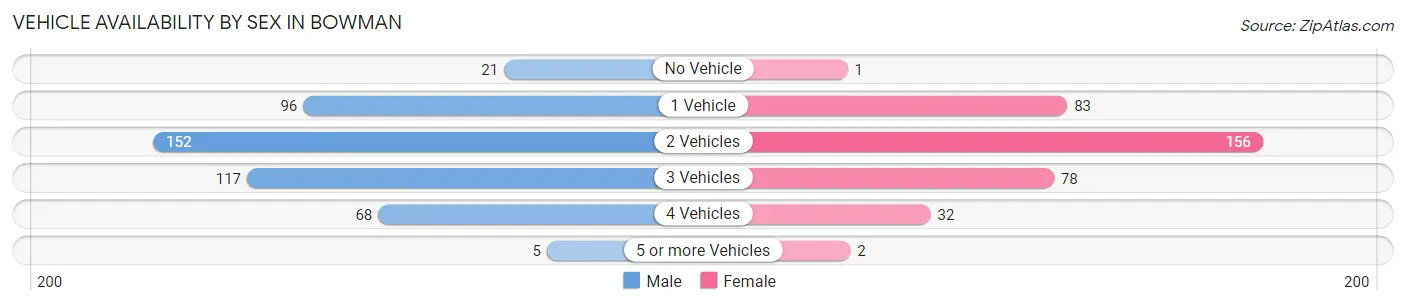
| Vehicles Available | Male | Female |
| No Vehicle | 21 (4.6%) | 1 (0.3%) |
| 1 Vehicle | 96 (20.9%) | 83 (23.6%) |
| 2 Vehicles | 152 (33.1%) | 156 (44.3%) |
| 3 Vehicles | 117 (25.5%) | 78 (22.2%) |
| 4 Vehicles | 68 (14.8%) | 32 (9.1%) |
| 5 or more Vehicles | 5 (1.1%) | 2 (0.6%) |
| Total | 459 (100.0%) | 352 (100.0%) |
Commute Time in Bowman
The most frequently occuring commute durations in Bowman are 5 to 9 minutes (300 commuters, 37.4%), less than 5 minutes (243 commuters, 30.3%), and 10 to 14 minutes (80 commuters, 10.0%).
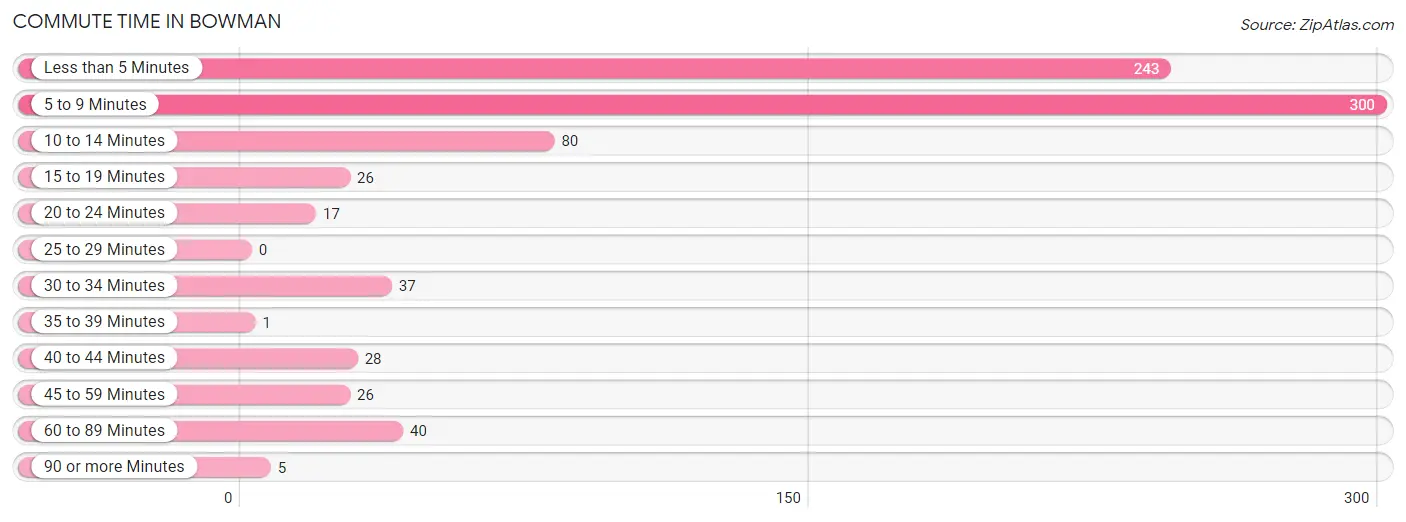
| Commute Time | # Commuters | % Commuters |
| Less than 5 Minutes | 243 | 30.3% |
| 5 to 9 Minutes | 300 | 37.4% |
| 10 to 14 Minutes | 80 | 10.0% |
| 15 to 19 Minutes | 26 | 3.2% |
| 20 to 24 Minutes | 17 | 2.1% |
| 25 to 29 Minutes | 0 | 0.0% |
| 30 to 34 Minutes | 37 | 4.6% |
| 35 to 39 Minutes | 1 | 0.1% |
| 40 to 44 Minutes | 28 | 3.5% |
| 45 to 59 Minutes | 26 | 3.2% |
| 60 to 89 Minutes | 40 | 5.0% |
| 90 or more Minutes | 5 | 0.6% |
Commute Time by Sex in Bowman
The most common commute times in Bowman are 5 to 9 minutes (167 commuters, 36.4%) for males and 5 to 9 minutes (133 commuters, 38.7%) for females.
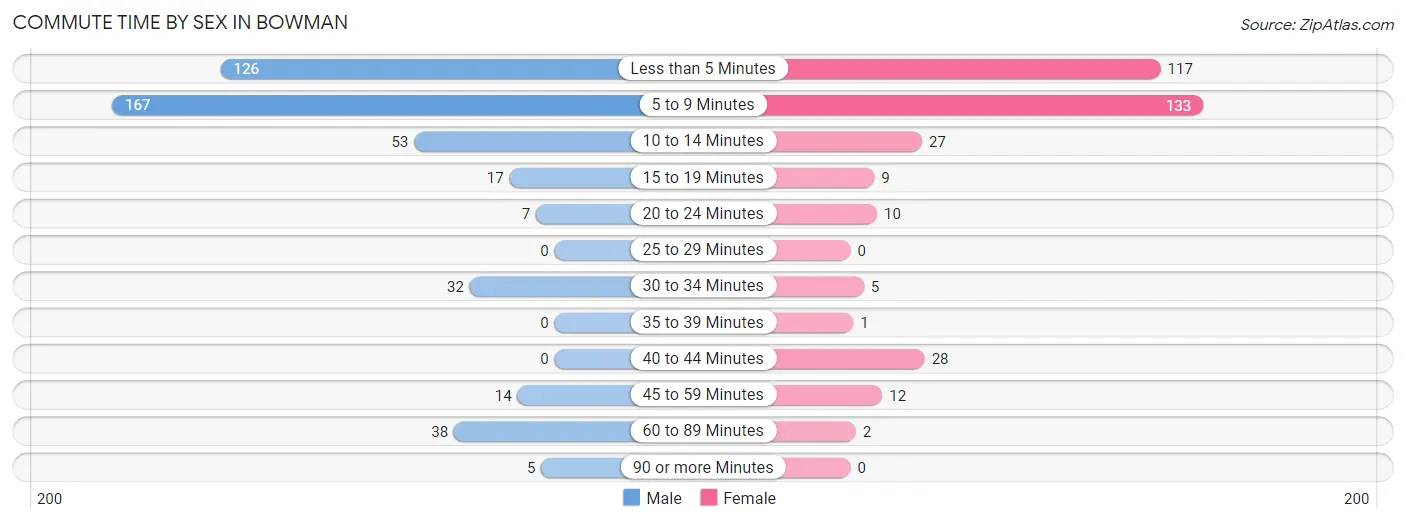
| Commute Time | Male | Female |
| Less than 5 Minutes | 126 (27.5%) | 117 (34.0%) |
| 5 to 9 Minutes | 167 (36.4%) | 133 (38.7%) |
| 10 to 14 Minutes | 53 (11.6%) | 27 (7.9%) |
| 15 to 19 Minutes | 17 (3.7%) | 9 (2.6%) |
| 20 to 24 Minutes | 7 (1.5%) | 10 (2.9%) |
| 25 to 29 Minutes | 0 (0.0%) | 0 (0.0%) |
| 30 to 34 Minutes | 32 (7.0%) | 5 (1.5%) |
| 35 to 39 Minutes | 0 (0.0%) | 1 (0.3%) |
| 40 to 44 Minutes | 0 (0.0%) | 28 (8.1%) |
| 45 to 59 Minutes | 14 (3.0%) | 12 (3.5%) |
| 60 to 89 Minutes | 38 (8.3%) | 2 (0.6%) |
| 90 or more Minutes | 5 (1.1%) | 0 (0.0%) |
Time of Departure to Work by Sex in Bowman
The most frequent times of departure to work in Bowman are 7:30 AM to 7:59 AM (121, 26.4%) for males and 5:30 AM to 5:59 AM (60, 17.4%) for females.
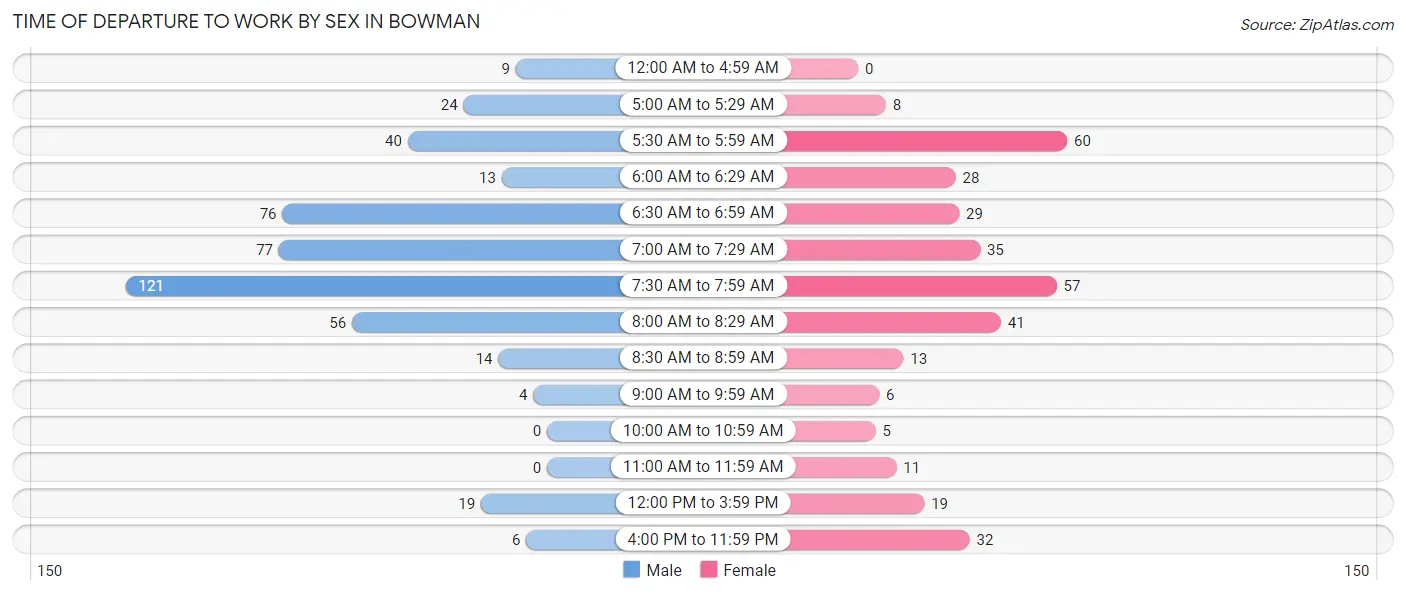
| Time of Departure | Male | Female |
| 12:00 AM to 4:59 AM | 9 (2.0%) | 0 (0.0%) |
| 5:00 AM to 5:29 AM | 24 (5.2%) | 8 (2.3%) |
| 5:30 AM to 5:59 AM | 40 (8.7%) | 60 (17.4%) |
| 6:00 AM to 6:29 AM | 13 (2.8%) | 28 (8.1%) |
| 6:30 AM to 6:59 AM | 76 (16.6%) | 29 (8.4%) |
| 7:00 AM to 7:29 AM | 77 (16.8%) | 35 (10.2%) |
| 7:30 AM to 7:59 AM | 121 (26.4%) | 57 (16.6%) |
| 8:00 AM to 8:29 AM | 56 (12.2%) | 41 (11.9%) |
| 8:30 AM to 8:59 AM | 14 (3.0%) | 13 (3.8%) |
| 9:00 AM to 9:59 AM | 4 (0.9%) | 6 (1.7%) |
| 10:00 AM to 10:59 AM | 0 (0.0%) | 5 (1.5%) |
| 11:00 AM to 11:59 AM | 0 (0.0%) | 11 (3.2%) |
| 12:00 PM to 3:59 PM | 19 (4.1%) | 19 (5.5%) |
| 4:00 PM to 11:59 PM | 6 (1.3%) | 32 (9.3%) |
| Total | 459 (100.0%) | 344 (100.0%) |
Housing Occupancy in Bowman
Occupancy by Ownership in Bowman
Of the total 627 dwellings in Bowman, owner-occupied units account for 442 (70.5%), while renter-occupied units make up 185 (29.5%).
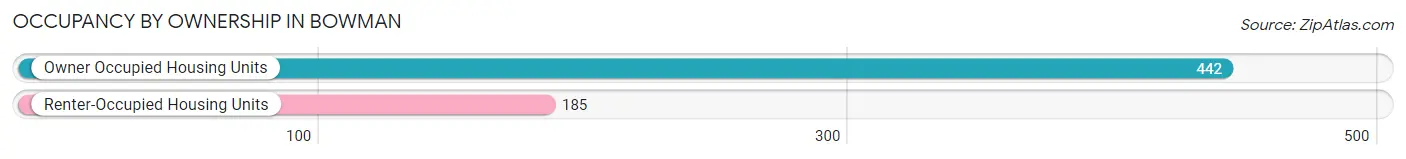
| Occupancy | # Housing Units | % Housing Units |
| Owner Occupied Housing Units | 442 | 70.5% |
| Renter-Occupied Housing Units | 185 | 29.5% |
| Total Occupied Housing Units | 627 | 100.0% |
Occupancy by Household Size in Bowman
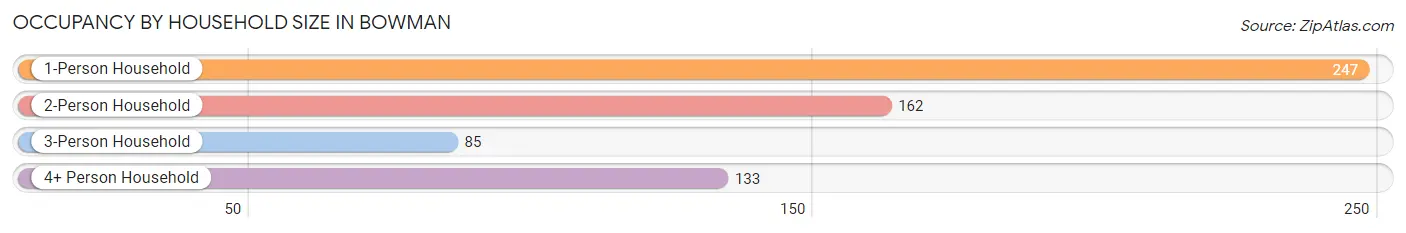
| Household Size | # Housing Units | % Housing Units |
| 1-Person Household | 247 | 39.4% |
| 2-Person Household | 162 | 25.8% |
| 3-Person Household | 85 | 13.6% |
| 4+ Person Household | 133 | 21.2% |
| Total Housing Units | 627 | 100.0% |
Occupancy by Ownership by Household Size in Bowman
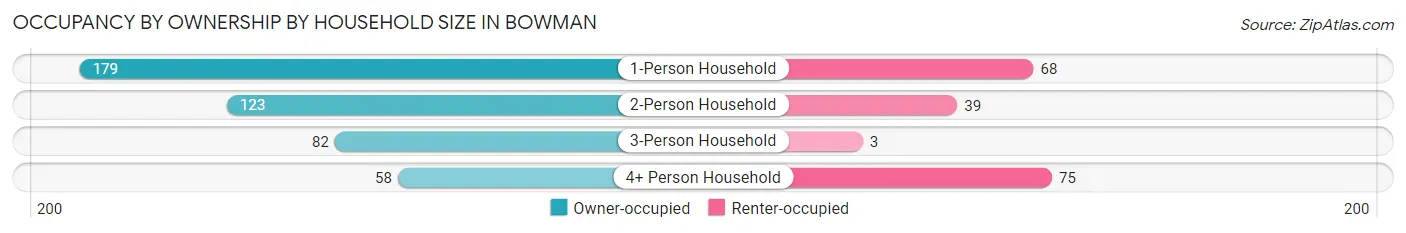
| Household Size | Owner-occupied | Renter-occupied |
| 1-Person Household | 179 (72.5%) | 68 (27.5%) |
| 2-Person Household | 123 (75.9%) | 39 (24.1%) |
| 3-Person Household | 82 (96.5%) | 3 (3.5%) |
| 4+ Person Household | 58 (43.6%) | 75 (56.4%) |
| Total Housing Units | 442 (70.5%) | 185 (29.5%) |
Occupancy by Educational Attainment in Bowman
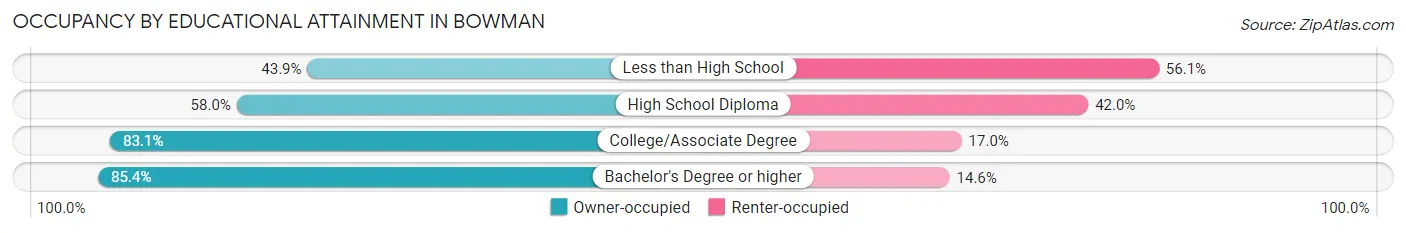
| Household Size | Owner-occupied | Renter-occupied |
| Less than High School | 29 (43.9%) | 37 (56.1%) |
| High School Diploma | 131 (58.0%) | 95 (42.0%) |
| College/Associate Degree | 147 (83.1%) | 30 (17.0%) |
| Bachelor's Degree or higher | 135 (85.4%) | 23 (14.6%) |
Occupancy by Age of Householder in Bowman
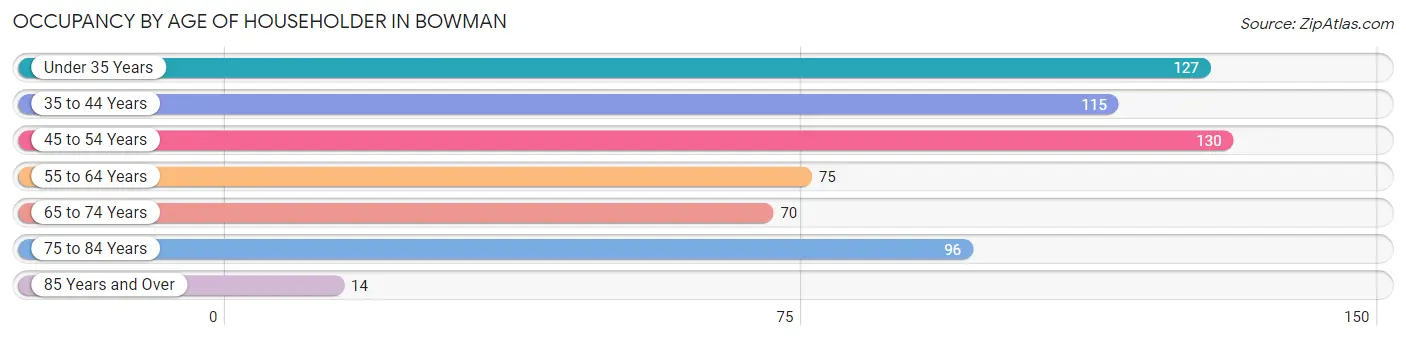
| Age Bracket | # Households | % Households |
| Under 35 Years | 127 | 20.3% |
| 35 to 44 Years | 115 | 18.3% |
| 45 to 54 Years | 130 | 20.7% |
| 55 to 64 Years | 75 | 12.0% |
| 65 to 74 Years | 70 | 11.2% |
| 75 to 84 Years | 96 | 15.3% |
| 85 Years and Over | 14 | 2.2% |
| Total | 627 | 100.0% |
Housing Finances in Bowman
Median Income by Occupancy in Bowman
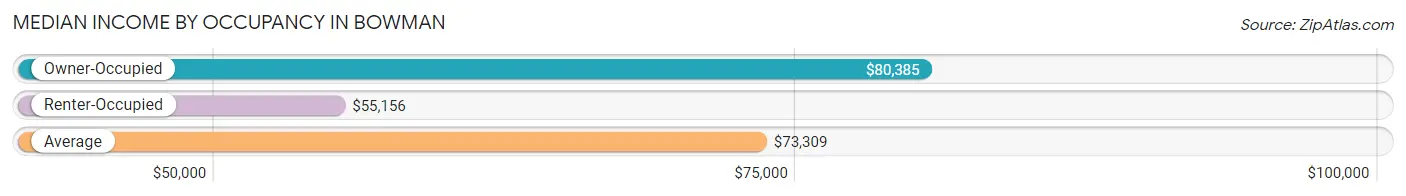
| Occupancy Type | # Households | Median Income |
| Owner-Occupied | 442 (70.5%) | $80,385 |
| Renter-Occupied | 185 (29.5%) | $55,156 |
| Average | 627 (100.0%) | $73,309 |
Occupancy by Householder Income Bracket in Bowman
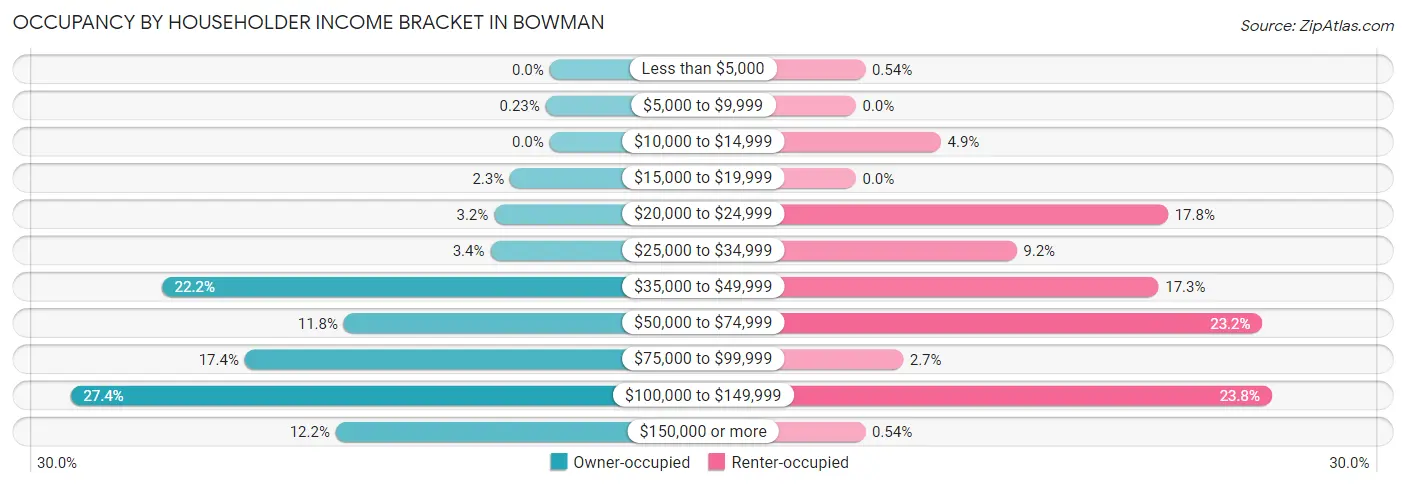
| Income Bracket | Owner-occupied | Renter-occupied |
| Less than $5,000 | 0 (0.0%) | 1 (0.5%) |
| $5,000 to $9,999 | 1 (0.2%) | 0 (0.0%) |
| $10,000 to $14,999 | 0 (0.0%) | 9 (4.9%) |
| $15,000 to $19,999 | 10 (2.3%) | 0 (0.0%) |
| $20,000 to $24,999 | 14 (3.2%) | 33 (17.8%) |
| $25,000 to $34,999 | 15 (3.4%) | 17 (9.2%) |
| $35,000 to $49,999 | 98 (22.2%) | 32 (17.3%) |
| $50,000 to $74,999 | 52 (11.8%) | 43 (23.2%) |
| $75,000 to $99,999 | 77 (17.4%) | 5 (2.7%) |
| $100,000 to $149,999 | 121 (27.4%) | 44 (23.8%) |
| $150,000 or more | 54 (12.2%) | 1 (0.5%) |
| Total | 442 (100.0%) | 185 (100.0%) |
Monthly Housing Cost Tiers in Bowman
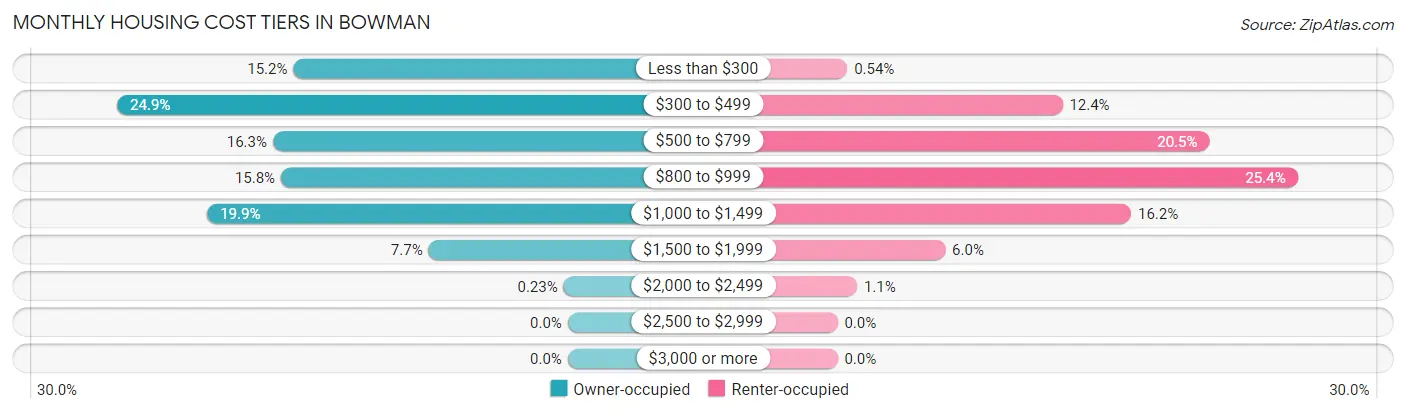
| Monthly Cost | Owner-occupied | Renter-occupied |
| Less than $300 | 67 (15.2%) | 1 (0.5%) |
| $300 to $499 | 110 (24.9%) | 23 (12.4%) |
| $500 to $799 | 72 (16.3%) | 38 (20.5%) |
| $800 to $999 | 70 (15.8%) | 47 (25.4%) |
| $1,000 to $1,499 | 88 (19.9%) | 30 (16.2%) |
| $1,500 to $1,999 | 34 (7.7%) | 11 (5.9%) |
| $2,000 to $2,499 | 1 (0.2%) | 2 (1.1%) |
| $2,500 to $2,999 | 0 (0.0%) | 0 (0.0%) |
| $3,000 or more | 0 (0.0%) | 0 (0.0%) |
| Total | 442 (100.0%) | 185 (100.0%) |
Physical Housing Characteristics in Bowman
Housing Structures in Bowman
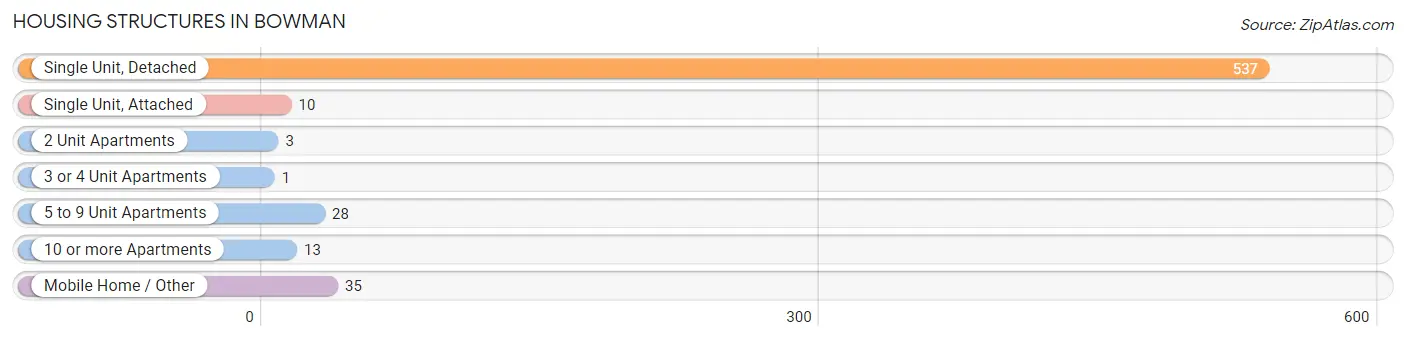
| Structure Type | # Housing Units | % Housing Units |
| Single Unit, Detached | 537 | 85.7% |
| Single Unit, Attached | 10 | 1.6% |
| 2 Unit Apartments | 3 | 0.5% |
| 3 or 4 Unit Apartments | 1 | 0.2% |
| 5 to 9 Unit Apartments | 28 | 4.5% |
| 10 or more Apartments | 13 | 2.1% |
| Mobile Home / Other | 35 | 5.6% |
| Total | 627 | 100.0% |
Housing Structures by Occupancy in Bowman
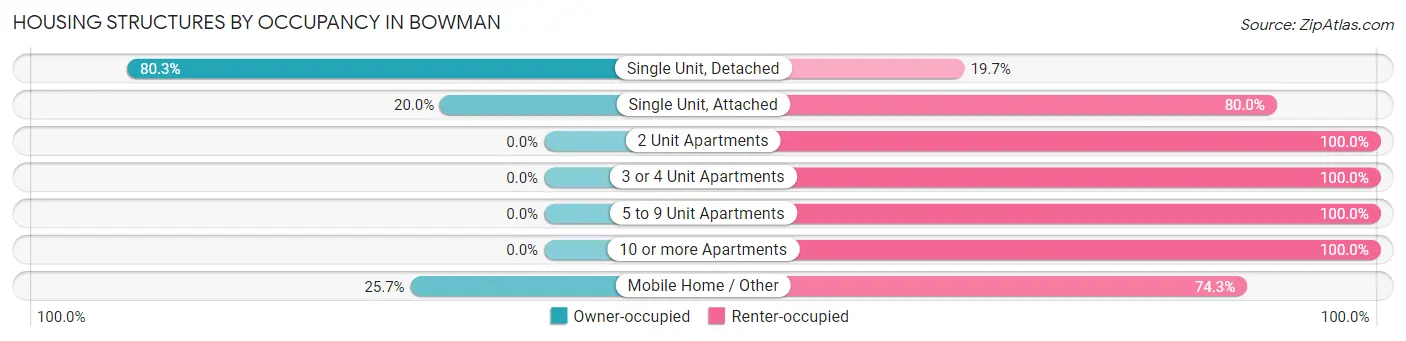
| Structure Type | Owner-occupied | Renter-occupied |
| Single Unit, Detached | 431 (80.3%) | 106 (19.7%) |
| Single Unit, Attached | 2 (20.0%) | 8 (80.0%) |
| 2 Unit Apartments | 0 (0.0%) | 3 (100.0%) |
| 3 or 4 Unit Apartments | 0 (0.0%) | 1 (100.0%) |
| 5 to 9 Unit Apartments | 0 (0.0%) | 28 (100.0%) |
| 10 or more Apartments | 0 (0.0%) | 13 (100.0%) |
| Mobile Home / Other | 9 (25.7%) | 26 (74.3%) |
| Total | 442 (70.5%) | 185 (29.5%) |
Housing Structures by Number of Rooms in Bowman
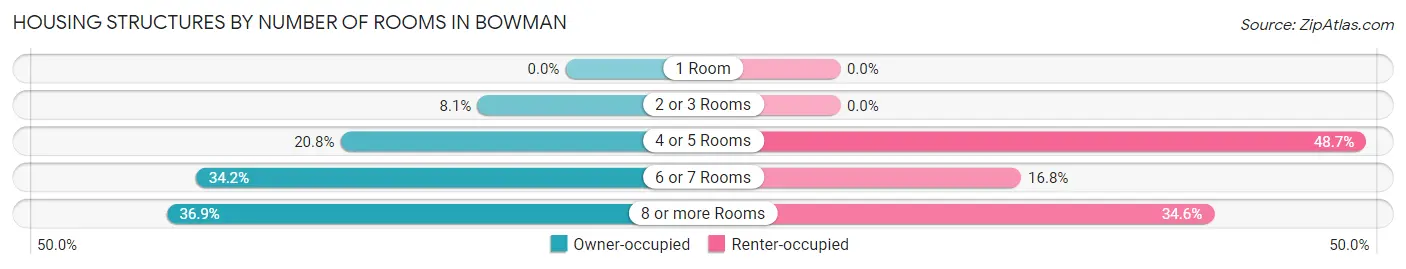
| Number of Rooms | Owner-occupied | Renter-occupied |
| 1 Room | 0 (0.0%) | 0 (0.0%) |
| 2 or 3 Rooms | 36 (8.1%) | 0 (0.0%) |
| 4 or 5 Rooms | 92 (20.8%) | 90 (48.6%) |
| 6 or 7 Rooms | 151 (34.2%) | 31 (16.8%) |
| 8 or more Rooms | 163 (36.9%) | 64 (34.6%) |
| Total | 442 (100.0%) | 185 (100.0%) |
Housing Structure by Heating Type in Bowman
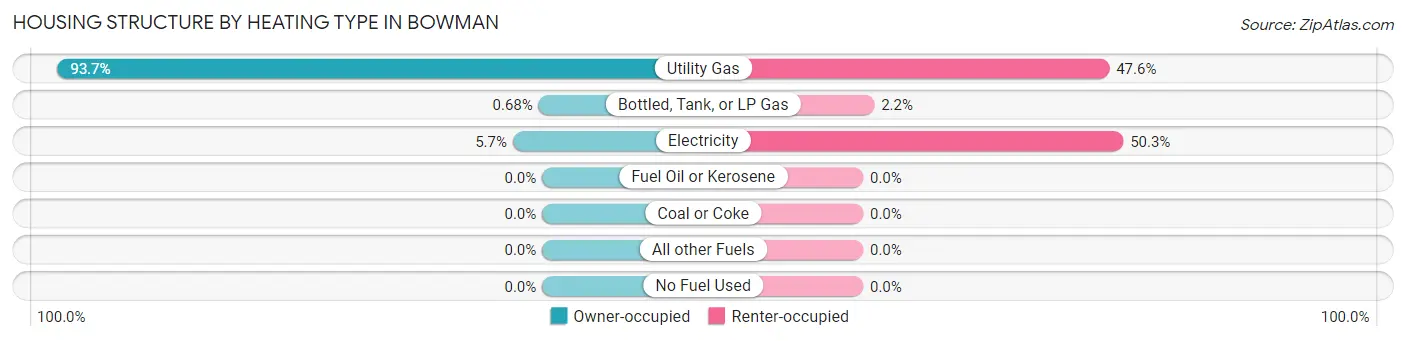
| Heating Type | Owner-occupied | Renter-occupied |
| Utility Gas | 414 (93.7%) | 88 (47.6%) |
| Bottled, Tank, or LP Gas | 3 (0.7%) | 4 (2.2%) |
| Electricity | 25 (5.7%) | 93 (50.3%) |
| Fuel Oil or Kerosene | 0 (0.0%) | 0 (0.0%) |
| Coal or Coke | 0 (0.0%) | 0 (0.0%) |
| All other Fuels | 0 (0.0%) | 0 (0.0%) |
| No Fuel Used | 0 (0.0%) | 0 (0.0%) |
| Total | 442 (100.0%) | 185 (100.0%) |
Household Vehicle Usage in Bowman
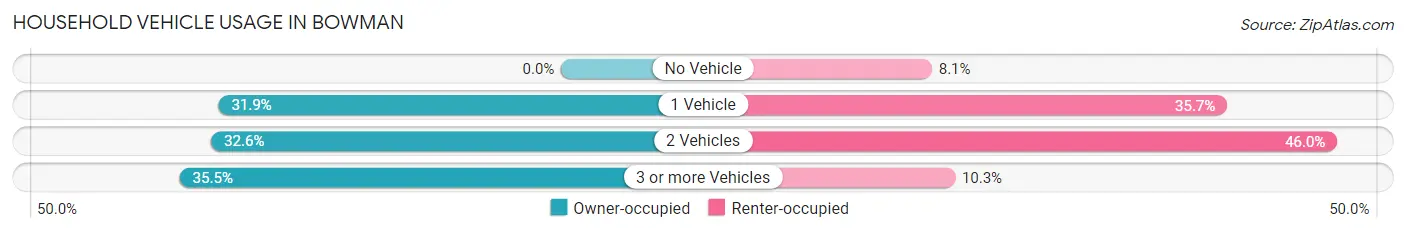
| Vehicles per Household | Owner-occupied | Renter-occupied |
| No Vehicle | 0 (0.0%) | 15 (8.1%) |
| 1 Vehicle | 141 (31.9%) | 66 (35.7%) |
| 2 Vehicles | 144 (32.6%) | 85 (46.0%) |
| 3 or more Vehicles | 157 (35.5%) | 19 (10.3%) |
| Total | 442 (100.0%) | 185 (100.0%) |
Real Estate & Mortgages in Bowman
Real Estate and Mortgage Overview in Bowman
| Characteristic | Without Mortgage | With Mortgage |
| Housing Units | 255 | 187 |
| Median Property Value | $181,000 | $170,400 |
| Median Household Income | $85,568 | $19 |
| Monthly Housing Costs | $418 | $0 |
| Real Estate Taxes | $1,597 | $13 |
Property Value by Mortgage Status in Bowman
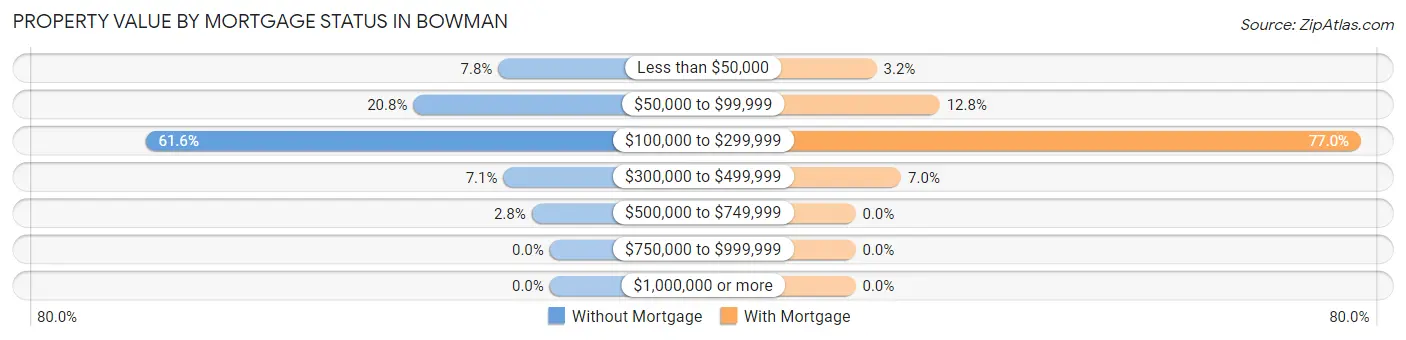
| Property Value | Without Mortgage | With Mortgage |
| Less than $50,000 | 20 (7.8%) | 6 (3.2%) |
| $50,000 to $99,999 | 53 (20.8%) | 24 (12.8%) |
| $100,000 to $299,999 | 157 (61.6%) | 144 (77.0%) |
| $300,000 to $499,999 | 18 (7.1%) | 13 (7.0%) |
| $500,000 to $749,999 | 7 (2.8%) | 0 (0.0%) |
| $750,000 to $999,999 | 0 (0.0%) | 0 (0.0%) |
| $1,000,000 or more | 0 (0.0%) | 0 (0.0%) |
| Total | 255 (100.0%) | 187 (100.0%) |
Household Income by Mortgage Status in Bowman
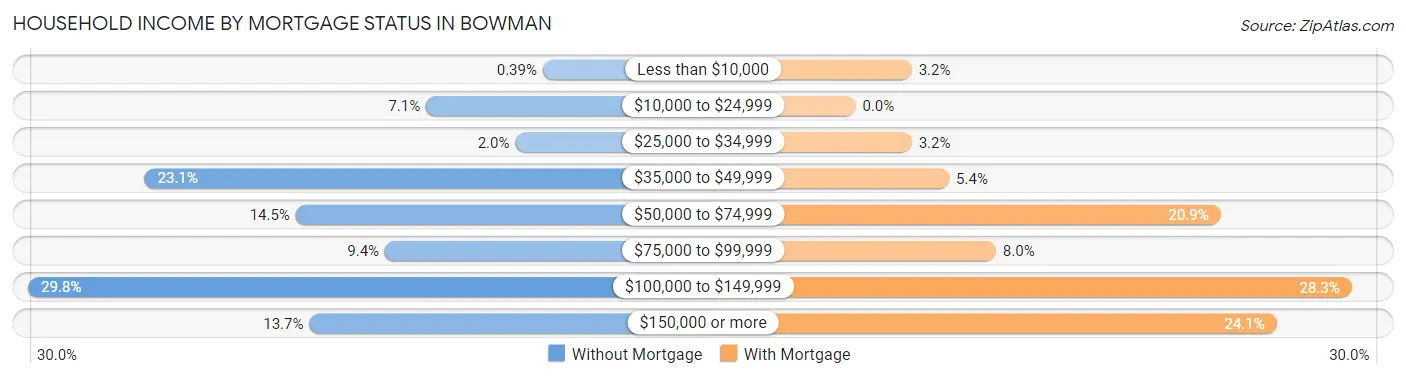
| Household Income | Without Mortgage | With Mortgage |
| Less than $10,000 | 1 (0.4%) | 6 (3.2%) |
| $10,000 to $24,999 | 18 (7.1%) | 0 (0.0%) |
| $25,000 to $34,999 | 5 (2.0%) | 6 (3.2%) |
| $35,000 to $49,999 | 59 (23.1%) | 10 (5.3%) |
| $50,000 to $74,999 | 37 (14.5%) | 39 (20.9%) |
| $75,000 to $99,999 | 24 (9.4%) | 15 (8.0%) |
| $100,000 to $149,999 | 76 (29.8%) | 53 (28.3%) |
| $150,000 or more | 35 (13.7%) | 45 (24.1%) |
| Total | 255 (100.0%) | 187 (100.0%) |
Property Value to Household Income Ratio in Bowman
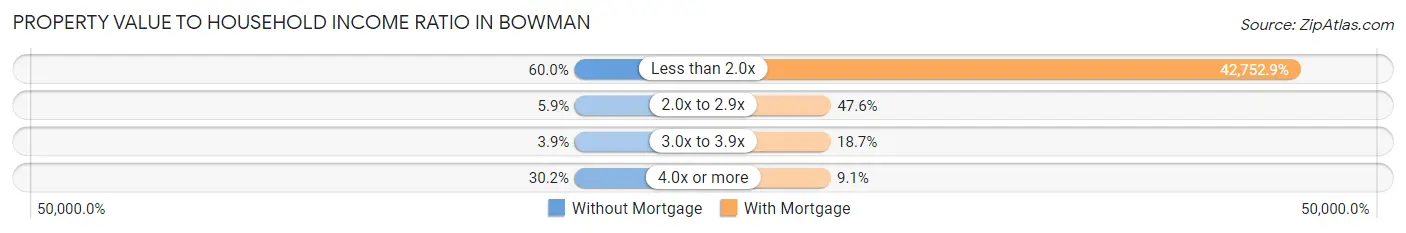
| Value-to-Income Ratio | Without Mortgage | With Mortgage |
| Less than 2.0x | 153 (60.0%) | 79,948 (42,752.9%) |
| 2.0x to 2.9x | 15 (5.9%) | 89 (47.6%) |
| 3.0x to 3.9x | 10 (3.9%) | 35 (18.7%) |
| 4.0x or more | 77 (30.2%) | 17 (9.1%) |
| Total | 255 (100.0%) | 187 (100.0%) |
Real Estate Taxes by Mortgage Status in Bowman
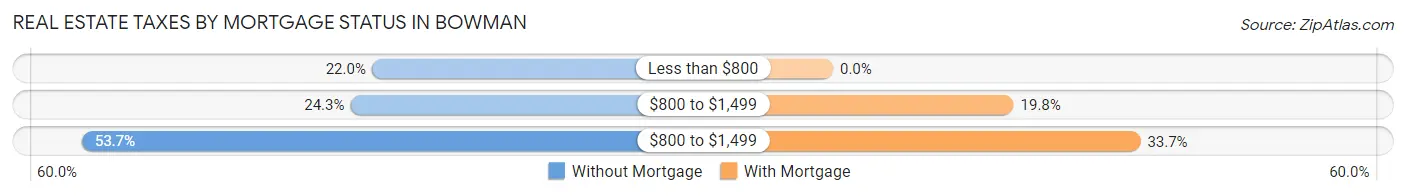
| Property Taxes | Without Mortgage | With Mortgage |
| Less than $800 | 56 (22.0%) | 0 (0.0%) |
| $800 to $1,499 | 62 (24.3%) | 37 (19.8%) |
| $800 to $1,499 | 137 (53.7%) | 63 (33.7%) |
| Total | 255 (100.0%) | 187 (100.0%) |
Health & Disability in Bowman
Health Insurance Coverage by Age in Bowman
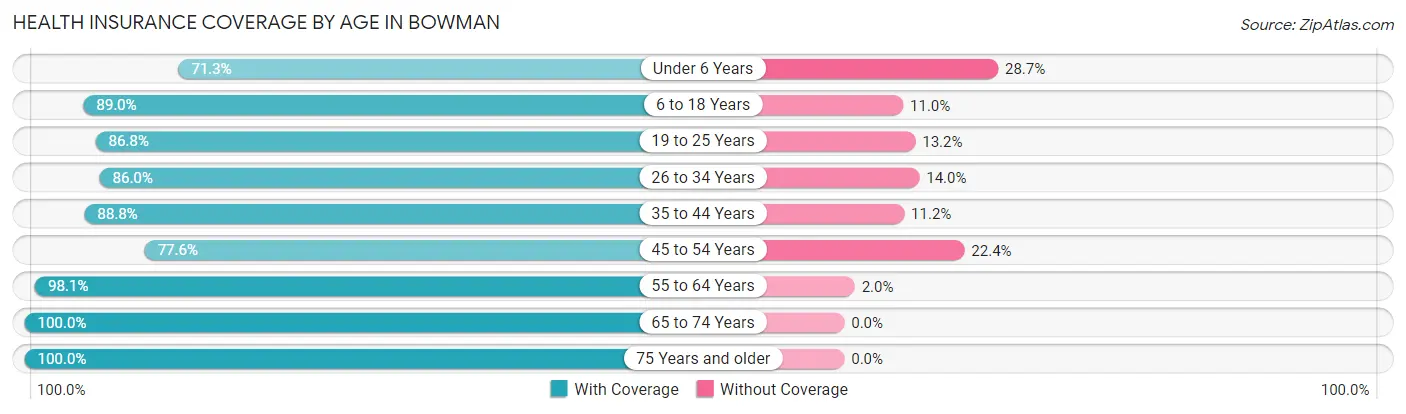
| Age Bracket | With Coverage | Without Coverage |
| Under 6 Years | 107 (71.3%) | 43 (28.7%) |
| 6 to 18 Years | 276 (89.0%) | 34 (11.0%) |
| 19 to 25 Years | 118 (86.8%) | 18 (13.2%) |
| 26 to 34 Years | 123 (86.0%) | 20 (14.0%) |
| 35 to 44 Years | 215 (88.8%) | 27 (11.2%) |
| 45 to 54 Years | 142 (77.6%) | 41 (22.4%) |
| 55 to 64 Years | 151 (98.1%) | 3 (1.9%) |
| 65 to 74 Years | 126 (100.0%) | 0 (0.0%) |
| 75 Years and older | 131 (100.0%) | 0 (0.0%) |
| Total | 1,389 (88.2%) | 186 (11.8%) |
Health Insurance Coverage by Citizenship Status in Bowman
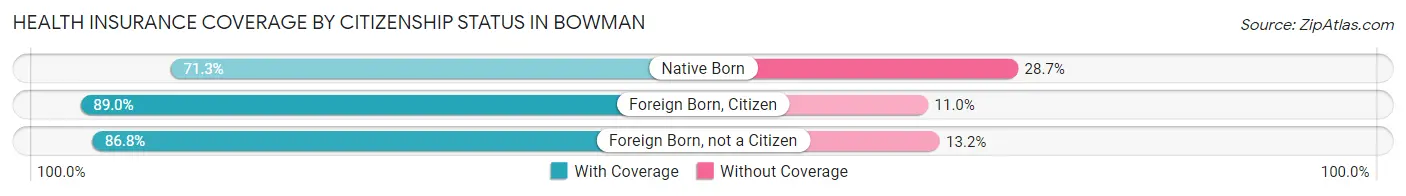
| Citizenship Status | With Coverage | Without Coverage |
| Native Born | 107 (71.3%) | 43 (28.7%) |
| Foreign Born, Citizen | 276 (89.0%) | 34 (11.0%) |
| Foreign Born, not a Citizen | 118 (86.8%) | 18 (13.2%) |
Health Insurance Coverage by Household Income in Bowman
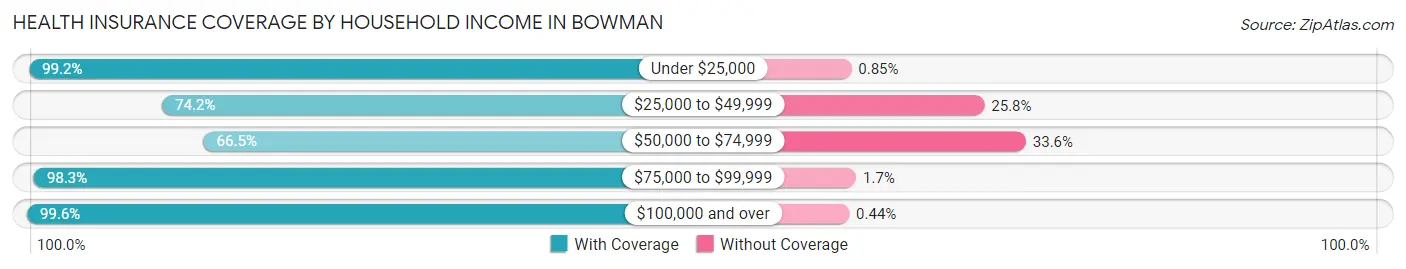
| Household Income | With Coverage | Without Coverage |
| Under $25,000 | 116 (99.2%) | 1 (0.9%) |
| $25,000 to $49,999 | 216 (74.2%) | 75 (25.8%) |
| $50,000 to $74,999 | 206 (66.4%) | 104 (33.6%) |
| $75,000 to $99,999 | 169 (98.3%) | 3 (1.7%) |
| $100,000 and over | 675 (99.6%) | 3 (0.4%) |
Public vs Private Health Insurance Coverage by Age in Bowman
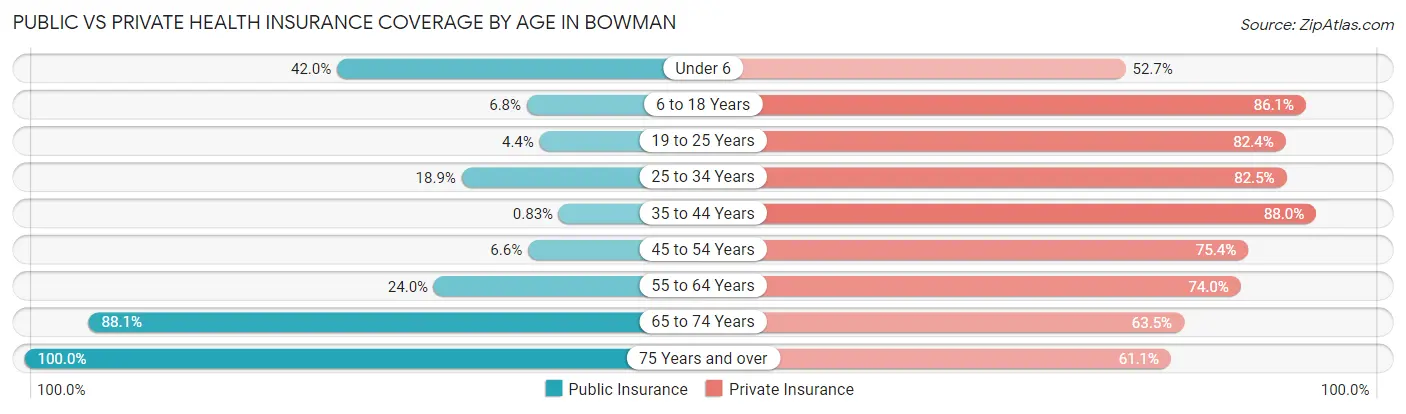
| Age Bracket | Public Insurance | Private Insurance |
| Under 6 | 63 (42.0%) | 79 (52.7%) |
| 6 to 18 Years | 21 (6.8%) | 267 (86.1%) |
| 19 to 25 Years | 6 (4.4%) | 112 (82.4%) |
| 25 to 34 Years | 27 (18.9%) | 118 (82.5%) |
| 35 to 44 Years | 2 (0.8%) | 213 (88.0%) |
| 45 to 54 Years | 12 (6.6%) | 138 (75.4%) |
| 55 to 64 Years | 37 (24.0%) | 114 (74.0%) |
| 65 to 74 Years | 111 (88.1%) | 80 (63.5%) |
| 75 Years and over | 131 (100.0%) | 80 (61.1%) |
| Total | 410 (26.0%) | 1,201 (76.2%) |
Disability Status by Sex by Age in Bowman
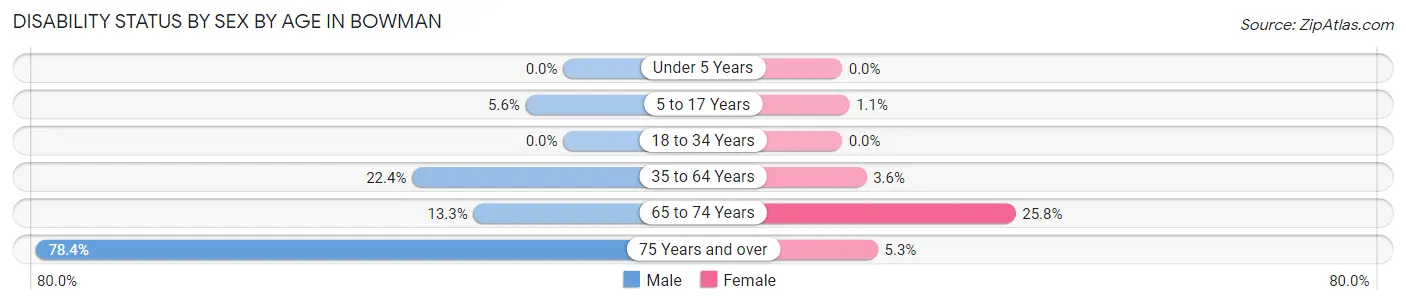
| Age Bracket | Male | Female |
| Under 5 Years | 0 (0.0%) | 0 (0.0%) |
| 5 to 17 Years | 8 (5.6%) | 2 (1.1%) |
| 18 to 34 Years | 0 (0.0%) | 0 (0.0%) |
| 35 to 64 Years | 68 (22.4%) | 10 (3.6%) |
| 65 to 74 Years | 8 (13.3%) | 17 (25.8%) |
| 75 Years and over | 29 (78.4%) | 5 (5.3%) |
Disability Class by Sex by Age in Bowman
Disability Class: Hearing Difficulty
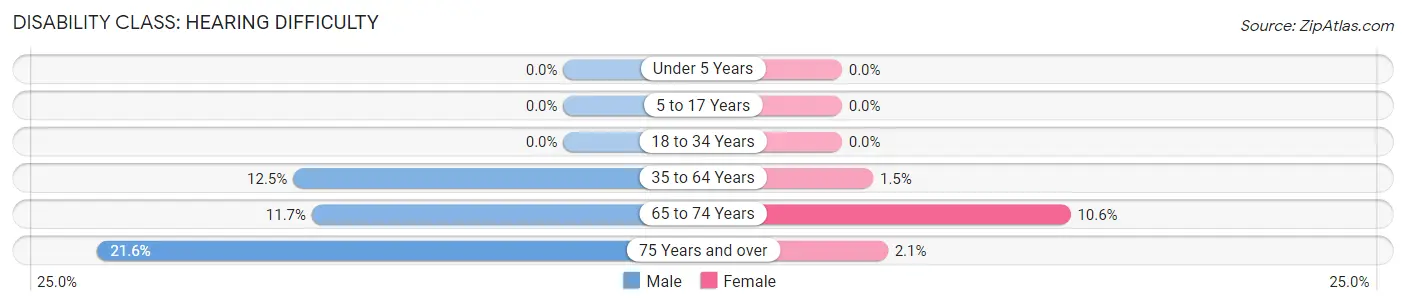
| Age Bracket | Male | Female |
| Under 5 Years | 0 (0.0%) | 0 (0.0%) |
| 5 to 17 Years | 0 (0.0%) | 0 (0.0%) |
| 18 to 34 Years | 0 (0.0%) | 0 (0.0%) |
| 35 to 64 Years | 38 (12.5%) | 4 (1.5%) |
| 65 to 74 Years | 7 (11.7%) | 7 (10.6%) |
| 75 Years and over | 8 (21.6%) | 2 (2.1%) |
Disability Class: Vision Difficulty
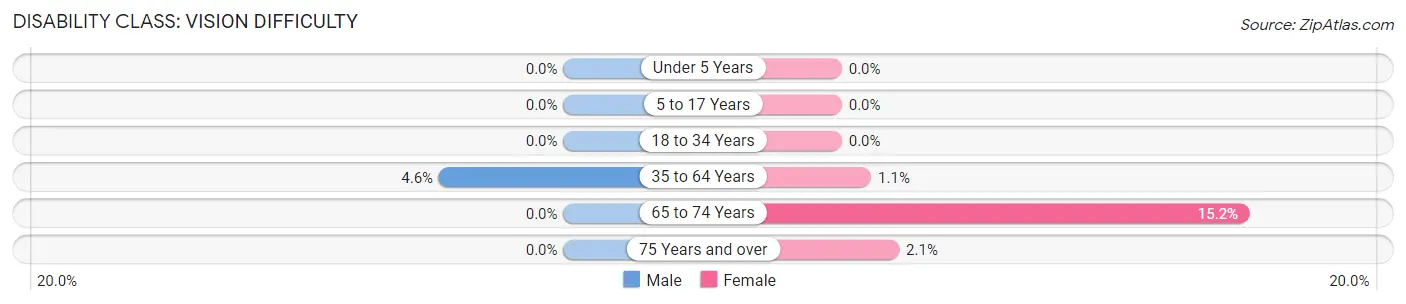
| Age Bracket | Male | Female |
| Under 5 Years | 0 (0.0%) | 0 (0.0%) |
| 5 to 17 Years | 0 (0.0%) | 0 (0.0%) |
| 18 to 34 Years | 0 (0.0%) | 0 (0.0%) |
| 35 to 64 Years | 14 (4.6%) | 3 (1.1%) |
| 65 to 74 Years | 0 (0.0%) | 10 (15.1%) |
| 75 Years and over | 0 (0.0%) | 2 (2.1%) |
Disability Class: Cognitive Difficulty
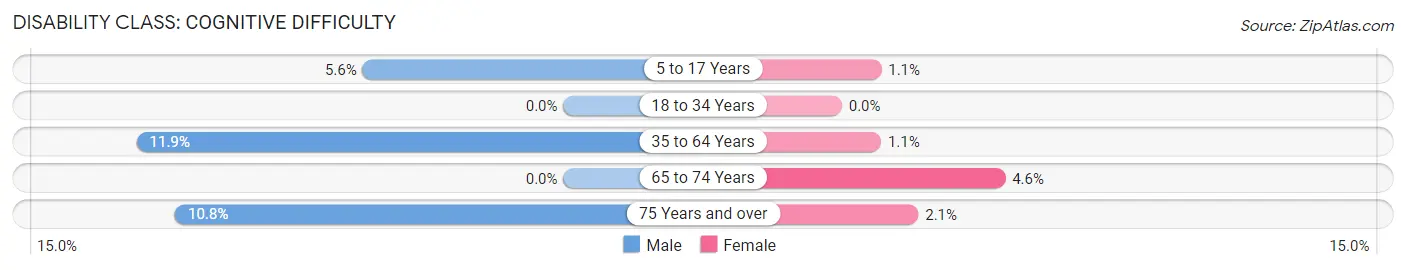
| Age Bracket | Male | Female |
| 5 to 17 Years | 8 (5.6%) | 2 (1.1%) |
| 18 to 34 Years | 0 (0.0%) | 0 (0.0%) |
| 35 to 64 Years | 36 (11.9%) | 3 (1.1%) |
| 65 to 74 Years | 0 (0.0%) | 3 (4.5%) |
| 75 Years and over | 4 (10.8%) | 2 (2.1%) |
Disability Class: Ambulatory Difficulty
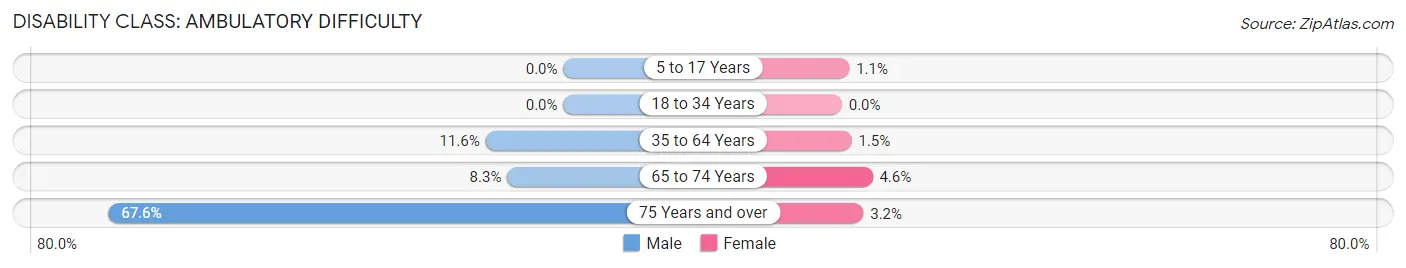
| Age Bracket | Male | Female |
| 5 to 17 Years | 0 (0.0%) | 2 (1.1%) |
| 18 to 34 Years | 0 (0.0%) | 0 (0.0%) |
| 35 to 64 Years | 35 (11.6%) | 4 (1.5%) |
| 65 to 74 Years | 5 (8.3%) | 3 (4.5%) |
| 75 Years and over | 25 (67.6%) | 3 (3.2%) |
Disability Class: Self-Care Difficulty
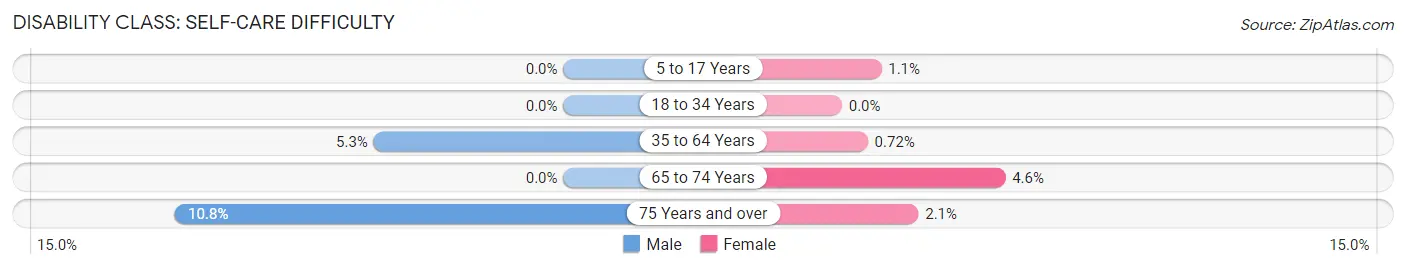
| Age Bracket | Male | Female |
| 5 to 17 Years | 0 (0.0%) | 2 (1.1%) |
| 18 to 34 Years | 0 (0.0%) | 0 (0.0%) |
| 35 to 64 Years | 16 (5.3%) | 2 (0.7%) |
| 65 to 74 Years | 0 (0.0%) | 3 (4.5%) |
| 75 Years and over | 4 (10.8%) | 2 (2.1%) |
Technology Access in Bowman
Computing Device Access in Bowman
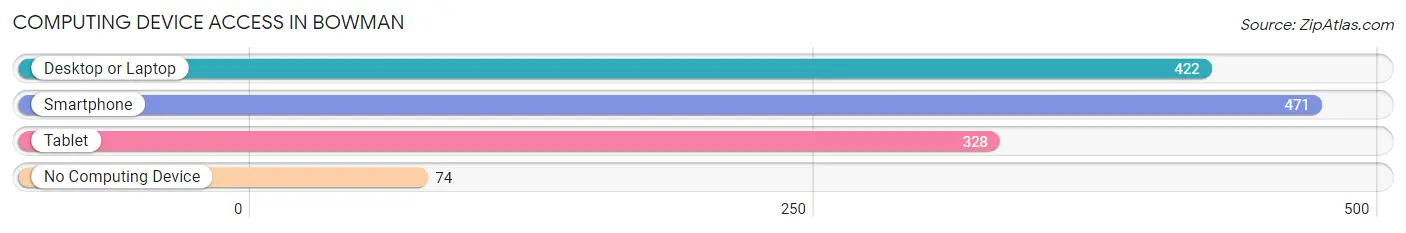
| Device Type | # Households | % Households |
| Desktop or Laptop | 422 | 67.3% |
| Smartphone | 471 | 75.1% |
| Tablet | 328 | 52.3% |
| No Computing Device | 74 | 11.8% |
| Total | 627 | 100.0% |
Internet Access in Bowman
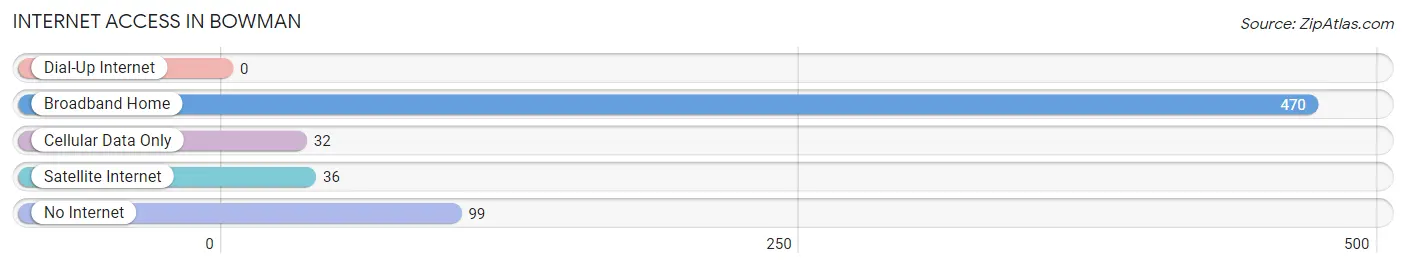
| Internet Type | # Households | % Households |
| Dial-Up Internet | 0 | 0.0% |
| Broadband Home | 470 | 75.0% |
| Cellular Data Only | 32 | 5.1% |
| Satellite Internet | 36 | 5.7% |
| No Internet | 99 | 15.8% |
| Total | 627 | 100.0% |
Bowman Summary
The small town of Bowman, North Dakota is located in the southwestern corner of the state, in Bowman County. It is the county seat and the largest town in the county, with a population of 1,396 as of the 2010 census. The town was founded in 1883 and named after George Bowman, a local rancher.
Geography
Bowman is located in the southwestern corner of North Dakota, in Bowman County. It is situated at the intersection of US Highway 12 and North Dakota Highway 85. The town is located in the Little Missouri Badlands, a region of rugged terrain and rolling hills. The Little Missouri River flows through the town, and the surrounding area is mostly grassland and prairie.
Economy
The economy of Bowman is largely based on agriculture and ranching. The town is home to several large ranches, and the surrounding area is used for cattle and sheep grazing. The town also has a small manufacturing sector, with several small businesses producing a variety of goods.
The town is also home to several oil and gas wells, and the surrounding area is rich in oil and gas reserves. The oil and gas industry is a major employer in the town, and the town is home to several oil and gas related businesses.
Demographics
As of the 2010 census, the population of Bowman was 1,396. The racial makeup of the town was 97.2% White, 0.3% African American, 0.3% Native American, 0.2% Asian, 0.1% Pacific Islander, 0.7% from other races, and 1.2% from two or more races. Hispanic or Latino of any race were 1.7% of the population.
The median income for a household in the town was $41,250, and the median income for a family was $50,000. The per capita income for the town was $20,845. About 11.2% of families and 14.2% of the population were below the poverty line, including 17.2% of those under age 18 and 8.3% of those age 65 or over.
History
Bowman was founded in 1883 and named after George Bowman, a local rancher. The town was originally a small settlement, but it quickly grew as the surrounding area was opened up for homesteading. The town was incorporated in 1887, and the first post office was established in 1888.
The town was an important stop on the Great Northern Railway, and it quickly became a major shipping center for the surrounding area. The town was also home to several large ranches, and the surrounding area was used for cattle and sheep grazing.
In the early 20th century, the town was a major center for oil and gas exploration. Several large oil and gas wells were drilled in the area, and the town was home to several oil and gas related businesses.
The town has remained relatively unchanged since the early 20th century, and it is still a small, rural community. The town is home to several small businesses, and the surrounding area is still used for cattle and sheep grazing. The town is also home to several oil and gas wells, and the oil and gas industry is still a major employer in the town.
Common Questions
What is Per Capita Income in Bowman?
Per Capita income in Bowman is $34,834.
What is the Median Family Income in Bowman?
Median Family Income in Bowman is $95,556.
What is the Median Household income in Bowman?
Median Household Income in Bowman is $73,309.
What is Income or Wage Gap in Bowman?
Income or Wage Gap in Bowman is 38.9%.
Women in Bowman earn 61.1 cents for every dollar earned by a man.
What is Inequality or Gini Index in Bowman?
Inequality or Gini Index in Bowman is 0.36.
What is the Total Population of Bowman?
Total Population of Bowman is 1,646.
What is the Total Male Population of Bowman?
Total Male Population of Bowman is 798.
What is the Total Female Population of Bowman?
Total Female Population of Bowman is 848.
What is the Ratio of Males per 100 Females in Bowman?
There are 94.10 Males per 100 Females in Bowman.
What is the Ratio of Females per 100 Males in Bowman?
There are 106.27 Females per 100 Males in Bowman.
What is the Median Population Age in Bowman?
Median Population Age in Bowman is 38.5 Years.
What is the Average Family Size in Bowman
Average Family Size in Bowman is 3.4 People.
What is the Average Household Size in Bowman
Average Household Size in Bowman is 2.5 People.
How Large is the Labor Force in Bowman?
There are 866 People in the Labor Forcein in Bowman.
What is the Percentage of People in the Labor Force in Bowman?
69.7% of People are in the Labor Force in Bowman.
What is the Unemployment Rate in Bowman?
Unemployment Rate in Bowman is 4.4%.