Beach, ND Map & Demographics
Beach Map
Beach Overview
$34,875
PER CAPITA INCOME
$102,167
AVG FAMILY INCOME
$71,500
AVG HOUSEHOLD INCOME
45.8%
WAGE / INCOME GAP [ % ]
54.2¢/ $1
WAGE / INCOME GAP [ $ ]
0.37
INEQUALITY / GINI INDEX
957
TOTAL POPULATION
473
MALE POPULATION
484
FEMALE POPULATION
97.73
MALES / 100 FEMALES
102.33
FEMALES / 100 MALES
36.8
MEDIAN AGE
2.9
AVG FAMILY SIZE
2.5
AVG HOUSEHOLD SIZE
487
LABOR FORCE [ PEOPLE ]
66.6%
PERCENT IN LABOR FORCE
8.8%
UNEMPLOYMENT RATE
Beach Zip Codes
Beach Area Codes
Income in Beach
Income Overview in Beach
Per Capita Income in Beach is $34,875, while median incomes of families and households are $102,167 and $71,500 respectively.
| Characteristic | Number | Measure |
| Per Capita Income | 957 | $34,875 |
| Median Family Income | 262 | $102,167 |
| Mean Family Income | 262 | $108,616 |
| Median Household Income | 372 | $71,500 |
| Mean Household Income | 372 | $90,569 |
| Income Deficit | 262 | $0 |
| Wage / Income Gap (%) | 957 | 45.84% |
| Wage / Income Gap ($) | 957 | 54.16¢ per $1 |
| Gini / Inequality Index | 957 | 0.37 |
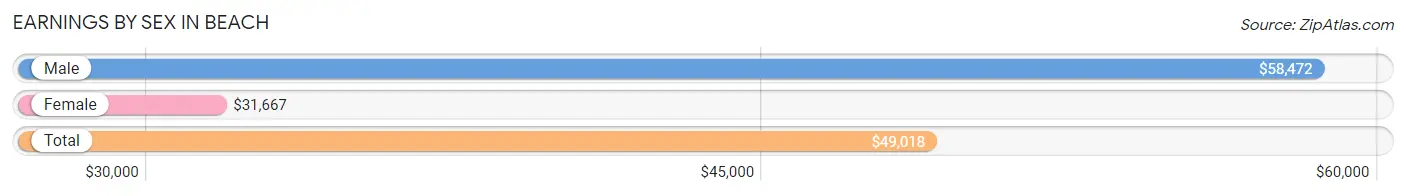
Earnings by Sex in Beach
Average Earnings in Beach are $49,018, $58,472 for men and $31,667 for women, a difference of 45.8%.
| Sex | Number | Average Earnings |
| Male | 263 (50.3%) | $58,472 |
| Female | 260 (49.7%) | $31,667 |
| Total | 523 (100.0%) | $49,018 |
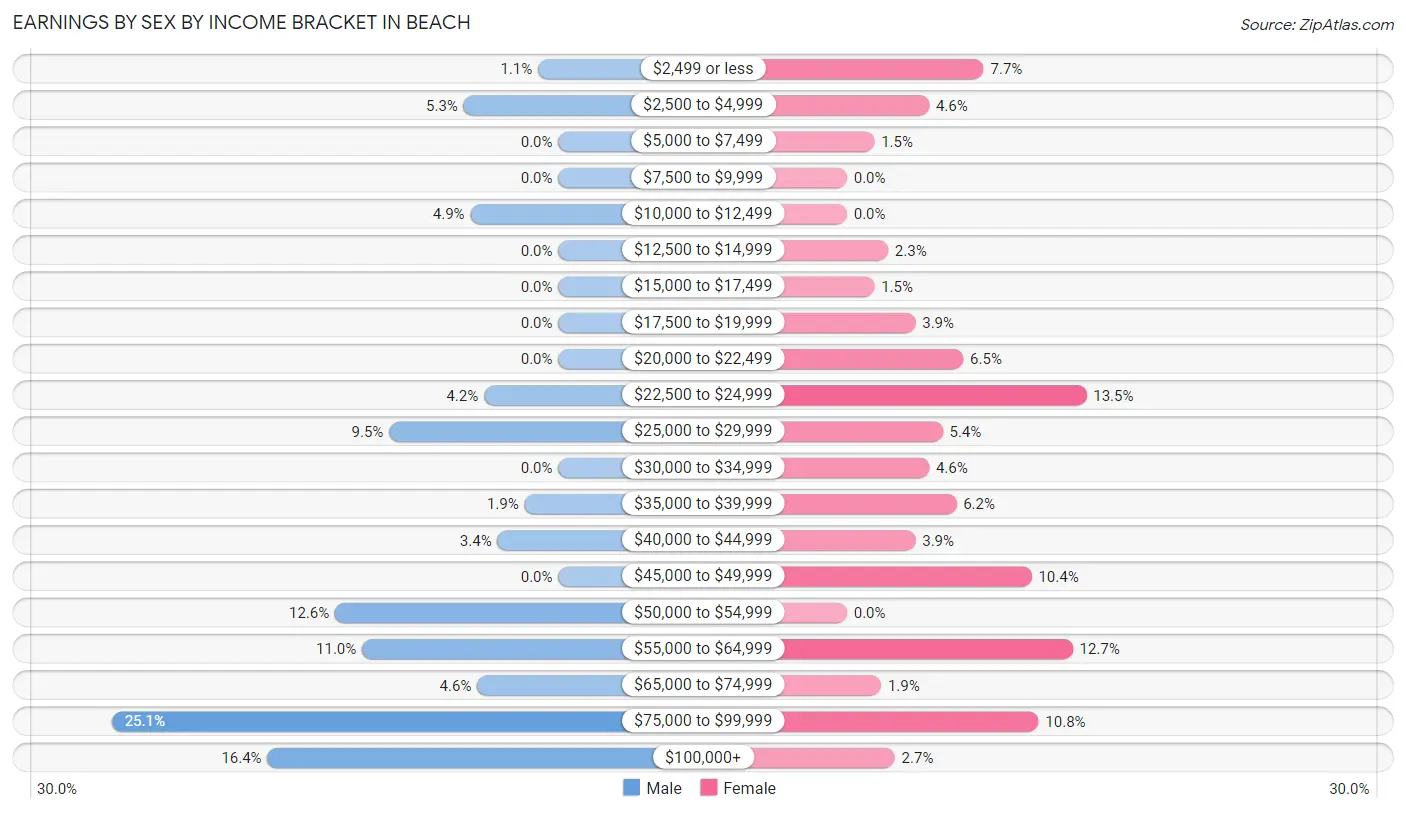
Earnings by Sex by Income Bracket in Beach
The most common earnings brackets in Beach are $75,000 to $99,999 for men (66 | 25.1%) and $22,500 to $24,999 for women (35 | 13.5%).
| Income | Male | Female |
| $2,499 or less | 3 (1.1%) | 20 (7.7%) |
| $2,500 to $4,999 | 14 (5.3%) | 12 (4.6%) |
| $5,000 to $7,499 | 0 (0.0%) | 4 (1.5%) |
| $7,500 to $9,999 | 0 (0.0%) | 0 (0.0%) |
| $10,000 to $12,499 | 13 (4.9%) | 0 (0.0%) |
| $12,500 to $14,999 | 0 (0.0%) | 6 (2.3%) |
| $15,000 to $17,499 | 0 (0.0%) | 4 (1.5%) |
| $17,500 to $19,999 | 0 (0.0%) | 10 (3.8%) |
| $20,000 to $22,499 | 0 (0.0%) | 17 (6.5%) |
| $22,500 to $24,999 | 11 (4.2%) | 35 (13.5%) |
| $25,000 to $29,999 | 25 (9.5%) | 14 (5.4%) |
| $30,000 to $34,999 | 0 (0.0%) | 12 (4.6%) |
| $35,000 to $39,999 | 5 (1.9%) | 16 (6.1%) |
| $40,000 to $44,999 | 9 (3.4%) | 10 (3.8%) |
| $45,000 to $49,999 | 0 (0.0%) | 27 (10.4%) |
| $50,000 to $54,999 | 33 (12.6%) | 0 (0.0%) |
| $55,000 to $64,999 | 29 (11.0%) | 33 (12.7%) |
| $65,000 to $74,999 | 12 (4.6%) | 5 (1.9%) |
| $75,000 to $99,999 | 66 (25.1%) | 28 (10.8%) |
| $100,000+ | 43 (16.4%) | 7 (2.7%) |
| Total | 263 (100.0%) | 260 (100.0%) |
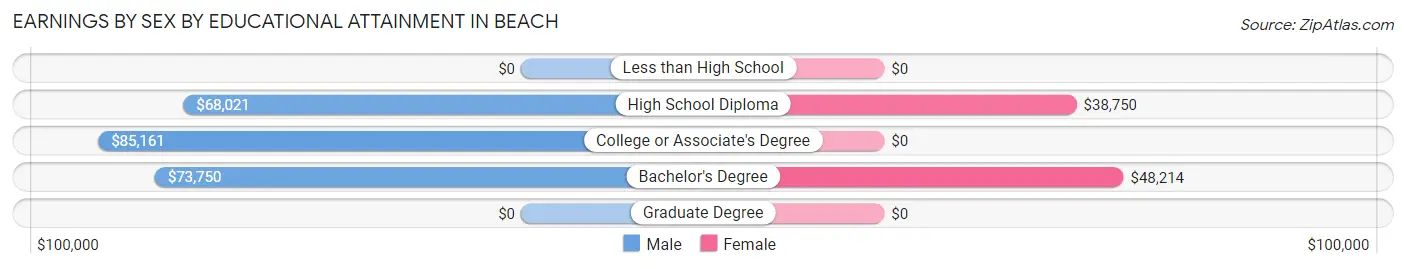
Earnings by Sex by Educational Attainment in Beach
Average earnings in Beach are $59,722 for men and $38,654 for women, a difference of 35.3%. Men with an educational attainment of college or associate's degree enjoy the highest average annual earnings of $85,161, while those with high school diploma education earn the least with $68,021. Women with an educational attainment of bachelor's degree earn the most with the average annual earnings of $48,214, while those with high school diploma education have the smallest earnings of $38,750.
| Educational Attainment | Male Income | Female Income |
| Less than High School | - | - |
| High School Diploma | $68,021 | $38,750 |
| College or Associate's Degree | $85,161 | $0 |
| Bachelor's Degree | $73,750 | $48,214 |
| Graduate Degree | - | - |
| Total | $59,722 | $38,654 |
Family Income in Beach
Family Income Brackets in Beach
According to the Beach family income data, there are 92 families falling into the $100,000 to $149,999 income range, which is the most common income bracket and makes up 35.1% of all families.
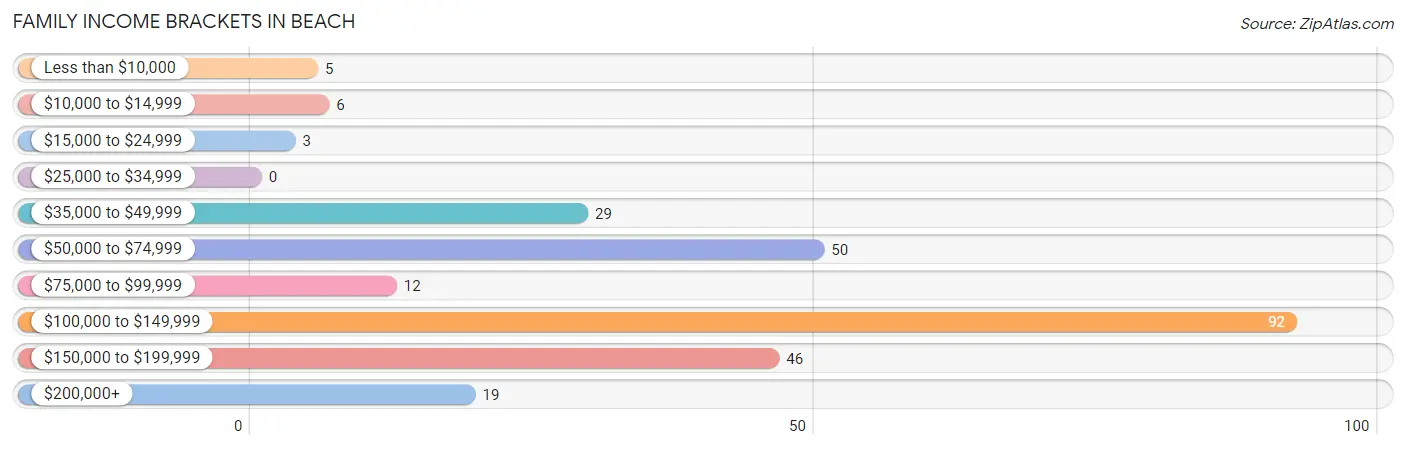
| Income Bracket | # Families | % Families |
| Less than $10,000 | 5 | 1.9% |
| $10,000 to $14,999 | 6 | 2.3% |
| $15,000 to $24,999 | 3 | 1.1% |
| $25,000 to $34,999 | 0 | 0.0% |
| $35,000 to $49,999 | 29 | 11.1% |
| $50,000 to $74,999 | 50 | 19.1% |
| $75,000 to $99,999 | 12 | 4.6% |
| $100,000 to $149,999 | 92 | 35.1% |
| $150,000 to $199,999 | 46 | 17.6% |
| $200,000+ | 19 | 7.3% |
Family Income by Famaliy Size in Beach
4-person families (24 | 9.2%) account for the highest median family income in Beach with $135,000 per family, while 2-person families (168 | 64.1%) have the highest median income of $56,607 per family member.
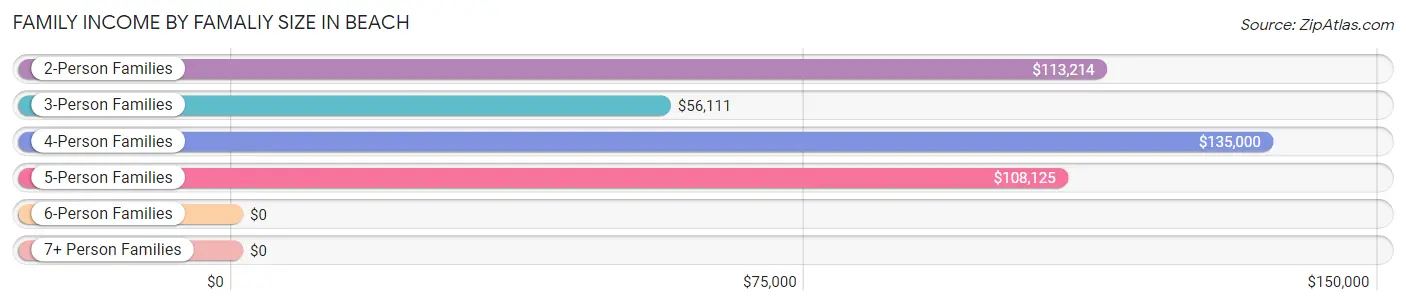
| Income Bracket | # Families | Median Income |
| 2-Person Families | 168 (64.1%) | $113,214 |
| 3-Person Families | 28 (10.7%) | $56,111 |
| 4-Person Families | 24 (9.2%) | $135,000 |
| 5-Person Families | 28 (10.7%) | $108,125 |
| 6-Person Families | 14 (5.3%) | $0 |
| 7+ Person Families | 0 (0.0%) | $0 |
| Total | 262 (100.0%) | $102,167 |
Family Income by Number of Earners in Beach
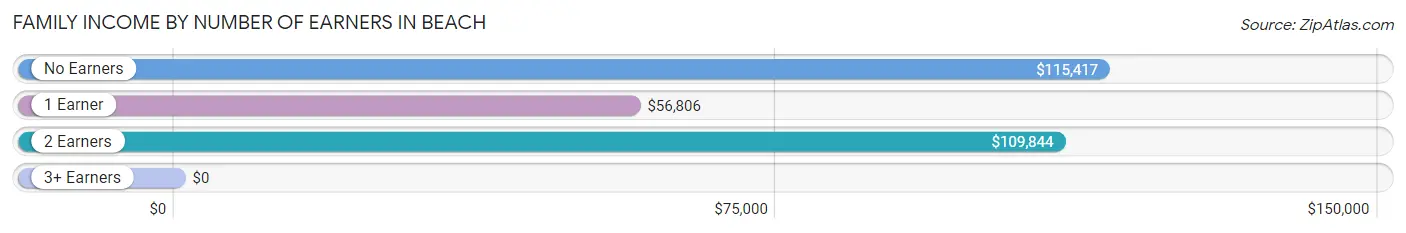
| Number of Earners | # Families | Median Income |
| No Earners | 15 (5.7%) | $115,417 |
| 1 Earner | 85 (32.4%) | $56,806 |
| 2 Earners | 151 (57.6%) | $109,844 |
| 3+ Earners | 11 (4.2%) | $0 |
| Total | 262 (100.0%) | $102,167 |
Household Income in Beach
Household Income Brackets in Beach
With 107 households falling in the category, the $100,000 to $149,999 income range is the most frequent in Beach, accounting for 28.8% of all households. In contrast, only 9 households (2.4%) fall into the $25,000 to $34,999 income bracket, making it the least populous group.
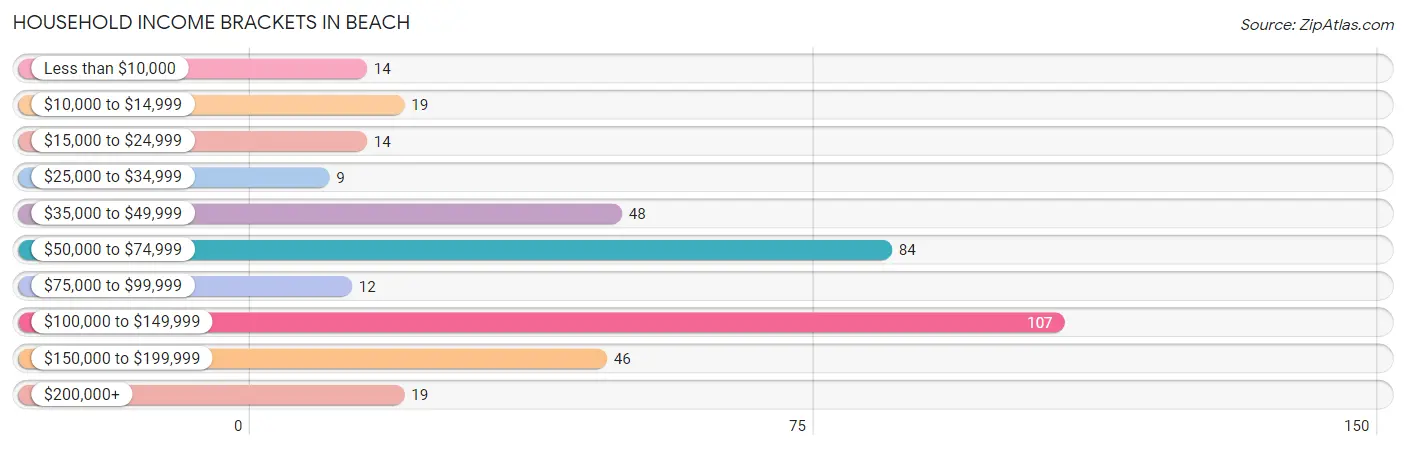
| Income Bracket | # Households | % Households |
| Less than $10,000 | 14 | 3.8% |
| $10,000 to $14,999 | 19 | 5.1% |
| $15,000 to $24,999 | 14 | 3.8% |
| $25,000 to $34,999 | 9 | 2.4% |
| $35,000 to $49,999 | 48 | 12.9% |
| $50,000 to $74,999 | 84 | 22.6% |
| $75,000 to $99,999 | 12 | 3.2% |
| $100,000 to $149,999 | 107 | 28.8% |
| $150,000 to $199,999 | 46 | 12.4% |
| $200,000+ | 19 | 5.1% |
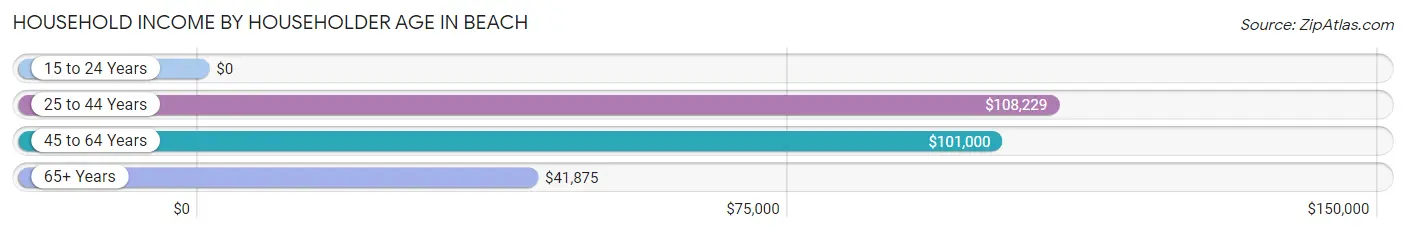
Household Income by Householder Age in Beach
The median household income in Beach is $71,500, with the highest median household income of $108,229 found in the 25 to 44 years age bracket for the primary householder. A total of 112 households (30.1%) fall into this category. Meanwhile, the 15 to 24 years age bracket for the primary householder has the lowest median household income of $0, with 5 households (1.3%) in this group.
| Income Bracket | # Households | Median Income |
| 15 to 24 Years | 5 (1.3%) | $0 |
| 25 to 44 Years | 112 (30.1%) | $108,229 |
| 45 to 64 Years | 144 (38.7%) | $101,000 |
| 65+ Years | 111 (29.8%) | $41,875 |
| Total | 372 (100.0%) | $71,500 |
Poverty in Beach
Income Below Poverty by Sex and Age in Beach
With 22.8% poverty level for males and 13.4% for females among the residents of Beach, 15 year old males and 15 year old females are the most vulnerable to poverty, with 14 males (100.0%) and 9 females (100.0%) in their respective age groups living below the poverty level.
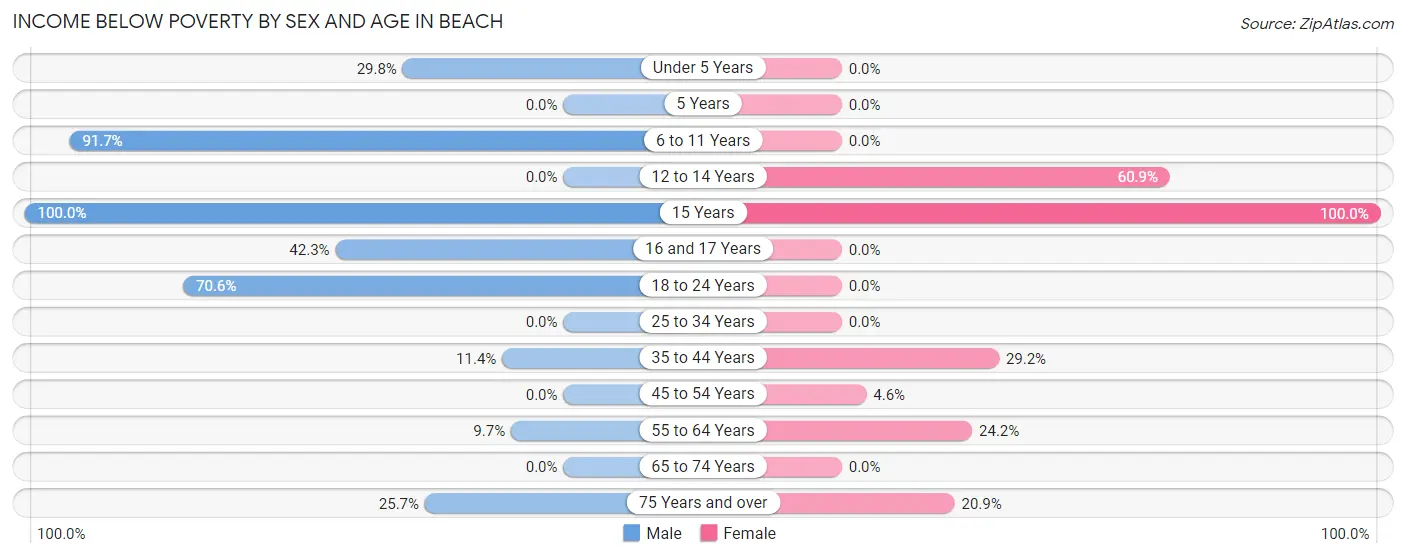
| Age Bracket | Male | Female |
| Under 5 Years | 17 (29.8%) | 0 (0.0%) |
| 5 Years | 0 (0.0%) | 0 (0.0%) |
| 6 to 11 Years | 33 (91.7%) | 0 (0.0%) |
| 12 to 14 Years | 0 (0.0%) | 14 (60.9%) |
| 15 Years | 14 (100.0%) | 9 (100.0%) |
| 16 and 17 Years | 11 (42.3%) | 0 (0.0%) |
| 18 to 24 Years | 12 (70.6%) | 0 (0.0%) |
| 25 to 34 Years | 0 (0.0%) | 0 (0.0%) |
| 35 to 44 Years | 5 (11.4%) | 14 (29.2%) |
| 45 to 54 Years | 0 (0.0%) | 4 (4.5%) |
| 55 to 64 Years | 7 (9.7%) | 15 (24.2%) |
| 65 to 74 Years | 0 (0.0%) | 0 (0.0%) |
| 75 Years and over | 9 (25.7%) | 9 (20.9%) |
| Total | 108 (22.8%) | 65 (13.4%) |
Income Above Poverty by Sex and Age in Beach
According to the poverty statistics in Beach, males aged 12 to 14 years and females aged under 5 years are the age groups that are most secure financially, with 100.0% of males and 100.0% of females in these age groups living above the poverty line.
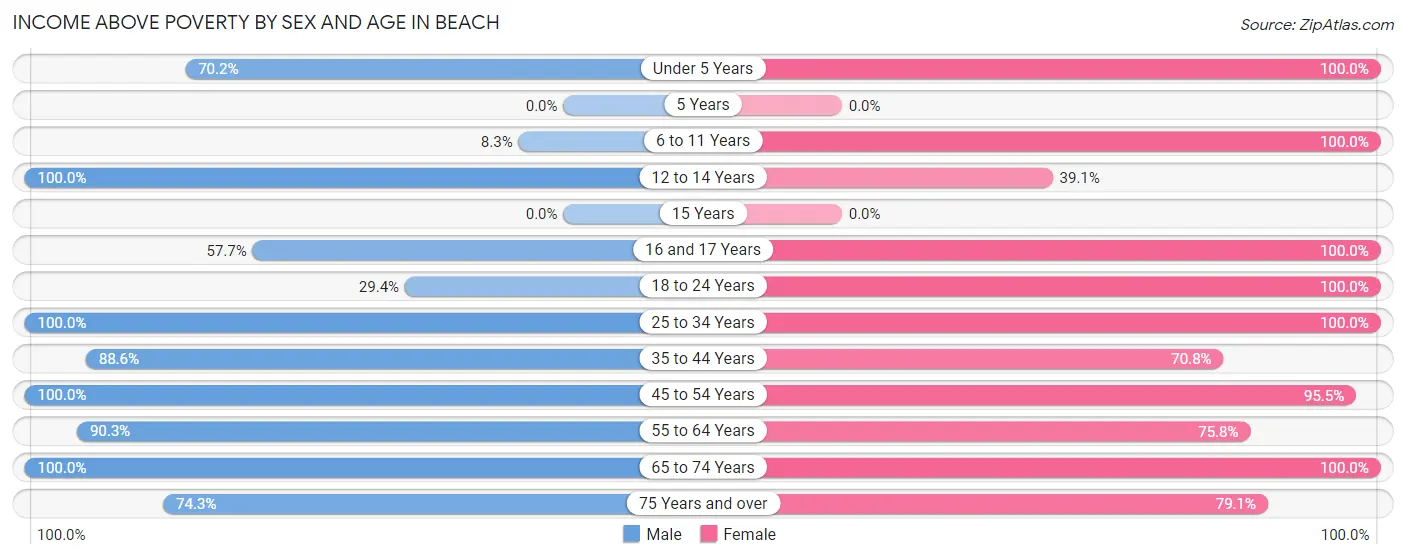
| Age Bracket | Male | Female |
| Under 5 Years | 40 (70.2%) | 43 (100.0%) |
| 5 Years | 0 (0.0%) | 0 (0.0%) |
| 6 to 11 Years | 3 (8.3%) | 31 (100.0%) |
| 12 to 14 Years | 13 (100.0%) | 9 (39.1%) |
| 15 Years | 0 (0.0%) | 0 (0.0%) |
| 16 and 17 Years | 15 (57.7%) | 7 (100.0%) |
| 18 to 24 Years | 5 (29.4%) | 19 (100.0%) |
| 25 to 34 Years | 72 (100.0%) | 82 (100.0%) |
| 35 to 44 Years | 39 (88.6%) | 34 (70.8%) |
| 45 to 54 Years | 43 (100.0%) | 84 (95.5%) |
| 55 to 64 Years | 65 (90.3%) | 47 (75.8%) |
| 65 to 74 Years | 44 (100.0%) | 29 (100.0%) |
| 75 Years and over | 26 (74.3%) | 34 (79.1%) |
| Total | 365 (77.2%) | 419 (86.6%) |
Income Below Poverty Among Married-Couple Families in Beach
The poverty statistics for married-couple families in Beach show that 2.9% or 6 of the total 208 families live below the poverty line. Families with no children have the highest poverty rate of 4.3%, comprising of 6 families. On the other hand, families with 1 or 2 children have the lowest poverty rate of 0.0%, which includes 0 families.
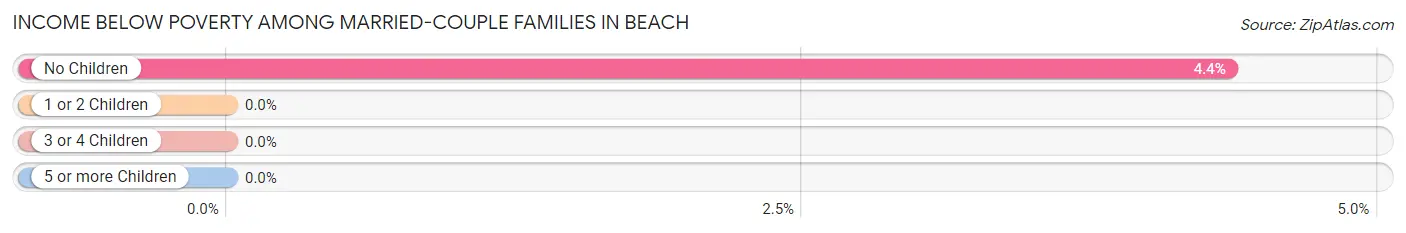
| Children | Above Poverty | Below Poverty |
| No Children | 132 (95.7%) | 6 (4.3%) |
| 1 or 2 Children | 48 (100.0%) | 0 (0.0%) |
| 3 or 4 Children | 22 (100.0%) | 0 (0.0%) |
| 5 or more Children | 0 (0.0%) | 0 (0.0%) |
| Total | 202 (97.1%) | 6 (2.9%) |
Income Below Poverty Among Single-Parent Households in Beach
According to the poverty data in Beach, 18.5% or 5 single-father households and 51.8% or 14 single-mother households are living below the poverty line. Among single-father households, those with no children have the highest poverty rate, with 5 households (25.0%) experiencing poverty. Likewise, among single-mother households, those with 5 or more children have the highest poverty rate, with 14 households (100.0%) falling below the poverty line.
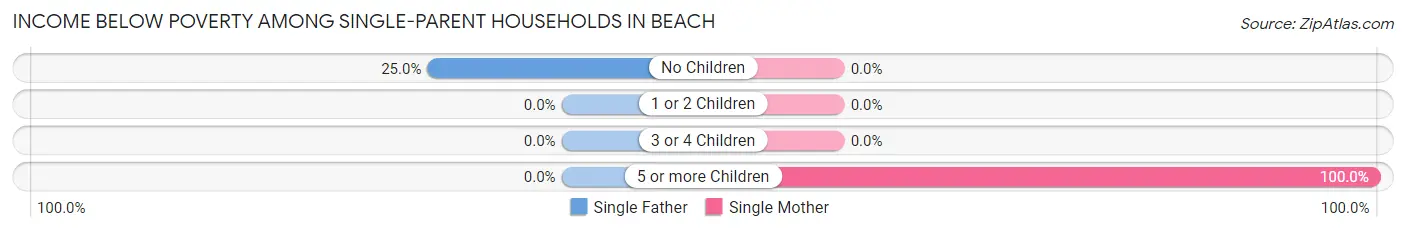
| Children | Single Father | Single Mother |
| No Children | 5 (25.0%) | 0 (0.0%) |
| 1 or 2 Children | 0 (0.0%) | 0 (0.0%) |
| 3 or 4 Children | 0 (0.0%) | 0 (0.0%) |
| 5 or more Children | 0 (0.0%) | 14 (100.0%) |
| Total | 5 (18.5%) | 14 (51.8%) |
Income Below Poverty Among Married-Couple vs Single-Parent Households in Beach
The poverty data for Beach shows that 6 of the married-couple family households (2.9%) and 19 of the single-parent households (35.2%) are living below the poverty level. Within the married-couple family households, those with no children have the highest poverty rate, with 6 households (4.3%) falling below the poverty line. Among the single-parent households, those with 5 or more children have the highest poverty rate, with 14 household (100.0%) living below poverty.
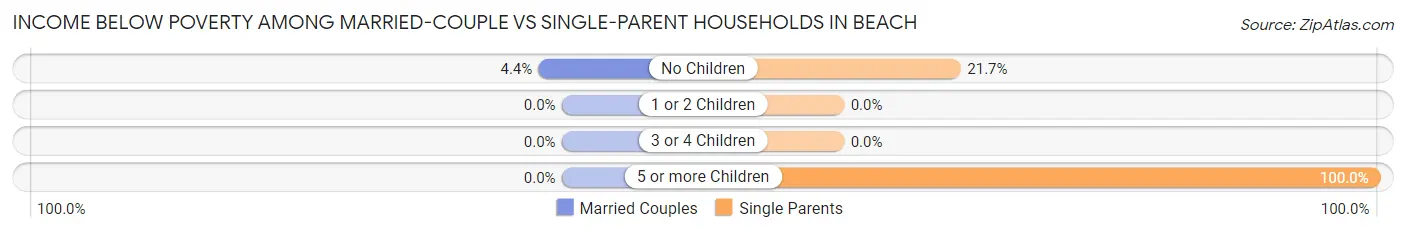
| Children | Married-Couple Families | Single-Parent Households |
| No Children | 6 (4.3%) | 5 (21.7%) |
| 1 or 2 Children | 0 (0.0%) | 0 (0.0%) |
| 3 or 4 Children | 0 (0.0%) | 0 (0.0%) |
| 5 or more Children | 0 (0.0%) | 14 (100.0%) |
| Total | 6 (2.9%) | 19 (35.2%) |
Race in Beach
The most populous races in Beach are White / Caucasian (790 | 82.6%), Two or more Races (154 | 16.1%), and Hispanic or Latino (66 | 6.9%).
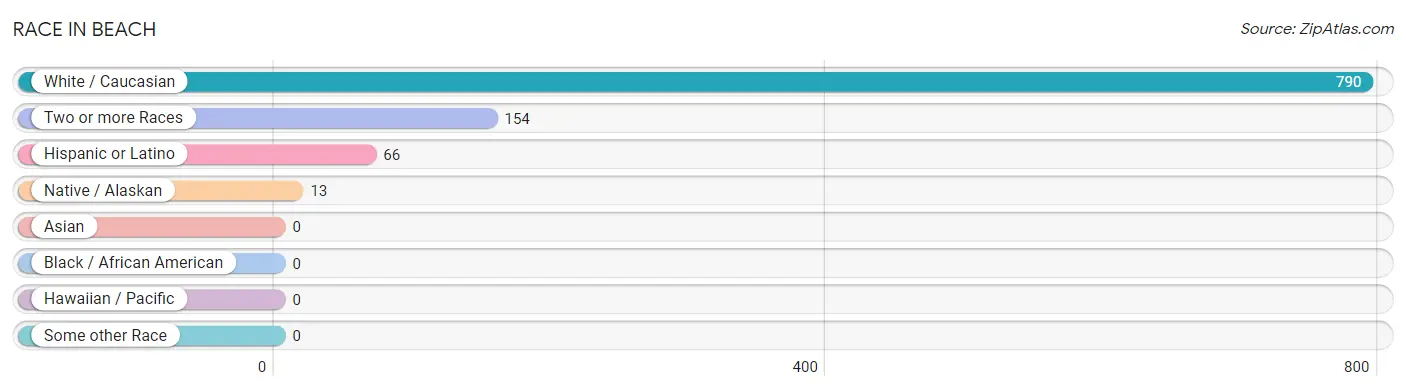
| Race | # Population | % Population |
| Asian | 0 | 0.0% |
| Black / African American | 0 | 0.0% |
| Hawaiian / Pacific | 0 | 0.0% |
| Hispanic or Latino | 66 | 6.9% |
| Native / Alaskan | 13 | 1.4% |
| White / Caucasian | 790 | 82.6% |
| Two or more Races | 154 | 16.1% |
| Some other Race | 0 | 0.0% |
| Total | 957 | 100.0% |
Ancestry in Beach
The most populous ancestries reported in Beach are German (437 | 45.7%), Irish (136 | 14.2%), Polish (73 | 7.6%), Norwegian (64 | 6.7%), and English (49 | 5.1%), together accounting for 79.3% of all Beach residents.
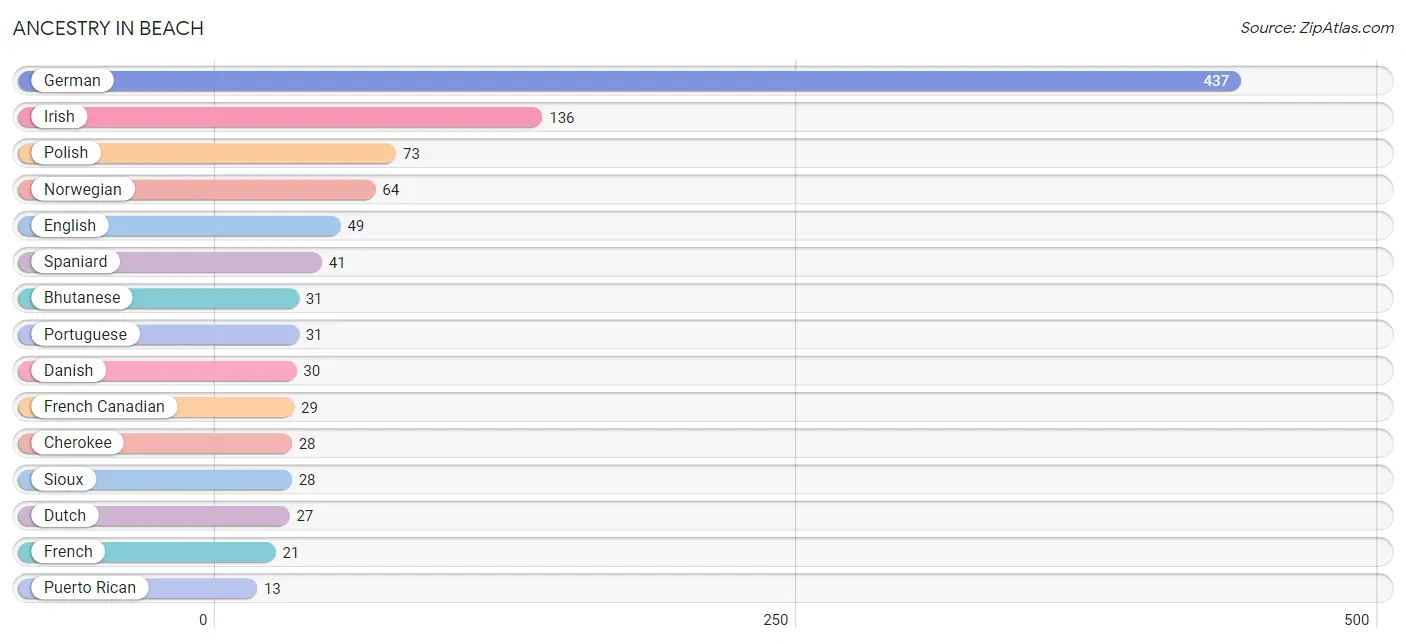
| Ancestry | # Population | % Population |
| American | 8 | 0.8% |
| Bhutanese | 31 | 3.2% |
| Bulgarian | 11 | 1.1% |
| Cherokee | 28 | 2.9% |
| Danish | 30 | 3.1% |
| Dutch | 27 | 2.8% |
| English | 49 | 5.1% |
| European | 7 | 0.7% |
| French | 21 | 2.2% |
| French Canadian | 29 | 3.0% |
| German | 437 | 45.7% |
| German Russian | 3 | 0.3% |
| Irish | 136 | 14.2% |
| Mexican | 12 | 1.3% |
| Norwegian | 64 | 6.7% |
| Polish | 73 | 7.6% |
| Portuguese | 31 | 3.2% |
| Puerto Rican | 13 | 1.4% |
| Russian | 12 | 1.3% |
| Scottish | 1 | 0.1% |
| Sioux | 28 | 2.9% |
| Spaniard | 41 | 4.3% |
| Swedish | 1 | 0.1% | View All 23 Rows |
Immigrants in Beach
The most numerous immigrant groups reported in Beach came from Central America (25 | 2.6%), Latin America (25 | 2.6%), Honduras (13 | 1.4%), and Mexico (12 | 1.3%), together accounting for 7.8% of all Beach residents.
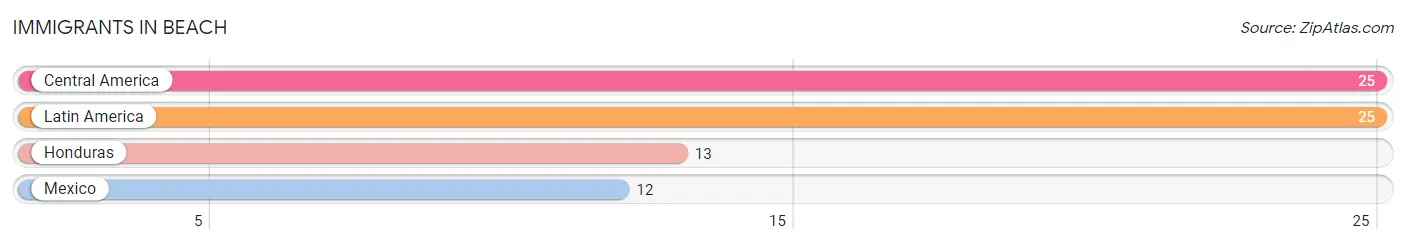
| Immigration Origin | # Population | % Population |
| Central America | 25 | 2.6% |
| Honduras | 13 | 1.4% |
| Latin America | 25 | 2.6% |
| Mexico | 12 | 1.3% | View All 4 Rows |
Sex and Age in Beach
Sex and Age in Beach
The most populous age groups in Beach are Under 5 Years (57 | 12.0%) for men and 45 to 49 Years (69 | 14.3%) for women.
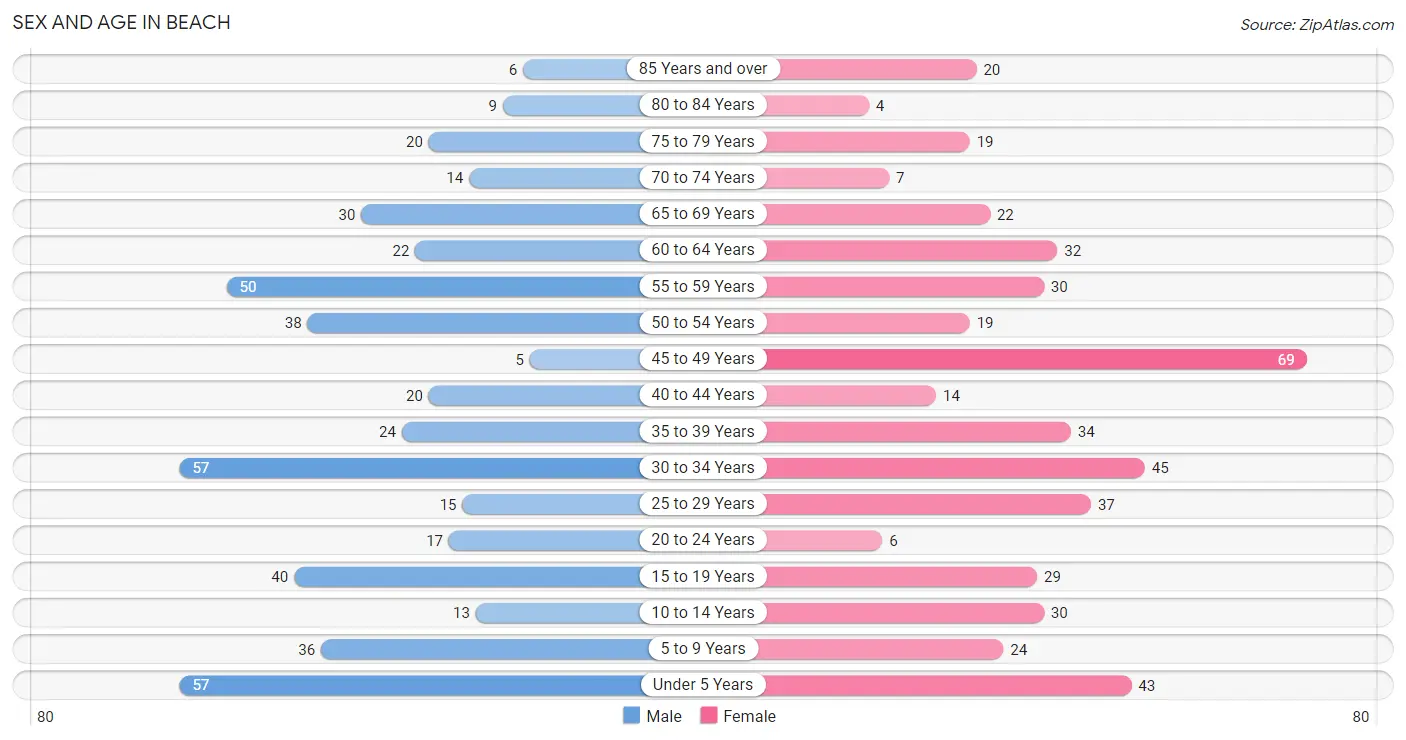
| Age Bracket | Male | Female |
| Under 5 Years | 57 (12.0%) | 43 (8.9%) |
| 5 to 9 Years | 36 (7.6%) | 24 (5.0%) |
| 10 to 14 Years | 13 (2.8%) | 30 (6.2%) |
| 15 to 19 Years | 40 (8.5%) | 29 (6.0%) |
| 20 to 24 Years | 17 (3.6%) | 6 (1.2%) |
| 25 to 29 Years | 15 (3.2%) | 37 (7.6%) |
| 30 to 34 Years | 57 (12.0%) | 45 (9.3%) |
| 35 to 39 Years | 24 (5.1%) | 34 (7.0%) |
| 40 to 44 Years | 20 (4.2%) | 14 (2.9%) |
| 45 to 49 Years | 5 (1.1%) | 69 (14.3%) |
| 50 to 54 Years | 38 (8.0%) | 19 (3.9%) |
| 55 to 59 Years | 50 (10.6%) | 30 (6.2%) |
| 60 to 64 Years | 22 (4.6%) | 32 (6.6%) |
| 65 to 69 Years | 30 (6.3%) | 22 (4.5%) |
| 70 to 74 Years | 14 (3.0%) | 7 (1.5%) |
| 75 to 79 Years | 20 (4.2%) | 19 (3.9%) |
| 80 to 84 Years | 9 (1.9%) | 4 (0.8%) |
| 85 Years and over | 6 (1.3%) | 20 (4.1%) |
| Total | 473 (100.0%) | 484 (100.0%) |
Families and Households in Beach
Median Family Size in Beach
The median family size in Beach is 2.94 persons per family, with single female/mother families (27 | 10.3%) accounting for the largest median family size of 4.89 persons per family. On the other hand, single male/father families (27 | 10.3%) represent the smallest median family size with 2.52 persons per family.
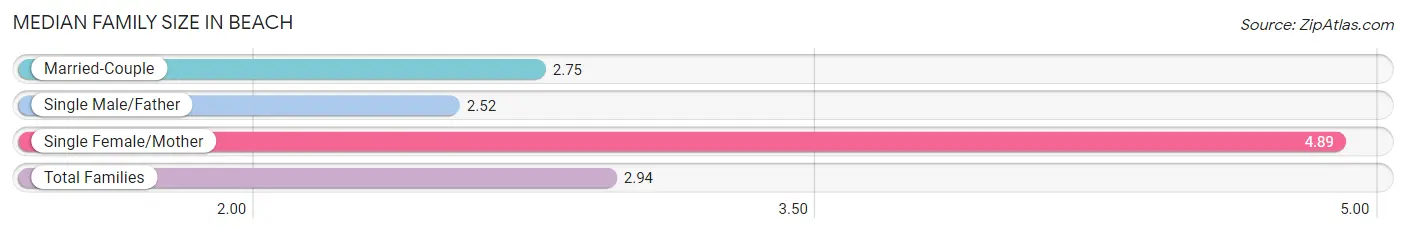
| Family Type | # Families | Family Size |
| Married-Couple | 208 (79.4%) | 2.75 |
| Single Male/Father | 27 (10.3%) | 2.52 |
| Single Female/Mother | 27 (10.3%) | 4.89 |
| Total Families | 262 (100.0%) | 2.94 |
Median Household Size in Beach
The median household size in Beach is 2.48 persons per household, with single female/mother households (27 | 7.3%) accounting for the largest median household size of 4.89 persons per household. non-family households (110 | 29.6%) represent the smallest median household size with 1.28 persons per household.
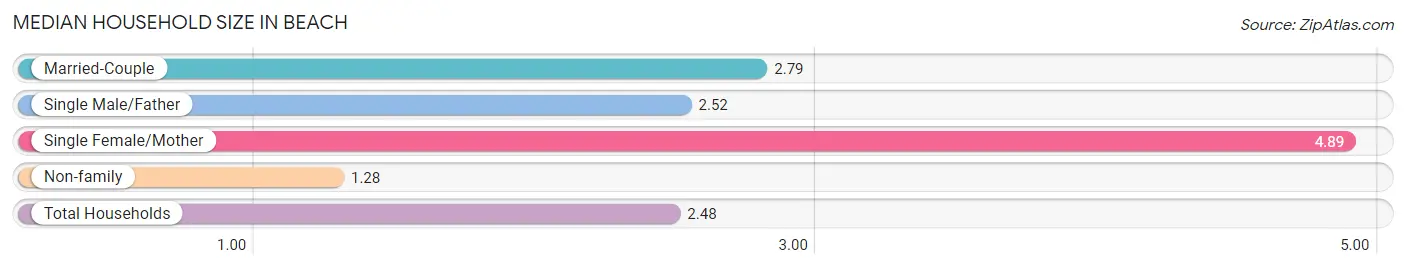
| Household Type | # Households | Household Size |
| Married-Couple | 208 (55.9%) | 2.79 |
| Single Male/Father | 27 (7.3%) | 2.52 |
| Single Female/Mother | 27 (7.3%) | 4.89 |
| Non-family | 110 (29.6%) | 1.28 |
| Total Households | 372 (100.0%) | 2.48 |
Household Size by Marriage Status in Beach
Out of a total of 372 households in Beach, 262 (70.4%) are family households, while 110 (29.6%) are nonfamily households. The most numerous type of family households are 2-person households, comprising 168, and the most common type of nonfamily households are 1-person households, comprising 98.
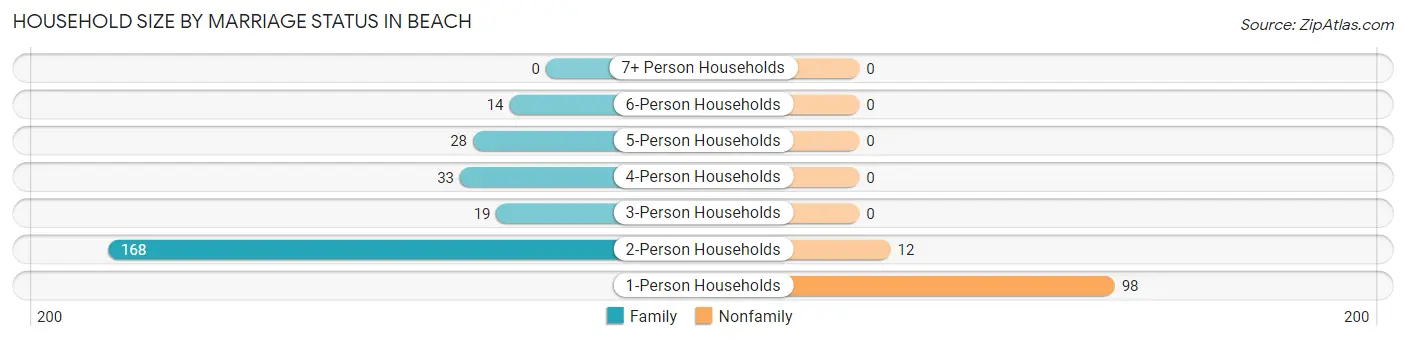
| Household Size | Family Households | Nonfamily Households |
| 1-Person Households | - | 98 (26.3%) |
| 2-Person Households | 168 (45.2%) | 12 (3.2%) |
| 3-Person Households | 19 (5.1%) | 0 (0.0%) |
| 4-Person Households | 33 (8.9%) | 0 (0.0%) |
| 5-Person Households | 28 (7.5%) | 0 (0.0%) |
| 6-Person Households | 14 (3.8%) | 0 (0.0%) |
| 7+ Person Households | 0 (0.0%) | 0 (0.0%) |
| Total | 262 (70.4%) | 110 (29.6%) |
Female Fertility in Beach
Fertility by Age in Beach
| Age Bracket | Women with Births | Births / 1,000 Women |
| 15 to 19 years | 0 (0.0%) | 0.0 |
| 20 to 34 years | 0 (0.0%) | 0.0 |
| 35 to 50 years | 0 (0.0%) | 0.0 |
| Total | 0 (0.0%) | 0.0 |
Fertility by Age by Marriage Status in Beach
| Age Bracket | Married | Unmarried |
| 15 to 19 years | 0 (0.0%) | 0 (0.0%) |
| 20 to 34 years | 0 (0.0%) | 0 (0.0%) |
| 35 to 50 years | 0 (0.0%) | 0 (0.0%) |
| Total | 0 (0.0%) | 0 (0.0%) |
Fertility by Education in Beach
| Educational Attainment | Women with Births | Births / 1,000 Women |
| Less than High School | 0 (0.0%) | 0.0 |
| High School Diploma | 0 (0.0%) | 0.0 |
| College or Associate's Degree | 0 (0.0%) | 0.0 |
| Bachelor's Degree | 0 (0.0%) | 0.0 |
| Graduate Degree | 0 (0.0%) | 0.0 |
| Total | 0 (0.0%) | 0.0 |
Fertility by Education by Marriage Status in Beach
| Educational Attainment | Married | Unmarried |
| Less than High School | 0 (0.0%) | 0 (0.0%) |
| High School Diploma | 0 (0.0%) | 0 (0.0%) |
| College or Associate's Degree | 0 (0.0%) | 0 (0.0%) |
| Bachelor's Degree | 0 (0.0%) | 0 (0.0%) |
| Graduate Degree | 0 (0.0%) | 0 (0.0%) |
| Total | 0 (0.0%) | 0 (0.0%) |
Employment Characteristics in Beach
Employment by Class of Employer in Beach
Among the 442 employed individuals in Beach, private company employees (217 | 49.1%), not-for-profit organizations (63 | 14.2%), and self-employed (incorporated) (62 | 14.0%) make up the most common classes of employment.
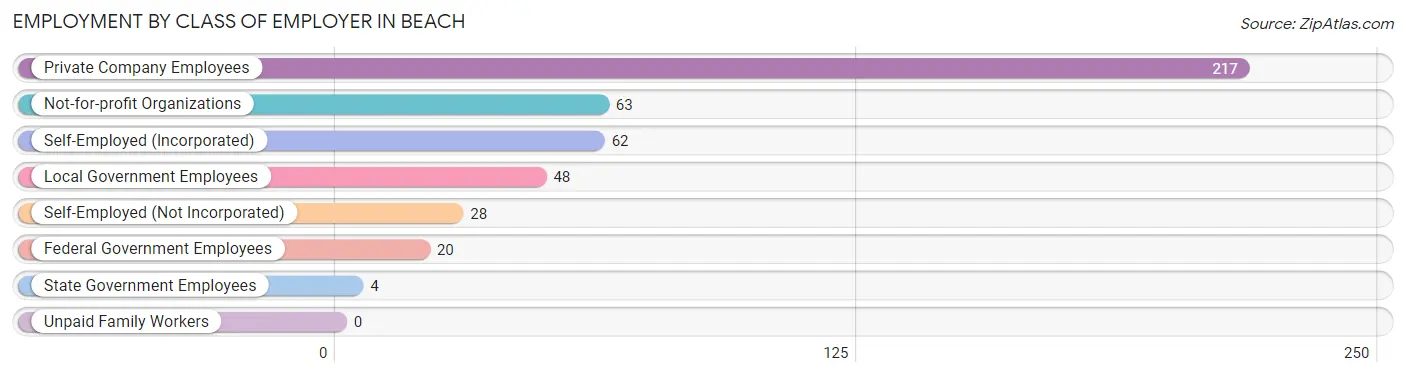
| Employer Class | # Employees | % Employees |
| Private Company Employees | 217 | 49.1% |
| Self-Employed (Incorporated) | 62 | 14.0% |
| Self-Employed (Not Incorporated) | 28 | 6.3% |
| Not-for-profit Organizations | 63 | 14.2% |
| Local Government Employees | 48 | 10.9% |
| State Government Employees | 4 | 0.9% |
| Federal Government Employees | 20 | 4.5% |
| Unpaid Family Workers | 0 | 0.0% |
| Total | 442 | 100.0% |
Employment Status by Age in Beach
According to the labor force statistics for Beach, out of the total population over 16 years of age (731), 66.6% or 487 individuals are in the labor force, with 8.8% or 43 of them unemployed. The age group with the highest labor force participation rate is 25 to 29 years, with 100.0% or 52 individuals in the labor force. Within the labor force, the 55 to 59 years age range has the highest percentage of unemployed individuals, with 30.0% or 24 of them being unemployed.
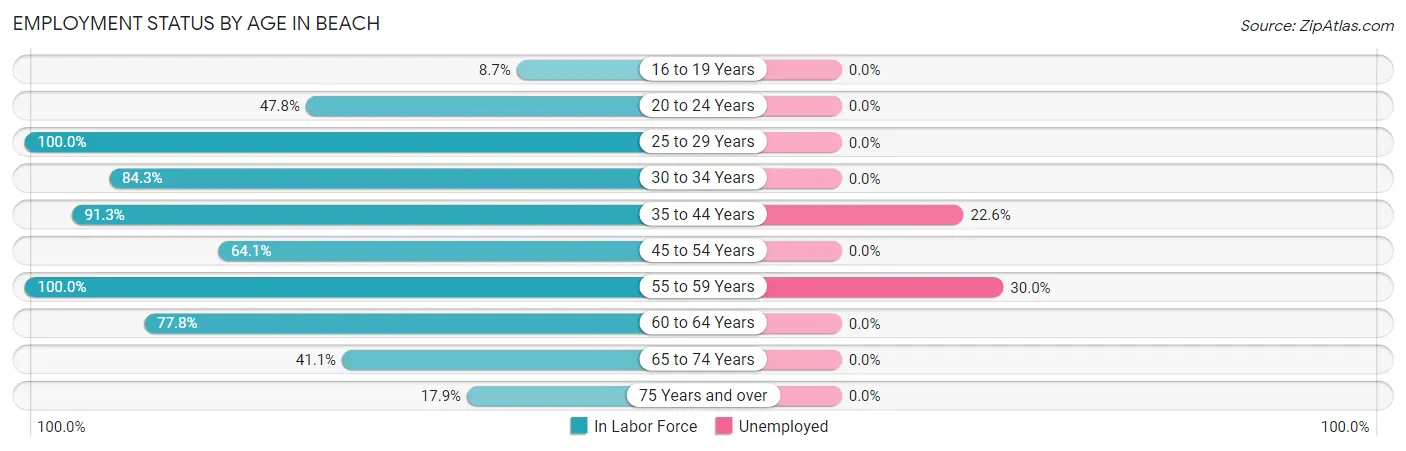
| Age Bracket | In Labor Force | Unemployed |
| 16 to 19 Years | 4 (8.7%) | 0 (0.0%) |
| 20 to 24 Years | 11 (47.8%) | 0 (0.0%) |
| 25 to 29 Years | 52 (100.0%) | 0 (0.0%) |
| 30 to 34 Years | 86 (84.3%) | 0 (0.0%) |
| 35 to 44 Years | 84 (91.3%) | 19 (22.6%) |
| 45 to 54 Years | 84 (64.1%) | 0 (0.0%) |
| 55 to 59 Years | 80 (100.0%) | 24 (30.0%) |
| 60 to 64 Years | 42 (77.8%) | 0 (0.0%) |
| 65 to 74 Years | 30 (41.1%) | 0 (0.0%) |
| 75 Years and over | 14 (17.9%) | 0 (0.0%) |
| Total | 487 (66.6%) | 43 (8.8%) |
Employment Status by Educational Attainment in Beach
According to labor force statistics for Beach, 83.8% of individuals (428) out of the total population between 25 and 64 years of age (511) are in the labor force, with 10.0% or 43 of them being unemployed. The group with the highest labor force participation rate are those with the educational attainment of high school diploma, with 100.0% or 64 individuals in the labor force. Within the labor force, individuals with college / associate degree education have the highest percentage of unemployment, with 19.7% or 43 of them being unemployed.
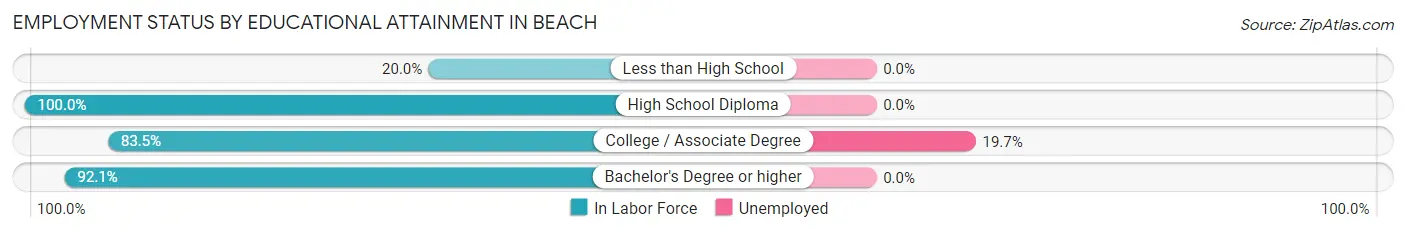
| Educational Attainment | In Labor Force | Unemployed |
| Less than High School | 7 (20.0%) | 0 (0.0%) |
| High School Diploma | 64 (100.0%) | 0 (0.0%) |
| College / Associate Degree | 218 (83.5%) | 51 (19.7%) |
| Bachelor's Degree or higher | 139 (92.1%) | 0 (0.0%) |
| Total | 428 (83.8%) | 51 (10.0%) |
Employment Occupations by Sex in Beach
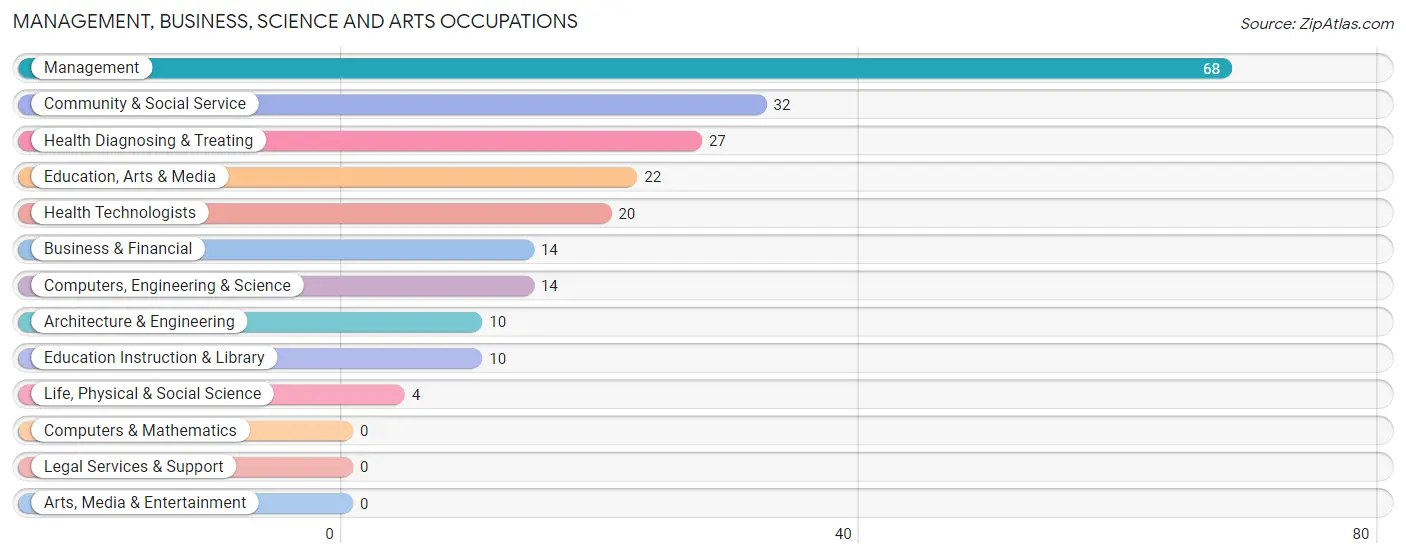
Management, Business, Science and Arts Occupations
The most common Management, Business, Science and Arts occupations in Beach are Management (68 | 15.3%), Community & Social Service (32 | 7.2%), Health Diagnosing & Treating (27 | 6.1%), Education, Arts & Media (22 | 5.0%), and Health Technologists (20 | 4.5%).
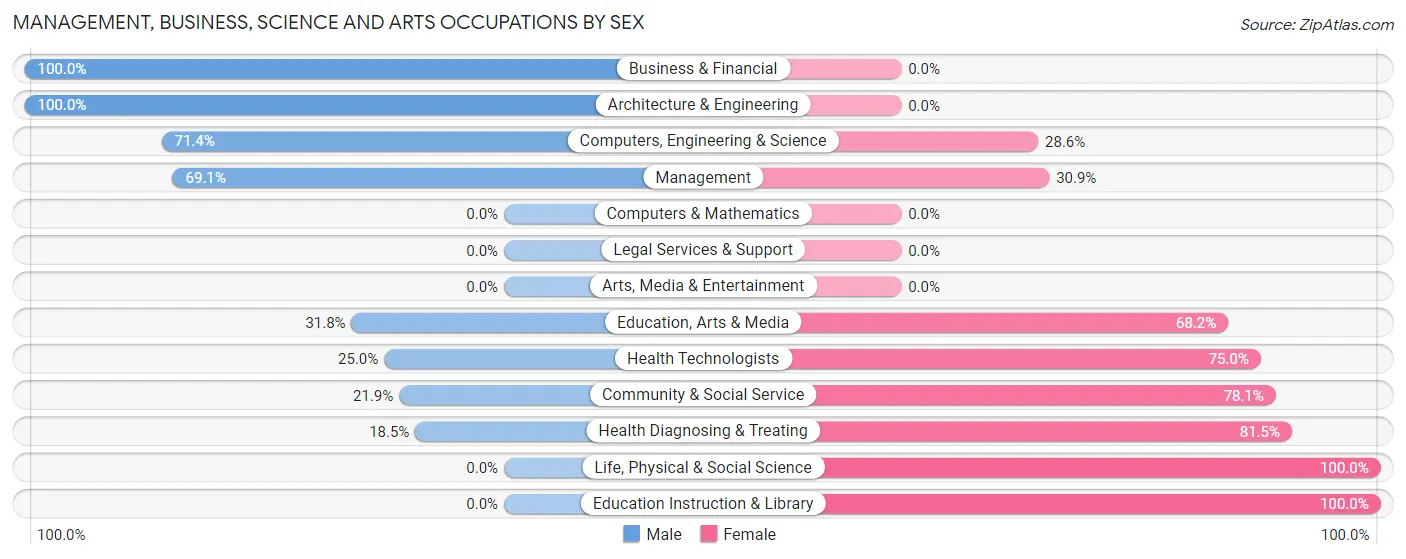
Management, Business, Science and Arts Occupations by Sex
Within the Management, Business, Science and Arts occupations in Beach, the most male-oriented occupations are Business & Financial (100.0%), Architecture & Engineering (100.0%), and Computers, Engineering & Science (71.4%), while the most female-oriented occupations are Life, Physical & Social Science (100.0%), Education Instruction & Library (100.0%), and Health Diagnosing & Treating (81.5%).
| Occupation | Male | Female |
| Management | 47 (69.1%) | 21 (30.9%) |
| Business & Financial | 14 (100.0%) | 0 (0.0%) |
| Computers, Engineering & Science | 10 (71.4%) | 4 (28.6%) |
| Computers & Mathematics | 0 (0.0%) | 0 (0.0%) |
| Architecture & Engineering | 10 (100.0%) | 0 (0.0%) |
| Life, Physical & Social Science | 0 (0.0%) | 4 (100.0%) |
| Community & Social Service | 7 (21.9%) | 25 (78.1%) |
| Education, Arts & Media | 7 (31.8%) | 15 (68.2%) |
| Legal Services & Support | 0 (0.0%) | 0 (0.0%) |
| Education Instruction & Library | 0 (0.0%) | 10 (100.0%) |
| Arts, Media & Entertainment | 0 (0.0%) | 0 (0.0%) |
| Health Diagnosing & Treating | 5 (18.5%) | 22 (81.5%) |
| Health Technologists | 5 (25.0%) | 15 (75.0%) |
| Total (Category) | 83 (53.5%) | 72 (46.5%) |
| Total (Overall) | 237 (53.4%) | 207 (46.6%) |
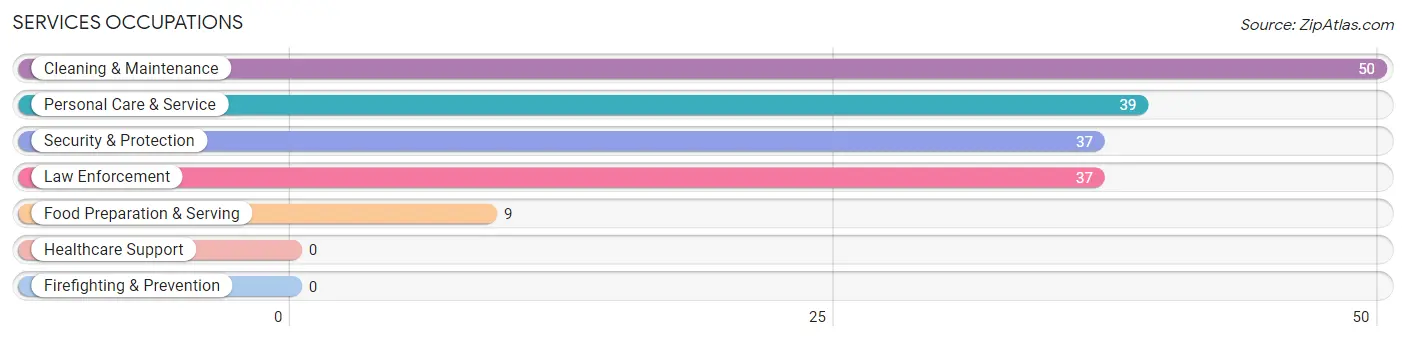
Services Occupations
The most common Services occupations in Beach are Cleaning & Maintenance (50 | 11.3%), Personal Care & Service (39 | 8.8%), Security & Protection (37 | 8.3%), Law Enforcement (37 | 8.3%), and Food Preparation & Serving (9 | 2.0%).
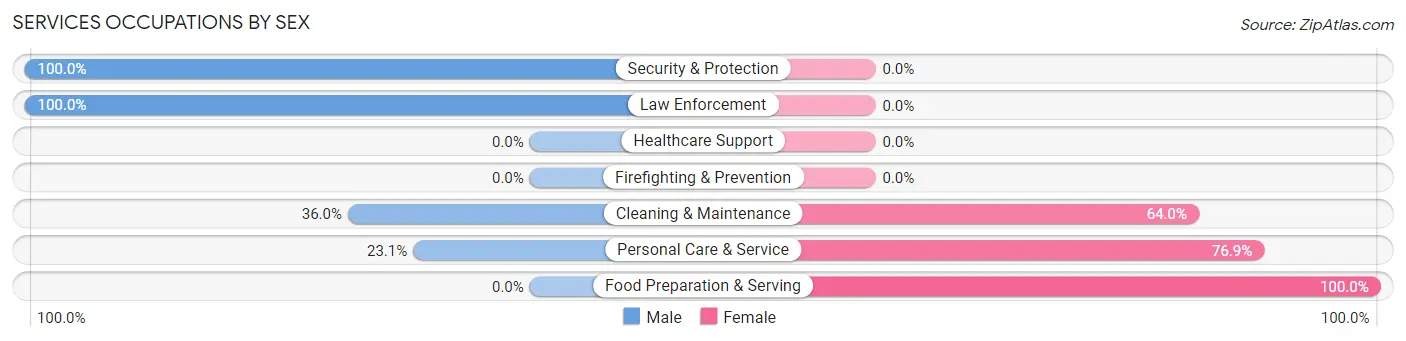
Services Occupations by Sex
Within the Services occupations in Beach, the most male-oriented occupations are Security & Protection (100.0%), Law Enforcement (100.0%), and Cleaning & Maintenance (36.0%), while the most female-oriented occupations are Food Preparation & Serving (100.0%), Personal Care & Service (76.9%), and Cleaning & Maintenance (64.0%).
| Occupation | Male | Female |
| Healthcare Support | 0 (0.0%) | 0 (0.0%) |
| Security & Protection | 37 (100.0%) | 0 (0.0%) |
| Firefighting & Prevention | 0 (0.0%) | 0 (0.0%) |
| Law Enforcement | 37 (100.0%) | 0 (0.0%) |
| Food Preparation & Serving | 0 (0.0%) | 9 (100.0%) |
| Cleaning & Maintenance | 18 (36.0%) | 32 (64.0%) |
| Personal Care & Service | 9 (23.1%) | 30 (76.9%) |
| Total (Category) | 64 (47.4%) | 71 (52.6%) |
| Total (Overall) | 237 (53.4%) | 207 (46.6%) |
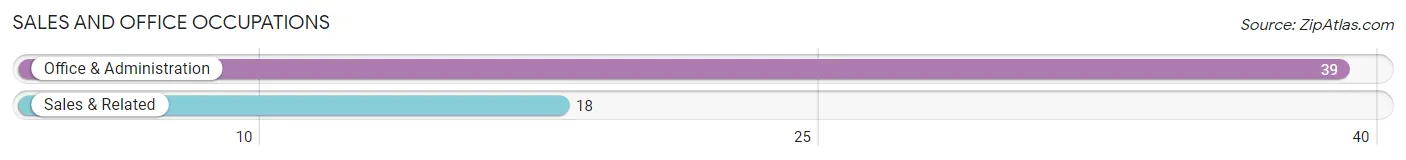
Sales and Office Occupations
The most common Sales and Office occupations in Beach are Office & Administration (39 | 8.8%), and Sales & Related (18 | 4.1%).
Sales and Office Occupations by Sex
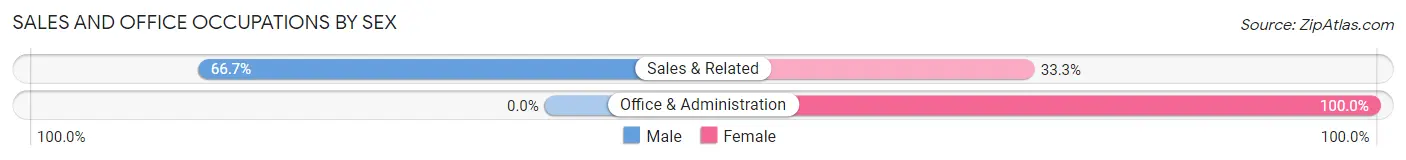
| Occupation | Male | Female |
| Sales & Related | 12 (66.7%) | 6 (33.3%) |
| Office & Administration | 0 (0.0%) | 39 (100.0%) |
| Total (Category) | 12 (21.0%) | 45 (78.9%) |
| Total (Overall) | 237 (53.4%) | 207 (46.6%) |
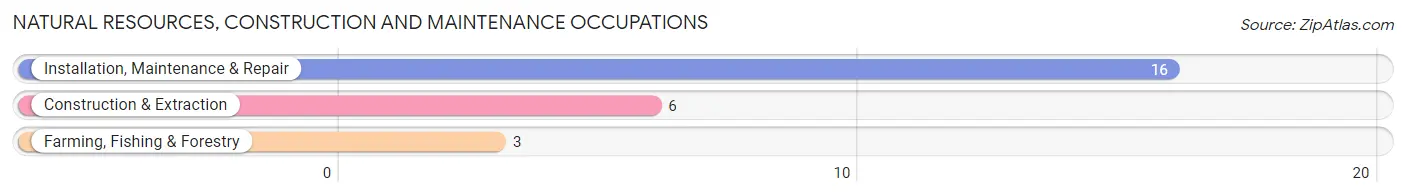
Natural Resources, Construction and Maintenance Occupations
The most common Natural Resources, Construction and Maintenance occupations in Beach are Installation, Maintenance & Repair (16 | 3.6%), Construction & Extraction (6 | 1.3%), and Farming, Fishing & Forestry (3 | 0.7%).
Natural Resources, Construction and Maintenance Occupations by Sex
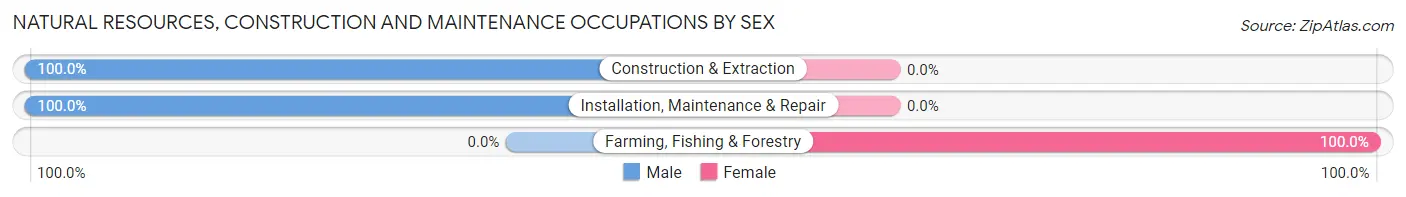
| Occupation | Male | Female |
| Farming, Fishing & Forestry | 0 (0.0%) | 3 (100.0%) |
| Construction & Extraction | 6 (100.0%) | 0 (0.0%) |
| Installation, Maintenance & Repair | 16 (100.0%) | 0 (0.0%) |
| Total (Category) | 22 (88.0%) | 3 (12.0%) |
| Total (Overall) | 237 (53.4%) | 207 (46.6%) |
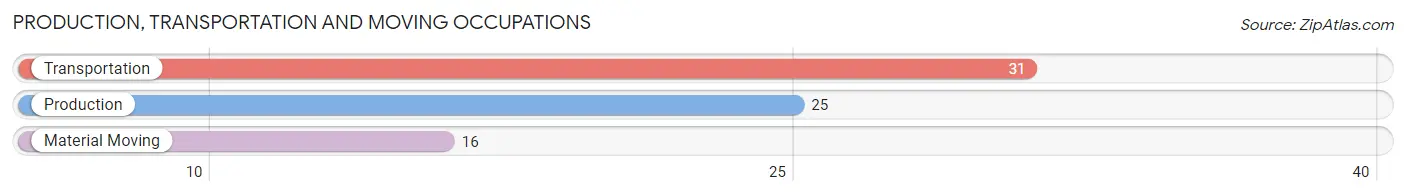
Production, Transportation and Moving Occupations
The most common Production, Transportation and Moving occupations in Beach are Transportation (31 | 7.0%), Production (25 | 5.6%), and Material Moving (16 | 3.6%).
Production, Transportation and Moving Occupations by Sex
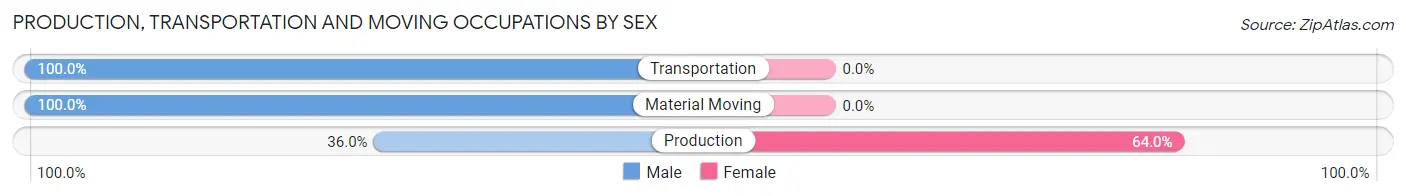
| Occupation | Male | Female |
| Production | 9 (36.0%) | 16 (64.0%) |
| Transportation | 31 (100.0%) | 0 (0.0%) |
| Material Moving | 16 (100.0%) | 0 (0.0%) |
| Total (Category) | 56 (77.8%) | 16 (22.2%) |
| Total (Overall) | 237 (53.4%) | 207 (46.6%) |
Employment Industries by Sex in Beach
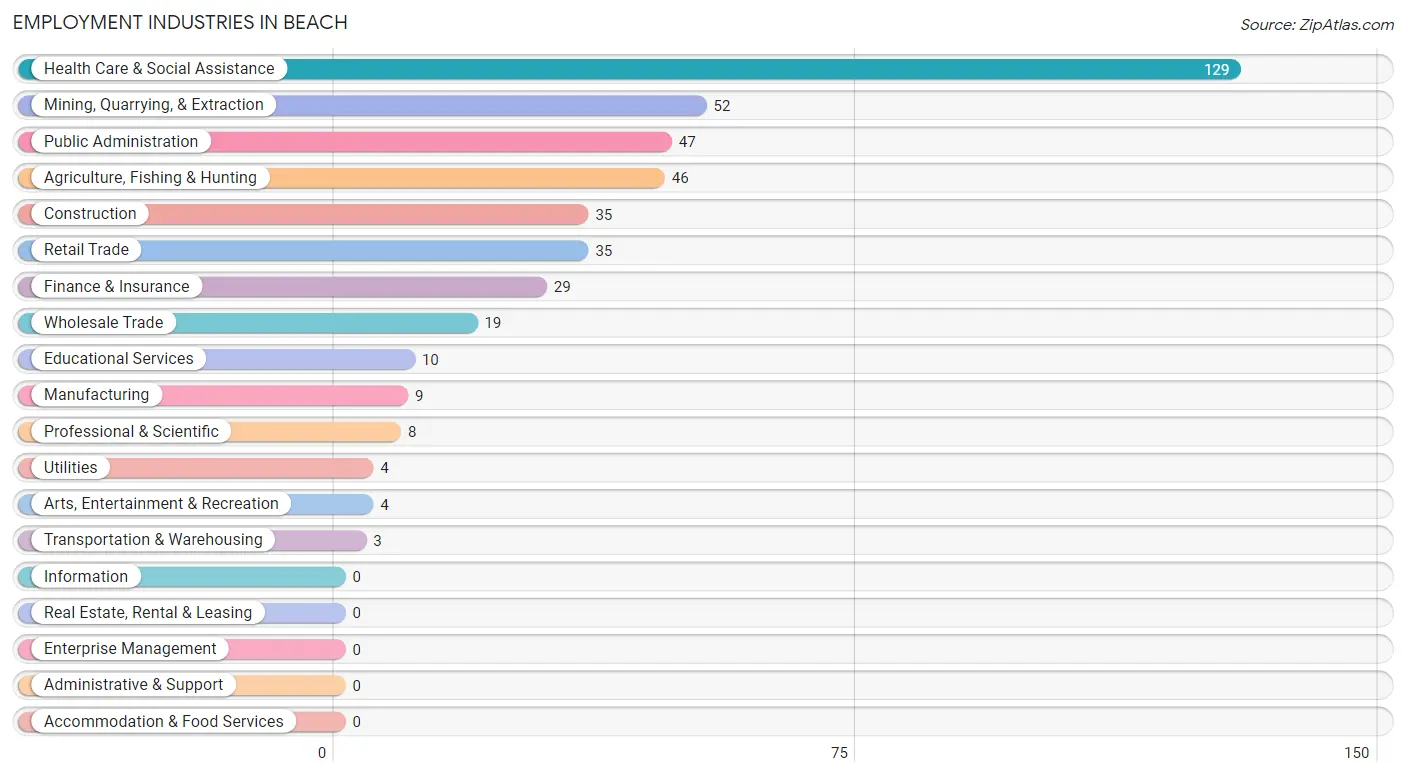
Employment Industries in Beach
The major employment industries in Beach include Health Care & Social Assistance (129 | 29.0%), Mining, Quarrying, & Extraction (52 | 11.7%), Public Administration (47 | 10.6%), Agriculture, Fishing & Hunting (46 | 10.4%), and Construction (35 | 7.9%).
Employment Industries by Sex in Beach
The Beach industries that see more men than women are Mining, Quarrying, & Extraction (100.0%), Construction (100.0%), and Manufacturing (100.0%), whereas the industries that tend to have a higher number of women are Transportation & Warehousing (100.0%), Utilities (100.0%), and Professional & Scientific (100.0%).
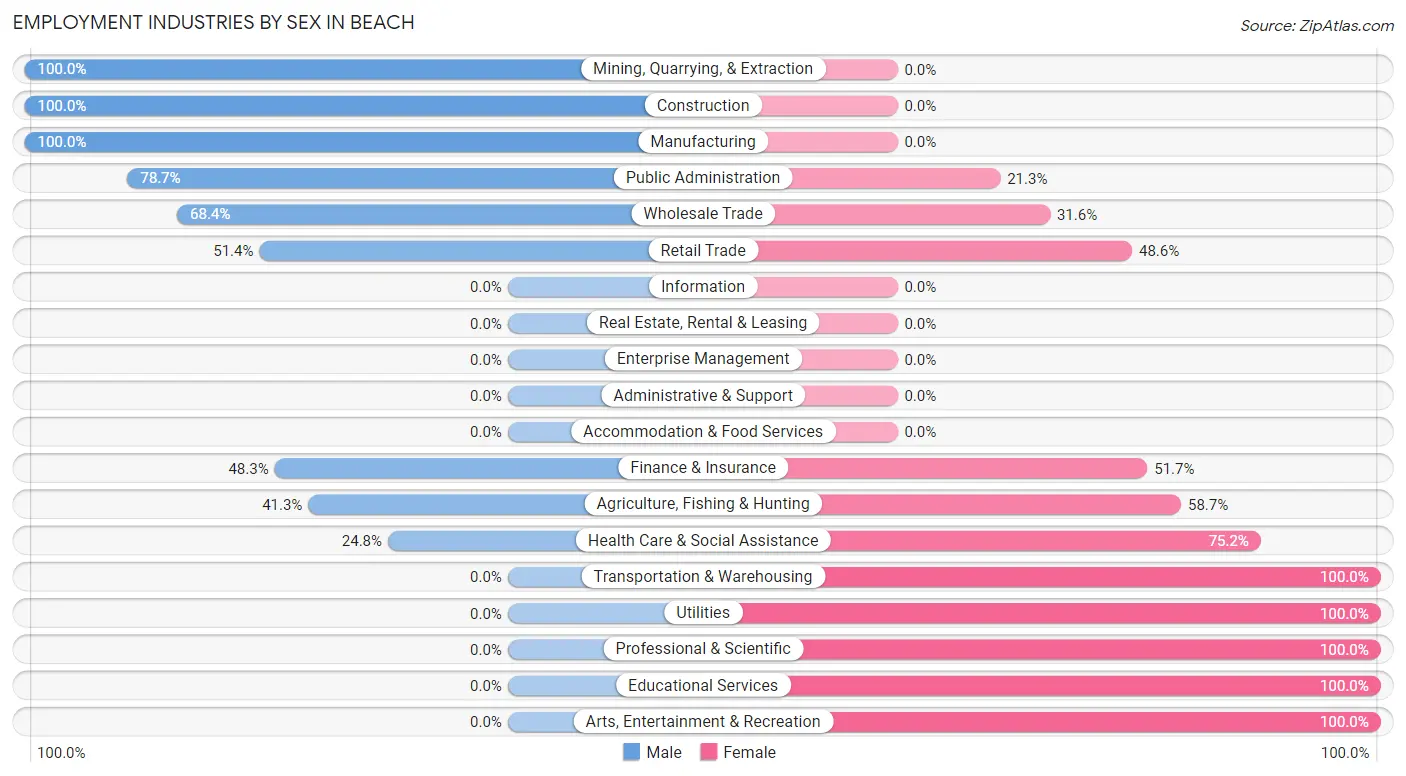
| Industry | Male | Female |
| Agriculture, Fishing & Hunting | 19 (41.3%) | 27 (58.7%) |
| Mining, Quarrying, & Extraction | 52 (100.0%) | 0 (0.0%) |
| Construction | 35 (100.0%) | 0 (0.0%) |
| Manufacturing | 9 (100.0%) | 0 (0.0%) |
| Wholesale Trade | 13 (68.4%) | 6 (31.6%) |
| Retail Trade | 18 (51.4%) | 17 (48.6%) |
| Transportation & Warehousing | 0 (0.0%) | 3 (100.0%) |
| Utilities | 0 (0.0%) | 4 (100.0%) |
| Information | 0 (0.0%) | 0 (0.0%) |
| Finance & Insurance | 14 (48.3%) | 15 (51.7%) |
| Real Estate, Rental & Leasing | 0 (0.0%) | 0 (0.0%) |
| Professional & Scientific | 0 (0.0%) | 8 (100.0%) |
| Enterprise Management | 0 (0.0%) | 0 (0.0%) |
| Administrative & Support | 0 (0.0%) | 0 (0.0%) |
| Educational Services | 0 (0.0%) | 10 (100.0%) |
| Health Care & Social Assistance | 32 (24.8%) | 97 (75.2%) |
| Arts, Entertainment & Recreation | 0 (0.0%) | 4 (100.0%) |
| Accommodation & Food Services | 0 (0.0%) | 0 (0.0%) |
| Public Administration | 37 (78.7%) | 10 (21.3%) |
| Total | 237 (53.4%) | 207 (46.6%) |
Education in Beach
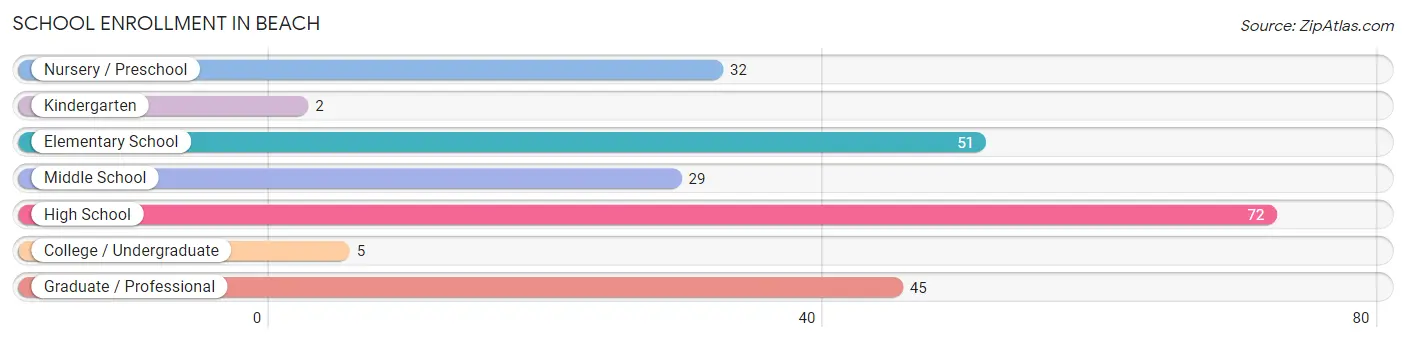
School Enrollment in Beach
The most common levels of schooling among the 236 students in Beach are high school (72 | 30.5%), elementary school (51 | 21.6%), and graduate / professional (45 | 19.1%).
| School Level | # Students | % Students |
| Nursery / Preschool | 32 | 13.6% |
| Kindergarten | 2 | 0.9% |
| Elementary School | 51 | 21.6% |
| Middle School | 29 | 12.3% |
| High School | 72 | 30.5% |
| College / Undergraduate | 5 | 2.1% |
| Graduate / Professional | 45 | 19.1% |
| Total | 236 | 100.0% |
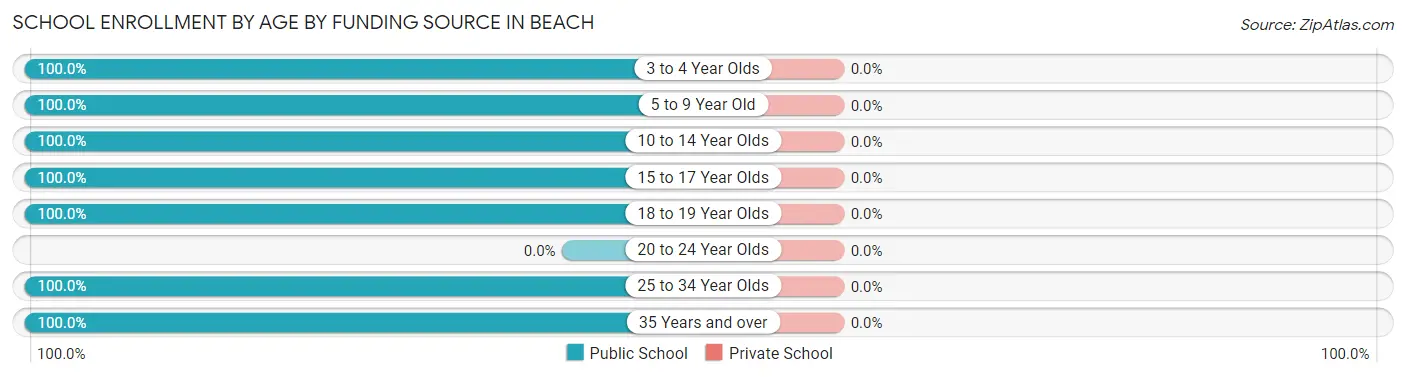
School Enrollment by Age by Funding Source in Beach
| Age Bracket | Public School | Private School |
| 3 to 4 Year Olds | 32 (100.0%) | 0 (0.0%) |
| 5 to 9 Year Old | 53 (100.0%) | 0 (0.0%) |
| 10 to 14 Year Olds | 43 (100.0%) | 0 (0.0%) |
| 15 to 17 Year Olds | 45 (100.0%) | 0 (0.0%) |
| 18 to 19 Year Olds | 13 (100.0%) | 0 (0.0%) |
| 20 to 24 Year Olds | 0 (0.0%) | 0 (0.0%) |
| 25 to 34 Year Olds | 40 (100.0%) | 0 (0.0%) |
| 35 Years and over | 10 (100.0%) | 0 (0.0%) |
| Total | 236 (100.0%) | 0 (0.0%) |
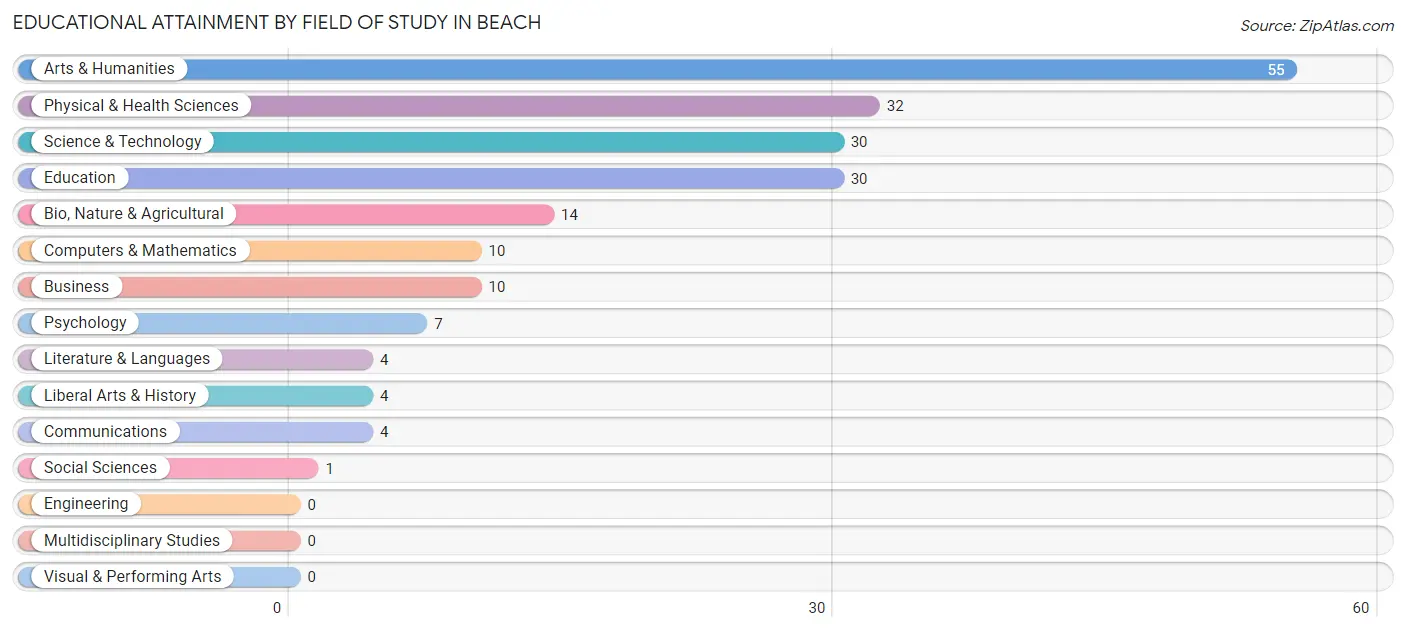
Educational Attainment by Field of Study in Beach
Arts & humanities (55 | 27.4%), physical & health sciences (32 | 15.9%), science & technology (30 | 14.9%), education (30 | 14.9%), and bio, nature & agricultural (14 | 7.0%) are the most common fields of study among 201 individuals in Beach who have obtained a bachelor's degree or higher.
| Field of Study | # Graduates | % Graduates |
| Computers & Mathematics | 10 | 5.0% |
| Bio, Nature & Agricultural | 14 | 7.0% |
| Physical & Health Sciences | 32 | 15.9% |
| Psychology | 7 | 3.5% |
| Social Sciences | 1 | 0.5% |
| Engineering | 0 | 0.0% |
| Multidisciplinary Studies | 0 | 0.0% |
| Science & Technology | 30 | 14.9% |
| Business | 10 | 5.0% |
| Education | 30 | 14.9% |
| Literature & Languages | 4 | 2.0% |
| Liberal Arts & History | 4 | 2.0% |
| Visual & Performing Arts | 0 | 0.0% |
| Communications | 4 | 2.0% |
| Arts & Humanities | 55 | 27.4% |
| Total | 201 | 100.0% |
Transportation & Commute in Beach
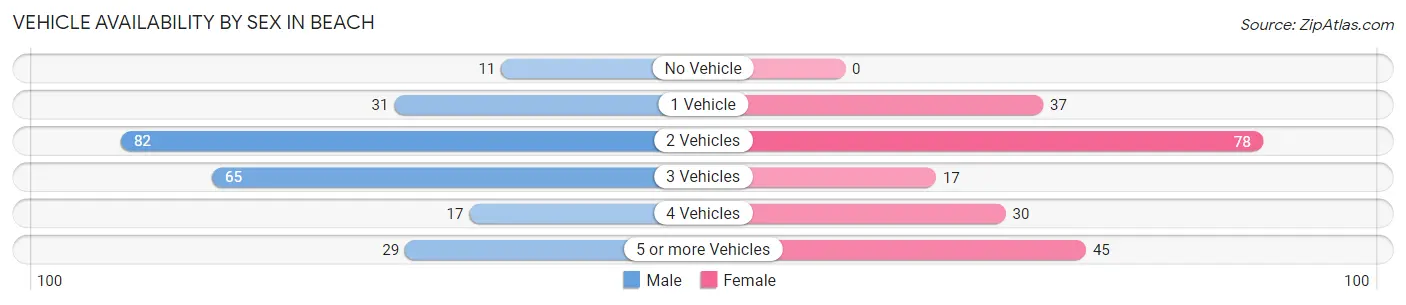
Vehicle Availability by Sex in Beach
The most prevalent vehicle ownership categories in Beach are males with 2 vehicles (82, accounting for 34.9%) and females with 2 vehicles (78, making up 39.6%).
| Vehicles Available | Male | Female |
| No Vehicle | 11 (4.7%) | 0 (0.0%) |
| 1 Vehicle | 31 (13.2%) | 37 (17.9%) |
| 2 Vehicles | 82 (34.9%) | 78 (37.7%) |
| 3 Vehicles | 65 (27.7%) | 17 (8.2%) |
| 4 Vehicles | 17 (7.2%) | 30 (14.5%) |
| 5 or more Vehicles | 29 (12.3%) | 45 (21.7%) |
| Total | 235 (100.0%) | 207 (100.0%) |
Commute Time in Beach
The most frequently occuring commute durations in Beach are less than 5 minutes (117 commuters, 26.8%), 20 to 24 minutes (94 commuters, 21.5%), and 15 to 19 minutes (50 commuters, 11.4%).
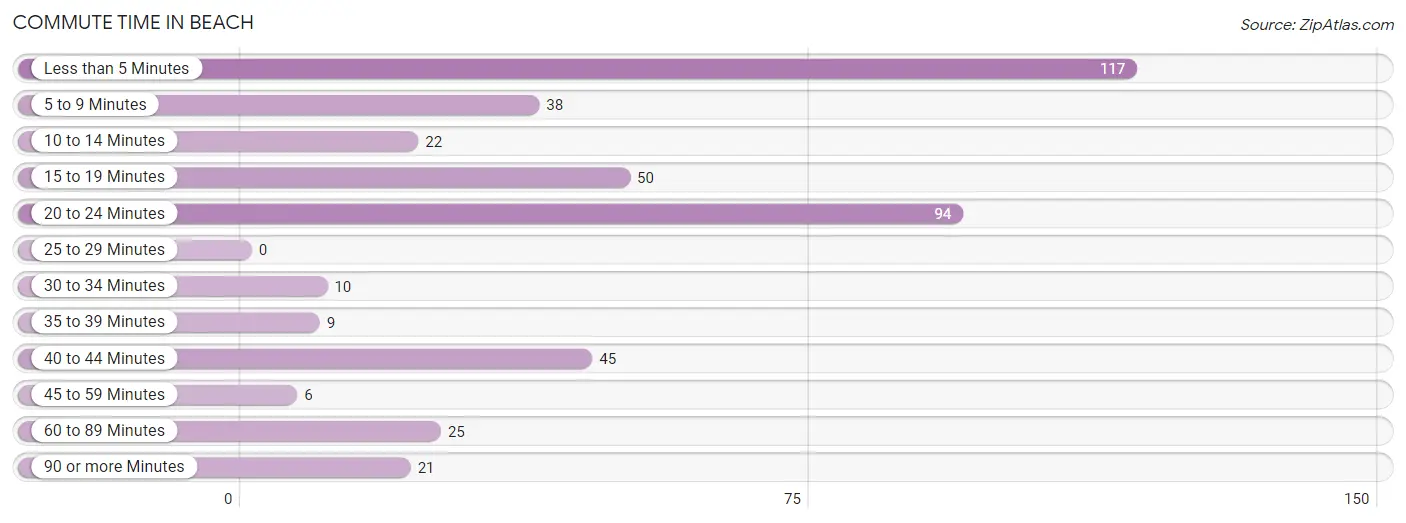
| Commute Time | # Commuters | % Commuters |
| Less than 5 Minutes | 117 | 26.8% |
| 5 to 9 Minutes | 38 | 8.7% |
| 10 to 14 Minutes | 22 | 5.0% |
| 15 to 19 Minutes | 50 | 11.4% |
| 20 to 24 Minutes | 94 | 21.5% |
| 25 to 29 Minutes | 0 | 0.0% |
| 30 to 34 Minutes | 10 | 2.3% |
| 35 to 39 Minutes | 9 | 2.1% |
| 40 to 44 Minutes | 45 | 10.3% |
| 45 to 59 Minutes | 6 | 1.4% |
| 60 to 89 Minutes | 25 | 5.7% |
| 90 or more Minutes | 21 | 4.8% |
Commute Time by Sex in Beach
The most common commute times in Beach are less than 5 minutes (54 commuters, 23.5%) for males and less than 5 minutes (63 commuters, 30.4%) for females.
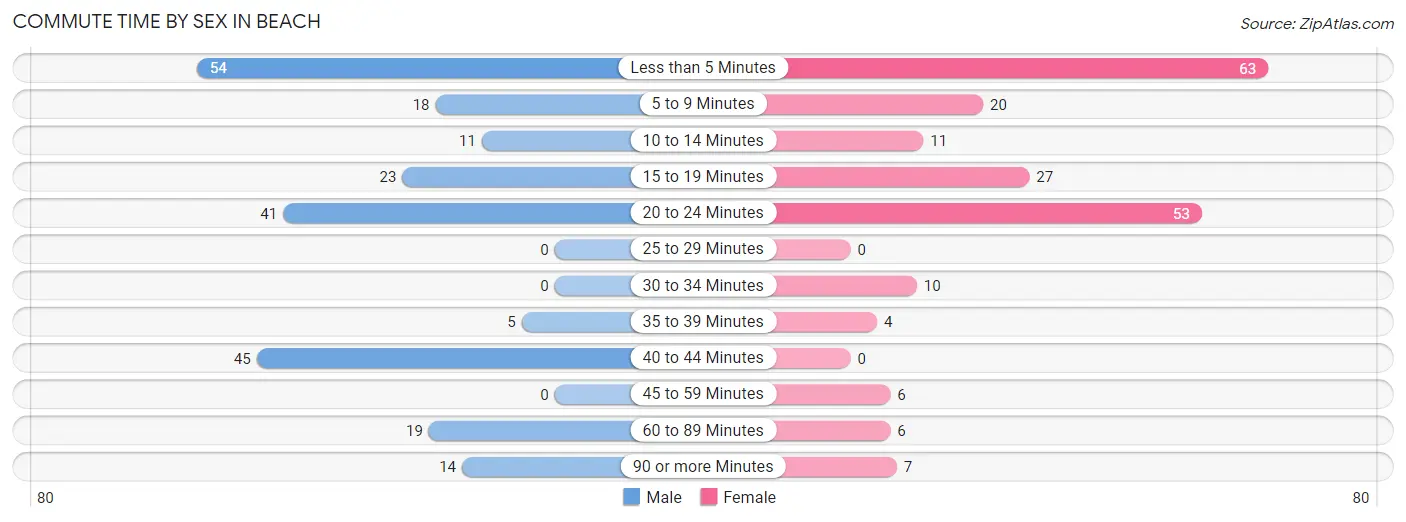
| Commute Time | Male | Female |
| Less than 5 Minutes | 54 (23.5%) | 63 (30.4%) |
| 5 to 9 Minutes | 18 (7.8%) | 20 (9.7%) |
| 10 to 14 Minutes | 11 (4.8%) | 11 (5.3%) |
| 15 to 19 Minutes | 23 (10.0%) | 27 (13.0%) |
| 20 to 24 Minutes | 41 (17.8%) | 53 (25.6%) |
| 25 to 29 Minutes | 0 (0.0%) | 0 (0.0%) |
| 30 to 34 Minutes | 0 (0.0%) | 10 (4.8%) |
| 35 to 39 Minutes | 5 (2.2%) | 4 (1.9%) |
| 40 to 44 Minutes | 45 (19.6%) | 0 (0.0%) |
| 45 to 59 Minutes | 0 (0.0%) | 6 (2.9%) |
| 60 to 89 Minutes | 19 (8.3%) | 6 (2.9%) |
| 90 or more Minutes | 14 (6.1%) | 7 (3.4%) |
Time of Departure to Work by Sex in Beach
The most frequent times of departure to work in Beach are 7:30 AM to 7:59 AM (47, 20.4%) for males and 8:00 AM to 8:29 AM (62, 29.9%) for females.
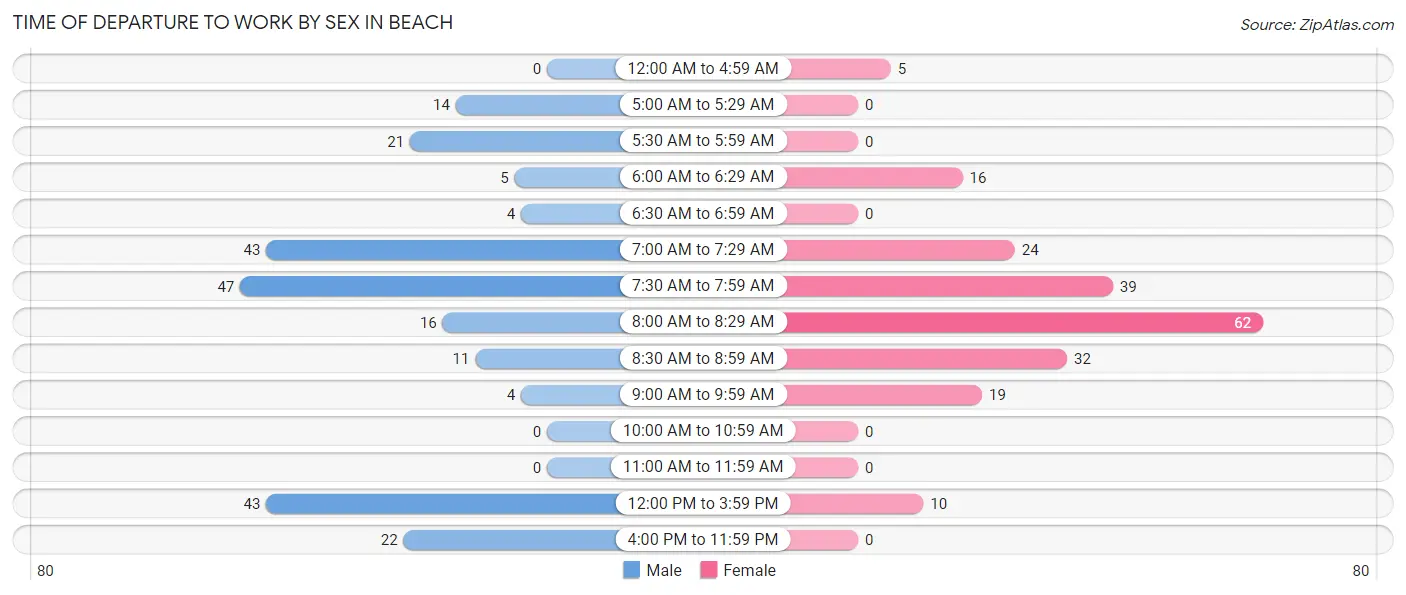
| Time of Departure | Male | Female |
| 12:00 AM to 4:59 AM | 0 (0.0%) | 5 (2.4%) |
| 5:00 AM to 5:29 AM | 14 (6.1%) | 0 (0.0%) |
| 5:30 AM to 5:59 AM | 21 (9.1%) | 0 (0.0%) |
| 6:00 AM to 6:29 AM | 5 (2.2%) | 16 (7.7%) |
| 6:30 AM to 6:59 AM | 4 (1.7%) | 0 (0.0%) |
| 7:00 AM to 7:29 AM | 43 (18.7%) | 24 (11.6%) |
| 7:30 AM to 7:59 AM | 47 (20.4%) | 39 (18.8%) |
| 8:00 AM to 8:29 AM | 16 (7.0%) | 62 (29.9%) |
| 8:30 AM to 8:59 AM | 11 (4.8%) | 32 (15.5%) |
| 9:00 AM to 9:59 AM | 4 (1.7%) | 19 (9.2%) |
| 10:00 AM to 10:59 AM | 0 (0.0%) | 0 (0.0%) |
| 11:00 AM to 11:59 AM | 0 (0.0%) | 0 (0.0%) |
| 12:00 PM to 3:59 PM | 43 (18.7%) | 10 (4.8%) |
| 4:00 PM to 11:59 PM | 22 (9.6%) | 0 (0.0%) |
| Total | 230 (100.0%) | 207 (100.0%) |
Housing Occupancy in Beach
Occupancy by Ownership in Beach
Of the total 372 dwellings in Beach, owner-occupied units account for 251 (67.5%), while renter-occupied units make up 121 (32.5%).
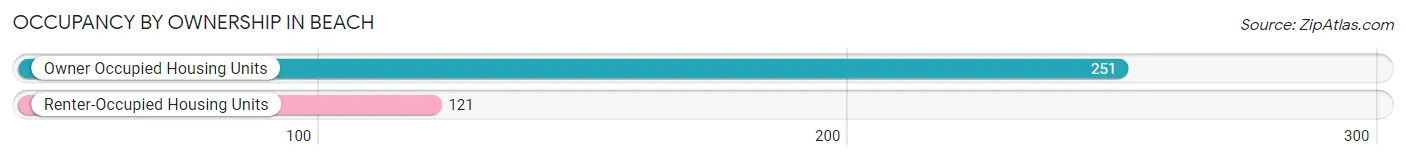
| Occupancy | # Housing Units | % Housing Units |
| Owner Occupied Housing Units | 251 | 67.5% |
| Renter-Occupied Housing Units | 121 | 32.5% |
| Total Occupied Housing Units | 372 | 100.0% |
Occupancy by Household Size in Beach
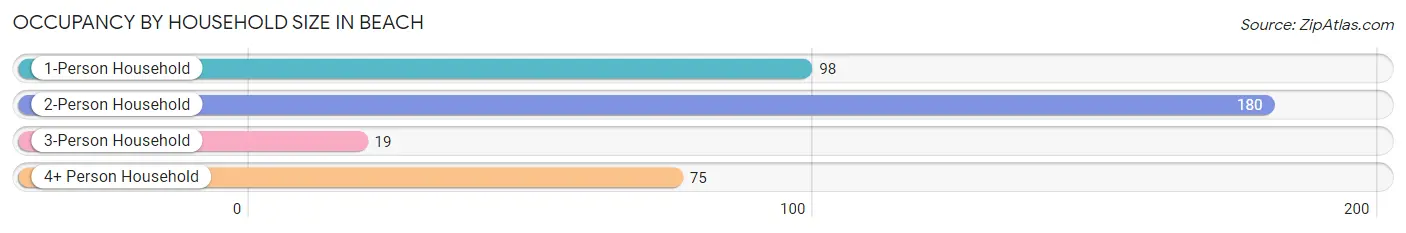
| Household Size | # Housing Units | % Housing Units |
| 1-Person Household | 98 | 26.3% |
| 2-Person Household | 180 | 48.4% |
| 3-Person Household | 19 | 5.1% |
| 4+ Person Household | 75 | 20.2% |
| Total Housing Units | 372 | 100.0% |
Occupancy by Ownership by Household Size in Beach
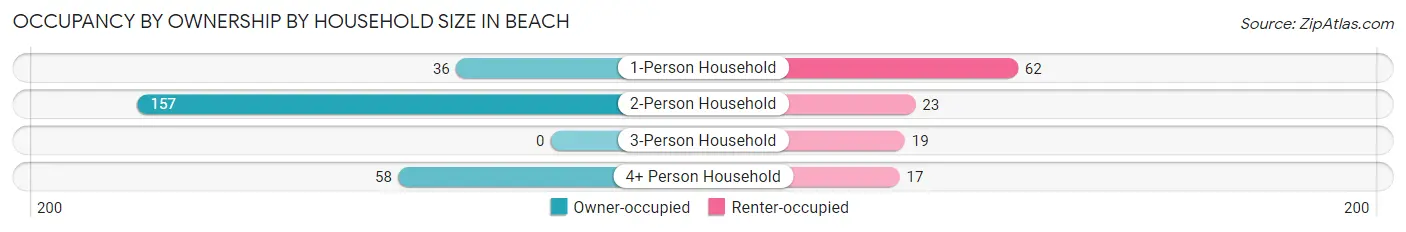
| Household Size | Owner-occupied | Renter-occupied |
| 1-Person Household | 36 (36.7%) | 62 (63.3%) |
| 2-Person Household | 157 (87.2%) | 23 (12.8%) |
| 3-Person Household | 0 (0.0%) | 19 (100.0%) |
| 4+ Person Household | 58 (77.3%) | 17 (22.7%) |
| Total Housing Units | 251 (67.5%) | 121 (32.5%) |
Occupancy by Educational Attainment in Beach
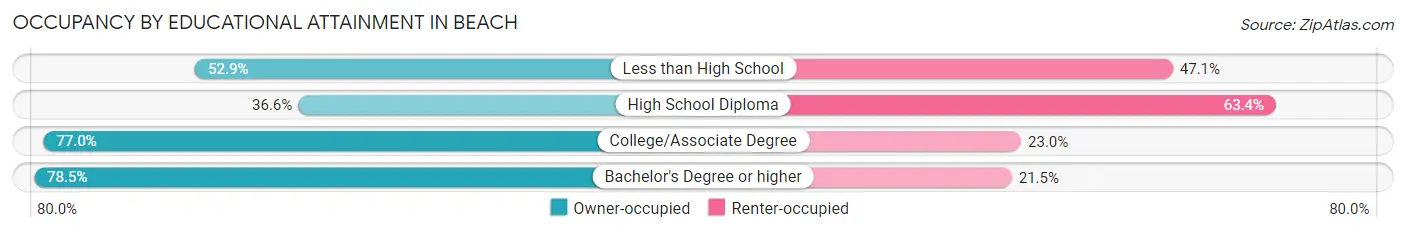
| Household Size | Owner-occupied | Renter-occupied |
| Less than High School | 18 (52.9%) | 16 (47.1%) |
| High School Diploma | 26 (36.6%) | 45 (63.4%) |
| College/Associate Degree | 134 (77.0%) | 40 (23.0%) |
| Bachelor's Degree or higher | 73 (78.5%) | 20 (21.5%) |
Occupancy by Age of Householder in Beach
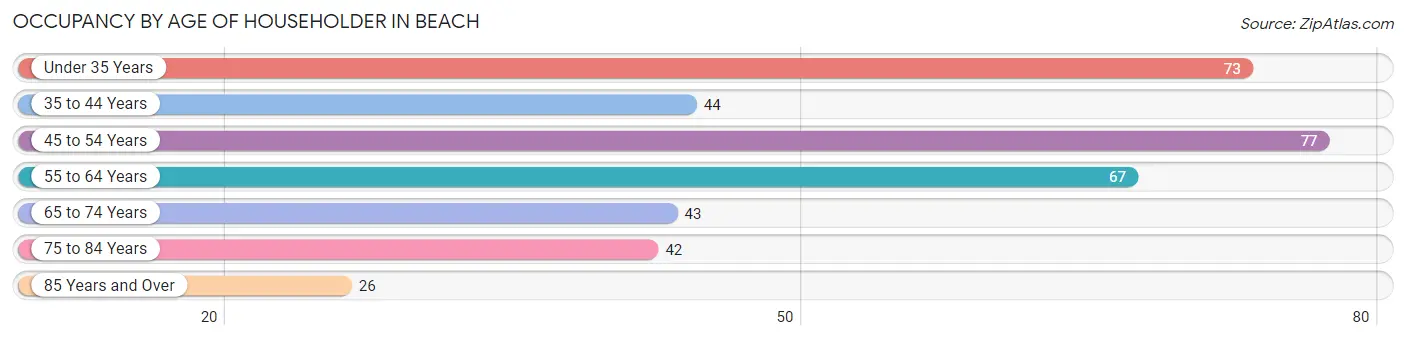
| Age Bracket | # Households | % Households |
| Under 35 Years | 73 | 19.6% |
| 35 to 44 Years | 44 | 11.8% |
| 45 to 54 Years | 77 | 20.7% |
| 55 to 64 Years | 67 | 18.0% |
| 65 to 74 Years | 43 | 11.6% |
| 75 to 84 Years | 42 | 11.3% |
| 85 Years and Over | 26 | 7.0% |
| Total | 372 | 100.0% |
Housing Finances in Beach
Median Income by Occupancy in Beach
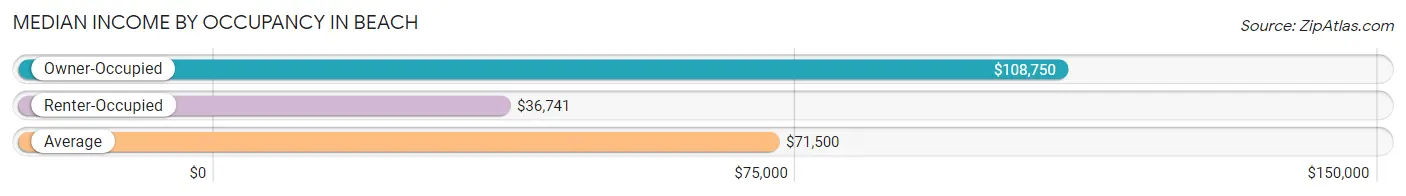
| Occupancy Type | # Households | Median Income |
| Owner-Occupied | 251 (67.5%) | $108,750 |
| Renter-Occupied | 121 (32.5%) | $36,741 |
| Average | 372 (100.0%) | $71,500 |
Occupancy by Householder Income Bracket in Beach
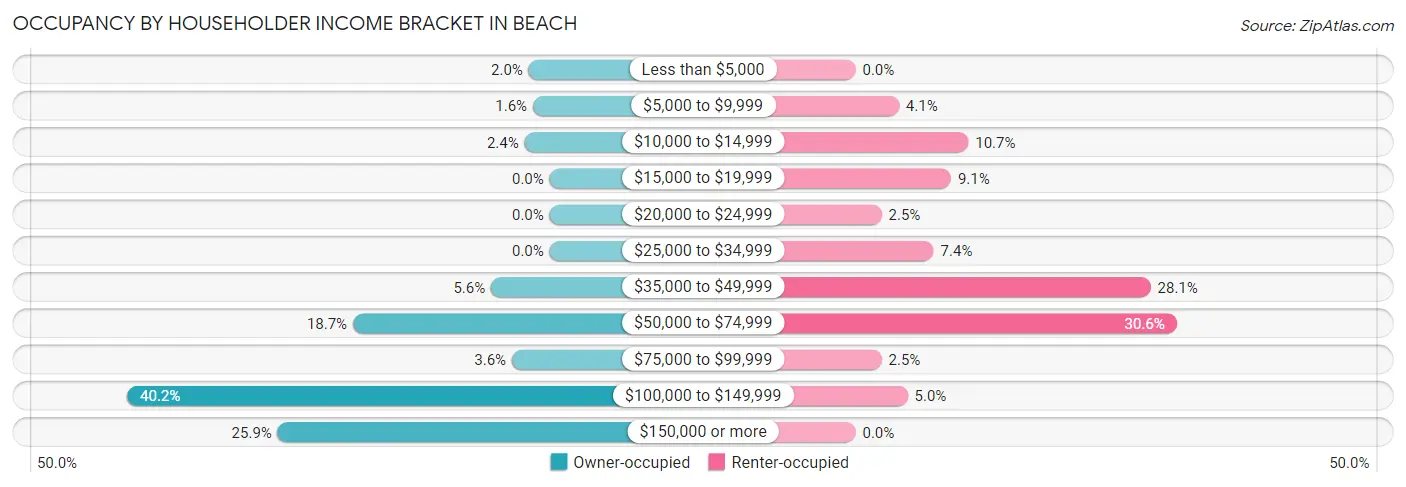
| Income Bracket | Owner-occupied | Renter-occupied |
| Less than $5,000 | 5 (2.0%) | 0 (0.0%) |
| $5,000 to $9,999 | 4 (1.6%) | 5 (4.1%) |
| $10,000 to $14,999 | 6 (2.4%) | 13 (10.7%) |
| $15,000 to $19,999 | 0 (0.0%) | 11 (9.1%) |
| $20,000 to $24,999 | 0 (0.0%) | 3 (2.5%) |
| $25,000 to $34,999 | 0 (0.0%) | 9 (7.4%) |
| $35,000 to $49,999 | 14 (5.6%) | 34 (28.1%) |
| $50,000 to $74,999 | 47 (18.7%) | 37 (30.6%) |
| $75,000 to $99,999 | 9 (3.6%) | 3 (2.5%) |
| $100,000 to $149,999 | 101 (40.2%) | 6 (5.0%) |
| $150,000 or more | 65 (25.9%) | 0 (0.0%) |
| Total | 251 (100.0%) | 121 (100.0%) |
Monthly Housing Cost Tiers in Beach
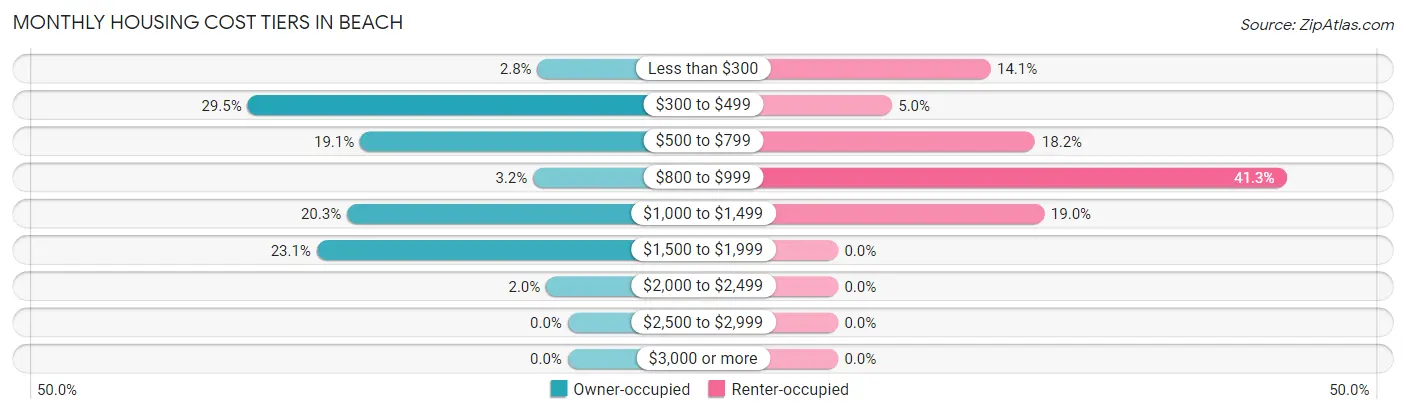
| Monthly Cost | Owner-occupied | Renter-occupied |
| Less than $300 | 7 (2.8%) | 17 (14.1%) |
| $300 to $499 | 74 (29.5%) | 6 (5.0%) |
| $500 to $799 | 48 (19.1%) | 22 (18.2%) |
| $800 to $999 | 8 (3.2%) | 50 (41.3%) |
| $1,000 to $1,499 | 51 (20.3%) | 23 (19.0%) |
| $1,500 to $1,999 | 58 (23.1%) | 0 (0.0%) |
| $2,000 to $2,499 | 5 (2.0%) | 0 (0.0%) |
| $2,500 to $2,999 | 0 (0.0%) | 0 (0.0%) |
| $3,000 or more | 0 (0.0%) | 0 (0.0%) |
| Total | 251 (100.0%) | 121 (100.0%) |
Physical Housing Characteristics in Beach
Housing Structures in Beach
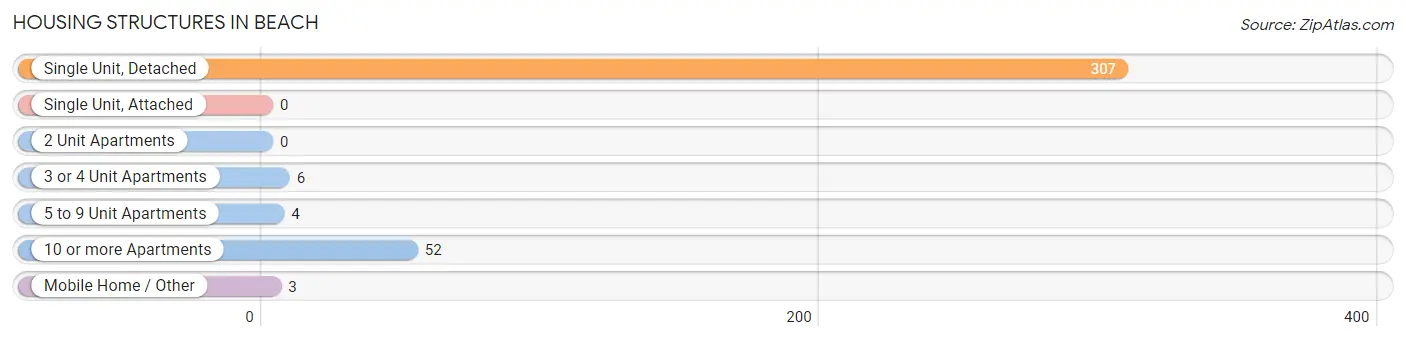
| Structure Type | # Housing Units | % Housing Units |
| Single Unit, Detached | 307 | 82.5% |
| Single Unit, Attached | 0 | 0.0% |
| 2 Unit Apartments | 0 | 0.0% |
| 3 or 4 Unit Apartments | 6 | 1.6% |
| 5 to 9 Unit Apartments | 4 | 1.1% |
| 10 or more Apartments | 52 | 14.0% |
| Mobile Home / Other | 3 | 0.8% |
| Total | 372 | 100.0% |
Housing Structures by Occupancy in Beach
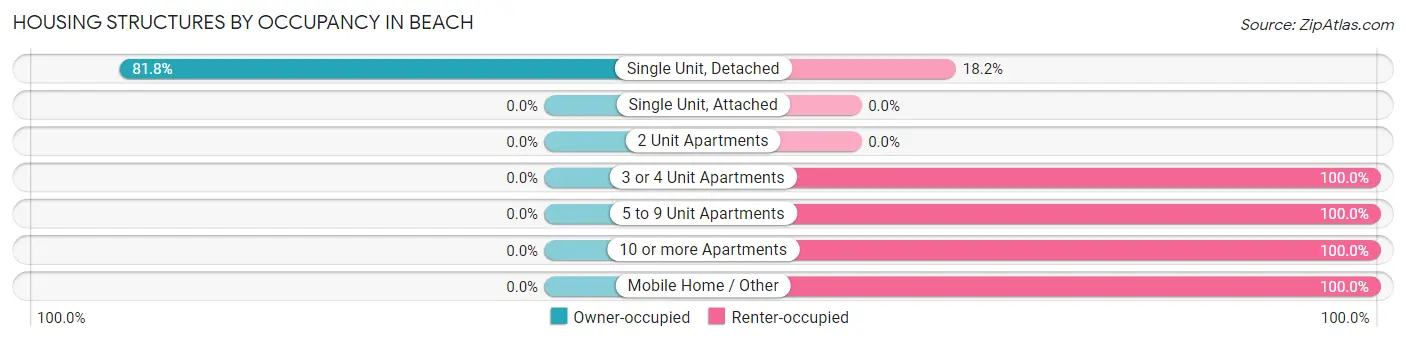
| Structure Type | Owner-occupied | Renter-occupied |
| Single Unit, Detached | 251 (81.8%) | 56 (18.2%) |
| Single Unit, Attached | 0 (0.0%) | 0 (0.0%) |
| 2 Unit Apartments | 0 (0.0%) | 0 (0.0%) |
| 3 or 4 Unit Apartments | 0 (0.0%) | 6 (100.0%) |
| 5 to 9 Unit Apartments | 0 (0.0%) | 4 (100.0%) |
| 10 or more Apartments | 0 (0.0%) | 52 (100.0%) |
| Mobile Home / Other | 0 (0.0%) | 3 (100.0%) |
| Total | 251 (67.5%) | 121 (32.5%) |
Housing Structures by Number of Rooms in Beach
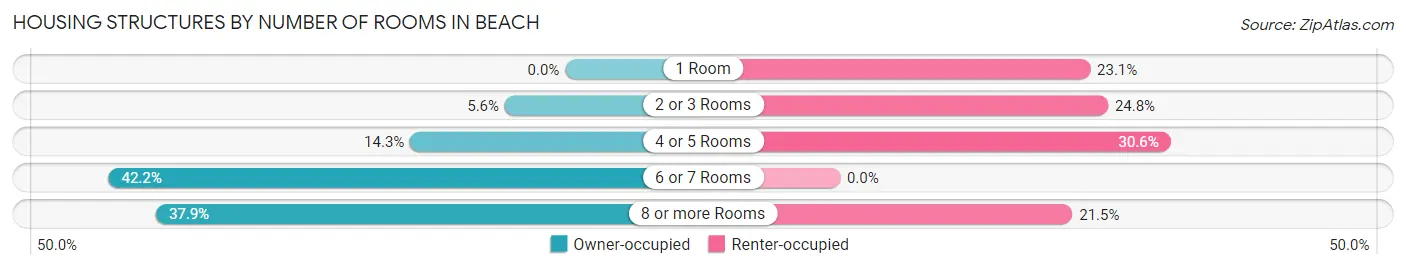
| Number of Rooms | Owner-occupied | Renter-occupied |
| 1 Room | 0 (0.0%) | 28 (23.1%) |
| 2 or 3 Rooms | 14 (5.6%) | 30 (24.8%) |
| 4 or 5 Rooms | 36 (14.3%) | 37 (30.6%) |
| 6 or 7 Rooms | 106 (42.2%) | 0 (0.0%) |
| 8 or more Rooms | 95 (37.9%) | 26 (21.5%) |
| Total | 251 (100.0%) | 121 (100.0%) |
Housing Structure by Heating Type in Beach
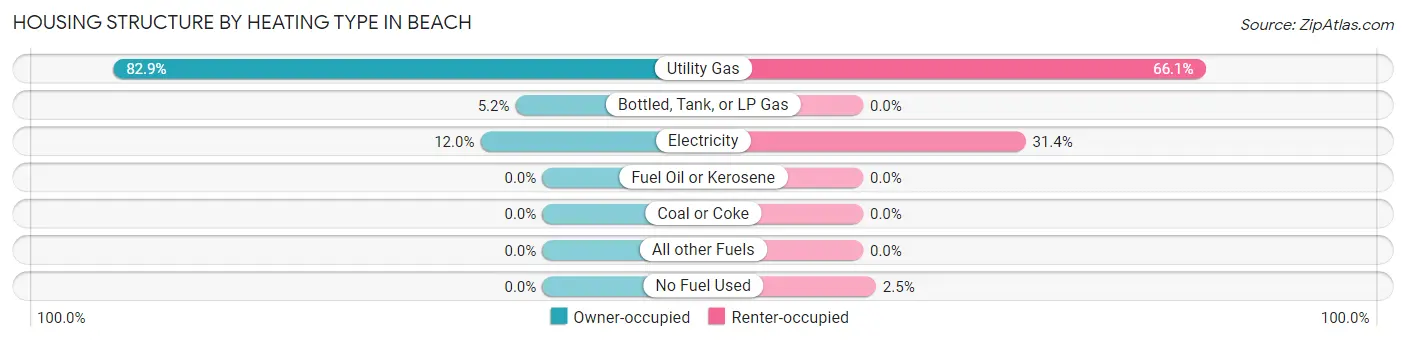
| Heating Type | Owner-occupied | Renter-occupied |
| Utility Gas | 208 (82.9%) | 80 (66.1%) |
| Bottled, Tank, or LP Gas | 13 (5.2%) | 0 (0.0%) |
| Electricity | 30 (11.9%) | 38 (31.4%) |
| Fuel Oil or Kerosene | 0 (0.0%) | 0 (0.0%) |
| Coal or Coke | 0 (0.0%) | 0 (0.0%) |
| All other Fuels | 0 (0.0%) | 0 (0.0%) |
| No Fuel Used | 0 (0.0%) | 3 (2.5%) |
| Total | 251 (100.0%) | 121 (100.0%) |
Household Vehicle Usage in Beach
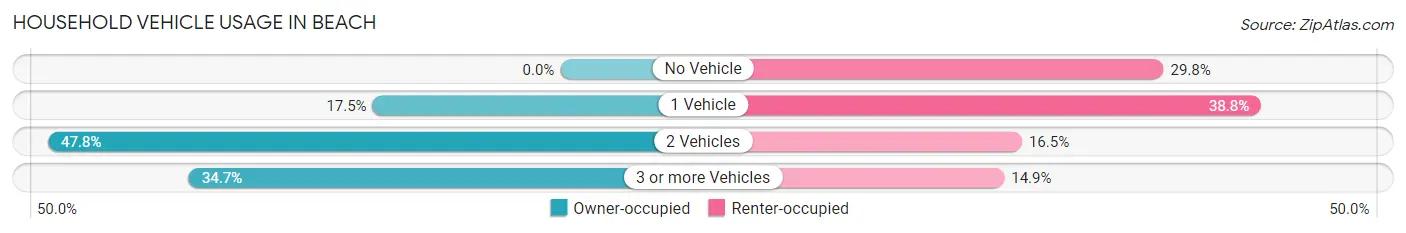
| Vehicles per Household | Owner-occupied | Renter-occupied |
| No Vehicle | 0 (0.0%) | 36 (29.7%) |
| 1 Vehicle | 44 (17.5%) | 47 (38.8%) |
| 2 Vehicles | 120 (47.8%) | 20 (16.5%) |
| 3 or more Vehicles | 87 (34.7%) | 18 (14.9%) |
| Total | 251 (100.0%) | 121 (100.0%) |
Real Estate & Mortgages in Beach
Real Estate and Mortgage Overview in Beach
| Characteristic | Without Mortgage | With Mortgage |
| Housing Units | 110 | 141 |
| Median Property Value | $137,500 | $163,900 |
| Median Household Income | $113,929 | $41 |
| Monthly Housing Costs | $458 | $0 |
| Real Estate Taxes | $1,195 | $0 |
Property Value by Mortgage Status in Beach
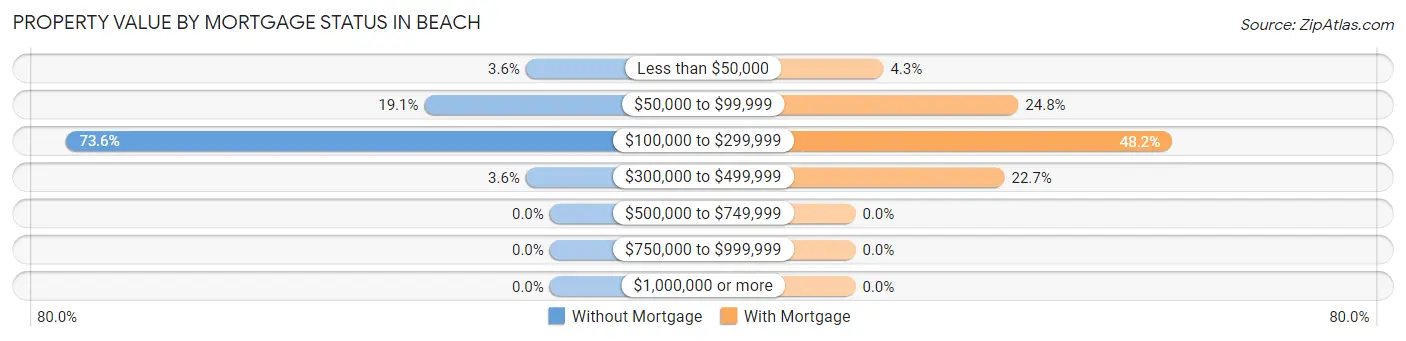
| Property Value | Without Mortgage | With Mortgage |
| Less than $50,000 | 4 (3.6%) | 6 (4.3%) |
| $50,000 to $99,999 | 21 (19.1%) | 35 (24.8%) |
| $100,000 to $299,999 | 81 (73.6%) | 68 (48.2%) |
| $300,000 to $499,999 | 4 (3.6%) | 32 (22.7%) |
| $500,000 to $749,999 | 0 (0.0%) | 0 (0.0%) |
| $750,000 to $999,999 | 0 (0.0%) | 0 (0.0%) |
| $1,000,000 or more | 0 (0.0%) | 0 (0.0%) |
| Total | 110 (100.0%) | 141 (100.0%) |
Household Income by Mortgage Status in Beach
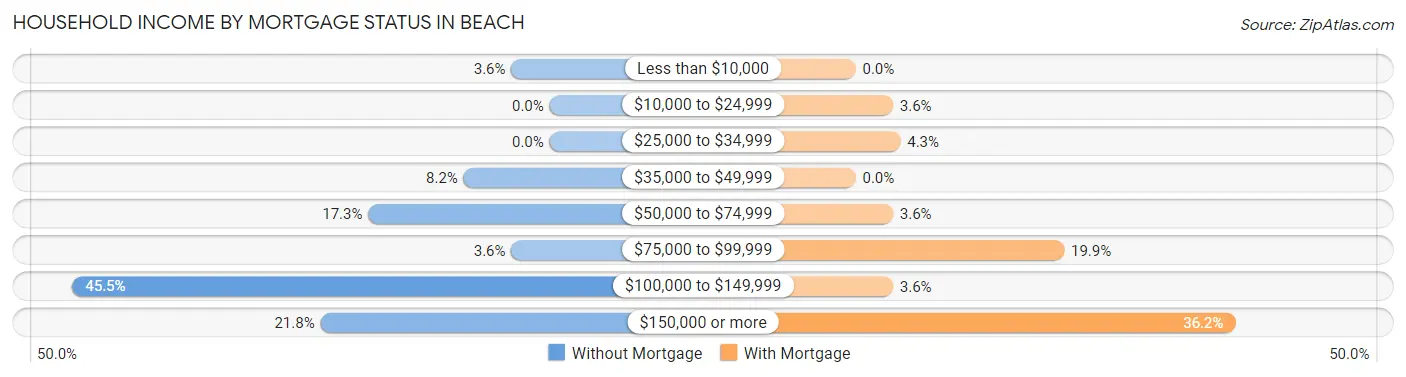
| Household Income | Without Mortgage | With Mortgage |
| Less than $10,000 | 4 (3.6%) | 0 (0.0%) |
| $10,000 to $24,999 | 0 (0.0%) | 5 (3.5%) |
| $25,000 to $34,999 | 0 (0.0%) | 6 (4.3%) |
| $35,000 to $49,999 | 9 (8.2%) | 0 (0.0%) |
| $50,000 to $74,999 | 19 (17.3%) | 5 (3.5%) |
| $75,000 to $99,999 | 4 (3.6%) | 28 (19.9%) |
| $100,000 to $149,999 | 50 (45.5%) | 5 (3.5%) |
| $150,000 or more | 24 (21.8%) | 51 (36.2%) |
| Total | 110 (100.0%) | 141 (100.0%) |
Property Value to Household Income Ratio in Beach
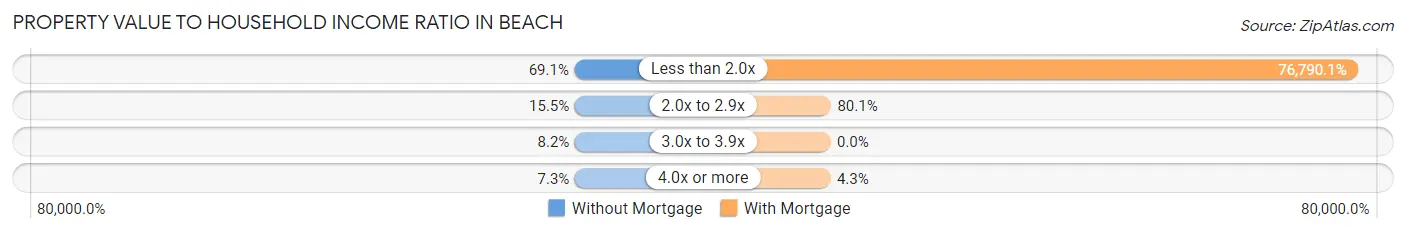
| Value-to-Income Ratio | Without Mortgage | With Mortgage |
| Less than 2.0x | 76 (69.1%) | 108,274 (76,790.1%) |
| 2.0x to 2.9x | 17 (15.4%) | 113 (80.1%) |
| 3.0x to 3.9x | 9 (8.2%) | 0 (0.0%) |
| 4.0x or more | 8 (7.3%) | 6 (4.3%) |
| Total | 110 (100.0%) | 141 (100.0%) |
Real Estate Taxes by Mortgage Status in Beach
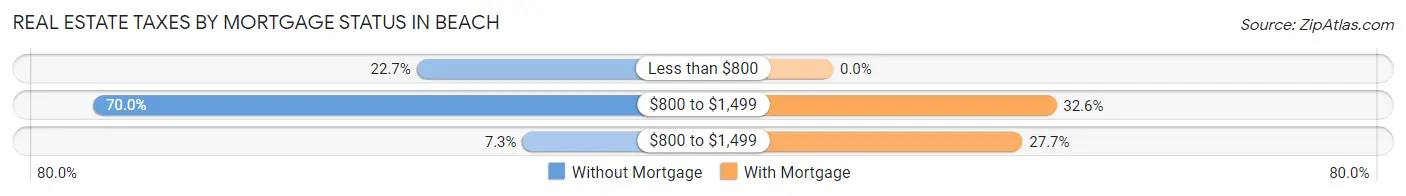
| Property Taxes | Without Mortgage | With Mortgage |
| Less than $800 | 25 (22.7%) | 0 (0.0%) |
| $800 to $1,499 | 77 (70.0%) | 46 (32.6%) |
| $800 to $1,499 | 8 (7.3%) | 39 (27.7%) |
| Total | 110 (100.0%) | 141 (100.0%) |
Health & Disability in Beach
Health Insurance Coverage by Age in Beach
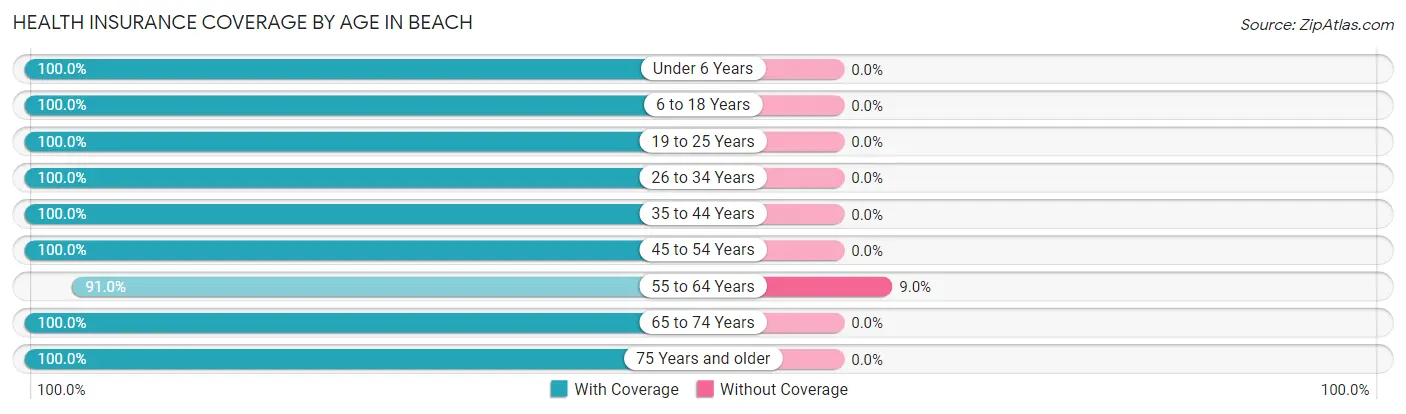
| Age Bracket | With Coverage | Without Coverage |
| Under 6 Years | 100 (100.0%) | 0 (0.0%) |
| 6 to 18 Years | 172 (100.0%) | 0 (0.0%) |
| 19 to 25 Years | 23 (100.0%) | 0 (0.0%) |
| 26 to 34 Years | 154 (100.0%) | 0 (0.0%) |
| 35 to 44 Years | 92 (100.0%) | 0 (0.0%) |
| 45 to 54 Years | 131 (100.0%) | 0 (0.0%) |
| 55 to 64 Years | 122 (91.0%) | 12 (9.0%) |
| 65 to 74 Years | 73 (100.0%) | 0 (0.0%) |
| 75 Years and older | 78 (100.0%) | 0 (0.0%) |
| Total | 945 (98.8%) | 12 (1.3%) |
Health Insurance Coverage by Citizenship Status in Beach
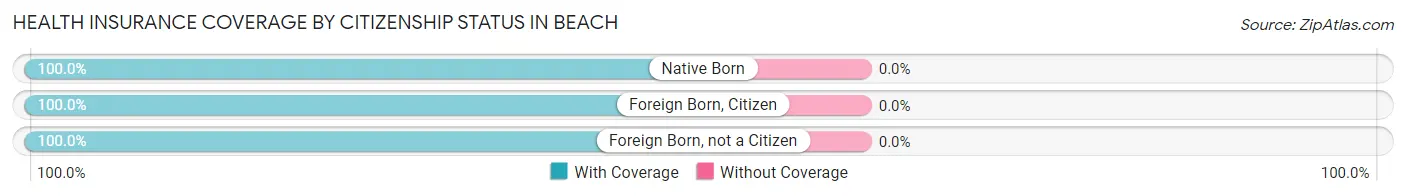
| Citizenship Status | With Coverage | Without Coverage |
| Native Born | 100 (100.0%) | 0 (0.0%) |
| Foreign Born, Citizen | 172 (100.0%) | 0 (0.0%) |
| Foreign Born, not a Citizen | 23 (100.0%) | 0 (0.0%) |
Health Insurance Coverage by Household Income in Beach
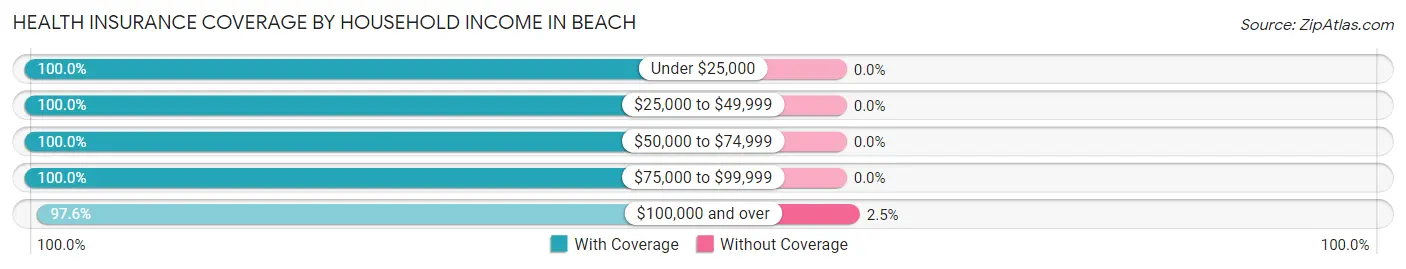
| Household Income | With Coverage | Without Coverage |
| Under $25,000 | 71 (100.0%) | 0 (0.0%) |
| $25,000 to $49,999 | 160 (100.0%) | 0 (0.0%) |
| $50,000 to $74,999 | 162 (100.0%) | 0 (0.0%) |
| $75,000 to $99,999 | 38 (100.0%) | 0 (0.0%) |
| $100,000 and over | 478 (97.6%) | 12 (2.5%) |
Public vs Private Health Insurance Coverage by Age in Beach
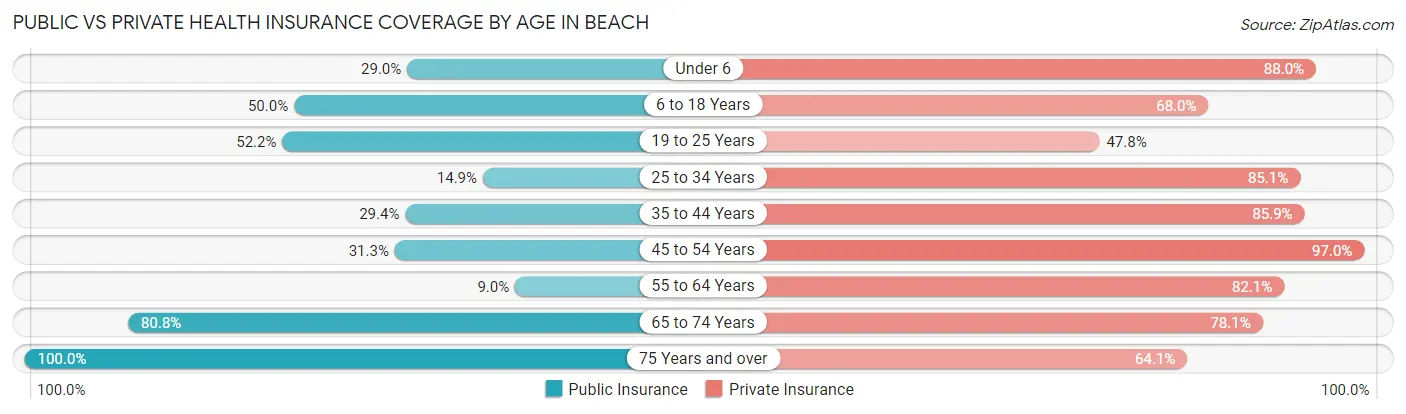
| Age Bracket | Public Insurance | Private Insurance |
| Under 6 | 29 (29.0%) | 88 (88.0%) |
| 6 to 18 Years | 86 (50.0%) | 117 (68.0%) |
| 19 to 25 Years | 12 (52.2%) | 11 (47.8%) |
| 25 to 34 Years | 23 (14.9%) | 131 (85.1%) |
| 35 to 44 Years | 27 (29.3%) | 79 (85.9%) |
| 45 to 54 Years | 41 (31.3%) | 127 (97.0%) |
| 55 to 64 Years | 12 (9.0%) | 110 (82.1%) |
| 65 to 74 Years | 59 (80.8%) | 57 (78.1%) |
| 75 Years and over | 78 (100.0%) | 50 (64.1%) |
| Total | 367 (38.4%) | 770 (80.5%) |
Disability Status by Sex by Age in Beach
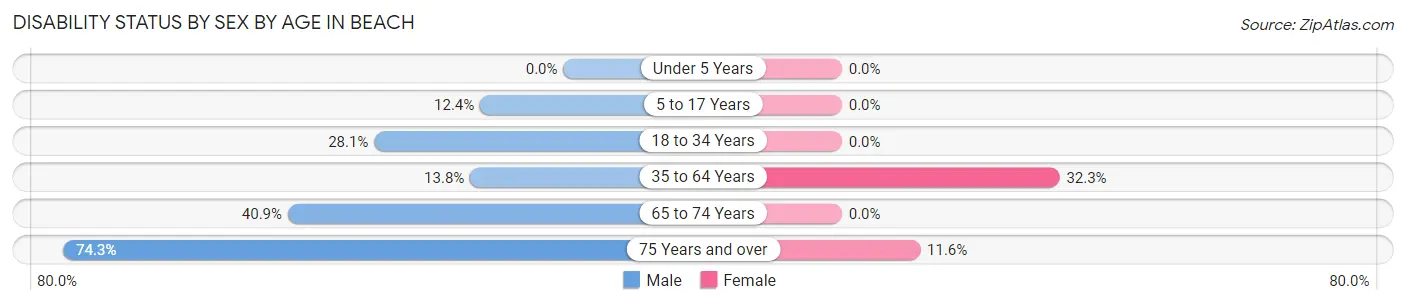
| Age Bracket | Male | Female |
| Under 5 Years | 0 (0.0%) | 0 (0.0%) |
| 5 to 17 Years | 11 (12.4%) | 0 (0.0%) |
| 18 to 34 Years | 25 (28.1%) | 0 (0.0%) |
| 35 to 64 Years | 22 (13.8%) | 64 (32.3%) |
| 65 to 74 Years | 18 (40.9%) | 0 (0.0%) |
| 75 Years and over | 26 (74.3%) | 5 (11.6%) |
Disability Class by Sex by Age in Beach
Disability Class: Hearing Difficulty
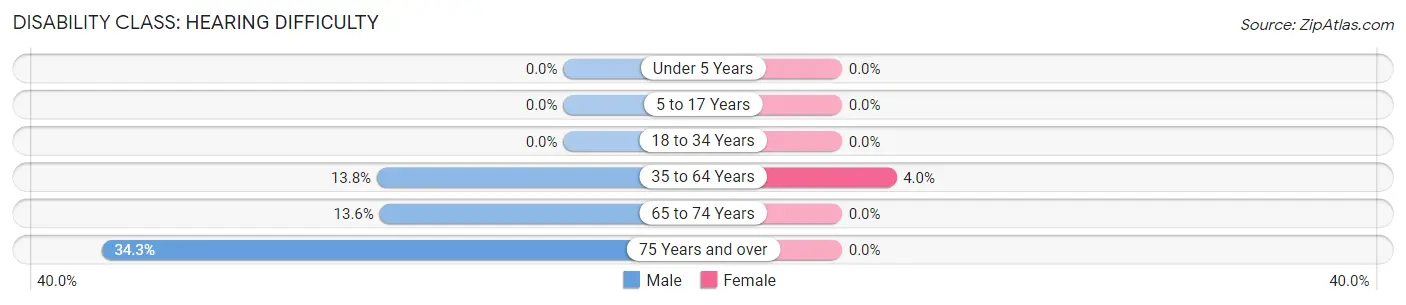
| Age Bracket | Male | Female |
| Under 5 Years | 0 (0.0%) | 0 (0.0%) |
| 5 to 17 Years | 0 (0.0%) | 0 (0.0%) |
| 18 to 34 Years | 0 (0.0%) | 0 (0.0%) |
| 35 to 64 Years | 22 (13.8%) | 8 (4.0%) |
| 65 to 74 Years | 6 (13.6%) | 0 (0.0%) |
| 75 Years and over | 12 (34.3%) | 0 (0.0%) |
Disability Class: Vision Difficulty
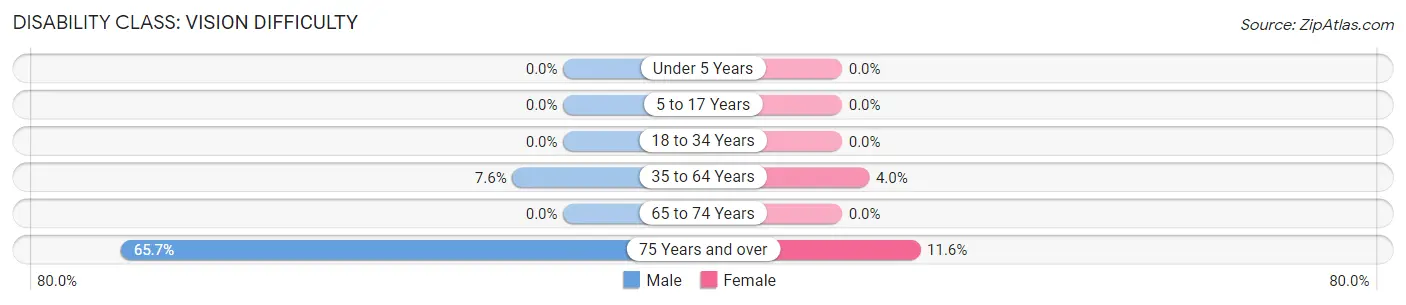
| Age Bracket | Male | Female |
| Under 5 Years | 0 (0.0%) | 0 (0.0%) |
| 5 to 17 Years | 0 (0.0%) | 0 (0.0%) |
| 18 to 34 Years | 0 (0.0%) | 0 (0.0%) |
| 35 to 64 Years | 12 (7.5%) | 8 (4.0%) |
| 65 to 74 Years | 0 (0.0%) | 0 (0.0%) |
| 75 Years and over | 23 (65.7%) | 5 (11.6%) |
Disability Class: Cognitive Difficulty
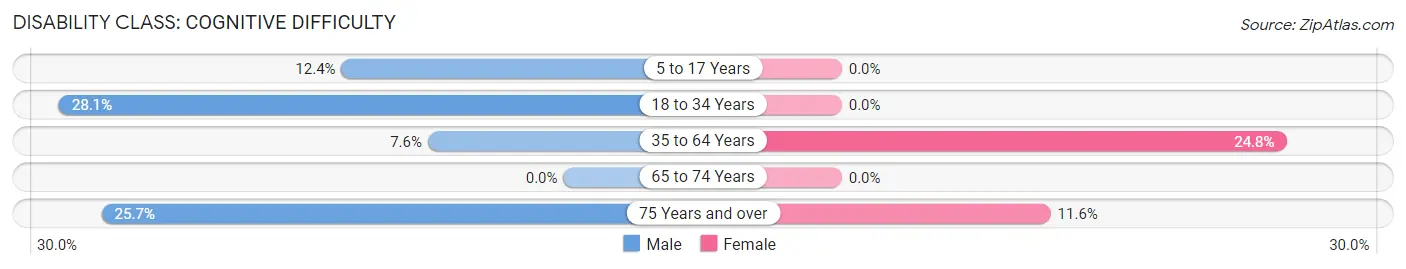
| Age Bracket | Male | Female |
| 5 to 17 Years | 11 (12.4%) | 0 (0.0%) |
| 18 to 34 Years | 25 (28.1%) | 0 (0.0%) |
| 35 to 64 Years | 12 (7.5%) | 49 (24.7%) |
| 65 to 74 Years | 0 (0.0%) | 0 (0.0%) |
| 75 Years and over | 9 (25.7%) | 5 (11.6%) |
Disability Class: Ambulatory Difficulty
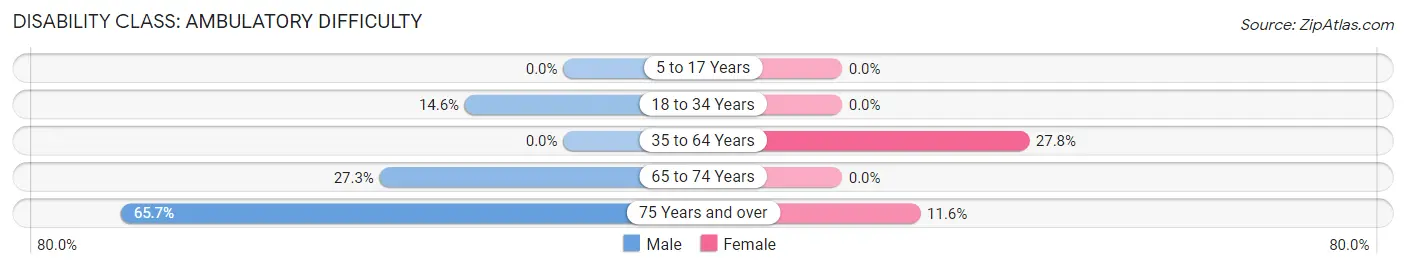
| Age Bracket | Male | Female |
| 5 to 17 Years | 0 (0.0%) | 0 (0.0%) |
| 18 to 34 Years | 13 (14.6%) | 0 (0.0%) |
| 35 to 64 Years | 0 (0.0%) | 55 (27.8%) |
| 65 to 74 Years | 12 (27.3%) | 0 (0.0%) |
| 75 Years and over | 23 (65.7%) | 5 (11.6%) |
Disability Class: Self-Care Difficulty
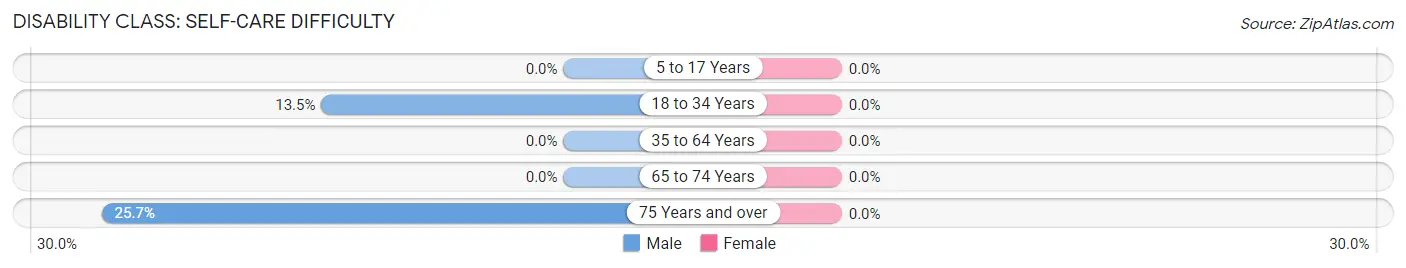
| Age Bracket | Male | Female |
| 5 to 17 Years | 0 (0.0%) | 0 (0.0%) |
| 18 to 34 Years | 12 (13.5%) | 0 (0.0%) |
| 35 to 64 Years | 0 (0.0%) | 0 (0.0%) |
| 65 to 74 Years | 0 (0.0%) | 0 (0.0%) |
| 75 Years and over | 9 (25.7%) | 0 (0.0%) |
Technology Access in Beach
Computing Device Access in Beach
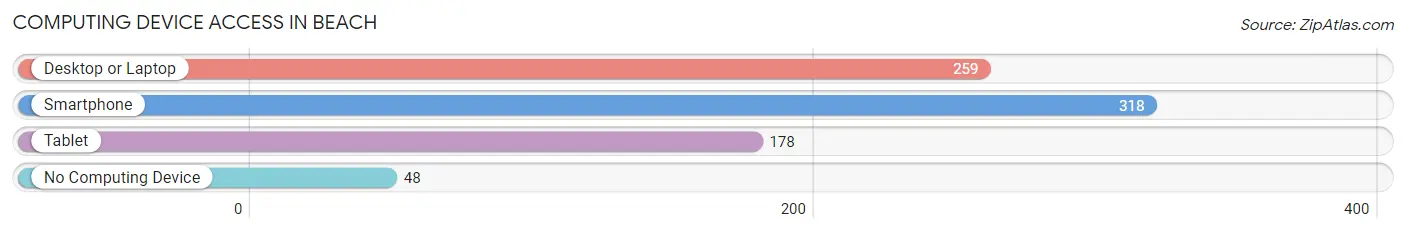
| Device Type | # Households | % Households |
| Desktop or Laptop | 259 | 69.6% |
| Smartphone | 318 | 85.5% |
| Tablet | 178 | 47.8% |
| No Computing Device | 48 | 12.9% |
| Total | 372 | 100.0% |
Internet Access in Beach
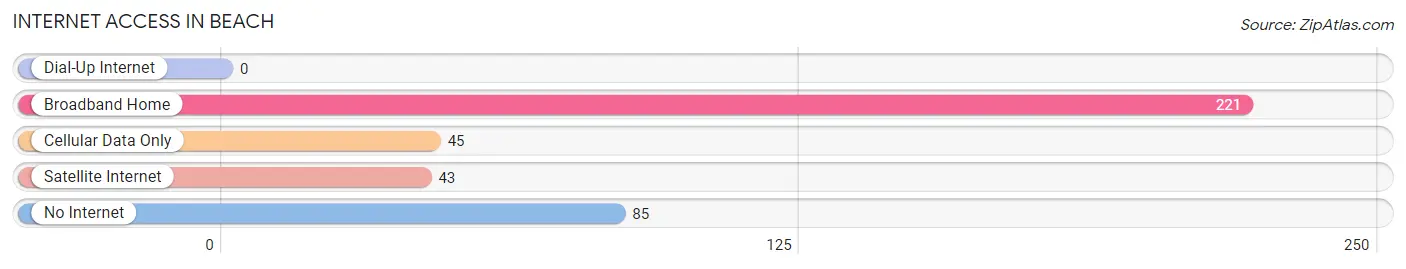
| Internet Type | # Households | % Households |
| Dial-Up Internet | 0 | 0.0% |
| Broadband Home | 221 | 59.4% |
| Cellular Data Only | 45 | 12.1% |
| Satellite Internet | 43 | 11.6% |
| No Internet | 85 | 22.9% |
| Total | 372 | 100.0% |
Beach Summary
Beach, North Dakota is a small city located in the western part of the state, in Golden Valley County. It is situated on the banks of the Missouri River, and is the county seat of Golden Valley County. The city has a population of 1,845 people, according to the 2010 census.
Geography
Beach is located in the western part of North Dakota, in Golden Valley County. It is situated on the banks of the Missouri River, and is the county seat of Golden Valley County. The city has a total area of 1.2 square miles, all of which is land. The city is located at an elevation of 2,845 feet above sea level.
The climate in Beach is semi-arid, with hot summers and cold winters. The average temperature in the summer is around 80 degrees Fahrenheit, and the average temperature in the winter is around 10 degrees Fahrenheit. The average annual precipitation is around 16 inches.
Economy
The economy of Beach is largely based on agriculture and tourism. The city is home to several farms, which produce a variety of crops, including wheat, corn, and soybeans. The city also has a number of tourist attractions, including the Golden Valley County Museum, the Beach Historical Society, and the Beach Golf Course.
The city also has a number of businesses, including restaurants, retail stores, and service providers. The city is home to a number of manufacturing companies, including a furniture factory, a plastics factory, and a metal fabrication plant.
Demographics
As of the 2010 census, the population of Beach was 1,845 people. The racial makeup of the city was 97.3% White, 0.2% African American, 0.2% Native American, 0.2% Asian, 0.1% Pacific Islander, 0.7% from other races, and 1.3% from two or more races. Hispanic or Latino of any race were 1.7% of the population.
The median income for a household in Beach was $37,917, and the median income for a family was $45,625. The per capita income for the city was $18,945. About 11.2% of families and 14.2% of the population were below the poverty line, including 18.2% of those under age 18 and 8.3% of those age 65 or over.
Beach is served by the Golden Valley County School District, which includes Beach Elementary School, Beach Middle School, and Beach High School. The city is also home to a number of churches, including the Beach United Methodist Church, the Beach Lutheran Church, and the Beach Baptist Church.
Common Questions
What is Per Capita Income in Beach?
Per Capita income in Beach is $34,875.
What is the Median Family Income in Beach?
Median Family Income in Beach is $102,167.
What is the Median Household income in Beach?
Median Household Income in Beach is $71,500.
What is Income or Wage Gap in Beach?
Income or Wage Gap in Beach is 45.8%.
Women in Beach earn 54.2 cents for every dollar earned by a man.
What is Inequality or Gini Index in Beach?
Inequality or Gini Index in Beach is 0.37.
What is the Total Population of Beach?
Total Population of Beach is 957.
What is the Total Male Population of Beach?
Total Male Population of Beach is 473.
What is the Total Female Population of Beach?
Total Female Population of Beach is 484.
What is the Ratio of Males per 100 Females in Beach?
There are 97.73 Males per 100 Females in Beach.
What is the Ratio of Females per 100 Males in Beach?
There are 102.33 Females per 100 Males in Beach.
What is the Median Population Age in Beach?
Median Population Age in Beach is 36.8 Years.
What is the Average Family Size in Beach
Average Family Size in Beach is 2.9 People.
What is the Average Household Size in Beach
Average Household Size in Beach is 2.5 People.
How Large is the Labor Force in Beach?
There are 487 People in the Labor Forcein in Beach.
What is the Percentage of People in the Labor Force in Beach?
66.6% of People are in the Labor Force in Beach.
What is the Unemployment Rate in Beach?
Unemployment Rate in Beach is 8.8%.