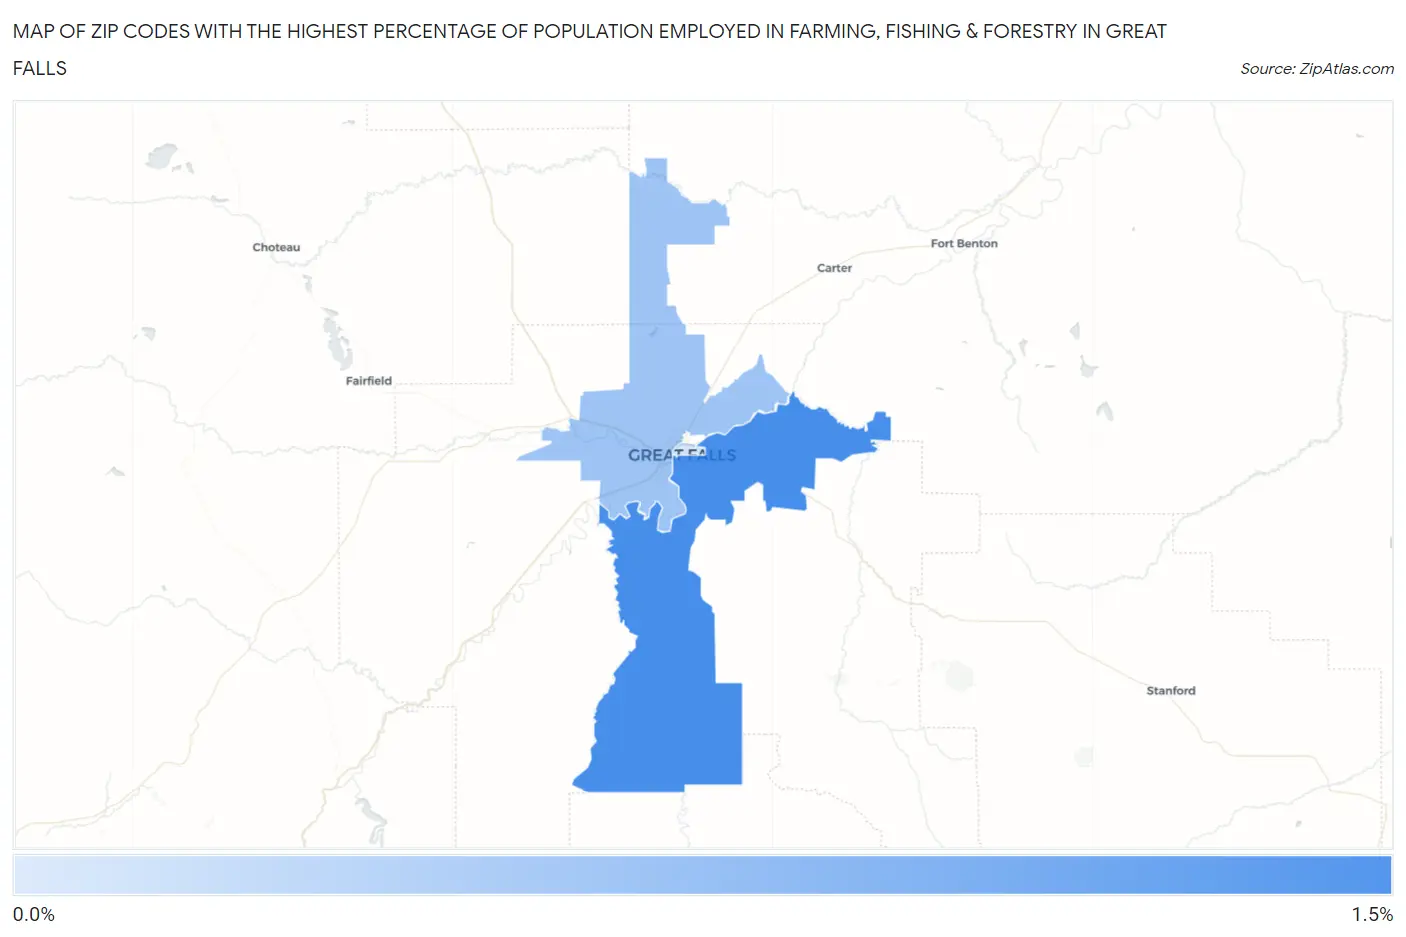
Zip Codes with the Highest Percentage of Population Employed in Farming, Fishing & Forestry in Great Falls, MT
RELATED REPORTS & OPTIONS
Farming, Fishing & Forestry
Great Falls
Compare Zip Codes
Map of Zip Codes with the Highest Percentage of Population Employed in Farming, Fishing & Forestry in Great Falls
0.0%
1.5%
Zip Codes with the Highest Percentage of Population Employed in Farming, Fishing & Forestry in Great Falls, MT
| Zip Code | % Employed | vs State | vs National | |
| 1. | 59405 | 1.1% | 1.7%(-0.569)#226 | 0.61%(+0.488)#9,351 |
| 2. | 59404 | 0.71% | 1.7%(-0.948)#245 | 0.61%(+0.109)#11,282 |
| 3. | 59401 | 0.45% | 1.7%(-1.21)#257 | 0.61%(-0.154)#13,271 |
1
Common Questions
What are the Top Zip Codes with the Highest Percentage of Population Employed in Farming, Fishing & Forestry in Great Falls, MT?
Top Zip Codes with the Highest Percentage of Population Employed in Farming, Fishing & Forestry in Great Falls, MT are:
What zip code has the Highest Percentage of Population Employed in Farming, Fishing & Forestry in Great Falls, MT?
59405 has the Highest Percentage of Population Employed in Farming, Fishing & Forestry in Great Falls, MT with 1.1%.
What is the Percentage of Population Employed in Farming, Fishing & Forestry in Great Falls, MT?
Percentage of Population Employed in Farming, Fishing & Forestry in Great Falls is 0.83%.
What is the Percentage of Population Employed in Farming, Fishing & Forestry in Montana?
Percentage of Population Employed in Farming, Fishing & Forestry in Montana is 1.7%.
What is the Percentage of Population Employed in Farming, Fishing & Forestry in the United States?
Percentage of Population Employed in Farming, Fishing & Forestry in the United States is 0.61%.