Zip Codes with the Highest Percentage of Population Employed in Agriculture, Fishing & Hunting in Bozeman, MT
RELATED REPORTS & OPTIONS
Agriculture, Fishing & Hunting
Bozeman
Compare Zip Codes
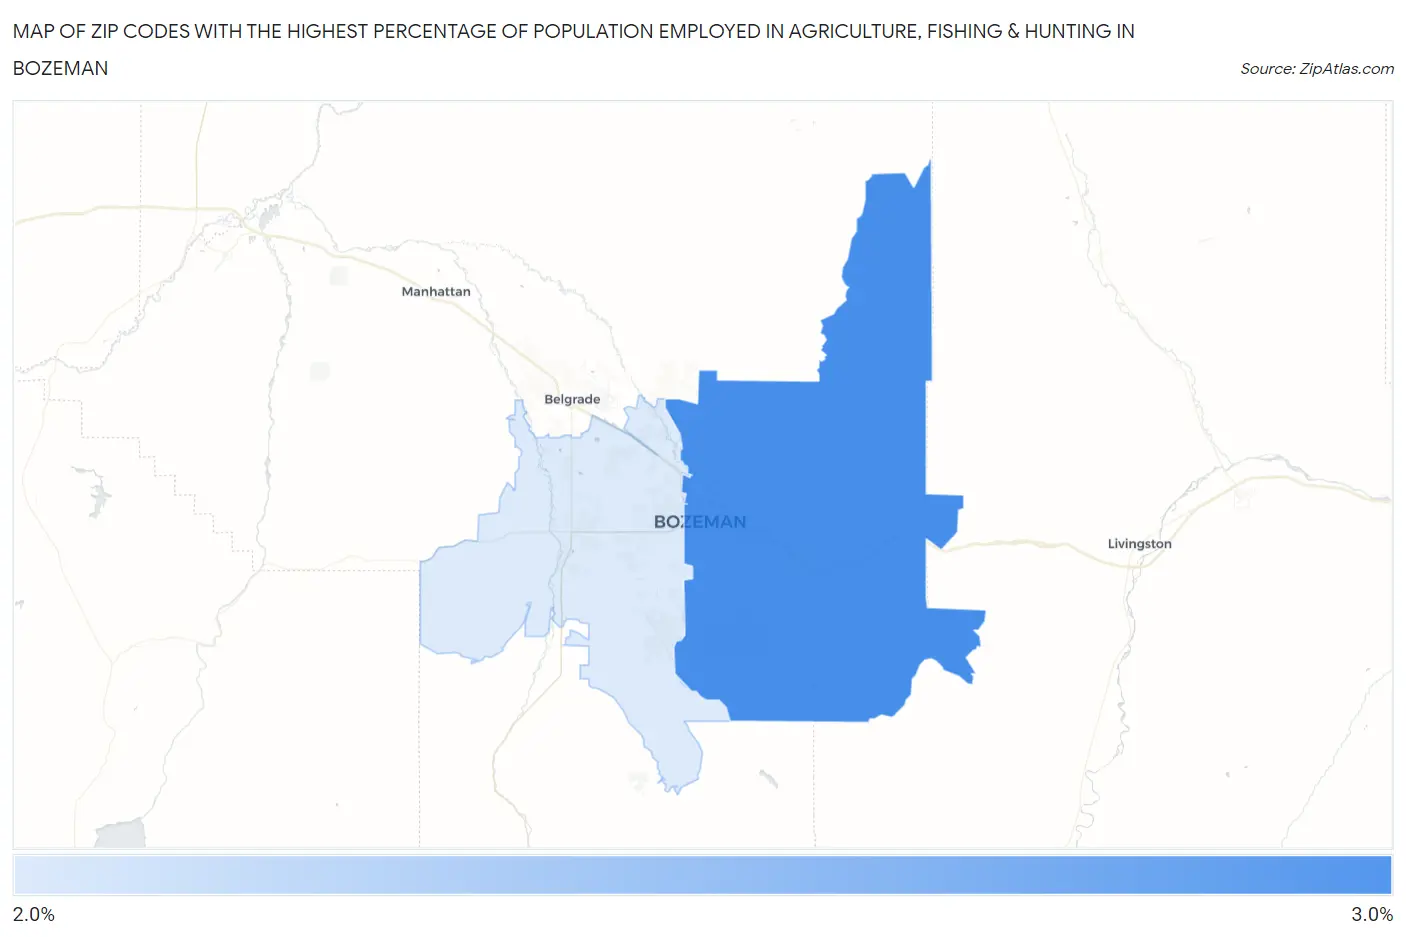
Map of Zip Codes with the Highest Percentage of Population Employed in Agriculture, Fishing & Hunting in Bozeman
0.0%
3.0%
Zip Codes with the Highest Percentage of Population Employed in Agriculture, Fishing & Hunting in Bozeman, MT
| Zip Code | % Employed | vs State | vs National | |
| 1. | 59715 | 2.8% | 4.9%(-2.13)#289 | 1.2%(+1.60)#10,942 |
| 2. | 59718 | 2.4% | 4.9%(-2.49)#299 | 1.2%(+1.24)#11,698 |
1
Common Questions
What are the Top Zip Codes with the Highest Percentage of Population Employed in Agriculture, Fishing & Hunting in Bozeman, MT?
Top Zip Codes with the Highest Percentage of Population Employed in Agriculture, Fishing & Hunting in Bozeman, MT are:
What zip code has the Highest Percentage of Population Employed in Agriculture, Fishing & Hunting in Bozeman, MT?
59715 has the Highest Percentage of Population Employed in Agriculture, Fishing & Hunting in Bozeman, MT with 2.8%.
What is the Percentage of Population Employed in Agriculture, Fishing & Hunting in Bozeman, MT?
Percentage of Population Employed in Agriculture, Fishing & Hunting in Bozeman is 2.0%.
What is the Percentage of Population Employed in Agriculture, Fishing & Hunting in Montana?
Percentage of Population Employed in Agriculture, Fishing & Hunting in Montana is 4.9%.
What is the Percentage of Population Employed in Agriculture, Fishing & Hunting in the United States?
Percentage of Population Employed in Agriculture, Fishing & Hunting in the United States is 1.2%.