Zip Codes with the Highest Percentage of Population Employed in Accommodation & Food Services in Southaven, MS
RELATED REPORTS & OPTIONS
Accommodation & Food Services
Southaven
Compare Zip Codes
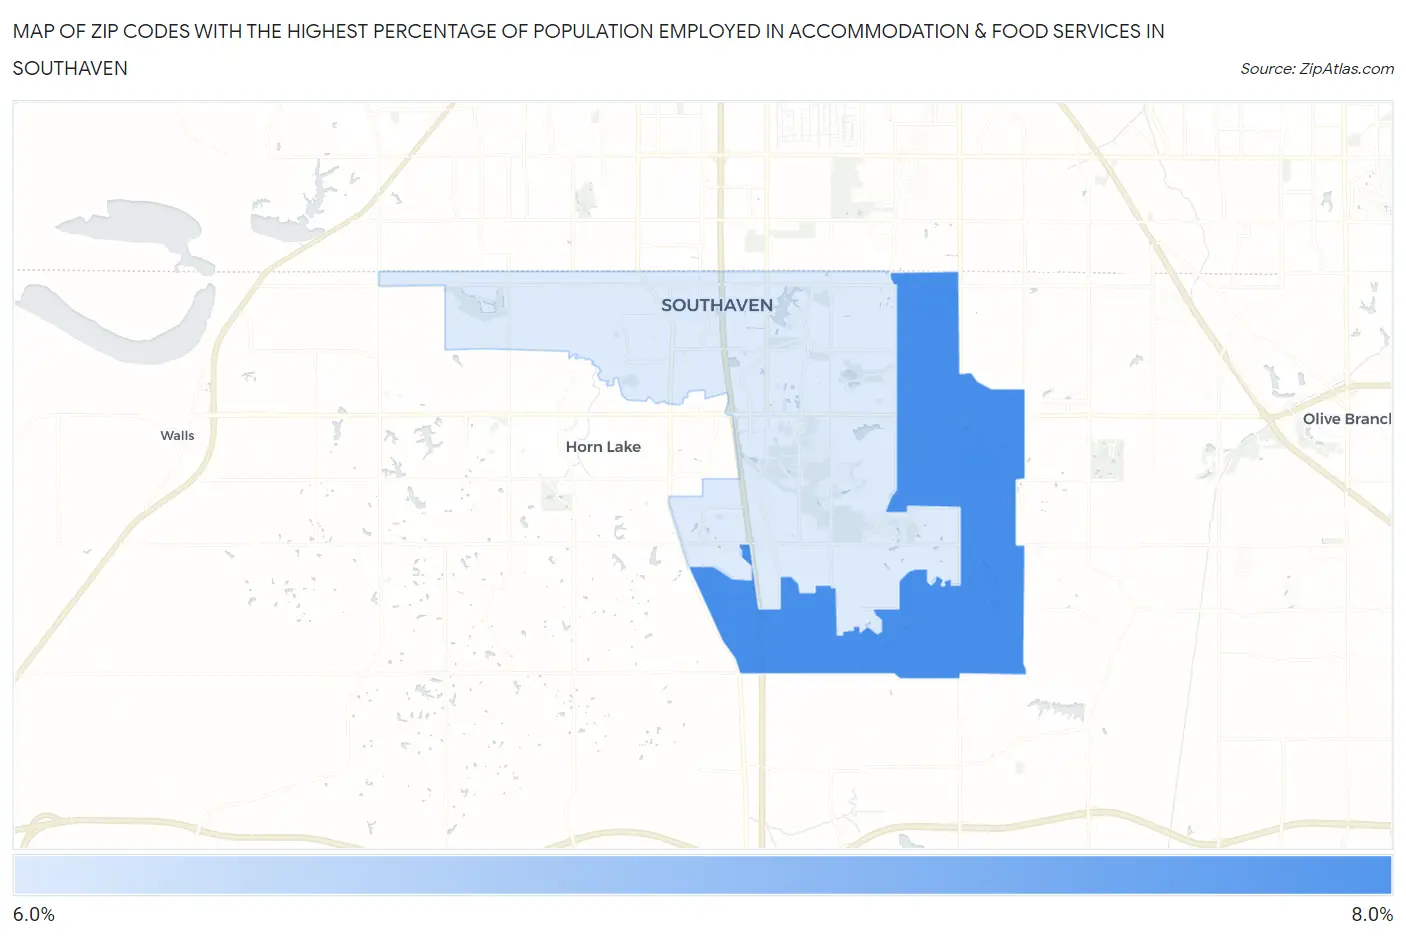
Map of Zip Codes with the Highest Percentage of Population Employed in Accommodation & Food Services in Southaven
6.6%
7.8%
Zip Codes with the Highest Percentage of Population Employed in Accommodation & Food Services in Southaven, MS
| Zip Code | % Employed | vs State | vs National | |
| 1. | 38672 | 7.8% | 6.9%(+0.900)#101 | 6.9%(+0.928)#8,245 |
| 2. | 38671 | 6.6% | 6.9%(-0.331)#137 | 6.9%(-0.304)#11,592 |
1
Common Questions
What are the Top Zip Codes with the Highest Percentage of Population Employed in Accommodation & Food Services in Southaven, MS?
Top Zip Codes with the Highest Percentage of Population Employed in Accommodation & Food Services in Southaven, MS are:
What zip code has the Highest Percentage of Population Employed in Accommodation & Food Services in Southaven, MS?
38672 has the Highest Percentage of Population Employed in Accommodation & Food Services in Southaven, MS with 7.8%.
What is the Percentage of Population Employed in Accommodation & Food Services in Southaven, MS?
Percentage of Population Employed in Accommodation & Food Services in Southaven is 6.7%.
What is the Percentage of Population Employed in Accommodation & Food Services in Mississippi?
Percentage of Population Employed in Accommodation & Food Services in Mississippi is 6.9%.
What is the Percentage of Population Employed in Accommodation & Food Services in the United States?
Percentage of Population Employed in Accommodation & Food Services in the United States is 6.9%.