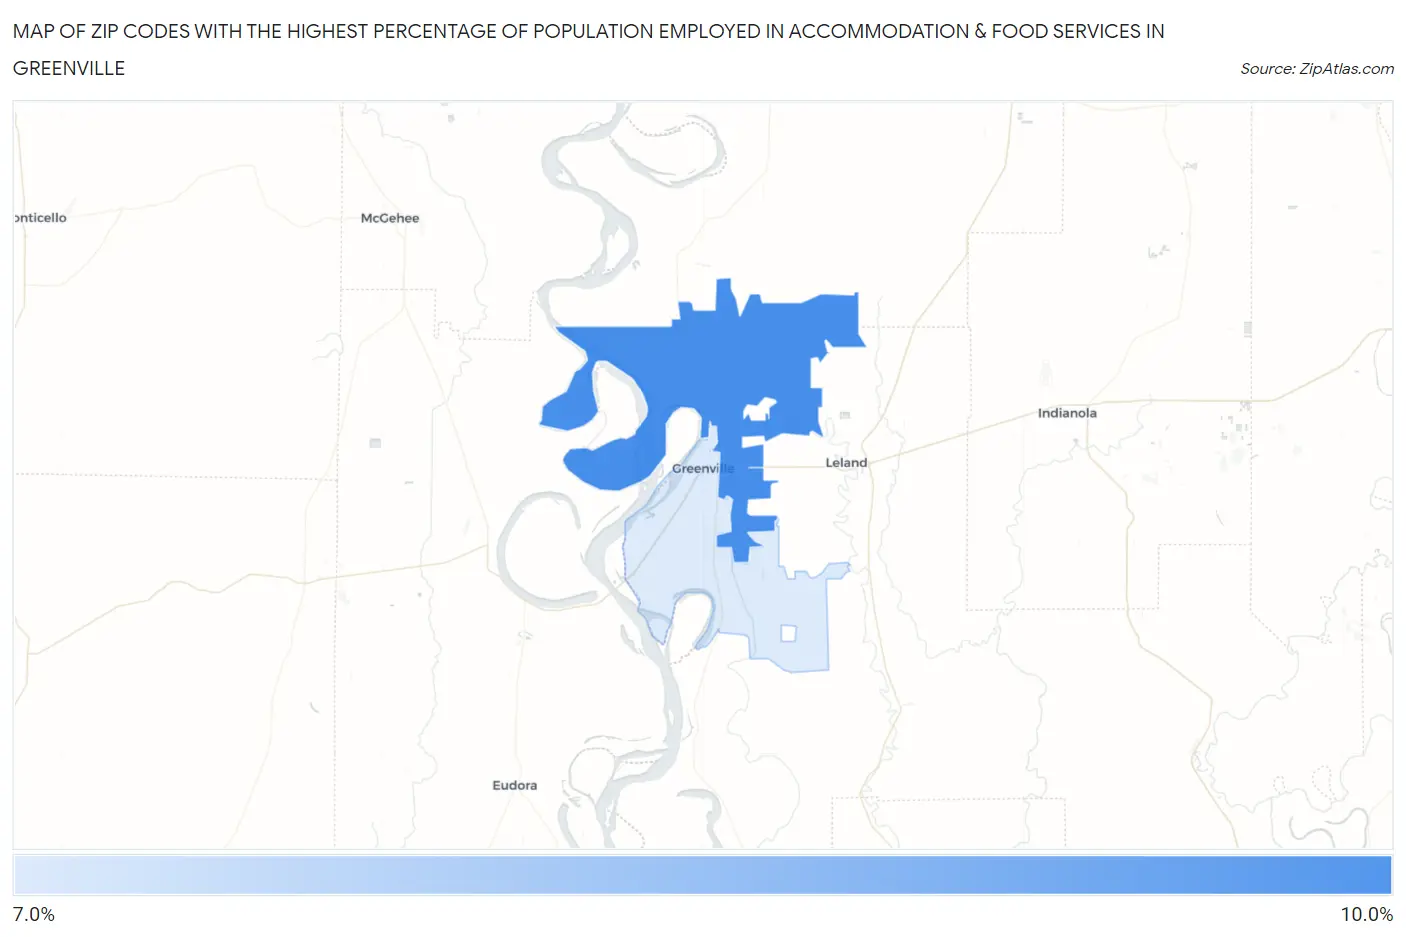
Zip Codes with the Highest Percentage of Population Employed in Accommodation & Food Services in Greenville, MS
RELATED REPORTS & OPTIONS
Accommodation & Food Services
Greenville
Compare Zip Codes
Map of Zip Codes with the Highest Percentage of Population Employed in Accommodation & Food Services in Greenville
7.1%
10.0%
Zip Codes with the Highest Percentage of Population Employed in Accommodation & Food Services in Greenville, MS
| Zip Code | % Employed | vs State | vs National | |
| 1. | 38703 | 10.0% | 6.9%(+3.07)#63 | 6.9%(+3.09)#4,580 |
| 2. | 38701 | 7.1% | 6.9%(+0.231)#122 | 6.9%(+0.258)#9,960 |
1
Common Questions
What are the Top Zip Codes with the Highest Percentage of Population Employed in Accommodation & Food Services in Greenville, MS?
Top Zip Codes with the Highest Percentage of Population Employed in Accommodation & Food Services in Greenville, MS are:
What zip code has the Highest Percentage of Population Employed in Accommodation & Food Services in Greenville, MS?
38703 has the Highest Percentage of Population Employed in Accommodation & Food Services in Greenville, MS with 10.0%.
What is the Percentage of Population Employed in Accommodation & Food Services in Greenville, MS?
Percentage of Population Employed in Accommodation & Food Services in Greenville is 8.3%.
What is the Percentage of Population Employed in Accommodation & Food Services in Mississippi?
Percentage of Population Employed in Accommodation & Food Services in Mississippi is 6.9%.
What is the Percentage of Population Employed in Accommodation & Food Services in the United States?
Percentage of Population Employed in Accommodation & Food Services in the United States is 6.9%.