Zip Codes with the Highest Percentage of Population Employed in Transportation & Warehousing in Missouri
RELATED REPORTS & OPTIONS
Transportation & Warehousing
Missouri
Compare Zip Codes
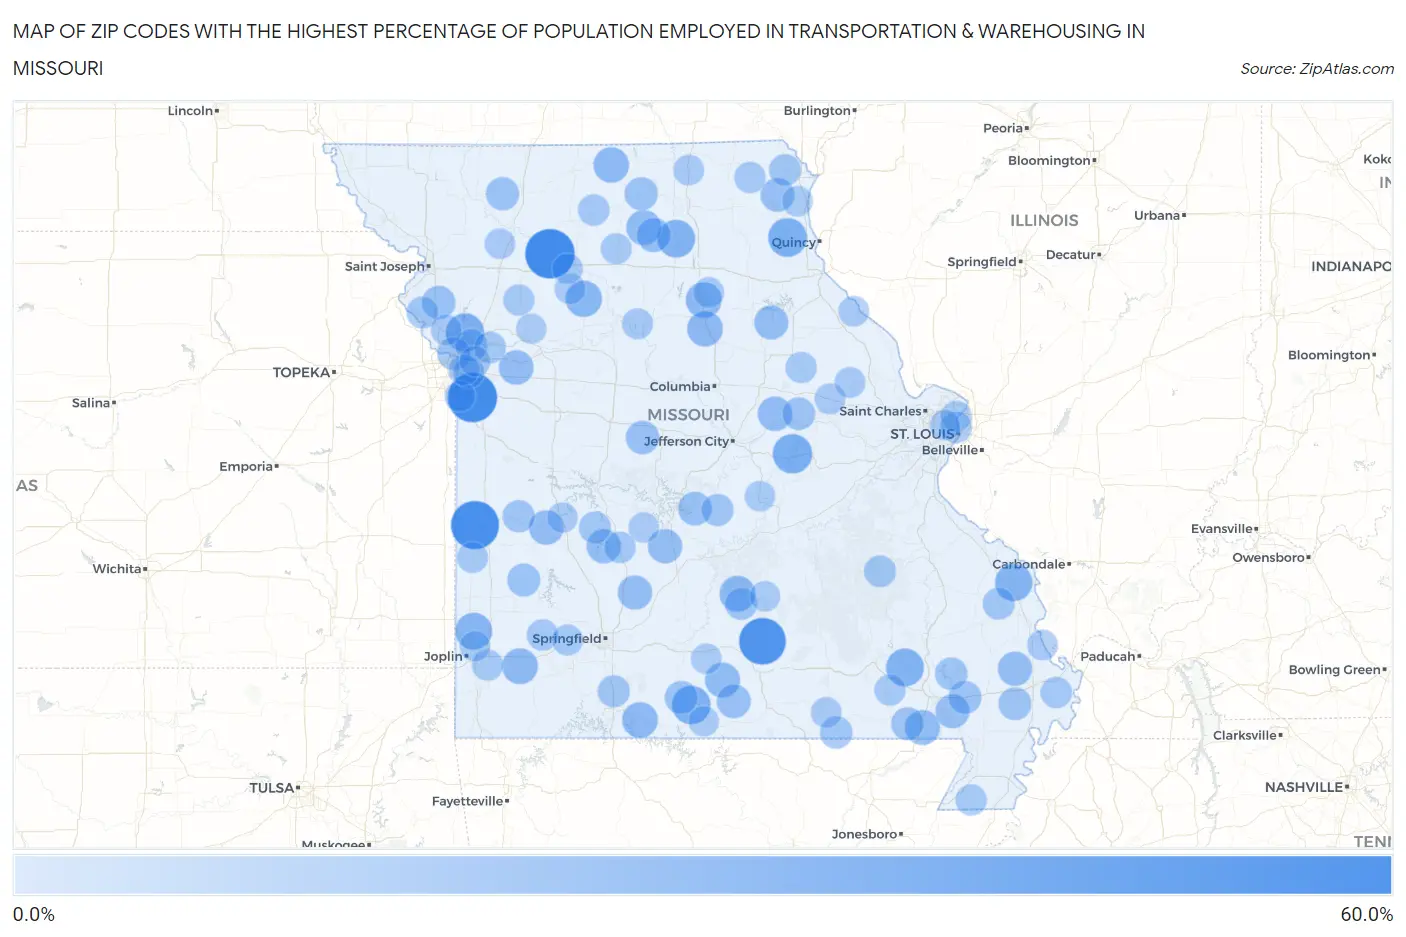
Map of Zip Codes with the Highest Percentage of Population Employed in Transportation & Warehousing in Missouri
0.0%
60.0%
Zip Codes with the Highest Percentage of Population Employed in Transportation & Warehousing in Missouri
| Zip Code | % Employed | vs State | vs National | |
| 1. | 64654 | 53.3% | 5.0%(+48.4)#1 | 4.9%(+48.4)#67 |
| 2. | 64149 | 52.8% | 5.0%(+47.9)#2 | 4.9%(+47.9)#68 |
| 3. | 64765 | 50.0% | 5.0%(+45.0)#3 | 4.9%(+45.1)#83 |
| 4. | 65464 | 47.1% | 5.0%(+42.1)#4 | 4.9%(+42.1)#95 |
| 5. | 65062 | 30.8% | 5.0%(+25.8)#5 | 4.9%(+25.8)#215 |
| 6. | 63438 | 29.5% | 5.0%(+24.5)#6 | 4.9%(+24.5)#239 |
| 7. | 65773 | 29.1% | 5.0%(+24.1)#7 | 4.9%(+24.1)#248 |
| 8. | 64166 | 28.6% | 5.0%(+23.6)#8 | 4.9%(+23.6)#255 |
| 9. | 63952 | 27.5% | 5.0%(+22.5)#9 | 4.9%(+22.6)#283 |
| 10. | 63538 | 26.9% | 5.0%(+21.9)#10 | 4.9%(+22.0)#293 |
| 11. | 63770 | 26.3% | 5.0%(+21.3)#11 | 4.9%(+21.4)#303 |
| 12. | 64849 | 25.4% | 5.0%(+20.4)#12 | 4.9%(+20.4)#325 |
| 13. | 64682 | 24.2% | 5.0%(+19.2)#13 | 4.9%(+19.3)#355 |
| 14. | 65239 | 23.3% | 5.0%(+18.3)#14 | 4.9%(+18.4)#386 |
| 15. | 65557 | 23.1% | 5.0%(+18.1)#15 | 4.9%(+18.1)#393 |
| 16. | 64873 | 23.0% | 5.0%(+18.0)#16 | 4.9%(+18.0)#396 |
| 17. | 65680 | 22.5% | 5.0%(+17.5)#17 | 4.9%(+17.6)#408 |
| 18. | 65278 | 22.5% | 5.0%(+17.5)#18 | 4.9%(+17.6)#410 |
| 19. | 64655 | 22.2% | 5.0%(+17.2)#19 | 4.9%(+17.3)#427 |
| 20. | 65768 | 21.2% | 5.0%(+16.2)#20 | 4.9%(+16.2)#467 |
| 21. | 63954 | 21.1% | 5.0%(+16.2)#21 | 4.9%(+16.2)#469 |
| 22. | 63566 | 21.1% | 5.0%(+16.1)#22 | 4.9%(+16.1)#477 |
| 23. | 64074 | 20.3% | 5.0%(+15.4)#23 | 4.9%(+15.4)#519 |
| 24. | 65077 | 20.0% | 5.0%(+15.0)#24 | 4.9%(+15.1)#536 |
| 25. | 64781 | 20.0% | 5.0%(+15.0)#25 | 4.9%(+15.1)#541 |
| 26. | 65644 | 19.8% | 5.0%(+14.9)#26 | 4.9%(+14.9)#551 |
| 27. | 65463 | 19.8% | 5.0%(+14.9)#27 | 4.9%(+14.9)#552 |
| 28. | 63784 | 19.7% | 5.0%(+14.7)#28 | 4.9%(+14.8)#560 |
| 29. | 65724 | 19.6% | 5.0%(+14.6)#29 | 4.9%(+14.6)#565 |
| 30. | 63557 | 19.1% | 5.0%(+14.2)#30 | 4.9%(+14.2)#584 |
| 31. | 65282 | 19.1% | 5.0%(+14.2)#31 | 4.9%(+14.2)#585 |
| 32. | 63932 | 18.8% | 5.0%(+13.8)#32 | 4.9%(+13.8)#614 |
| 33. | 65637 | 18.7% | 5.0%(+13.7)#33 | 4.9%(+13.8)#621 |
| 34. | 63473 | 18.6% | 5.0%(+13.6)#34 | 4.9%(+13.7)#628 |
| 35. | 65017 | 18.2% | 5.0%(+13.2)#35 | 4.9%(+13.2)#672 |
| 36. | 65329 | 17.8% | 5.0%(+12.9)#36 | 4.9%(+12.9)#697 |
| 37. | 64439 | 17.8% | 5.0%(+12.8)#37 | 4.9%(+12.8)#705 |
| 38. | 64471 | 17.3% | 5.0%(+12.3)#38 | 4.9%(+12.4)#739 |
| 39. | 63545 | 17.1% | 5.0%(+12.2)#39 | 4.9%(+12.2)#763 |
| 40. | 65755 | 16.8% | 5.0%(+11.8)#40 | 4.9%(+11.8)#798 |
| 41. | 64756 | 16.7% | 5.0%(+11.8)#41 | 4.9%(+11.8)#807 |
| 42. | 63936 | 16.7% | 5.0%(+11.7)#42 | 4.9%(+11.7)#817 |
| 43. | 63953 | 16.6% | 5.0%(+11.6)#43 | 4.9%(+11.6)#839 |
| 44. | 63828 | 16.4% | 5.0%(+11.4)#44 | 4.9%(+11.5)#860 |
| 45. | 64150 | 16.2% | 5.0%(+11.2)#45 | 4.9%(+11.2)#878 |
| 46. | 65069 | 16.0% | 5.0%(+11.1)#46 | 4.9%(+11.1)#904 |
| 47. | 63966 | 15.7% | 5.0%(+10.7)#47 | 4.9%(+10.7)#951 |
| 48. | 65778 | 15.6% | 5.0%(+10.6)#48 | 4.9%(+10.7)#961 |
| 49. | 64780 | 15.4% | 5.0%(+10.4)#49 | 4.9%(+10.4)#991 |
| 50. | 64158 | 15.3% | 5.0%(+10.3)#50 | 4.9%(+10.3)#1,012 |
| 51. | 65570 | 15.3% | 5.0%(+10.3)#51 | 4.9%(+10.3)#1,014 |
| 52. | 65486 | 15.0% | 5.0%(+10.0)#52 | 4.9%(+10.0)#1,072 |
| 53. | 65630 | 14.9% | 5.0%(+9.89)#53 | 4.9%(+9.92)#1,094 |
| 54. | 65779 | 14.6% | 5.0%(+9.66)#54 | 4.9%(+9.69)#1,134 |
| 55. | 64098 | 14.6% | 5.0%(+9.61)#55 | 4.9%(+9.64)#1,148 |
| 56. | 63766 | 14.5% | 5.0%(+9.56)#56 | 4.9%(+9.59)#1,159 |
| 57. | 63623 | 14.3% | 5.0%(+9.36)#57 | 4.9%(+9.39)#1,198 |
| 58. | 63445 | 14.1% | 5.0%(+9.16)#58 | 4.9%(+9.19)#1,256 |
| 59. | 64072 | 14.0% | 5.0%(+9.08)#59 | 4.9%(+9.10)#1,274 |
| 60. | 63107 | 13.6% | 5.0%(+8.68)#60 | 4.9%(+8.70)#1,361 |
| 61. | 64641 | 13.6% | 5.0%(+8.66)#61 | 4.9%(+8.69)#1,364 |
| 62. | 63820 | 13.4% | 5.0%(+8.46)#62 | 4.9%(+8.49)#1,414 |
| 63. | 65767 | 13.3% | 5.0%(+8.37)#63 | 4.9%(+8.40)#1,433 |
| 64. | 65707 | 13.3% | 5.0%(+8.31)#64 | 4.9%(+8.34)#1,457 |
| 65. | 64129 | 13.1% | 5.0%(+8.13)#65 | 4.9%(+8.16)#1,505 |
| 66. | 64840 | 13.1% | 5.0%(+8.12)#66 | 4.9%(+8.15)#1,510 |
| 67. | 64671 | 13.0% | 5.0%(+8.06)#67 | 4.9%(+8.09)#1,530 |
| 68. | 63543 | 13.0% | 5.0%(+8.03)#68 | 4.9%(+8.05)#1,533 |
| 69. | 63384 | 13.0% | 5.0%(+8.02)#69 | 4.9%(+8.05)#1,534 |
| 70. | 63855 | 12.9% | 5.0%(+7.88)#70 | 4.9%(+7.91)#1,575 |
| 71. | 63943 | 12.8% | 5.0%(+7.85)#71 | 4.9%(+7.87)#1,585 |
| 72. | 65246 | 12.5% | 5.0%(+7.53)#72 | 4.9%(+7.55)#1,687 |
| 73. | 65664 | 12.5% | 5.0%(+7.53)#73 | 4.9%(+7.55)#1,688 |
| 74. | 64771 | 12.4% | 5.0%(+7.46)#74 | 4.9%(+7.48)#1,704 |
| 75. | 64653 | 12.4% | 5.0%(+7.45)#75 | 4.9%(+7.47)#1,709 |
| 76. | 63137 | 12.2% | 5.0%(+7.25)#76 | 4.9%(+7.27)#1,775 |
| 77. | 64638 | 12.1% | 5.0%(+7.12)#77 | 4.9%(+7.15)#1,809 |
| 78. | 64146 | 12.0% | 5.0%(+7.05)#78 | 4.9%(+7.07)#1,849 |
| 79. | 64128 | 12.0% | 5.0%(+6.98)#79 | 4.9%(+7.01)#1,886 |
| 80. | 63351 | 11.9% | 5.0%(+6.97)#80 | 4.9%(+7.00)#1,892 |
| 81. | 64686 | 11.9% | 5.0%(+6.93)#81 | 4.9%(+6.96)#1,903 |
| 82. | 64163 | 11.9% | 5.0%(+6.92)#82 | 4.9%(+6.95)#1,906 |
| 83. | 63349 | 11.9% | 5.0%(+6.91)#83 | 4.9%(+6.94)#1,910 |
| 84. | 63353 | 11.9% | 5.0%(+6.89)#84 | 4.9%(+6.92)#1,917 |
| 85. | 65606 | 11.8% | 5.0%(+6.84)#85 | 4.9%(+6.86)#1,941 |
| 86. | 65260 | 11.7% | 5.0%(+6.77)#86 | 4.9%(+6.79)#1,980 |
| 87. | 64054 | 11.7% | 5.0%(+6.73)#87 | 4.9%(+6.76)#1,989 |
| 88. | 63561 | 11.7% | 5.0%(+6.71)#88 | 4.9%(+6.73)#1,994 |
| 89. | 63742 | 11.7% | 5.0%(+6.69)#89 | 4.9%(+6.72)#2,001 |
| 90. | 63435 | 11.6% | 5.0%(+6.68)#90 | 4.9%(+6.70)#2,006 |
| 91. | 64497 | 11.6% | 5.0%(+6.61)#91 | 4.9%(+6.63)#2,037 |
| 92. | 65717 | 11.5% | 5.0%(+6.57)#92 | 4.9%(+6.60)#2,053 |
| 93. | 65582 | 11.5% | 5.0%(+6.49)#93 | 4.9%(+6.51)#2,090 |
| 94. | 63133 | 11.5% | 5.0%(+6.48)#94 | 4.9%(+6.51)#2,093 |
| 95. | 65542 | 11.4% | 5.0%(+6.46)#95 | 4.9%(+6.49)#2,100 |
| 96. | 64776 | 11.4% | 5.0%(+6.44)#96 | 4.9%(+6.46)#2,116 |
| 97. | 64835 | 11.4% | 5.0%(+6.38)#97 | 4.9%(+6.41)#2,147 |
| 98. | 65786 | 11.3% | 5.0%(+6.37)#98 | 4.9%(+6.40)#2,153 |
| 99. | 65655 | 11.2% | 5.0%(+6.19)#99 | 4.9%(+6.22)#2,246 |
| 100. | 64085 | 11.1% | 5.0%(+6.12)#100 | 4.9%(+6.15)#2,282 |
Common Questions
What are the Top 10 Zip Codes with the Highest Percentage of Population Employed in Transportation & Warehousing in Missouri?
Top 10 Zip Codes with the Highest Percentage of Population Employed in Transportation & Warehousing in Missouri are:
What zip code has the Highest Percentage of Population Employed in Transportation & Warehousing in Missouri?
64654 has the Highest Percentage of Population Employed in Transportation & Warehousing in Missouri with 53.3%.
What is the Percentage of Population Employed in Transportation & Warehousing in the State of Missouri?
Percentage of Population Employed in Transportation & Warehousing in Missouri is 5.0%.
What is the Percentage of Population Employed in Transportation & Warehousing in the United States?
Percentage of Population Employed in Transportation & Warehousing in the United States is 4.9%.