Zip Codes with the Highest Percentage of Population Employed in Farming, Fishing & Forestry in Kalamazoo, MI

RELATED REPORTS & OPTIONS

Farming, Fishing & Forestry
Population
Families and Households
Female Fertility
Female Fertility (Unmarried)
Race (Community Size)
Race (Percentage)
Ancestry (Community Size)
AfricanAmericanArabArgentineanArmenianAustrianBelgianBhutaneseBlackfeetBolivianBrazilianBritishBritish West IndianBulgarianBurmeseCanadianCentral AmericanCentral American IndianCherokeeChippewaChoctawColombianCroatianCubanCzechCzechoslovakianDanishDominicanDutchEastern EuropeanEcuadorianEgyptianEnglishEuropeanFilipinoFinnishFrenchFrench American IndianFrench CanadianGermanGreekGuatemalanHonduranHungarianIcelanderIndian (Asian)IranianIraqiIrishIroquoisItalianJamaicanJapaneseKoreanLaotianLatvianLebaneseLithuanianMacedonianMexicanMexican American IndianMoroccanNigerianNorthern EuropeanNorwegianOttawaPakistaniPanamanianPennsylvania GermanPeruvianPolishPortuguesePotawatomiPuerto RicanRomanianRussianSamoanScandinavianScotch-IrishScottishSerbianSlovakSloveneSouth AmericanSpaniardSpanishSri LankanSubsaharan AfricanSwedishSwissSyrianThaiTurkishUgandanUkrainianWelshWest IndianYugoslavian
Ancestry (Percentage)
AfricanAmericanArabArgentineanArmenianAustrianBelgianBhutaneseBlackfeetBolivianBrazilianBritishBritish West IndianBulgarianBurmeseCanadianCentral AmericanCentral American IndianCherokeeChippewaChoctawColombianCroatianCubanCzechCzechoslovakianDanishDominicanDutchEastern EuropeanEcuadorianEgyptianEnglishEuropeanFilipinoFinnishFrenchFrench American IndianFrench CanadianGermanGreekGuatemalanHonduranHungarianIcelanderIndian (Asian)IranianIraqiIrishIroquoisItalianJamaicanJapaneseKoreanLaotianLatvianLebaneseLithuanianMacedonianMexicanMexican American IndianMoroccanNigerianNorthern EuropeanNorwegianOttawaPakistaniPanamanianPennsylvania GermanPeruvianPolishPortuguesePotawatomiPuerto RicanRomanianRussianSamoanScandinavianScotch-IrishScottishSerbianSlovakSloveneSouth AmericanSpaniardSpanishSri LankanSubsaharan AfricanSwedishSwissSyrianThaiTurkishUgandanUkrainianWelshWest IndianYugoslavian
Immigrant Origin (Total)
Immigrant Origin (Percentage)
Income
Income (Families)
Income (Households)
Poverty
Poverty (Families)
Unemployment
Employment Occupations
Employment Industries
Employer Class
Commute Time
Commute Means
School Enrollment
Education by Degree Field
Occupancy
Finances
Physical Characteristics
Kalamazoo
Compare Zip Codes
Comparison Subject

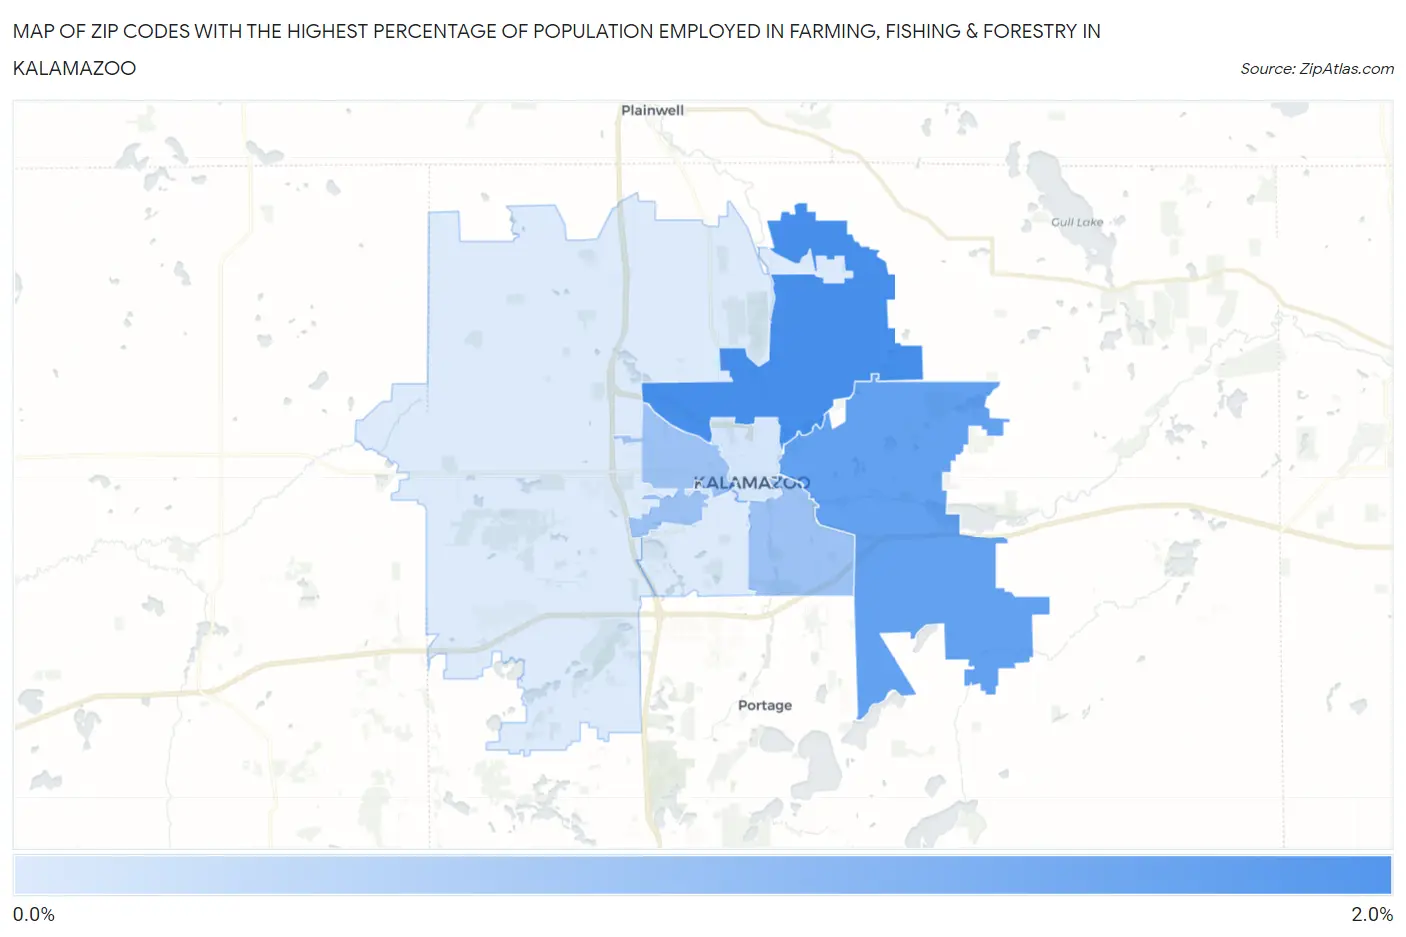
Map of Zip Codes with the Highest Percentage of Population Employed in Farming, Fishing & Forestry in Kalamazoo

0.0%
2.0%
Zip Codes with the Highest Percentage of Population Employed in Farming, Fishing & Forestry in Kalamazoo Map

Zip Codes with the Highest Percentage of Population Employed in Farming, Fishing & Forestry in Kalamazoo, MI

Zip Code % Employed vs State vs National
1.490041.6%0.47%(+1.11)#2090.61%(+0.970)#7,660
2.490481.3%0.47%(+0.848)#2370.61%(+0.709)#8,513
3.490060.82%0.47%(+0.351)#3250.61%(+0.212)#10,671
4.490010.78%0.47%(+0.311)#3390.61%(+0.172)#10,921
5.490070.28%0.47%(-0.185)#5210.61%(-0.324)#15,052
6.490080.20%0.47%(-0.269)#5670.61%(-0.408)#16,167
7.490090.19%0.47%(-0.272)#5720.61%(-0.411)#16,203

Common Questions

What are the Top 5 Zip Codes with the Highest Percentage of Population Employed in Farming, Fishing & Forestry in Kalamazoo, MI?
Top 5 Zip Codes with the Highest Percentage of Population Employed in Farming, Fishing & Forestry in Kalamazoo, MI are:
#1
1.6%
#2
1.3%
#3
0.82%
#4
0.78%
#5
0.28%
What zip code has the Highest Percentage of Population Employed in Farming, Fishing & Forestry in Kalamazoo, MI?
49004 has the Highest Percentage of Population Employed in Farming, Fishing & Forestry in Kalamazoo, MI with 1.6%.
What is the Percentage of Population Employed in Farming, Fishing & Forestry in Kalamazoo, MI?
Percentage of Population Employed in Farming, Fishing & Forestry in Kalamazoo is 0.56%.
What is the Percentage of Population Employed in Farming, Fishing & Forestry in Michigan?
Percentage of Population Employed in Farming, Fishing & Forestry in Michigan is 0.47%.
What is the Percentage of Population Employed in Farming, Fishing & Forestry in the United States?
Percentage of Population Employed in Farming, Fishing & Forestry in the United States is 0.61%.