Zip Codes with the Highest Percentage of Population Employed in Agriculture, Fishing & Hunting in Clarkston, MI
RELATED REPORTS & OPTIONS
Select to Compare
Select to Compare
Compare Zip Codes
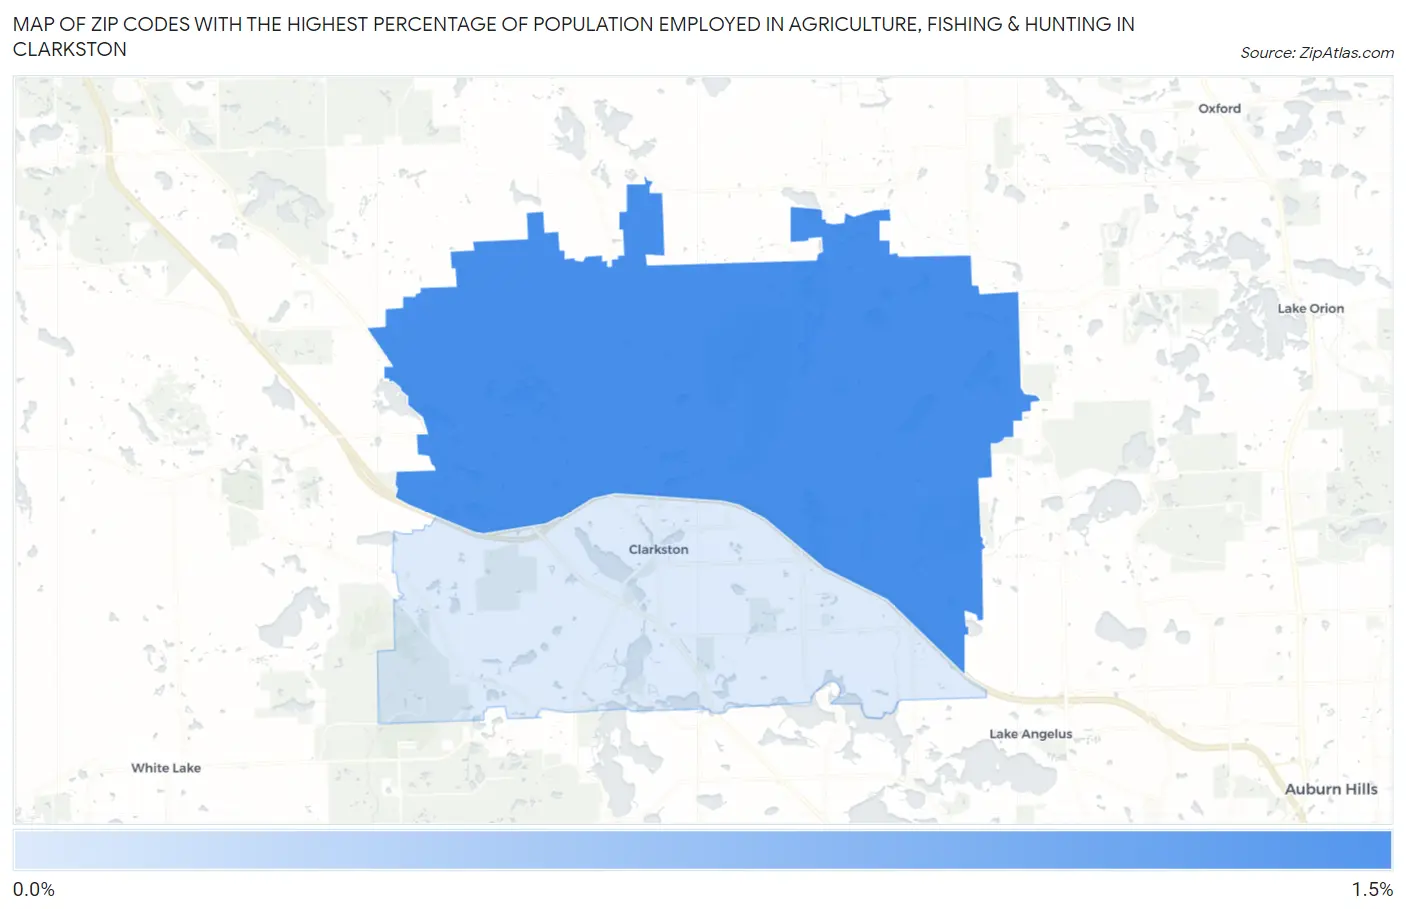
Map of Zip Codes with the Highest Percentage of Population Employed in Agriculture, Fishing & Hunting in Clarkston
0.0%
1.5%
Zip Codes with the Highest Percentage of Population Employed in Agriculture, Fishing & Hunting in Clarkston, MI
| Zip Code | % Employed | vs State | vs National | |
| 1. | 48348 | 1.2% | 0.98%(+0.254)#470 | 1.2%(+0.039)#15,255 |
1
Common Questions
What are the Top Zip Codes with the Highest Percentage of Population Employed in Agriculture, Fishing & Hunting in Clarkston, MI?
Top Zip Codes with the Highest Percentage of Population Employed in Agriculture, Fishing & Hunting in Clarkston, MI are:
What zip code has the Highest Percentage of Population Employed in Agriculture, Fishing & Hunting in Clarkston, MI?
48348 has the Highest Percentage of Population Employed in Agriculture, Fishing & Hunting in Clarkston, MI with 1.2%.
What is the Percentage of Population Employed in Agriculture, Fishing & Hunting in Michigan?
Percentage of Population Employed in Agriculture, Fishing & Hunting in Michigan is 0.98%.
What is the Percentage of Population Employed in Agriculture, Fishing & Hunting in the United States?
Percentage of Population Employed in Agriculture, Fishing & Hunting in the United States is 1.2%.