Zip Codes with the Highest Percentage of Population Employed in Agriculture, Fishing & Hunting in Bay City, MI
RELATED REPORTS & OPTIONS
Agriculture, Fishing & Hunting
Bay City
Compare Zip Codes
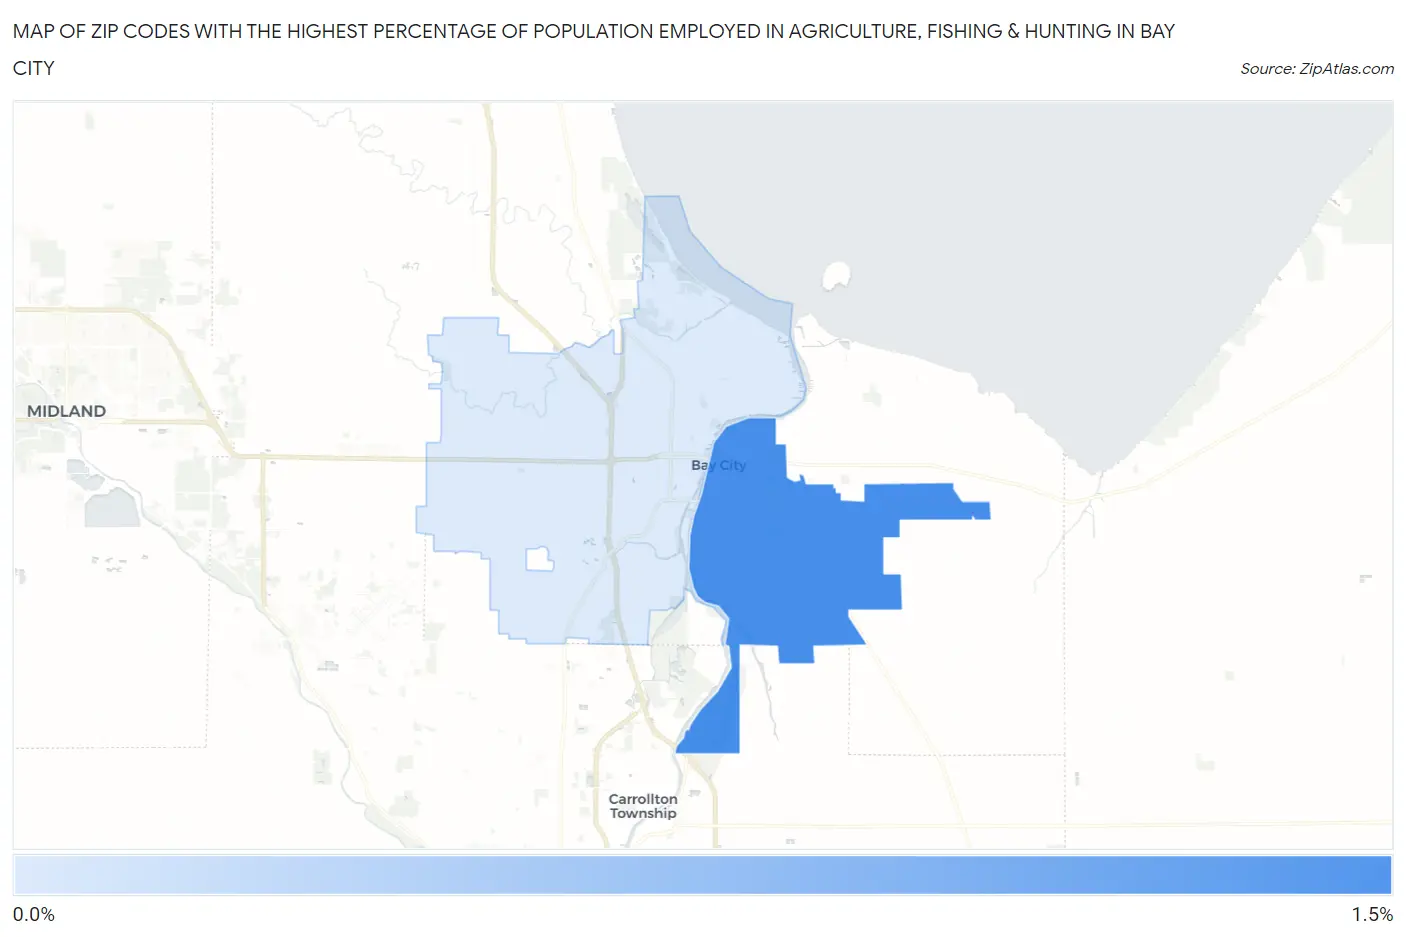
Map of Zip Codes with the Highest Percentage of Population Employed in Agriculture, Fishing & Hunting in Bay City
0.0%
1.5%
Zip Codes with the Highest Percentage of Population Employed in Agriculture, Fishing & Hunting in Bay City, MI
| Zip Code | % Employed | vs State | vs National | |
| 1. | 48708 | 1.4% | 0.98%(+0.411)#435 | 1.2%(+0.196)#14,657 |
| 2. | 48706 | 0.40% | 0.98%(-0.585)#666 | 1.2%(-0.801)#20,171 |
1
Common Questions
What are the Top Zip Codes with the Highest Percentage of Population Employed in Agriculture, Fishing & Hunting in Bay City, MI?
Top Zip Codes with the Highest Percentage of Population Employed in Agriculture, Fishing & Hunting in Bay City, MI are:
What zip code has the Highest Percentage of Population Employed in Agriculture, Fishing & Hunting in Bay City, MI?
48708 has the Highest Percentage of Population Employed in Agriculture, Fishing & Hunting in Bay City, MI with 1.4%.
What is the Percentage of Population Employed in Agriculture, Fishing & Hunting in Bay City, MI?
Percentage of Population Employed in Agriculture, Fishing & Hunting in Bay City is 0.65%.
What is the Percentage of Population Employed in Agriculture, Fishing & Hunting in Michigan?
Percentage of Population Employed in Agriculture, Fishing & Hunting in Michigan is 0.98%.
What is the Percentage of Population Employed in Agriculture, Fishing & Hunting in the United States?
Percentage of Population Employed in Agriculture, Fishing & Hunting in the United States is 1.2%.