Zip Codes with the Highest Percentage of Population with a Degree in Visual and Performing Arts in Silver Spring, MD
RELATED REPORTS & OPTIONS
Visual and Performing Arts
Silver Spring
Compare Zip Codes
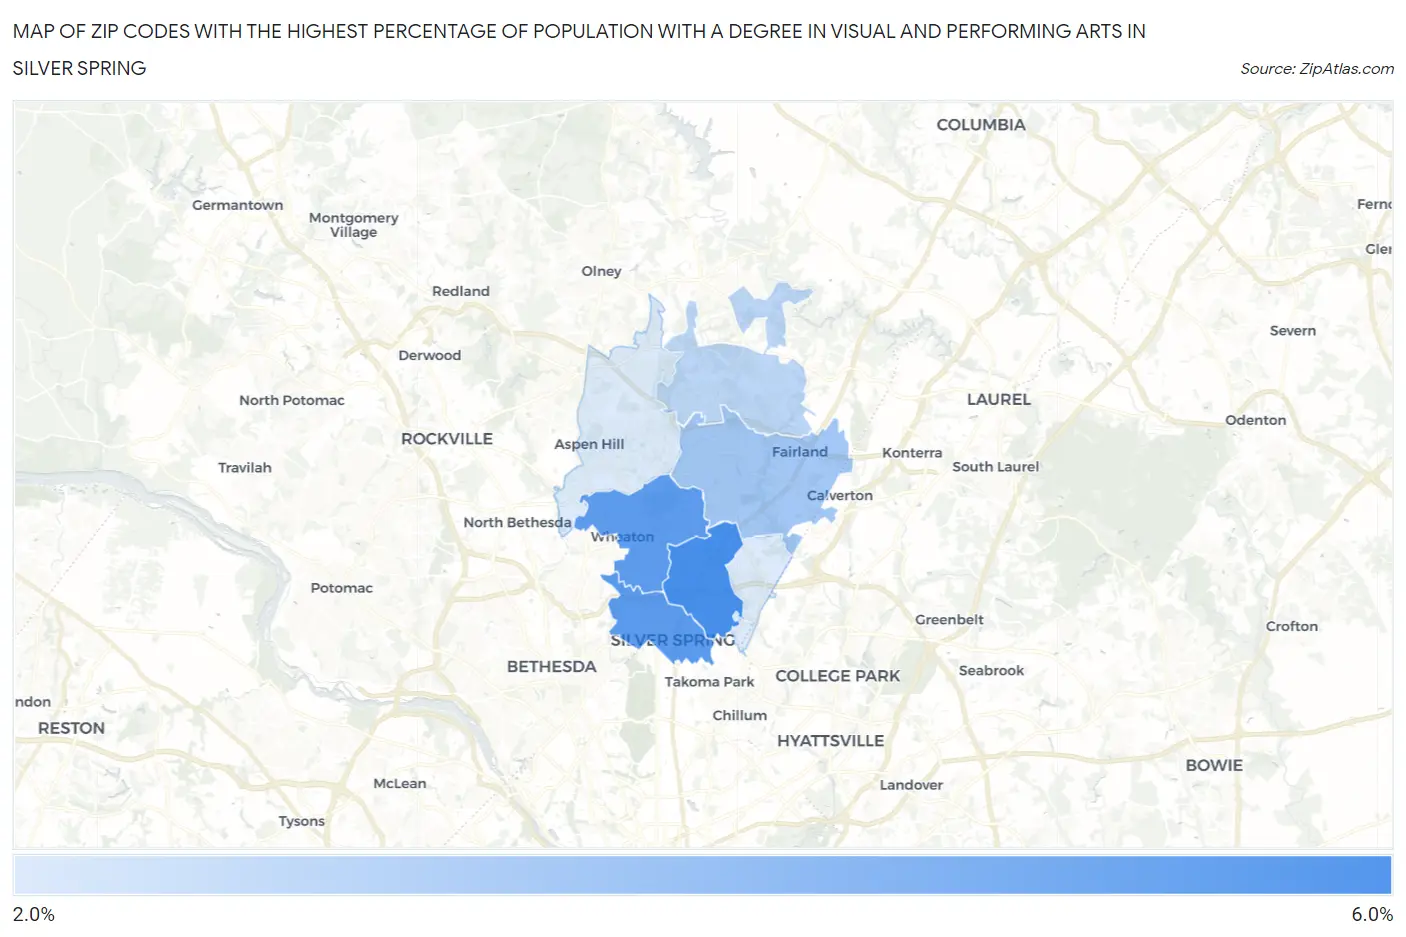
Map of Zip Codes with the Highest Percentage of Population with a Degree in Visual and Performing Arts in Silver Spring
2.3%
5.4%
Zip Codes with the Highest Percentage of Population with a Degree in Visual and Performing Arts in Silver Spring, MD
| Zip Code | % Graduates | vs State | vs National | |
| 1. | 20901 | 5.4% | 3.8%(+1.60)#90 | 4.3%(+1.17)#5,818 |
| 2. | 20910 | 5.0% | 3.8%(+1.20)#103 | 4.3%(+0.774)#6,570 |
| 3. | 20902 | 4.9% | 3.8%(+1.11)#107 | 4.3%(+0.679)#6,802 |
| 4. | 20904 | 3.5% | 3.8%(-0.345)#204 | 4.3%(-0.774)#10,966 |
| 5. | 20905 | 3.0% | 3.8%(-0.870)#235 | 4.3%(-1.30)#12,915 |
| 6. | 20906 | 2.3% | 3.8%(-1.53)#276 | 4.3%(-1.96)#15,405 |
| 7. | 20903 | 2.3% | 3.8%(-1.54)#277 | 4.3%(-1.97)#15,418 |
1
Common Questions
What are the Top 5 Zip Codes with the Highest Percentage of Population with a Degree in Visual and Performing Arts in Silver Spring, MD?
Top 5 Zip Codes with the Highest Percentage of Population with a Degree in Visual and Performing Arts in Silver Spring, MD are:
What zip code has the Highest Percentage of Population with a Degree in Visual and Performing Arts in Silver Spring, MD?
20901 has the Highest Percentage of Population with a Degree in Visual and Performing Arts in Silver Spring, MD with 5.4%.
What is the Percentage of Population with a Degree in Visual and Performing Arts in Silver Spring, MD?
Percentage of Population with a Degree in Visual and Performing Arts in Silver Spring is 5.0%.
What is the Percentage of Population with a Degree in Visual and Performing Arts in Maryland?
Percentage of Population with a Degree in Visual and Performing Arts in Maryland is 3.8%.
What is the Percentage of Population with a Degree in Visual and Performing Arts in the United States?
Percentage of Population with a Degree in Visual and Performing Arts in the United States is 4.3%.