Zip Codes with the Highest Percentage of Population with a Degree in Liberal Arts and History in Silver Spring, MD
RELATED REPORTS & OPTIONS
Liberal Arts and History
Silver Spring
Compare Zip Codes
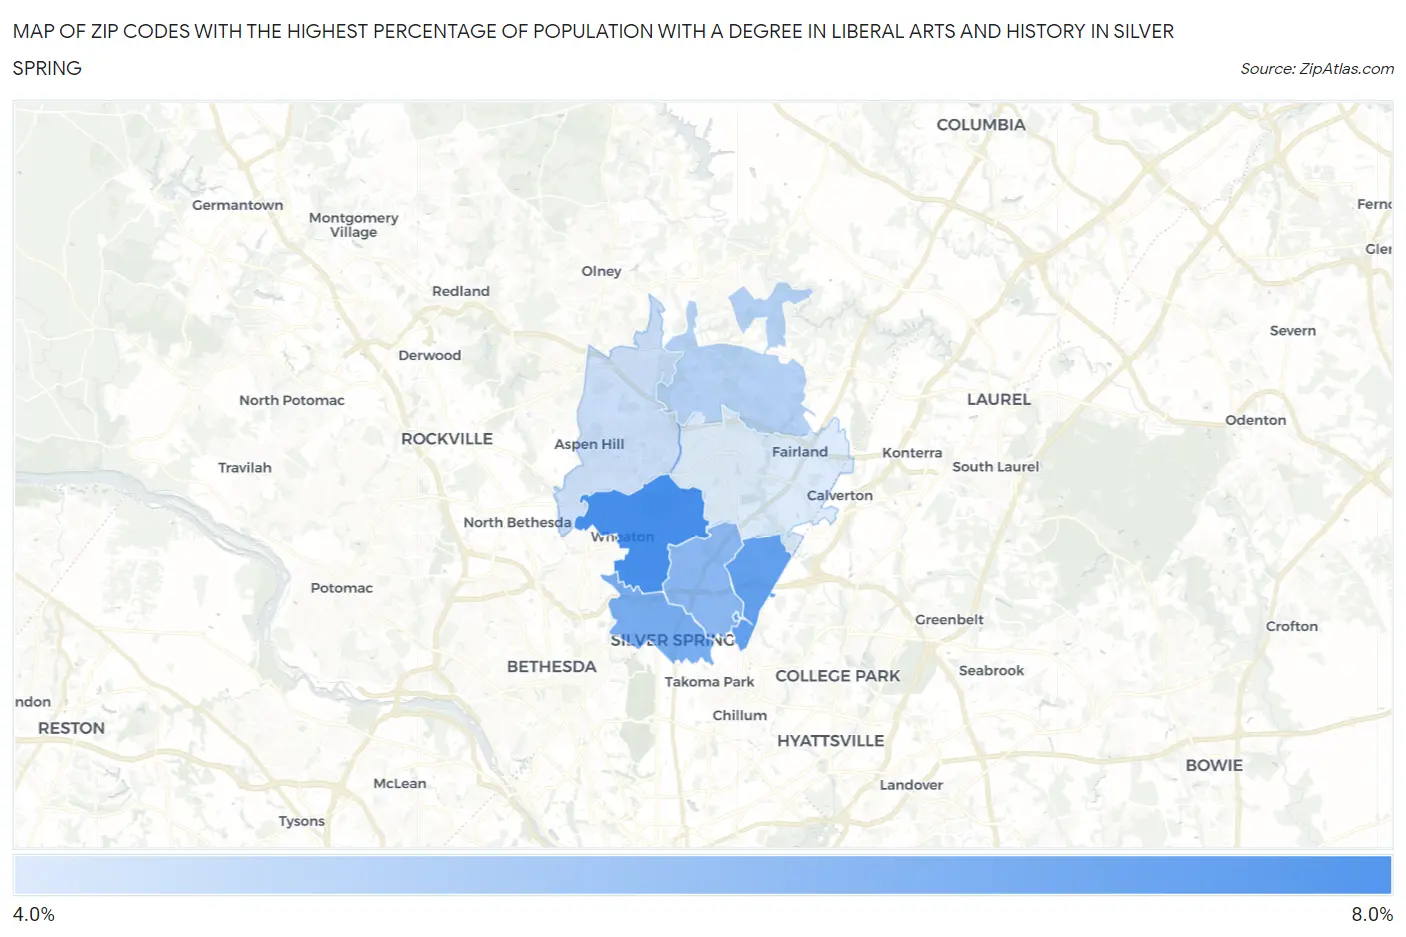
Map of Zip Codes with the Highest Percentage of Population with a Degree in Liberal Arts and History in Silver Spring
4.2%
7.9%
Zip Codes with the Highest Percentage of Population with a Degree in Liberal Arts and History in Silver Spring, MD
| Zip Code | % Graduates | vs State | vs National | |
| 1. | 20902 | 7.9% | 5.0%(+2.84)#82 | 4.9%(+3.00)#5,066 |
| 2. | 20903 | 7.2% | 5.0%(+2.17)#94 | 4.9%(+2.33)#6,039 |
| 3. | 20910 | 6.7% | 5.0%(+1.64)#110 | 4.9%(+1.81)#6,985 |
| 4. | 20901 | 6.2% | 5.0%(+1.21)#125 | 4.9%(+1.37)#7,927 |
| 5. | 20905 | 5.2% | 5.0%(+0.147)#183 | 4.9%(+0.309)#10,777 |
| 6. | 20906 | 4.6% | 5.0%(-0.400)#214 | 4.9%(-0.239)#12,540 |
| 7. | 20904 | 4.2% | 5.0%(-0.825)#234 | 4.9%(-0.663)#13,975 |
1
Common Questions
What are the Top 5 Zip Codes with the Highest Percentage of Population with a Degree in Liberal Arts and History in Silver Spring, MD?
Top 5 Zip Codes with the Highest Percentage of Population with a Degree in Liberal Arts and History in Silver Spring, MD are:
What zip code has the Highest Percentage of Population with a Degree in Liberal Arts and History in Silver Spring, MD?
20902 has the Highest Percentage of Population with a Degree in Liberal Arts and History in Silver Spring, MD with 7.9%.
What is the Percentage of Population with a Degree in Liberal Arts and History in Silver Spring, MD?
Percentage of Population with a Degree in Liberal Arts and History in Silver Spring is 6.6%.
What is the Percentage of Population with a Degree in Liberal Arts and History in Maryland?
Percentage of Population with a Degree in Liberal Arts and History in Maryland is 5.0%.
What is the Percentage of Population with a Degree in Liberal Arts and History in the United States?
Percentage of Population with a Degree in Liberal Arts and History in the United States is 4.9%.