Zip Codes with the Highest Percentage of Population with a Degree in Liberal Arts and History in Baltimore, MD
RELATED REPORTS & OPTIONS
Liberal Arts and History
Baltimore
Compare Zip Codes
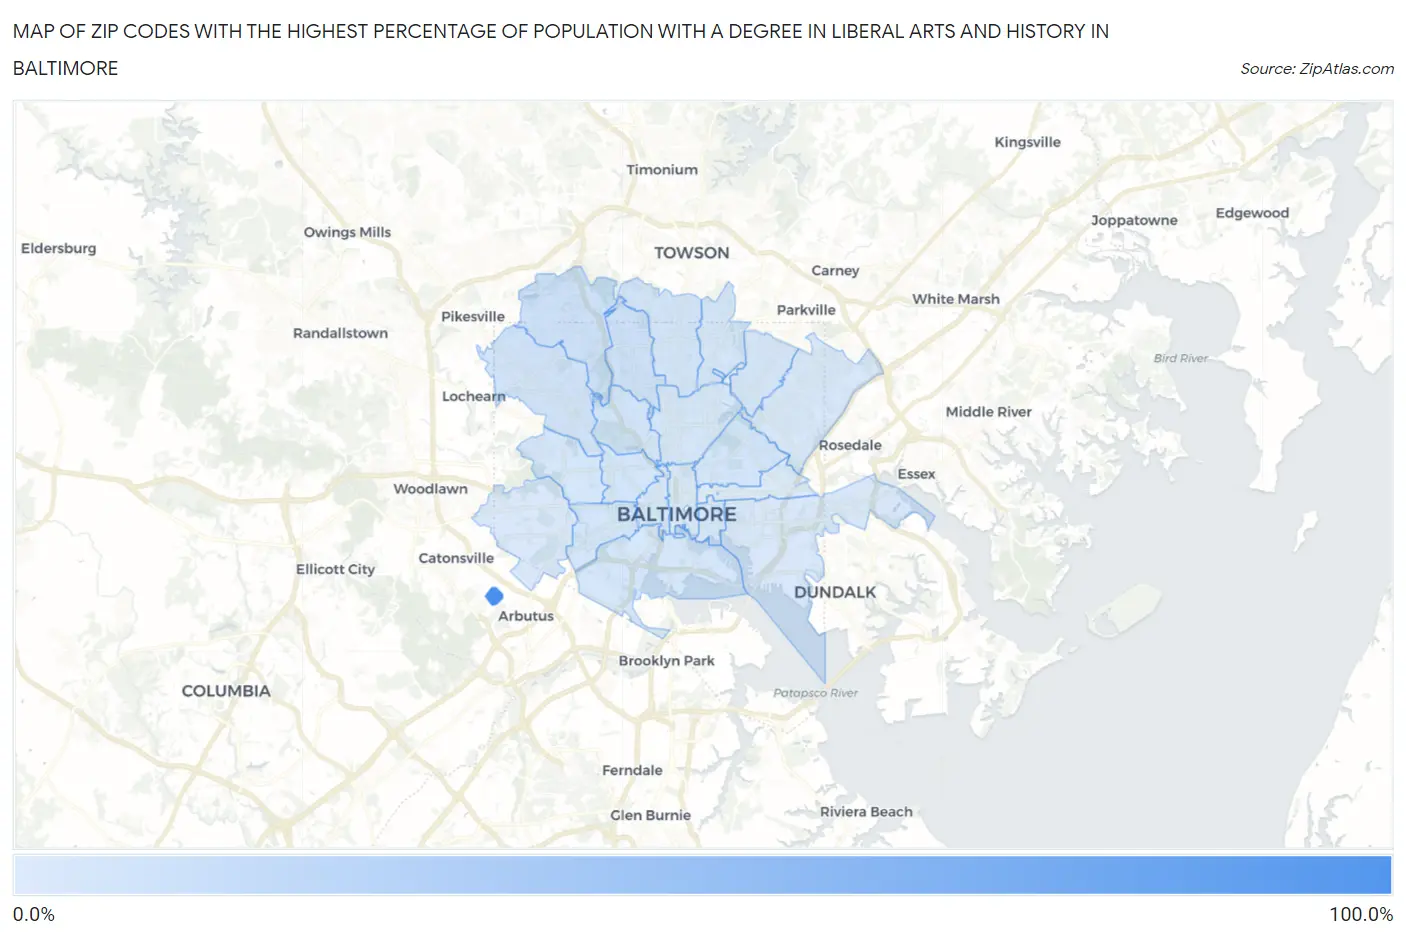
Map of Zip Codes with the Highest Percentage of Population with a Degree in Liberal Arts and History in Baltimore
2.2%
100.0%
Zip Codes with the Highest Percentage of Population with a Degree in Liberal Arts and History in Baltimore, MD
| Zip Code | % Graduates | vs State | vs National | |
| 1. | 21250 | 100.0% | 5.0%(+95.0)#2 | 4.9%(+95.1)#6 |
| 2. | 21210 | 9.1% | 5.0%(+4.04)#64 | 4.9%(+4.20)#3,788 |
| 3. | 21209 | 8.7% | 5.0%(+3.71)#68 | 4.9%(+3.87)#4,084 |
| 4. | 21215 | 7.8% | 5.0%(+2.79)#84 | 4.9%(+2.95)#5,132 |
| 5. | 21212 | 7.0% | 5.0%(+1.97)#100 | 4.9%(+2.13)#6,383 |
| 6. | 21211 | 6.7% | 5.0%(+1.66)#108 | 4.9%(+1.82)#6,956 |
| 7. | 21217 | 6.3% | 5.0%(+1.27)#120 | 4.9%(+1.43)#7,785 |
| 8. | 21223 | 6.1% | 5.0%(+1.04)#136 | 4.9%(+1.20)#8,322 |
| 9. | 21213 | 6.0% | 5.0%(+1.00)#138 | 4.9%(+1.17)#8,418 |
| 10. | 21201 | 5.9% | 5.0%(+0.894)#142 | 4.9%(+1.06)#8,708 |
| 11. | 21216 | 5.9% | 5.0%(+0.866)#144 | 4.9%(+1.03)#8,776 |
| 12. | 21230 | 5.8% | 5.0%(+0.718)#154 | 4.9%(+0.880)#9,157 |
| 13. | 21214 | 5.7% | 5.0%(+0.653)#156 | 4.9%(+0.815)#9,334 |
| 14. | 21218 | 5.7% | 5.0%(+0.628)#158 | 4.9%(+0.790)#9,396 |
| 15. | 21231 | 5.5% | 5.0%(+0.459)#170 | 4.9%(+0.621)#9,884 |
| 16. | 21239 | 5.1% | 5.0%(+0.049)#188 | 4.9%(+0.210)#11,096 |
| 17. | 21206 | 4.6% | 5.0%(-0.435)#218 | 4.9%(-0.273)#12,645 |
| 18. | 21224 | 4.2% | 5.0%(-0.856)#238 | 4.9%(-0.694)#14,105 |
| 19. | 21202 | 3.8% | 5.0%(-1.18)#262 | 4.9%(-1.02)#15,332 |
| 20. | 21229 | 3.6% | 5.0%(-1.40)#275 | 4.9%(-1.24)#16,105 |
| 21. | 21205 | 2.2% | 5.0%(-2.86)#349 | 4.9%(-2.70)#20,917 |
1
Common Questions
What are the Top 10 Zip Codes with the Highest Percentage of Population with a Degree in Liberal Arts and History in Baltimore, MD?
Top 10 Zip Codes with the Highest Percentage of Population with a Degree in Liberal Arts and History in Baltimore, MD are:
What zip code has the Highest Percentage of Population with a Degree in Liberal Arts and History in Baltimore, MD?
21250 has the Highest Percentage of Population with a Degree in Liberal Arts and History in Baltimore, MD with 100.0%.
What is the Percentage of Population with a Degree in Liberal Arts and History in Baltimore, MD?
Percentage of Population with a Degree in Liberal Arts and History in Baltimore is 5.7%.
What is the Percentage of Population with a Degree in Liberal Arts and History in Maryland?
Percentage of Population with a Degree in Liberal Arts and History in Maryland is 5.0%.
What is the Percentage of Population with a Degree in Liberal Arts and History in the United States?
Percentage of Population with a Degree in Liberal Arts and History in the United States is 4.9%.