Zip Codes with the Highest Percentage of Population with a Degree in Computers and Mathematics in Columbia, MD

RELATED REPORTS & OPTIONS

Computers and Mathematics
Population
Families and Households
Female Fertility
Female Fertility (Unmarried)
Race (Community Size)
Race (Percentage)
Ancestry (Community Size)
AfricanAmericanArabArgentineanAustralianAustrianBahamianBarbadianBelgianBhutaneseBlackfeetBolivianBrazilianBritishBritish West IndianBurmeseCanadianCelticCentral AmericanCentral American IndianCherokeeChileanColombianCroatianCubanCzechCzechoslovakianDanishDominicanDutchEastern EuropeanEgyptianEnglishEthiopianEuropeanFilipinoFinnishFrenchFrench CanadianGermanGhanaianGreekGuatemalanGuyaneseHaitianHonduranHungarianIndian (Asian)IranianIrishItalianJamaicanKenyanKoreanLatvianLebaneseLiberianLithuanianMexicanMexican American IndianNigerianNorthern EuropeanNorwegianPakistaniPanamanianPennsylvania GermanPeruvianPolishPortuguesePuerto RicanRomanianRussianSalvadoranScandinavianScotch-IrishScottishSerbianSierra LeoneanSiouxSlavicSlovakSouth AmericanSpaniardSpanishSri LankanSubsaharan AfricanSwedishSwissSyrianThaiTurkishUkrainianVenezuelanVietnameseWelshWest Indian
Ancestry (Percentage)
AfricanAmericanArabArgentineanAustralianAustrianBahamianBarbadianBelgianBhutaneseBlackfeetBolivianBrazilianBritishBritish West IndianBurmeseCanadianCelticCentral AmericanCentral American IndianCherokeeChileanColombianCroatianCubanCzechCzechoslovakianDanishDominicanDutchEastern EuropeanEgyptianEnglishEthiopianEuropeanFilipinoFinnishFrenchFrench CanadianGermanGhanaianGreekGuatemalanGuyaneseHaitianHonduranHungarianIndian (Asian)IranianIrishItalianJamaicanKenyanKoreanLatvianLebaneseLiberianLithuanianMexicanMexican American IndianNigerianNorthern EuropeanNorwegianPakistaniPanamanianPennsylvania GermanPeruvianPolishPortuguesePuerto RicanRomanianRussianSalvadoranScandinavianScotch-IrishScottishSerbianSierra LeoneanSiouxSlavicSlovakSouth AmericanSpaniardSpanishSri LankanSubsaharan AfricanSwedishSwissSyrianThaiTurkishUkrainianVenezuelanVietnameseWelshWest Indian
Immigrant Origin (Total)
Immigrant Origin (Percentage)
Income
Income (Families)
Income (Households)
Poverty
Poverty (Families)
Unemployment
Employment Occupations
Employment Industries
Employer Class
Commute Time
Commute Means
School Enrollment
Education by Degree Field
Occupancy
Finances
Physical Characteristics
Columbia
Compare Zip Codes
Comparison Subject

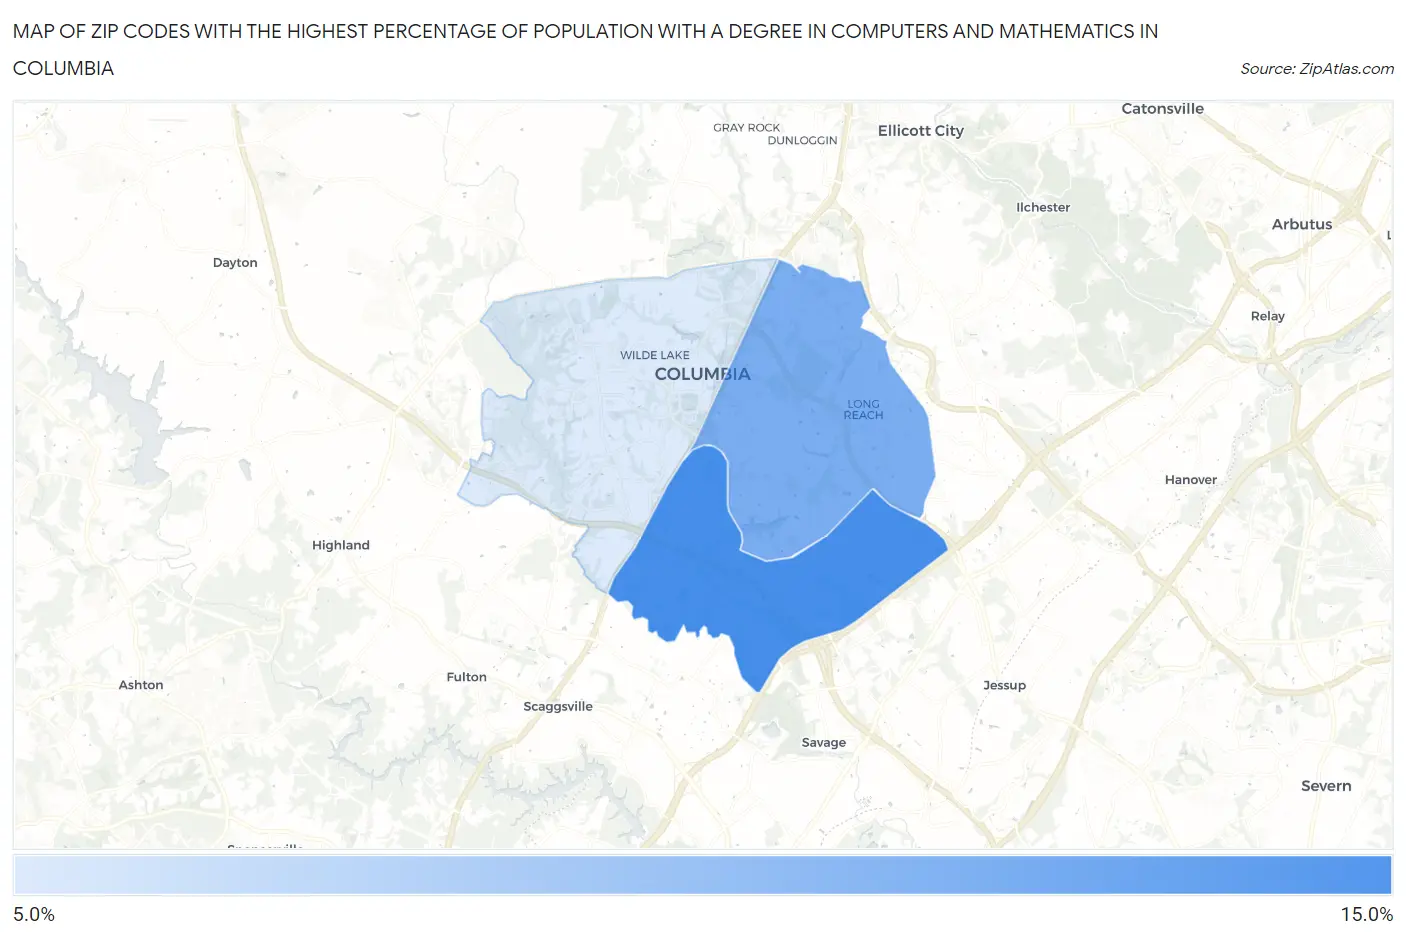
Map of Zip Codes with the Highest Percentage of Population with a Degree in Computers and Mathematics in Columbia

0.0%
15.0%
Zip Codes with the Highest Percentage of Population with a Degree in Computers and Mathematics in Columbia Map

Zip Codes with the Highest Percentage of Population with a Degree in Computers and Mathematics in Columbia, MD

Zip Code % Graduates vs State vs National
1.2104610.6%7.0%(+3.69)#544.9%(+5.75)#1,539
2.2104510.0%7.0%(+3.08)#644.9%(+5.14)#1,741
3.210448.8%7.0%(+1.90)#894.9%(+3.96)#2,335

Common Questions

What are the Top Zip Codes with the Highest Percentage of Population with a Degree in Computers and Mathematics in Columbia, MD?
Top Zip Codes with the Highest Percentage of Population with a Degree in Computers and Mathematics in Columbia, MD are:
#1
10.6%
#2
10.0%
#3
8.8%
What zip code has the Highest Percentage of Population with a Degree in Computers and Mathematics in Columbia, MD?
21046 has the Highest Percentage of Population with a Degree in Computers and Mathematics in Columbia, MD with 10.6%.
What is the Percentage of Population with a Degree in Computers and Mathematics in Columbia, MD?
Percentage of Population with a Degree in Computers and Mathematics in Columbia is 9.7%.
What is the Percentage of Population with a Degree in Computers and Mathematics in Maryland?
Percentage of Population with a Degree in Computers and Mathematics in Maryland is 7.0%.
What is the Percentage of Population with a Degree in Computers and Mathematics in the United States?
Percentage of Population with a Degree in Computers and Mathematics in the United States is 4.9%.