Zip Codes with the Highest Percentage of Households Heated by Bottled Gas / Liquid Propane in Bowie, MD
RELATED REPORTS & OPTIONS
Bottled Gas / LP Heating
Bowie
Compare Zip Codes
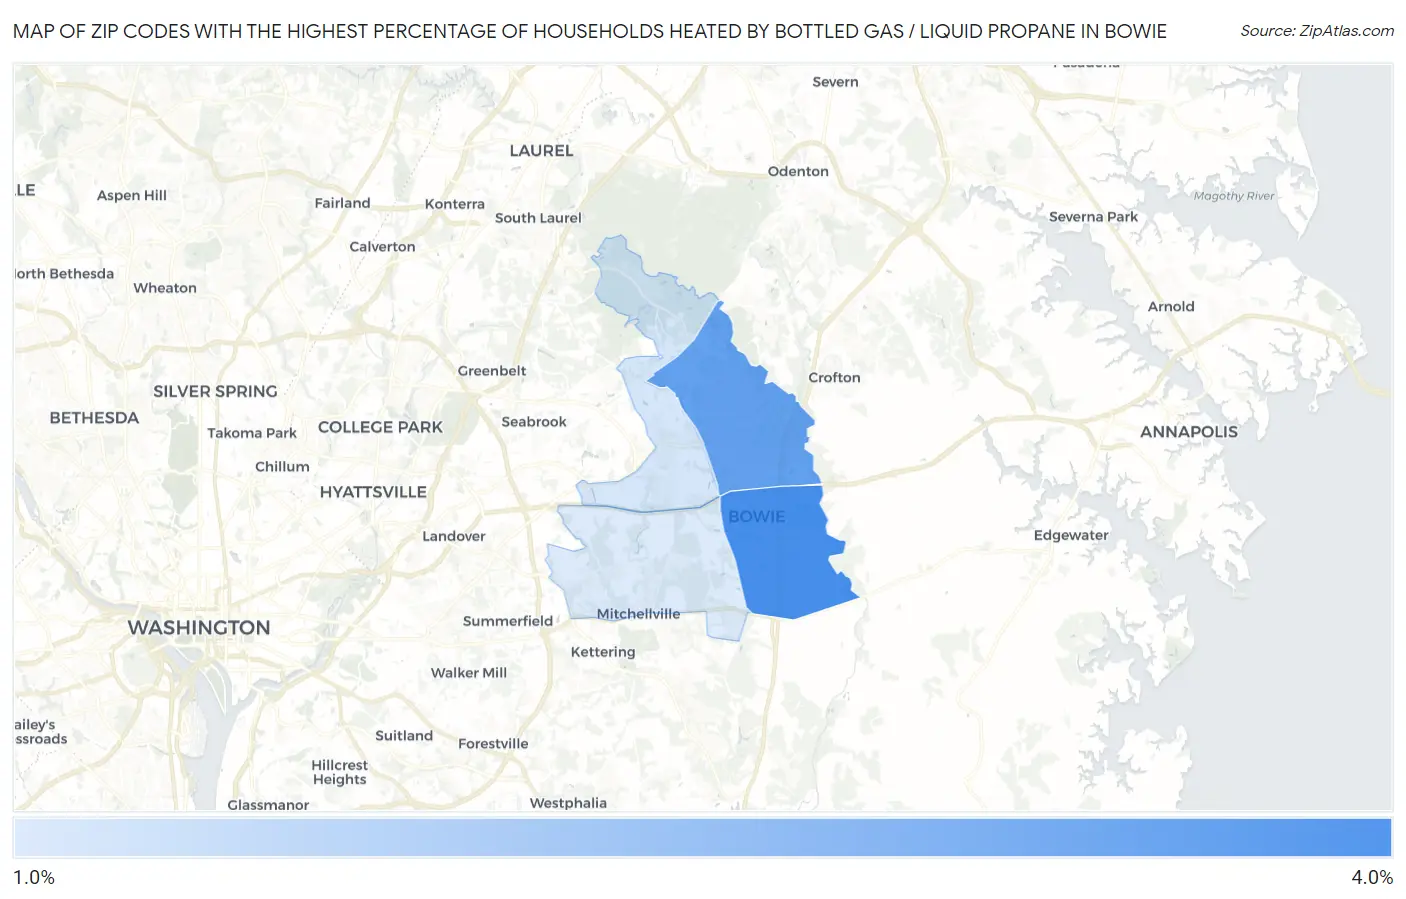
Map of Zip Codes with the Highest Percentage of Households Heated by Bottled Gas / Liquid Propane in Bowie
0.0%
4.0%
Zip Codes with the Highest Percentage of Households Heated by Bottled Gas / Liquid Propane in Bowie, MD
| Zip Code | Bottled Gas / LP Heating | vs State | vs National | |
| 1. | 20716 | 3.1% | 3.7%(-0.600)#268 | 4.9%(-1.80)#20,876 |
| 2. | 20715 | 2.7% | 3.7%(-1.00)#281 | 4.9%(-2.20)#21,547 |
| 3. | 20720 | 1.1% | 3.7%(-2.60)#362 | 4.9%(-3.80)#26,286 |
| 4. | 20721 | 1.0% | 3.7%(-2.70)#378 | 4.9%(-3.90)#26,652 |
1
Common Questions
What are the Top 3 Zip Codes with the Highest Percentage of Households Heated by Bottled Gas / Liquid Propane in Bowie, MD?
Top 3 Zip Codes with the Highest Percentage of Households Heated by Bottled Gas / Liquid Propane in Bowie, MD are:
What zip code has the Highest Percentage of Households Heated by Bottled Gas / Liquid Propane in Bowie, MD?
20716 has the Highest Percentage of Households Heated by Bottled Gas / Liquid Propane in Bowie, MD with 3.1%.
What is the Percentage of Households Heated by Bottled Gas / Liquid Propane in Bowie, MD?
Percentage of Households Heated by Bottled Gas / Liquid Propane in Bowie is 2.0%.
What is the Percentage of Households Heated by Bottled Gas / Liquid Propane in Maryland?
Percentage of Households Heated by Bottled Gas / Liquid Propane in Maryland is 3.7%.
What is the Percentage of Households Heated by Bottled Gas / Liquid Propane in the United States?
Percentage of Households Heated by Bottled Gas / Liquid Propane in the United States is 4.9%.