Zip Codes with the Highest Percentage of Population Employed in Agriculture, Fishing & Hunting in Lowell, MA
RELATED REPORTS & OPTIONS
Agriculture, Fishing & Hunting
Lowell
Compare Zip Codes
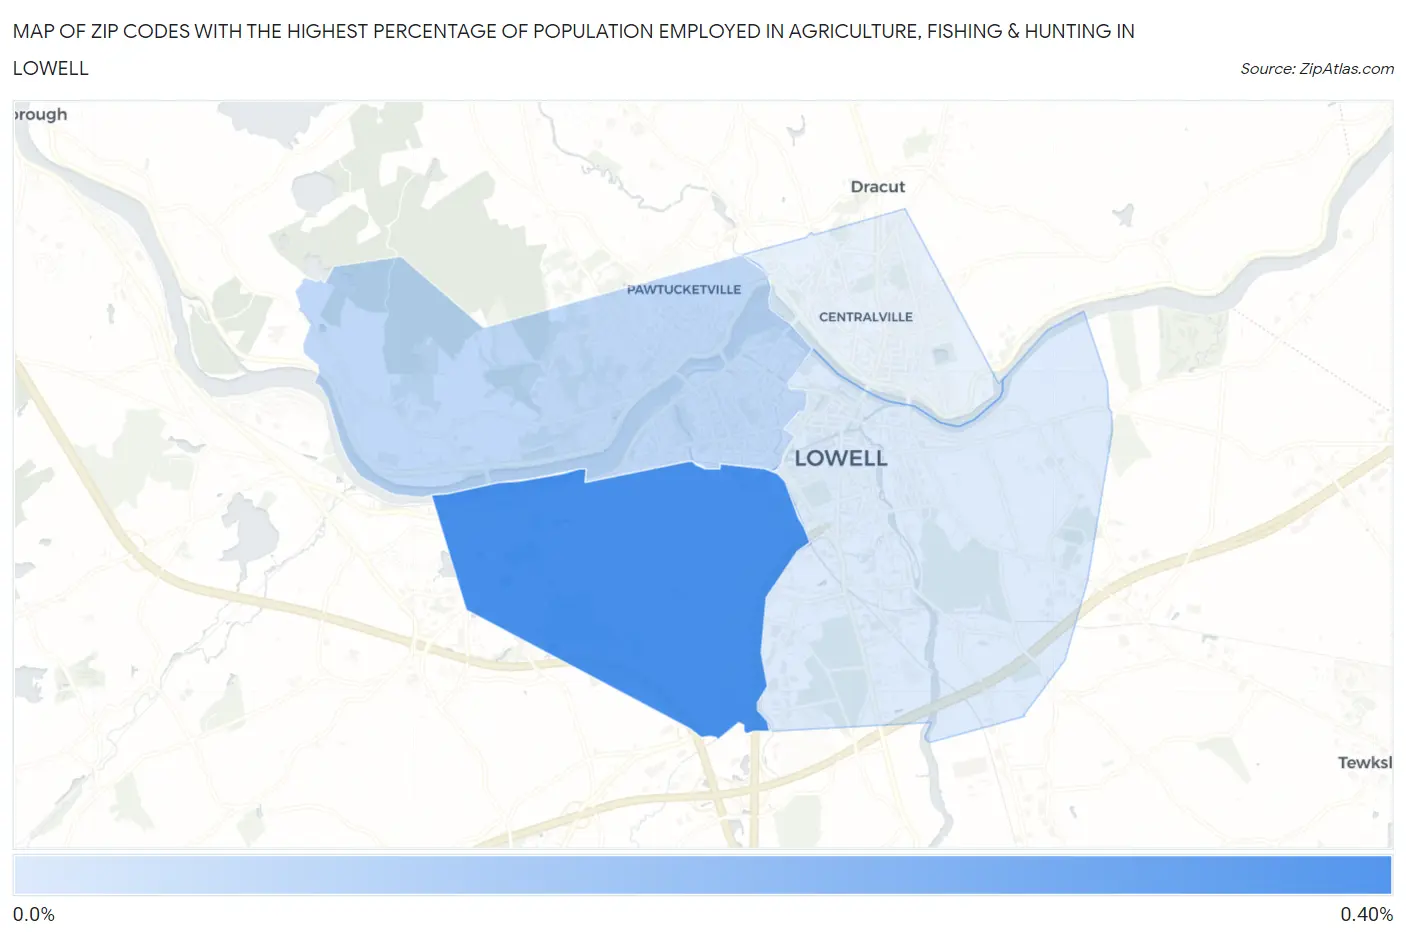
Map of Zip Codes with the Highest Percentage of Population Employed in Agriculture, Fishing & Hunting in Lowell
0.0%
0.40%
Zip Codes with the Highest Percentage of Population Employed in Agriculture, Fishing & Hunting in Lowell, MA
| Zip Code | % Employed | vs State | vs National | |
| 1. | 01851 | 0.37% | 0.39%(-0.020)#222 | 1.2%(-0.825)#20,394 |
| 2. | 01854 | 0.12% | 0.39%(-0.279)#315 | 1.2%(-1.08)#23,460 |
| 3. | 01852 | 0.052% | 0.39%(-0.343)#349 | 1.2%(-1.15)#24,324 |
1
Common Questions
What are the Top 3 Zip Codes with the Highest Percentage of Population Employed in Agriculture, Fishing & Hunting in Lowell, MA?
Top 3 Zip Codes with the Highest Percentage of Population Employed in Agriculture, Fishing & Hunting in Lowell, MA are:
What zip code has the Highest Percentage of Population Employed in Agriculture, Fishing & Hunting in Lowell, MA?
01851 has the Highest Percentage of Population Employed in Agriculture, Fishing & Hunting in Lowell, MA with 0.37%.
What is the Percentage of Population Employed in Agriculture, Fishing & Hunting in Lowell, MA?
Percentage of Population Employed in Agriculture, Fishing & Hunting in Lowell is 0.16%.
What is the Percentage of Population Employed in Agriculture, Fishing & Hunting in Massachusetts?
Percentage of Population Employed in Agriculture, Fishing & Hunting in Massachusetts is 0.39%.
What is the Percentage of Population Employed in Agriculture, Fishing & Hunting in the United States?
Percentage of Population Employed in Agriculture, Fishing & Hunting in the United States is 1.2%.