Zip Codes with the Highest Percentage of Population Employed in Arts, Entertainment & Recreation in Arlington, MA
RELATED REPORTS & OPTIONS
Arts, Entertainment & Recreation
Arlington
Compare Zip Codes
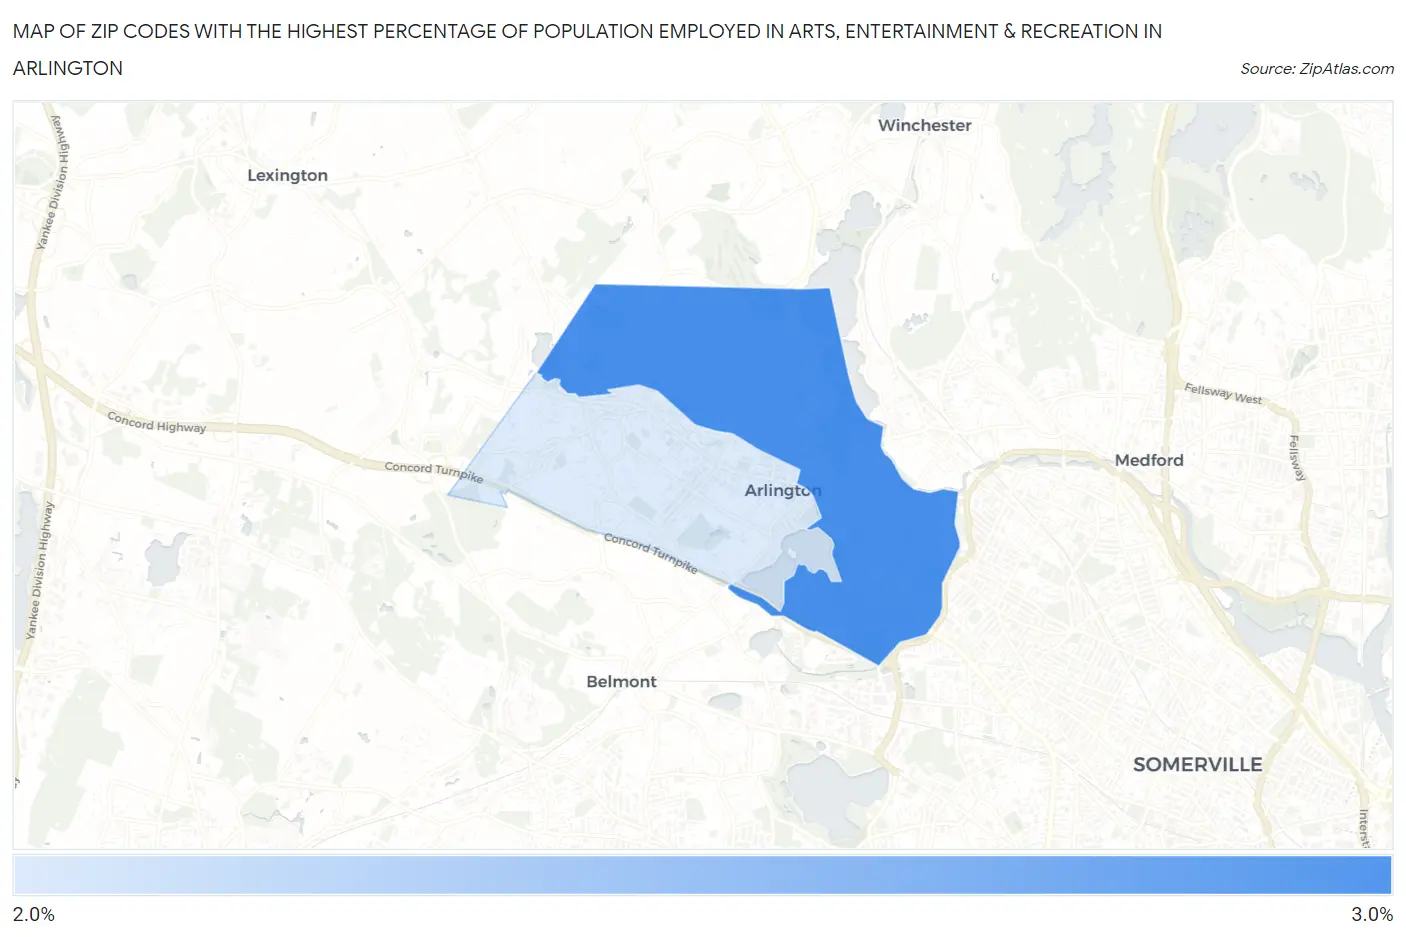
Map of Zip Codes with the Highest Percentage of Population Employed in Arts, Entertainment & Recreation in Arlington
0.0%
3.0%
Zip Codes with the Highest Percentage of Population Employed in Arts, Entertainment & Recreation in Arlington, MA
| Zip Code | % Employed | vs State | vs National | |
| 1. | 02474 | 2.7% | 2.0%(+0.698)#149 | 2.1%(+0.594)#6,457 |
| 2. | 02476 | 2.6% | 2.0%(+0.609)#158 | 2.1%(+0.504)#6,812 |
1
Common Questions
What are the Top Zip Codes with the Highest Percentage of Population Employed in Arts, Entertainment & Recreation in Arlington, MA?
Top Zip Codes with the Highest Percentage of Population Employed in Arts, Entertainment & Recreation in Arlington, MA are:
What zip code has the Highest Percentage of Population Employed in Arts, Entertainment & Recreation in Arlington, MA?
02474 has the Highest Percentage of Population Employed in Arts, Entertainment & Recreation in Arlington, MA with 2.7%.
What is the Percentage of Population Employed in Arts, Entertainment & Recreation in Arlington, MA?
Percentage of Population Employed in Arts, Entertainment & Recreation in Arlington is 2.6%.
What is the Percentage of Population Employed in Arts, Entertainment & Recreation in Massachusetts?
Percentage of Population Employed in Arts, Entertainment & Recreation in Massachusetts is 2.0%.
What is the Percentage of Population Employed in Arts, Entertainment & Recreation in the United States?
Percentage of Population Employed in Arts, Entertainment & Recreation in the United States is 2.1%.